
2023-10-13
Informational purposes only. The content in this report, including allocations, analysis, and commentary, is provided solely for informational and educational purposes. It does not constitute financial advice, investment advice, trading advice, or any other type of advice. Past performance does not guarantee future results. Always conduct your own research and consult a qualified financial professional before making investment decisions.
Weekly Allocation
| Ticker | Category | Weight | Role |
|---|---|---|---|
| FBTC | 50% | Overlay | |
| XLE | Traditional Energy | 10% | Top-2 (10%) |
| URNM | Nuclear Energy | 10% | Top-2 (10%) |
| XAR | Defense & Aerospace | 5% | Tier-2 (5%) |
| GLD | Precious Metals | 5% | Tier-2 (5%) |
| PAVE | Utilities & Infrastructure | 5% | Tier-2 (5%) |
| INDA | Emerging Markets | 5% | Tier-2 (5%) |
| MOO | Agriculture & Livestock | 5% | Tier-2 (5%) |
| XLK | Technology | 5% | Tier-2 (5%) |
Trade Instructions — Monday Open
Sell the tranche from 2023-09-15 (completing its 4-week hold). Buy the new tranche. Instructions show net portfolio changes — same-asset positions cancel, weight changes show the delta.
| Action | Ticker | Instruction |
|---|---|---|
| SELL | COPX | Sell 50% of COPX position (reduce 2.50% → 1.25%) |
| SELL | XLU | Sell 50% of XLU position (reduce 2.50% → 1.25%) |
| SELL | CIBR | Sell 25% of CIBR position (reduce 5.00% → 3.75%) |
| BUY | INDA | Buy INDA — 33.33% of freed cash (adds 1.25% to portfolio) |
| BUY | PAVE | Buy PAVE — 33.33% of freed cash (adds 1.25% to portfolio) |
| BUY | XLK | Buy XLK — 33.33% of freed cash (adds 1.25% to portfolio) |
Current Portfolio After Trade
Combined holdings across all 4 active tranches. Each tranche is 25% of the portfolio.
| Ticker | % of Portfolio | Weight Bar |
|---|---|---|
| FBTC | 50.00% | |
| URNM | 10.00% | |
| XLE | 7.50% | |
| XAR | 5.00% | |
| MOO | 3.75% | |
| CIBR | 3.75% | |
| GLD | 2.50% | |
| PICK | 2.50% | |
| FCG | 2.50% | |
| INDA | 2.50% | |
| PAVE | 2.50% | |
| COPX | 1.25% | |
| XLU | 1.25% | |
| SLV | 1.25% | |
| IGF | 1.25% | |
| SMH | 1.25% | |
| XLK | 1.25% |
Macro Regime — Late-Cycle Reflation
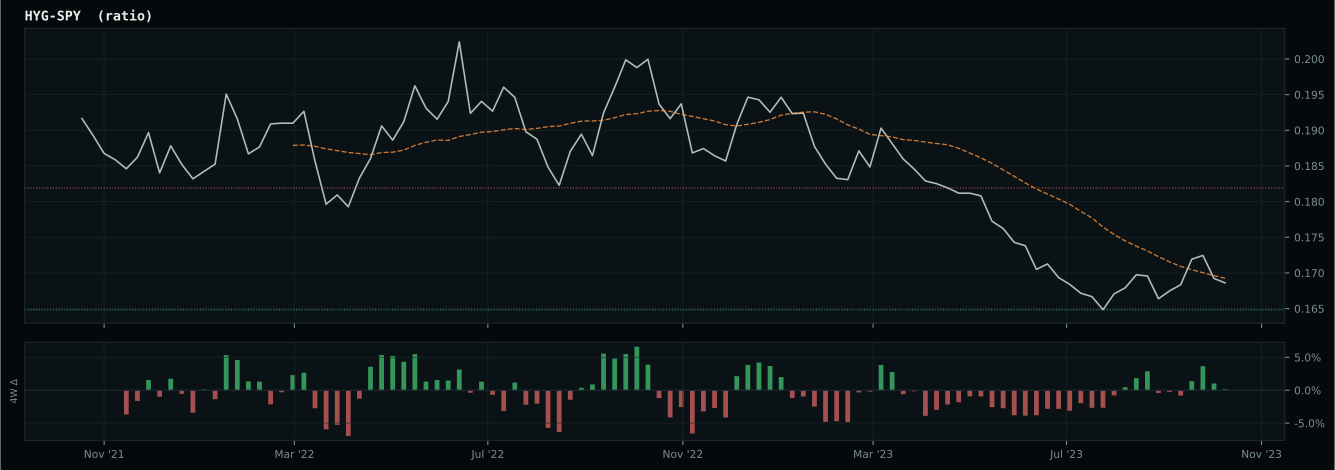
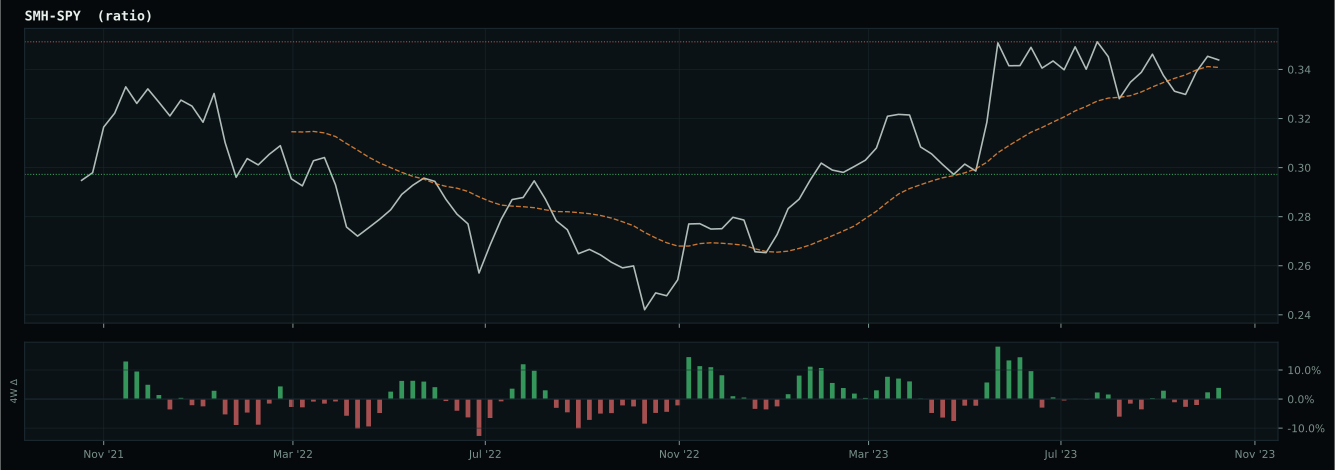
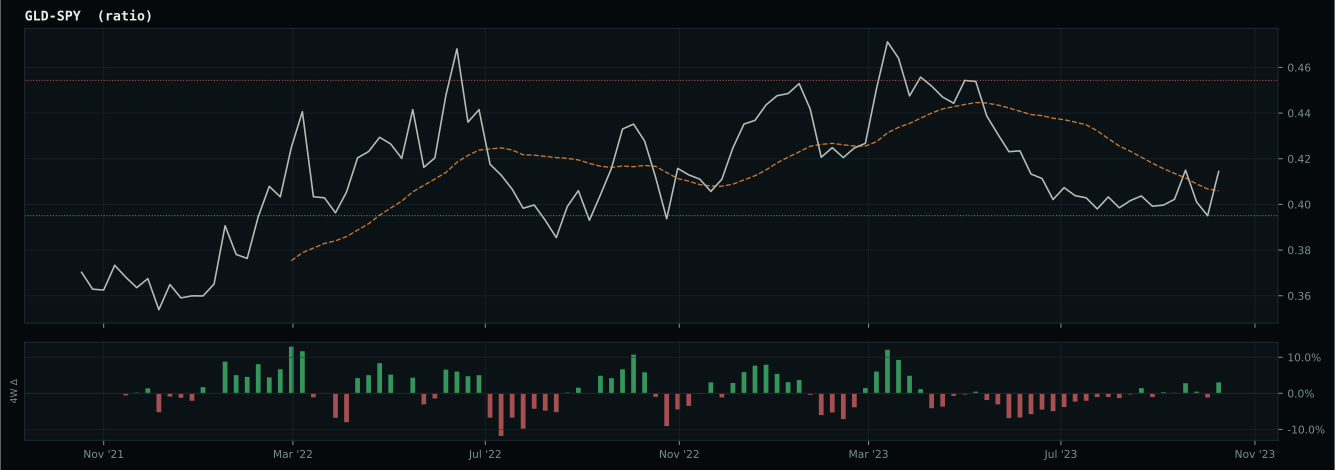
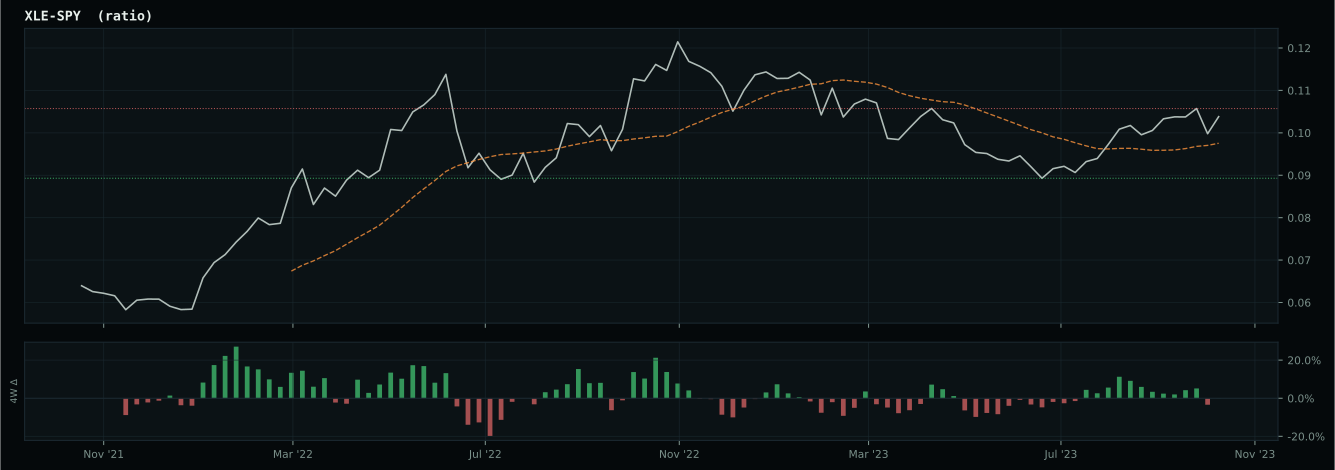
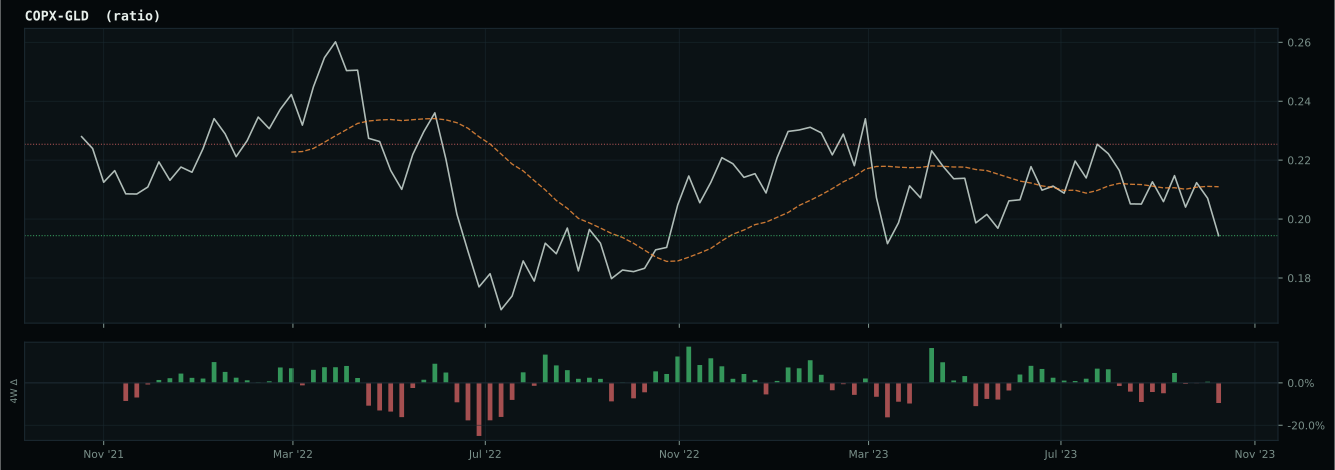
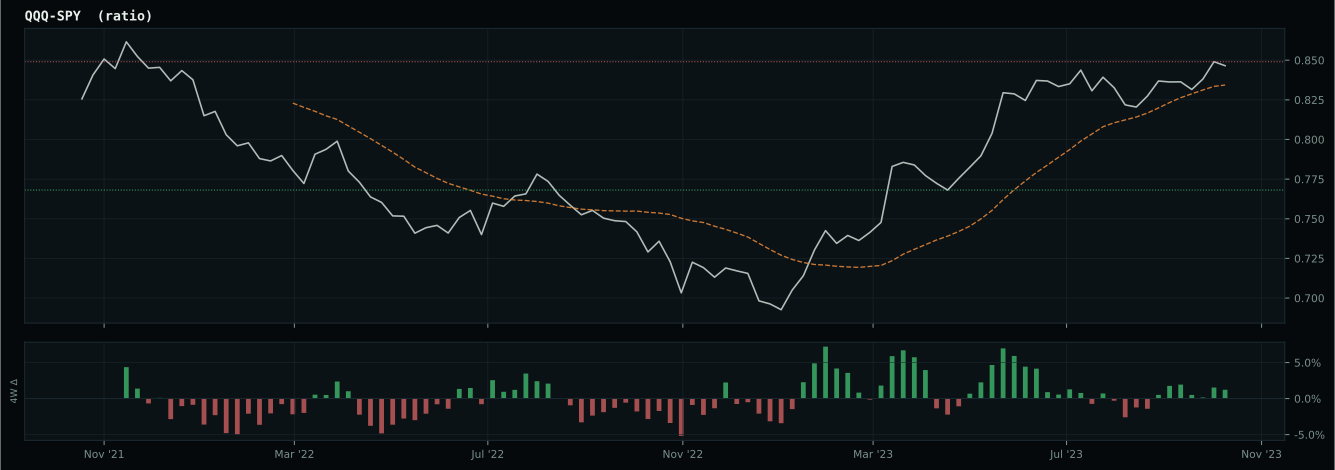
Macro Evidence Charts
Market-implied signals behind the macro regime scores. Each ratio compares two assets; the direction and slope of the ratio is what the macro engine reads.
Crypto Regime — TrendBTC
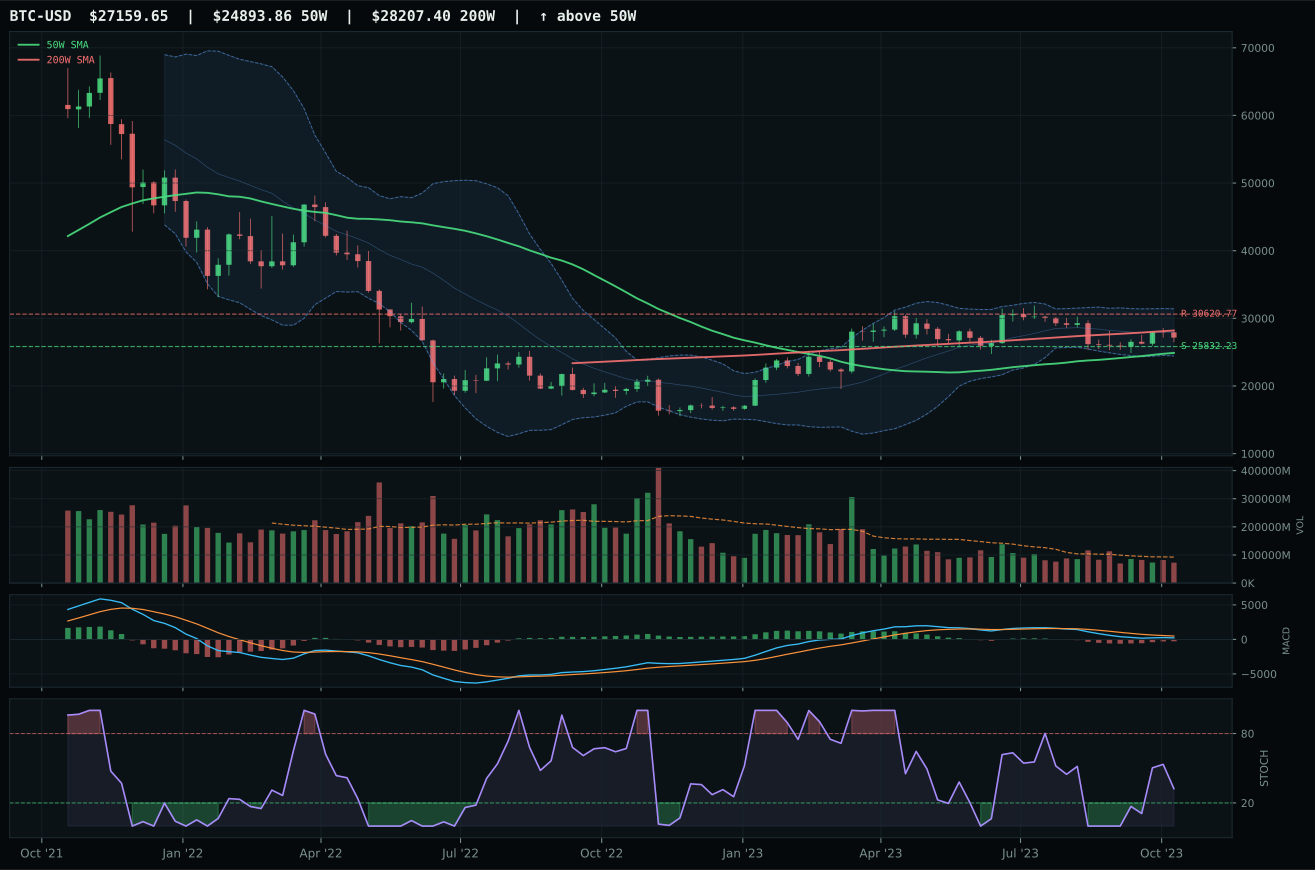
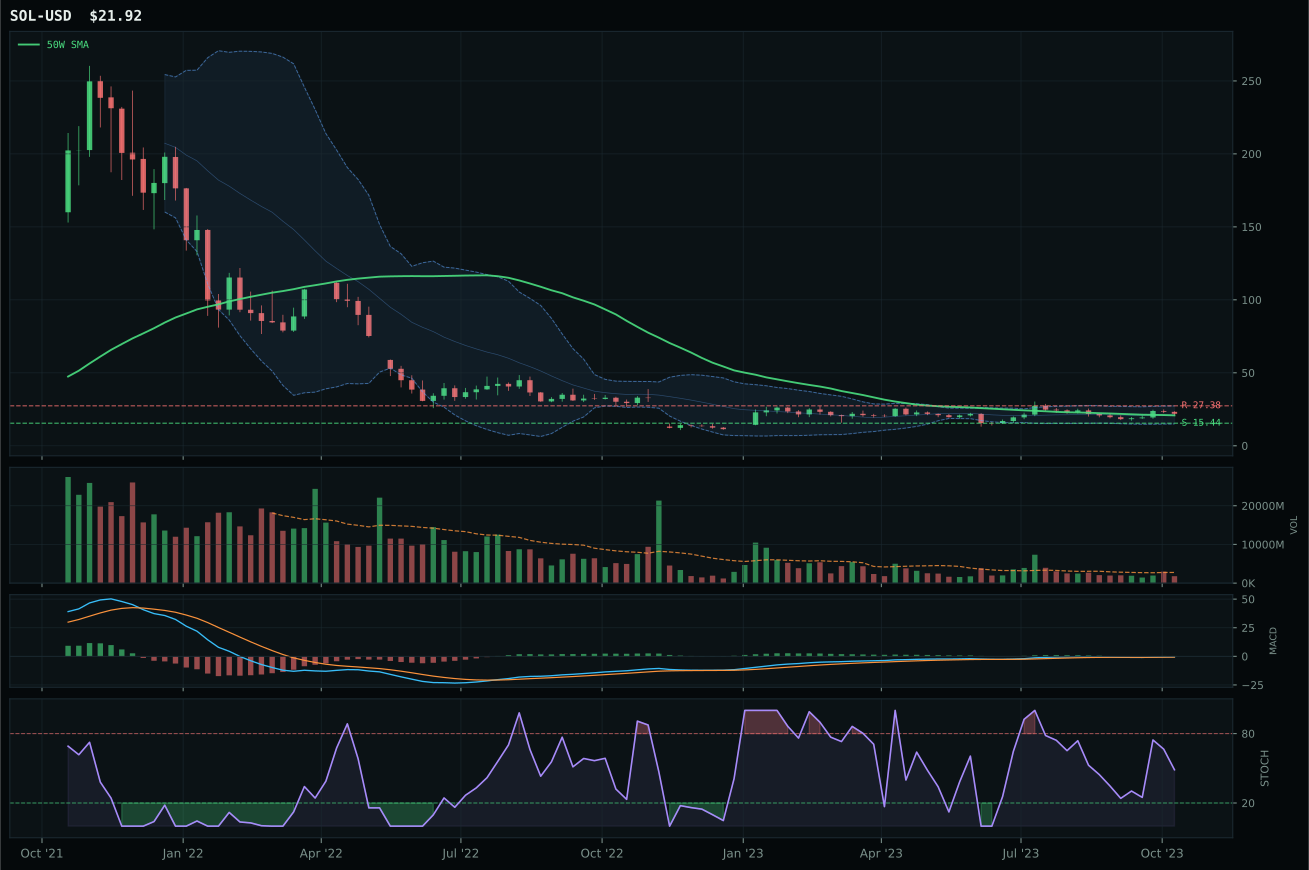
post-touch structure is too wide to count as a range; max/min close ratio is 1.88
TrendBTC confirmed: 2 consecutive closes above rising/flat 50W SMA
one or more available conditions failed
Category Rankings
| Rank | Category | Winner | Score | Alloc | 4W Ret | Peers (4W) |
|---|---|---|---|---|---|---|
| 1 | Traditional Energy | XLE | 82.7 | 20% | -7.35% | FCG -8.0% · XOP -7.8% |
| 2 | Nuclear Energy | URNM | 51.5 | 20% | +5.96% | URA +5.7% · NLR +3.0% |
| 3 | Defense & Aerospace | XAR | 38.0 | 10% | +4.11% | ITA +4.8% · ROKT -0.6% |
| 4 | Precious Metals | GLD | 36.2 | 10% | +0.88% | SLV -2.6% · GDX -6.0% |
| 5 | Utilities & Infrastructure | PAVE | 33.3 | 10% | -0.76% | XLU +1.3% · IGF +1.7% |
| 6 | Agriculture & Livestock | MOO | 28.7 | 10% | -5.33% | VEGI -4.1% · WEAT -1.7% |
| 7 | Technology | XLK | 27.2 | 10% | +5.84% | CIBR +0.3% · IGV +3.6% |
| 8 | Industrial Metals | PICK | 24.8 | 10% | -2.22% | COPX -8.2% · REMX -11.6% |
| 9 | AI | SMH | 12.5 | 0% | +5.22% | AIQ +3.6% · BOTZ +1.2% |
| 10 | Emerging Markets | INDA | — | 0% | -0.60% | IEMG +0.9% · ILF +4.9% |
Traditional Energy — XLE
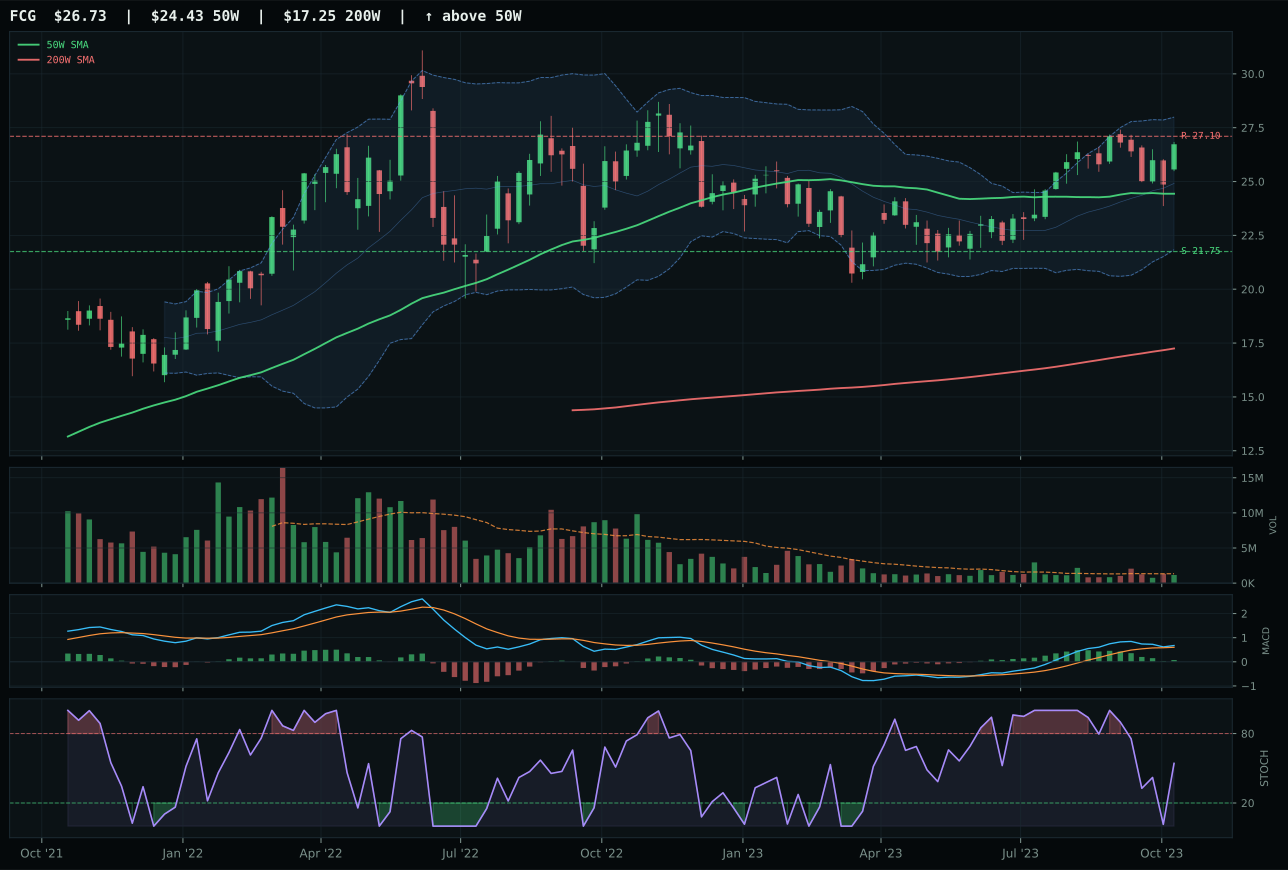
FCG has a neutral structure profile with 17.9% 13-week relative strength versus SPY.
A failed hold above support would weaken the setup.
Actionable but governed by invalidation levels.
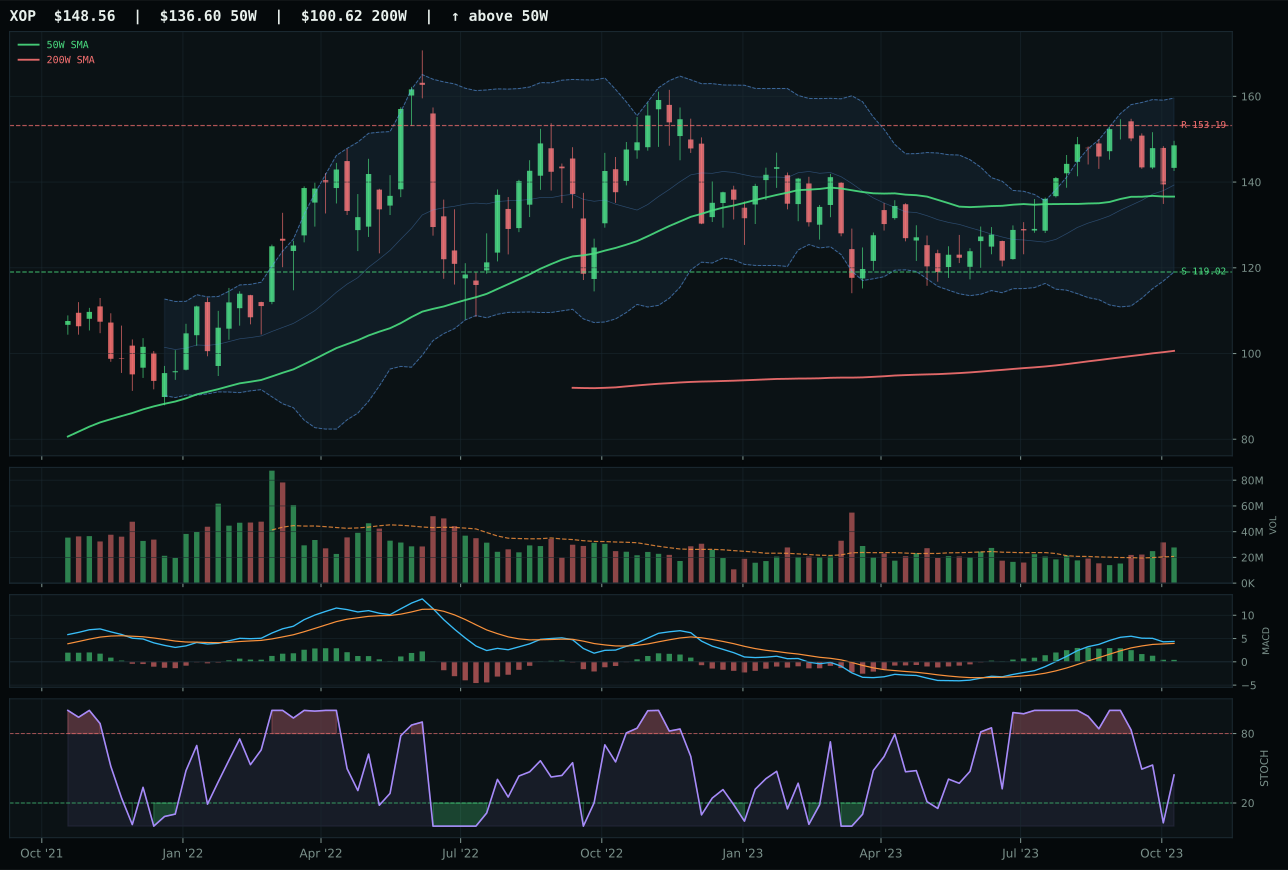
XOP has a neutral structure profile with 19.1% 13-week relative strength versus SPY.
A failed hold above support would weaken the setup.
Actionable but governed by invalidation levels.
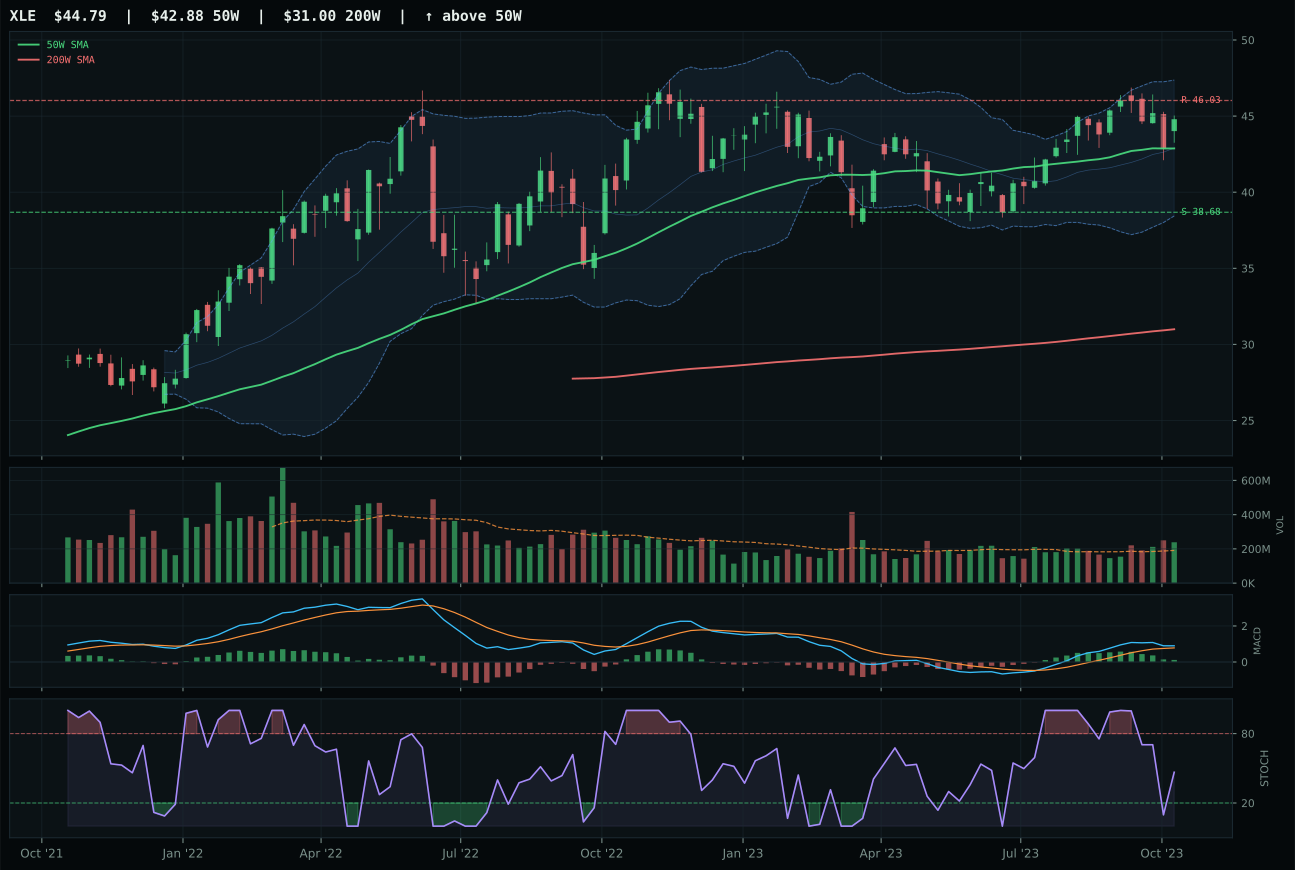
XLE has a neutral structure profile with 14.0% 13-week relative strength versus SPY.
A failed hold above support would weaken the setup.
Actionable but governed by invalidation levels.
XLE claimed the top-2 slot with a 82.7 category score and an exemplary risk/reward setup that justifies aggressive allocation in a reflation cycle. The energy leader trades 4.5% above its 50W with MACD bullish but flattening—the ideal position for continuation rather than exhaustion—and stochastic RSI falling/neutral at 0.47, suggesting momentum has room to run without extreme euphoria. Trend score of 100.0/100 reflects price above 50W and 200W with non-deteriorating slope, while 13W return of 10.0% and RS versus SPY of 14.0% prove energy has been the clear relative strength leader. The 14.0% RS gain versus SPY means institutional capital is actively rotating into energy; FCG's 17.9% relative strength looks stronger on the surface, but FCG trades with neutral volume participation whereas XLE shows 1.25x above-average accumulation, revealing which name has real institutional sponsorship. Risk/reward at 48.0/100 is the portfolio's weakest in absolute terms because upside to resistance is only -2.7%, but the category macro environment is so strong that containment into resistance is acceptable for a top-2 position.
Traditional Energy earns a 10% top-2 overweight allocation as one of the portfolio's two highest-conviction sleeves, driven by a category-level macro fit of 90.0/100—the strongest macro alignment of any category this week. Energy scarcity is active at +16 points, Late-Cycle Reflation adds +12, supply shortage at +9, inflation pressure at +10, and real asset sponsorship at +7, creating a five-factor macro tailwind that is nearly unmatched in the current regime. XLE's trend evidence of 100.0/100 combined with 14.0% relative strength versus SPY proves the technical setup aligns with macro conviction. The portfolio is positioned to profit from sustained energy demand in a reflation cycle where supply constraints, geopolitical risk, and inventory drawdowns support pricing power. The 10% weighting reflects both technical quality and macro alignment; this is one of two categories where the asymmetric risk-reward of late-cycle inflation works in the portfolio's favor. Hold this position unless XLE breaks below 38.68 support on heavy volume, signaling demand destruction.
Nuclear Energy — URNM
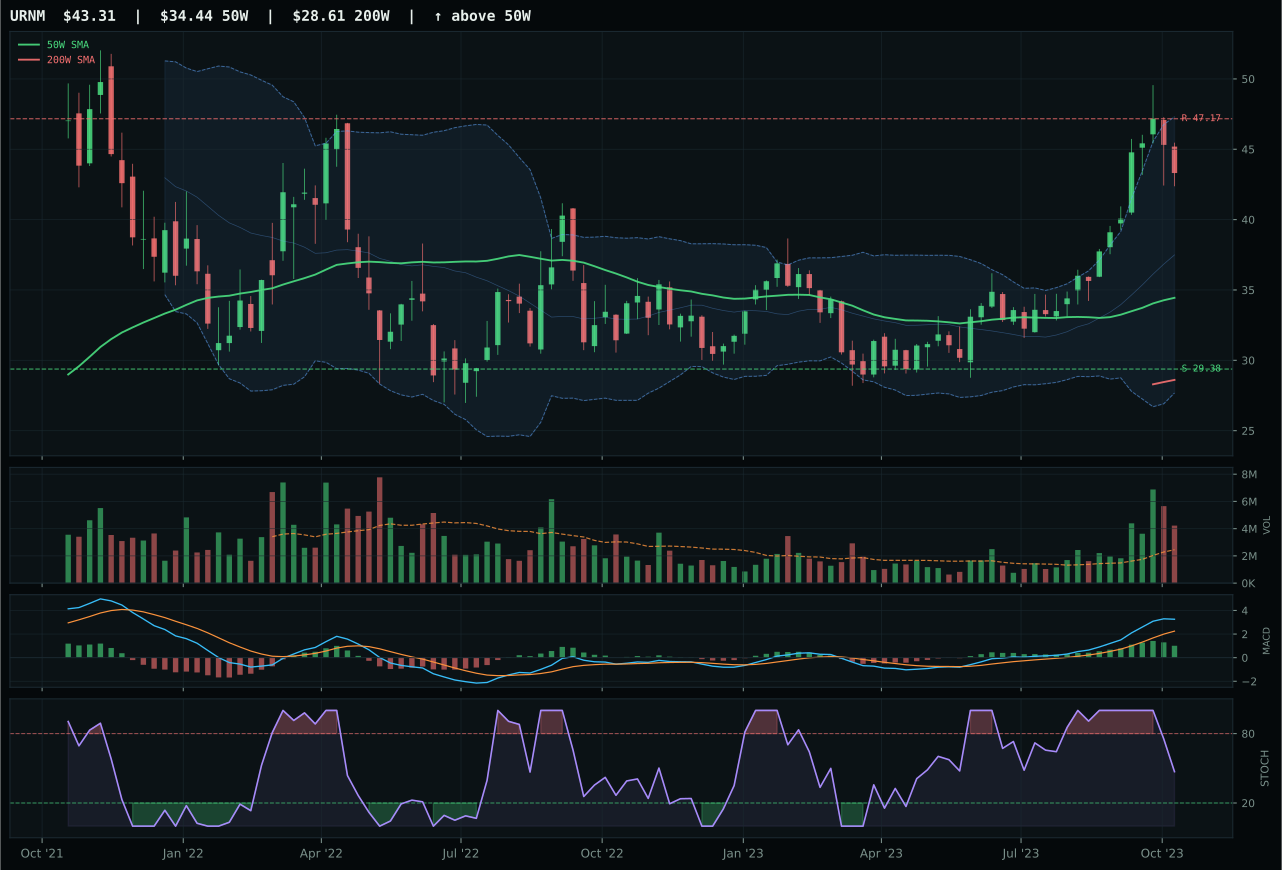
URNM has a vertical extension profile with 32.9% 13-week relative strength versus SPY.
A failed hold above support would weaken the setup.
Actionable but governed by invalidation levels.
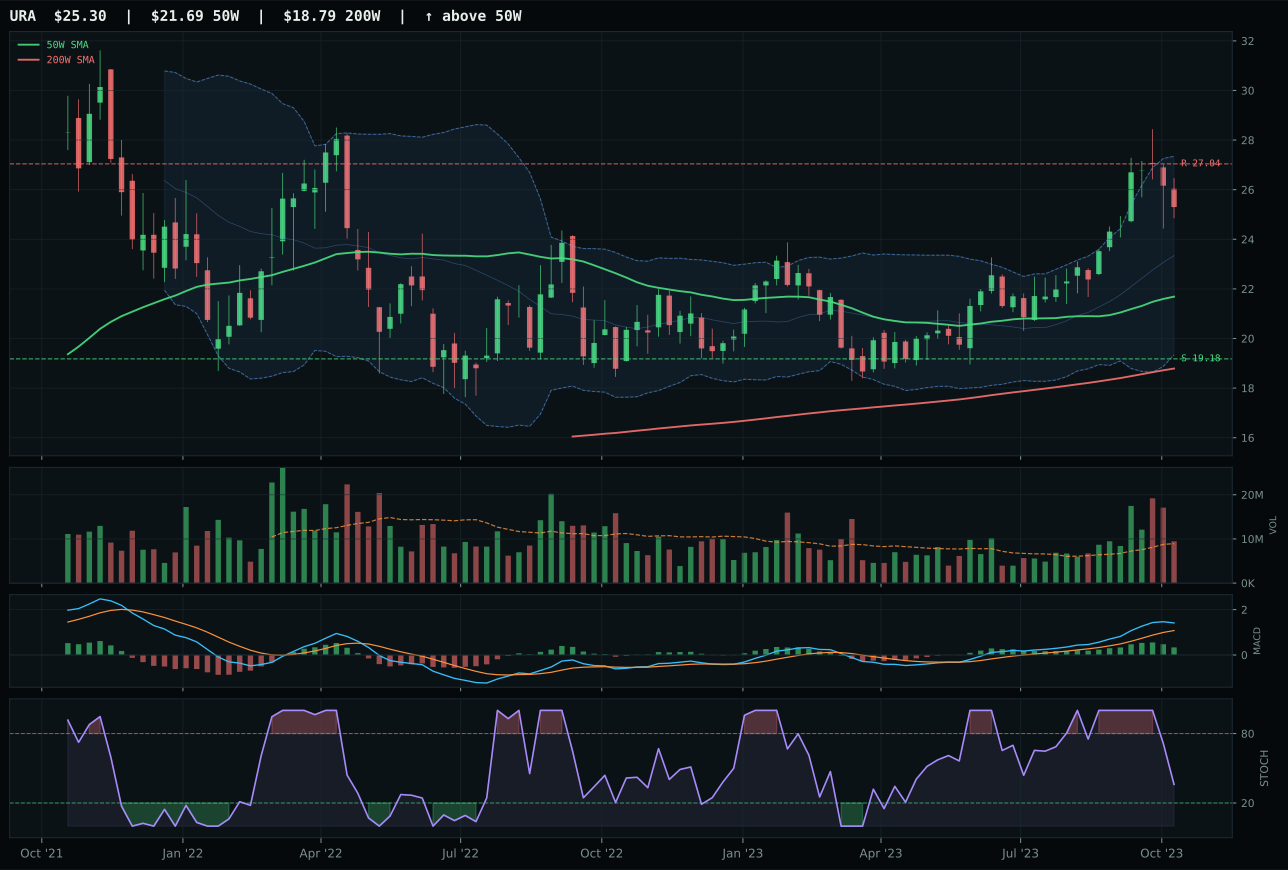
URA has a vertical extension profile with 20.5% 13-week relative strength versus SPY.
A failed hold above support would weaken the setup.
Actionable but governed by invalidation levels.
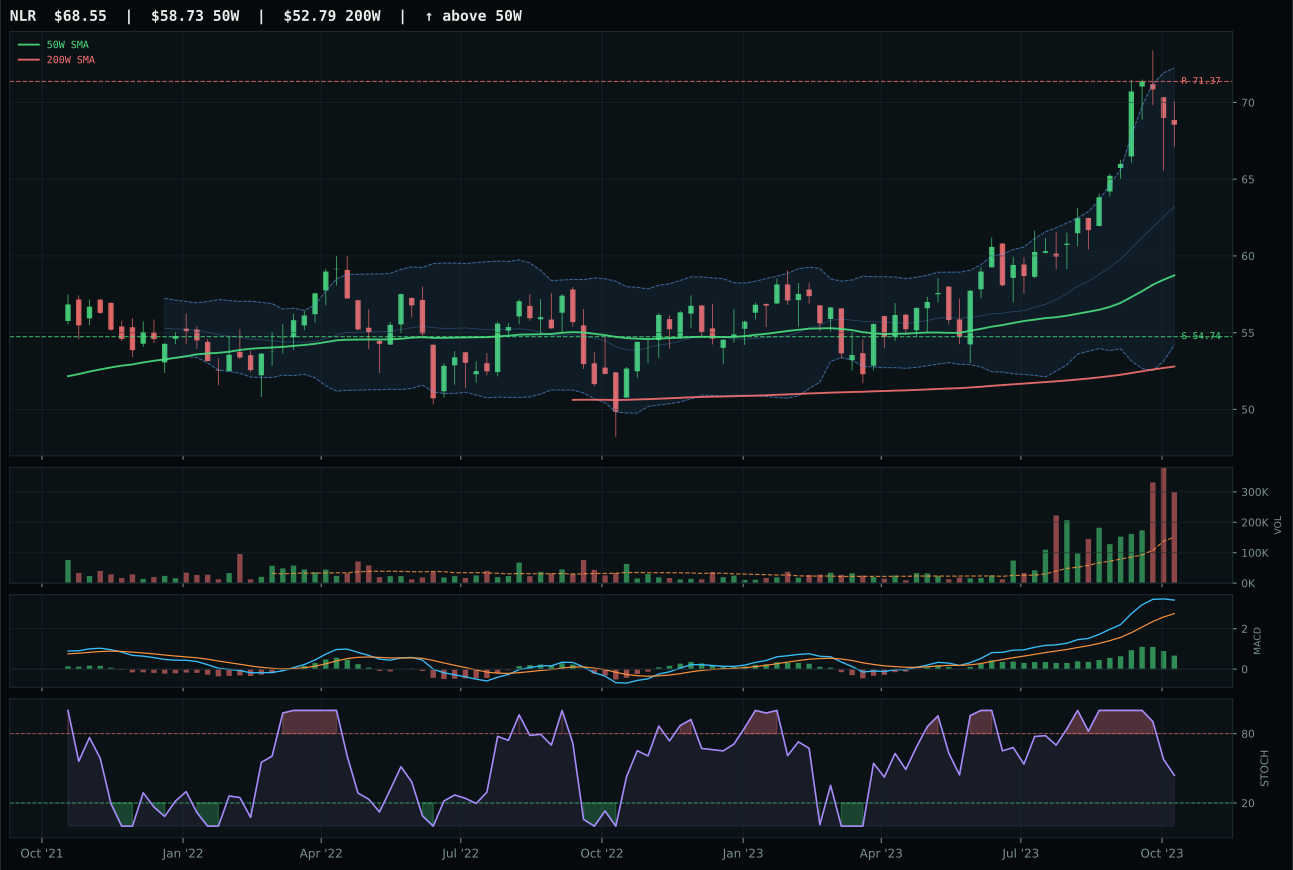
NLR has a vertical extension profile with 17.7% 13-week relative strength versus SPY.
A failed hold above support would weaken the setup.
Tracked, but not top-2 eligible because: .
URNM took the category despite a weaker reasoned proof order (-8.4 points behind URA) because the winner's category-relative strength of 12.4% versus URA's 0.0% proved decisive in the final category score calculation. URNM trades extended at 25.7% above the 50W with support at 29.38 and resistance at 47.17, creating a risk/reward of 40.1/100—the portfolio's second-weakest on absolute terms—but timing is impeccable at 100.0/100 trend score from 32.9% RS versus SPY and 28.9% 13W return. MACD is bullish but flattening, stochastic RSI is falling/neutral, and volume trades at 1.72x the 20W average with distribution pressure signals suggesting some profit-taking. This extended structure normally warrants caution, yet the momentum confirmation score of 100.0/100 from strong 13W performance and 12.4% category-relative leadership overrides typical mean-reversion concerns. URA's superior 65.1 reasoned proof order and 68.3% technical evidence score could not overcome the relative strength penalty in a category where nuclear is the clear momentum leader.
Nuclear Energy earns a 10% top-2 overweight allocation as the portfolio's highest-conviction momentum bet, justified by a 51.5 category score and exceptional macro alignment at 64.0/100. Energy scarcity (+9), real asset sponsorship (+7), and inflation pressure (+3) create positive macro factors, only partially offset by liquidity stress at -7 points. URNM's 28.9% 13W return and 32.9% relative strength versus SPY prove this is the strongest relative performance sleeve in the portfolio; uranium-miner equities are bidding on supply constraints and long-term energy demand from data centers and grid reliability in an AI-driven economy. The 10% weighting reflects momentum leadership rather than mean-reversion setup; this is an extended rally that the portfolio is riding, not establishing fresh longs. Risk management is critical: the 47.4% downside to support at 29.38 creates asymmetric drawdown risk if momentum stalls. Reduce position size if URNM breaks below the 50W at 40.85 on volume, signaling the momentum cycle may have peaked.
Defense & Aerospace — XAR
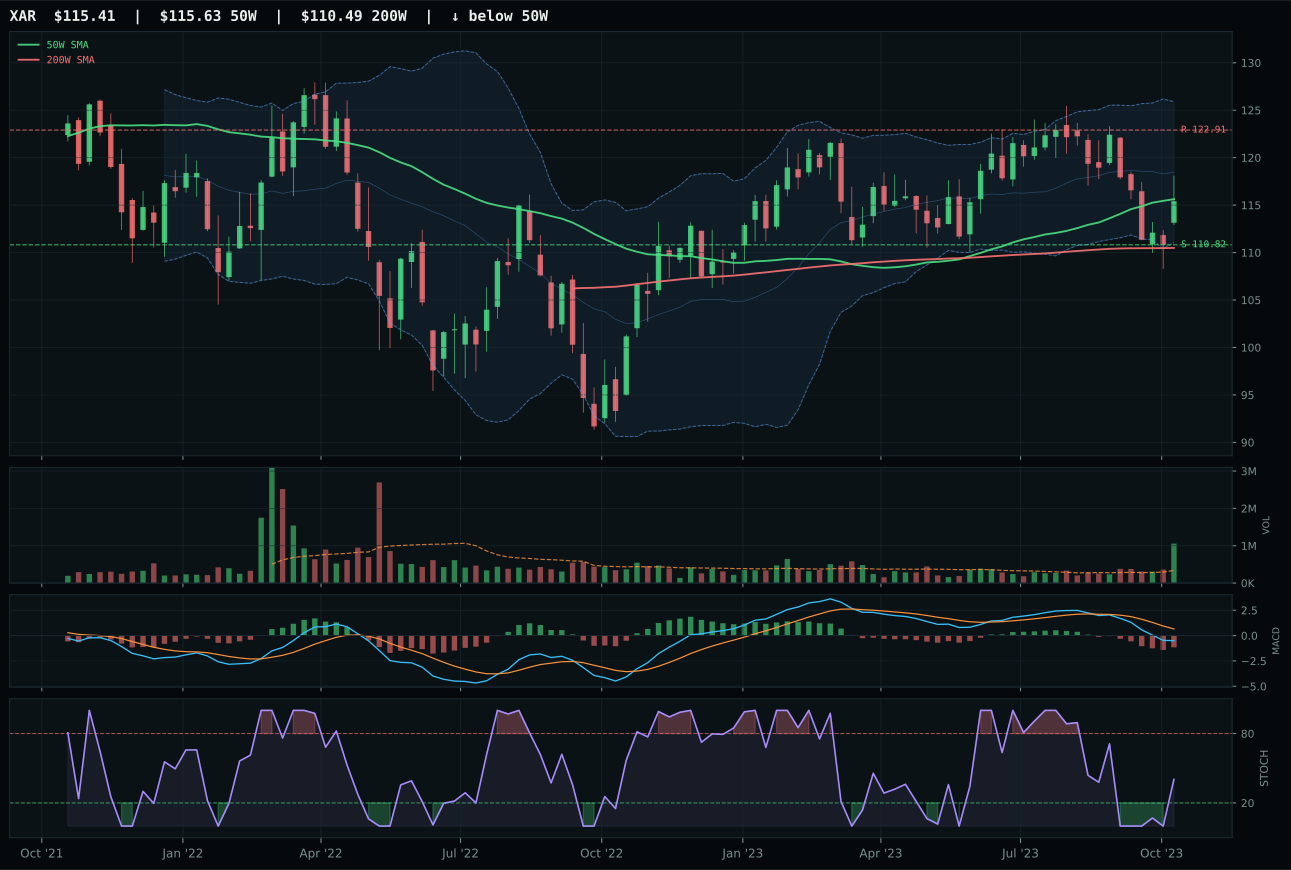
XAR has a pullback into support profile with -0.7% 13-week relative strength versus SPY.
A failed hold above support would weaken the setup.
Actionable but governed by invalidation levels.
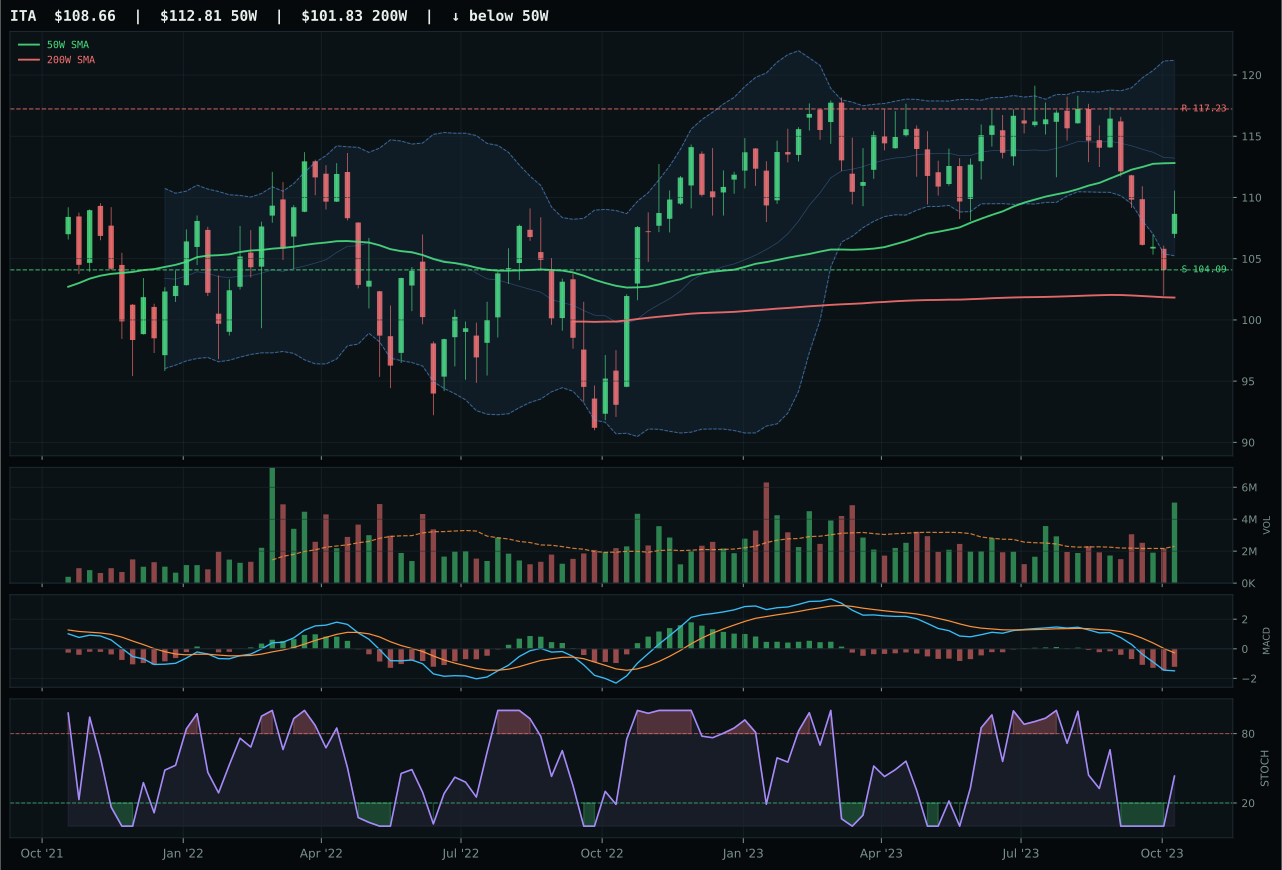
ITA has a pullback into support profile with -2.5% 13-week relative strength versus SPY.
A failed hold above support would weaken the setup.
Actionable but governed by invalidation levels.
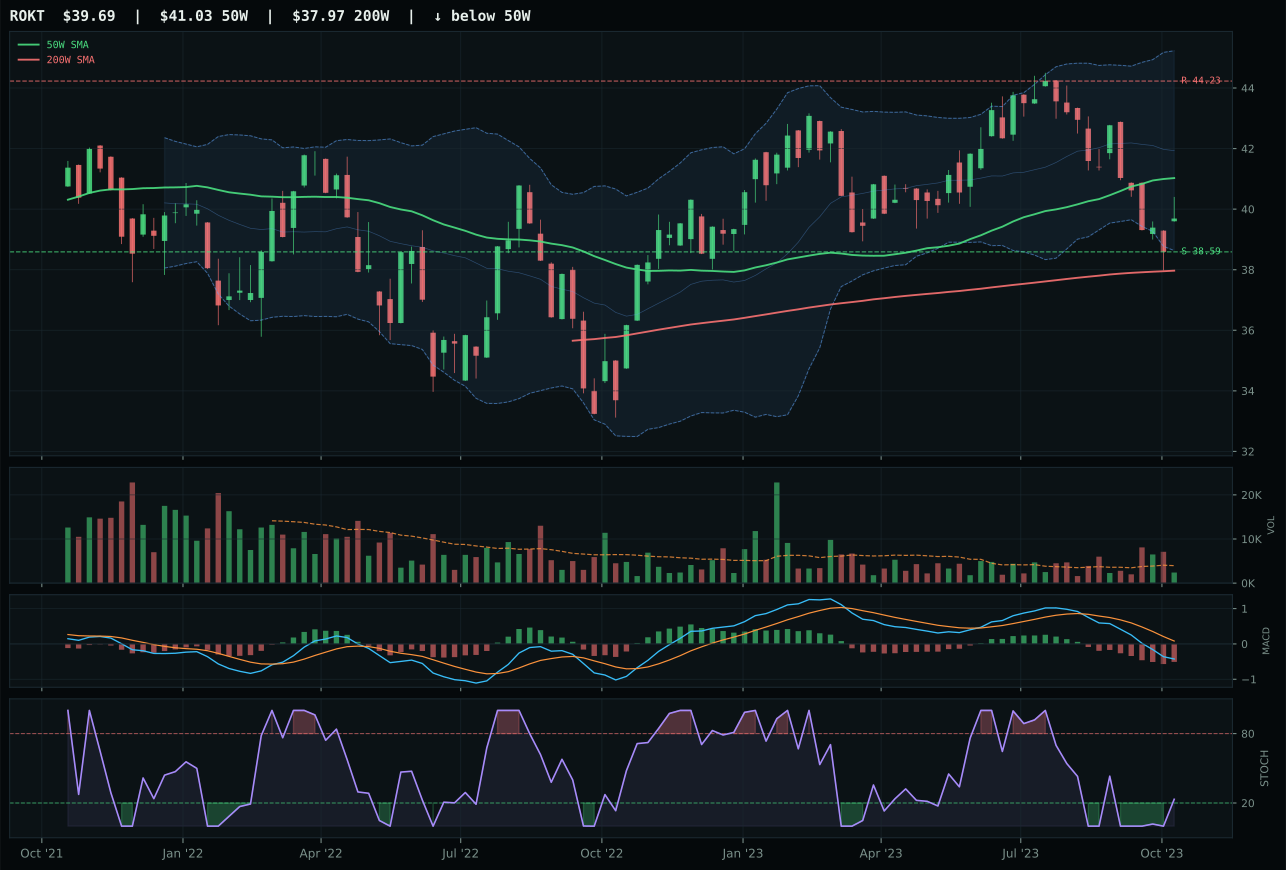
ROKT has a pullback into support profile with -5.1% 13-week relative strength versus SPY.
A failed hold above support would weaken the setup.
Tracked, but not top-2 eligible because: .
XAR seized the category on the strength of a textbook pullback-into-support setup with perfect timing execution. Price sits -0.2% from the 50W at a compressed level, meaning support near 110.82 is imminent and provides a clean invalidation trigger—a rare advantage in volatile tape. The timing score of 100.0/100 reflects this precision: distance to 50W near zero, MACD weakening but not broken, stochastic RSI rising mid-zone, and Fibonacci placement in the upper retracement zone all align for a bounce candidate. Risk/reward at 76.5/100 reflects only 4.1% downside to support versus -6.1% upside to resistance, not a favorable asymmetry but defensible given the category-relative strength advantage of 1.8% over ITA's 0.0%. Volume accumulation at 3.13x the 20W average seals the decision—heavy participation into support is the classic accumulation signal that separates intended reversals from fakes.
Defense & Aerospace holds a 5% tier-2 allocation despite its 38.0 category score falling well short of top-2 placement. The macro environment actually favors this sleeve: Late-Cycle Reflation adds +6 points, broad market bear adds +6 points, and dollar pressure adds +3 points—a cumulative +15 macro tailwind that pushes category-level macro fit to 66.0/100. This is one of the few categories where late-cycle stress conditions actually support allocations, as defense spending proves resilient and geopolitical anxiety persists. XAR's technical evidence of 53.6/100 remains modest, but the combination of structural support holding, volume sponsorship, and macro alignment justifies the allocation. For this category to move to top-2, the category score itself must improve via either a cleaner technical setup or tighter category-relative strength confirmation—currently the scoring gap versus Technology and Precious Metals is too large.
Precious Metals — GLD
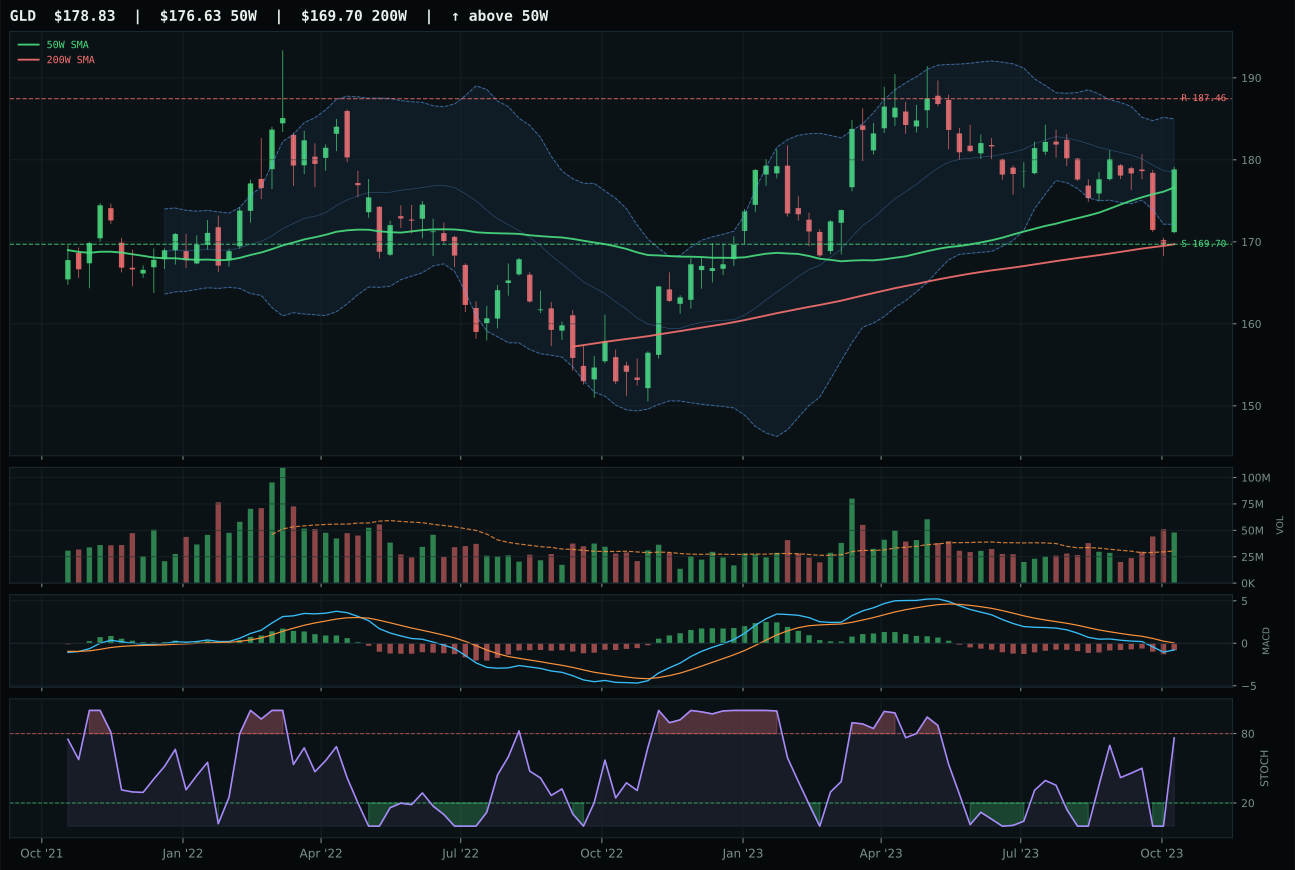
GLD has a compression near 50W profile with 2.5% 13-week relative strength versus SPY.
A failed hold above support would weaken the setup.
Actionable but governed by invalidation levels.
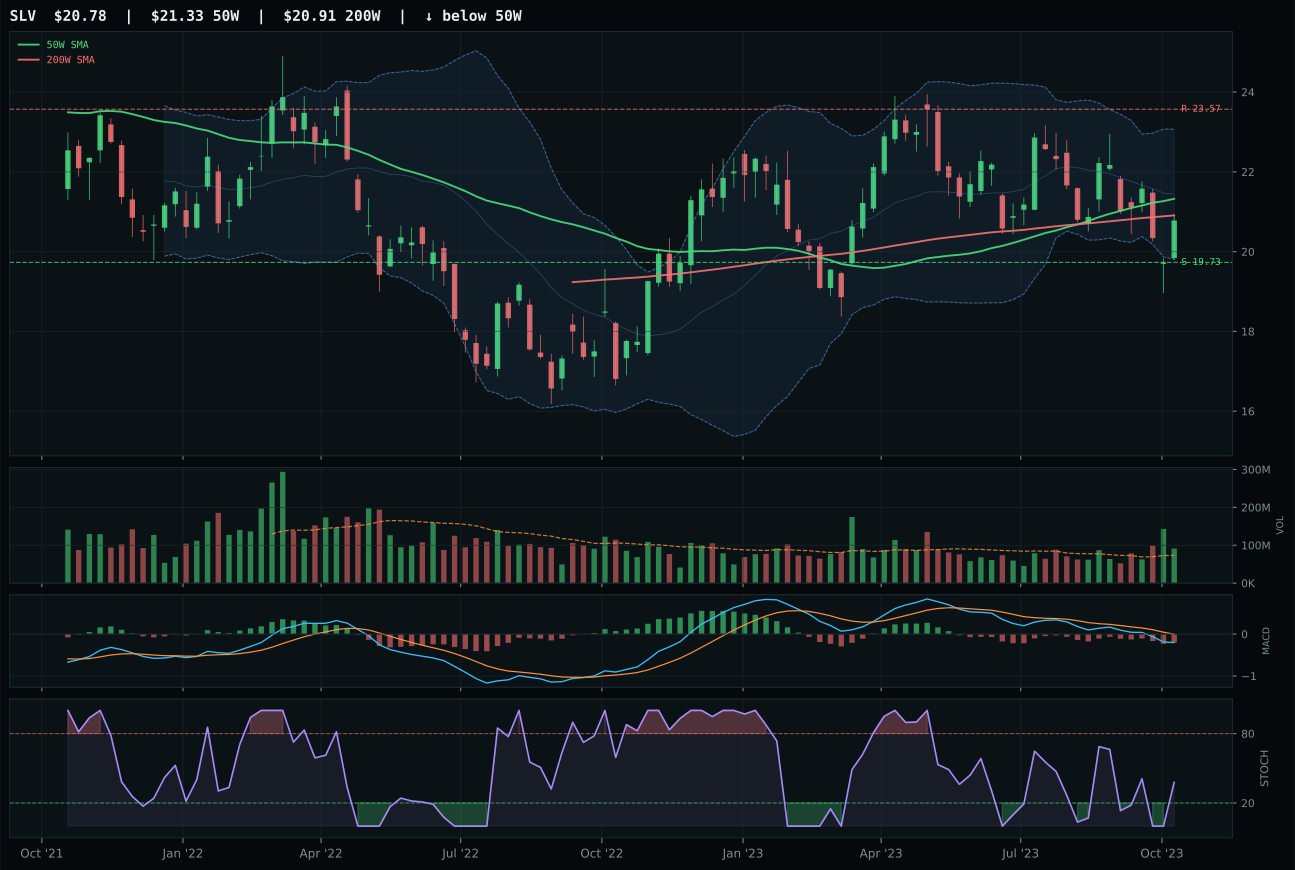
SLV has a compression near 50W profile with -5.1% 13-week relative strength versus SPY.
A failed hold above support would weaken the setup.
Actionable but governed by invalidation levels.
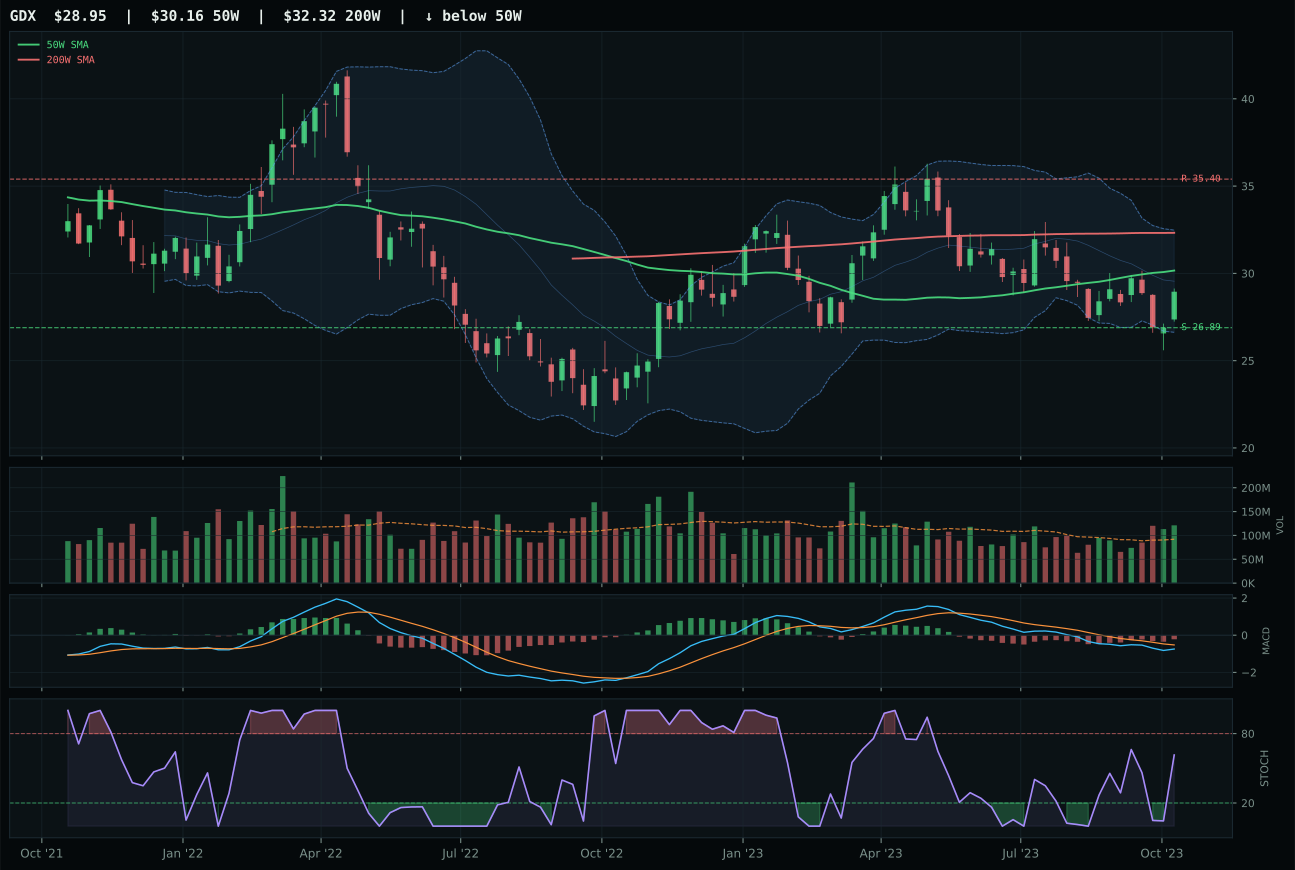
GDX has a neutral structure profile with -5.5% 13-week relative strength versus SPY.
Extension and support failure are the main tactical risks.
Tracked, but not top-2 eligible because: structurally broken.
GLD dominated the category through the rare combination of positive relative strength, crisp price structure, and near-perfect timing alignment. The precious metals leader sits only 1.2% above its 50W, creating a compression setup at 169.70 support and 187.46 resistance—textbook mean-reversion environment where buyers can load with tight risk. Relative strength of 2.5% versus SPY and 7.7% versus category peers signals institutional demand is flowing into gold specifically, a meaningful divergence in a sector where SLV's -5.1% SPY-relative weakness reveals silver's industrial beta is struggling. GLD's timing score of 100.0/100 reflects flawless setup positioning: price 1.2% from 50W, MACD weakening but orderly, stochastic RSI rising mid-zone at 0.76, and Fib placement in upper retracement zone. Volume accumulation at 1.57x the 20W average confirms real money accumulation, not liquidation bounces. SLV's stochastic RSI falling/neutral versus GLD's rising mid-zone creates a technical fork that clearly favors the gold expression.
Precious Metals earns a 5% tier-2 allocation on the back of a 36.2 category score and sector-specific macro sponsorship. The macro environment provides a +14-point monetary hedge bid from central bank emergency preparation, plus +2 from dollar pressure weakness, creating a 67.0/100 category-level macro fit that exceeds expectations in a reflation regime. GLD's trend score of 85.8/100 demonstrates price structure is holding the long-term uptrend despite recent consolidation; the category-relative strength advantage of 7.7% proves gold is the preferred precious metal hedge in this macro moment. The 5% weighting is appropriate given that gold's momentum confirmation of 59.0/100 trails other real asset categories, but the technical setup and macro alignment justify holding. This allocation serves a dual role: inflation hedge against the active inflation pressure descriptor, and monetary insurance against credit stress activation. To escalate to top-2 would require GLD to break above 187.46 with volume confirmation, signaling institutional accumulation has moved from steady to aggressive.
Utilities & Infrastructure — PAVE
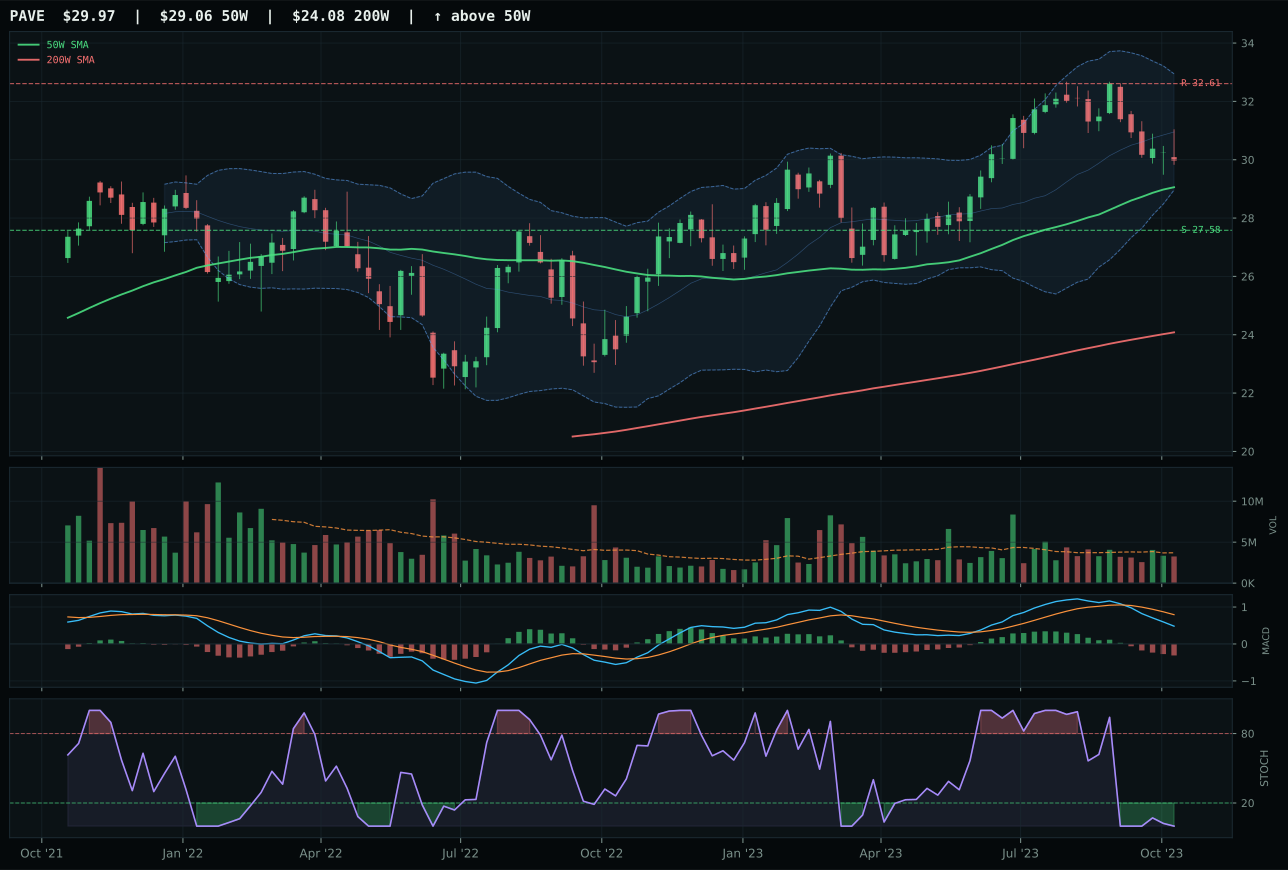
PAVE has a neutral structure profile with -1.6% 13-week relative strength versus SPY.
A failed hold above support would weaken the setup.
Actionable but governed by invalidation levels.
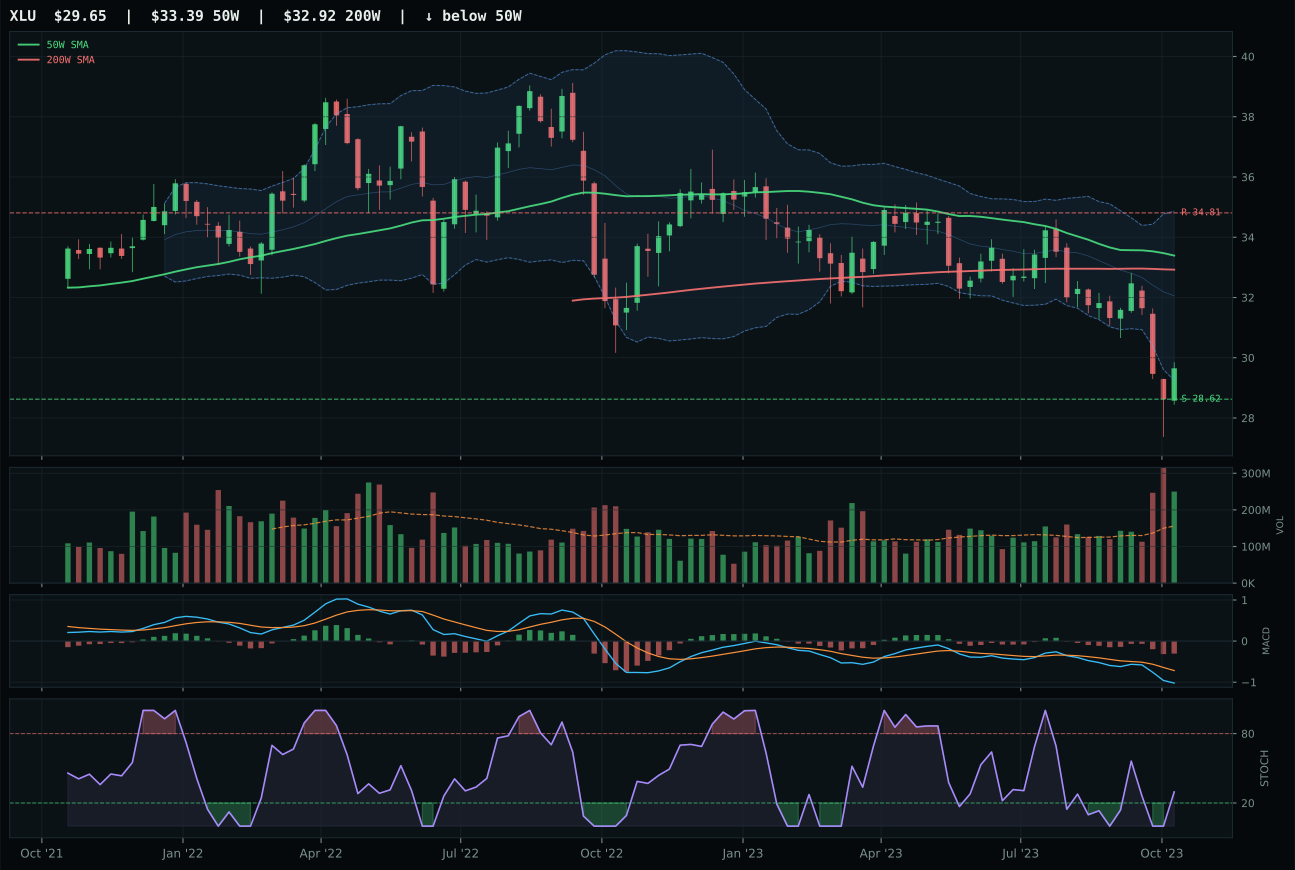
XLU has a pullback into support profile with -7.3% 13-week relative strength versus SPY.
A failed hold above support would weaken the setup.
Actionable but governed by invalidation levels.
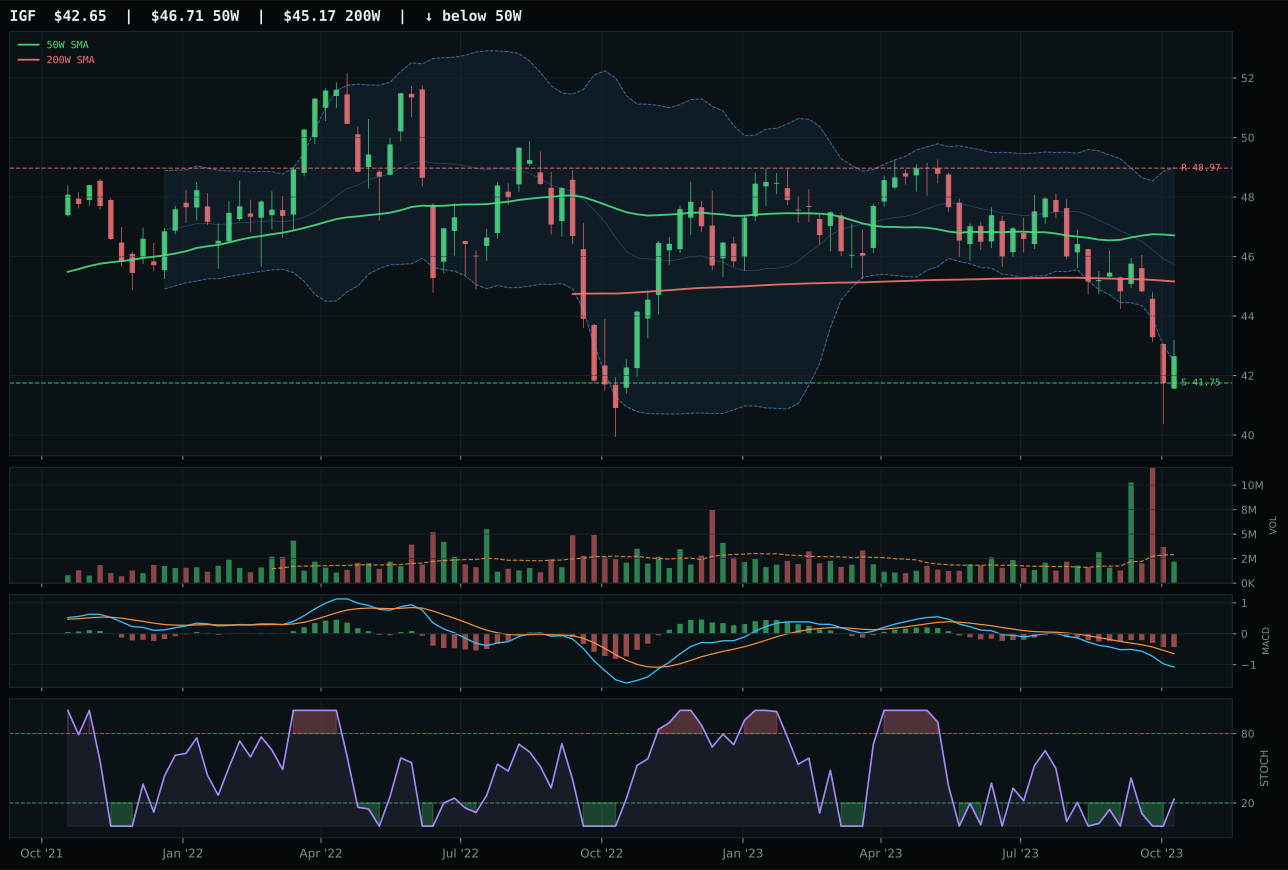
IGF has a pullback into support profile with -6.3% 13-week relative strength versus SPY.
A failed hold above support would weaken the setup.
Actionable but governed by invalidation levels.
PAVE secured the category by marginal technical superiority—timing score of 85.0/100 versus XLU's 68.0/100 and category-relative strength of 4.7% versus XLU's -1.0% tipped the decision. PAVE sits 3.1% above the 50W in a neutral structure with compression at 83.7/100, MACD weakening but organized, and stochastic RSI at complete oversold (0.00), suggesting reversal potential if infrastructure spending narratives persist. Risk/reward of 61.8/100 reflects -8.1% upside to 32.61 resistance but only 8.7% downside to 27.58 support—a tight risk envelope. Volume at 0.88x the 20W average remains neutral, meaning the setup lacks heavy accumulation signals but also avoids capitulation selling. XLU's pullback-into-support structure should theoretically offer more support confirmation, yet its volume shows accumulation at 1.57x and stochastic RSI is rising mid-zone, but the -11.3% 13W return and -7.3% SPY-relative weakness overwhelmed XLU's technical foundation.
Utilities & Infrastructure holds 5% tier-2 allocation despite a modest 33.3 category score, justified by macro tailwinds that most credit-sensitive categories lack. Category-level macro fit reaches 49.0/100 from positive contributions (Transition/Mixed at +4, broad market bear at +4) against inflation pressure at -6 and liquidity stress at -3—a relatively balanced macro environment compared to other defensive sleeves. PAVE's infrastructure capex theme aligns with Late-Cycle Reflation concerns about government spending durability; as private capital tightens, infrastructure-dependent utilities become safer relative returns. The 5% weighting reflects caution rather than conviction: trend score of 79.6/100 is respectable but volume participation remains neutral at 0.88x the 20W, meaning real money accumulation is not occurring yet. For this category to graduate to higher allocation, either XLU or IGF must show decisive volume participation during any rebound, or government infrastructure spending must accelerate to confirm the reflation thesis. Hold current allocation; do not add unless category-level macro fit breaks above 60.0/100.
Agriculture & Livestock — MOO
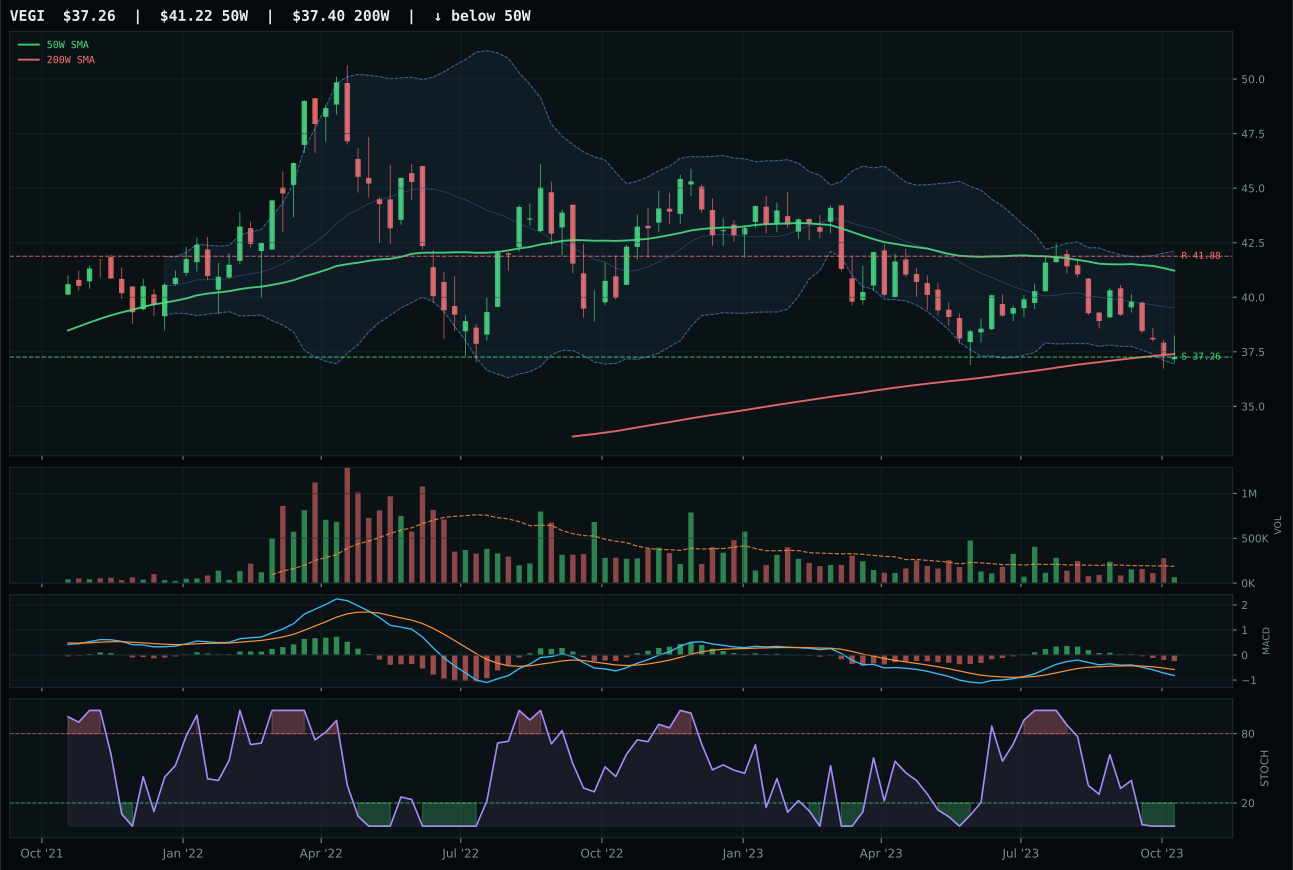
VEGI has a pullback into support profile with -3.5% 13-week relative strength versus SPY.
A failed hold above support would weaken the setup.
Tracked, but not top-2 eligible because: .
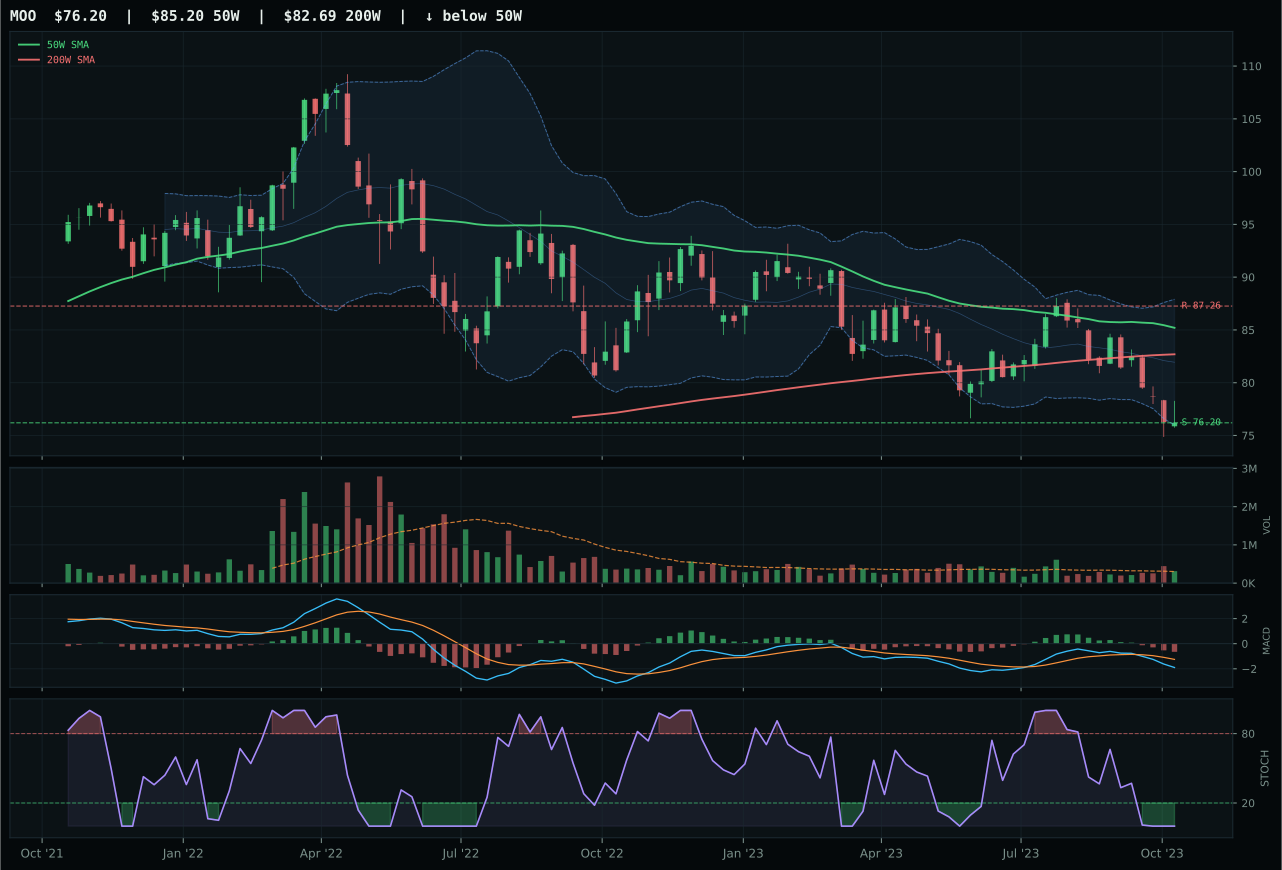
MOO has a pullback into support profile with -4.9% 13-week relative strength versus SPY.
A failed hold above support would weaken the setup.
Actionable but governed by invalidation levels.
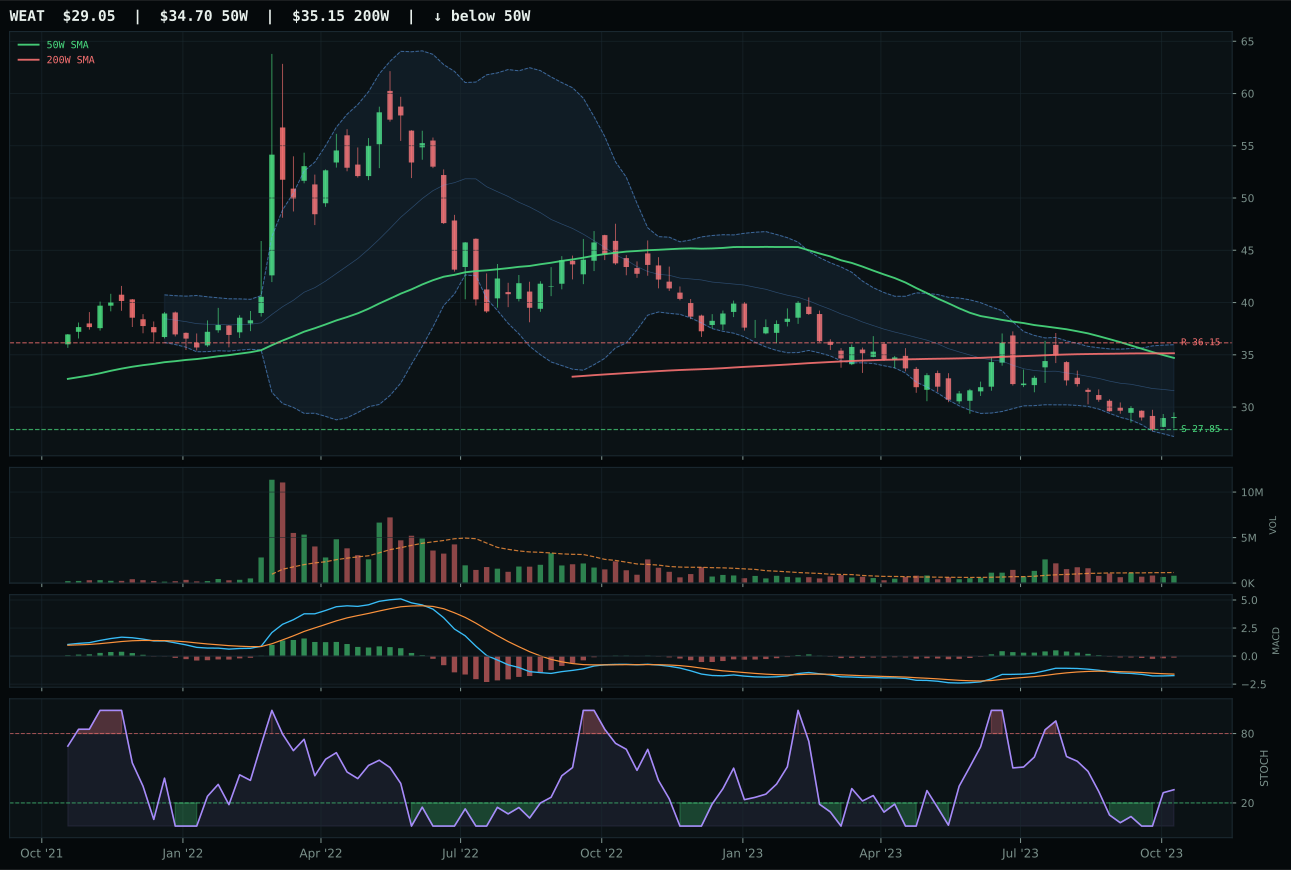
WEAT has a pullback into support profile with -7.5% 13-week relative strength versus SPY.
Extension and support failure are the main tactical risks.
Tracked, but not top-2 eligible because: structurally broken.
MOO won through macro sponsorship more than technical strength, securing the category with a -23.7-point gap over runner-up VEGI in what amounts to a category-wide distress scenario. Price sits -10.6% below the 50W and sits near 78.96, pulled down to Fib 0.786 deep in the repair zone with stochastic RSI at complete oversold (0.00). The trend score of 29.6/100 reflects this damage, yet risk/reward still scores 73.5/100 because downside to support is pinned at 0.0%—price has nowhere lower to go. MOO's category-relative strength of 0.0% ties it with VEGI, and volume remains neutral, so the technical case is symmetric between both names. The decisive factor: MOO's macro narrative fit reached 70.0/100 from supply shortage at +8, inflation pressure at +7, and real asset sponsorship at +5, allowing the portfolio to hold agricultural exposure despite the broken chart structure. This is allocation by macro conviction, not technical timing.
Agriculture & Livestock receives 5% allocation despite a final category score of only 28.7, sitting firmly in tier-2 with the lowest composite technical strength of any allocated sleeve. The macro case is overwhelming: category-level macro fit of 85.0/100 comes from Late-Cycle Reflation at +8 points, supply shortage at +13, inflation pressure at +10, real asset sponsorship at +8, and only liquidity stress at -4 to temper the thesis. In a reflation regime where commodities and real assets are bid, agricultural producers benefit from both input-cost inflation (favoring sellers with pricing power) and demand from emerging markets hedging currency debasement. MOO and VEGI both trade in oversold territory with 13W returns near -8%, creating a potential reversion candidate if supply constraints remain in place. Maintain this position; to remove it would require either a fundamental shift in supply conditions or a break below support that violates the risk/reward framework. The 5% weighting acknowledges the disrupted technicals while respecting the macro thesis.
Technology — XLK
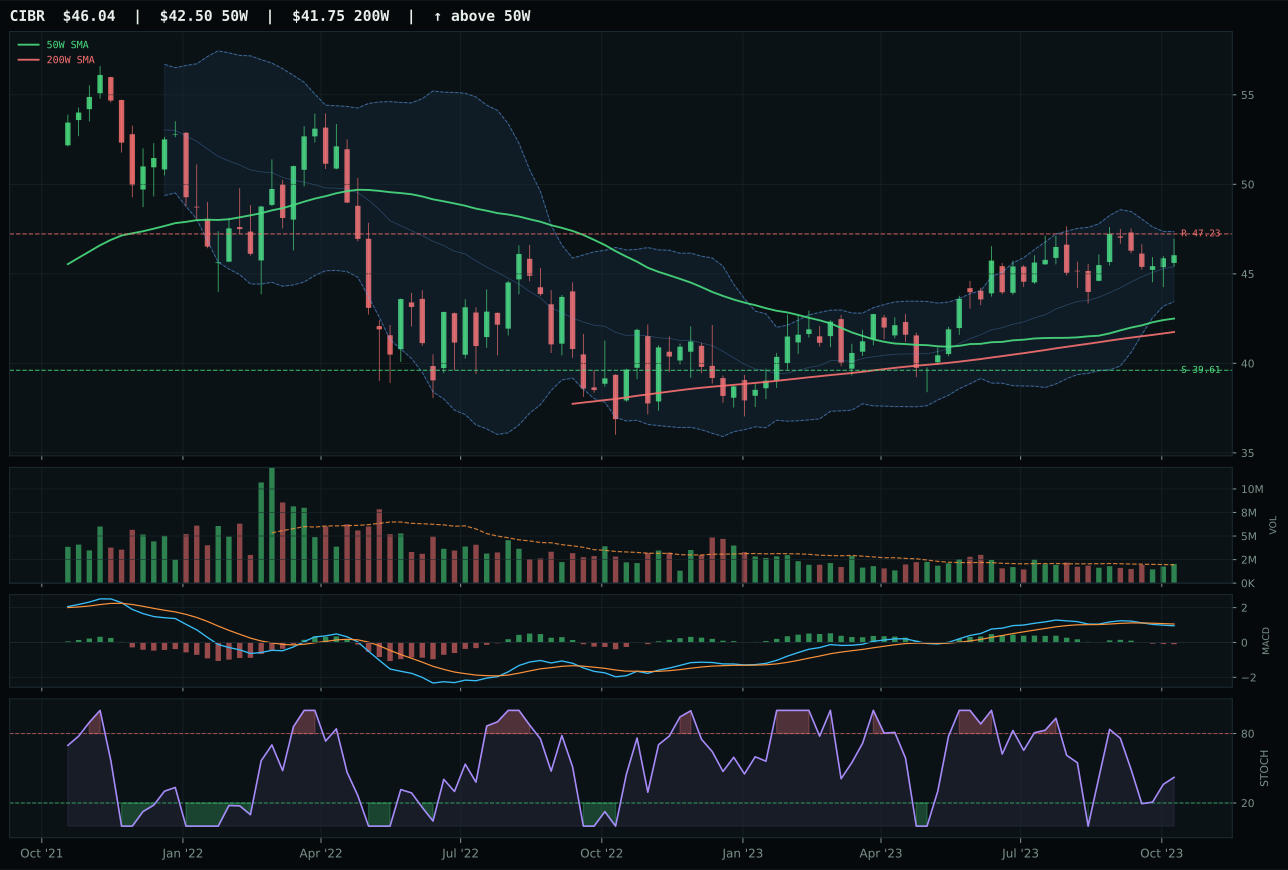
CIBR has a neutral structure profile with 4.9% 13-week relative strength versus SPY.
A failed hold above support would weaken the setup.
Actionable but governed by invalidation levels.
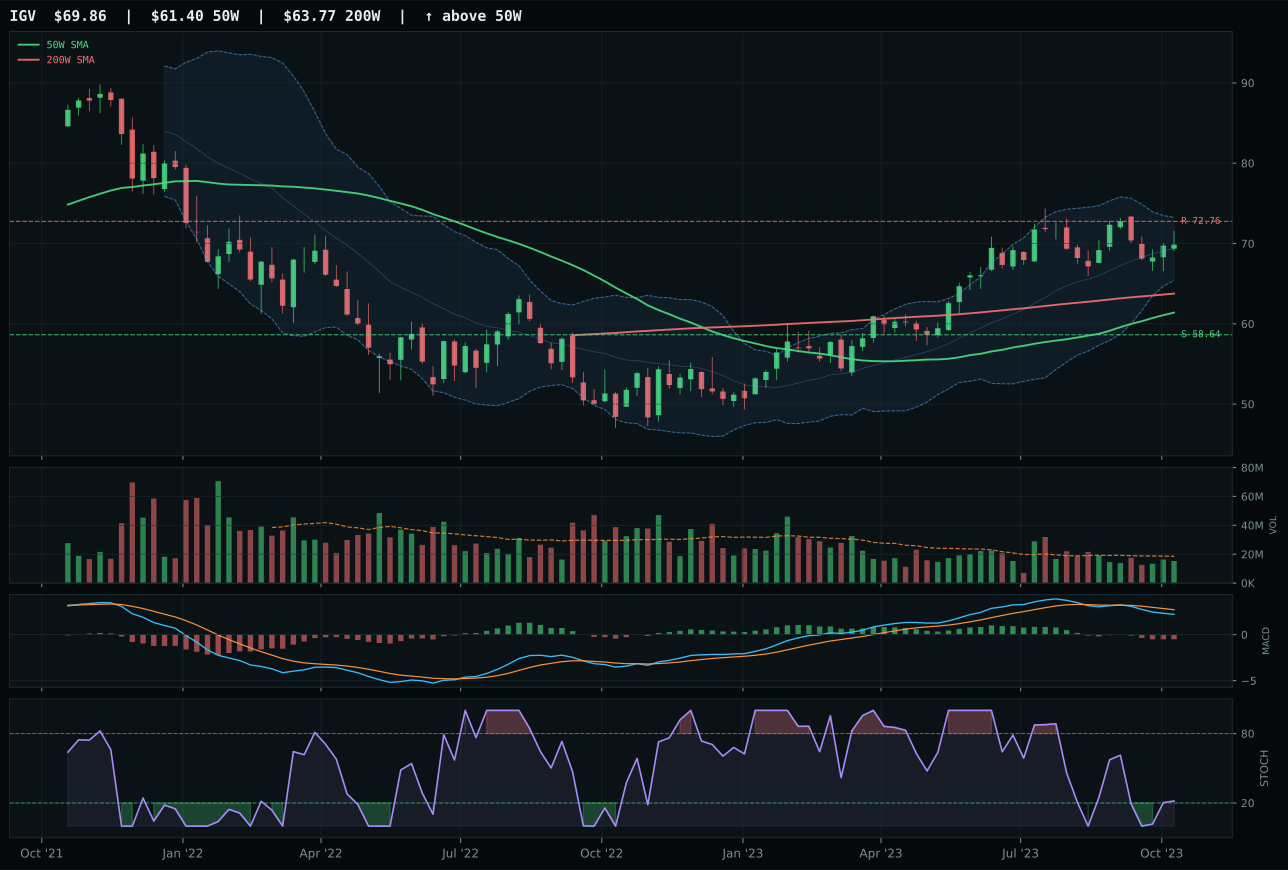
IGV has a neutral structure profile with 1.3% 13-week relative strength versus SPY.
A failed hold above support would weaken the setup.
Actionable but governed by invalidation levels.
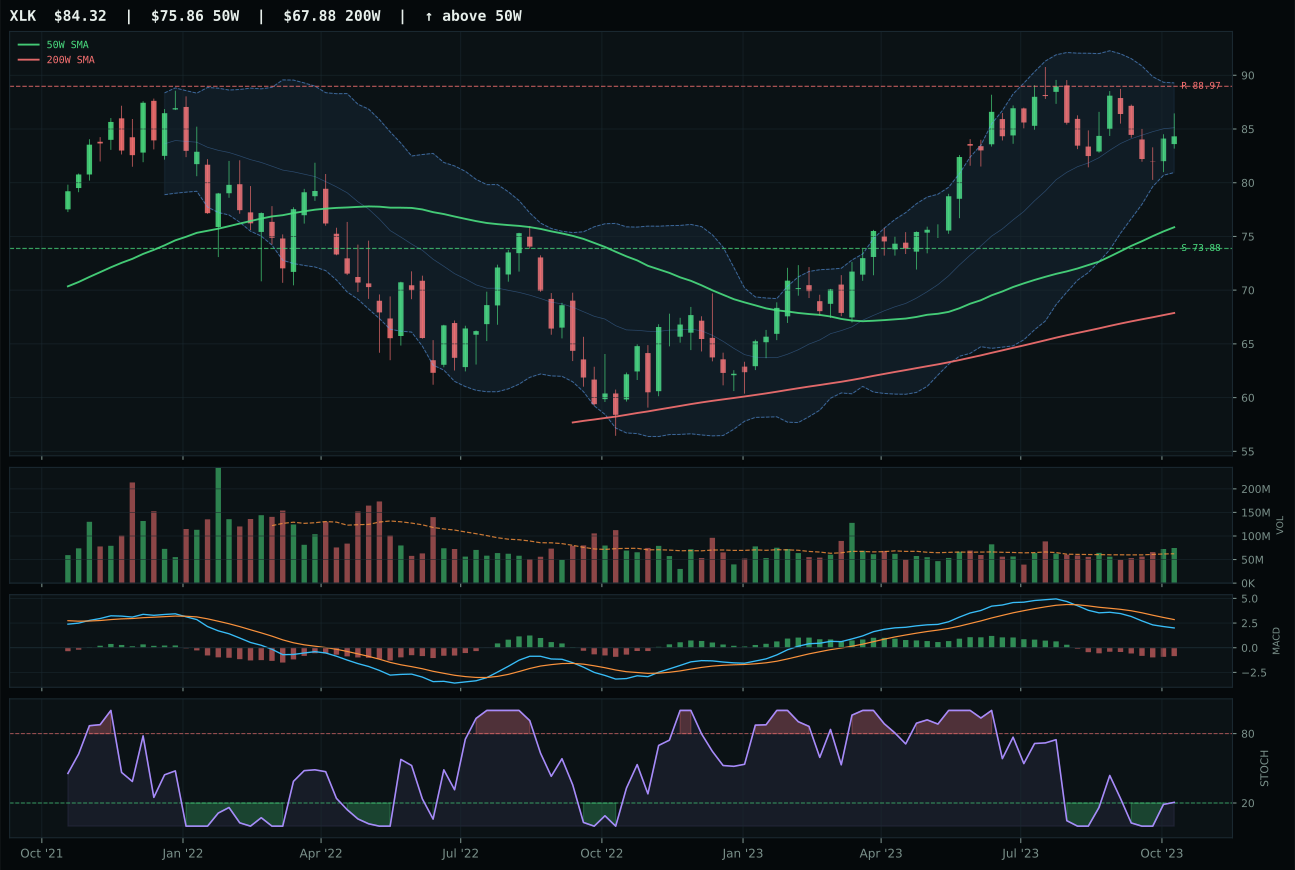
XLK has a neutral structure profile with -0.2% 13-week relative strength versus SPY.
A failed hold above support would weaken the setup.
Actionable but governed by invalidation levels.
XLK claimed the category by defending relative stability where peers faltered. The winner sits 11.1% above its 50-week moving average with a 50W slope holding flat at 0.5%, translating to a neutral hold rather than deterioration—critical in a macro environment where liquidity stress and credit stress are both active headwinds. CIBR lost ground on two decisive fronts: its risk/reward asymmetry compressed to 47.8 versus XLK's 51.7, and volume participation remained neutral instead of the above-average buying that XLK captured at 1.20x its 20W average. The setup quality differs in a subtle but important way: both trade neutral structures with identical MACD weakness and mid-zone stochastic timing, but XLK's volume endorsement suggests accumulation is occurring into weakness rather than capitulation selling. This is a technical edge in a category where the macro regime offers no tailwind.
Technology earns a 5% allocation despite ranking outside the top two categories this week. The category's composite score of 27.2 reflects a deeply challenged macro fit at 24.0/100—the highest headwinds belong to liquidity stress at -10 points and credit stress at -7 points, both active drags in a Late-Cycle Reflation regime where capital is tightening. XLK's relative strength versus SPY sits at -0.2%, meaning the sector is lagging broad equity buyers; without that neutral-to-slightly-positive technical performance, this category would receive zero allocation. The case for holding at 5% is defensive: technology's trend score of 81.7/100 proves price structure remains intact, and the stochastic RSI rising from mid-zone suggests a retest of resistance remains possible if credit conditions stabilize. Elimination would require either a break below the 50W support at 73.88 or a widening of the SPY relative strength gap below -2.0%.
Emerging Markets — INDA
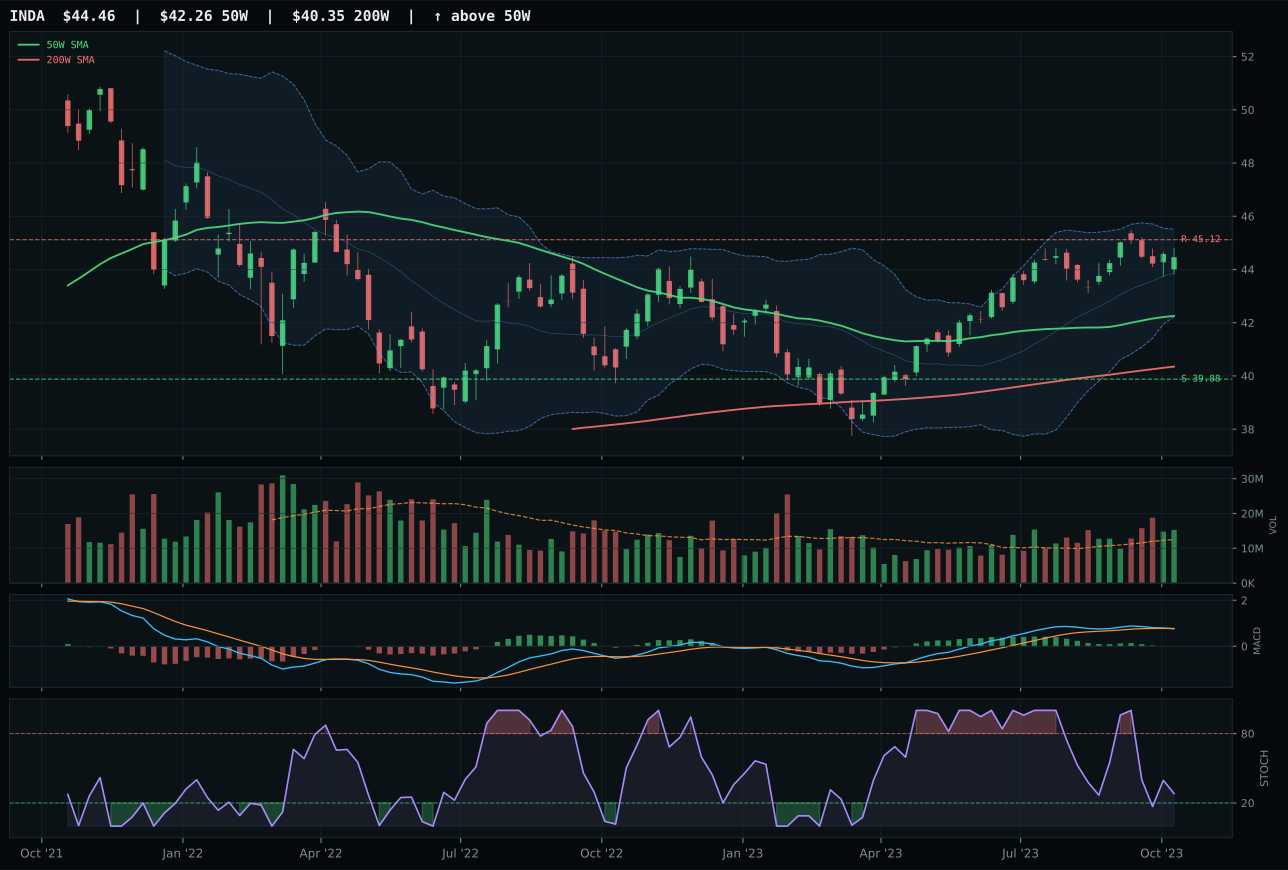
INDA has a neutral structure profile with 4.4% 13-week relative strength versus SPY.
A failed hold above support would weaken the setup.
Actionable but governed by invalidation levels.
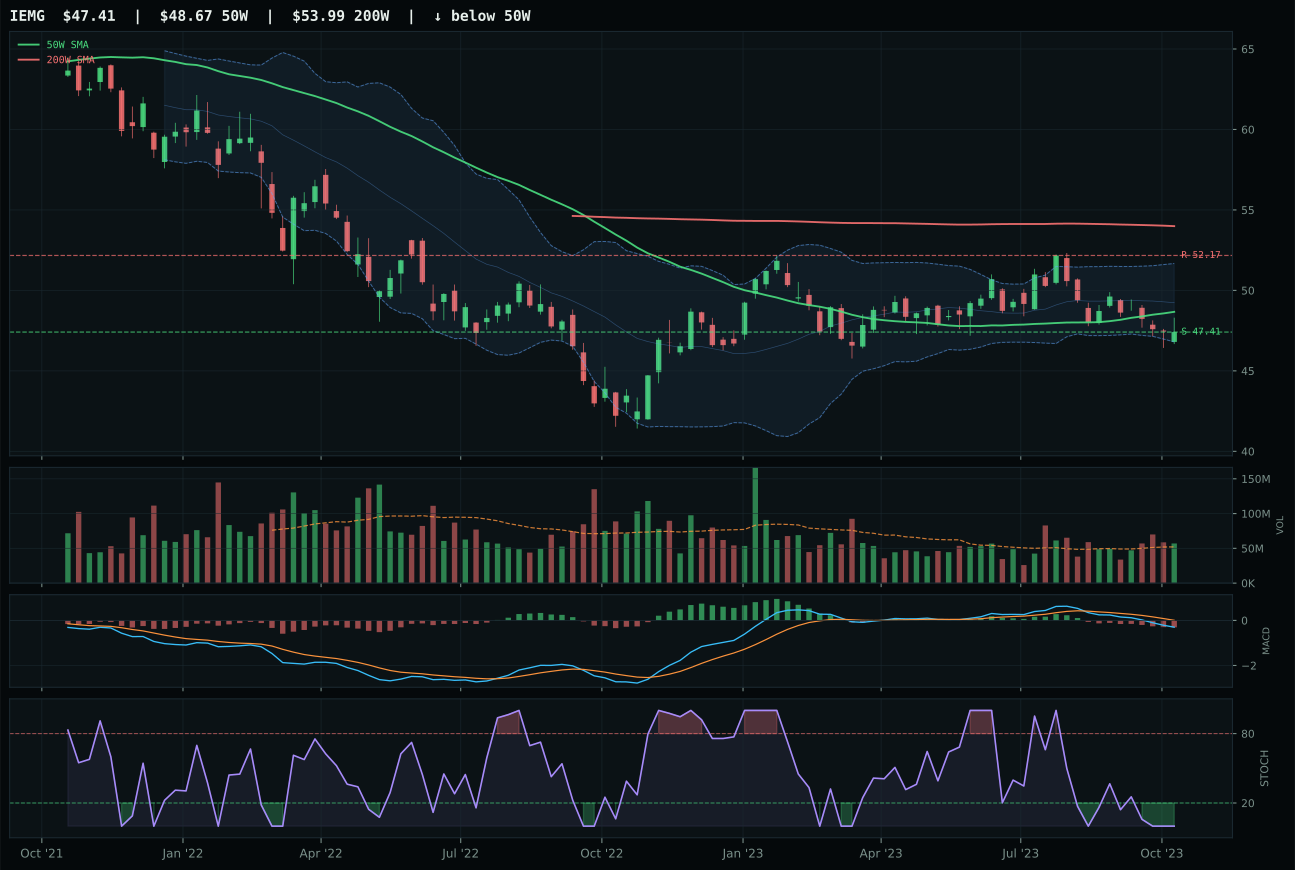
IEMG has a pullback into support profile with -3.1% 13-week relative strength versus SPY.
Extension and support failure are the main tactical risks.
Tracked, but not top-2 eligible because: structurally broken.
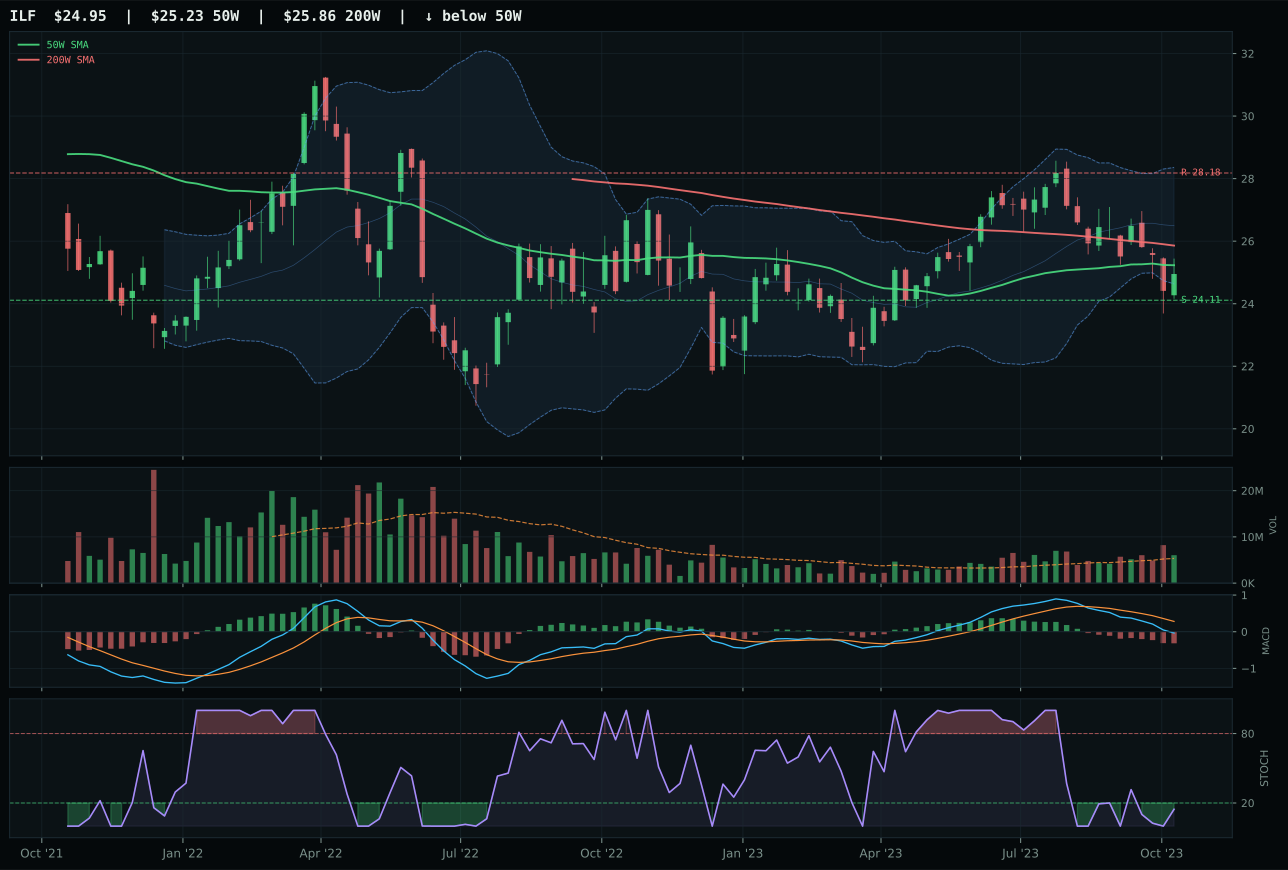
ILF has a pullback into support profile with -4.8% 13-week relative strength versus SPY.
Extension and support failure are the main tactical risks.
Tracked, but not top-2 eligible because: structurally broken.
INDA dominated the category with a 54.1-point scoring gap over IEMG, but this margin masks a category-wide macro crisis that dragged the final score down to 0.0. INDA sits 5.2% above its 50W with trend score of 88.6/100, neutral structure, above-average volume participation at 1.22x the 20W average, and category-relative strength of 7.5%—the clear technical winner by any standard. IEMG's structure decomposed to 37.7/100 as price trades -17.6% below its 50W in a pullback-into-support setup with stochastic RSI at complete oversold (0.00) and volume remaining neutral, failing to confirm the rebound. INDA's relative strength advantage and intact trend structure translate to momentum confirmation of 56.5/100 versus IEMG's 18.0%, a decisive technical fork. Volume participation of 1.22x the 20W average at INDA versus neutral at IEMG reveals institutional capital flow is favoring India-specific exposure over broad emerging markets.
Emerging Markets receives a 5% tier-2 allocation despite a final category score of 0.0, the portfolio's lowest score, because INDA's relative technical strength in a macro environment hostile to the entire category justifies a cautious position. The category-level macro fit collapsed to 7.0/100 from a devastating macro backdrop: dollar pressure at -14, credit stress at -10, liquidity stress at -10, and broad market bear at -9 all penalize emerging market exposure in a reflation cycle where dollar strength and capital repatriation are active. INDA's trend score of 88.6/100 and 4.4% relative strength versus SPY keep the category above zero allocation only on conviction that India's structural growth story can weather short-term macro headwinds. This is a tactical hold, not a conviction position; the portfolio holds INDA as a hedge against currency debasement more than as a cyclical emerging market bet. Liquidate this position entirely if INDA breaks below 39.88 support on volume or if the dollar index accelerates above 105.0, signaling that structural emerging market weakness will overcome tactical India strength.
Industrial Metals — PICK
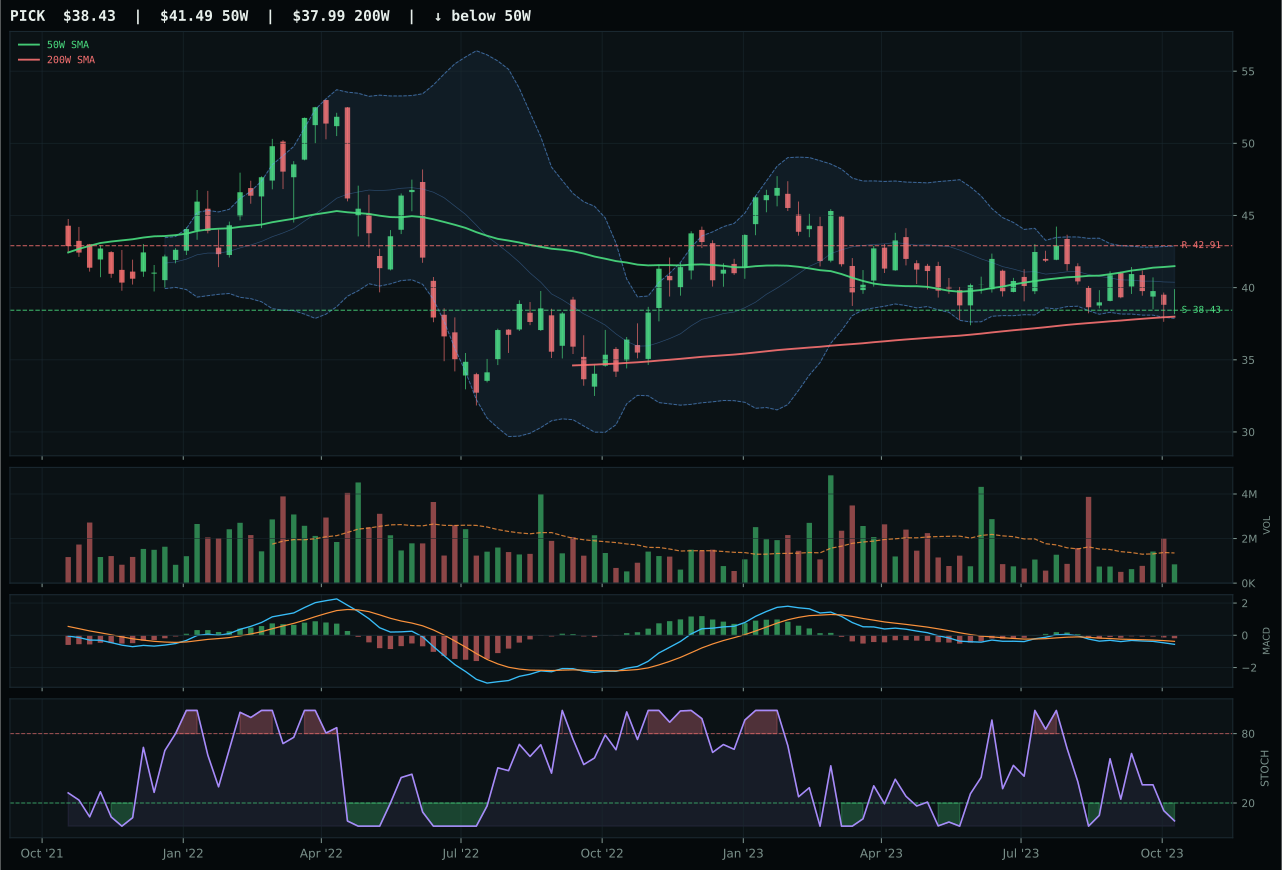
PICK has a pullback into support profile with -5.6% 13-week relative strength versus SPY.
A failed hold above support would weaken the setup.
Actionable but governed by invalidation levels.
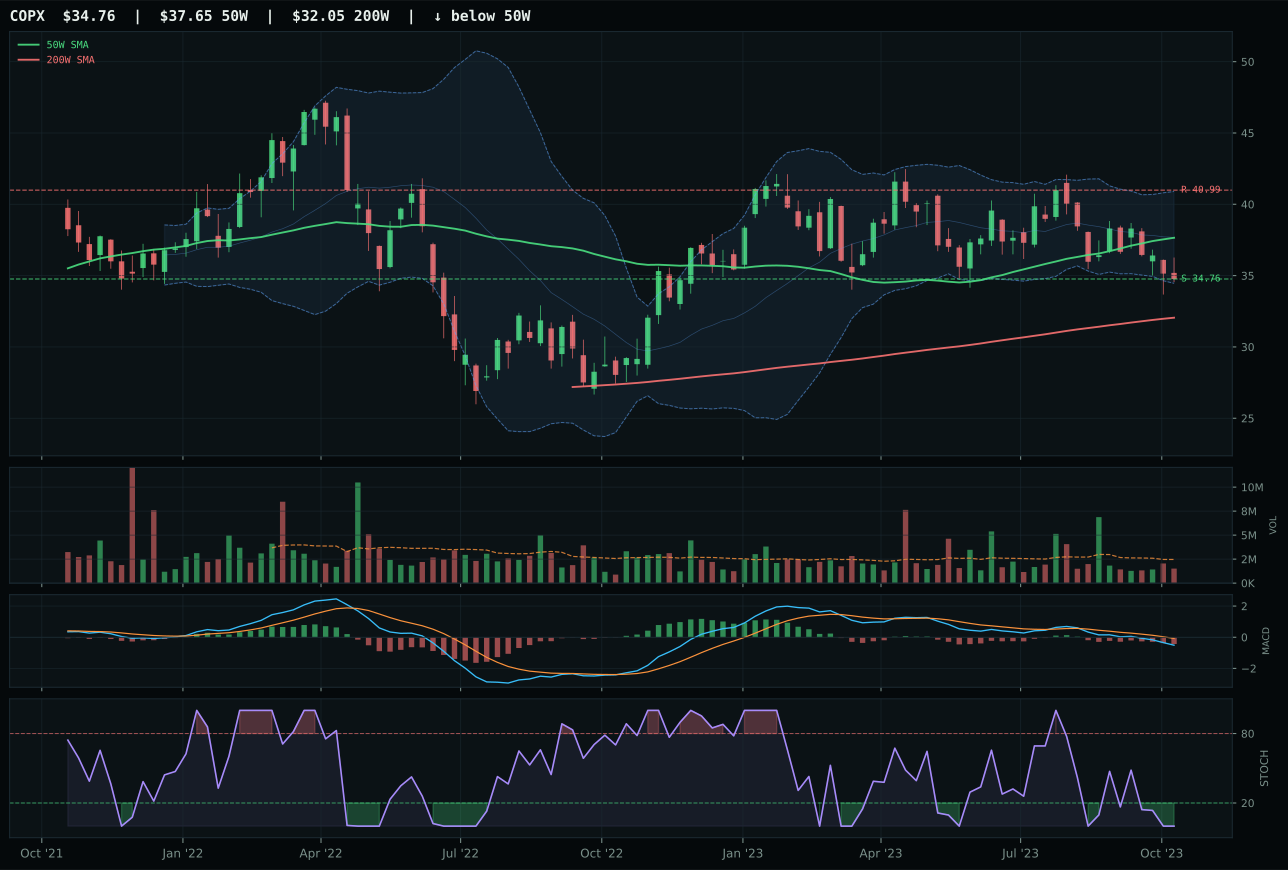
COPX has a pullback into support profile with -8.8% 13-week relative strength versus SPY.
A failed hold above support would weaken the setup.
Actionable but governed by invalidation levels.
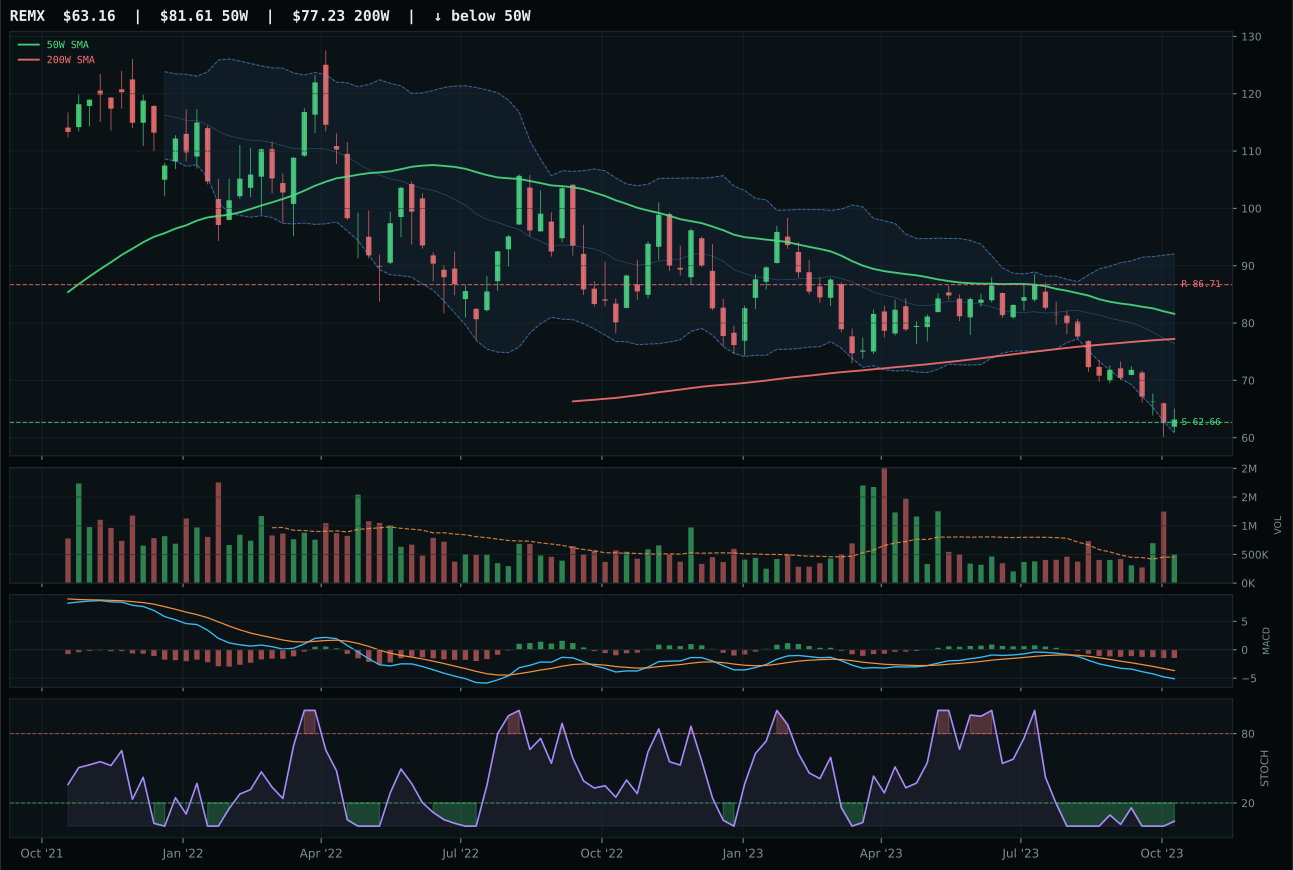
REMX has a pullback into support profile with -23.2% 13-week relative strength versus SPY.
A failed hold above support would weaken the setup.
Actionable but governed by invalidation levels.
PICK barely cleared COPX with a 1.7-point margin in a category where both names display structurally broken charts and thin volume participation. PICK trades -7.4% below the 50W with price near 38.43 support, positioned at Fib 0.618 in the deep value zone—a severe pullback that creates upside potential if the 38.43 floor holds. Stochastic RSI at oversold (0.05) and MACD weakening provide synchronous capitulation signals, the classic setup for reversal candidates. Category-relative strength of 3.3% versus COPX's 0.0% provides the tiebreaker, suggesting some rotating demand into diversified mining breadth. Volume at 0.62x the 20W average is thin, however, meaning any rebound will face liquidity challenges. COPX's -8.8% SPY-relative weakness and -12.8% 13W return prove copper's industrial demand cycle has turned; PICK's broader exposure offered slightly more resilience in this downturn.
Industrial Metals receives 0% allocation this week, excluded entirely from the portfolio after ranking 9th or 10th. The category-level macro fit of 44.0/100 reflects crushing headwinds: liquidity stress at -8, credit stress at -7, dollar pressure at -7, partially offset by Late-Cycle Reflation at +10 and real asset sponsorship at +6. PICK's technical evidence of only 31.3/100 cannot overcome the macro impediment; when copper is rolling over on dollar strength and credit stress, industrial metals demand signals capitulation. The final category score of 24.8 makes this the third-weakest sleeve behind AI and Industrial Metals. For this category to earn reinstatement, copper prices would need to stabilize above key support and PICK would need to show volume participation during any rebound—neither condition is currently met. The exclusion is macro-driven: in an environment where credit stress and dollar pressure are active, demand destruction for industrial inputs overrides the real asset sponsorship bid that helps agriculture and precious metals.
AI — SMH
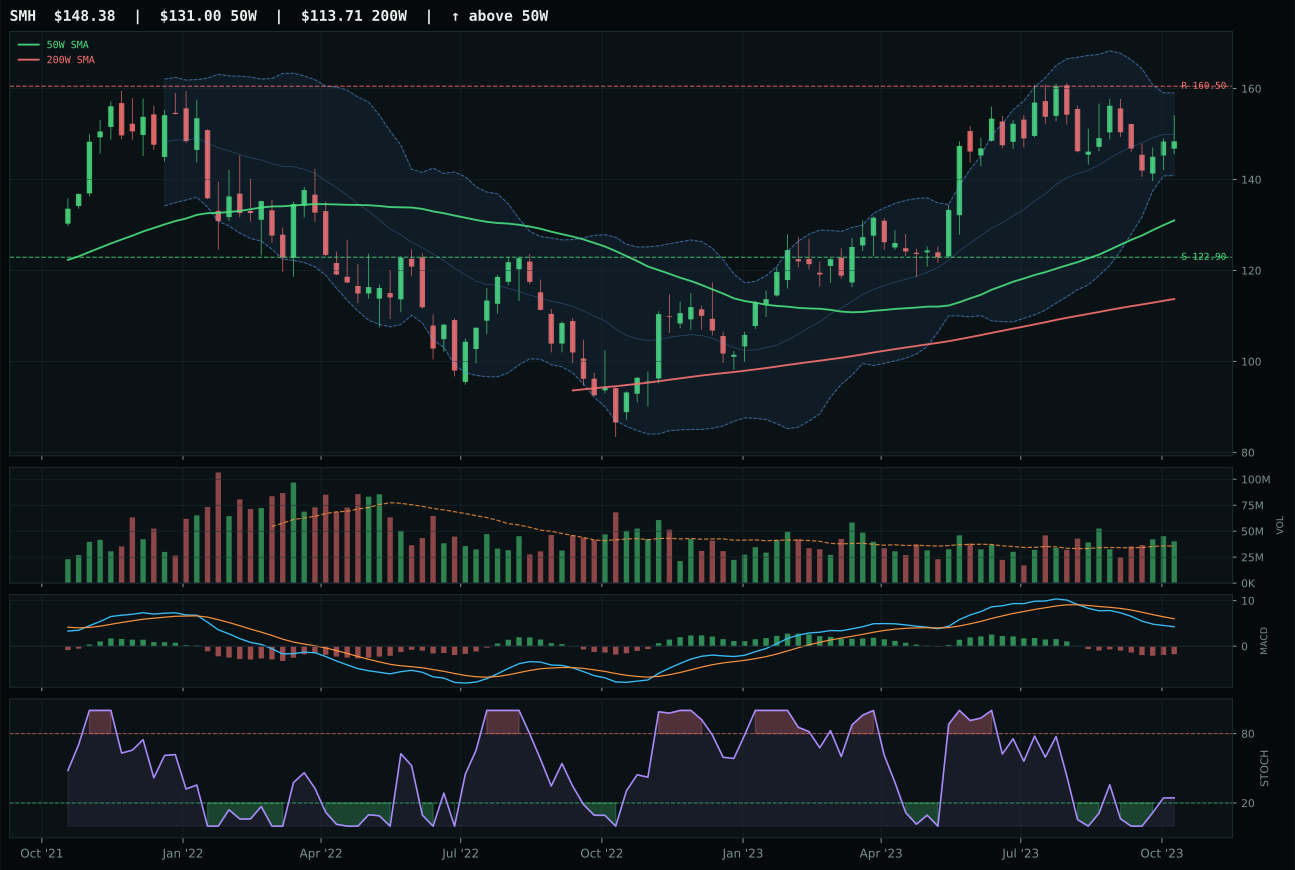
SMH has a neutral structure profile with -1.5% 13-week relative strength versus SPY.
A failed hold above support would weaken the setup.
Actionable but governed by invalidation levels.
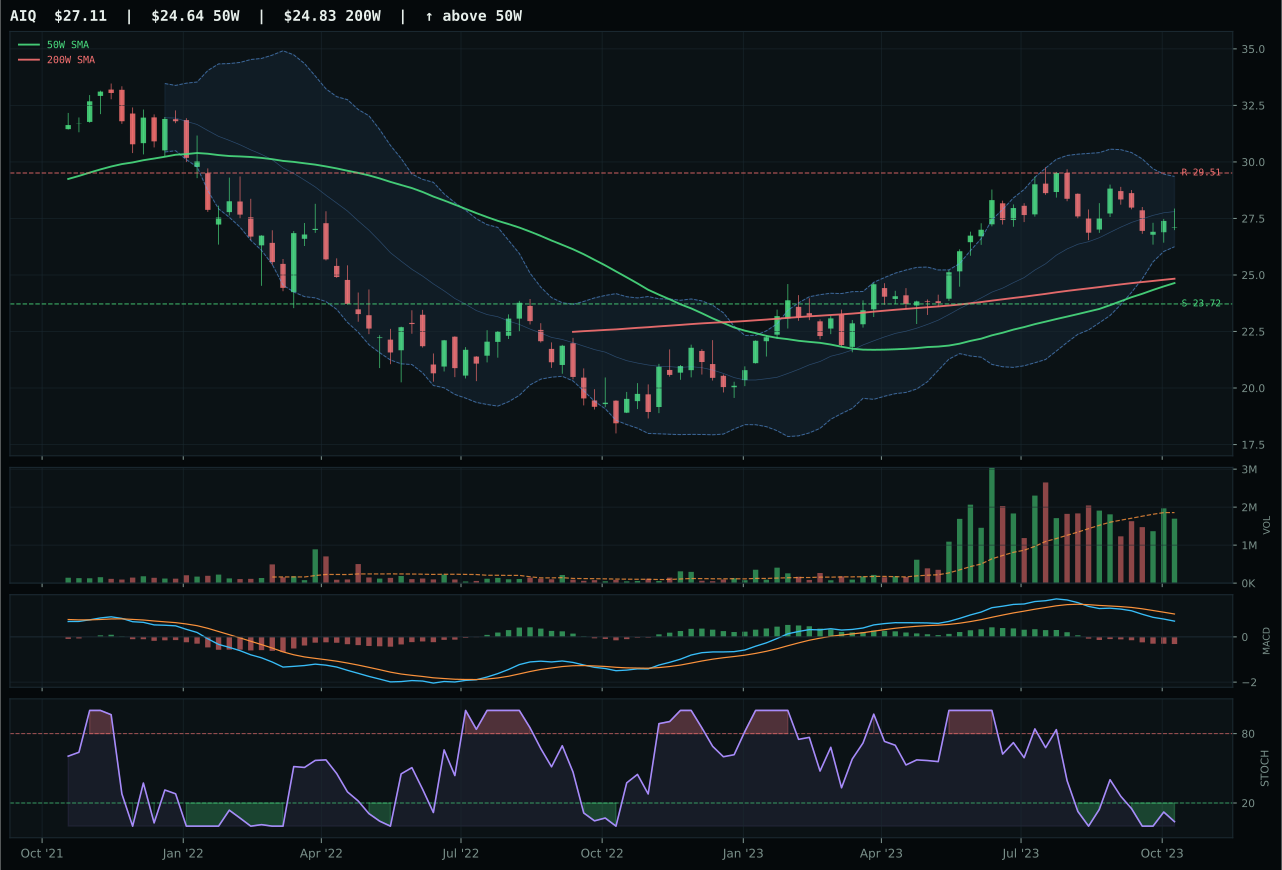
AIQ has a neutral structure profile with -2.6% 13-week relative strength versus SPY.
A failed hold above support would weaken the setup.
Actionable but governed by invalidation levels.
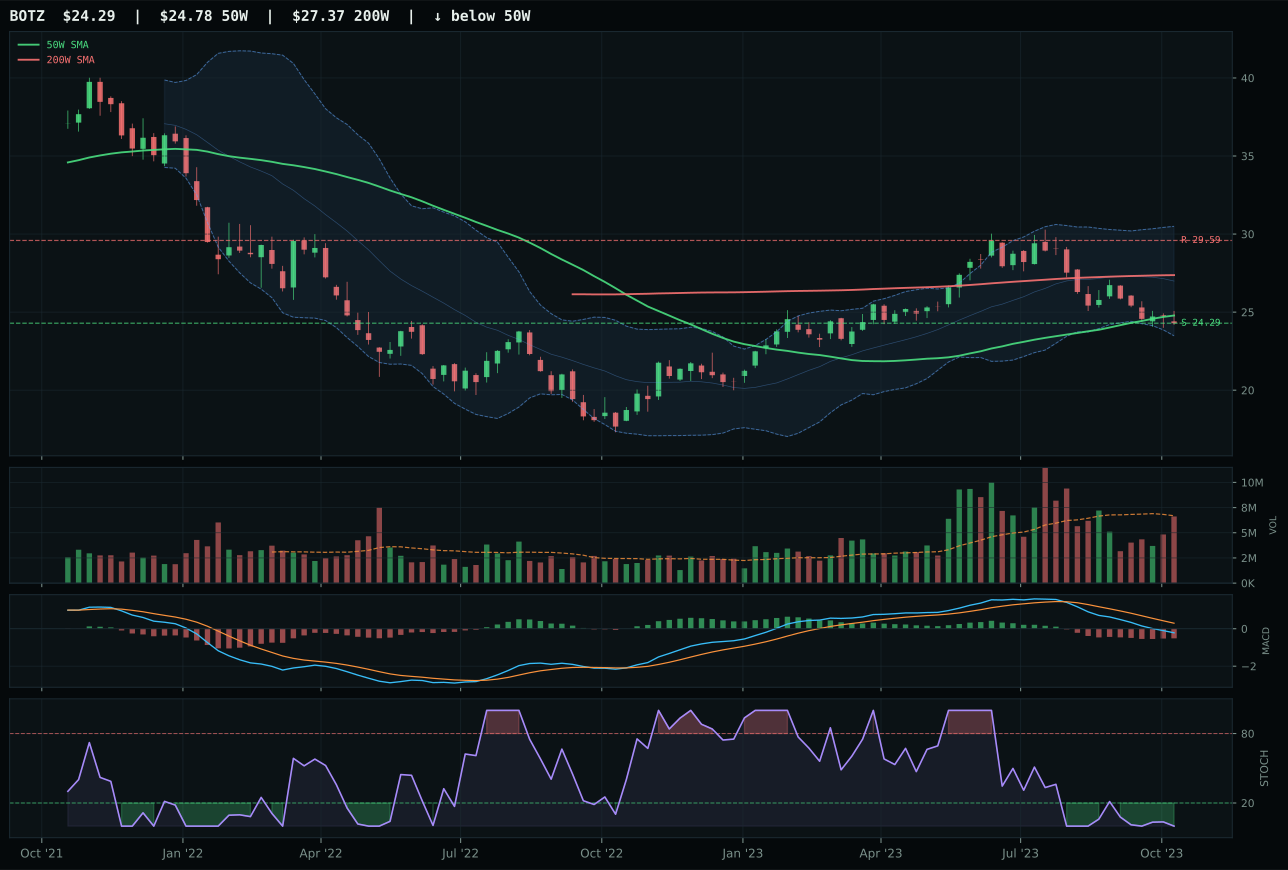
BOTZ has a pullback into support profile with -13.5% 13-week relative strength versus SPY.
Extension and support failure are the main tactical risks.
Tracked, but not top-2 eligible because: structurally broken.
SMH edged AIQ by a narrow 1.8-point margin in the reasoned proof order, winning through superior structure cleanliness and category-relative sponsorship. The semiconductor leader trades with 13.3% distance to its 50W at 143.73, positioned in the upper Fib retracement zone with stochastic RSI rising mid-zone—a textbook setup for expansion if support holds. AIQ stumbled on two counts: its structure score of 66.3 versus SMH's 72.5 signals less organized price action, and stochastic RSI at oversold turn-up lacks the mid-zone confirmation that SMH displays. Volume tells the same story: SMH captured above-average participation at 1.13x its 20W average while AIQ remained neutral, meaning institutions are not aggressively accumulating either name but at least SMH has the buying flow advantage. Both face identical MACD weakness and SPY-relative softness near -1.5 to -2.6%, so this win comes down to technical hygiene rather than conviction.
AI is completely excluded from the portfolio this week, receiving 0% allocation after ranking 9th or 10th among all categories. The category-level macro fit scored only 18.0/100, devastated by four simultaneous headwinds: liquidity stress at -12, credit stress at -8, broad market bear at -8, and dollar pressure at -4. SMH's technical evidence of 48.3/100 cannot overcome such fundamental macro deterioration when weighted at 64% against a macro fit of 34.0/100. The final category score collapsed to 12.5, making it the second-weakest sleeve in the portfolio. For AI to earn reinstatement, either the macro regime must shift away from multi-factor stress or SMH must break decisively above its 50W with volume confirmation—neither is currently signaling. This exclusion reflects not a tactical bearishness on semiconductors but rather the portfolio's need to redeploy capital toward categories with better risk-adjusted opportunity in an environment where credit is contracting and liquidity is under pressure.