
2023-10-06
Informational purposes only. The content in this report, including allocations, analysis, and commentary, is provided solely for informational and educational purposes. It does not constitute financial advice, investment advice, trading advice, or any other type of advice. Past performance does not guarantee future results. Always conduct your own research and consult a qualified financial professional before making investment decisions.
Weekly Allocation
| Ticker | Category | Weight | Role |
|---|---|---|---|
| FBTC | 50% | Overlay | |
| FCG | Traditional Energy | 10% | Top-2 (10%) |
| URNM | Nuclear Energy | 10% | Top-2 (10%) |
| INDA | Emerging Markets | 5% | Tier-2 (5%) |
| CIBR | Technology | 5% | Tier-2 (5%) |
| XAR | Defense & Aerospace | 5% | Tier-2 (5%) |
| PAVE | Utilities & Infrastructure | 5% | Tier-2 (5%) |
| PICK | Industrial Metals | 5% | Tier-2 (5%) |
| SMH | AI | 5% | Tier-2 (5%) |
Trade Instructions — Monday Open
Sell the tranche from 2023-09-08 (completing its 4-week hold). Buy the new tranche. Instructions show net portfolio changes — same-asset positions cancel, weight changes show the delta.
| Action | Ticker | Instruction |
|---|---|---|
| SELL | XLE | Sell 25% of XLE position (reduce 10.00% → 7.50%) |
| SELL | MOO | Sell 25% of MOO position (reduce 5.00% → 3.75%) |
| SELL | GLD | Sell 33% of GLD position (reduce 3.75% → 2.50%) |
| SELL | IGV | Sell entire IGV position (1.25% of portfolio) |
| BUY | CIBR | Buy CIBR — 20.00% of freed cash (adds 1.25% to portfolio) |
| BUY | FCG | Buy FCG — 40.00% of freed cash (adds 2.50% to portfolio) |
| BUY | INDA | Buy INDA — 20.00% of freed cash (adds 1.25% to portfolio) |
| BUY | SMH | Buy SMH — 20.00% of freed cash (adds 1.25% to portfolio) |
Current Portfolio After Trade
Combined holdings across all 4 active tranches. Each tranche is 25% of the portfolio.
| Ticker | % of Portfolio | Weight Bar |
|---|---|---|
| FBTC | 50.00% | |
| URNM | 10.00% | |
| XLE | 7.50% | |
| XAR | 5.00% | |
| CIBR | 5.00% | |
| MOO | 3.75% | |
| GLD | 2.50% | |
| PICK | 2.50% | |
| COPX | 2.50% | |
| XLU | 2.50% | |
| FCG | 2.50% | |
| SLV | 1.25% | |
| IGF | 1.25% | |
| INDA | 1.25% | |
| PAVE | 1.25% | |
| SMH | 1.25% |
Macro Regime — Late-Cycle Reflation
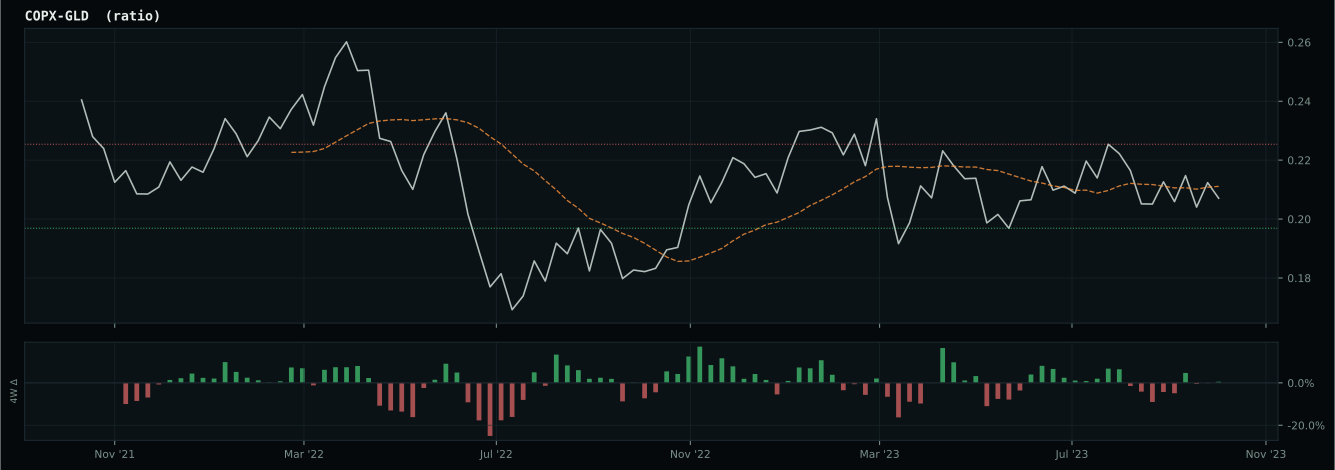
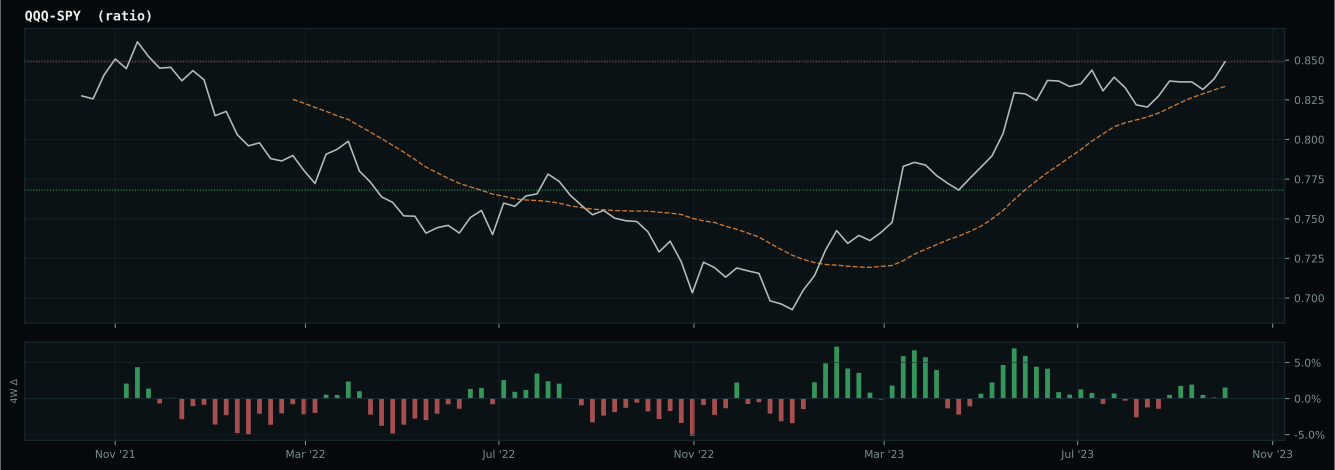
inflation-sensitive ratios are firm but broad commodity participation is weak
Macro Evidence Charts
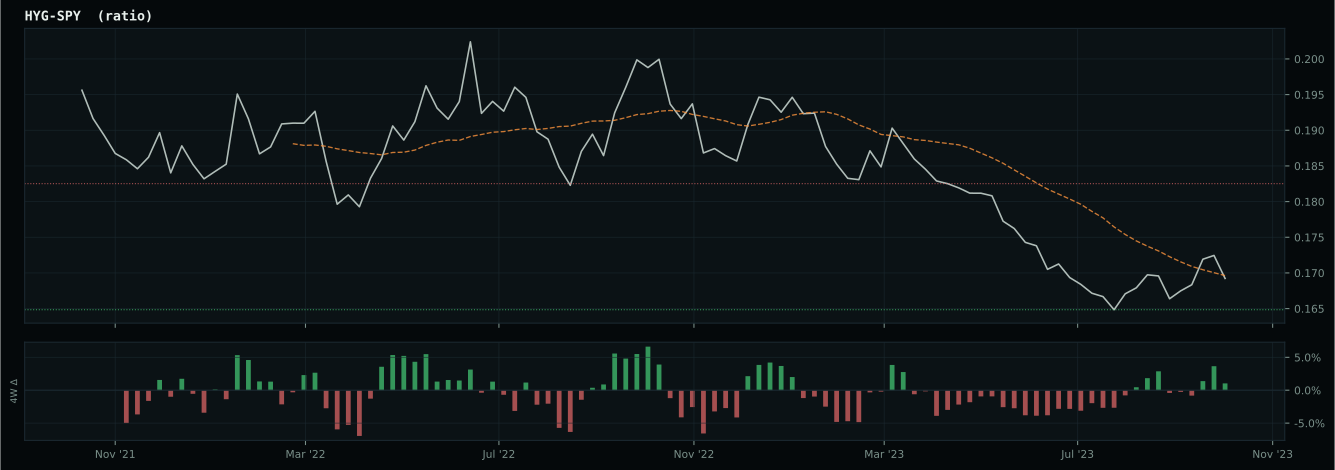
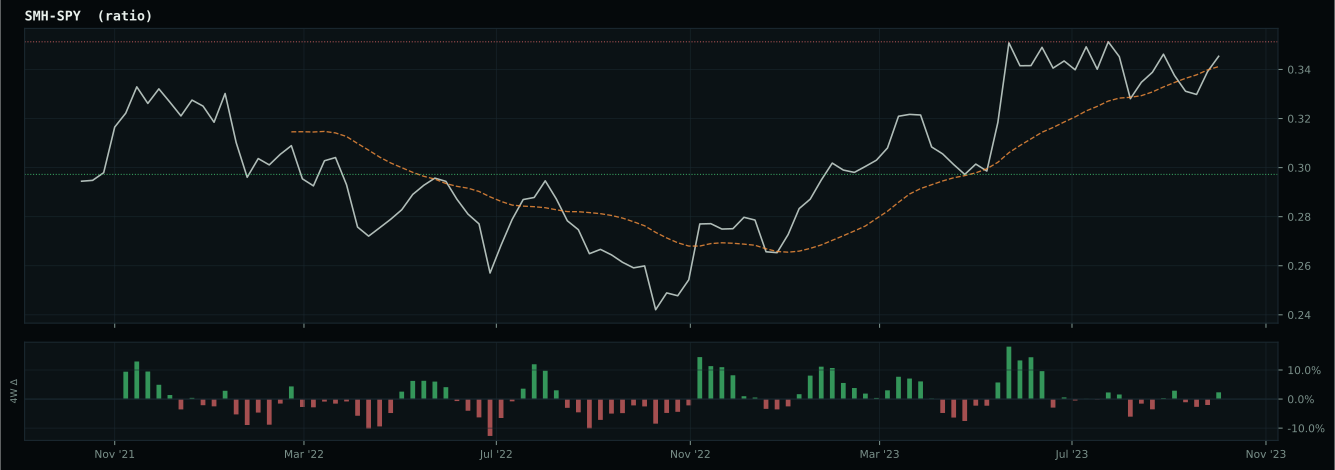
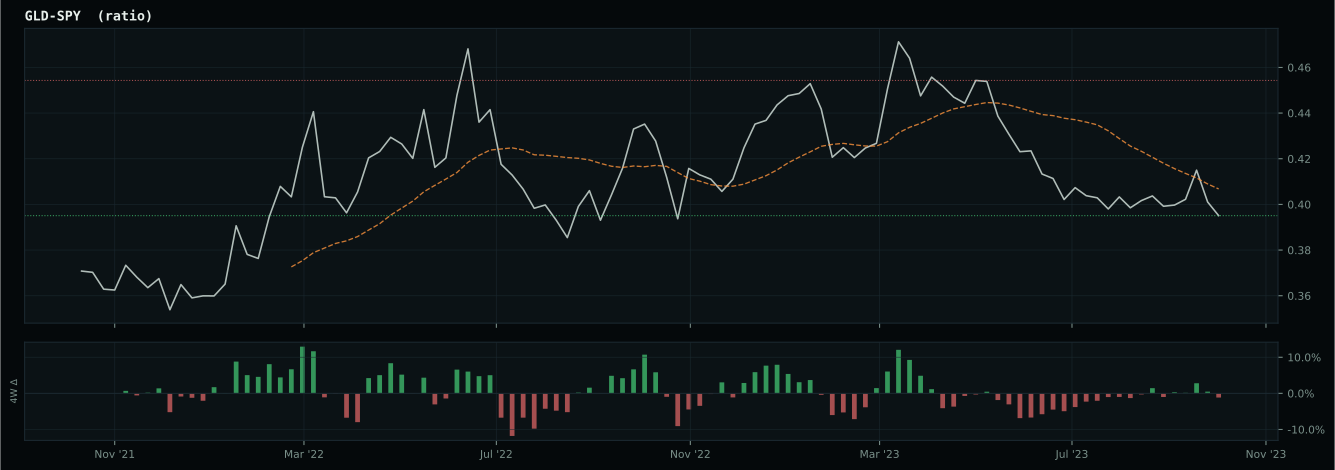
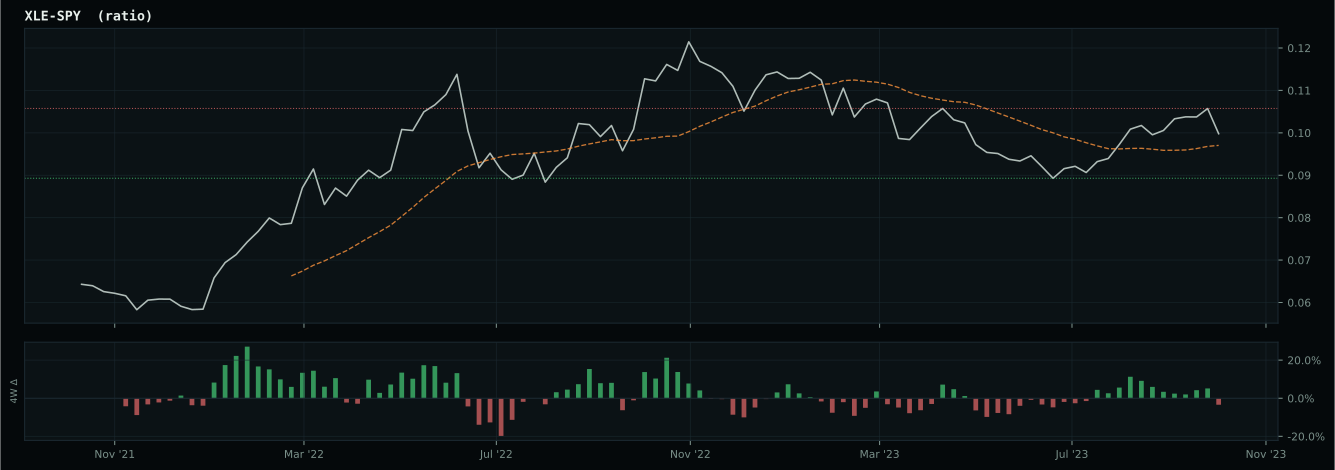
Market-implied signals behind the macro regime scores. Each ratio compares two assets; the direction and slope of the ratio is what the macro engine reads.
Crypto Regime — TrendBTC
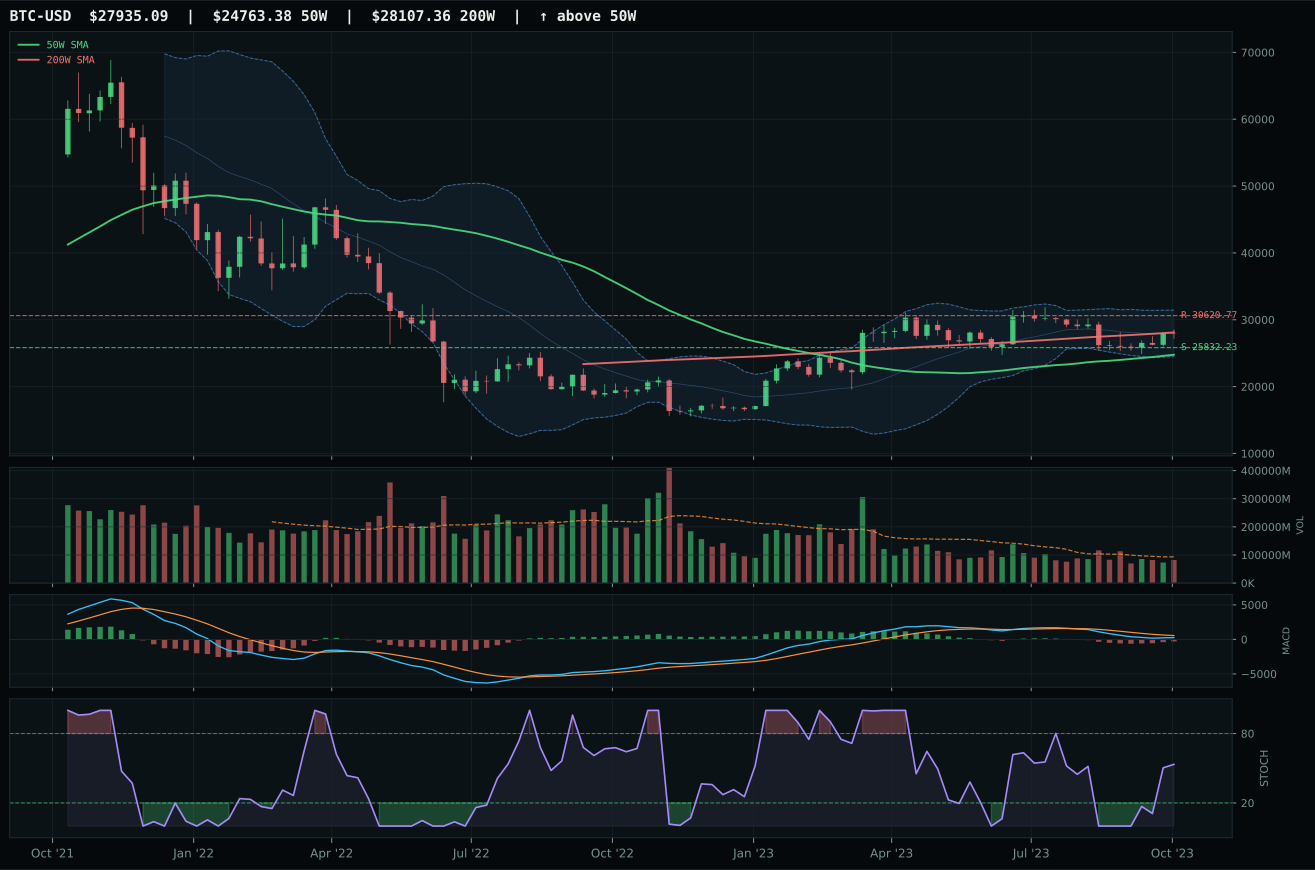
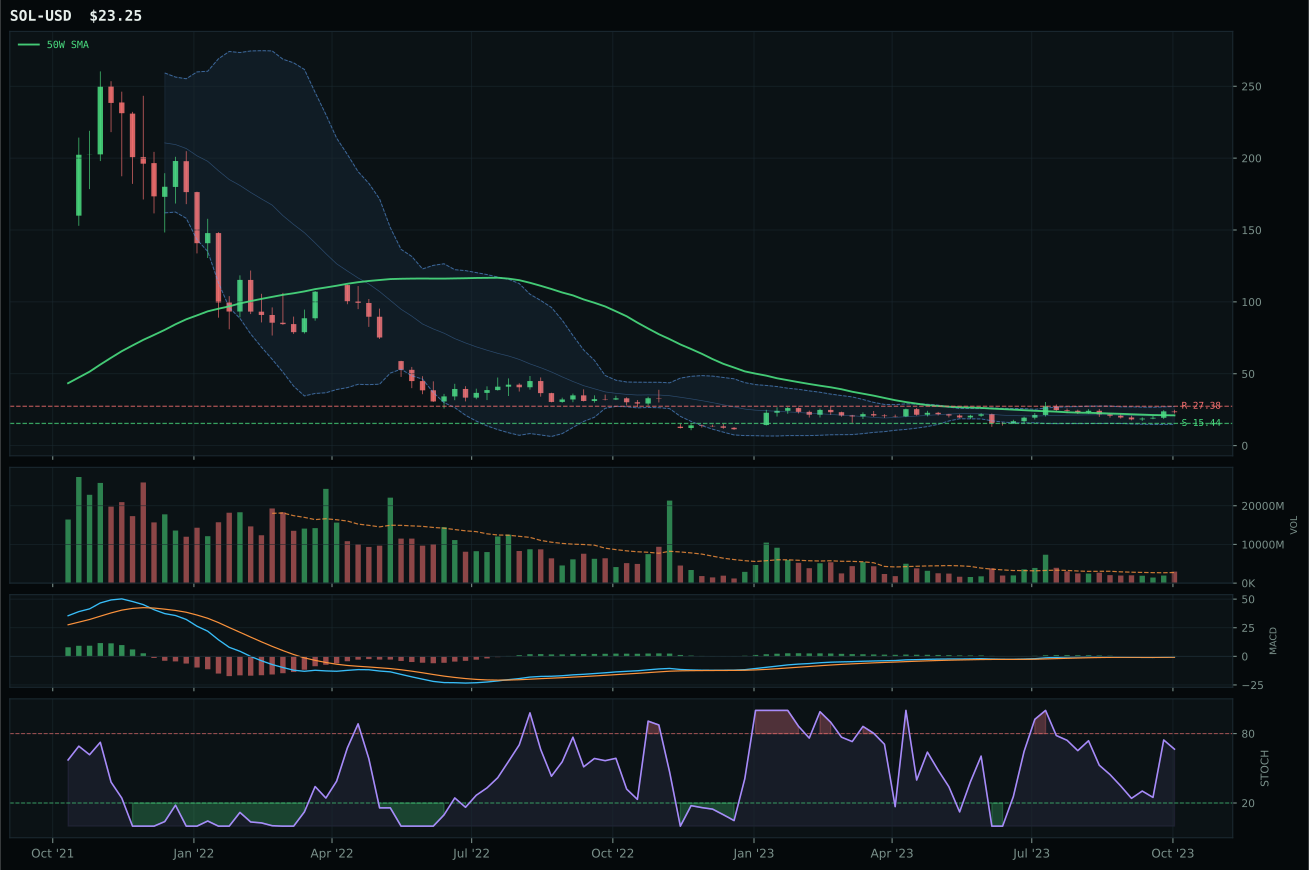
post-touch structure is too wide to count as a range; max/min close ratio is 1.88
TrendBTC confirmed: 2 consecutive closes above rising/flat 50W SMA
one or more available conditions failed
Category Rankings
| Rank | Category | Winner | Score | Alloc | 4W Ret | Peers (4W) |
|---|---|---|---|---|---|---|
| 1 | Traditional Energy | FCG | 64.0 | 20% | +4.34% | XLE -0.7% · XOP +3.3% |
| 2 | Nuclear Energy | URNM | 52.3 | 20% | +2.10% | URA +4.3% · NLR +3.5% |
| 3 | Technology | CIBR | 30.9 | 10% | +0.09% | XLK +2.9% · IGV +0.9% |
| 4 | Defense & Aerospace | XAR | 29.1 | 10% | +7.22% | ITA +6.4% · ROKT +0.7% |
| 5 | Utilities & Infrastructure | PAVE | 28.9 | 10% | +0.20% | IGF +6.7% · XLU +8.4% |
| 6 | Industrial Metals | PICK | 28.7 | 10% | +2.08% | COPX -2.5% · REMX -3.9% |
| 7 | AI | SMH | 24.3 | 10% | +2.02% | AIQ +2.5% · BOTZ +1.3% |
| 8 | Agriculture & Livestock | MOO | 22.9 | 10% | -1.16% | VEGI -0.4% · WEAT -0.2% |
| 9 | Precious Metals | GLD | 19.2 | 0% | +7.57% | GDX +7.3% · SLV +7.0% |
| 10 | Emerging Markets | INDA | — | 0% | +0.50% | IEMG +4.2% · ILF +9.7% |
Traditional Energy — FCG
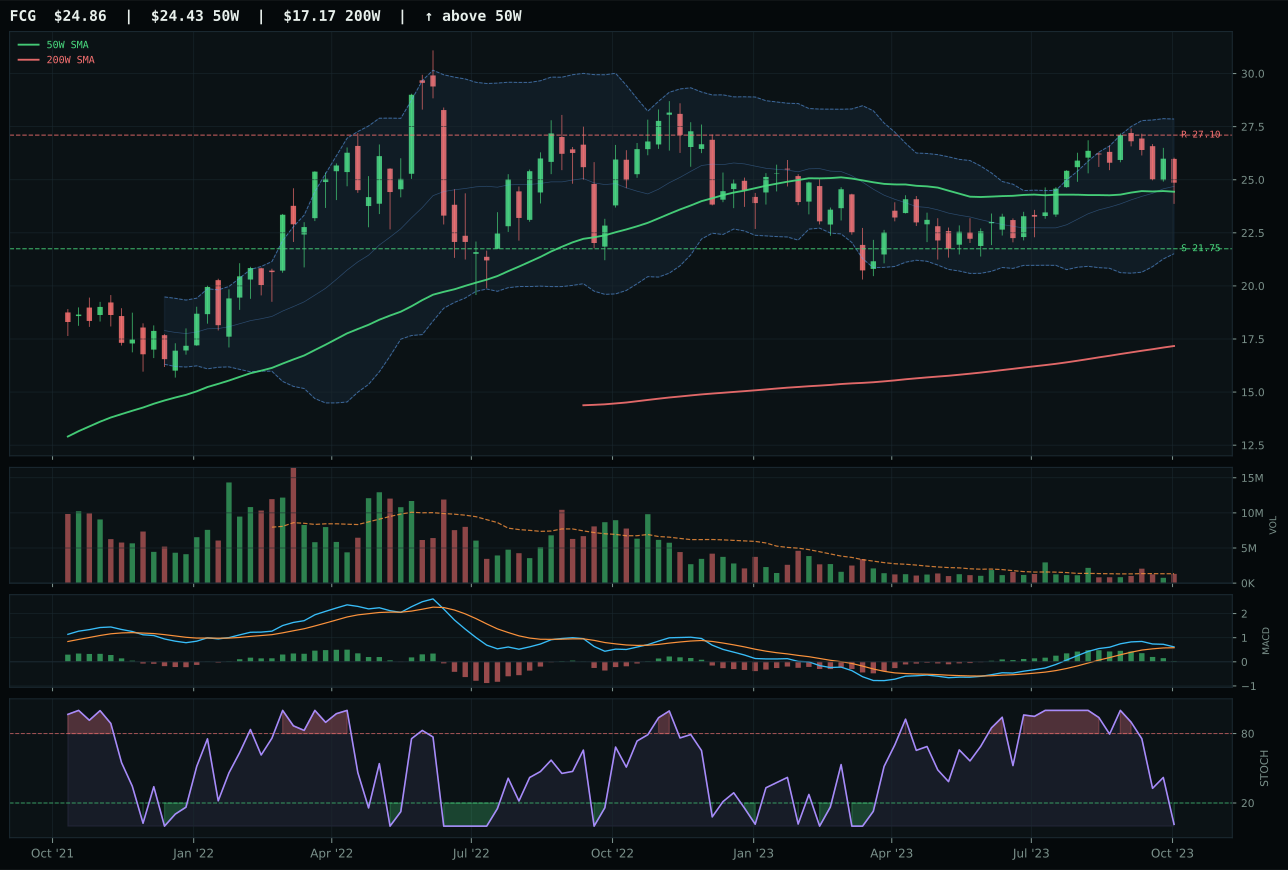
FCG has a compression near 50W profile with 8.9% 13-week relative strength versus SPY.
A failed hold above support would weaken the setup.
Actionable but governed by invalidation levels.
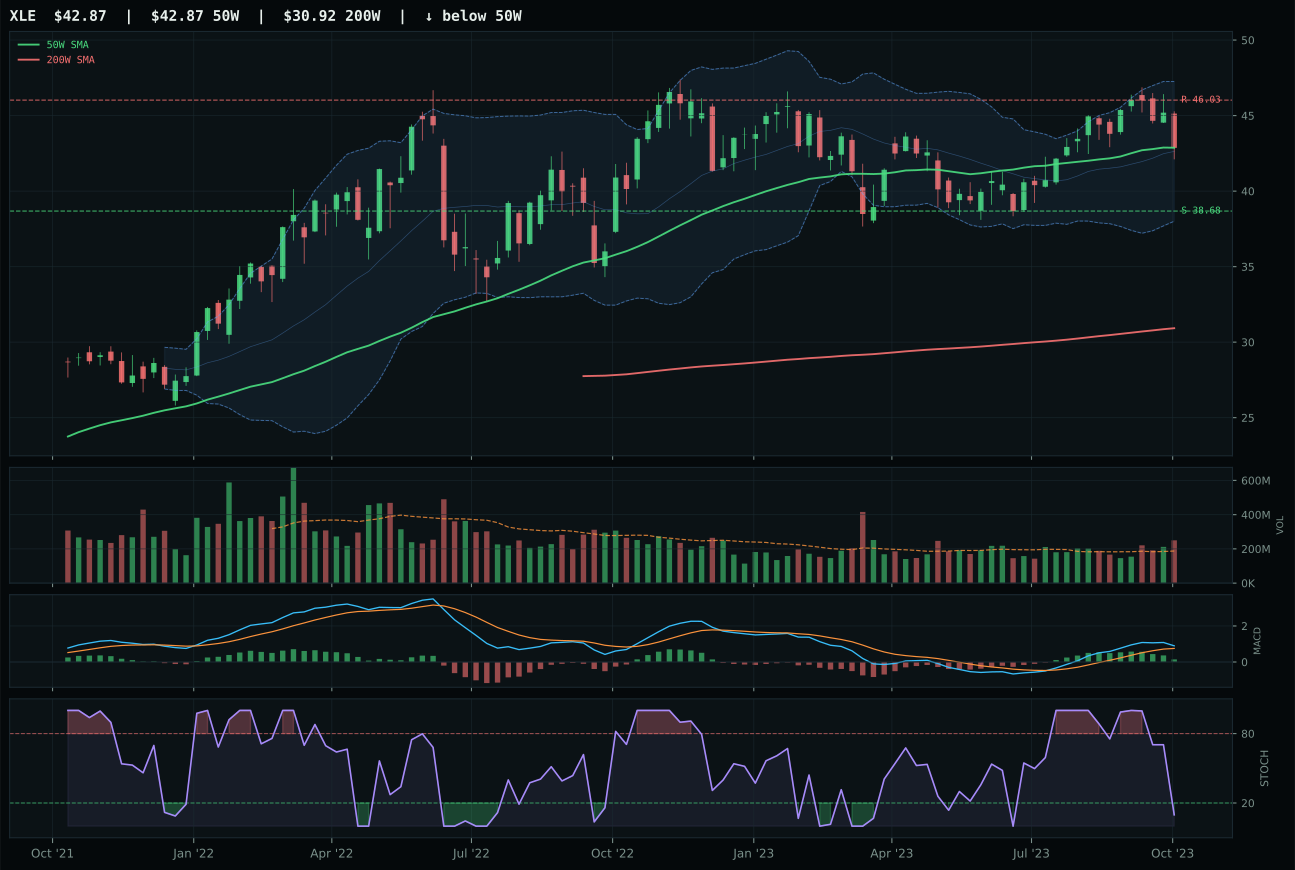
XLE has a compression near 50W profile with 8.2% 13-week relative strength versus SPY.
A failed hold above support would weaken the setup.
Actionable but governed by invalidation levels.
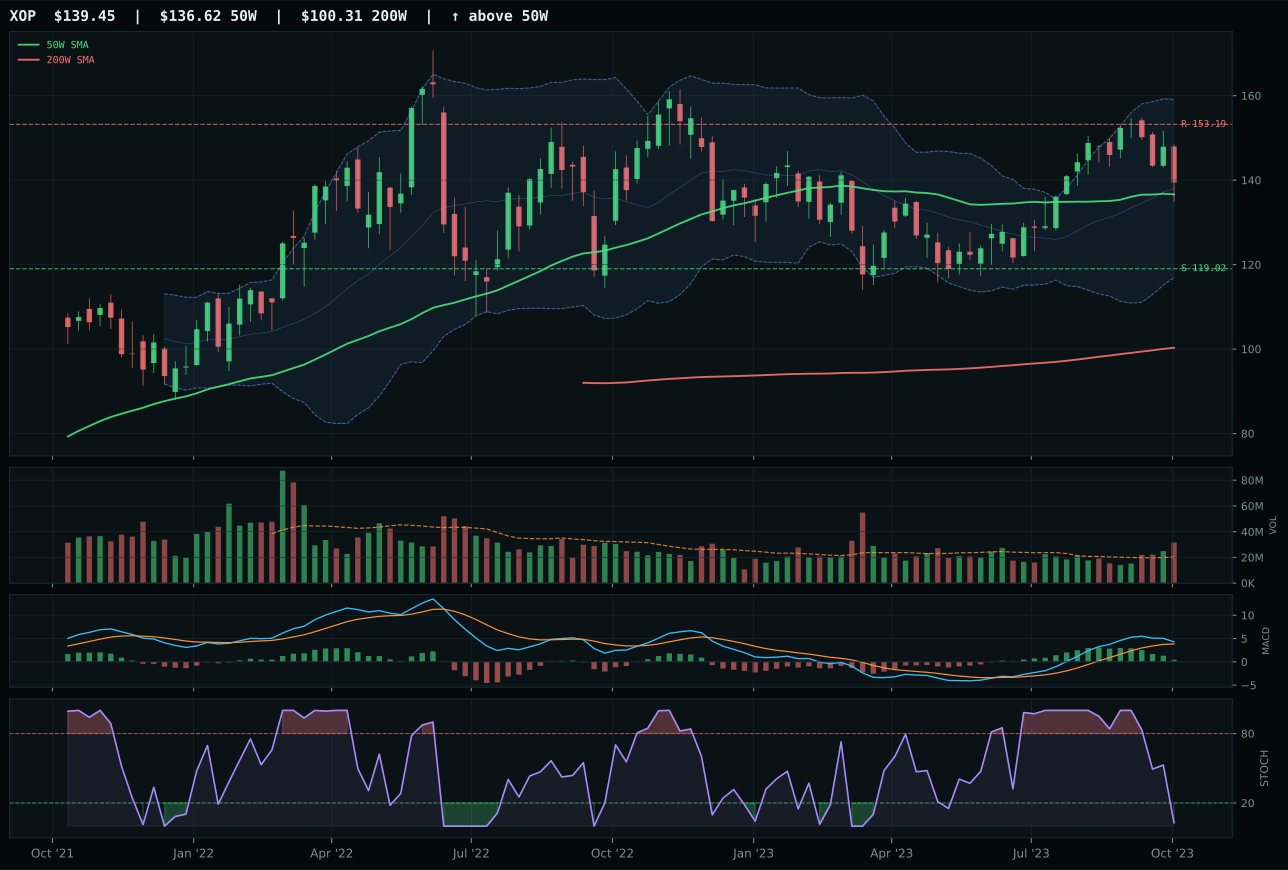
XOP has a compression near 50W profile with 10.4% 13-week relative strength versus SPY.
A failed hold above support would weaken the setup.
Actionable but governed by invalidation levels.
FCG wins Traditional Energy by a decisive 13.3-point margin over XLE based on superior category-relative strength (0.0% versus –0.8%) and cleaner timing mechanics despite nearly identical trend scores (96 vs 81). Both sit above the 50W and 200W with compression near the 50W, the ideal setup for trend continuation, and both show bullish-but-flattening MACD with oversold stochastic—the classic coil before expansion. FCG's 6.9% 13-week return and 8.9% RS versus SPY match XLE's 6.1% and 8.2% closely, but FCG shows 1.7% distance to the 50W while XLE sits slightly farther at higher cost-base. Volume is neutral at 0.98x for FCG versus above-average for XLE, meaning FCG's setup is fresher and less picked-over by momentum traders. The 100.0 timing score reflects that the compression zone is tightest for FCG; it is the purest way to play energy scarcity without overlaying integrated balance-sheet risk.
Traditional Energy is selected for top-2 overweight at 10% allocation with a category score of 64.0, the second-highest of all 10 categories. The macro narrative is overwhelming: Late-Cycle Reflation (+12), energy scarcity (+16), and inflation pressure (+10) all push hard in favor; only credit stress (–7) applies meaningful restraint. The category-level macro fit of 81.0 is the highest outside cryptocurrency, confirming that this is the regime's top beneficiary. FCG's technical evidence of 71.9 is robust—trend 96, timing 100, momentum confirmation 65—reflecting a clean chart with defined entry and explosive upside potential if the compression breaks. Risk-reward of 63.4 acknowledges limited upside to resistance at 27.10 (–8.3%) against 14.3% downside; this is not a moonshot but a reliable short-to-intermediate rotation bet. Energy's 10% weighting is justified by simultaneous technical confirmation and macro tailwinds that are rare in late-cycle regimes.
Nuclear Energy — URNM
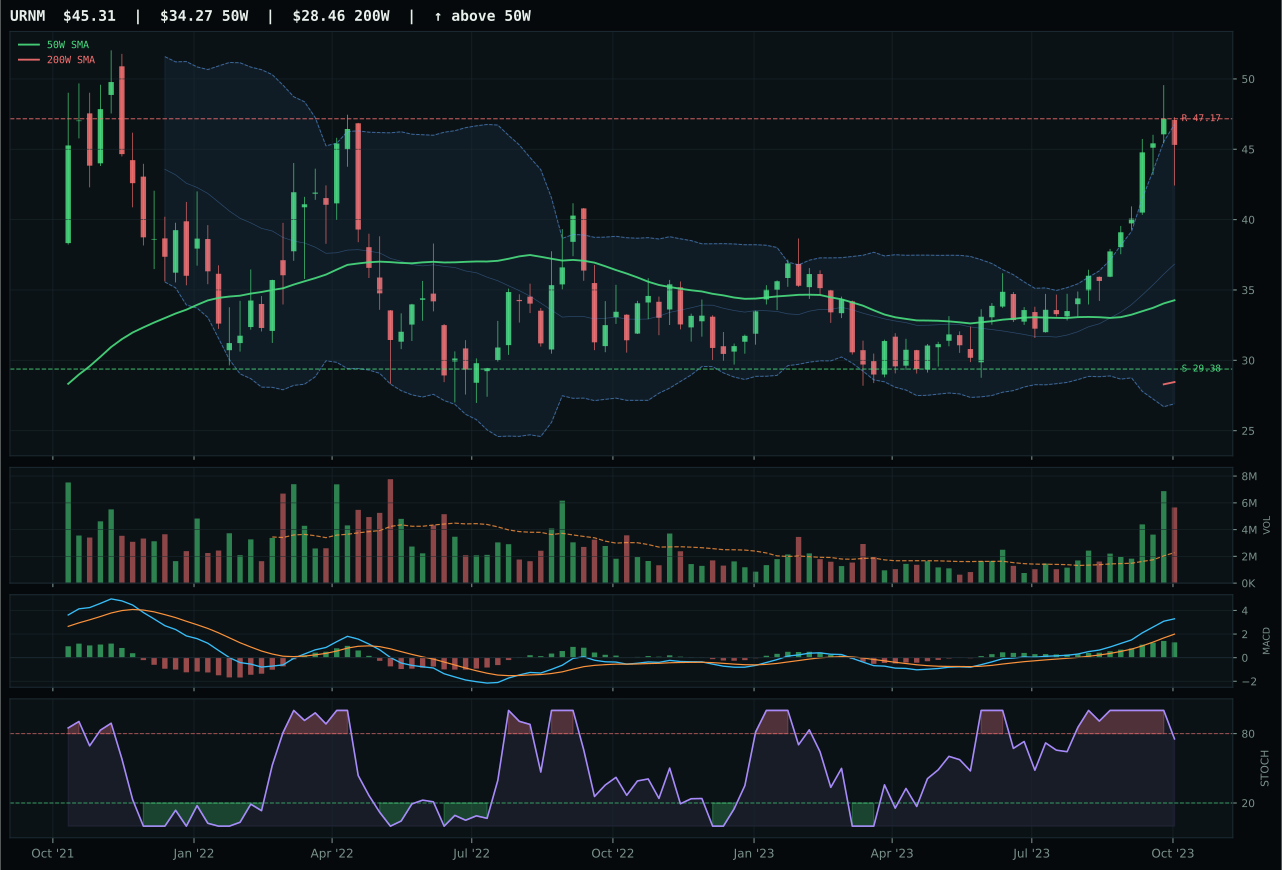
URNM has a vertical extension profile with 42.6% 13-week relative strength versus SPY.
A failed hold above support would weaken the setup.
Actionable but governed by invalidation levels.
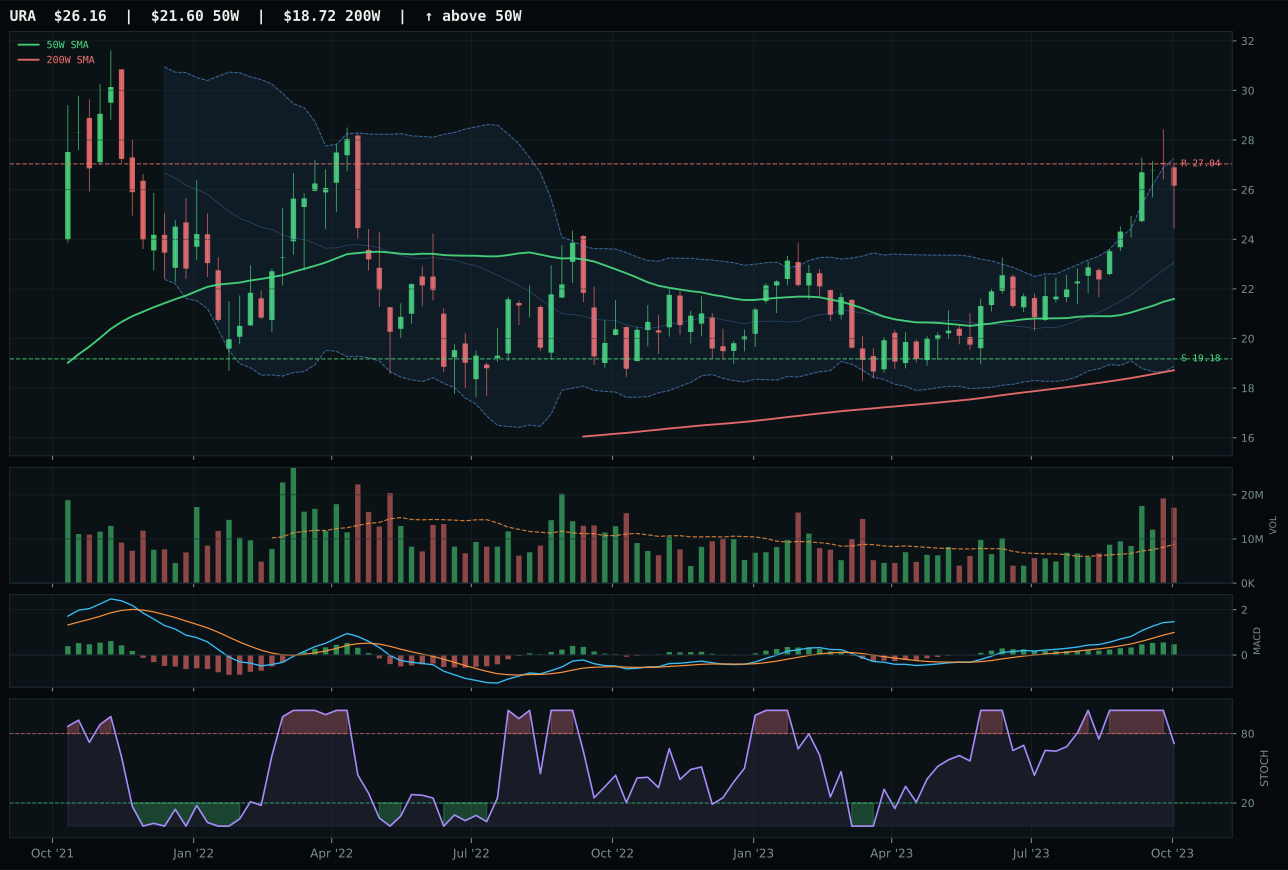
URA has a vertical extension profile with 27.5% 13-week relative strength versus SPY.
A failed hold above support would weaken the setup.
Actionable but governed by invalidation levels.
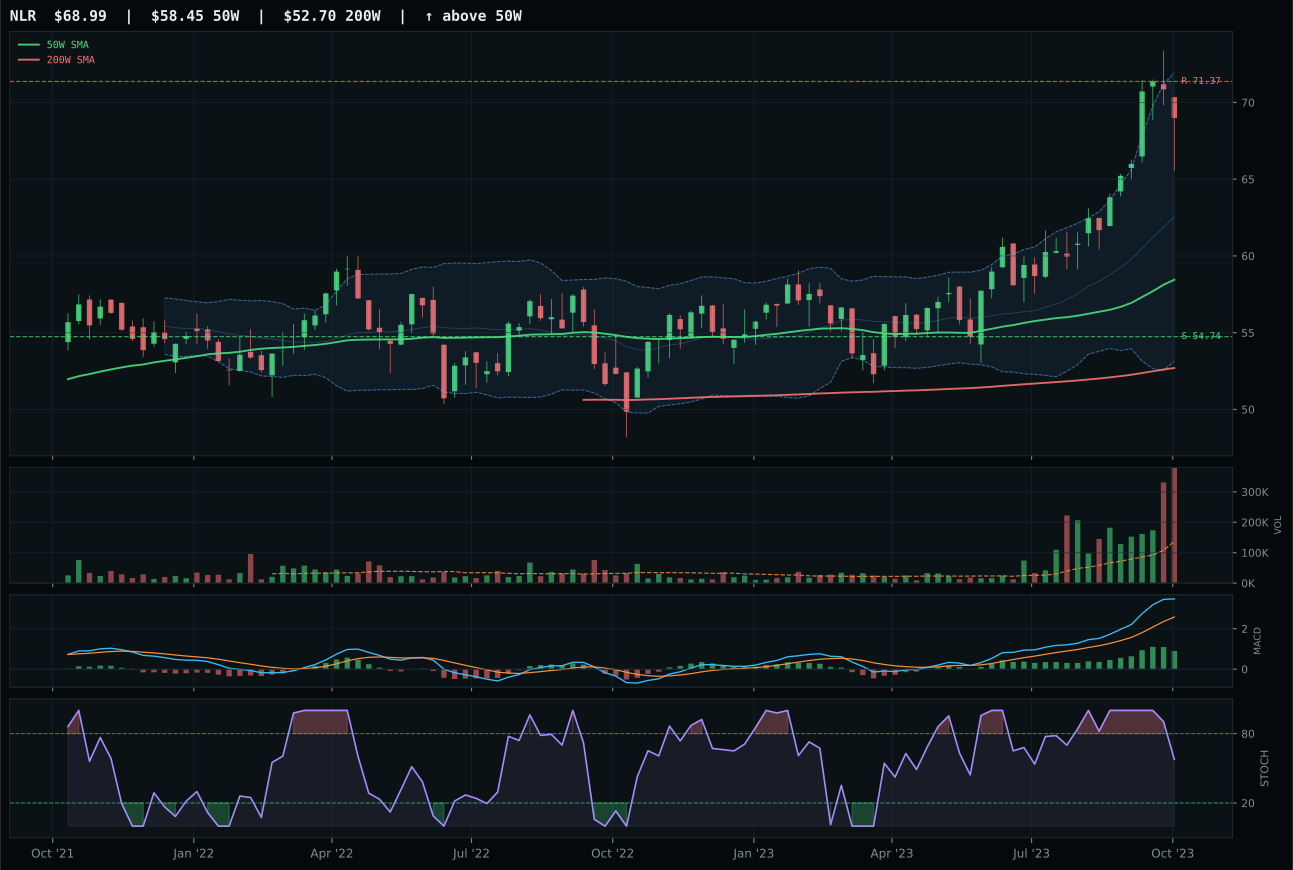
NLR has a vertical extension profile with 19.6% 13-week relative strength versus SPY.
A failed hold above support would weaken the setup.
Tracked, but not top-2 eligible because: .
URNM wins Nuclear Energy despite URA's superior 73 composite score because category-relative strength of 15.1% towers over URA's flat 0.0%, revealing that uranium-miner volatility is the preferred vehicle inside the thesis. Both trade vertically extended above the 50W (URNM 32.2%, URA lower but still parabolic), both show bullish-and-improving MACD with falling stochastic, and both post extraordinary momentum—URNM 100/100, URA 100/100. The critical difference is internal leadership: URNM's 13-week 40.5% and 42.6% SPY RS versus URA's 25.4% and 27.5% prove that tactical buyers are rotating toward the higher-volatility expression. Timing for both scores 53.0, a warning that extension risk is real (32.2% above the 50W for URNM is dangerous territory), but persistence of 88.8 for URNM versus missing data for URA suggests trend continuation from accumulated shorts covering into the vertical move. Risk-reward is inverted (38.3 for both)—upside to resistance is nearly exhausted while downside to support is 54.2%—a profile that screams extension, yet momentum confirmation of 100 overrides caution.
Nuclear Energy is selected for top-2 overweight at 10% allocation with a 52.2 category score. This category benefits from the same Late-Cycle Reflation and energy scarcity tailwinds as traditional energy, plus real asset sponsorship (+7) and inflation pressure (+4); macro fit is 64.0, well above neutral. URNM's technical evidence of 56.4 reflects the paradox: trend 100 and momentum 100 are offset by timing 53 and risk-reward 38.3, a setup that is explosive but overextended. The case for top-2 weighting is not that this is a safe setup—it is not—but that energy scarcity is acute enough to push even parabolic uranium miners into portfolio; the 40.5% 13-week return and 15.1% category-relative strength demand attention. The 50% crypto allocation overlay halves this to 5% real capital, creating asymmetric upside capture with controlled downside if extension breaks. URNM earns its slot because scarcity-driven real assets are the regime's primary alpha driver, and uranium is scarce enough to justify accepting extended technicals.
Technology — CIBR
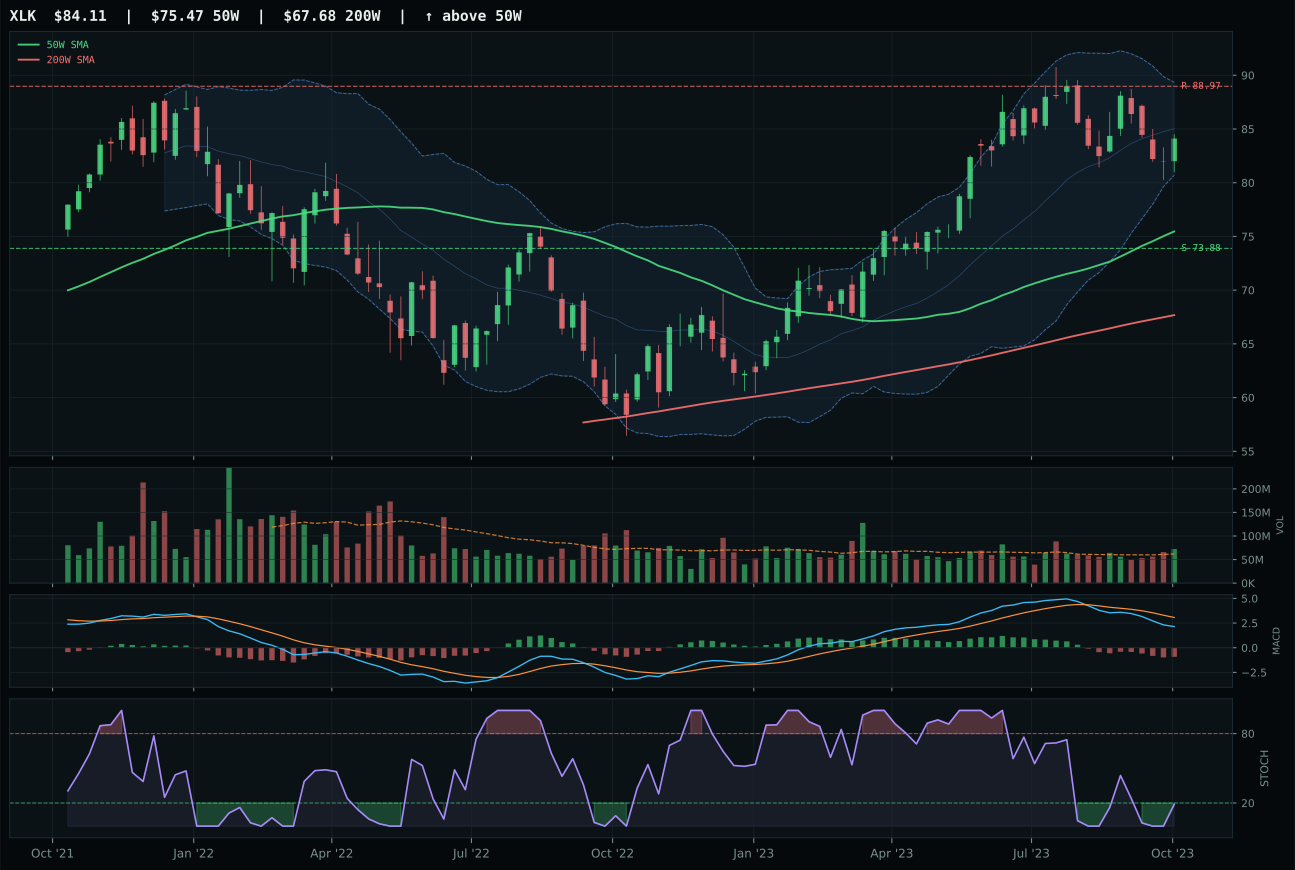
XLK has a neutral structure profile with 0.3% 13-week relative strength versus SPY.
A failed hold above support would weaken the setup.
Actionable but governed by invalidation levels.
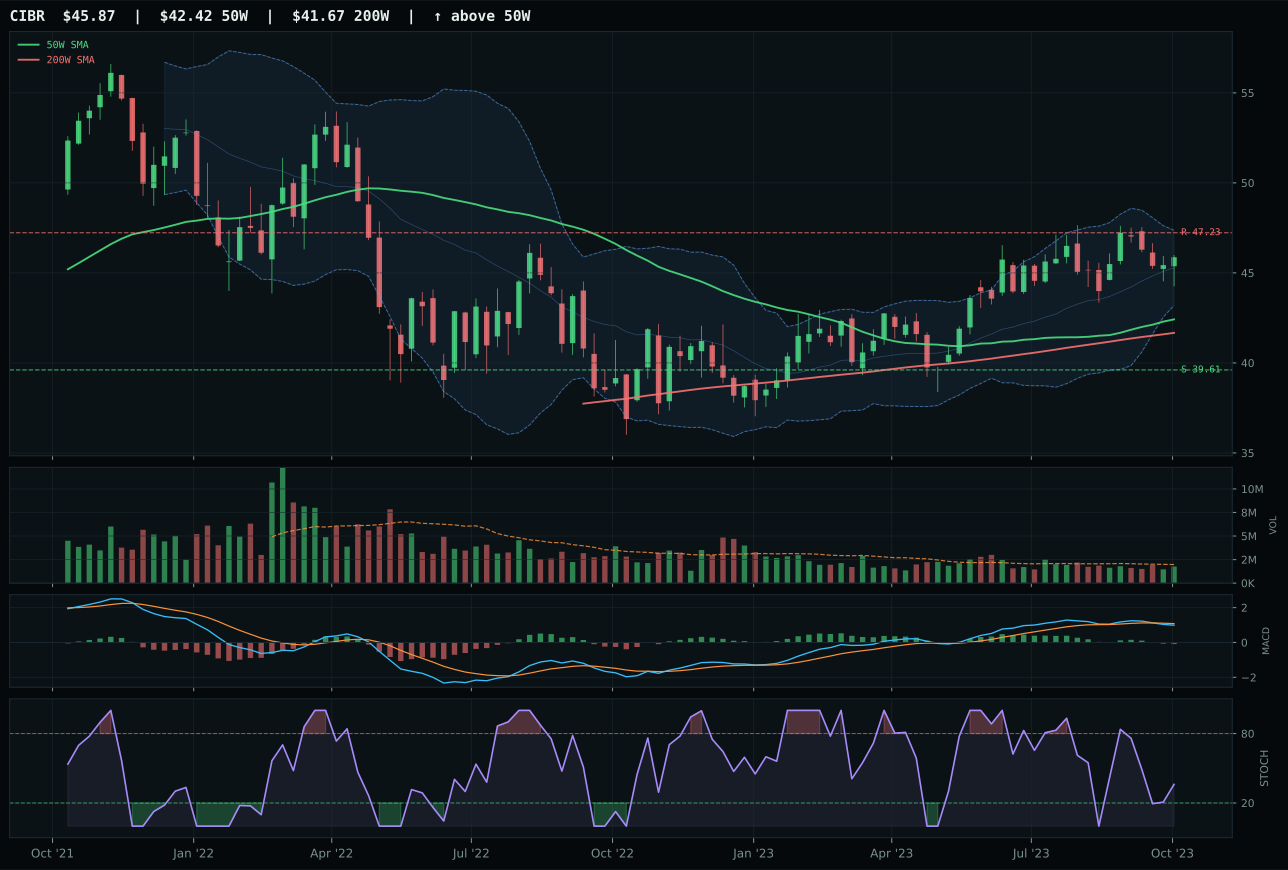
CIBR has a neutral structure profile with 5.0% 13-week relative strength versus SPY.
A failed hold above support would weaken the setup.
Actionable but governed by invalidation levels.
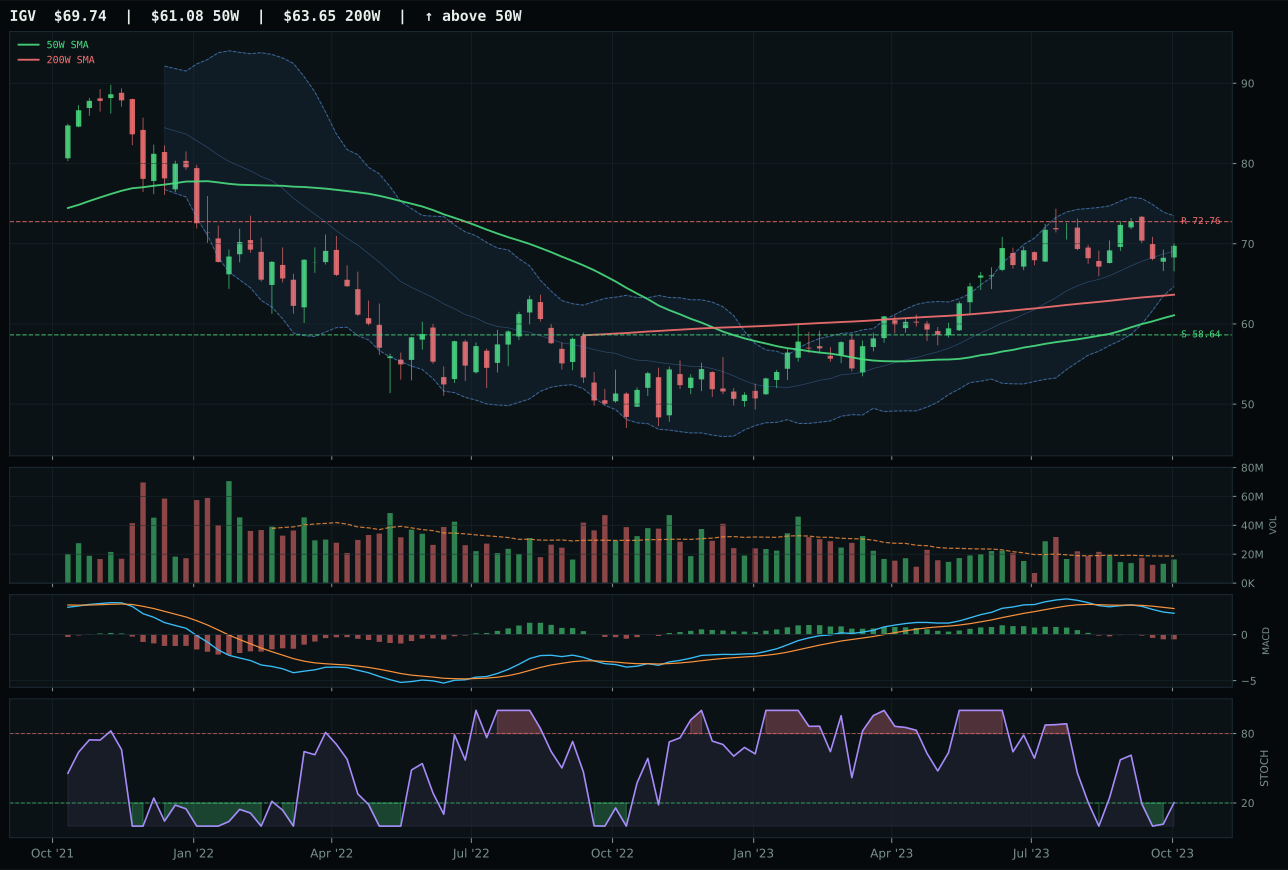
IGV has a neutral structure profile with 4.7% 13-week relative strength versus SPY.
A failed hold above support would weaken the setup.
Actionable but governed by invalidation levels.
CIBR wins because cybersecurity's relative strength versus SPY at 5.0% outpaced XLK's flat 0.3%, indicating buyers are actively rotating into this subtheme even as broad tech stalls. The trend score of 89.5 reflects price holding above both the 50W and 200W with a shallow 0.3% slope—not a powerful advance, but stable. XLK lost on cleanliness (72.0 vs 74.6) and internal category relative strength of -4.4%, meaning broad profitable tech is being rejected inside the basket while cybersecurity accumulates. CIBR sits 8.1% above the 50W in a neutral structure with stochastic RSI falling from mid-zone; this is not an extended chase but rather a well-defined setup where the short-term pullback risk is defined at support 39.61 while resistance 47.23 caps near-term upside. Volume neutral at 0.89x average tells us this move is not panic-driven or parabolic, leaving room for institutional participation if buyers choose to defend current levels.
Technology earns 5% allocation as a tier-2 holding, reflecting its rank outside the top-2 overweights. The category score of 30.9 places it behind stronger technical and macro-fit opportunities, and the 33.0 macro fit score reveals why: liquidity stress is currently the dominant headwind (–10), credit stress adds another –7, and dollar pressure contributes –5, all offsetting the positive signal from risk appetite (+9). Late-Cycle Reflation typically supports technology, but only when credit and liquidity conditions stabilize; today those twin stresses are pinning this category to tier-2 regardless of CIBR's local strength. For technology to reclaim a top-2 slot, either liquidity stress must reverse or category momentum confirmation must rise above its current 43.2—today's setup is defensible but not compelling enough to justify overweighting against better-positioned real asset and energy themes.
Defense & Aerospace — XAR
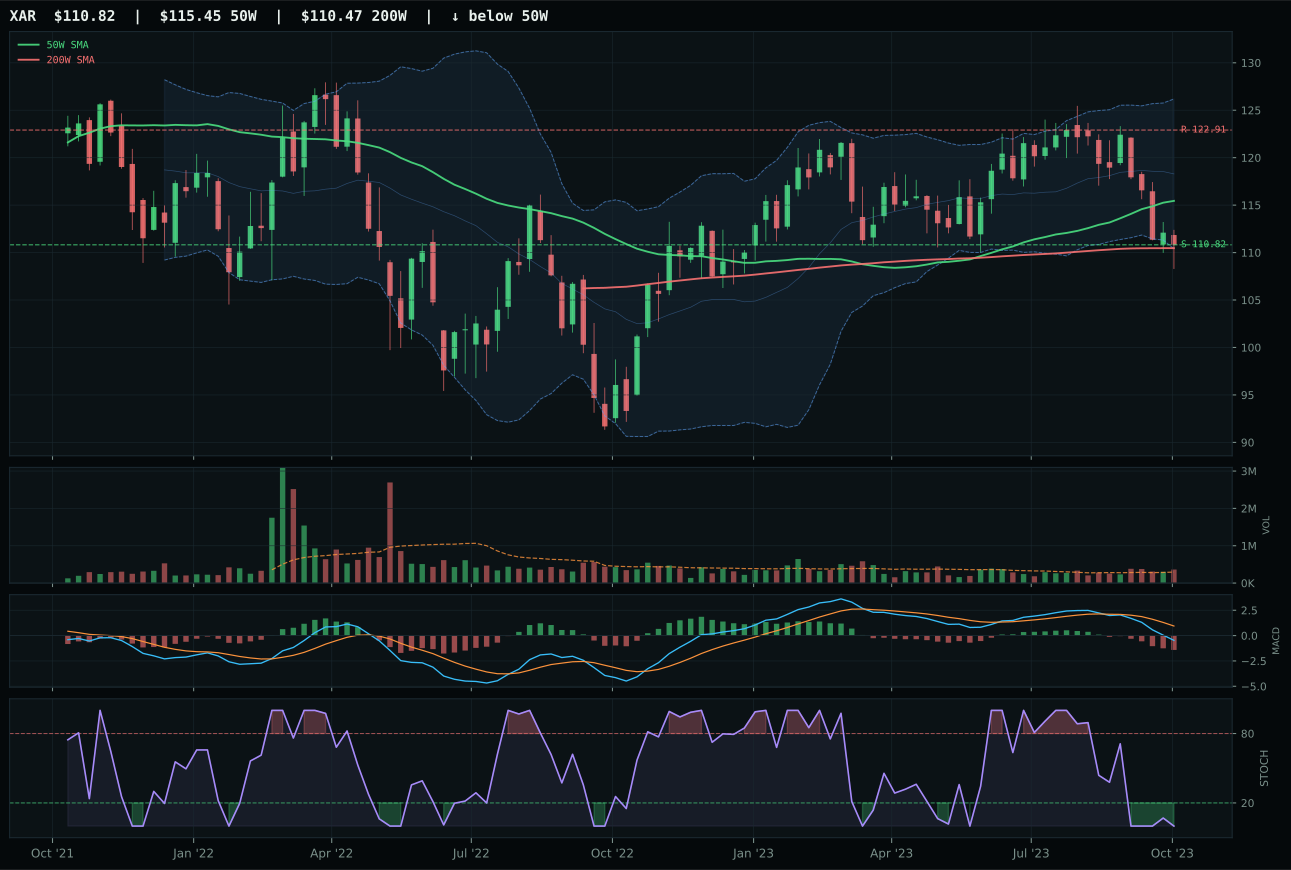
XAR has a pullback into support profile with -5.7% 13-week relative strength versus SPY.
A failed hold above support would weaken the setup.
Actionable but governed by invalidation levels.
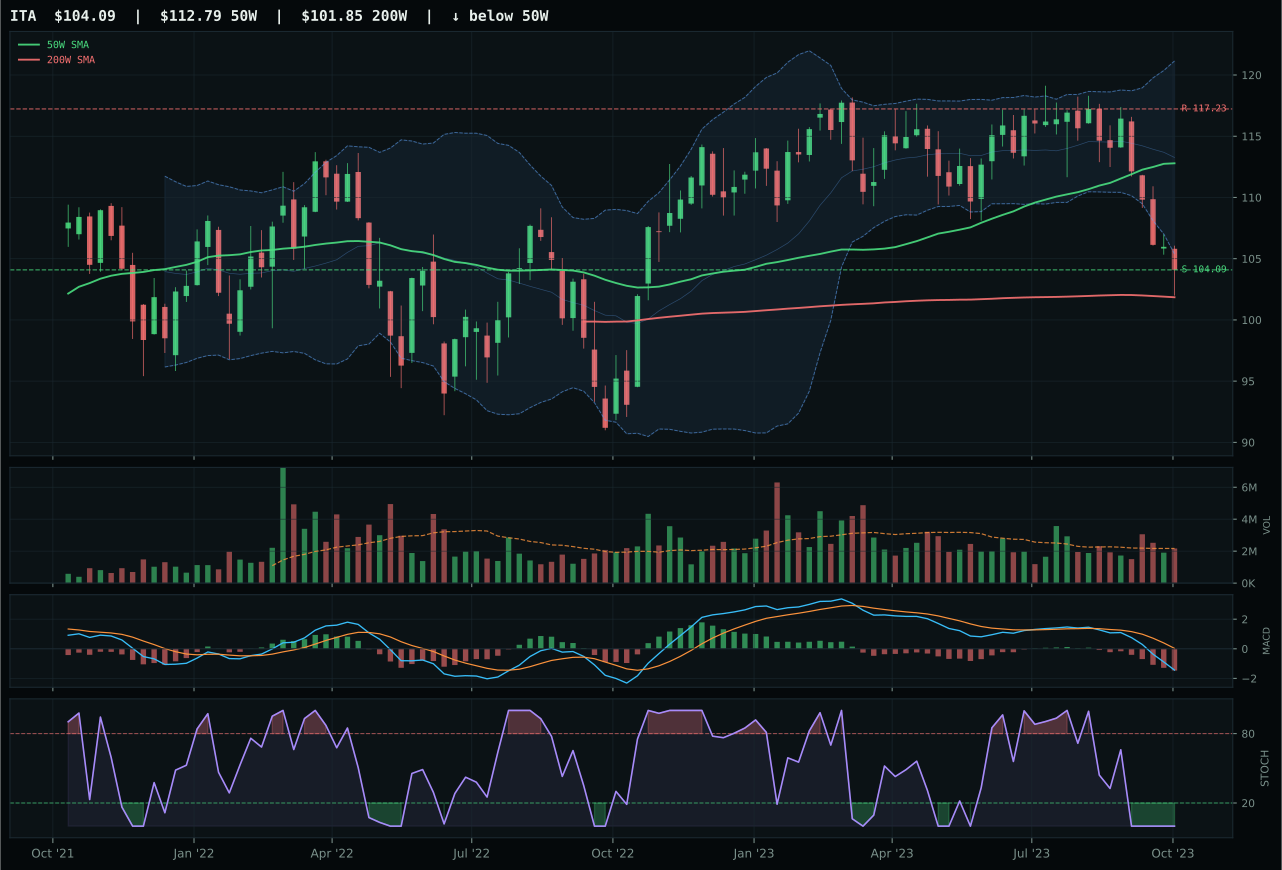
ITA has a pullback into support profile with -8.2% 13-week relative strength versus SPY.
A failed hold above support would weaken the setup.
Actionable but governed by invalidation levels.
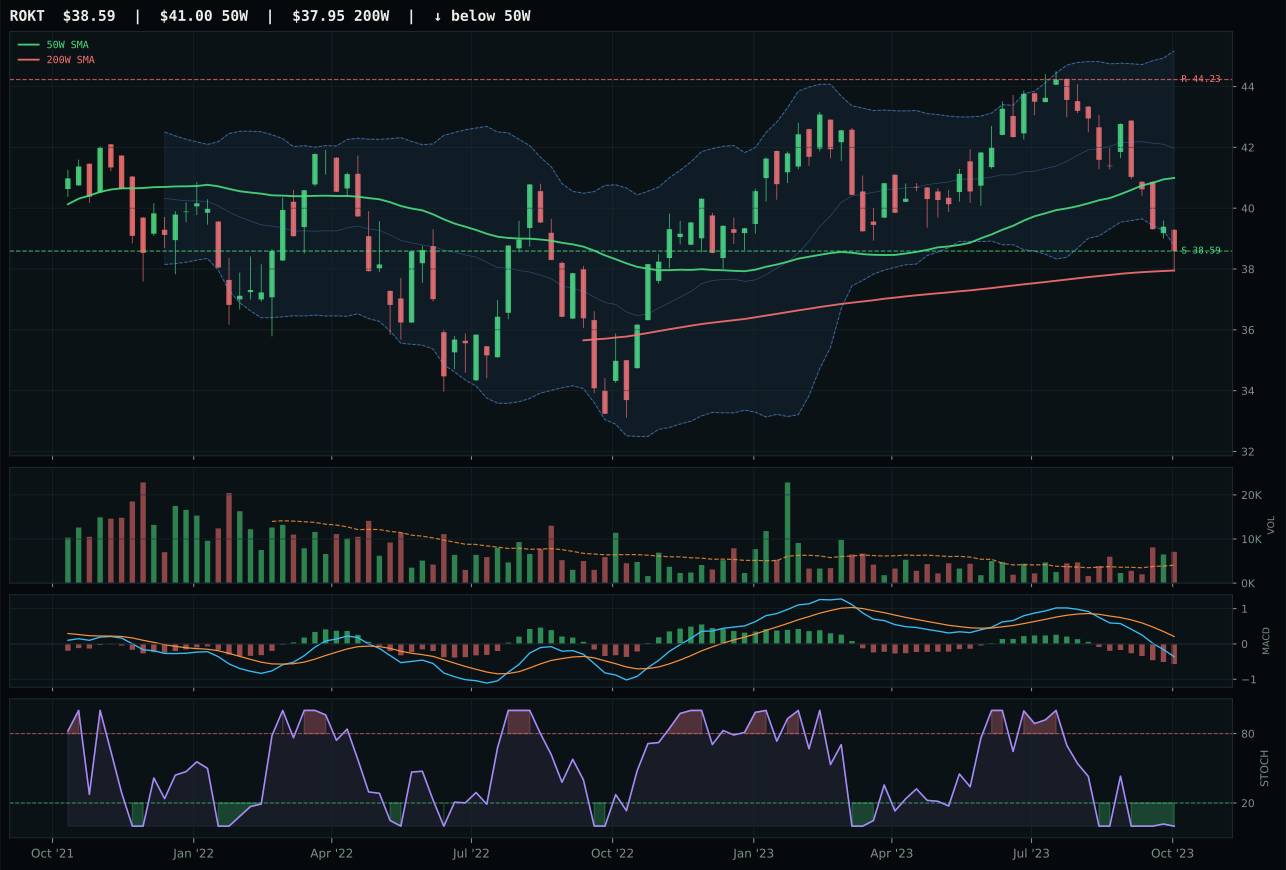
ROKT has a pullback into support profile with -9.2% 13-week relative strength versus SPY.
A failed hold above support would weaken the setup.
Tracked, but not top-2 eligible because: .
XAR wins Defense & Aerospace with a perfect 100.0 timing score that reflects price sitting exactly where the oversold stochastic RSI and bearish MACD meet support 110.82 in the middle Fibonacci retracement zone—the canonical setup for mean-reversion entries. While XLK lagged on structure (67.3 vs 72.3) and showed oversold stochastic without the pullback-to-support context, XAR's –4.0% distance to the 50W combined with above-average volume (1.23x) signals institutional accumulation rather than panic liquidation. The trend score of 48.4 is depressed by price sitting below the 50W and –5.7% relative weakness to SPY, but that weakness is the entire point—defense is being sold into weakness, and XAR's 2.5% category-relative strength over ITA shows discriminate buyers are leaning on the best-valued name. Risk-reward of 75.1 reflects 0% downside to support (already there) against 9.8% upside to resistance; invalidation risk is defined and tight.
Defense & Aerospace earns 5% tier-2 allocation despite a respectable 29.1 category score. The macro narrative actually favors this exposure—Late-Cycle Reflation (+6), broad market bear (+6), and dollar pressure (+3) typically support defensive cyclicals—yet category-level macro fit is 66.0, which is healthy but does not propel it to top-2 status. The 34.2 technical evidence score for XAR reflects the harsh reality that timing is the only component scoring well; trend is only 48.4 and momentum confirmation is just 16.2, meaning the setup is purely reversion-based rather than trend-following. Entry here is conditional on support 110.82 holding; a break below invalidates the thesis entirely. Defense would need either a sharp rally to confirm upside conviction or category momentum to exceed 50/100 to compete with energy and nuclear for top-2 capital.
Utilities & Infrastructure — PAVE
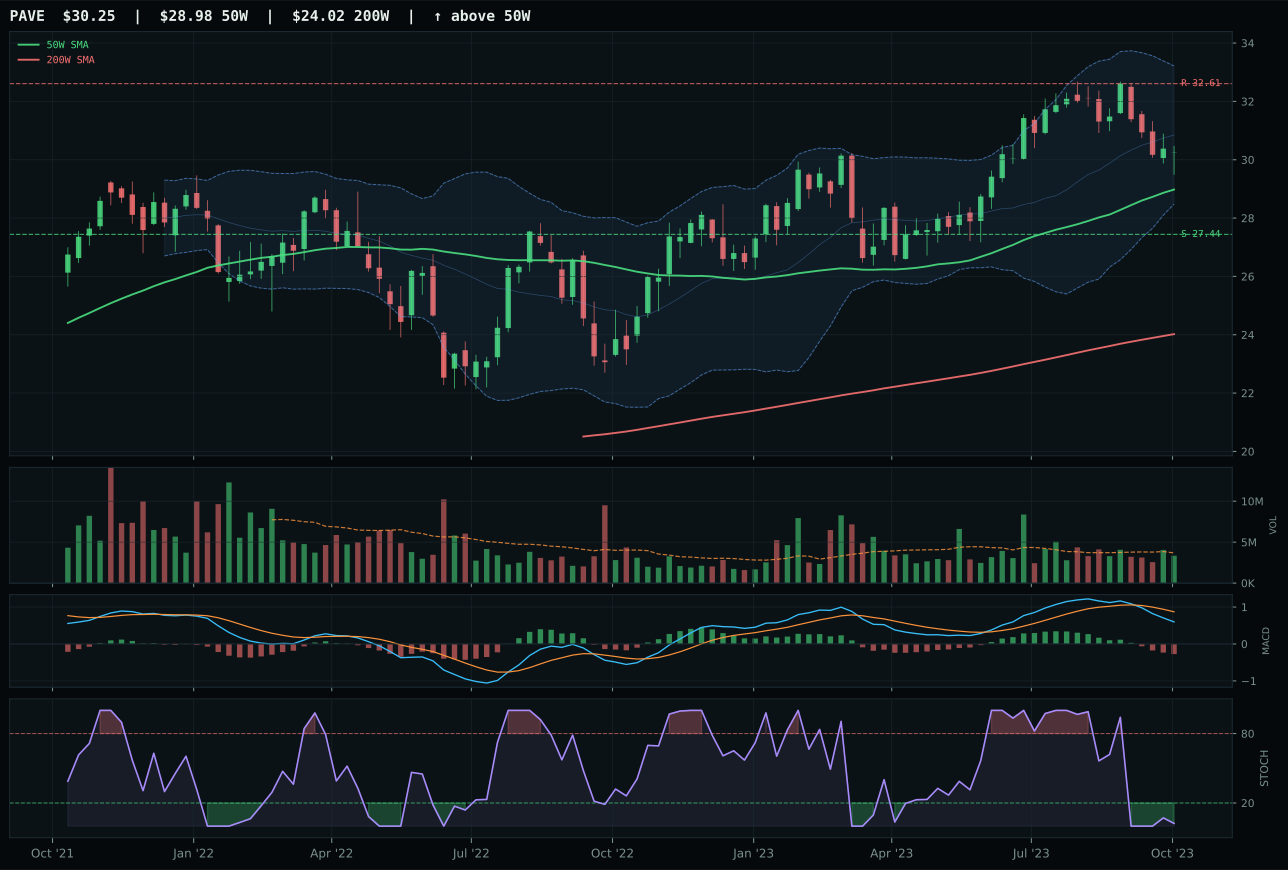
PAVE has a neutral structure profile with -0.1% 13-week relative strength versus SPY.
A failed hold above support would weaken the setup.
Actionable but governed by invalidation levels.
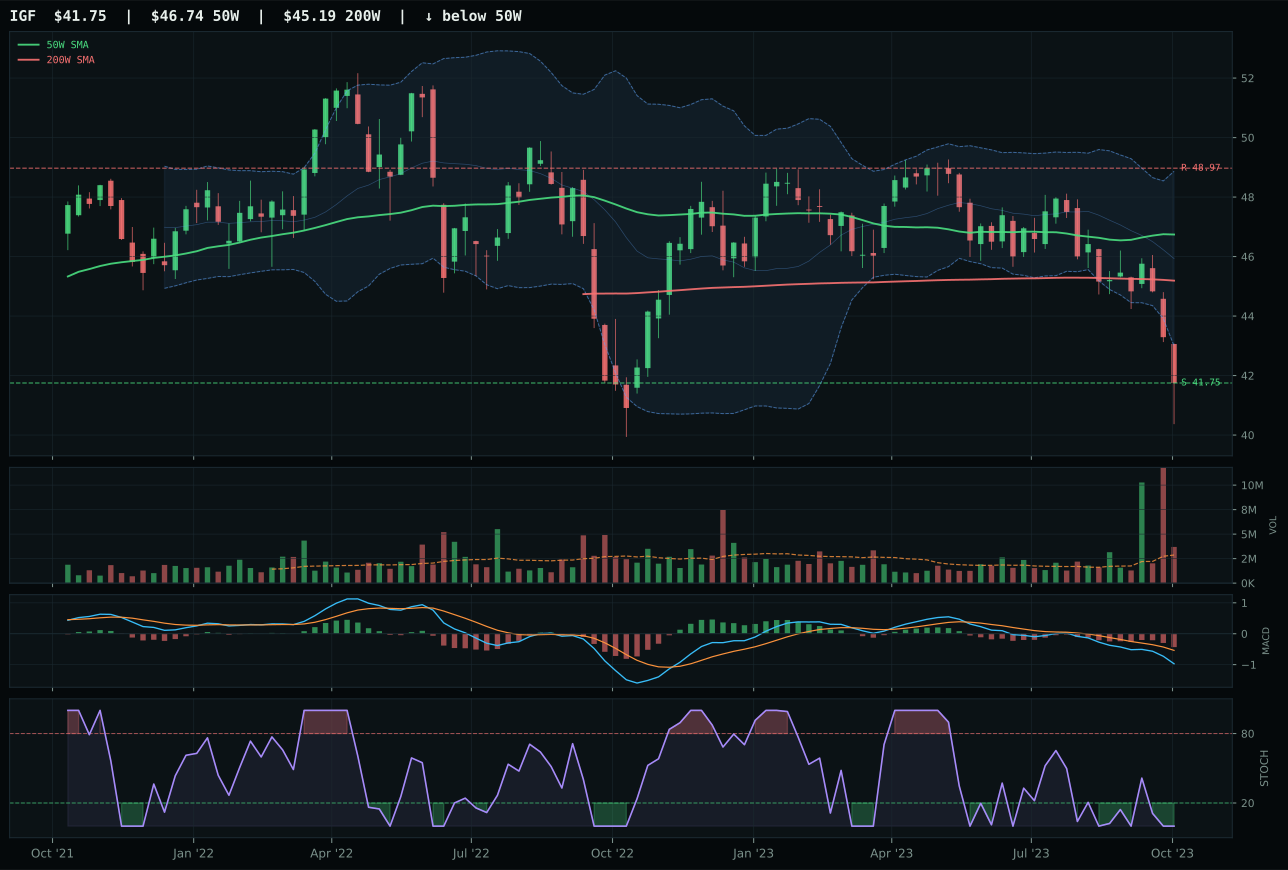
IGF has a pullback into support profile with -8.3% 13-week relative strength versus SPY.
A failed hold above support would weaken the setup.
Actionable but governed by invalidation levels.
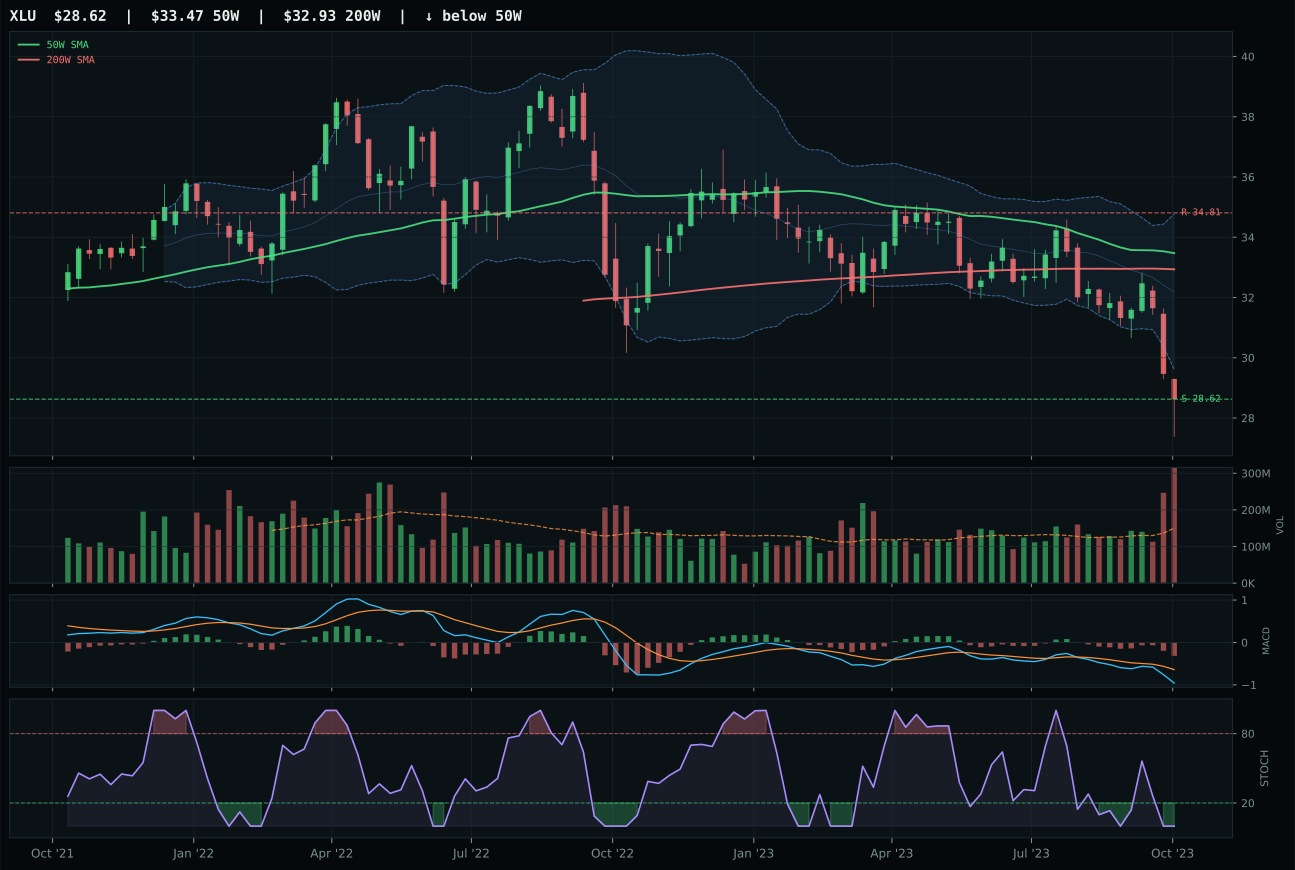
XLU has a pullback into support profile with -10.4% 13-week relative strength versus SPY.
A failed hold above support would weaken the setup.
Actionable but governed by invalidation levels.
PAVE wins Utilities & Infrastructure with a perfect 99.0 timing score that rewards price sitting 4.4% above the 50W near the Fibonacci 0.236 upper-retracement zone with stochastic oversold turn up (0.02)—the exact entry point where momentum is decelerating but directional bias remains up. IGF loses decisively on timing (60.0 vs 99.0) and structure (unspecified details suggest pullback context versus PAVE's neutral setup), revealing IGF is a deeper pullback opportunity (wrong time) versus PAVE's momentum-continuation entry. PAVE's 81.8 trend score reflects price above both the 50W and 200W with 0.4% positive 50W slope; while category-relative strength of 8.2% is strong, SPY relative strength flat at –0.1% shows this is pure category rotation. Volume neutral at 0.91x average means the move is not being pushed by distributors, preserving technical integrity. Momentum confirmation of 44.6 is modest—13-week return just –2.2%—but that flatness is useful: entry is not chasing extended moves.
Utilities & Infrastructure earns 5% tier-2 allocation with a 28.9 category score. The macro context is modestly supportive—Transition/Mixed (+4) and broad market bear (+4) favor defensive positioning—yet inflation pressure (–6) and liquidity stress (–3) constrain. Category-level macro fit is 47.0, neutral. PAVE's technical evidence of 50.4 is respectable but unremarkable; the 99.0 timing score is an outlier that depends entirely on stochastic oversold-turn-up mechanics at the 0.236 Fib level. Once that entry is consumed, the setup loses its alpha unless trend confirmation follows. The 13-week return of –2.2% and –0.1% SPY RS show this is not a leadership play but rather a tactical entry into a sideways asset class. Infrastructure would require either stronger category momentum (currently 44.6) or SPY-relative strength to flip positive to justify top-2 consideration; today it is held as defensive rotation within tier-2 if broader market weakness accelerates.
Industrial Metals — PICK
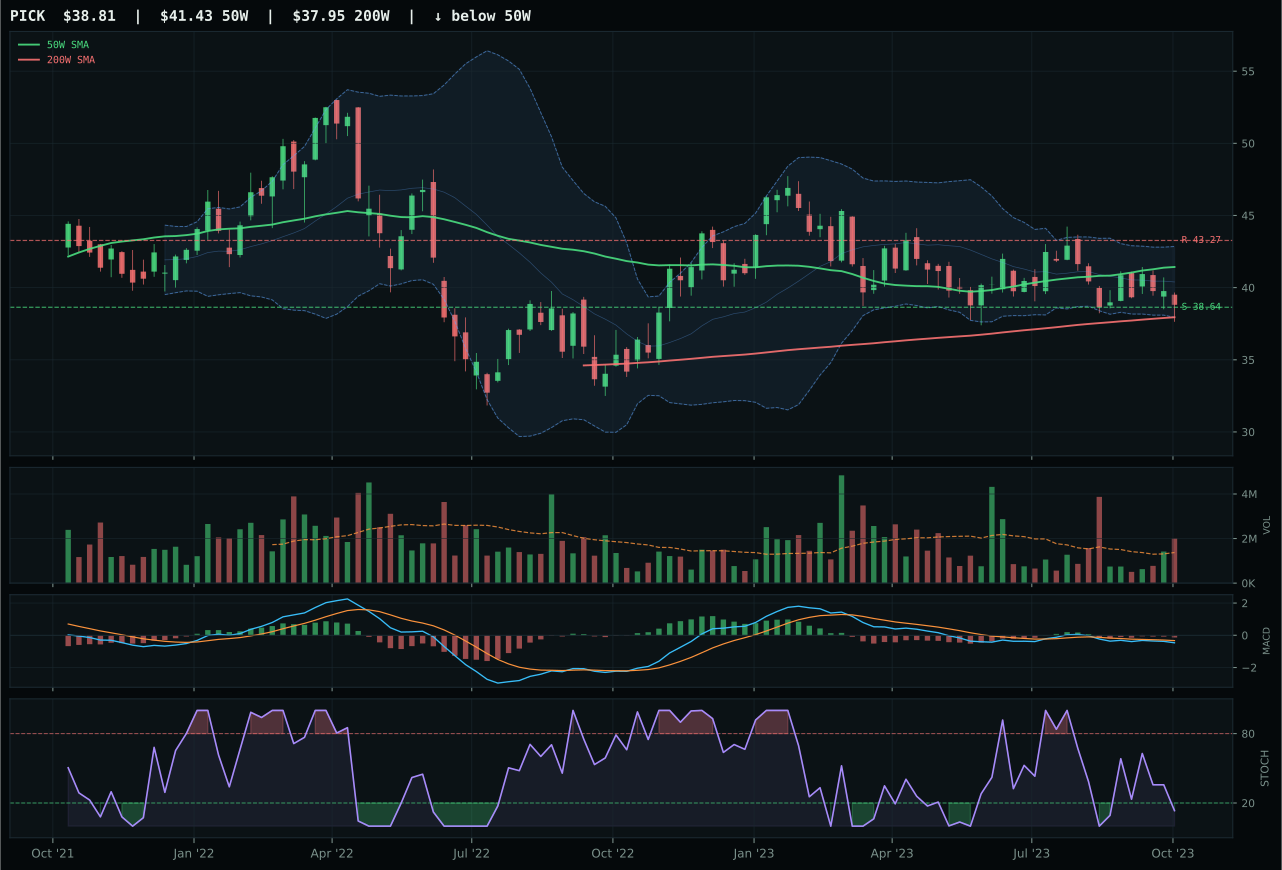
PICK has a pullback into support profile with -1.2% 13-week relative strength versus SPY.
A failed hold above support would weaken the setup.
Actionable but governed by invalidation levels.
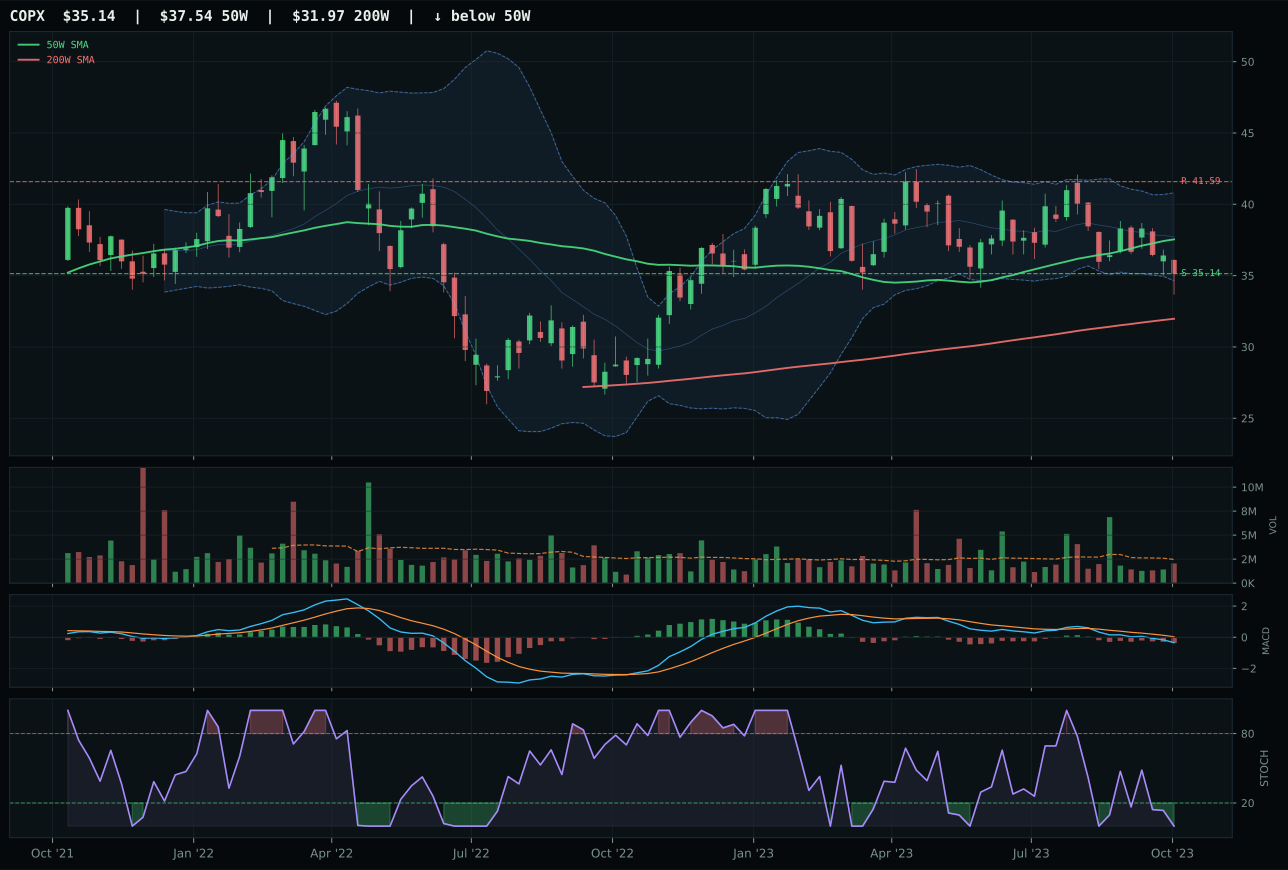
COPX has a pullback into support profile with -3.7% 13-week relative strength versus SPY.
A failed hold above support would weaken the setup.
Actionable but governed by invalidation levels.
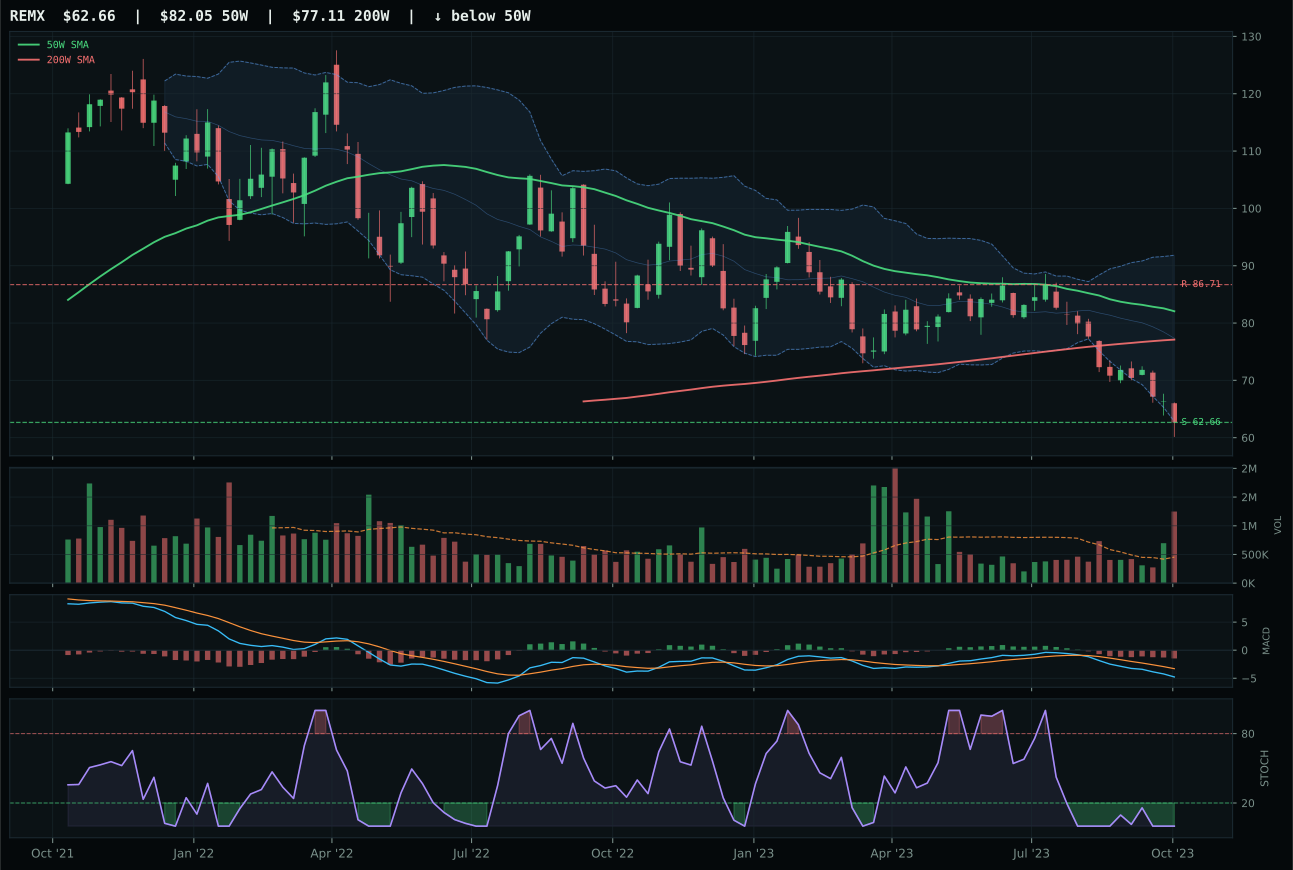
REMX has a pullback into support profile with -23.8% 13-week relative strength versus SPY.
A failed hold above support would weaken the setup.
Actionable but governed by invalidation levels.
PICK wins Industrial Metals decisively with a 77 composite score that reflects a superior risk-reward profile of 98.0—the highest in the category—combined with timing of 92.0 and momentum confirmation of 52.5. The chart is in a deep retracement zone (Fib 0.618 at 39.13) with oversold stochastic at 0.13 and, crucially, MACD bearish but improving, signaling early buyer intention rather than pure liquidation. PICK's –6.3% distance to the 50W with above-average volume (1.46x) and 2.5% category-relative strength show discriminate accumulation into support 38.64. COPX loses on multiple fronts: timing 87.0 versus 92.0, structure (64.0 vs 70.6), risk-reward (87.9 vs 98.0), volume neutral versus above-average, and category-relative strength flat at 0.0%. The MACD picture differs critically—PICK shows early improving action while COPX remains bearish/weakening—a detail that signals where institutional demand is flowing.
Industrial Metals earns 5% tier-2 allocation with a 28.7 category score. The macro setup is compelling: Late-Cycle Reflation supports it (+10), real asset sponsorship is active (+6), and inflation pressure is positive. Yet category-level macro fit is only 44.0 because liquidity stress (–8) and credit stress (–7) are simultaneously active, creating a tug-of-war. PICK's technical evidence of 62.6 is strong—the deep-value Fibonacci setup with improving MACD and tight support structure merit attention—but tier-2 rank reflects the macro conflicts. The risk-reward of 98.0 is genuine: downside to support 38.64 is just 0.4%, making this a defined entry. Industrial metals would require either reversal of liquidity/credit stress or momentum confirmation above 60 to claim a top-2 slot; today's setup is tactically sound but strategically constrained by macro headwinds.
AI — SMH
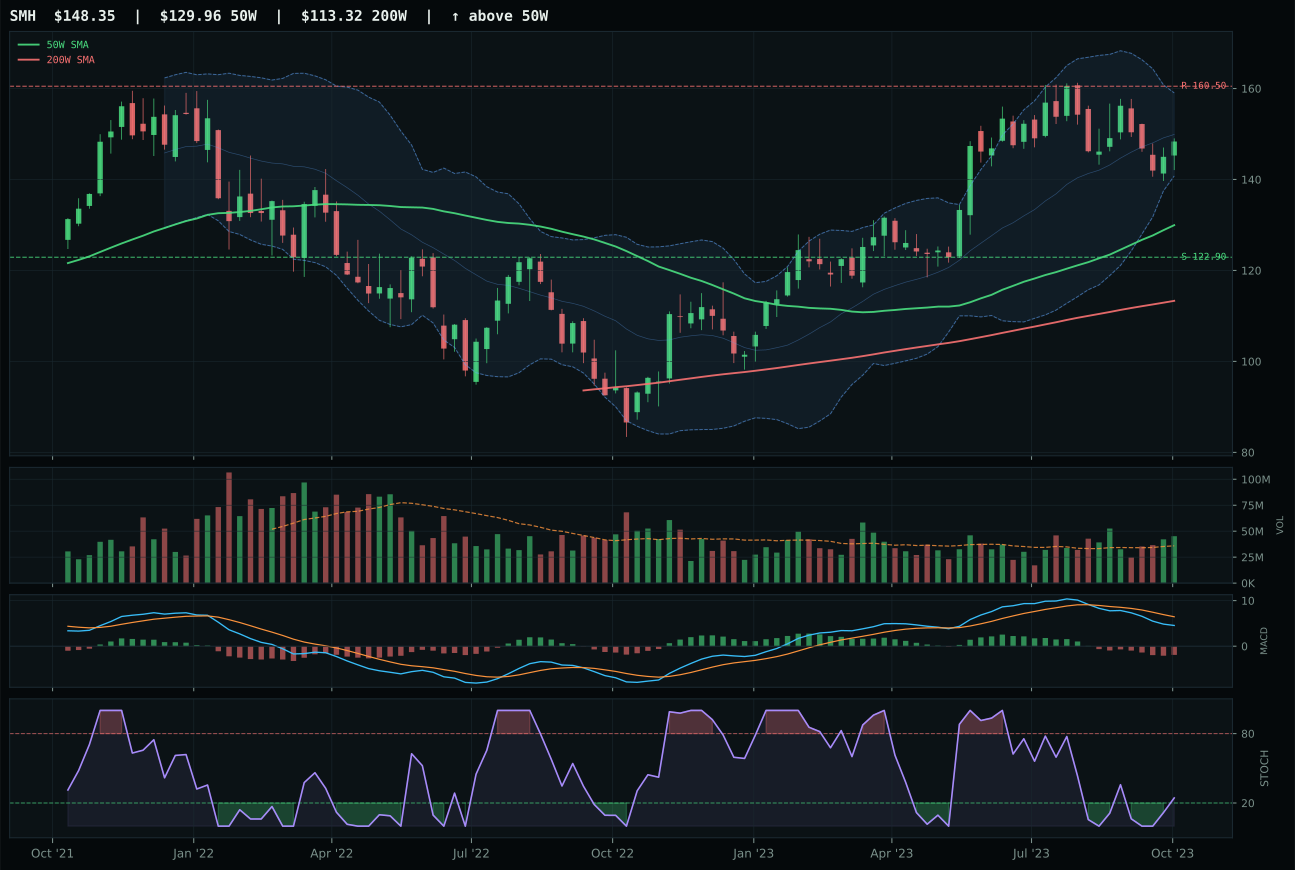
SMH has a neutral structure profile with 1.6% 13-week relative strength versus SPY.
A failed hold above support would weaken the setup.
Actionable but governed by invalidation levels.
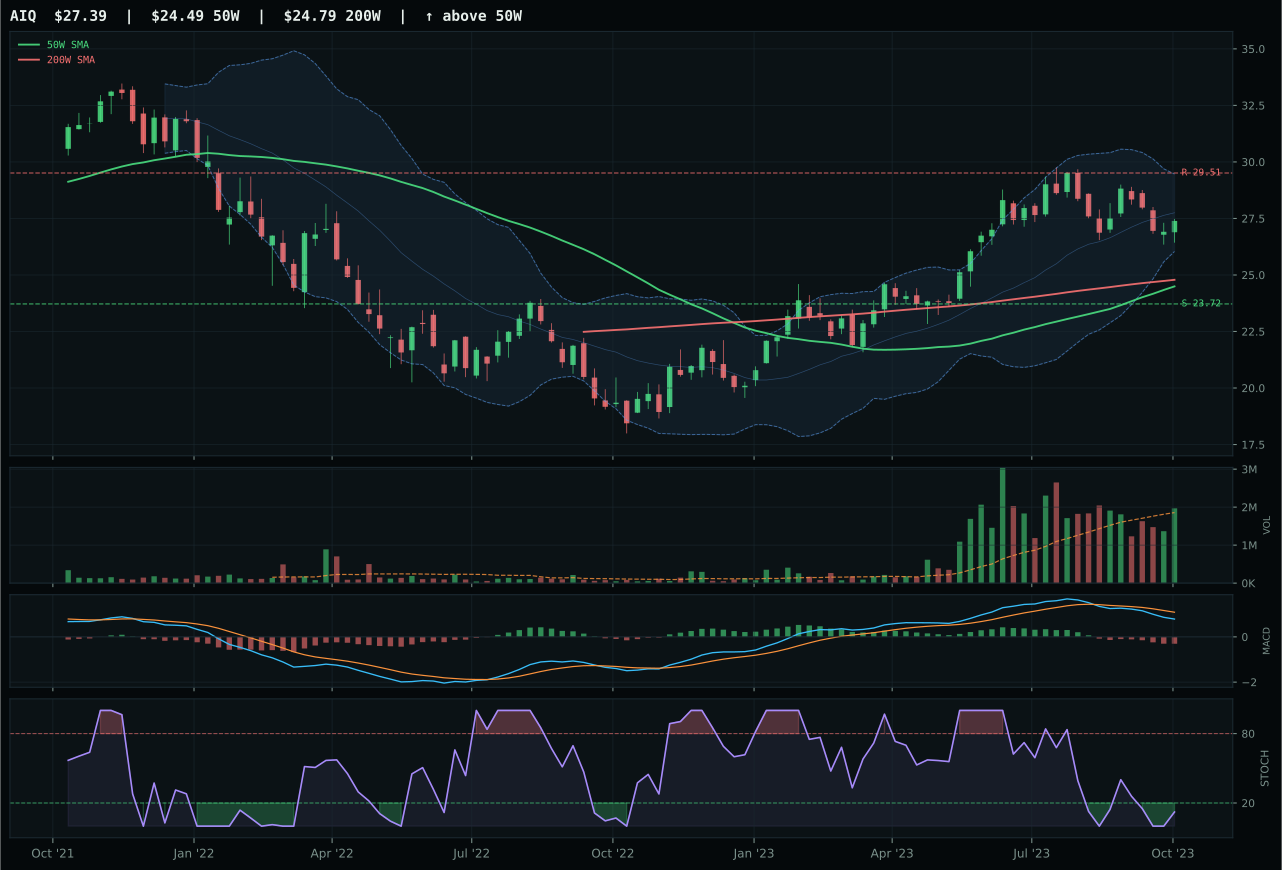
AIQ has a neutral structure profile with 1.1% 13-week relative strength versus SPY.
A failed hold above support would weaken the setup.
Actionable but governed by invalidation levels.
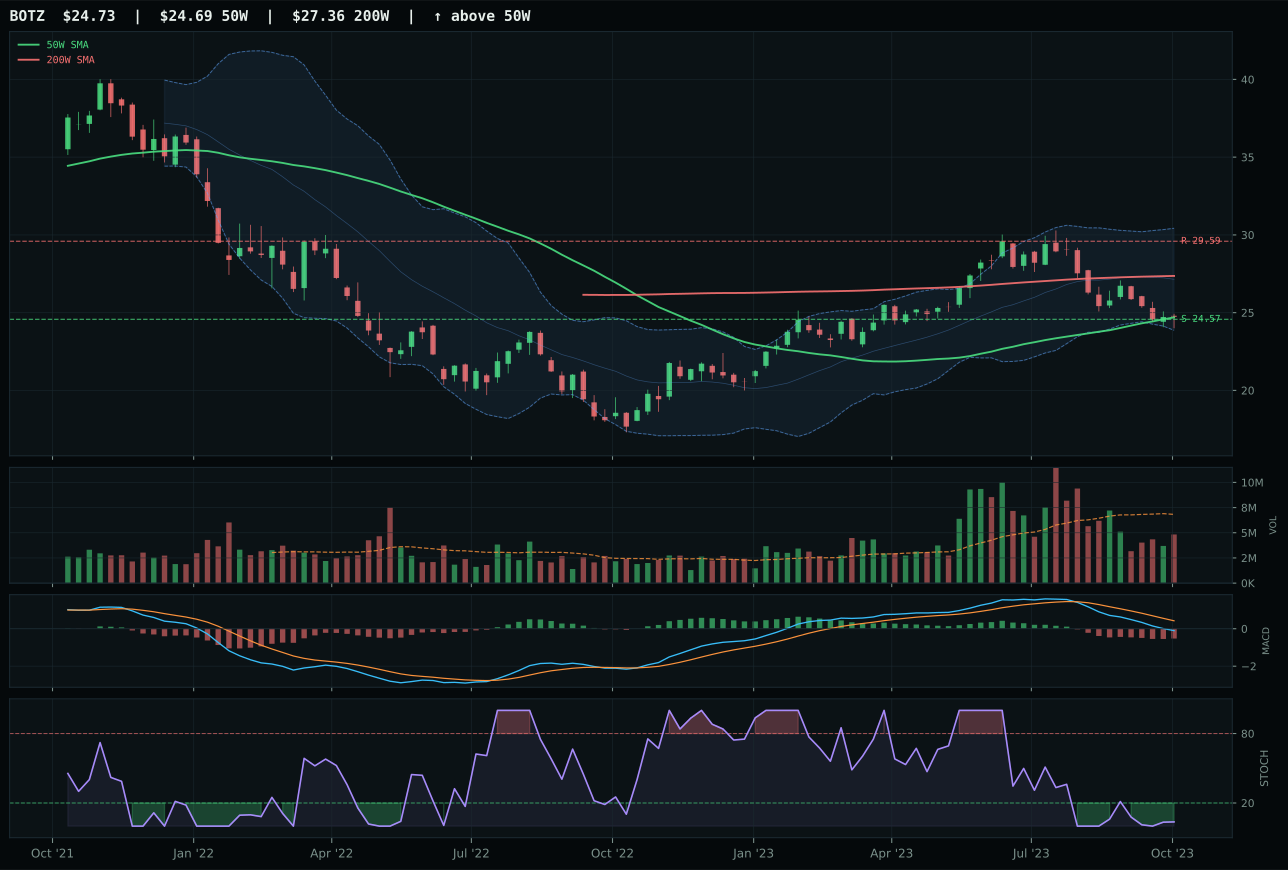
BOTZ has a pullback into support profile with -10.3% 13-week relative strength versus SPY.
A failed hold above support would weaken the setup.
Actionable but governed by invalidation levels.
SMH wins the AI category because its timing score of 78.0 beats AIQ's 70.0 by virtue of stochastic RSI sitting in the rising mid-zone versus oversold territory, offering a cleaner entry signal as sentiment recovers from extremes. The 1.6% relative strength versus SPY combined with 0.5% category-relative strength gives SMH a narrow but measurable edge in sponsorship; AIQ's 1.1% SPY RS and flat 0.0% category RS reveal weaker internal leadership. SMH trades 14.2% above the 50W with above-average volume participation (1.26x), meaning buyers are accepting a slightly extended entry to gain exposure to AI compute acceleration; the risk-reward of 51.6 acknowledges upside is limited to –7.6% to resistance at 160.50 while downside extends 20.7% to support. The structure remains neutral and MACD bearish/weakening, so the setup is momentum-based entry timing rather than a true reversal—appropriate for a 40.5/100 momentum confirmation score.
AI ranks 24.3 and receives 5% allocation in tier-2. The macro environment is hostile: liquidity stress (–12) and credit stress (–8) dominate, with broad market bear (–8) also active, overwhelming the positive energy scarcity signal (+8) and risk appetite lift (+10). SMH's technical evidence of 49.2 is respectable but insufficient to overcome a macro fit of only 44.0; the category-level macro fit registers just 28.0, pinning AI below energy and nuclear themes that benefit from real asset sponsorship in Late-Cycle Reflation. The 40.5% 13-week return and 42.6% RS versus SPY are headline-grabbing, but distribution pressure at 2.48x average volume and a timing score of only 53 signal that momentum is overextended for a category facing simultaneous liquidity and credit stress. AI would need either a sharp reversal in liquidity conditions or category-relative momentum to exceed 55/100 to justify top-2 positioning.
Emerging Markets — INDA
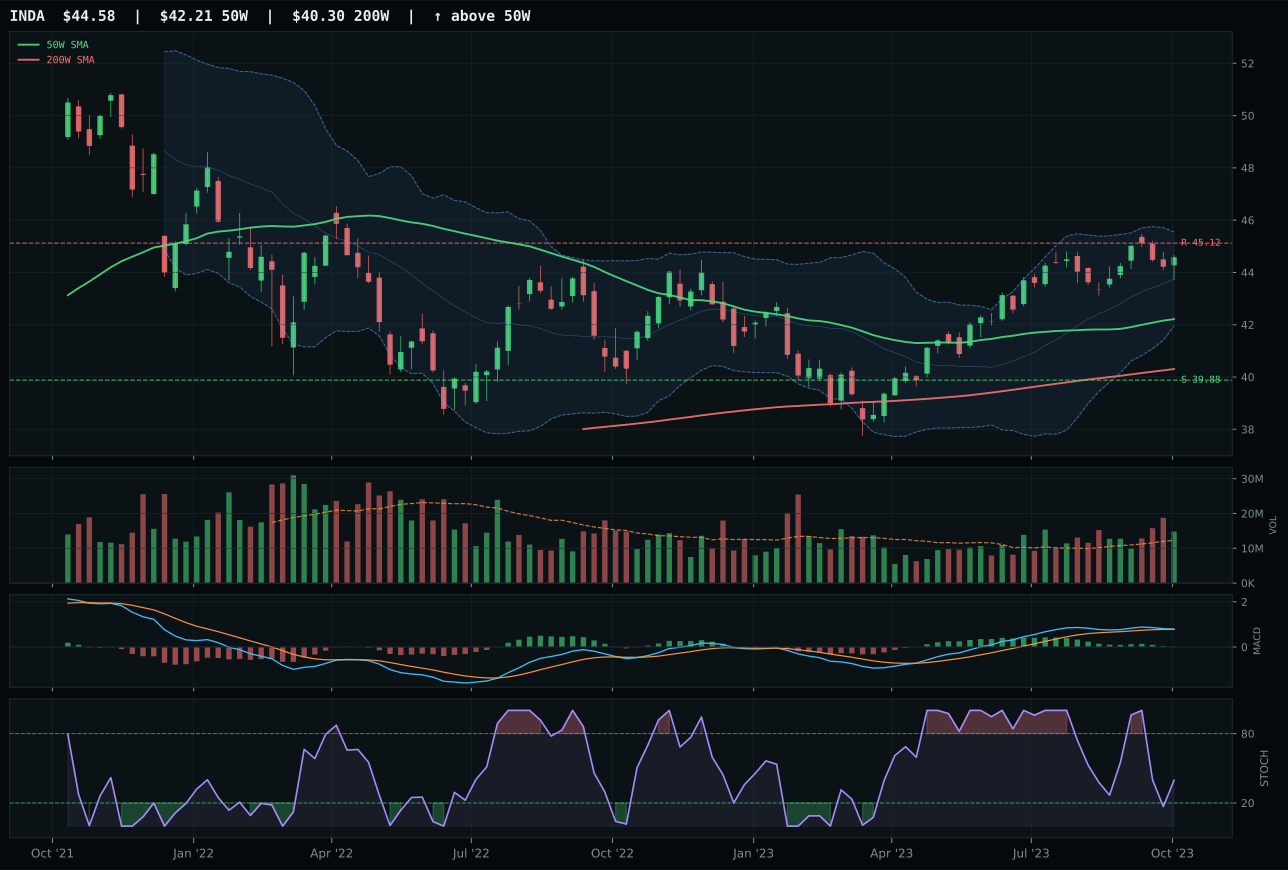
INDA has a neutral structure profile with 4.3% 13-week relative strength versus SPY.
A failed hold above support would weaken the setup.
Actionable but governed by invalidation levels.
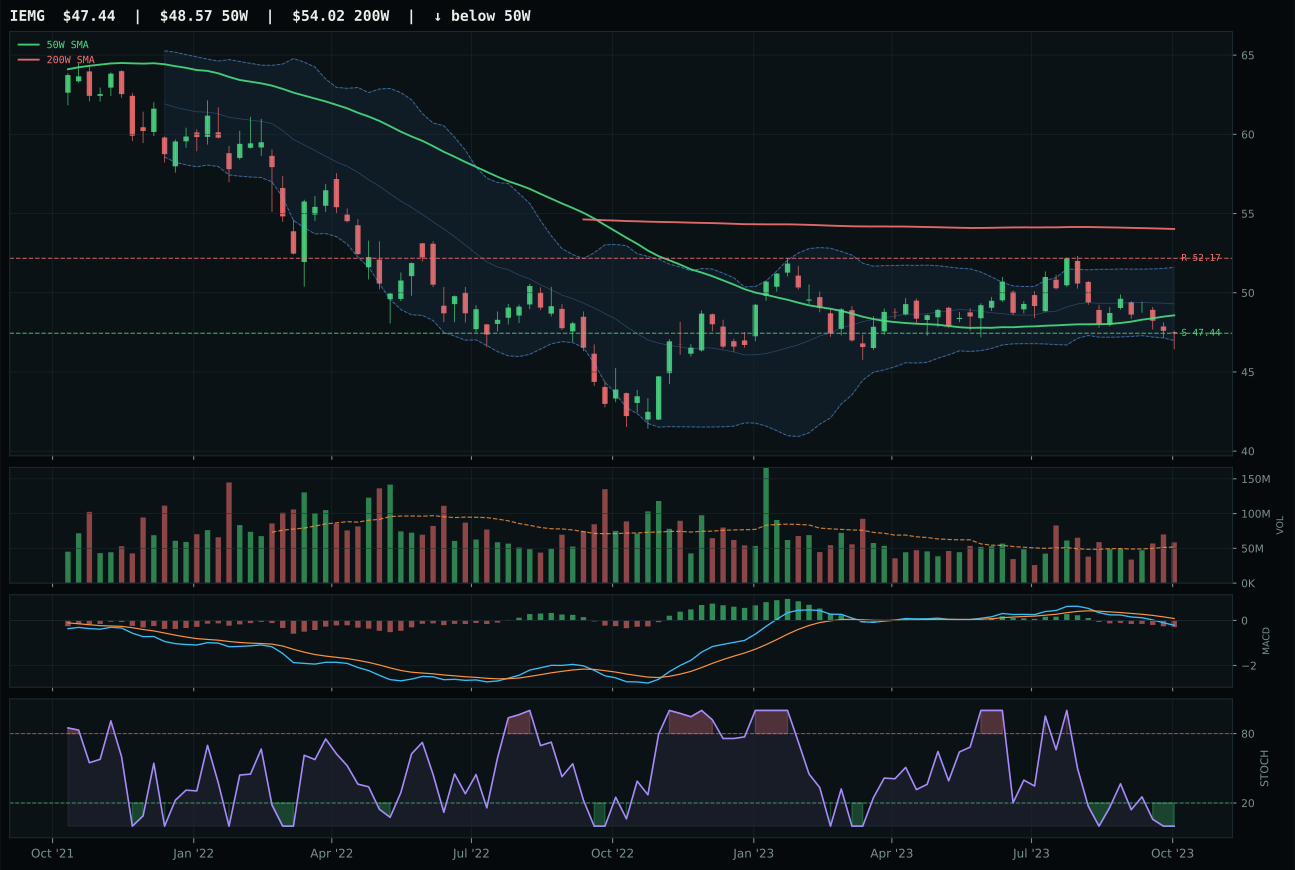
IEMG has a pullback into support profile with -1.4% 13-week relative strength versus SPY.
Extension and support failure are the main tactical risks.
Tracked, but not top-2 eligible because: structurally broken.
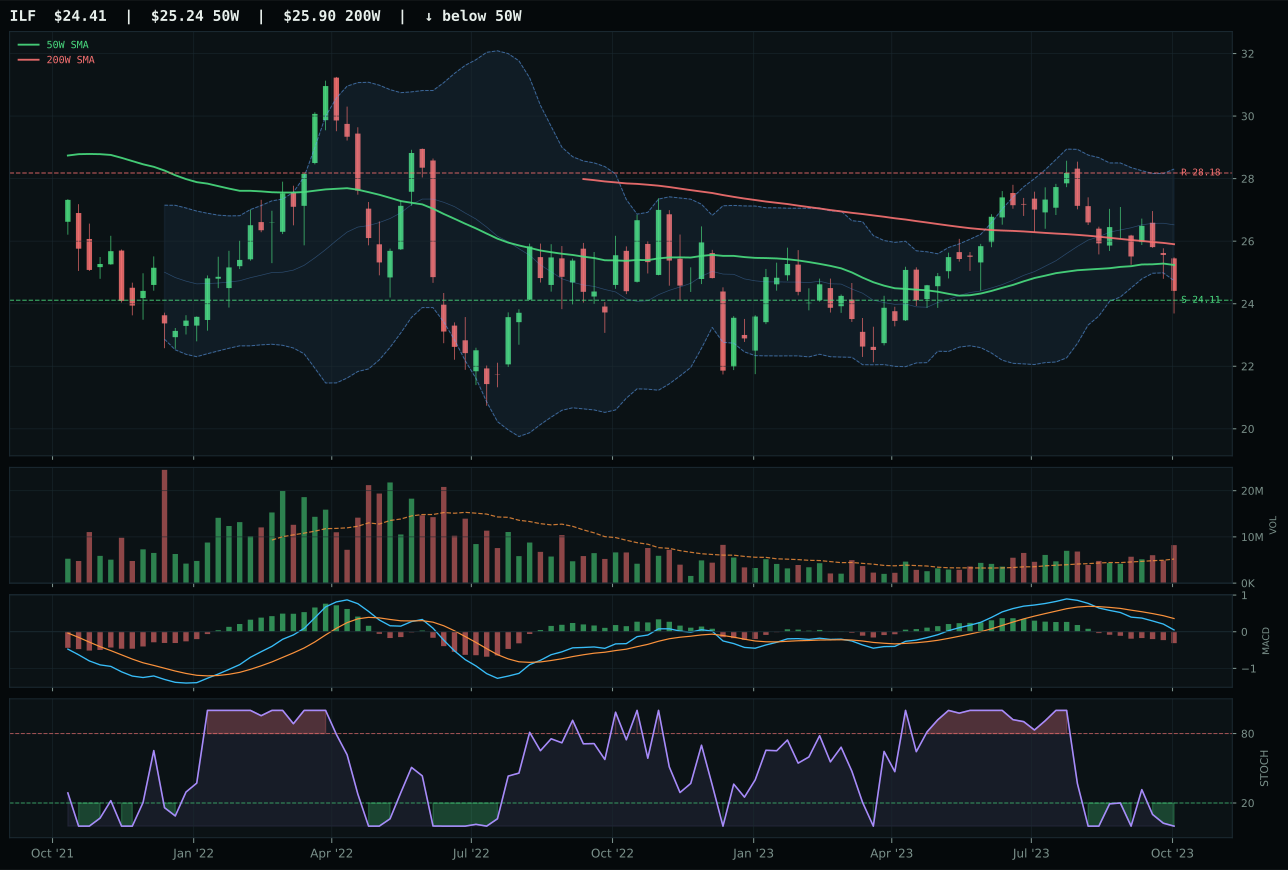
ILF has a pullback into support profile with -7.6% 13-week relative strength versus SPY.
Extension and support failure are the main tactical risks.
Tracked, but not top-2 eligible because: structurally broken.
INDA wins Emerging Markets decisively with a 79 composite score and 59.9 reasoned ETF ranking—nearly 31 points clear of IEMG's 28.6—based on superior structure cleanliness (79.5 vs 40.4) and MACD confirmation (bullish but flattening vs bearish/weakening). Both sit above the 50W with above-average volume, but INDA's neutral structure and 5.6% distance to the 50W create less crowded entry than IEMG's pullback-into-support setup. INDA's 4.3% relative strength versus SPY combined with 5.7% category-relative strength shows that India quality-growth is being bought while broad emerging markets face liquidation; category-relative strength 0.0% for IEMG versus 5.7% for INDA is the clinching signal. INDA's stochastic at 0.40 (falling/neutral) is better-positioned than IEMG's oversold, offering entry before the bounce rather than on the bounce. The 77.2 momentum confirmation for INDA versus 30 for IEMG reveals one is accumulating and one is being dumped.
Emerging Markets receives 5% tier-2 allocation despite INDA's strong 79 composite score; the category final score of 0.0 signals a hard filter failure that overrode technical strength. The macro headwinds are severe: dollar pressure (–14), credit stress (–10), liquidity stress (–10), and broad market bear (–9) all hammer emerging markets in a late-cycle USD-strong regime. Category-level macro fit is just 15.0, the lowest of any category in the portfolio. The 73.7 technical evidence for INDA is excellent—100 trend, 77 momentum, 67 volume—but it cannot overcome macro resistance. INDA's 4.3% SPY relative strength and bullish MACD show it is trading somewhat independently from the emerging-markets complex, making it defensible as a quality-growth rotation. However, top-2 consideration would require either a sharp reversal in dollar pressure or category momentum to exceed 60; the current environment treats emerging markets as risk-off dumping grounds regardless of name-level strength.
Agriculture & Livestock — MOO
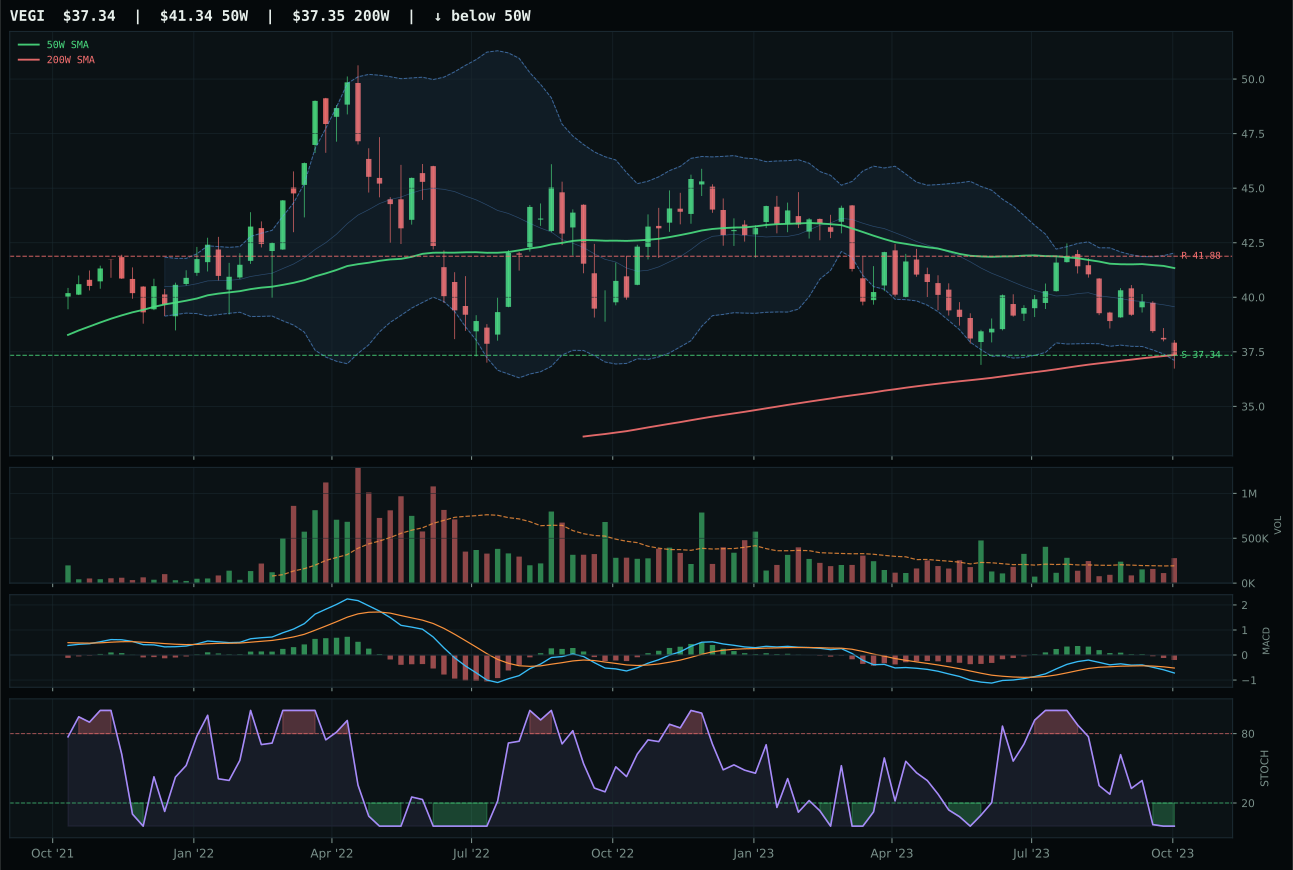
VEGI has a pullback into support profile with -4.4% 13-week relative strength versus SPY.
A failed hold above support would weaken the setup.
Tracked, but not top-2 eligible because: .
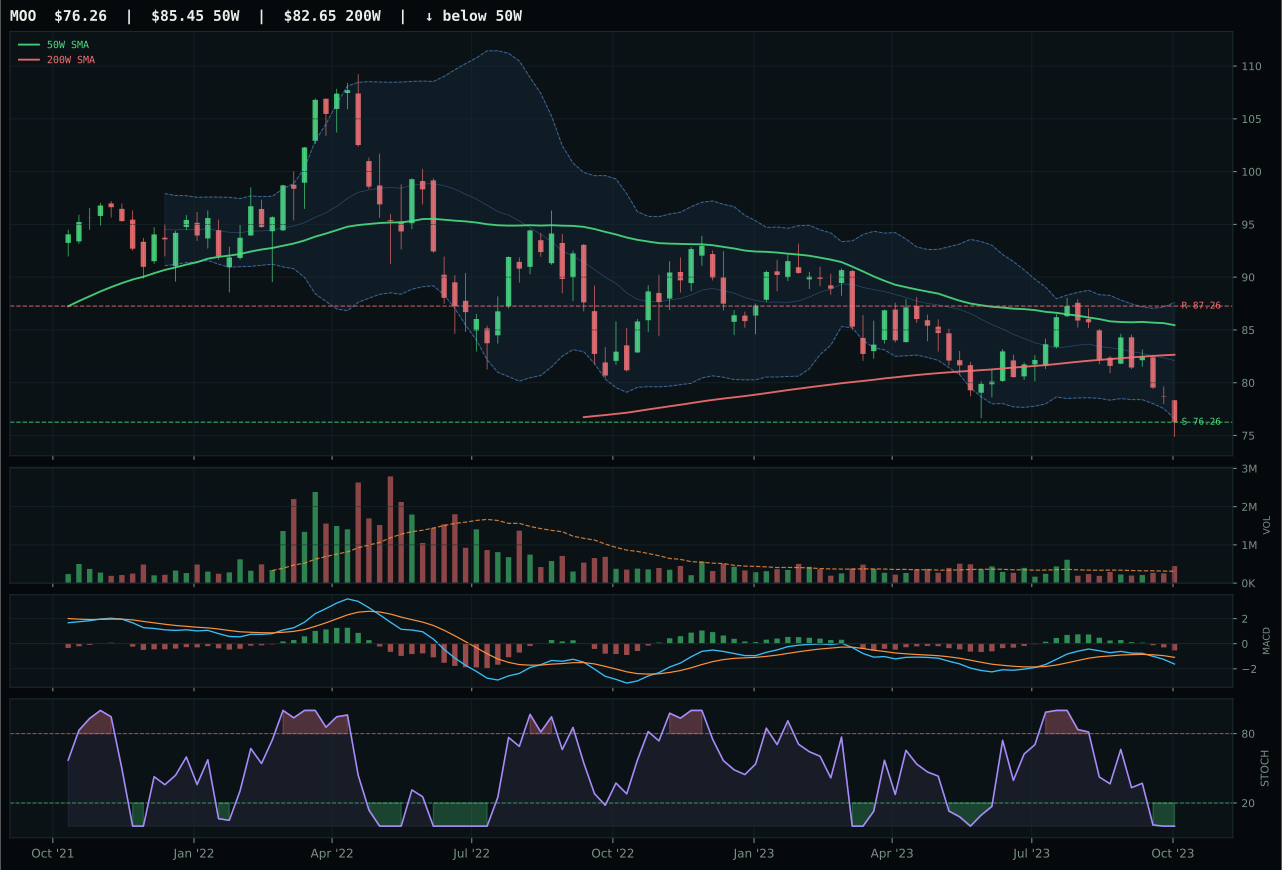
MOO has a pullback into support profile with -5.1% 13-week relative strength versus SPY.
A failed hold above support would weaken the setup.
Actionable but governed by invalidation levels.
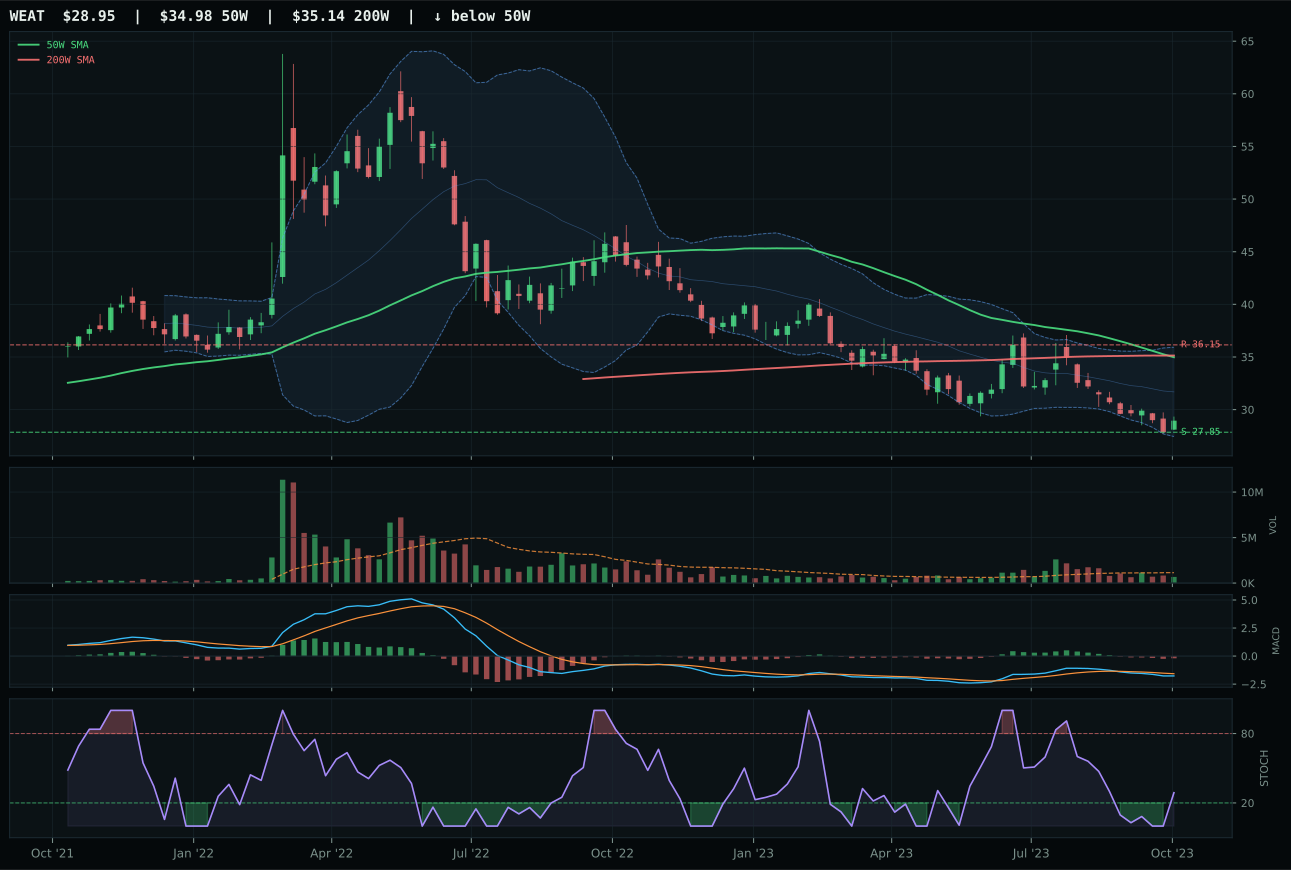
WEAT has a pullback into support profile with -8.2% 13-week relative strength versus SPY.
Extension and support failure are the main tactical risks.
Tracked, but not top-2 eligible because: structurally broken.
MOO wins a weak category by default: it scores 22.9 versus VEGI's 6.6 despite nearly identical technical profiles because risk-reward of 73.4 edges VEGI's 69.4 and category-relative strength is neutral 0.0% rather than trailing 0.7% behind the median. Both sit in pullback-to-support setups with oversold stochastics and bearish MACD; both show above-average volume and face similar macro headwinds. MOO's advantage is marginal and technical—the chart is simply closer to support 76.26 with less gap risk on the downside—rather than fundamental. Trend 29.3 and momentum 13.4 are both anemic, reflecting that agriculture is a liquidation trade, not an accumulation. The 73.4 risk-reward score looks attractive on paper because upside is limited (–12.6% to resistance at 87.26), but that same constraint tells you buyers have low conviction.
Agriculture & Livestock is allocated 0% this week; the category is excluded entirely from the portfolio at final rank 9 (or tied for 9). Despite a strong macro narrative—inflation pressure (+10), real asset sponsorship (+8), and Late-Cycle Reflation (+8) all help—the category-level macro fit of 72.0 cannot overcome the technical collapse. MOO's technical evidence is only 24.8; the 13-week return of –7.2%, RS versus SPY of –5.1%, and persistence of just 26.5 reveal active liquidation. The 73.4 risk-reward score is deceptive: it rewards the trade because losses are bounded, not because gains are likely. Allocation criteria require either trend confirmation above 50 or momentum above 40 for tier-2 entry; this category fails both. Agriculture would need to stabilize price above the 50W with volume confirmation and flip MACD to bullish to earn a 5% slot.
Precious Metals — GLD
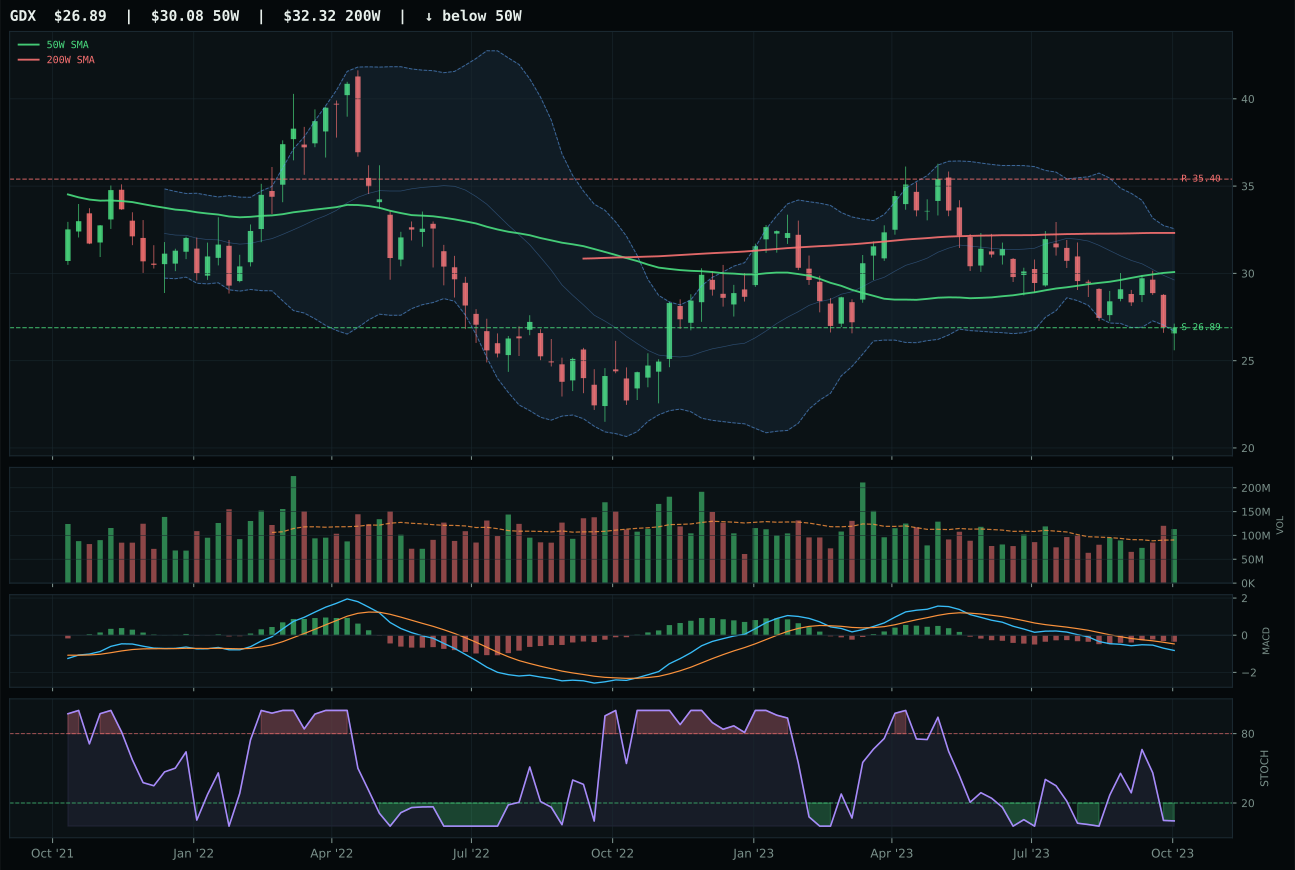
GDX has a pullback into support profile with -6.6% 13-week relative strength versus SPY.
Extension and support failure are the main tactical risks.
Tracked, but not top-2 eligible because: structurally broken.
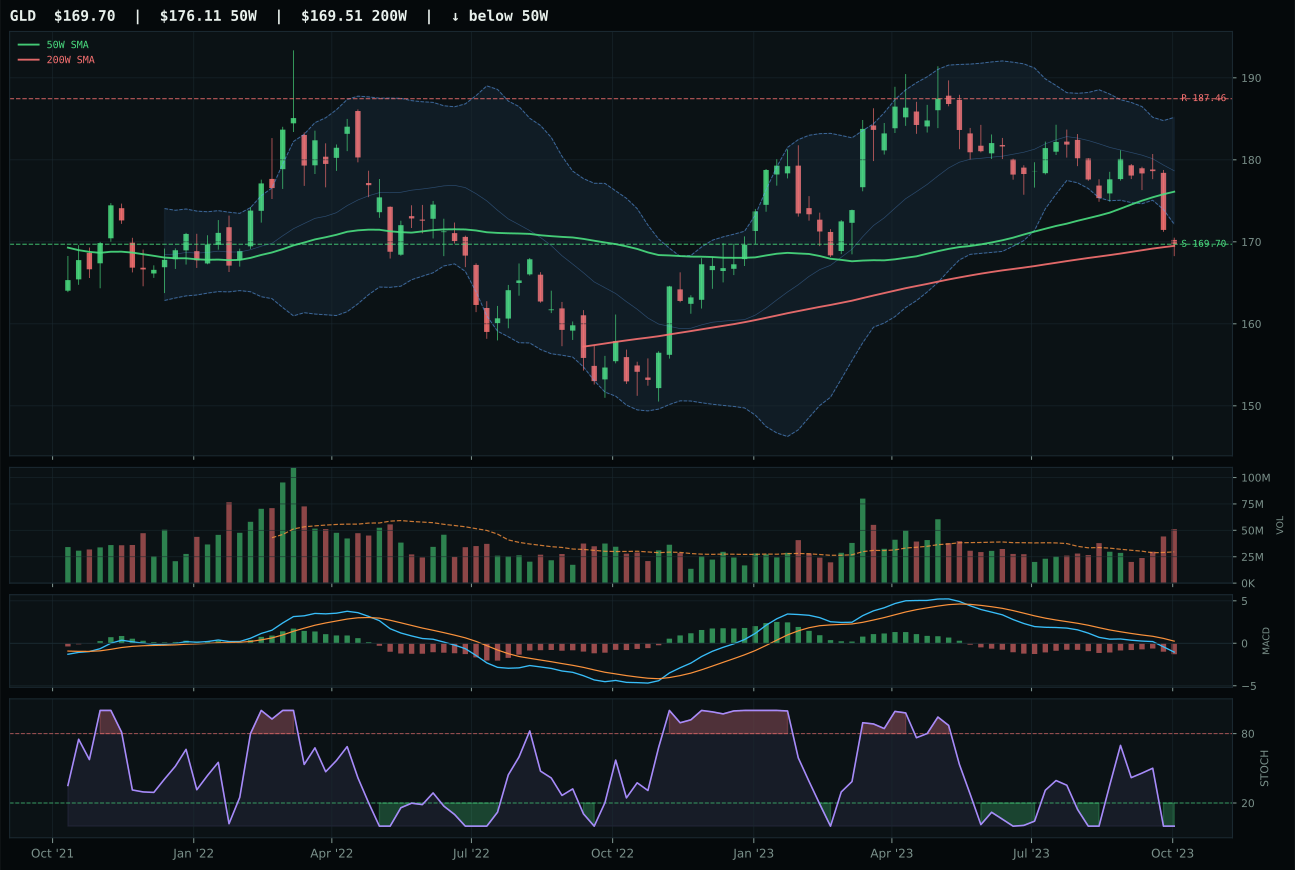
GLD has a pullback into support profile with -2.9% 13-week relative strength versus SPY.
A failed hold above support would weaken the setup.
Actionable but governed by invalidation levels.
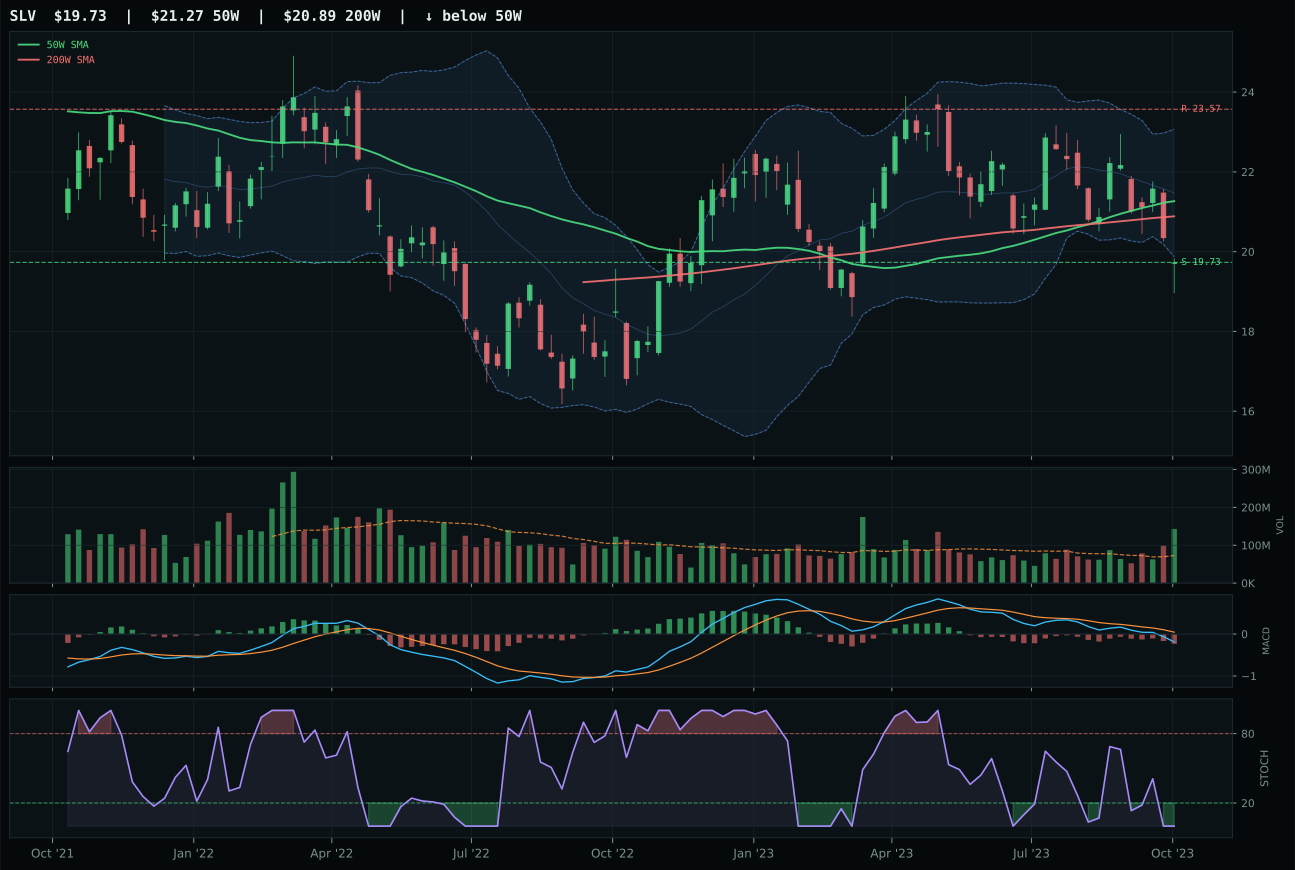
SLV has a pullback into support profile with -4.8% 13-week relative strength versus SPY.
A failed hold above support would weaken the setup.
Actionable but governed by invalidation levels.
GLD wins Precious Metals over GDX by posting a 100.0 timing score that captures the clean pullback-to-support setup at 169.70 with oversold stochastic and bearish MACD—the textbook mean-reversion entry. GDX loses on timing (65.0 vs 100.0), structure cleanliness (33.9 vs 68.5), and category-relative strength (–1.8% vs +1.8%), with an additional hard filter flagging it as structurally broken. Both face distribution pressure from volume; GLD's 1.73x reflects liquidation into support while GDX shows 2.48x, suggesting desperation. GLD's trend score of 52.6 is honest: the –2.9% relative weakness to SPY and price below the 50W tell you gold is being sold, not bought. But the timing setup—oversold RSI at the Fibonacci 0.500 midpoint—offers defined entry and exit points. Momentum confirmation of just 8.8 and persistence of 14.2 confirm this is a tactical setup, not a trend.
Precious Metals is allocated 0%; the category ranks 10 and is excluded entirely. The technical foundation crumbles under scrutiny: GLD's technical evidence is only 6.5, the lowest of any winning ETF in the portfolio. The macro case is contradictory—dollar pressure (+3) should support gold, but risk appetite positive (–4) actively crimps it—leaving category-level macro fit at 49.0, which is neutral at best. A 19.2 final category score reflects mostly timing merit on the GLD pullback-to-support setup; everything else (trend, momentum, persistence, volume confirmation) is weak. The –5.0% 13-week return and –2.9% SPY relative strength expose the fundamental problem: gold has failed to benefit from either risk-off (stocks would crater harder) or inflation print acceleration. Precious metals would require either a sharp dollar decline or credit stress activation to earn consideration.