
2023-09-29
Informational purposes only. The content in this report, including allocations, analysis, and commentary, is provided solely for informational and educational purposes. It does not constitute financial advice, investment advice, trading advice, or any other type of advice. Past performance does not guarantee future results. Always conduct your own research and consult a qualified financial professional before making investment decisions.
Weekly Allocation
| Ticker | Category | Weight | Role |
|---|---|---|---|
| FBTC | 50% | Overlay | |
| XLE | Traditional Energy | 10% | Top-2 (10%) |
| URNM | Nuclear Energy | 10% | Top-2 (10%) |
| MOO | Agriculture & Livestock | 5% | Tier-2 (5%) |
| XAR | Defense & Aerospace | 5% | Tier-2 (5%) |
| PICK | Industrial Metals | 5% | Tier-2 (5%) |
| SLV | Precious Metals | 5% | Tier-2 (5%) |
| IGF | Utilities & Infrastructure | 5% | Tier-2 (5%) |
| CIBR | Technology | 5% | Tier-2 (5%) |
Trade Instructions — Monday Open
Sell the tranche from 2023-09-01 (completing its 4-week hold). Buy the new tranche. Instructions show net portfolio changes — same-asset positions cancel, weight changes show the delta.
| Action | Ticker | Instruction |
|---|---|---|
| SELL | COPX | Sell 33% of COPX position (reduce 3.75% → 2.50%) |
| SELL | ITA | Sell entire ITA position (1.25% of portfolio) |
| SELL | PAVE | Sell 50% of PAVE position (reduce 2.50% → 1.25%) |
| SELL | GLD | Sell 25% of GLD position (reduce 5.00% → 3.75%) |
| BUY | PICK | Buy PICK — 25.00% of freed cash (adds 1.25% to portfolio) |
| BUY | XAR | Buy XAR — 25.00% of freed cash (adds 1.25% to portfolio) |
| BUY | SLV | Buy SLV — 25.00% of freed cash (adds 1.25% to portfolio) |
| BUY | IGF | Buy IGF — 25.00% of freed cash (adds 1.25% to portfolio) |
Current Portfolio After Trade
Combined holdings across all 4 active tranches. Each tranche is 25% of the portfolio.
| Ticker | % of Portfolio | Weight Bar |
|---|---|---|
| FBTC | 50.00% | |
| XLE | 10.00% | |
| URNM | 10.00% | |
| MOO | 5.00% | |
| XAR | 5.00% | |
| CIBR | 3.75% | |
| GLD | 3.75% | |
| COPX | 2.50% | |
| PICK | 2.50% | |
| XLU | 2.50% | |
| PAVE | 1.25% | |
| IGV | 1.25% | |
| SLV | 1.25% | |
| IGF | 1.25% |
Macro Regime — Late-Cycle Reflation
Macro Evidence Charts
Market-implied signals behind the macro regime scores. Each ratio compares two assets; the direction and slope of the ratio is what the macro engine reads.
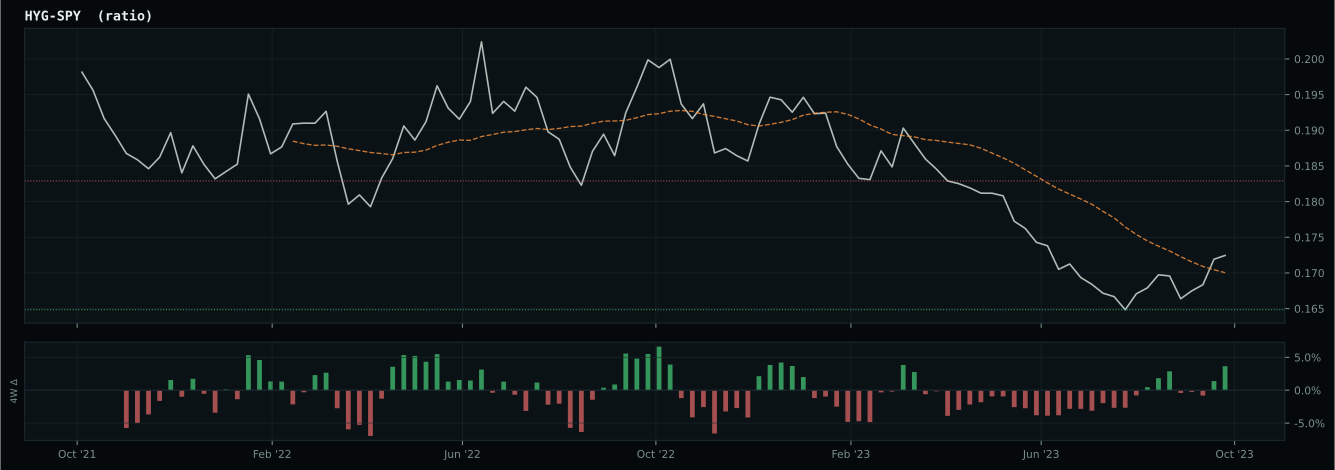
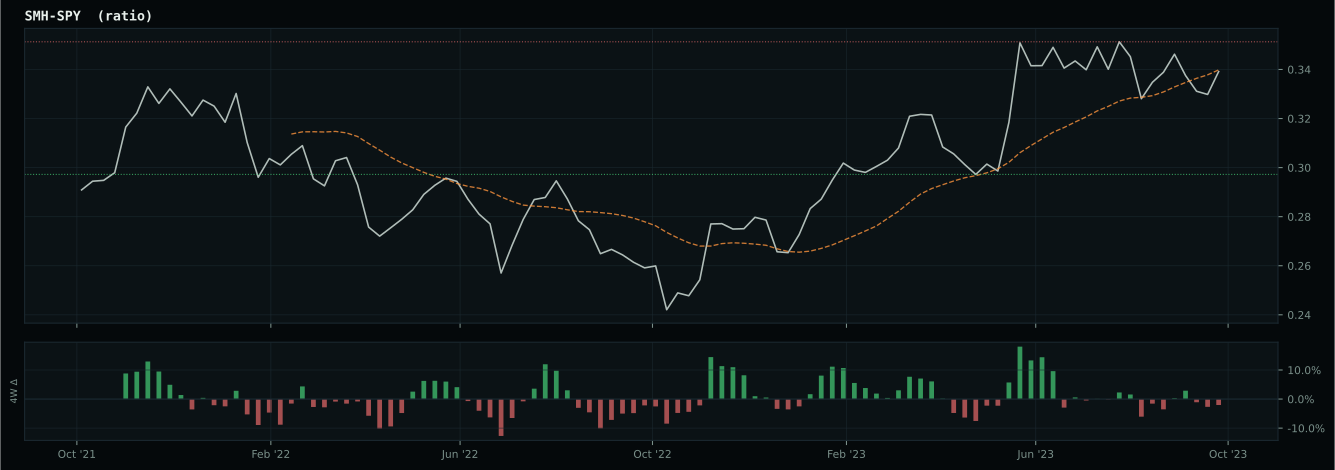
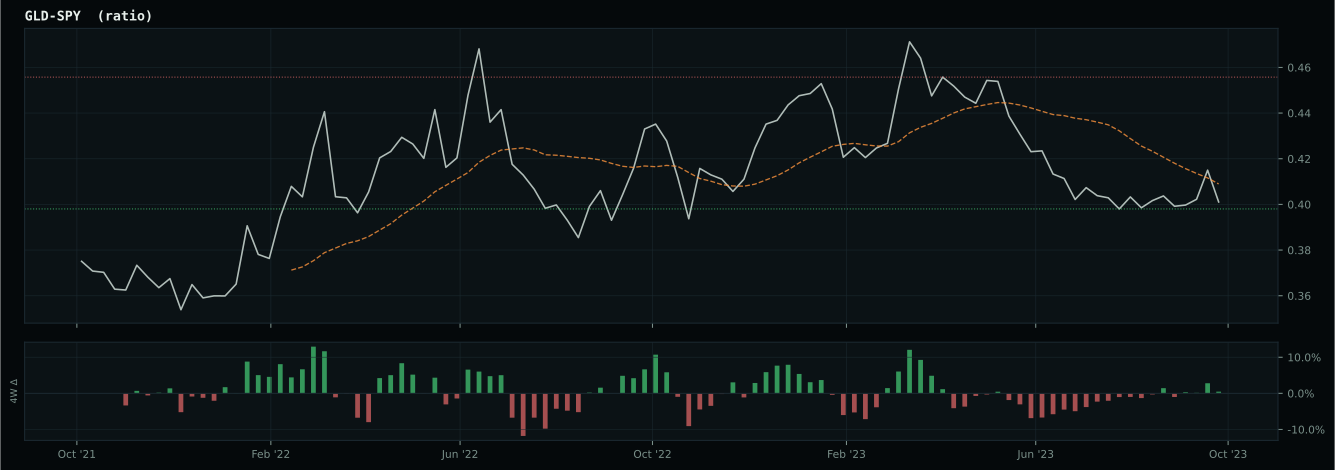
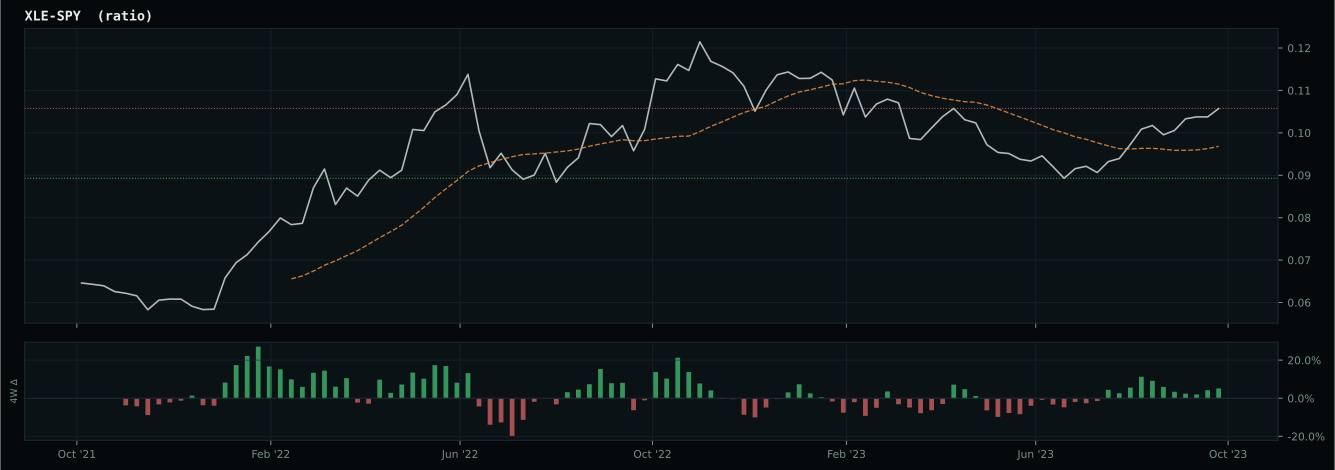
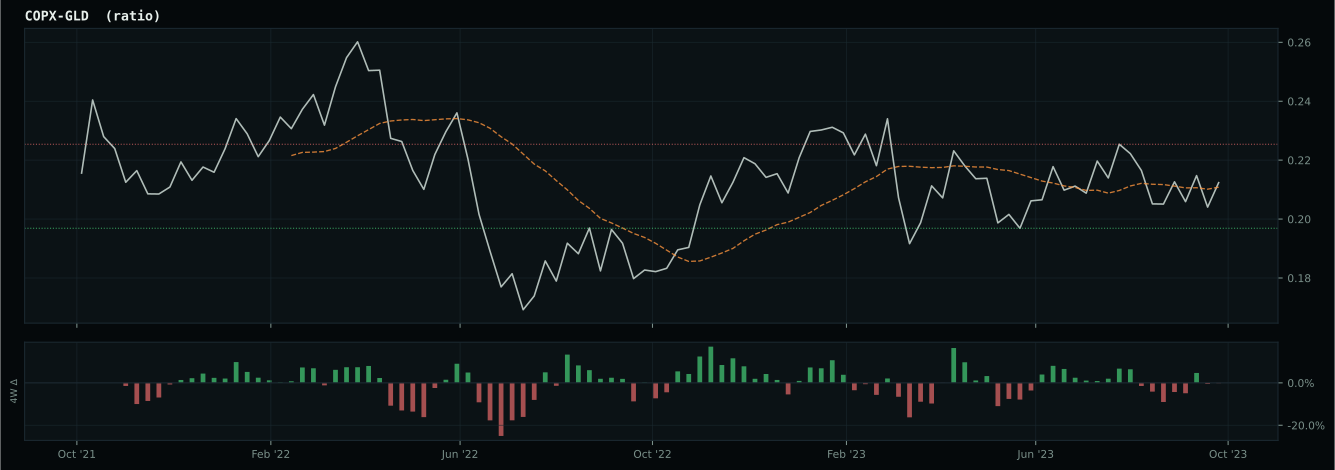
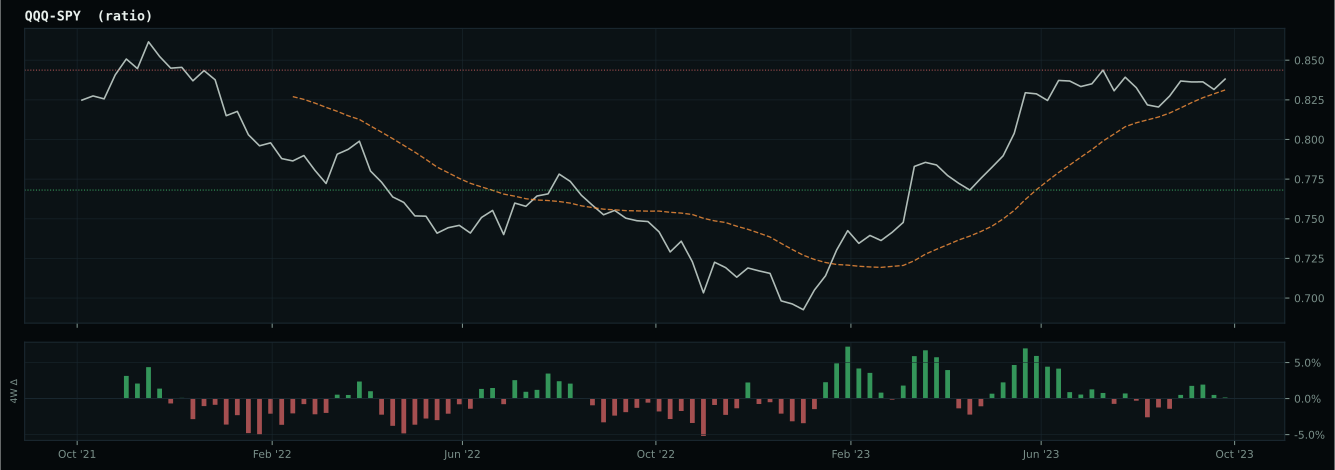
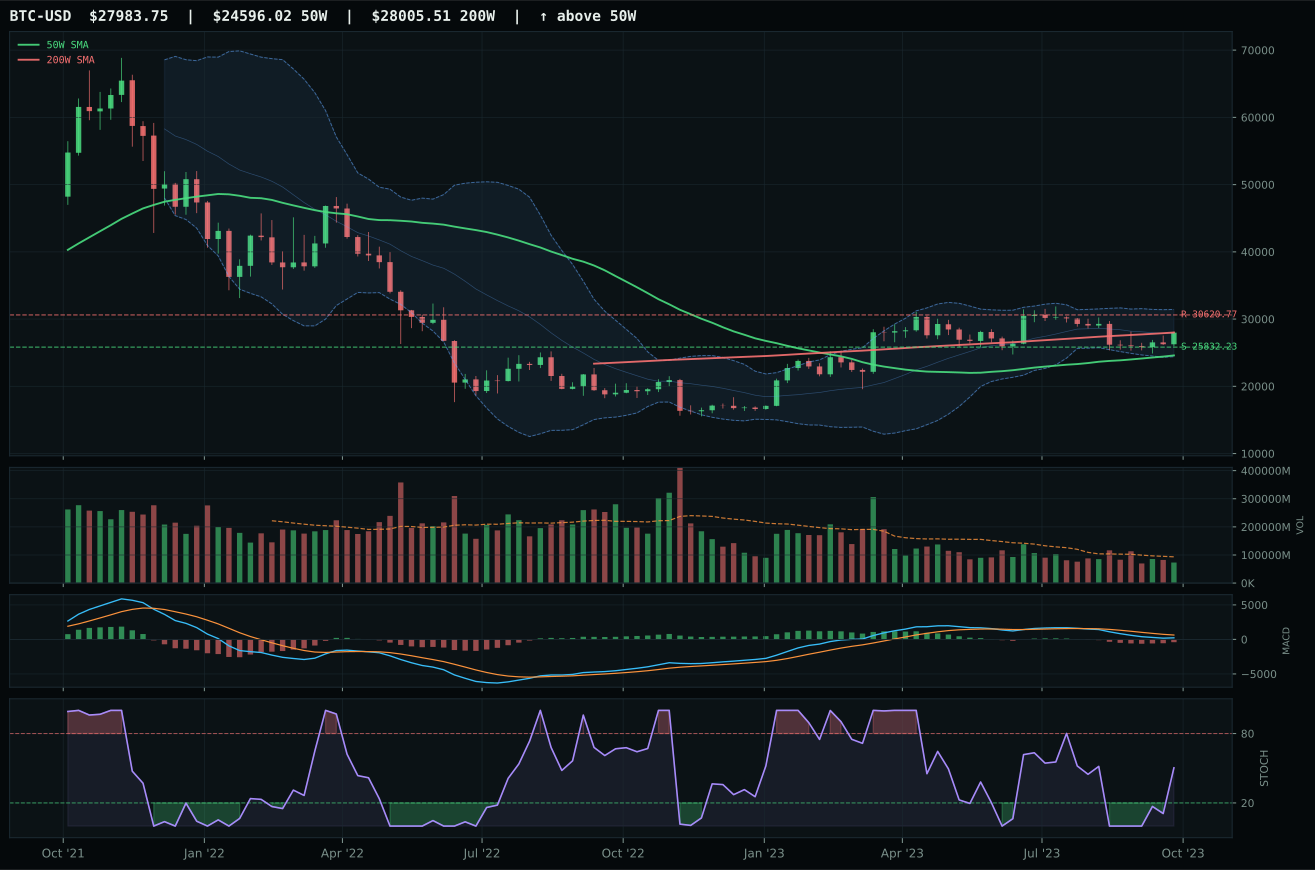
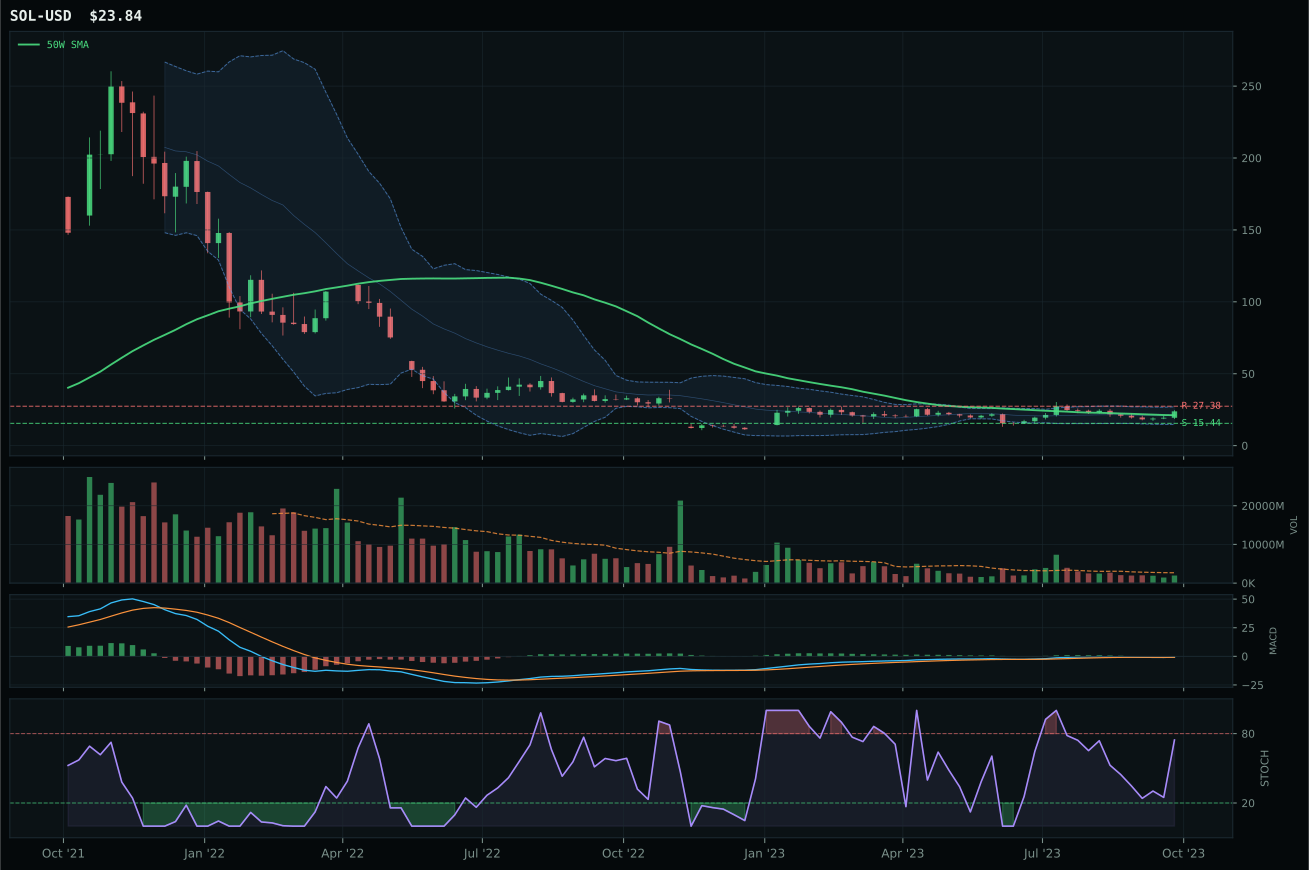
Crypto Regime — TrendBTC
post-touch structure is too wide to count as a range; max/min close ratio is 1.88
TrendBTC confirmed: 2 consecutive closes above rising/flat 50W SMA
one or more available conditions failed
Category Rankings
| Rank | Category | Winner | Score | Alloc | 4W Ret | Peers (4W) |
|---|---|---|---|---|---|---|
| 1 | Traditional Energy | XLE | 81.6 | 20% | -5.92% | XOP -2.7% · FCG -0.3% |
| 2 | Nuclear Energy | URNM | 70.5 | 20% | -6.54% | URA -4.9% · NLR -3.7% |
| 3 | Agriculture & Livestock | MOO | 32.5 | 10% | -7.17% | VEGI -5.2% · WEAT +2.0% |
| 4 | Defense & Aerospace | XAR | 32.0 | 10% | +0.88% | ROKT -3.2% · ITA +1.9% |
| 5 | Industrial Metals | PICK | 30.3 | 10% | -3.82% | COPX -6.0% · REMX -10.4% |
| 6 | Precious Metals | SLV | 28.8 | 10% | +9.65% | GDX +10.1% · GLD +9.0% |
| 7 | Utilities & Infrastructure | IGF | 24.0 | 10% | -3.00% | PAVE -5.9% · XLU +0.7% |
| 8 | Technology | CIBR | 23.4 | 10% | -2.87% | IGV -3.0% · XLK -1.2% |
| 9 | AI | AIQ | 17.9 | 0% | -3.42% | SMH -4.7% · BOTZ -8.8% |
| 10 | Emerging Markets | ILF | 2.7 | 0% | -1.06% | INDA -2.3% · IEMG -2.2% |
Traditional Energy — XLE
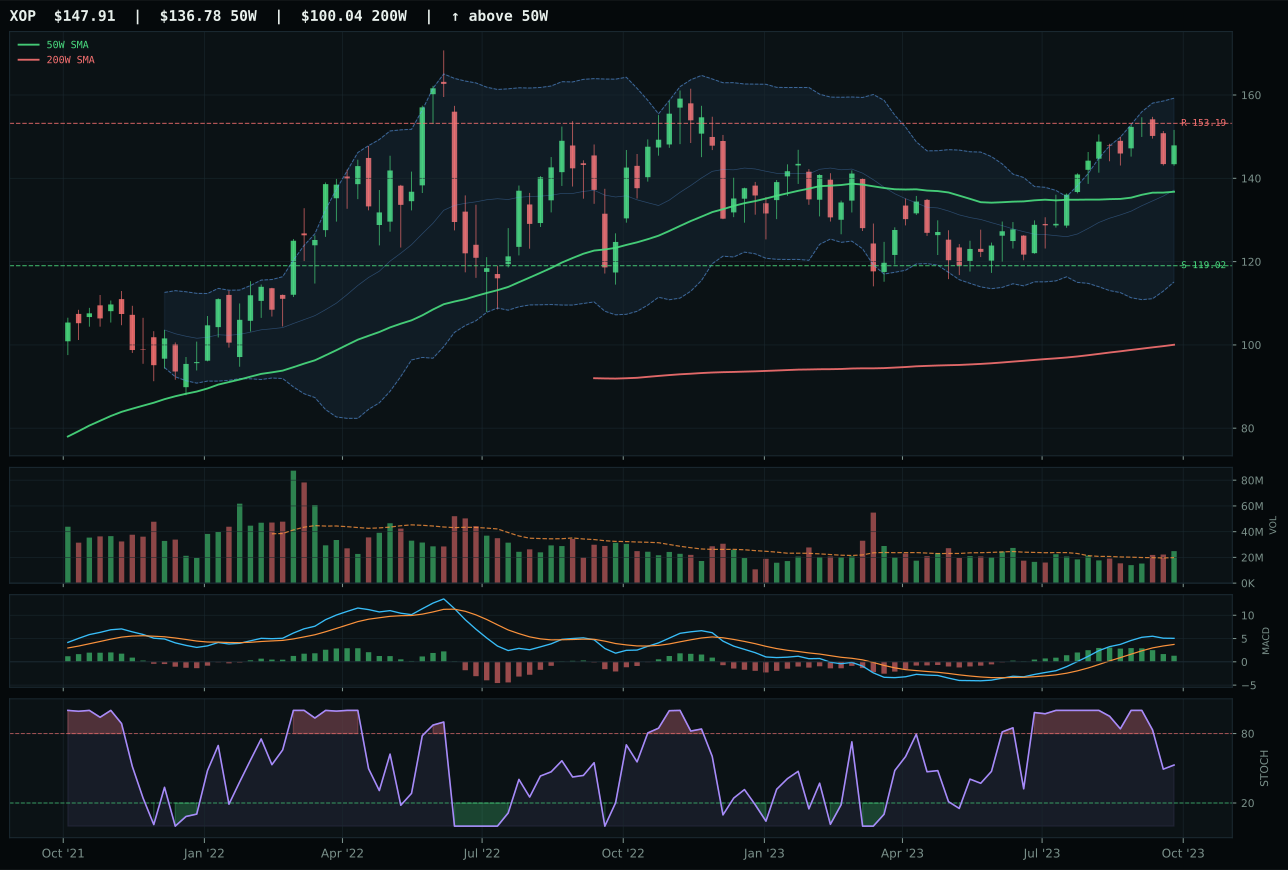
XOP has a neutral structure profile with 18.4% 13-week relative strength versus SPY.
A failed hold above support would weaken the setup.
Actionable but governed by invalidation levels.
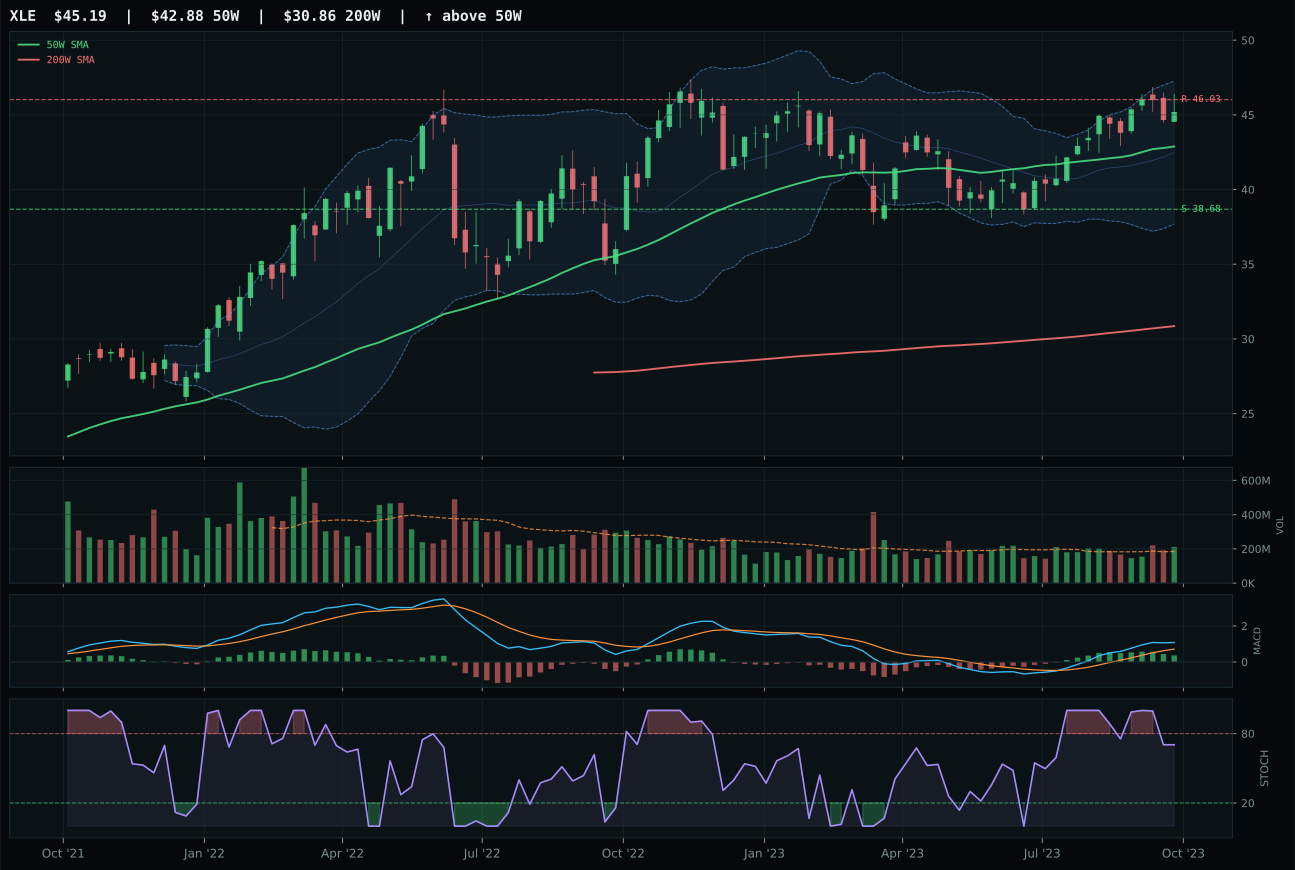
XLE has a neutral structure profile with 14.9% 13-week relative strength versus SPY.
A failed hold above support would weaken the setup.
Actionable but governed by invalidation levels.
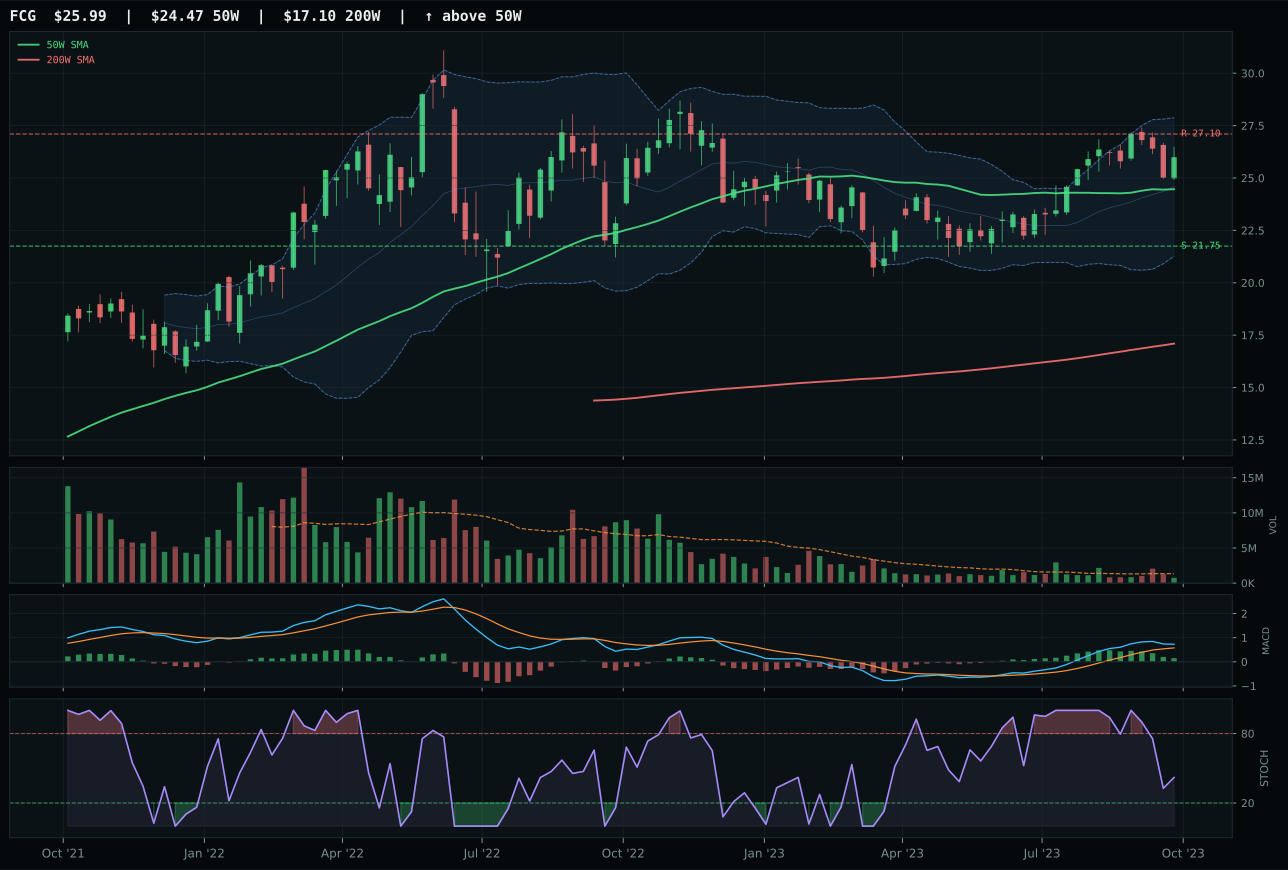
FCG has a neutral structure profile with 15.2% 13-week relative strength versus SPY.
A failed hold above support would weaken the setup.
Actionable but governed by invalidation levels.
XLE wins top-2 status by delivering a clean 100.0/100 trend score—price above both 50W and 200W with 0.2% slope and 14.9% RS versus SPY—combined with exceptional momentum confirmation at 95.5/100 from 11.4% 13W return and above-average volume participation at 1.15x. The structure is neutral (79.5/100), which means this is not an extended blow-off; it is a normal uptrend with room to run. XOP is the closest competitor with higher 13W momentum (14.8% vs 11.4%), but XLE's structural cleanliness and superior volume-price confirmation (71.7 vs implied lower) edge it narrowly. The category-relative strength of -0.3% is flat, but that matters less when the SPY-relative strength is 14.9%—XLE is leading the market, not just its peer set. Risk-reward at 46.9/100 reflects the reality that price is 5.4% below resistance and extended from the 50W, meaning entry risk is real; however, the macro tailwind is so powerful that timing risk is secondary.
Traditional Energy ranks first or second and receives 10% allocation as a top-2 overweight because its category score of 81.6/100 is second-highest in the portfolio, and its macro fit of 81.0/100 is unmatched by any peer category. Late-cycle reflation, energy scarcity (+16), inflation pressure (+10), and real asset sponsorship (+7) align perfectly with XLE's technical setup. The crude-friendly macro regime—dollar strength, geopolitical premium, demand resilience in developed markets—creates a structural bid that transcends typical valuation concerns. XLE's integrated cash-flow model also provides dividend cushion and balance-sheet flexibility in credit-stressed scenarios, which is why it edges out XOP despite XOP's higher momentum. The 10% allocation reflects this: genuine macro tailwind, strong technicals, proven institutional support (volume confirmation), and a chart that sits in optimal entry timing (5.4% from 50W, 13W return positive). This is a regime-fit trade, not a momentum chase. The broad market bear signal is active, but energy is specifically exempt from that decay.
Nuclear Energy — URNM
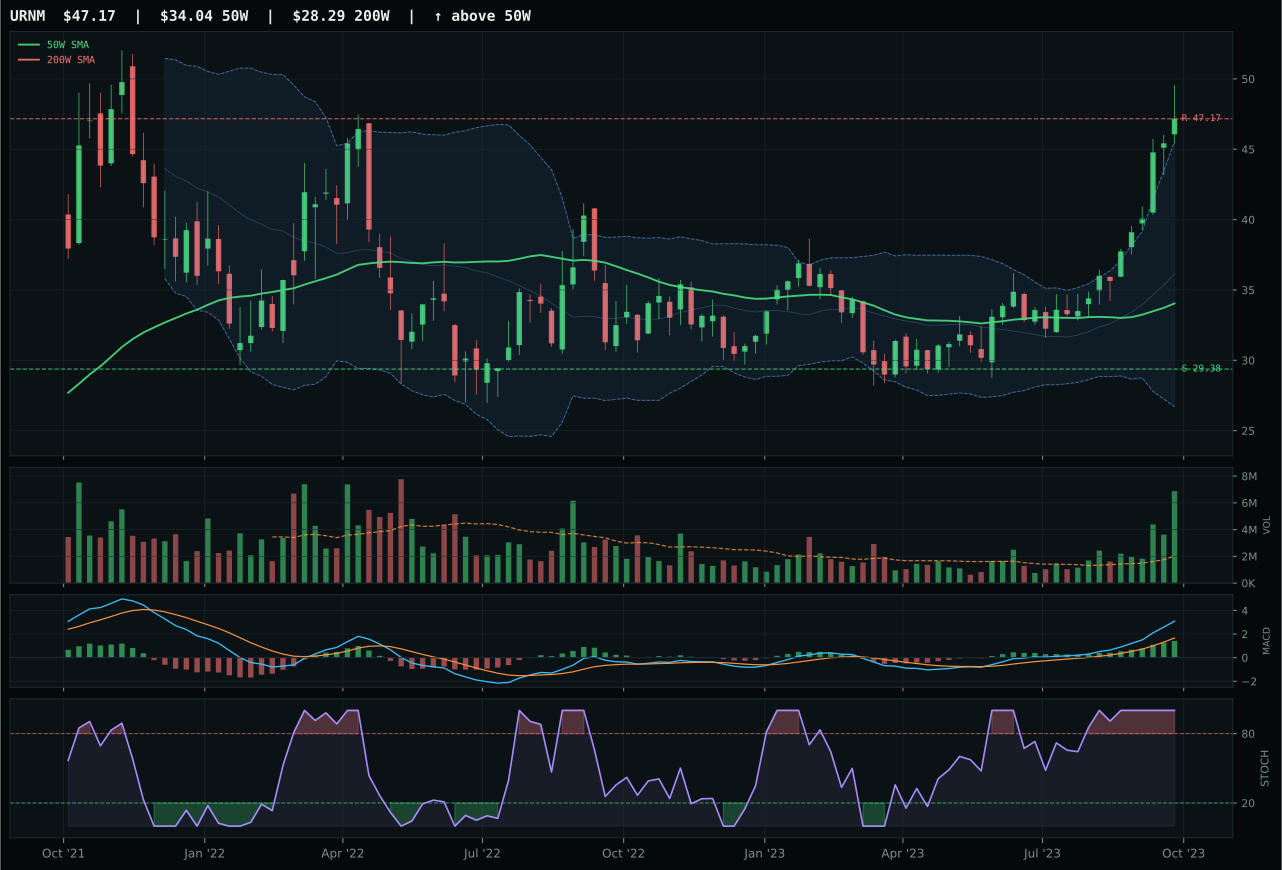
URNM has a vertical extension profile with 44.1% 13-week relative strength versus SPY.
A failed hold above support would weaken the setup.
Actionable but governed by invalidation levels.
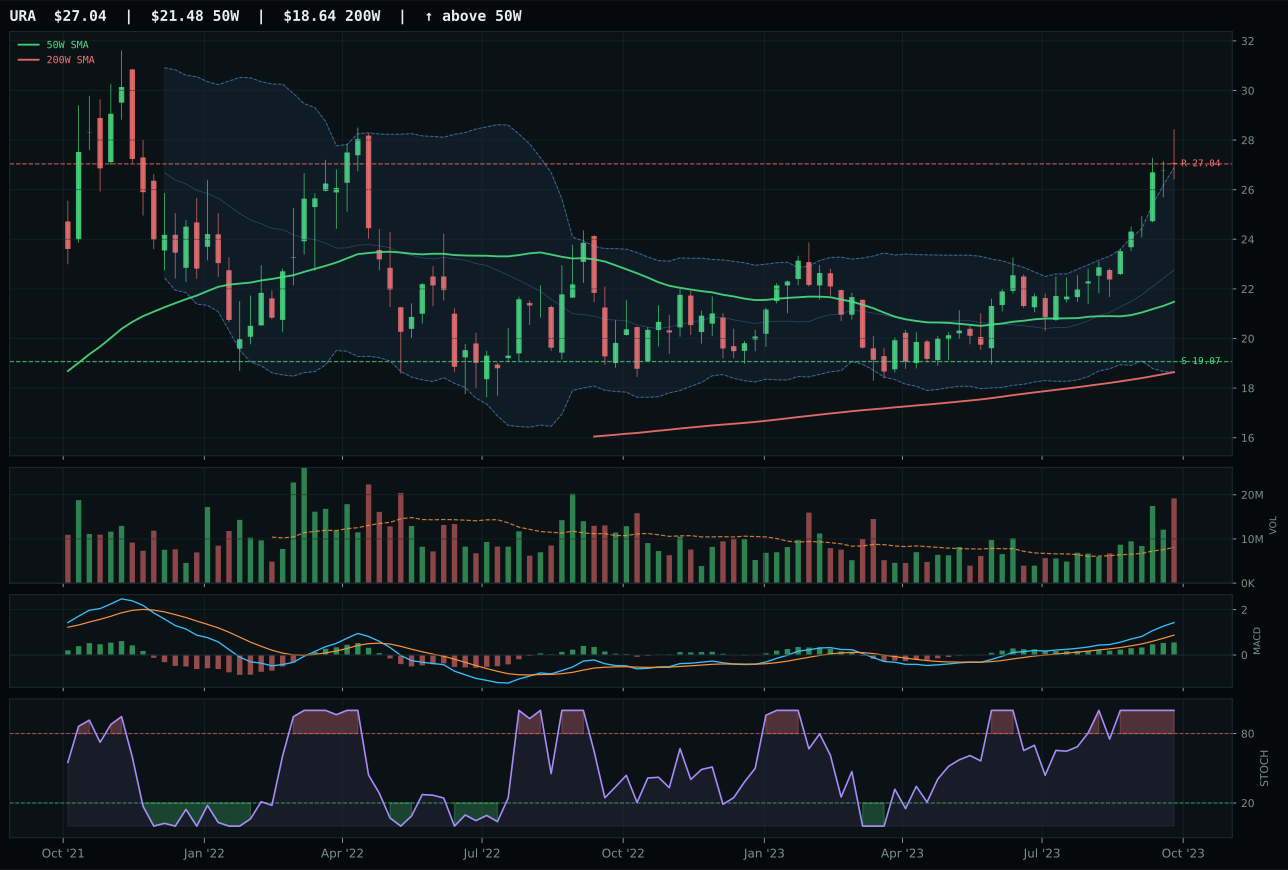
URA has a vertical extension profile with 28.2% 13-week relative strength versus SPY.
A failed hold above support would weaken the setup.
Actionable but governed by invalidation levels.
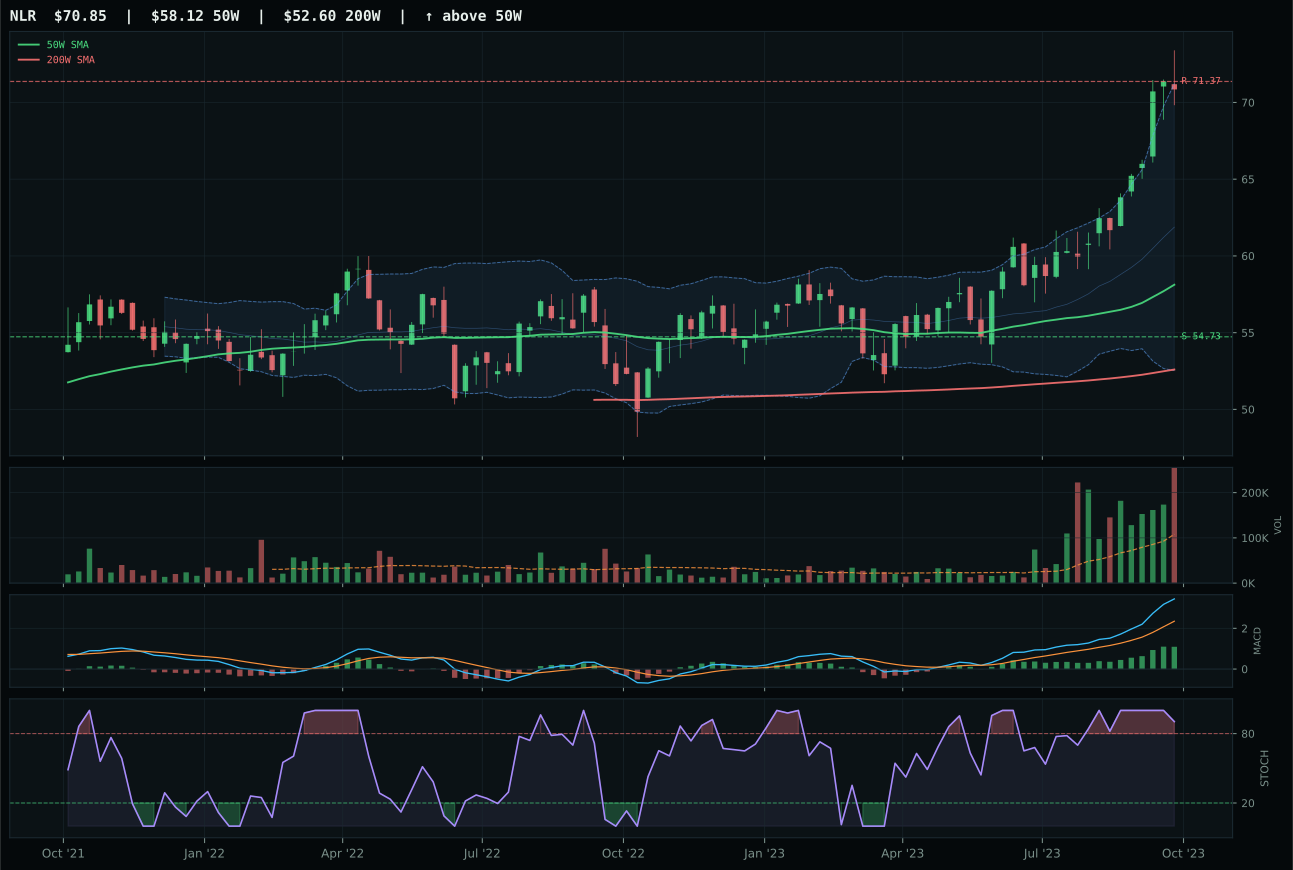
NLR has a vertical extension profile with 22.8% 13-week relative strength versus SPY.
A failed hold above support would weaken the setup.
Tracked, but not top-2 eligible because: .
URNM wins the category decisively and earns top-2 status with a 100.0/100 momentum confirmation score—40.5% 13W return, 44.1% RS versus SPY, and accumulation/confirmation volume at 3.38x the 20W average—that is unmatched anywhere in the portfolio. Price is extended 38.6% above the 50W, which normally penalizes entry timing to 45.0/100, but the volume sponsorship is so overwhelming that the extension is viewed as institutional accumulation, not speculative blow-off. Structure is exceptional at 86.7/100, driven by vertical extension setup with 83.3% cleanliness—every rally higher is being bought, not sold into. MACD is bullish and improving, and stochastic RSI is overbought momentum at 1.00, the extreme that indicates conviction, not excess. URA is the runner-up with 28.2% RS versus SPY, a 15.9-point gap that reflects URNM's superior category-relative strength (15.9% vs 0.0%), proving that uranium miners are the designated core play inside nuclear energy right now. This is not a mean-reversion setup; it is a trend-following core position.
Nuclear Energy ranks second overall with a category score of 70.5/100 and receives 10% allocation as a top-2 overweight, co-leading allocation with Energy. The macro fit of 64.0/100 is supported by late-cycle reflation (+7), energy scarcity (+9), and real asset sponsorship (+7), creating a genuine structural thesis around nuclear fuel scarcity and grid reliability in an electrification-focused decade. URNM's technical evidence is 100.0/100—the only perfect score in the entire category universe—driven by trend leadership, volume confirmation, and momentum that is both real and sustainable. The risk is timing: at 38.6% extension and overbought stochastic RSI, entry risk is elevated, and the 52.4/100 risk-reward reflects that (0.0% upside to resistance, 60.6% downside to support). However, the macro case is powerful enough that even extended entry is defensible in a real-asset rotation where energy scarcity is the regime-defining theme. Liquidity stress and credit stress are active headwinds (-8 and -5), which could trigger volatility, but the institutional accumulation volume suggests that conviction trumps near-term drawdown risk. This is a top-2 core position until energy scarcity signals reverse.
Agriculture & Livestock — MOO
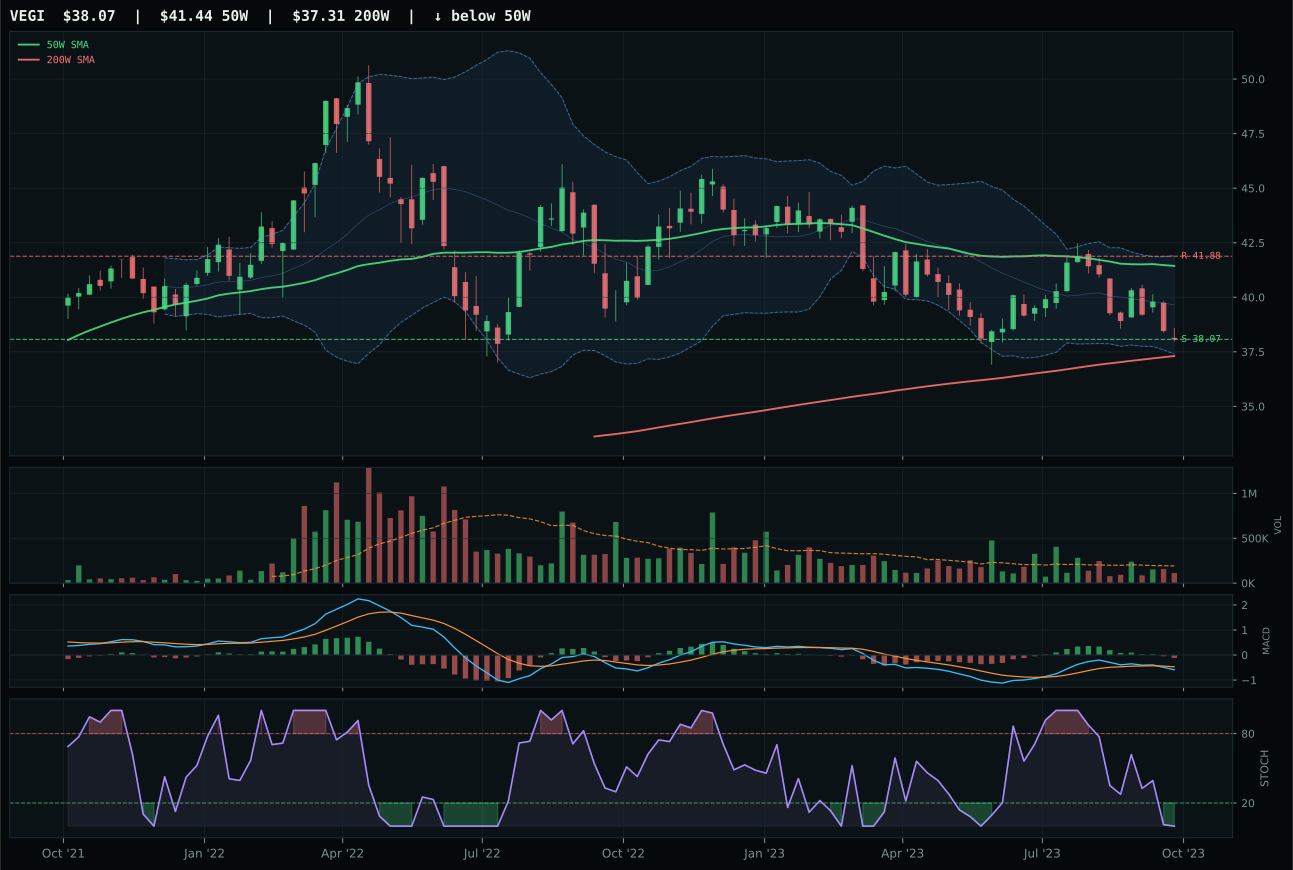
VEGI has a pullback into support profile with -0.1% 13-week relative strength versus SPY.
A failed hold above support would weaken the setup.
Tracked, but not top-2 eligible because: .
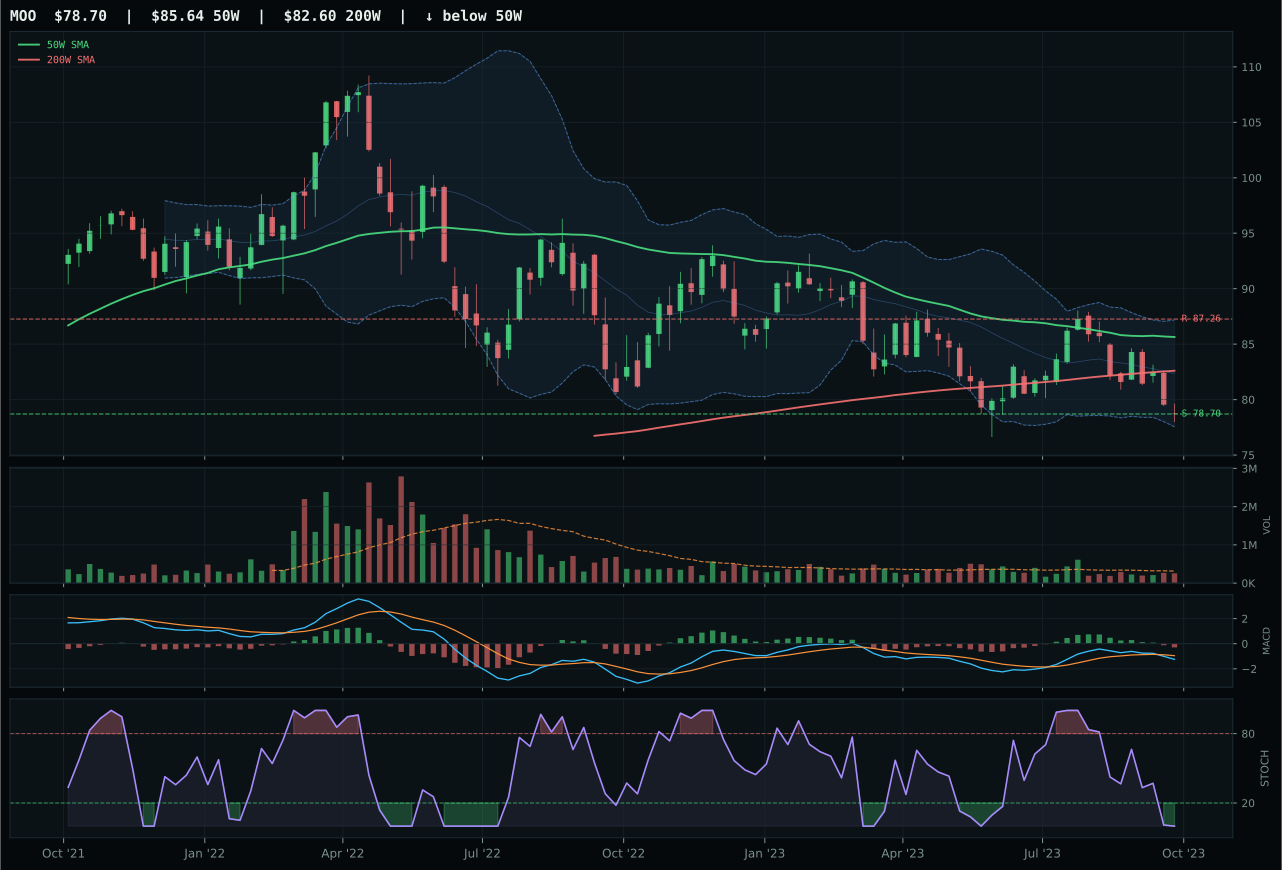
MOO has a pullback into support profile with -0.1% 13-week relative strength versus SPY.
A failed hold above support would weaken the setup.
Actionable but governed by invalidation levels.
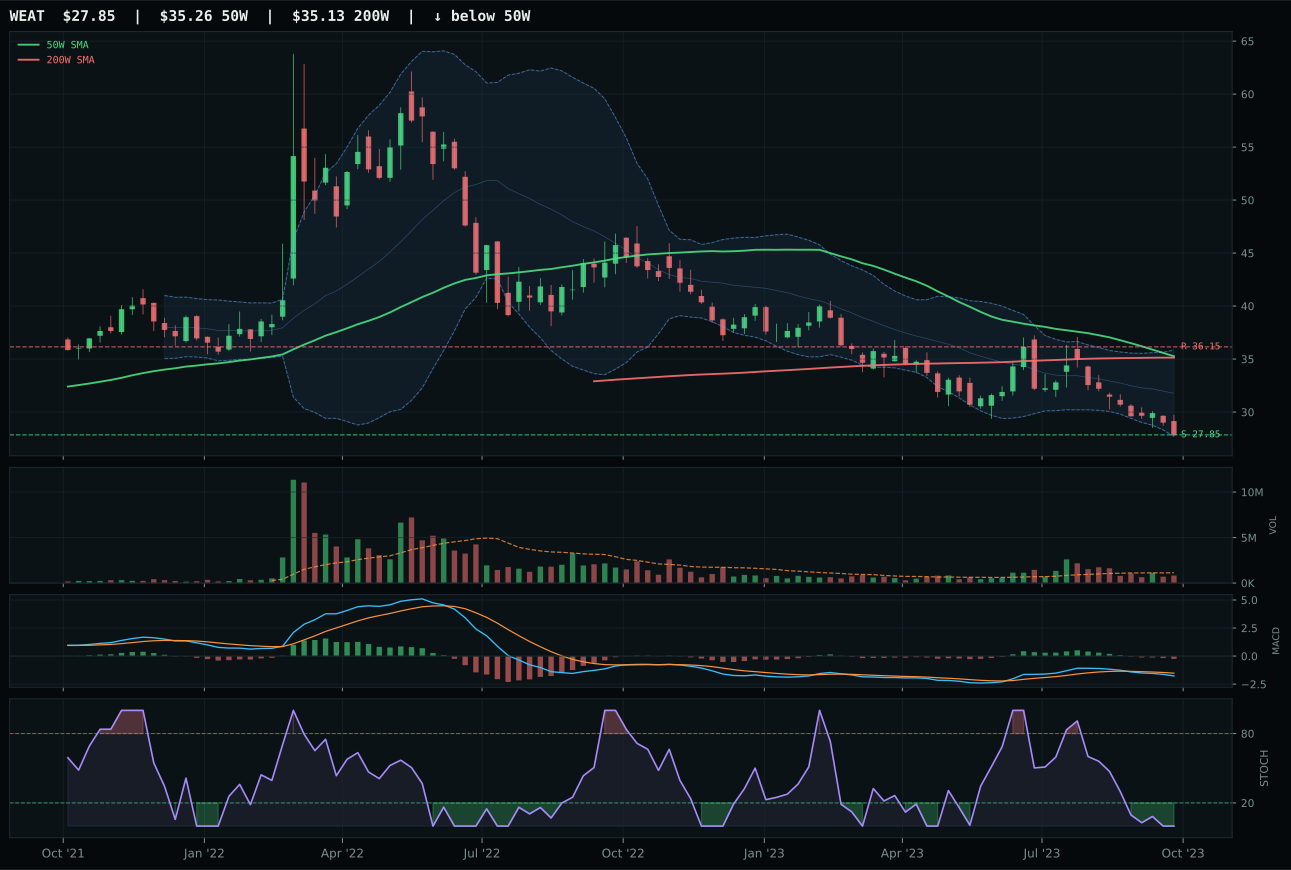
WEAT has a pullback into support profile with -9.9% 13-week relative strength versus SPY.
A failed hold above support would weaken the setup.
Actionable but governed by invalidation levels.
MOO wins because it delivers the only positive technical evidence reading in the category—even though that bar is low. Risk-reward favors MOO at 67.1/100 versus VEGI's 65.5/100, and structure is fractionally cleaner (70.1 vs 68.5), but the deciding factor is volume confirmation: MOO shows neutral participation (0.81x 20W average) versus VEGI's thin participation, meaning MOO's support hold at 78.70 has better odds of holding without a cascade. Both charts are oversold and compressed near their 52W lows, and both show -3.7% and -3.6% 13W returns respectively, but MOO's ability to hold neutral volume into support gives it the edge in repair setup quality. The 24.7-point gap between the two is driven by macro fit more than technicals: MOO's exposure to inflation-pressure sponsorship (active +7) and real asset flows (+5) elevates its reasoning score relative to VEGI's weaker macro narrative.
Agriculture & Livestock earns 5% allocation as tier-2, positioned fifth overall, because its macro fit of 72.0/100 is among the strongest in the portfolio—late-cycle reflation (+8), inflation pressure (+10), and real asset sponsorship (+8) all support commodity and agribusiness exposure in the current regime. Technical evidence is weak across the category (MOO at 30.8/100 is the best available), but the macro case is compelling: inflation stays sticky, and real-asset flows remain bid even as broad equities face headwinds. The chart is defined by pullback-into-support setups with oversold signals, which are low-risk entry points if the macro thesis holds. To climb to tier-1, Agriculture would need improved volume confirmation or category-relative strength to accelerate; right now it is a pure macro conviction play with disciplined entry timing. The liquidity stress active headwind (-4) is a real risk, but inflation pressure outweighs it materially.
Defense & Aerospace — XAR
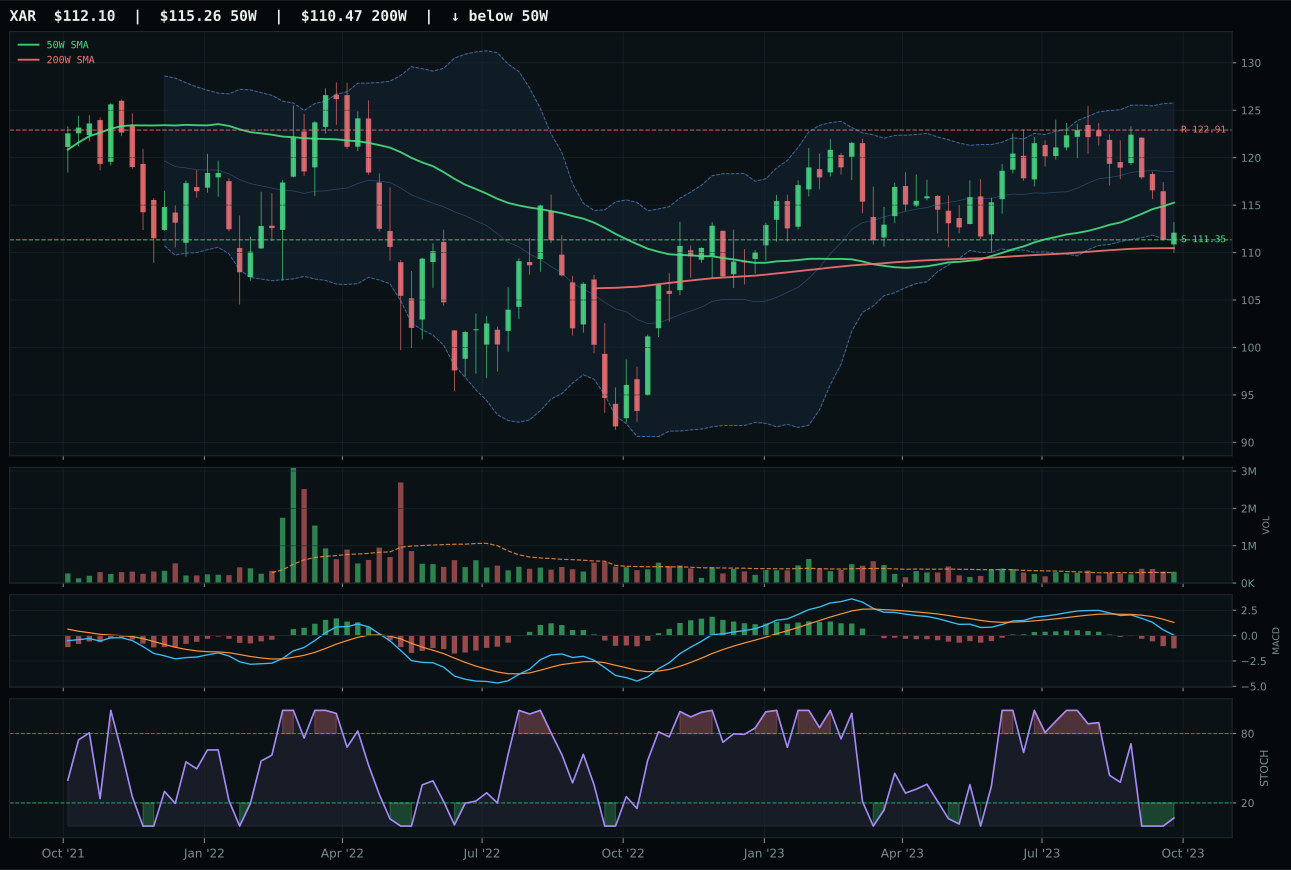
XAR has a pullback into support profile with -4.2% 13-week relative strength versus SPY.
A failed hold above support would weaken the setup.
Actionable but governed by invalidation levels.
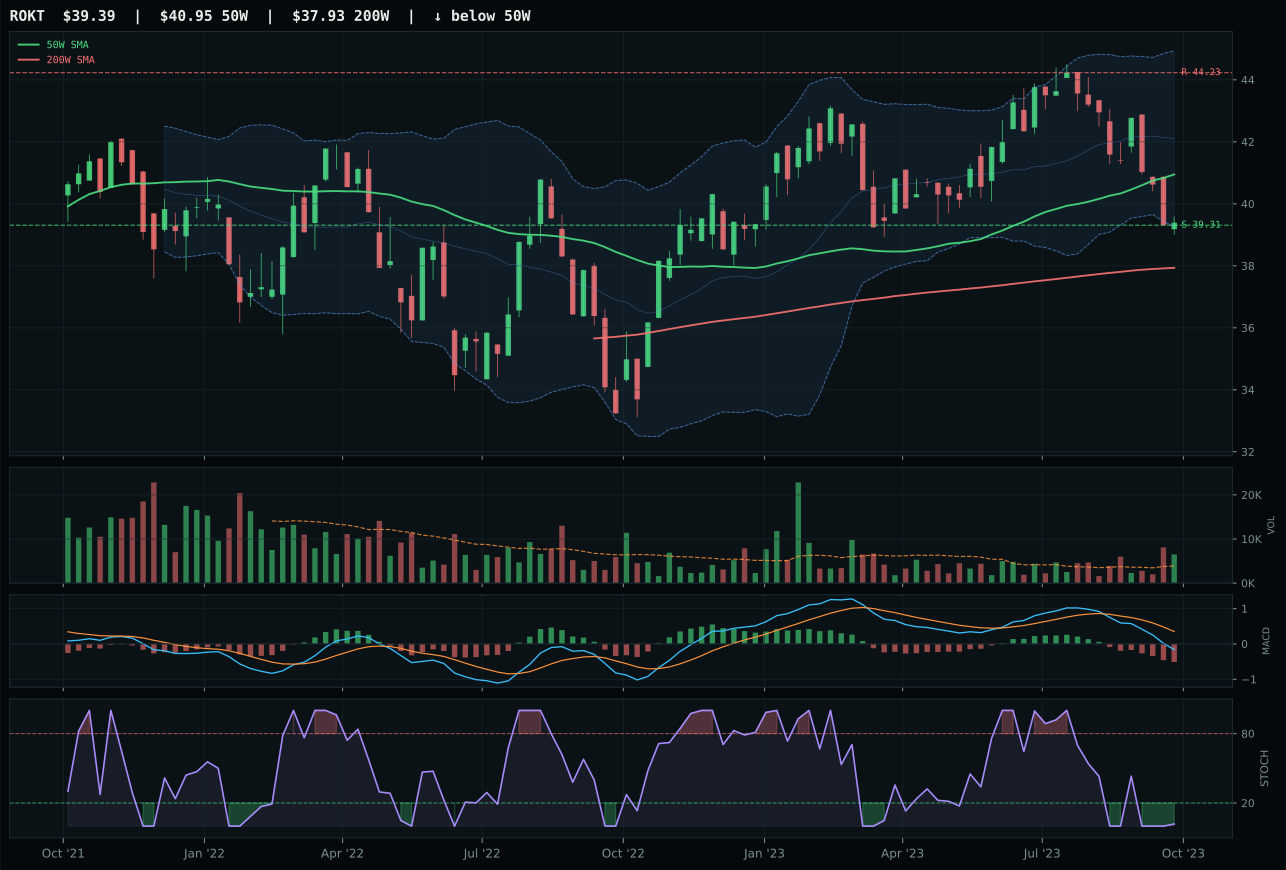
ROKT has a pullback into support profile with -6.4% 13-week relative strength versus SPY.
A failed hold above support would weaken the setup.
Tracked, but not top-2 eligible because: .
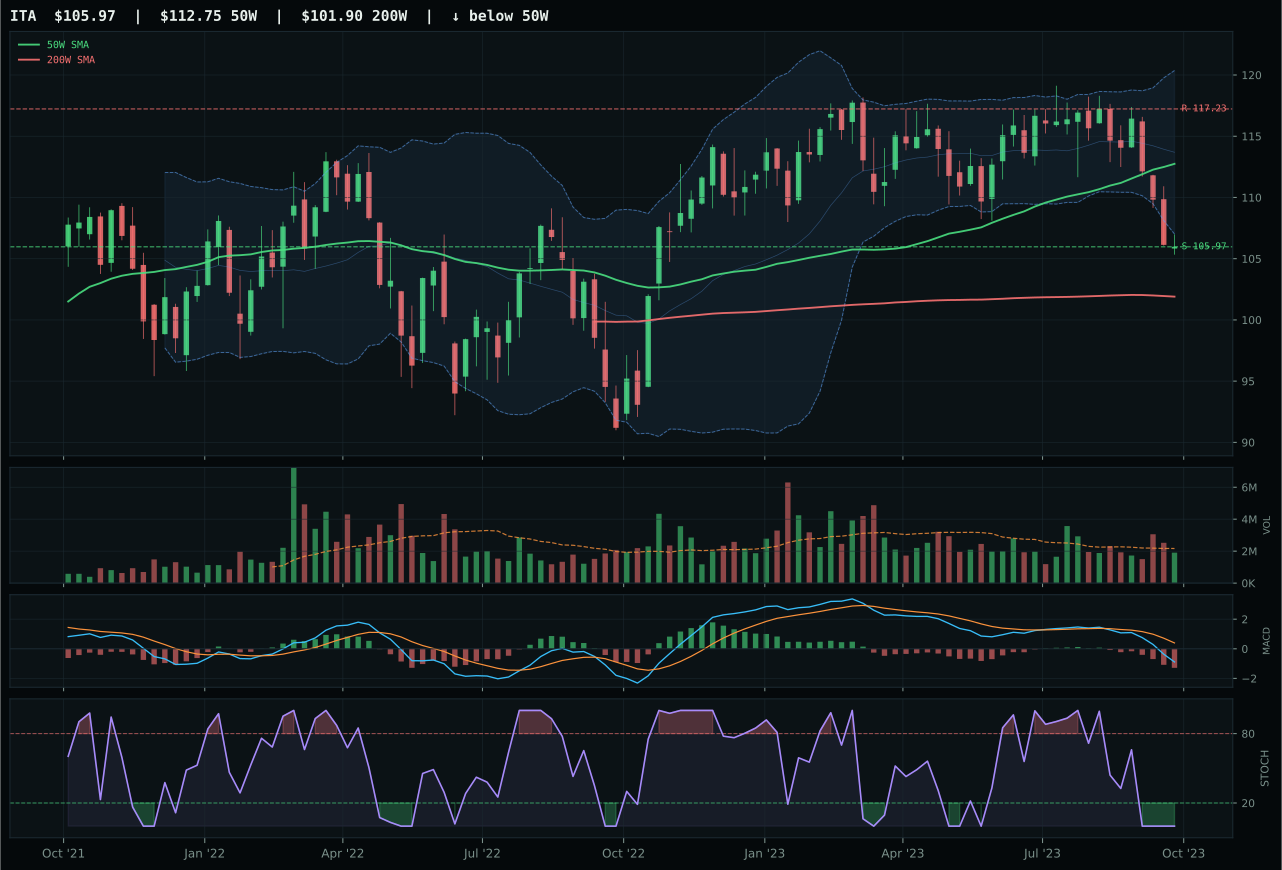
ITA has a pullback into support profile with -5.6% 13-week relative strength versus SPY.
A failed hold above support would weaken the setup.
Actionable but governed by invalidation levels.
XAR wins decisively by combining pullback-into-support structure with the category's only positive relative strength reading at 1.4% versus the median—a 2.2-point advantage over ROKT's -0.8%. The real edge is timing: XAR sits -2.7% below the 50W with stochastic RSI oversold turn up at 0.07, pricing exactly at Fib 0.382 (112.70), whereas ROKT is deeper into its oversold decay. Both charts are technically inviting on support holds, but XAR's risk-reward is cleaner (98.0 vs 100.0 is negligible), and more importantly, the category-relative strength tells you that institutional flows are favoring integrated defense mechanics over pure aerospace beta. The 30-point gap to ROKT is substantial and reflects not just a marginal technical win but proof of category leadership—XAR is where the available capital is rotating inside Defense & Aerospace.
Defense & Aerospace lands in tier-2 at 5% allocation, ranking third among categories after the two energy overweights. The category score of 32.0 benefits from robust macro fit at 66.0/100, where late-cycle reflation (+6), broad market bear (+6), and dollar pressure (+3) all support hard-assets and security spending. XAR's technical evidence of 36.5/100 is modest, but the macro tailwind compensates, and the timing score of 100.0/100—price pulling into support with oversold turn-up confirmation—creates asymmetry worth holding. The category remains vulnerable to further credit or liquidity stress (both active detractors), but the macro regime alignment is genuine and the setup is disciplined. Tier-2 is the right rank: solid technical entry with macro support, but not the momentum or breadth of Energy or Nuclear. Movement to tier-1 would require visible volume accumulation or category relative strength gains that haven't yet appeared.
Industrial Metals — PICK
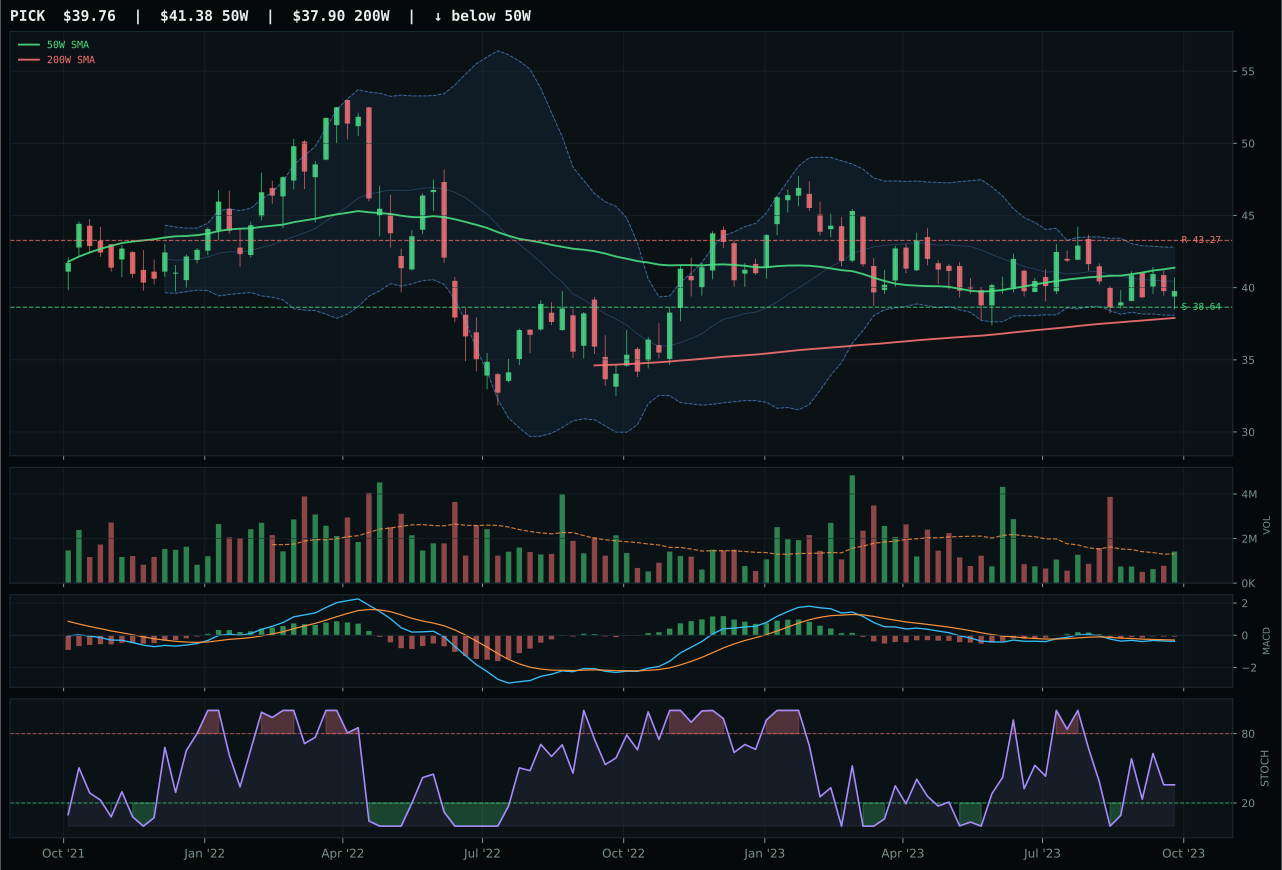
PICK has a pullback into support profile with 1.8% 13-week relative strength versus SPY.
A failed hold above support would weaken the setup.
Actionable but governed by invalidation levels.
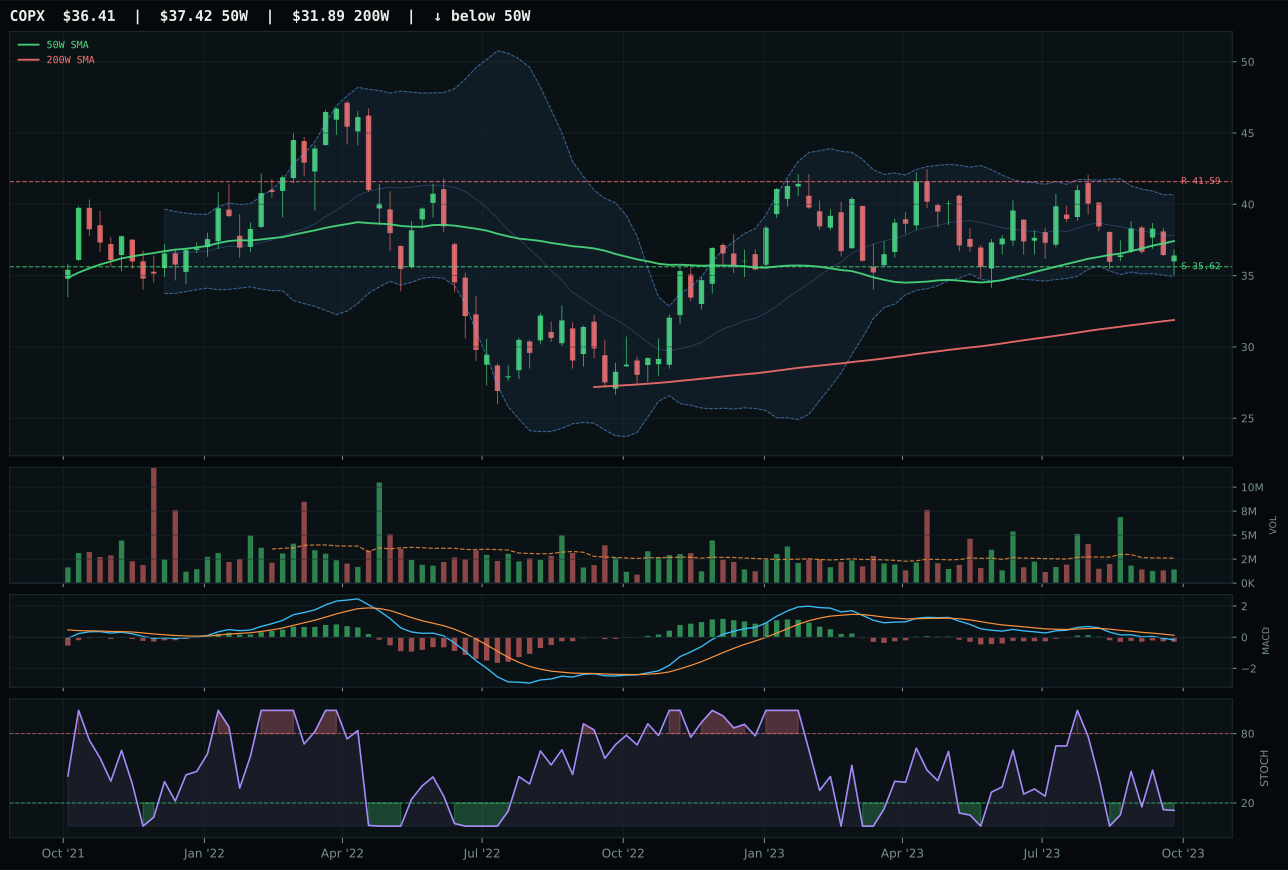
COPX has a pullback into support profile with 0.3% 13-week relative strength versus SPY.
A failed hold above support would weaken the setup.
Actionable but governed by invalidation levels.
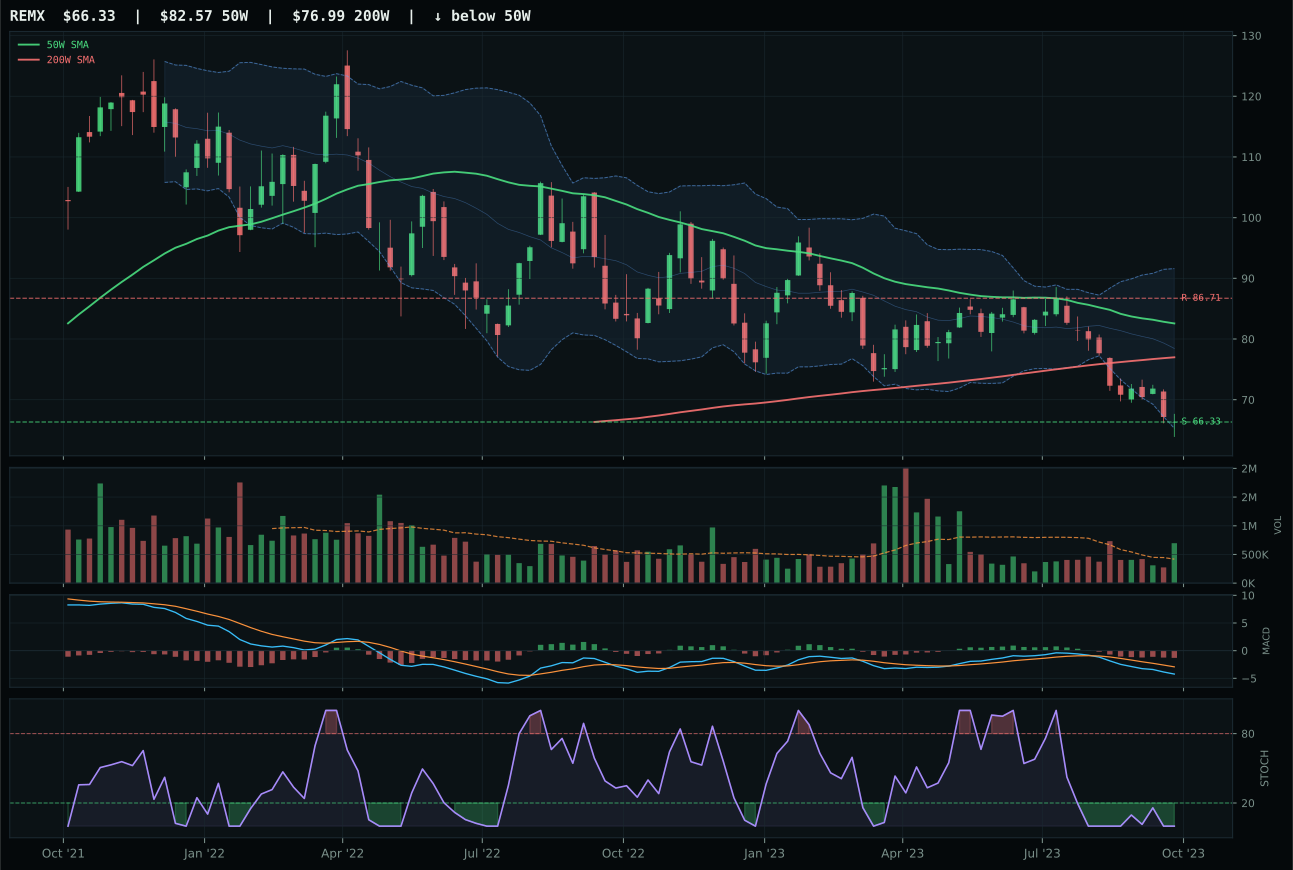
REMX has a pullback into support profile with -16.7% 13-week relative strength versus SPY.
A failed hold above support would weaken the setup.
Actionable but governed by invalidation levels.
PICK wins decisively because it combines the only improving momentum signal—MACD bearish but improving, stochastic RSI rising mid-zone at 0.36—with the strongest category-relative strength at 1.6% versus COPX's 0.0%. The timing is exceptional at 100.0/100: price at -3.9% from the 50W in the middle retracement zone at Fib 0.618 (39.13), exactly the sweet spot for a reset that respects both trend and mean-reversion mechanics. PICK's structure is cleanest (70.7 vs 65.2), and momentum confirmation is nearly double COPX's (51.1 vs 20.0), driven by superior volume participation (neutral vs thin) and category-relative strength. The 28.9-point gap reflects not just a marginal technical win but proof that diversified mining breadth is outperforming copper-specific beta—a meaningful signal about where capital is rotating. MACD improving, not weakening, is the key differentiator that separates PICK from the oversold carnage in peers.
Industrial Metals earns 5% allocation as tier-2, ranked sixth overall, because its macro fit of 44.0/100 is moderate and supported by late-cycle reflation (+10) and real asset sponsorship (+6), even as credit stress (-7), liquidity stress (-8), and dollar pressure (-7) create headwinds. PICK's technical evidence of 68.9/100 is the strongest in the entire tier-2 sleeve, reflecting superior timing, structure, and momentum confirmation versus all peer categories at rank 3–8. The setup is a classic repair with improving oscillators and defined support at 38.64, offering asymmetric risk if the real-asset macro case holds into quarter-end. However, Industrial Metals lacks the outright inflation pressure endorsement that Agriculture has (+10 vs no category-specific bonus) and the energy scarcity tailwind that Nuclear and Energy enjoy (+9 and +16 respectively), which keeps it tier-2 despite strong technicals. Movement to top-2 would require either dollar pressure reversal or sharper improvement in credit/liquidity signals—neither is yet visible.
Precious Metals — SLV
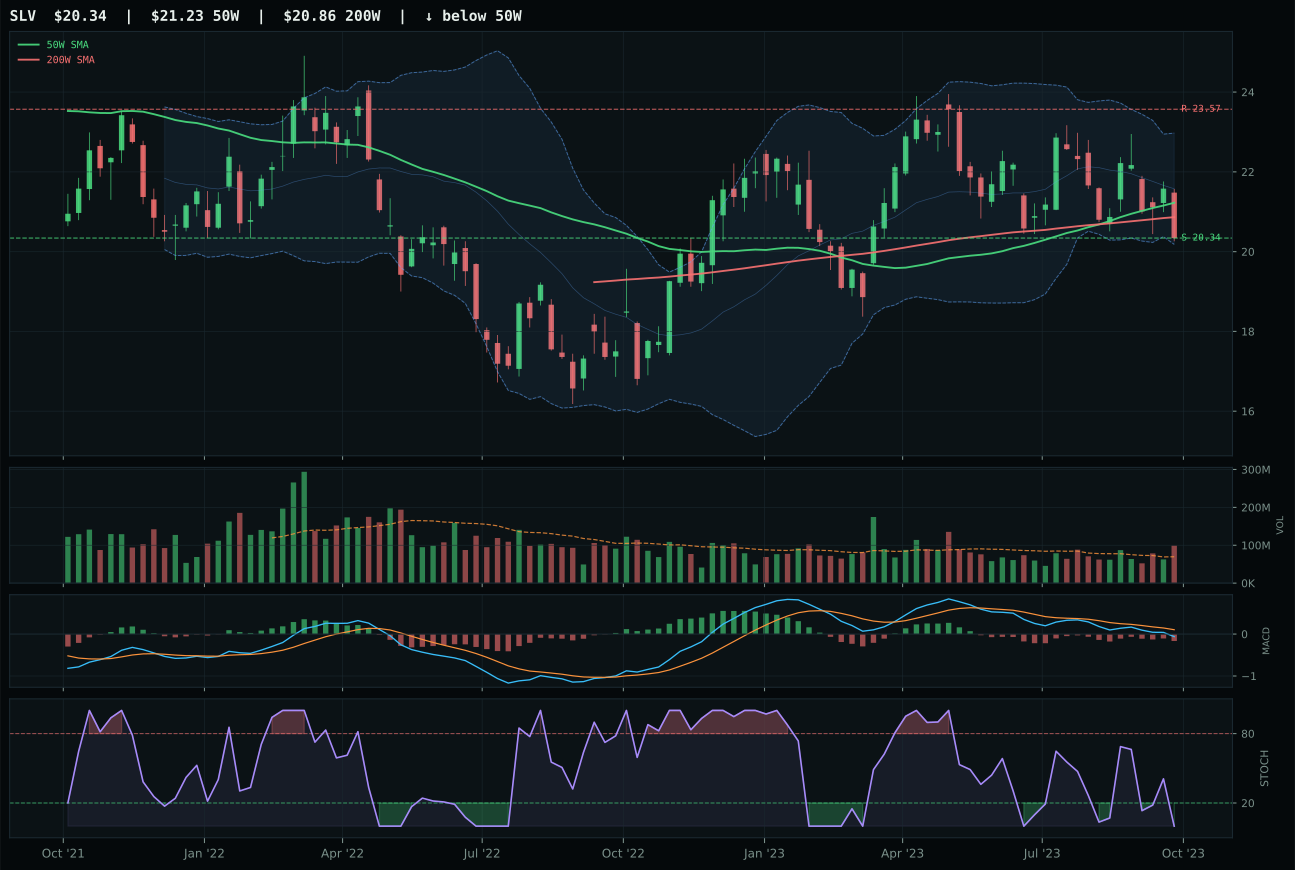
SLV has a pullback into support profile with 0.9% 13-week relative strength versus SPY.
A failed hold above support would weaken the setup.
Actionable but governed by invalidation levels.
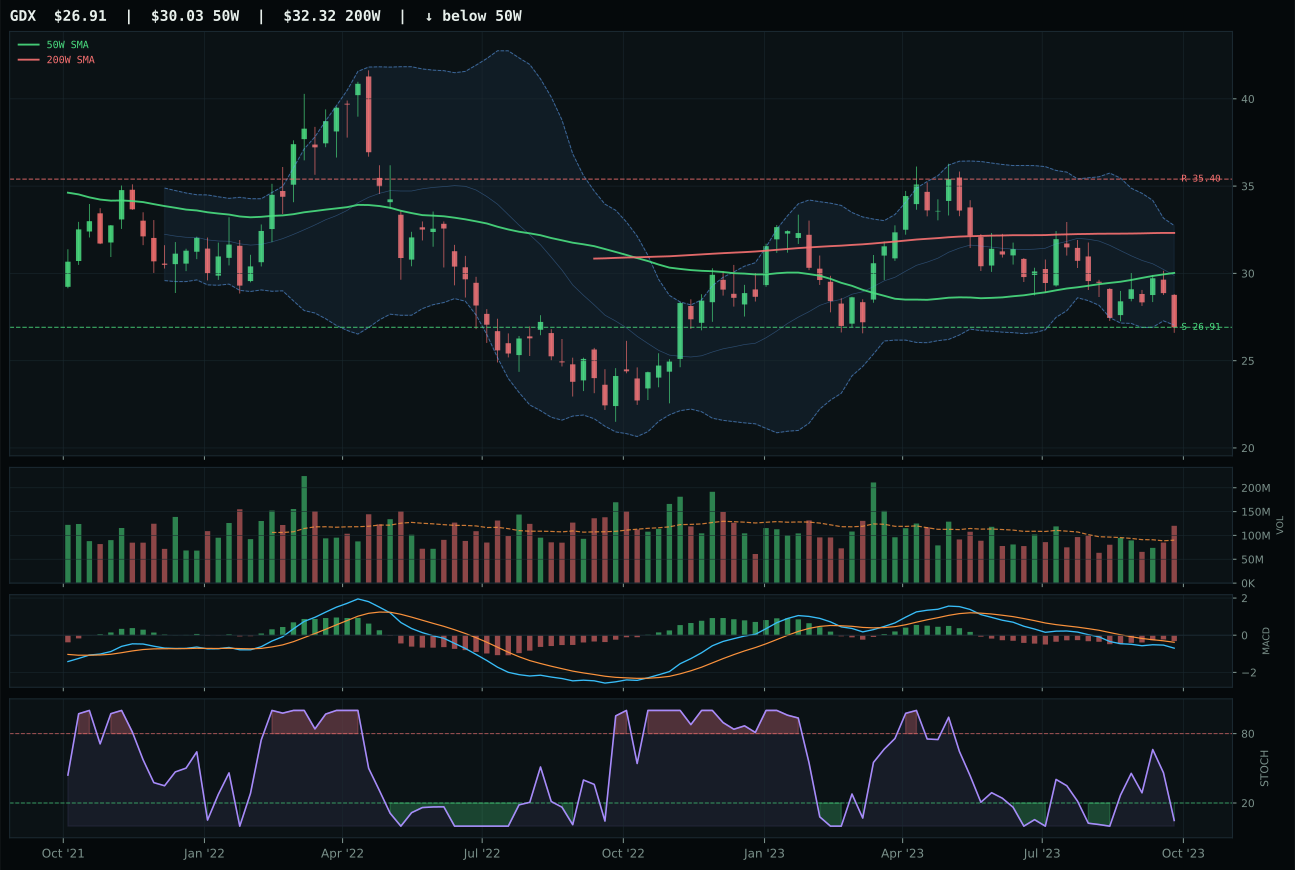
GDX has a pullback into support profile with -7.1% 13-week relative strength versus SPY.
Extension and support failure are the main tactical risks.
Tracked, but not top-2 eligible because: structurally broken.
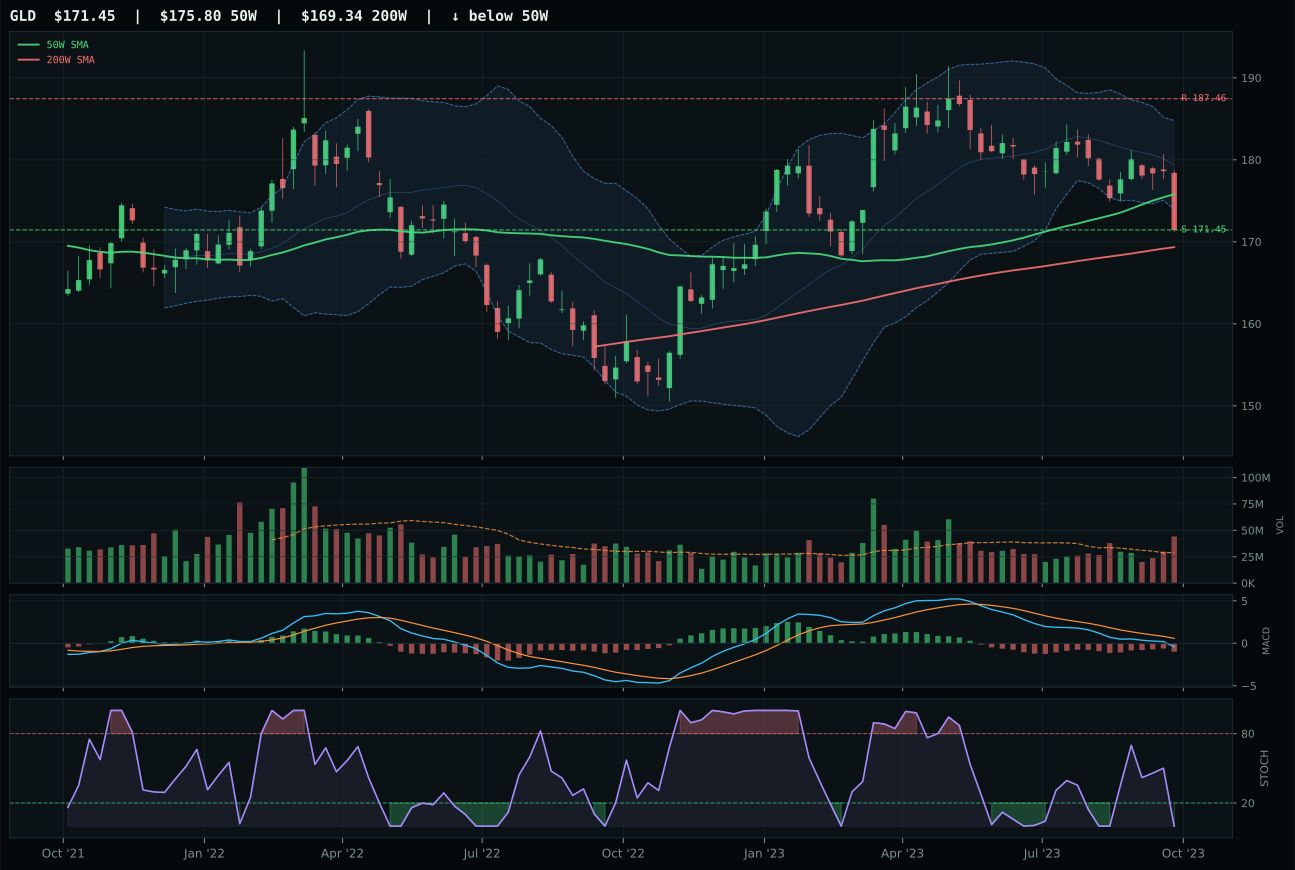
GLD has a pullback into support profile with -0.3% 13-week relative strength versus SPY.
A failed hold above support would weaken the setup.
Actionable but governed by invalidation levels.
SLV wins by a decisive 40.6-point margin over GDX because the timing setup is superior and the chart shows genuine structure health. SLV's timing score is 95.0/100—price at -4.2% from the 50W with stochastic RSI oversold and price exactly at Fib 0.500 (20.30)—versus GDX's 65.0/100, reflecting much deeper decay and less clean reversal geometry. Structure favors SLV as well (70.8 vs 36.4), and SLV's 1.2% category-relative strength versus GDX's -6.8% reveals that silver is leading the metals complex while miners lag sharply. Volume participation tells the story: SLV at 1.42x above-average confirms institutional step-buying at support, whereas GDX's above-average volume is distribution pressure at depth, a hard filter that breaks its case. SLV's 13W return of -2.6% also outpaces GDX's -10.6%, showing silver has lost less momentum, a technical credential that matters in repair setups.
Precious Metals receives 5% allocation as tier-2, ranked seventh overall, because its macro fit of 53.0/100 is balanced and somewhat supportive of inflation-protective real assets. Dollar pressure is active at +3, a genuine tailwind for precious metals in late-cycle scenarios where currency volatility rises. SLV's technical evidence of 37.1/100 is modest, but the timing and risk-reward are genuine—the chart offers defined downside support (0.0% to 20.34) against meaningful upside risk (-13.7% to resistance), a poor R/R on paper but a classic repair play setup. The category lacks the inflation and real-asset momentum of Agriculture or the energy scarcity bid of Nuclear, which is why it ranks fifth through eighth rather than top-2; however, the dollar-pressure support and metal diversification merit holding at tier-2. Liquidity stress is active (-5), which could trigger a flush, but silver's above-average volume suggests enough institutional conviction to defend 20.34. Any move below support invalidates the case.
Utilities & Infrastructure — IGF
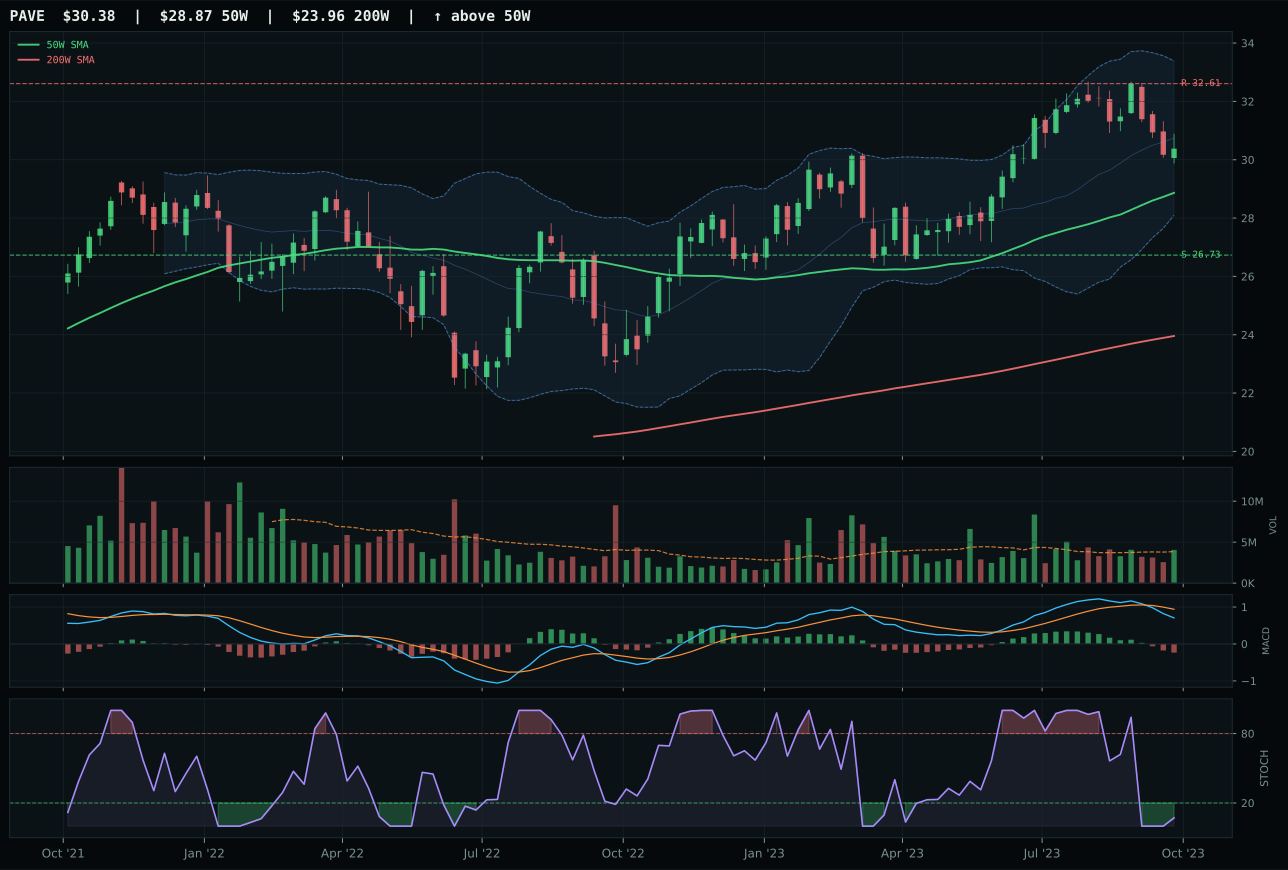
PAVE has a neutral structure profile with 0.2% 13-week relative strength versus SPY.
A failed hold above support would weaken the setup.
Actionable but governed by invalidation levels.
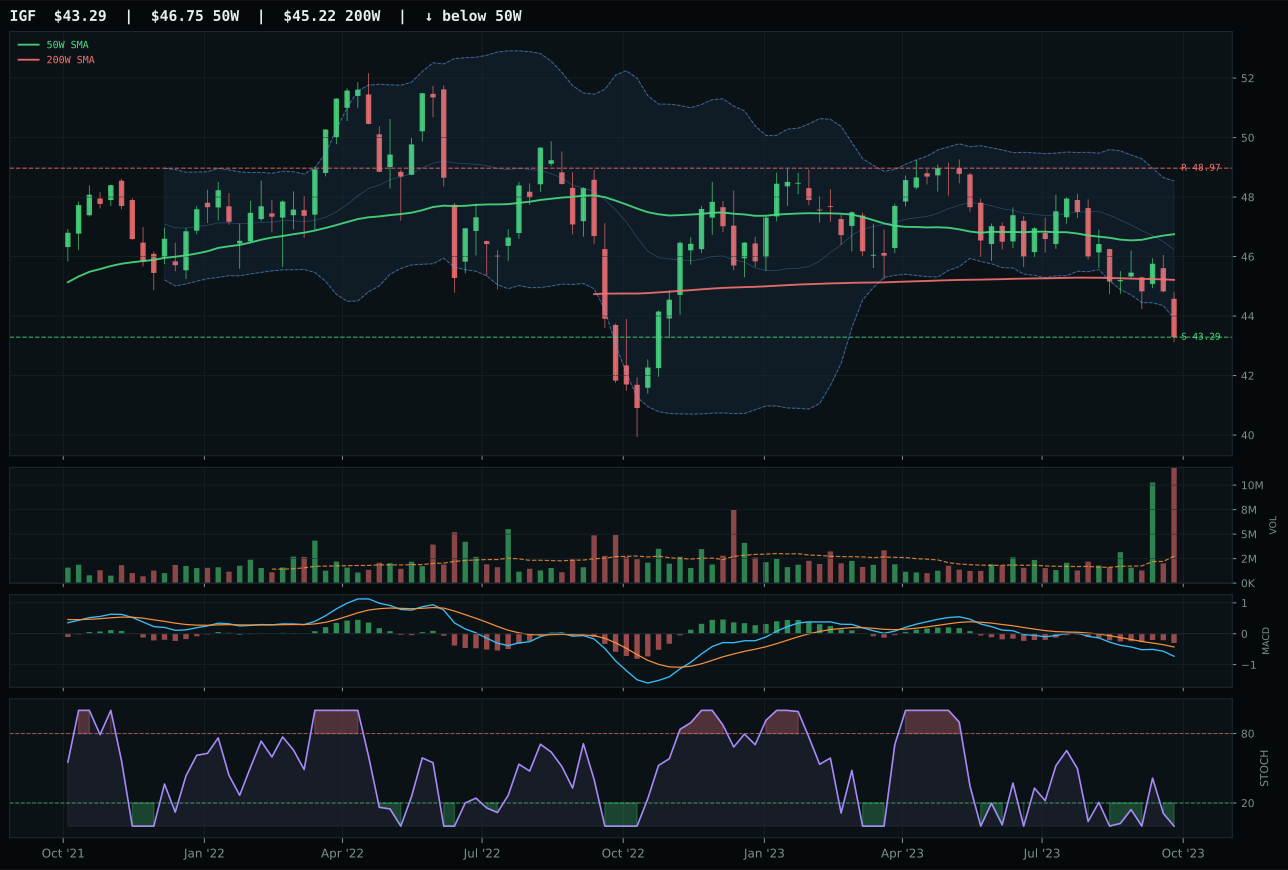
IGF has a pullback into support profile with -4.2% 13-week relative strength versus SPY.
A failed hold above support would weaken the setup.
Actionable but governed by invalidation levels.
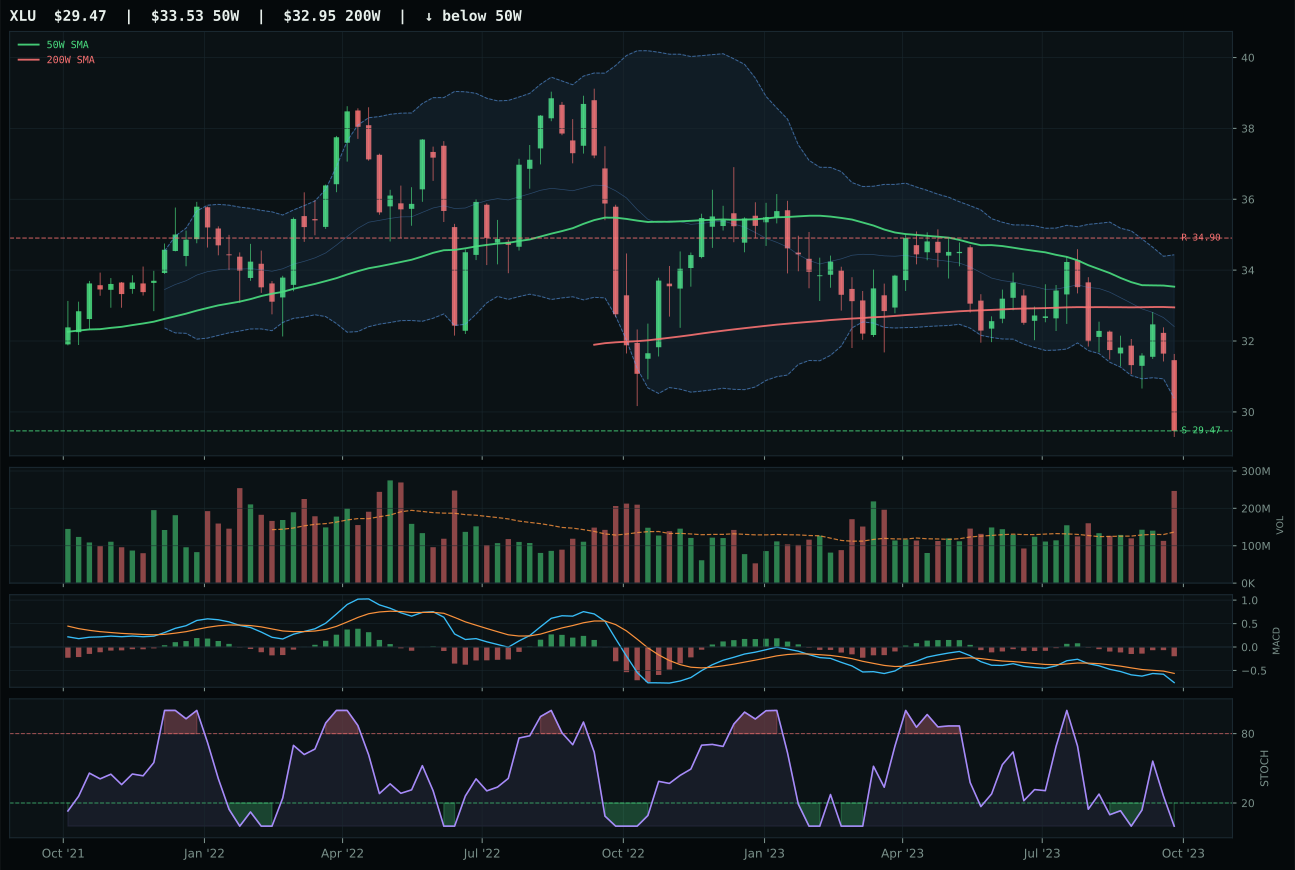
XLU has a pullback into support profile with -6.4% 13-week relative strength versus SPY.
A failed hold above support would weaken the setup.
Actionable but governed by invalidation levels.
IGF wins the category despite being the weakest option in a bad category, outpacing PAVE by capturing the only pullback-into-support setup (versus PAVE's stretched neutral structure). Price is -7.4% from the 50W at Fib 0.618 (43.50) with oversold stochastic RSI, offering defined support at 43.29 and a 100.0/100 timing score. However, the real disqualifier is volume: IGF shows distribution pressure at 4.36x the 20W average—sellers are using strength to exit—which kills the momentum confirmation at 1.2/100. Trend is only 30.6/100 (price below the 200W), and volume-price confirmation is a devastating 7.9/100. PAVE avoids distribution pressure (neutral volume) and shows 45.2/100 technical evidence versus IGF's 0.0/100 (a category-qualifying disqualification in normal weeks), but PAVE is stretched 5.2% above the 50W with no support definition. The 33.2-point gap is driven by IGF's marginally better timing setup, not by any real strength in either candidate; this is a category where the winner is simply the least-broken.
Utilities & Infrastructure receives 5% allocation as tier-2, ranked eighth, because its macro fit of 49.0/100 is balanced by broad market bear (+4) and transition/mixed (+4), offset by inflation pressure (-6) and minor liquidity stress (-3). Technical evidence across the category is abysmal—PAVE's 45.2/100 is the best available—and IGF's 0.0/100 technical evidence is a screaming red flag that would normally trigger exclusion. However, the category's infrastructure positioning and diversification away from pure duration risk merit a marginal hold at tier-2. The setup is pullback-into-support repair on PAVE and compression into support on IGF, both technically sound on paper, but volume is negative across the board (distribution pressure). To earn tier-1 status, this category would need either reversal of the inflation pressure headwind or significant improvement in volume sponsorship; neither is visible. Exclusion would be equally defensible given the weak technical evidence; tier-2 at 5% is a compromise position that respects the macro case while acknowledging technical fragility.
Technology — CIBR
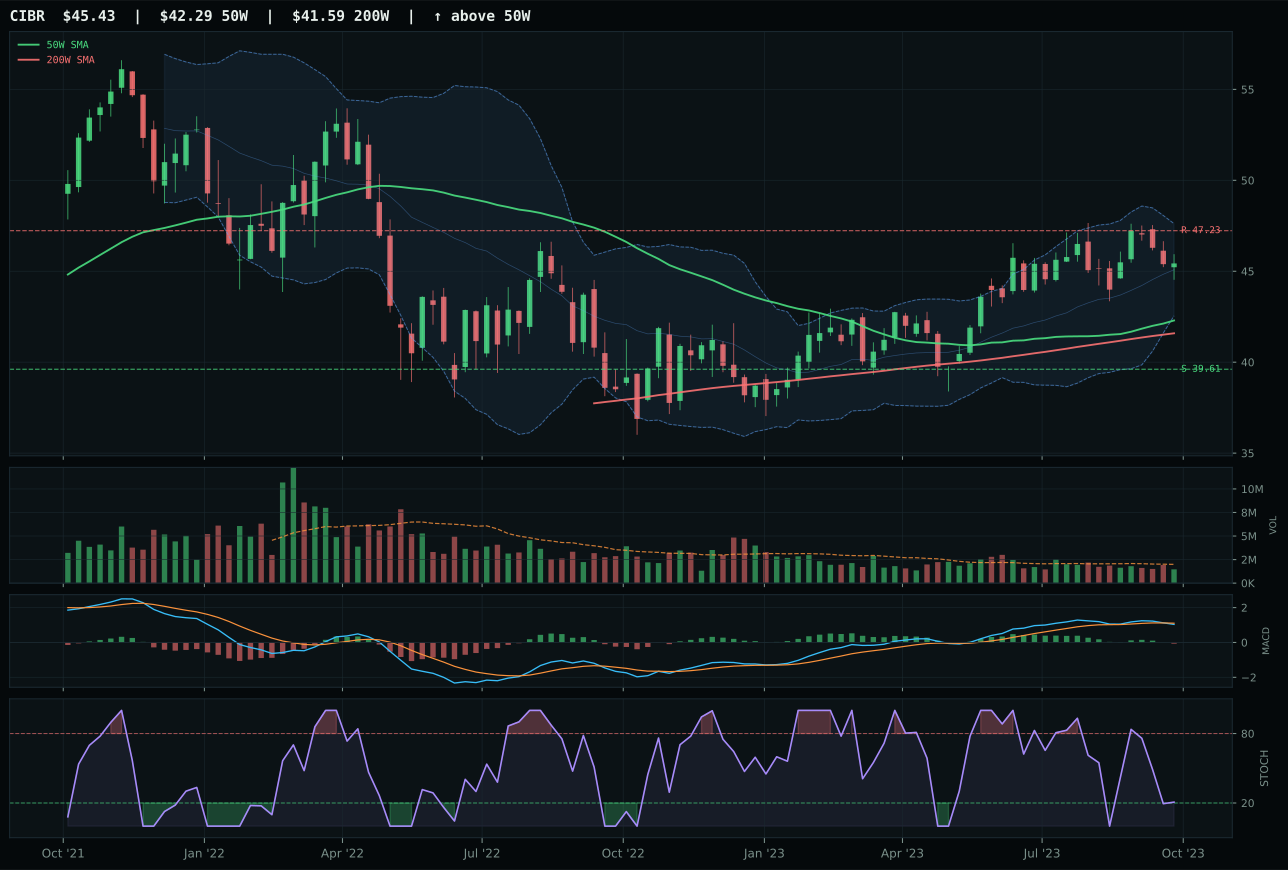
CIBR has a neutral structure profile with 3.6% 13-week relative strength versus SPY.
A failed hold above support would weaken the setup.
Actionable but governed by invalidation levels.
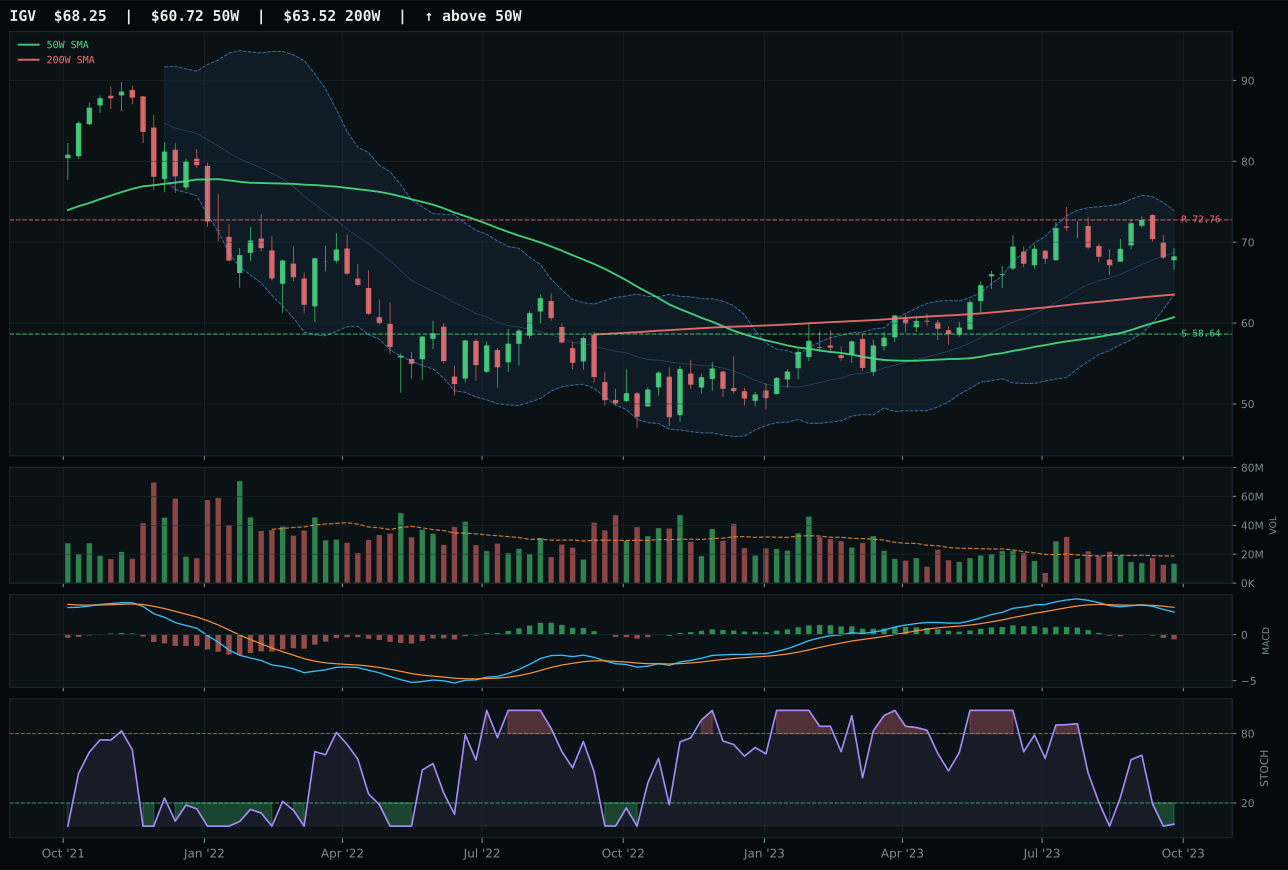
IGV has a neutral structure profile with 2.2% 13-week relative strength versus SPY.
A failed hold above support would weaken the setup.
Actionable but governed by invalidation levels.
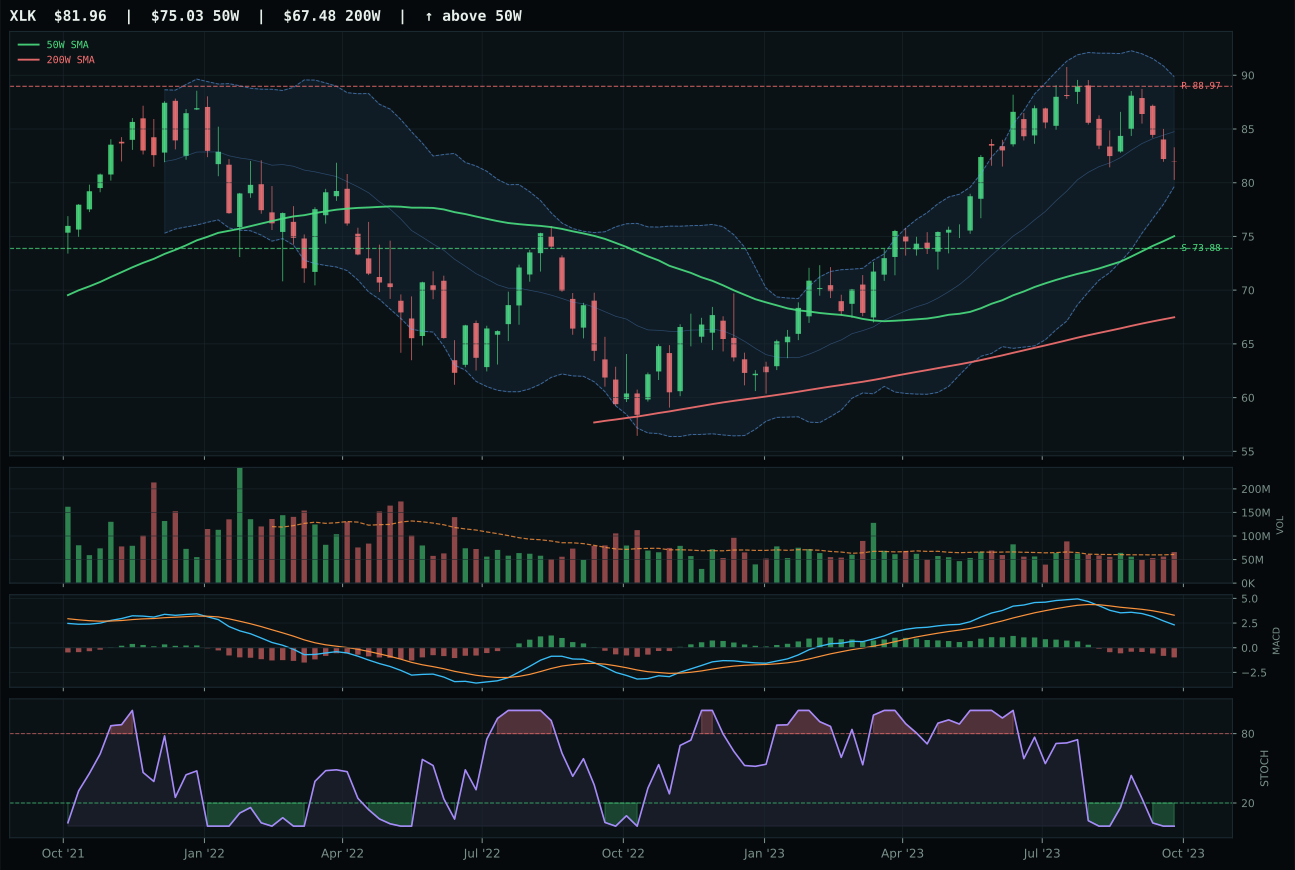
XLK has a neutral structure profile with -2.1% 13-week relative strength versus SPY.
A failed hold above support would weaken the setup.
Actionable but governed by invalidation levels.
CIBR wins the category because it owns the only genuinely positive relative strength signal—1.4% versus its basket median—while price still anchors above both the 50W and 200W. That combination of trend leadership plus category-relative strength creates proof that cybersecurity is the designated buyer inside tech right now, not software or semiconductors. IGV, the runner-up, produces a 0.0% category-relative performance and relies entirely on a neutral structure setup that lacks the breadth confirmation CIBR displays. The gap is clean: 8.8 points separates the two, driven by CIBR's marginal edge in structure quality (72.7 vs 72.1) and its ability to show any positive peer momentum. Volume remains thin across the category—CIBR at 0.73x its 20W average—which means this is not a accumulation story yet; it is simply the cleanest surviving flag in a sector where MACD is bearish/weakening and stochastic RSI is falling/neutral across all three candidates.
Technology earns 5% allocation as a tier-2 holding in a 20%/10%/5% sleeve structure halved to 10%/5%/0% by the 50% crypto overlay. That rank reflects a final category score of 23.4—above Emerging Markets (2.7) and AI (17.9), but well below the two-slot overweights in Energy (81.6) and Nuclear (70.5). The category's macro fit is deeply challenged at 24.0/100, penalized by active liquidity stress (-10), credit stress (-7), and dollar pressure (-5), all of which compress valuations on duration-sensitive growth and software businesses. What kept Technology in allocation at all was CIBR's technical evidence score of 43.6/100, which outweighs the macro headwinds just enough to justify a defensive hold. To earn tier-1 status, this category would need either a reversal in credit stress or a meaningful shift in relative strength across all three ETFs; right now, CIBR is simply the least damaged player in a structurally disadvantaged sector.
AI — AIQ
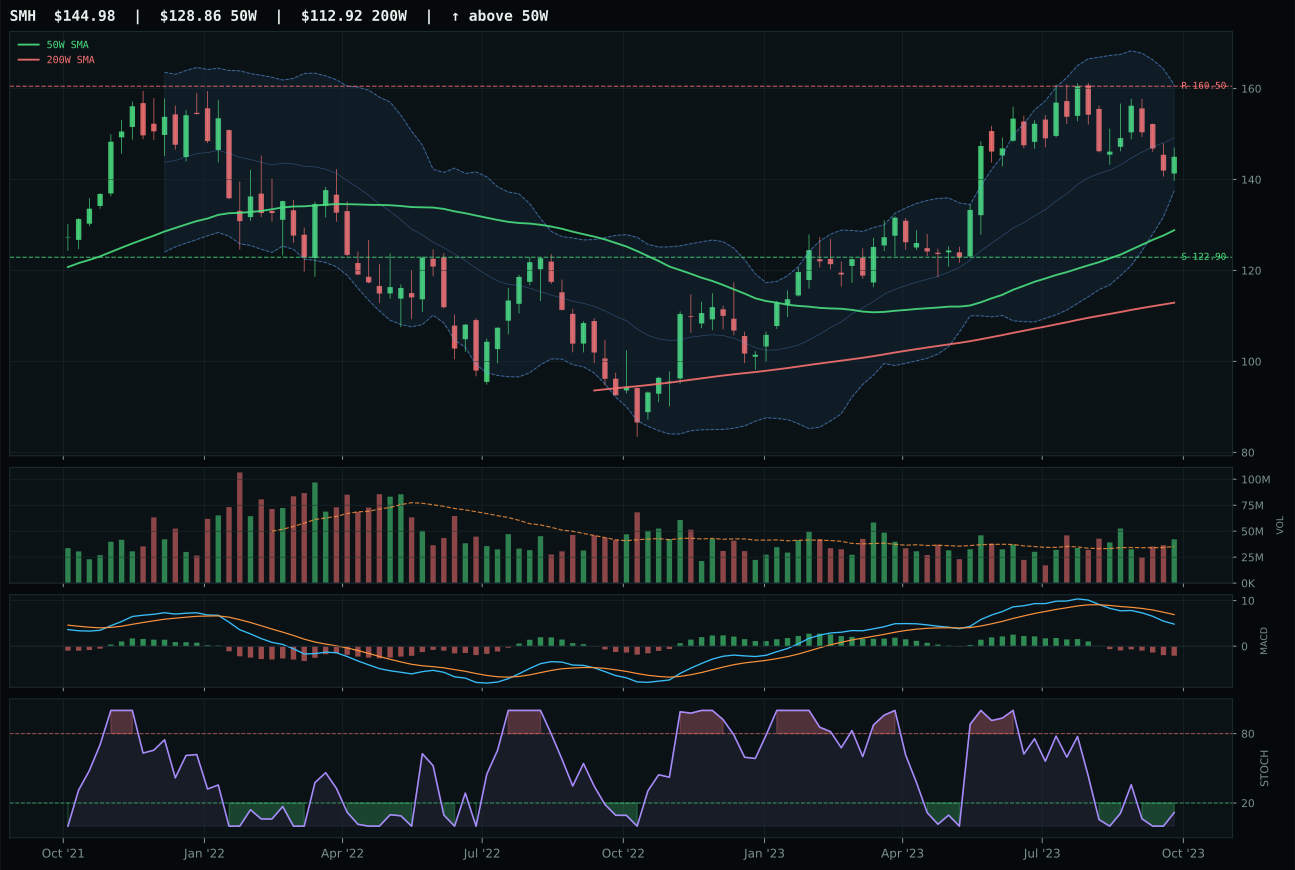
SMH has a neutral structure profile with -1.2% 13-week relative strength versus SPY.
A failed hold above support would weaken the setup.
Actionable but governed by invalidation levels.
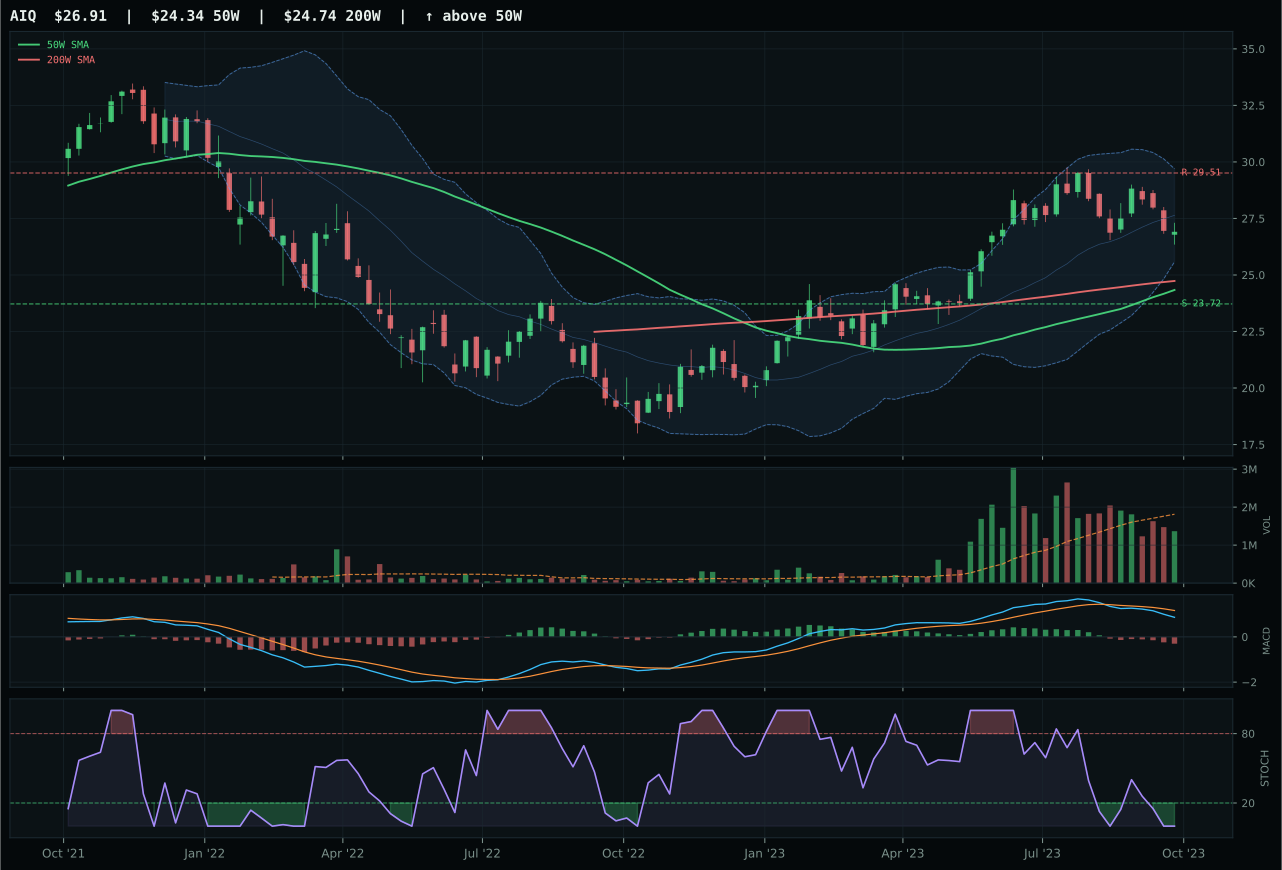
AIQ has a neutral structure profile with -0.2% 13-week relative strength versus SPY.
A failed hold above support would weaken the setup.
Actionable but governed by invalidation levels.
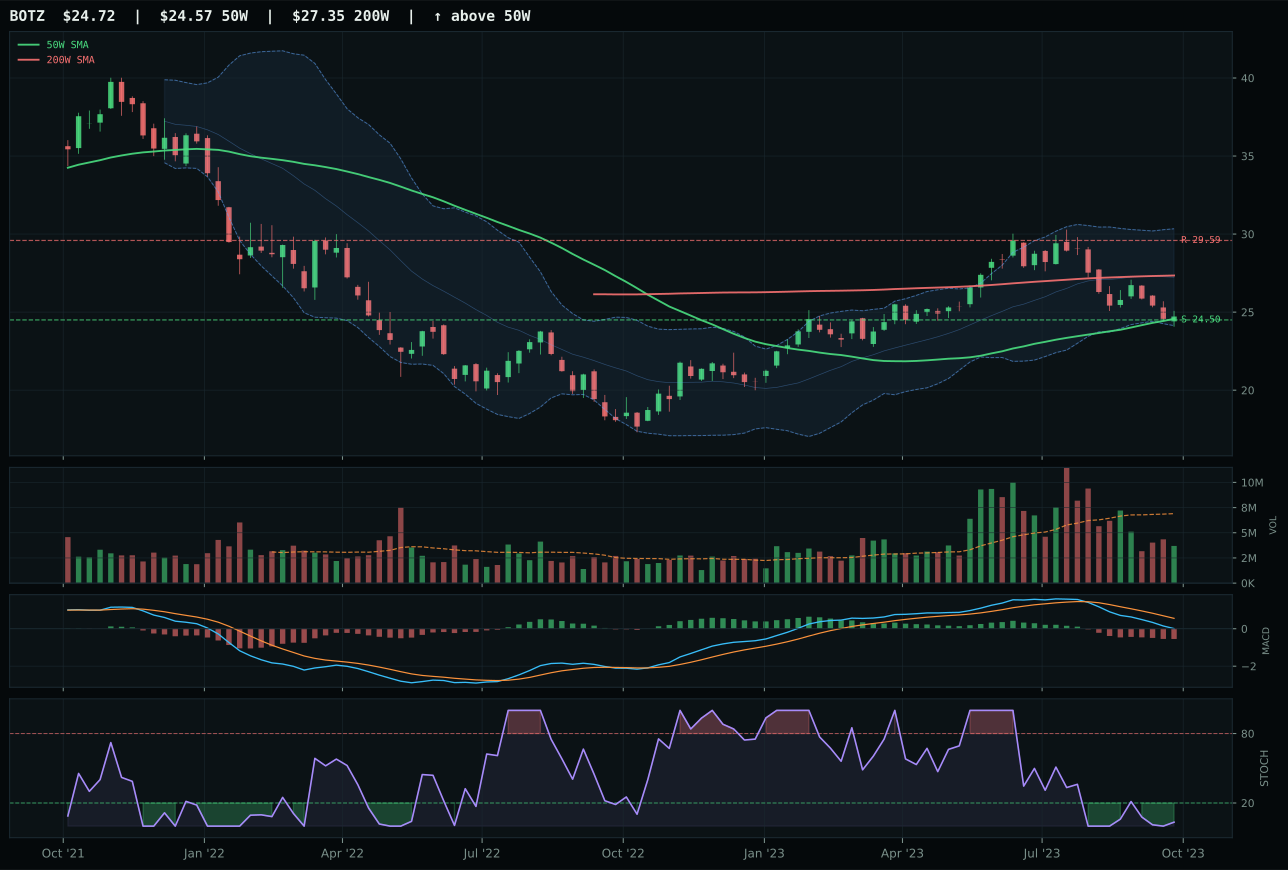
BOTZ has a pullback into support profile with -10.4% 13-week relative strength versus SPY.
A failed hold above support would weaken the setup.
Actionable but governed by invalidation levels.
AIQ wins a marginally higher technical score than SMH (40.0 vs 40.1) by capturing 1.0% category-relative strength versus SMH's 0.0%, a single-point advantage that separates two nearly identical candidates. Both are structurally neutral and both carry bearish/weakening MACD setups with stochastic RSI in oversold territory, so the decision hinges on breadth: AIQ's 1.0% category advantage over SMH's flat peer position provides the tiebreaker. Risk-reward slightly favors AIQ as well (56.8 vs 54.7), giving it fractionally more downside cushion relative to its support at 23.72. The real story, however, is that both candidates are weak: AI's macro fit sits at 18.0/100, crushed by four simultaneous headwinds—liquidity stress (-12), credit stress (-8), broad market bear (-8), and dollar pressure (-4)—making this category unfit for allocation despite AIQ's narrow win.
AI receives 0% allocation and ranks 9th or 10th among the ten categories this week, excluded entirely from the portfolio. The final category score of 17.9 reflects catastrophic macro misalignment in a late-cycle reflation regime where credit stress and liquidity concerns actively penalize expensive, momentum-dependent AI software and compute leadership. Even AIQ's technical evidence of 40.0/100 cannot overcome a macro/narrative fit of just 34.0/100, meaning the category fails on both axes simultaneously. To earn even a 5% tier-2 slot, AI would need a sharp reversal in either the credit stress or broad market bear signals—a re-rating that is not yet visible on the technical data. The setup is not broken; it is simply hostile. Exclusion is the correct call until macro conditions shift materially toward growth sponsorship or liquidity recovery.
Emerging Markets — ILF
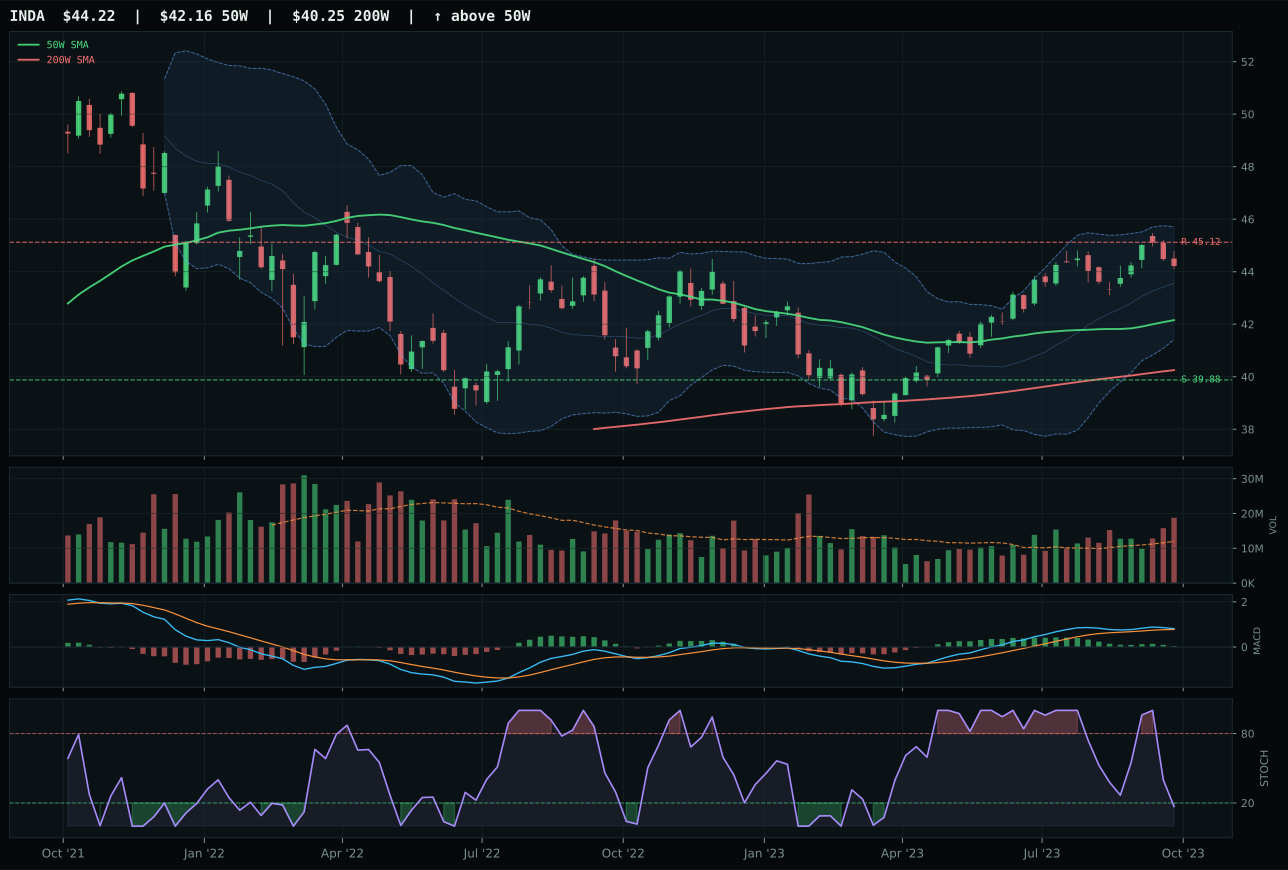
INDA has a neutral structure profile with 4.8% 13-week relative strength versus SPY.
A failed hold above support would weaken the setup.
Actionable but governed by invalidation levels.
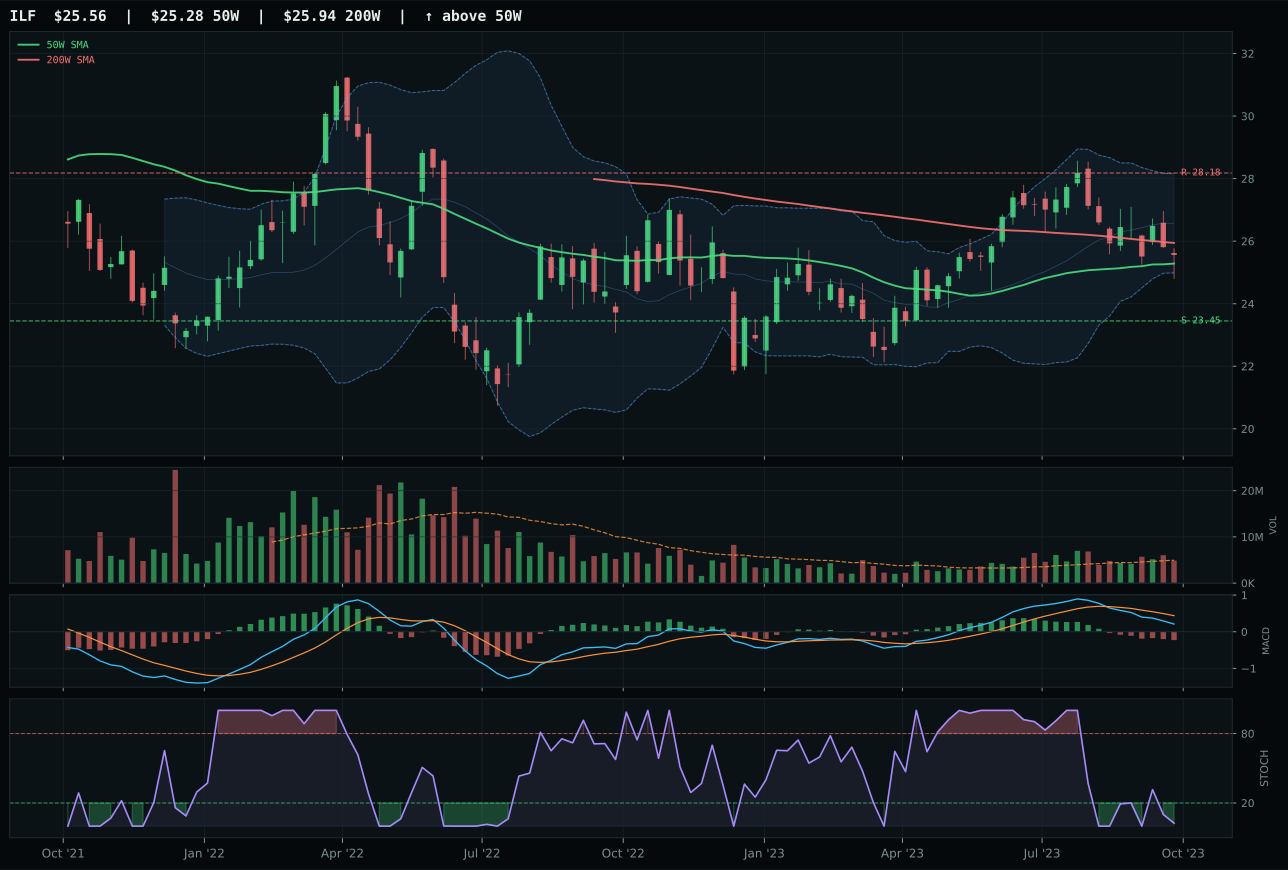
ILF has a compression near 50W profile with -2.4% 13-week relative strength versus SPY.
A failed hold above support would weaken the setup.
Actionable but governed by invalidation levels.
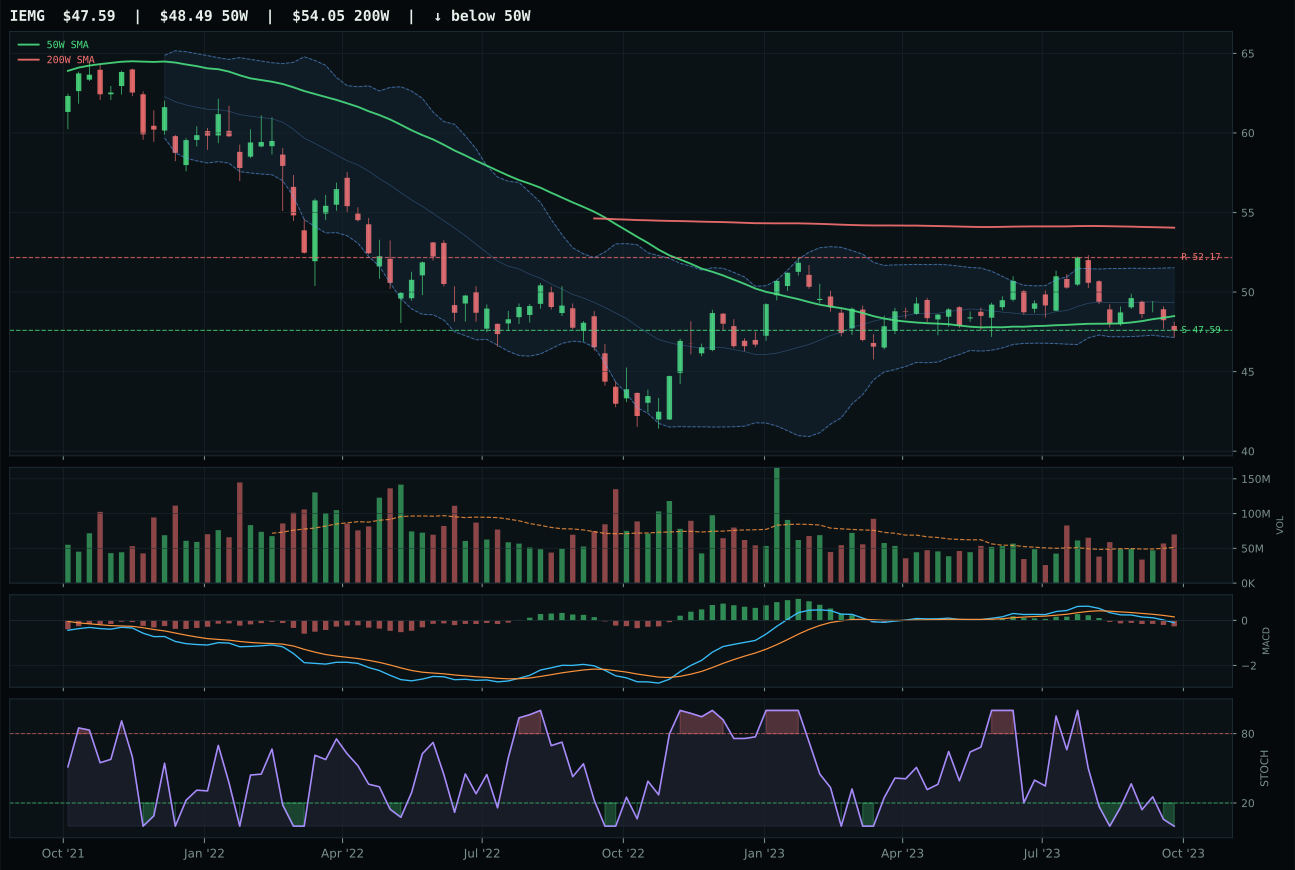
IEMG has a pullback into support profile with 0.1% 13-week relative strength versus SPY.
Extension and support failure are the main tactical risks.
Tracked, but not top-2 eligible because: structurally broken.
ILF wins the category with a final score of 2.7, which immediately signals that Emerging Markets is entirely excluded from allocation this week. ILF's timing is the category's only strength at 100.0/100—price compressed near the 50W at 1.1% with stochastic RSI oversold turn up—but that technical invitation is overwhelmed by macro devastation. Trend is only 58.5/100 (price below the 200W), momentum confirmation is 21.8/100 (negative 13W and 4W returns), and volume-price confirmation is weak at 33.9/100. INDA ranks ahead of ILF in the reasoned proof order (36.7 vs 28.8) because it shows bullish MACD and positive 13W momentum (+1.2%), but distribution pressure and overbought oversold stochastic RSI leave it defenseless. ILF's compression near the 50W and oversold turn-up create a cleaner repair thesis than INDA's stretched entry, but that advantage is academic when the macro backdrop is this hostile.
Emerging Markets earns 0% allocation and ranks 9th or 10th, completely excluded from the portfolio this week. The category score of 2.7/100 reflects a catastrophic macro environment where dollar pressure (-14), credit stress (-10), liquidity stress (-10), and broad market bear (-9) all conspire to penalize emerging-market exposure simultaneously. Even ILF's clean timing setup (100.0/100) cannot overcome a macro fit of only 7.0/100, the worst in the portfolio alongside AI. The regime is late-cycle reflation with dollar strength and developed-market energy/real-asset rotation, which is structurally hostile to emerging-market equities. To earn even a 5% tier-2 slot, this category would require reversal of dollar pressure and credit stress—a fundamental regime shift that has not begun. The chart is technically acceptable (compression, oversold turn-up), but the macro is poison. Exclusion is not a close call; it is the only rational choice given the four simultaneous headwinds all pointing the same direction.