
2023-09-22
Informational purposes only. The content in this report, including allocations, analysis, and commentary, is provided solely for informational and educational purposes. It does not constitute financial advice, investment advice, trading advice, or any other type of advice. Past performance does not guarantee future results. Always conduct your own research and consult a qualified financial professional before making investment decisions.
Weekly Allocation
| Ticker | Category | Weight | Role |
|---|---|---|---|
| FBTC | 50% | Overlay | |
| XLE | Traditional Energy | 10% | Top-2 (10%) |
| URNM | Nuclear Energy | 10% | Top-2 (10%) |
| GLD | Precious Metals | 5% | Tier-2 (5%) |
| COPX | Industrial Metals | 5% | Tier-2 (5%) |
| XLU | Utilities & Infrastructure | 5% | Tier-2 (5%) |
| MOO | Agriculture & Livestock | 5% | Tier-2 (5%) |
| XAR | Defense & Aerospace | 5% | Tier-2 (5%) |
| CIBR | Technology | 5% | Tier-2 (5%) |
Trade Instructions — Monday Open
Sell the tranche from 2023-08-25 (completing its 4-week hold). Buy the new tranche. Instructions show net portfolio changes — same-asset positions cancel, weight changes show the delta.
| Action | Ticker | Instruction |
|---|---|---|
| SELL | PICK | Sell 50% of PICK position (reduce 2.50% → 1.25%) |
| SELL | ITA | Sell 50% of ITA position (reduce 2.50% → 1.25%) |
| SELL | SLV | Sell entire SLV position (1.25% of portfolio) |
| SELL | PAVE | Sell 33% of PAVE position (reduce 3.75% → 2.50%) |
| BUY | COPX | Buy COPX — 25.00% of freed cash (adds 1.25% to portfolio) |
| BUY | GLD | Buy GLD — 25.00% of freed cash (adds 1.25% to portfolio) |
| BUY | XAR | Buy XAR — 25.00% of freed cash (adds 1.25% to portfolio) |
| BUY | XLU | Buy XLU — 25.00% of freed cash (adds 1.25% to portfolio) |
Current Portfolio After Trade
Combined holdings across all 4 active tranches. Each tranche is 25% of the portfolio.
| Ticker | % of Portfolio | Weight Bar |
|---|---|---|
| FBTC | 50.00% | |
| XLE | 10.00% | |
| URNM | 10.00% | |
| MOO | 5.00% | |
| GLD | 5.00% | |
| CIBR | 3.75% | |
| COPX | 3.75% | |
| XAR | 3.75% | |
| PAVE | 2.50% | |
| XLU | 2.50% | |
| PICK | 1.25% | |
| ITA | 1.25% | |
| IGV | 1.25% |
Macro Regime — Late-Cycle Reflation
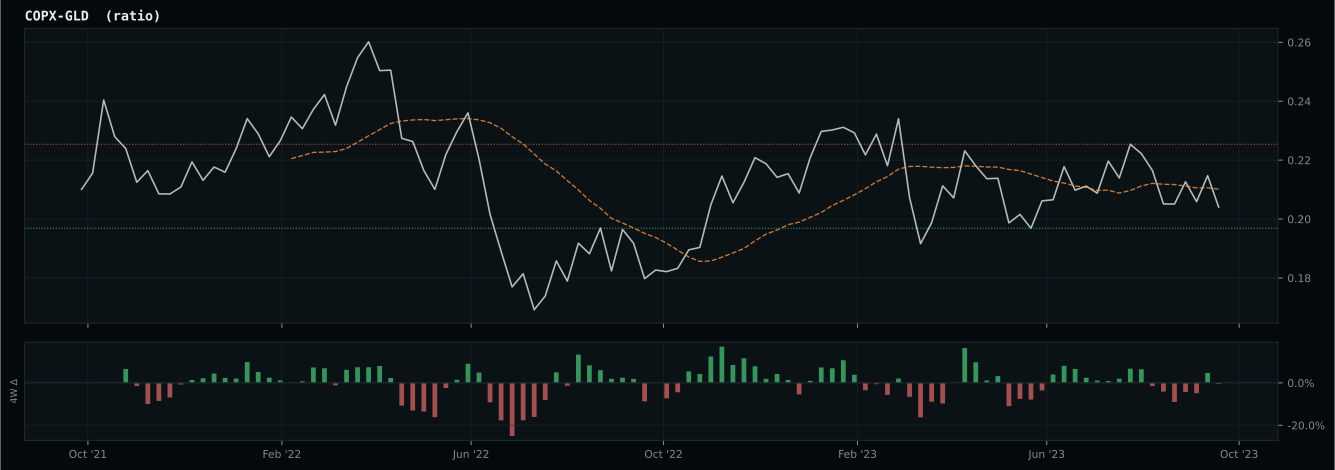
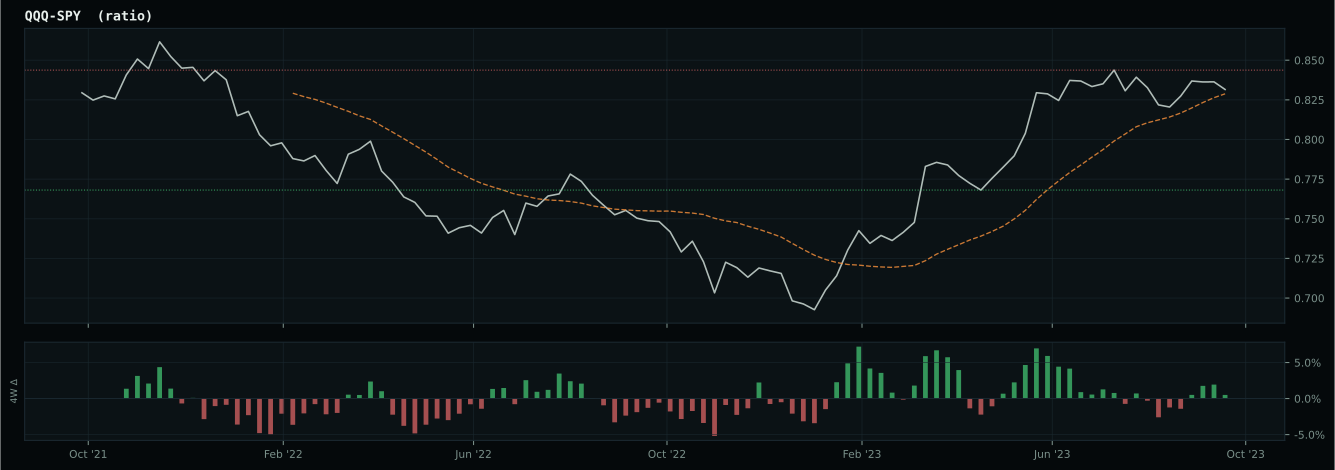
Macro Evidence Charts
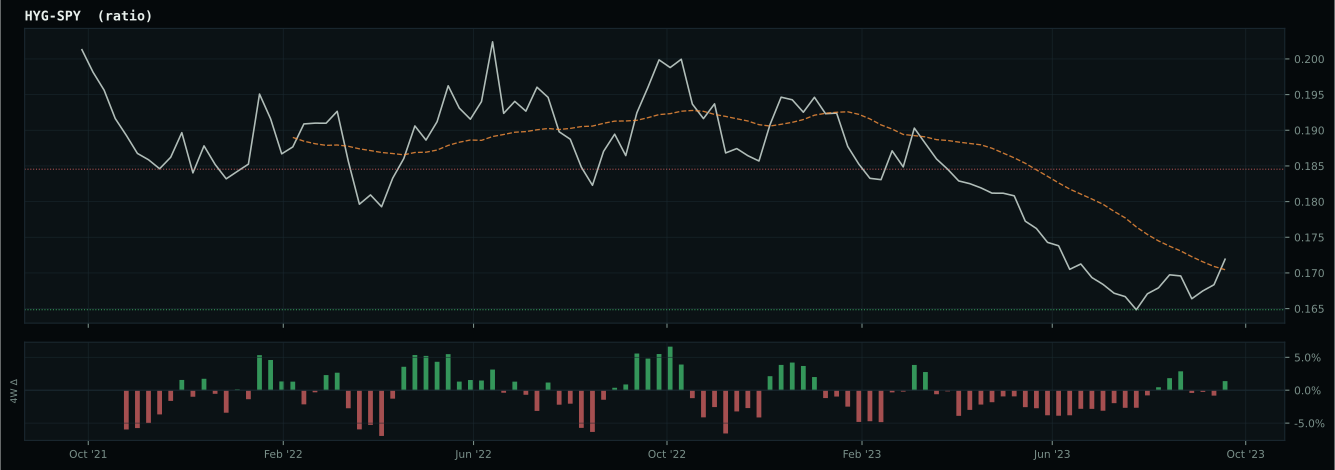
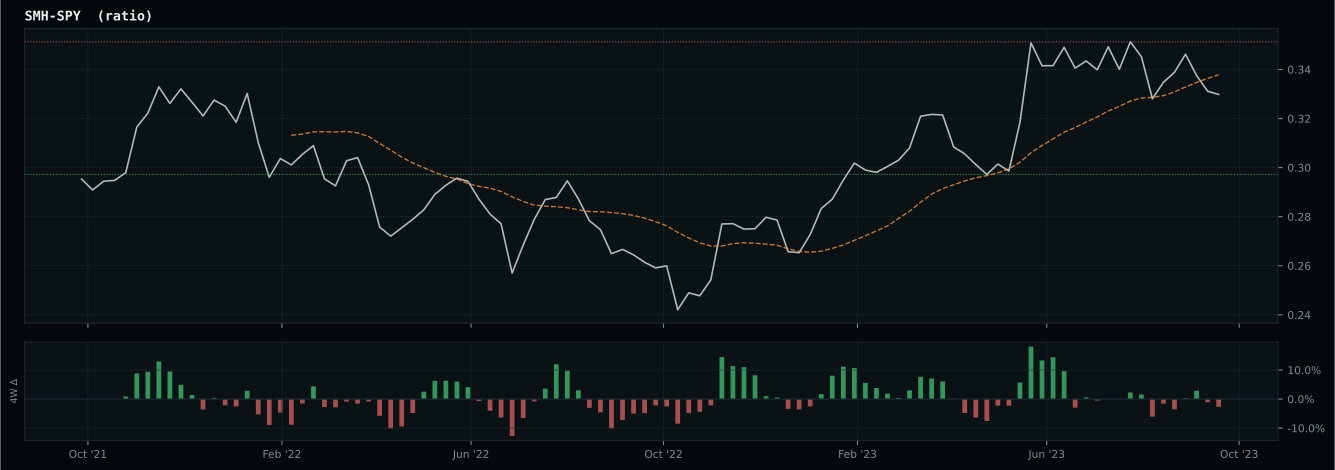
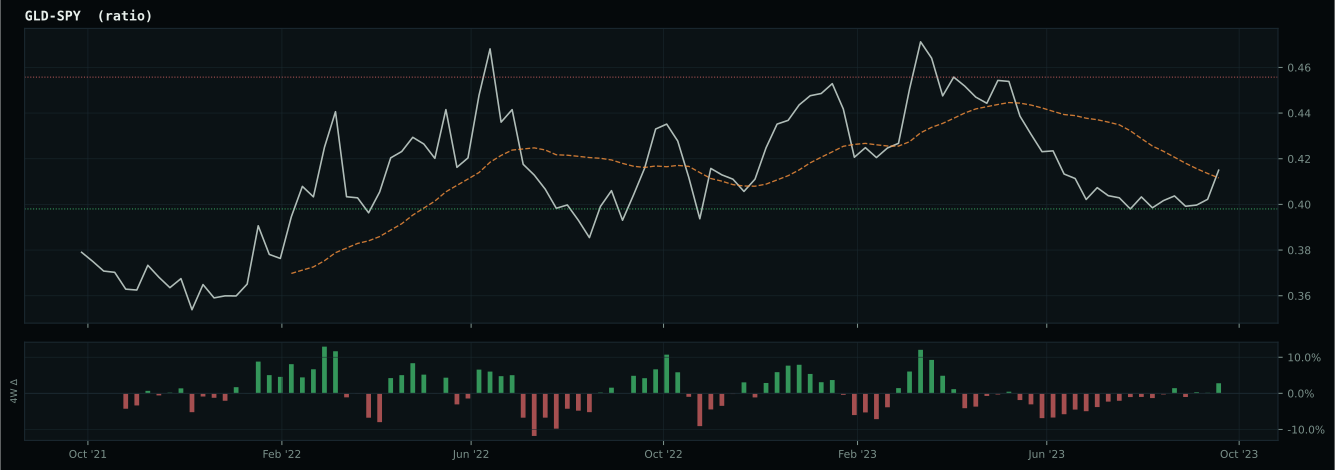
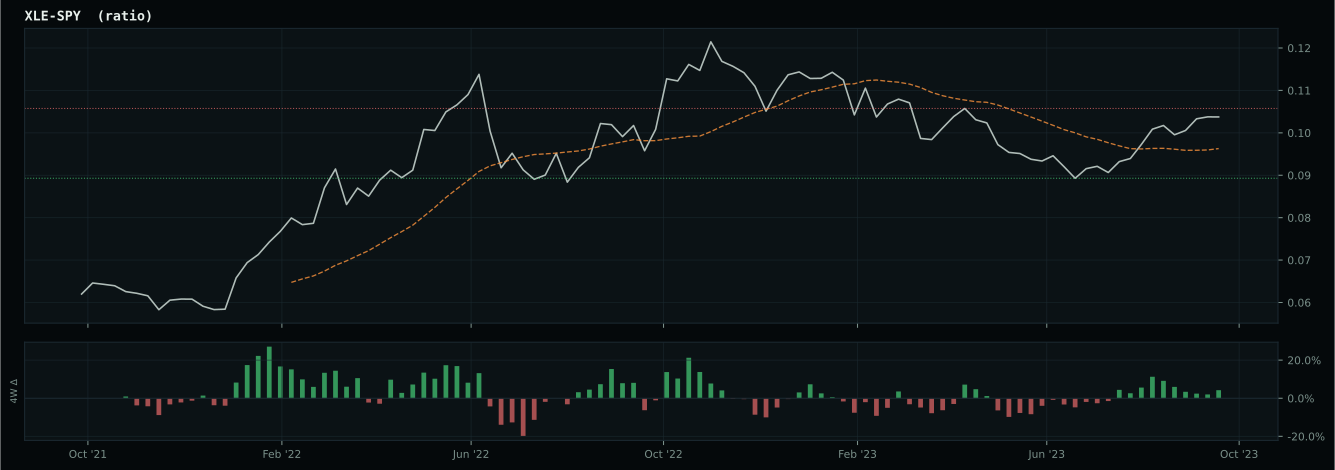
Market-implied signals behind the macro regime scores. Each ratio compares two assets; the direction and slope of the ratio is what the macro engine reads.
Crypto Regime — TrendBTC
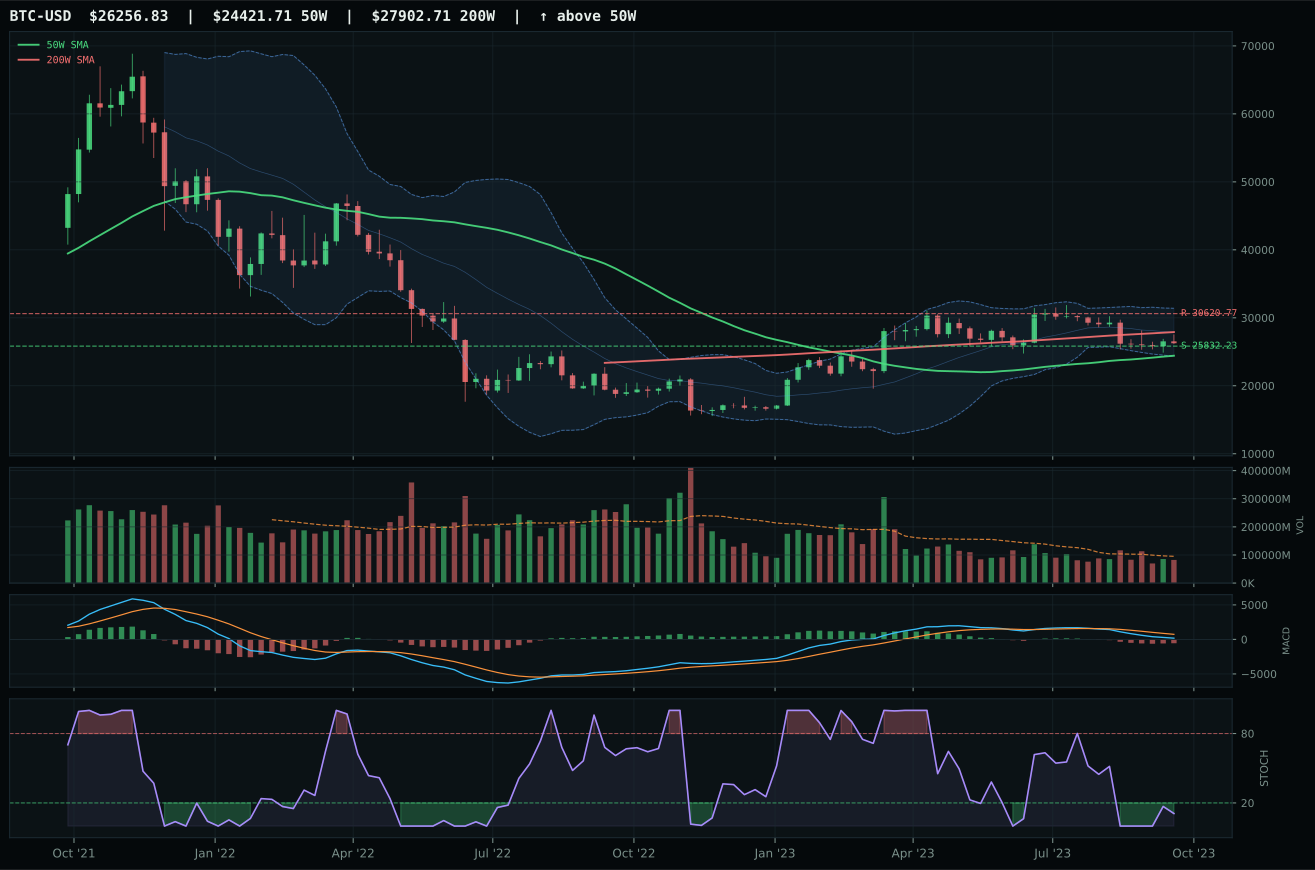
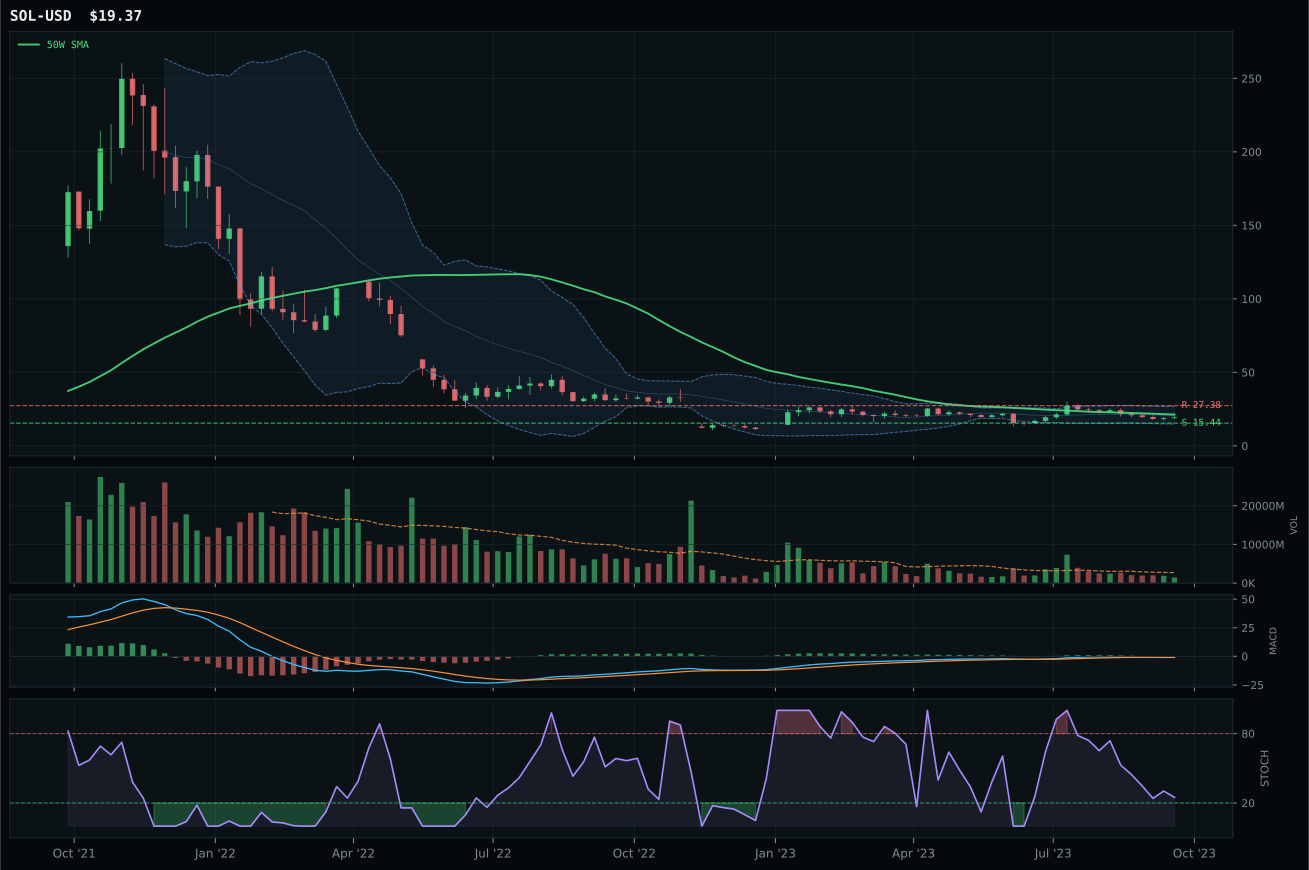
post-touch structure is too wide to count as a range; max/min close ratio is 1.88
TrendBTC confirmed: 2 consecutive closes above rising/flat 50W SMA
one or more available conditions failed
Category Rankings
| Rank | Category | Winner | Score | Alloc | 4W Ret | Peers (4W) |
|---|---|---|---|---|---|---|
| 1 | Traditional Energy | XLE | 83.0 | 20% | +0.75% | XOP +3.8% · FCG +6.5% |
| 2 | Nuclear Energy | URNM | 71.8 | 20% | -5.56% | URA -6.8% · NLR -5.2% |
| 3 | Precious Metals | GLD | 53.4 | 10% | +2.86% | SLV -1.3% · GDX +1.7% |
| 4 | Industrial Metals | COPX | 49.1 | 10% | -7.92% | PICK -7.5% · REMX -14.4% |
| 5 | Utilities & Infrastructure | XLU | 41.0 | 10% | -8.61% | IGF -7.1% · PAVE -4.7% |
| 6 | Agriculture & Livestock | MOO | 40.9 | 10% | -7.45% | VEGI -5.3% · WEAT +0.9% |
| 7 | Defense & Aerospace | XAR | 29.8 | 10% | +3.34% | ITA +0.7% · ROKT -0.7% |
| 8 | Technology | CIBR | 25.9 | 10% | -1.70% | IGV -0.9% · XLK -0.7% |
| 9 | AI | AIQ | 17.8 | 0% | -2.35% | SMH -0.1% · BOTZ -6.3% |
| 10 | Emerging Markets | ILF | 2.1 | 0% | -4.61% | INDA -1.9% · IEMG -4.4% |
Traditional Energy — XLE
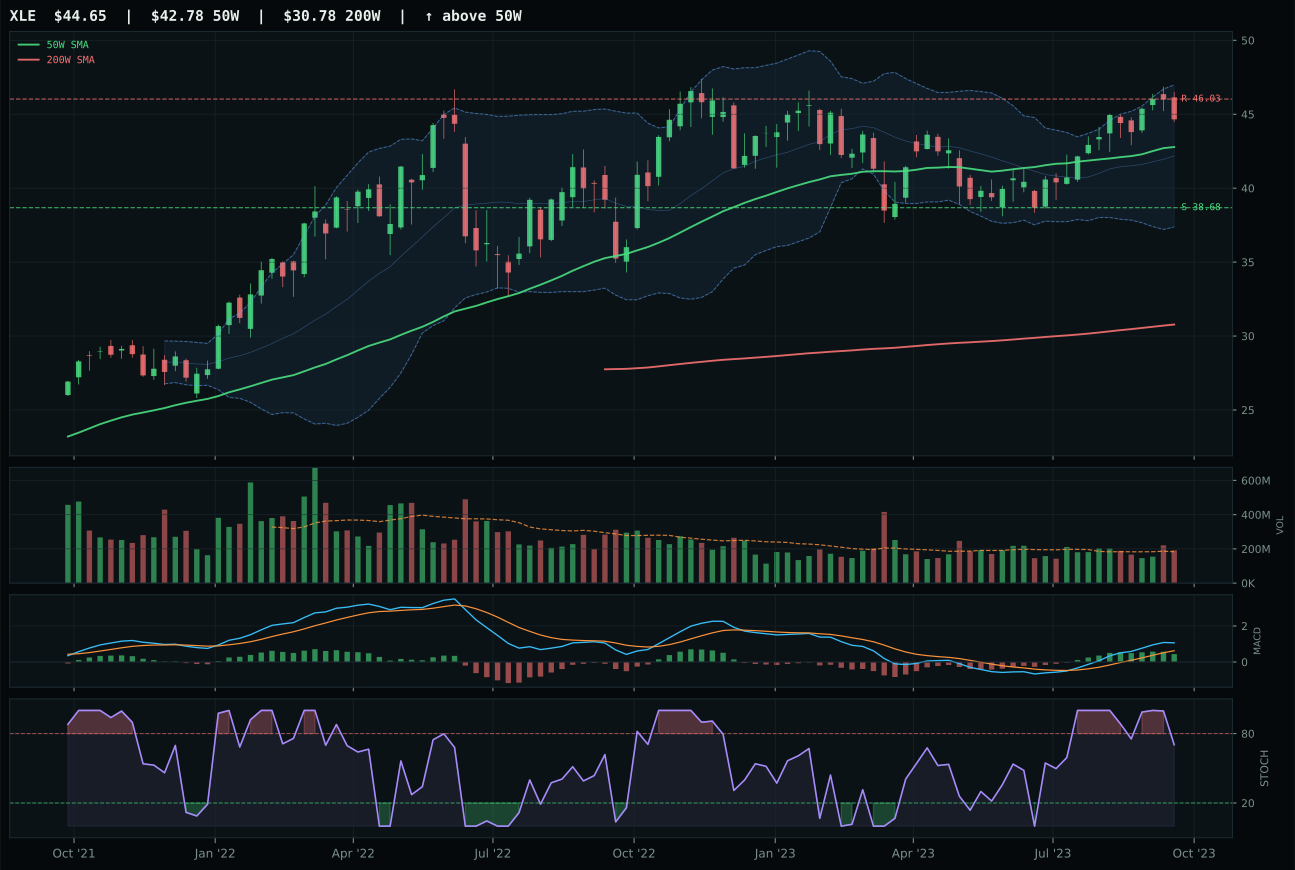
XLE has a neutral structure profile with 16.1% 13-week relative strength versus SPY.
A failed hold above support would weaken the setup.
Actionable but governed by invalidation levels.
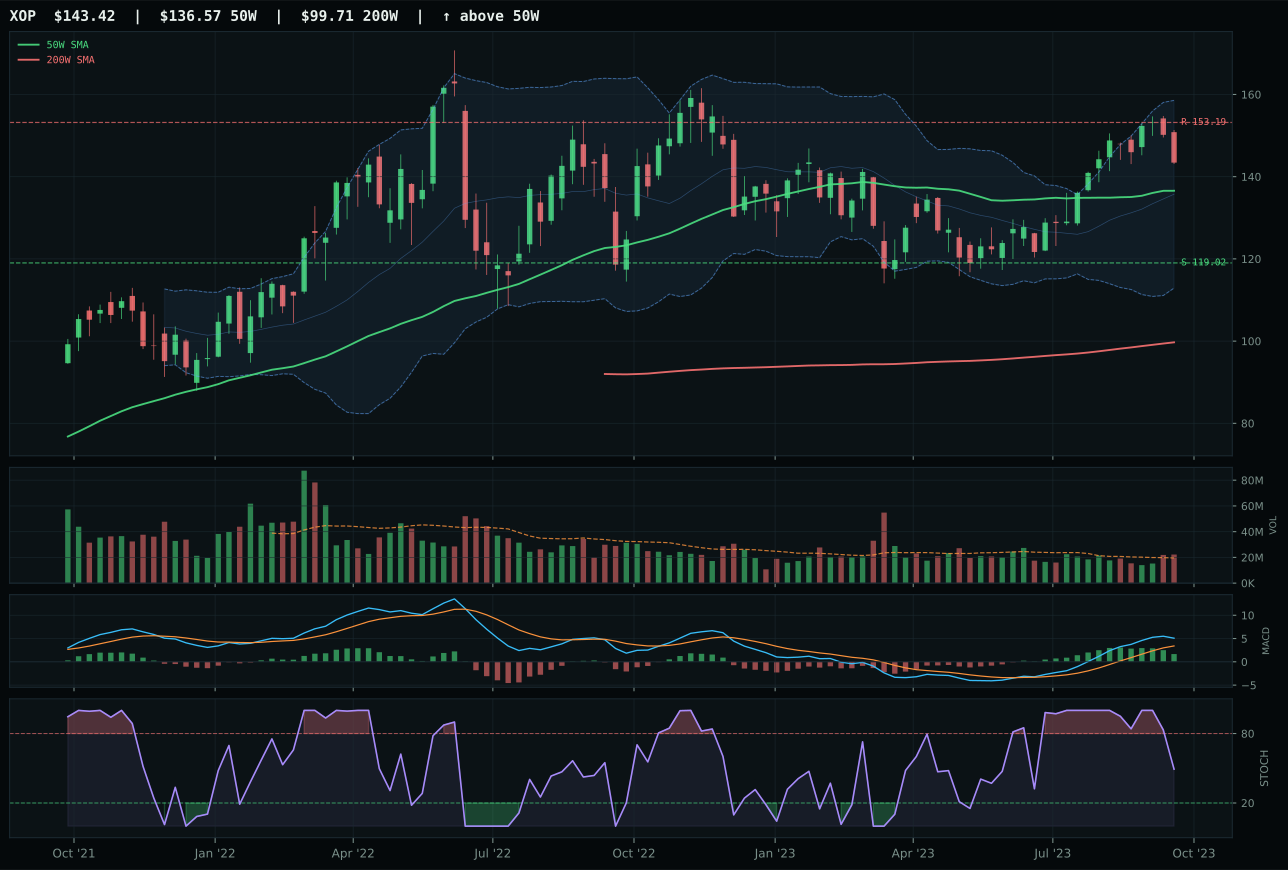
XOP has a neutral structure profile with 18.5% 13-week relative strength versus SPY.
A failed hold above support would weaken the setup.
Actionable but governed by invalidation levels.
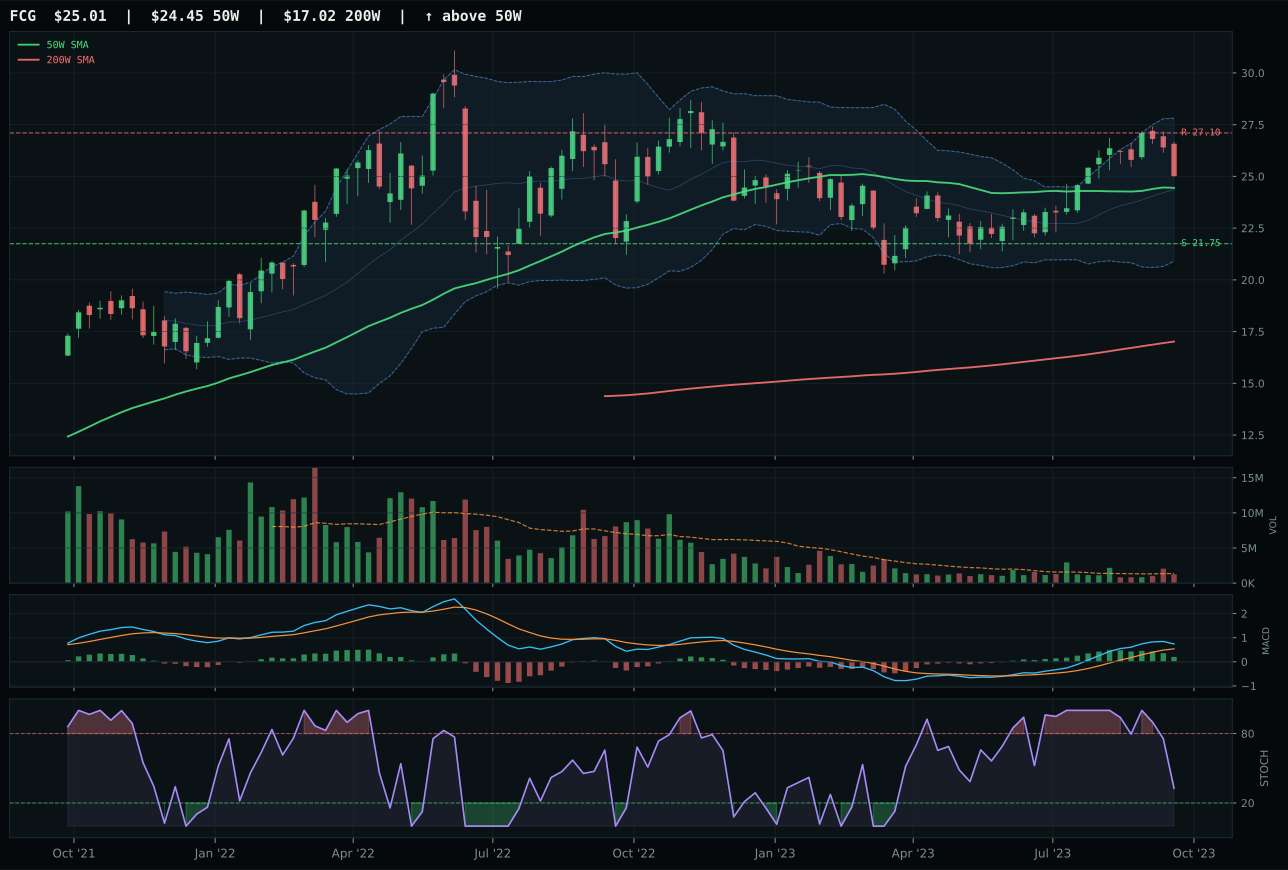
FCG has a compression near 50W profile with 13.0% 13-week relative strength versus SPY.
A failed hold above support would weaken the setup.
Actionable but governed by invalidation levels.
XLE wins the energy category decisively with clean momentum and perfect trend confirmation. Price is 4.4% above the 50W with a 0.2% slope—not extended but firmly in control—and the 13W return of 15.4% with 16.1% RS versus SPY shows real institutional accumulation. MACD is bullish but flattening (not yet rolling), stochastic RSI at 0.70 shows momentum but not overbought extremes, and volume at 1.04x the 20W average provides neutral confirmation—this is not speculative but sustained. The structure score of 74.2 reflects a clean neutral setup with good compression and well-defined support/resistance. Momentum confirmation at 100.0 is the category's highest, driven by 2.0% 4W return and category-relative strength of 0.0%, meaning XLE is leading its peers on pure power, not relative outperformance. XOP lost only on timing (70.0 vs 85.0) despite superior 18.5% RS versus SPY, suggesting XOP is extended and XLE has better entry geometry. The 1.6-point gap is tight, but XLE's cleaner timing and volume confirmation edge out pure momentum chase.
Traditional Energy receives 10% as a top-2 overweight, ranking among the portfolio's highest conviction allocations. The category score of 83.0 and macro fit of 90.0/100 reflect an exceptionally favorable regime. Energy scarcity is active (+16), supply shortage at +9, inflation pressure at +10, and real asset sponsorship at +7 all combine in explicit tailwind. Late-Cycle Reflation helps this exposure (+12), making energy one of the rare categories benefiting from both technical and macro alignment. XLE's technical evidence at 80.5/100 is strong but not extreme, relying on trend at 100.0 and momentum at 100.0 to offset only 48.5 risk/reward—price is within 3% of resistance, limiting upside. The 15.4% 13W return shows the move is well under way, yet volume confirmation at 78.7 suggests active buying rather than speculative spike. This is a conviction allocation to the most favored regime outcome: sticky inflation, energy constraints, and reflation equity thesis. The technical setup is not early, but it is still clean. Holding XLE at 10% is a bet that energy will compound as long as supply remains tight and late-cycle conditions persist.
Nuclear Energy — URNM
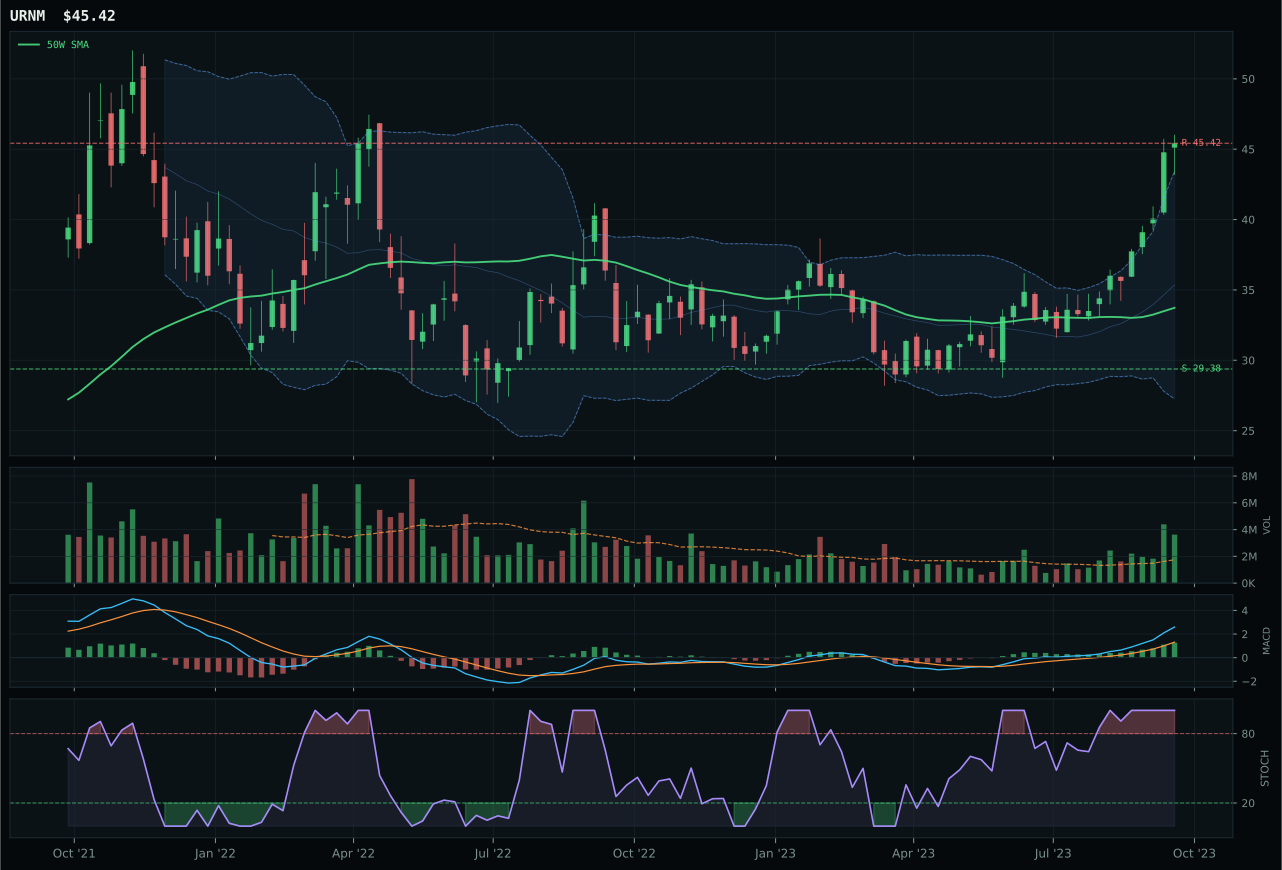
URNM has a vertical extension profile with 38.9% 13-week relative strength versus SPY.
A failed hold above support would weaken the setup.
Actionable but governed by invalidation levels.
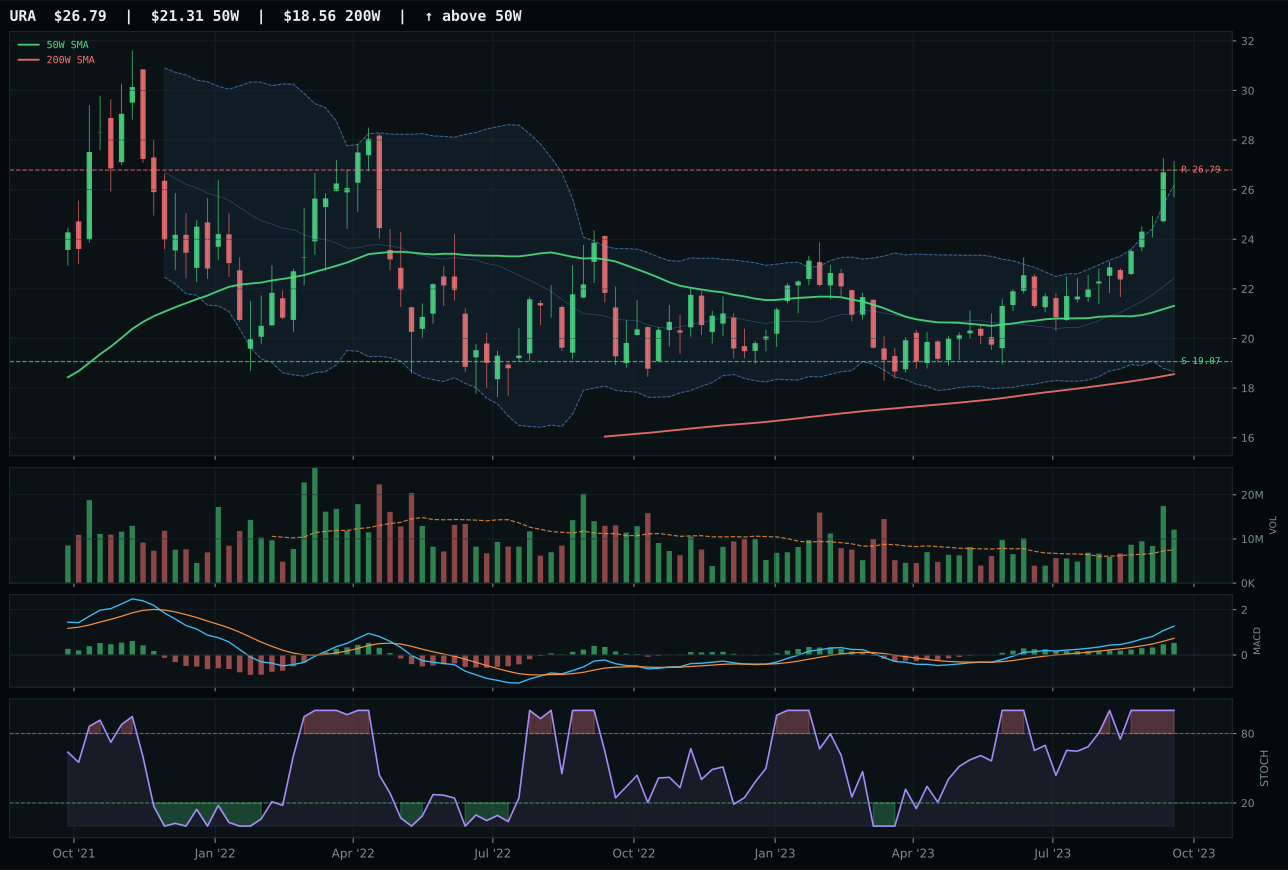
URA has a vertical extension profile with 26.4% 13-week relative strength versus SPY.
A failed hold above support would weaken the setup.
Actionable but governed by invalidation levels.
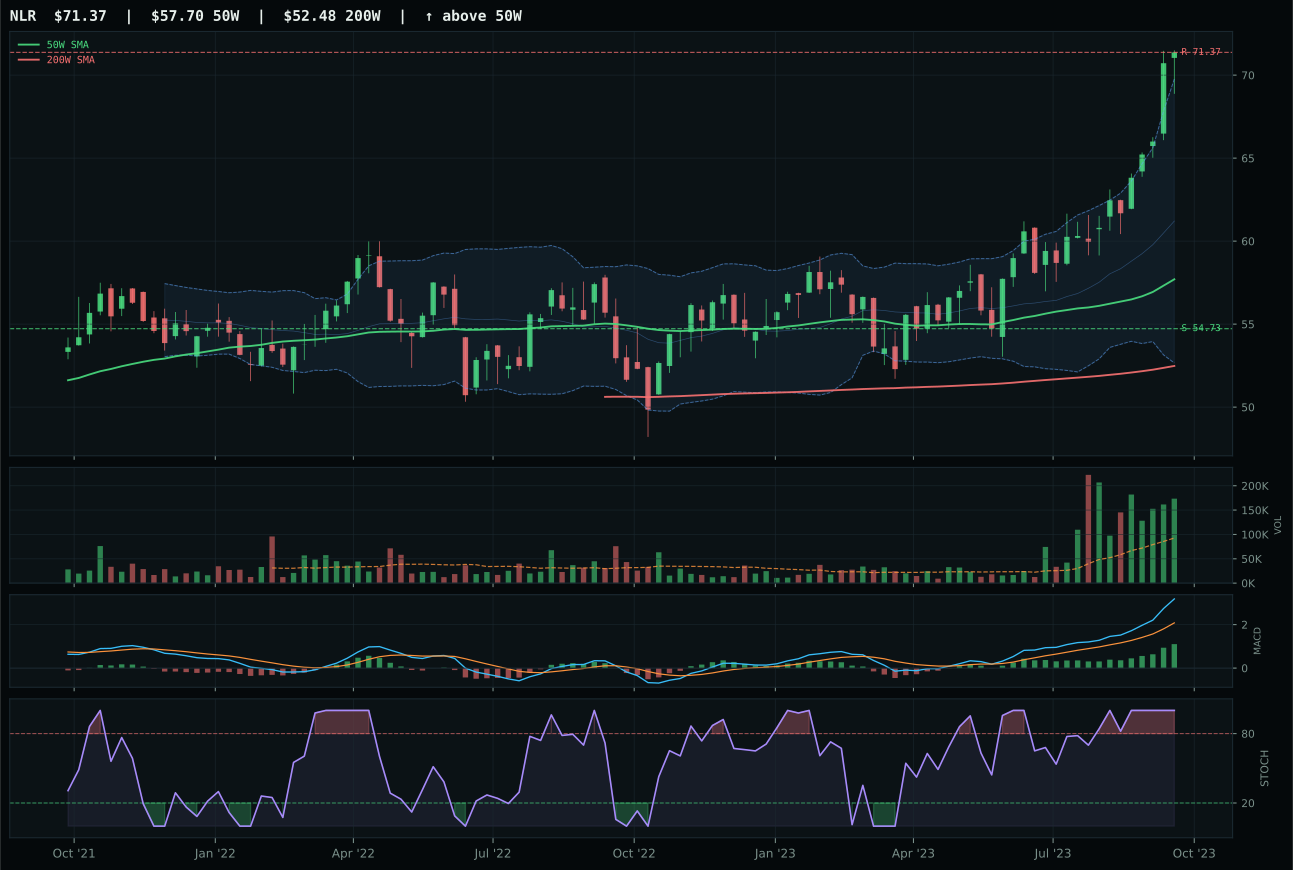
NLR has a vertical extension profile with 23.5% 13-week relative strength versus SPY.
A failed hold above support would weaken the setup.
Tracked, but not top-2 eligible because: .
URNM wins decisively despite severe extension because its volume-price confirmation and persistence are unmatched. Price sits 34.7% above the 50W and trades near the 52W high—objectively extended—yet the timing score of only 37.0 honestly reflects this risk. What overcomes the extension is accumulation-level volume at 2.08x the 20W average, paired with MACD bullish and improving (not flattening) and stochastic RSI at 1.00 (pure overbought momentum). Most critically, the 13W return of 38.2% and 38.9% RS versus SPY, combined with 12.5% category-relative strength, show this is not a bubble but a coherent institutional narrative. Momentum confirmation of 100.0 and volume-price confirmation at 91.6, persistence at 100.0—these scores are as strong as the data allows. URA lost despite identical Fibonacci setup because its 26.4% RS versus SPY and 0.0% category-relative strength show it is a follower, not a leader. The -6.6 point gap reflects URNM's ability to sustain heavy volume accumulation while URA is riding coattails. This is a buy-the-leader trade, not a mean-reversion trade.
Nuclear Energy receives 10% as a top-2 overweight alongside Traditional Energy, representing the portfolio's second-highest conviction slot. The category score of 71.8 and macro fit of 64.0/100 reflect strong but not exceptional macro conditions. Energy scarcity is active (+9), real asset sponsorship at +7, and Late-Cycle Reflation at +7 provide foundation. However, liquidity stress at -7 is a headwind that URNM's momentum overcomes through sheer technical power. URNM's technical evidence is exceptional at 97.6/100, the highest in the portfolio—driven by trend at 90.0, timing at 37.0 (the lowest component, honest pricing for extension), momentum at 100.0, and persistence at 100.0. This is a momentum allocation with full awareness of extension risk. The 38.2% 13W return and 2.08x accumulation volume show institutional capital is flowing in despite the 34.7% extension from the 50W. The risk/reward is poor at 44.6 (only 0.0% upside to resistance, 54.6% downside to support), making this a momentum-hold rather than an add-on-dip scenario. Holding at 10% is a conviction bet that the nuclear energy narrative (scarcity, clean energy, late-cycle inflation) will sustain heavy buying despite technical extremes. If accumulation volume drops below 1.5x the 20W average or MACD begins flattening, the 54.6% downside support becomes relevant.
Precious Metals — GLD
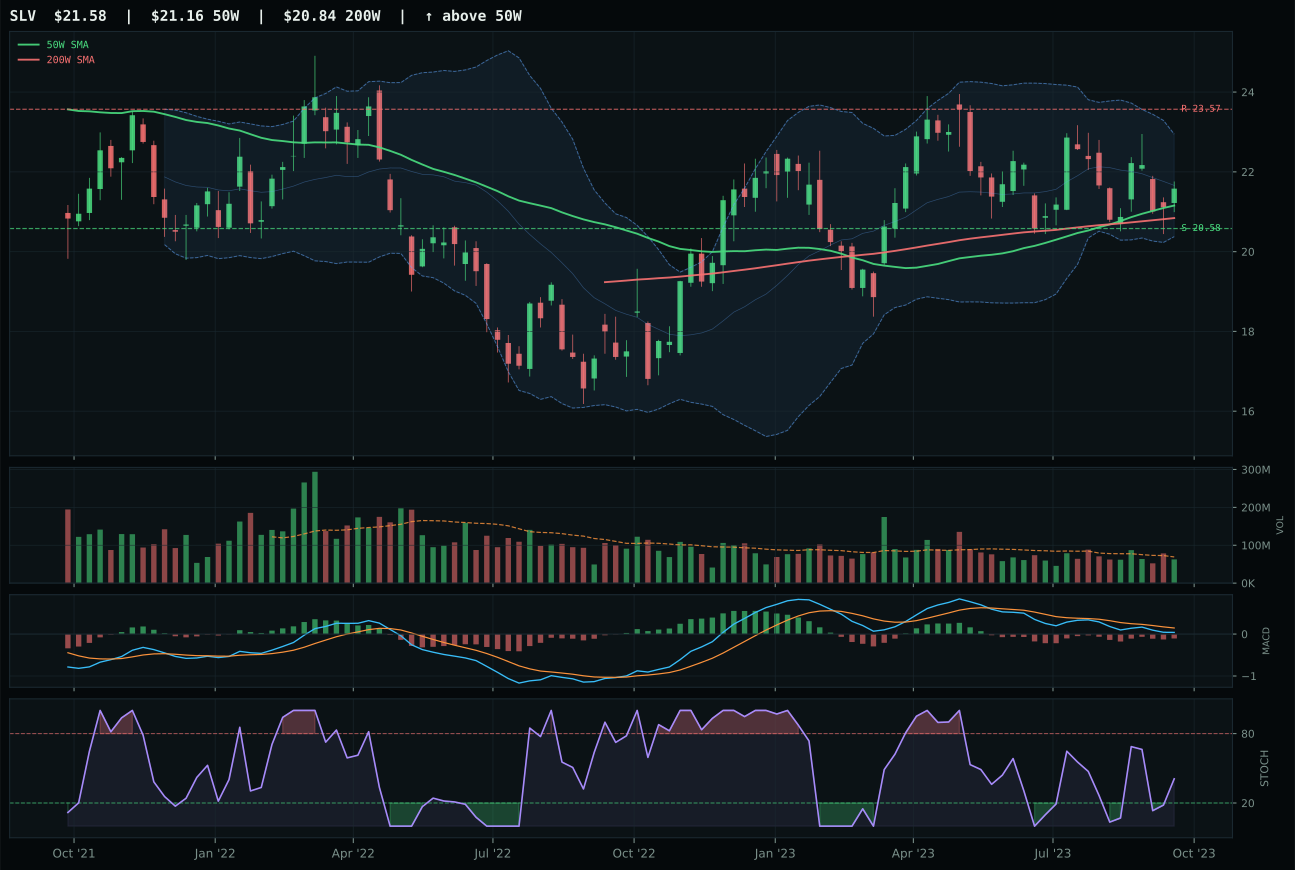
SLV has a pullback into support profile with 5.5% 13-week relative strength versus SPY.
A failed hold above support would weaken the setup.
Actionable but governed by invalidation levels.
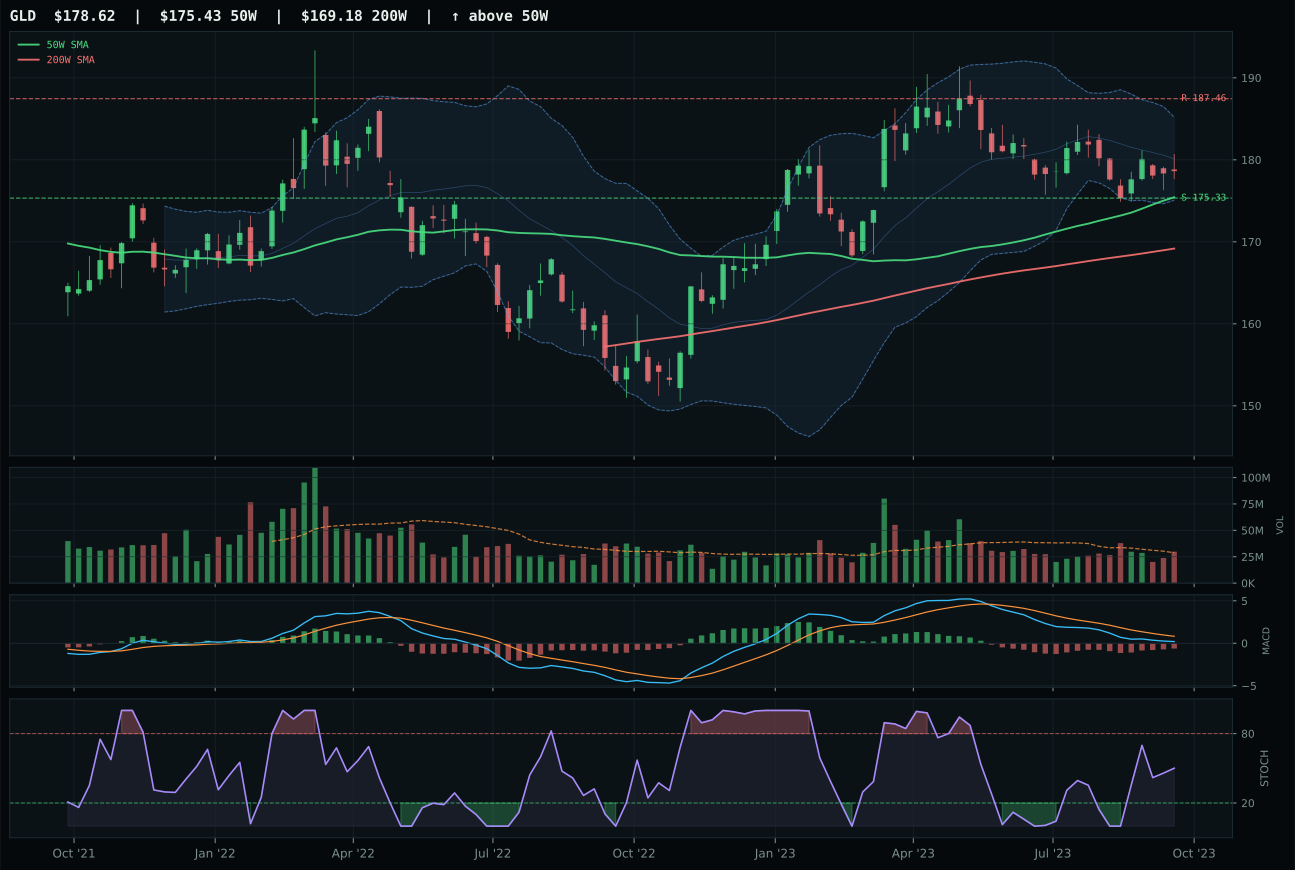
GLD has a pullback into support profile with 0.9% 13-week relative strength versus SPY.
A failed hold above support would weaken the setup.
Actionable but governed by invalidation levels.
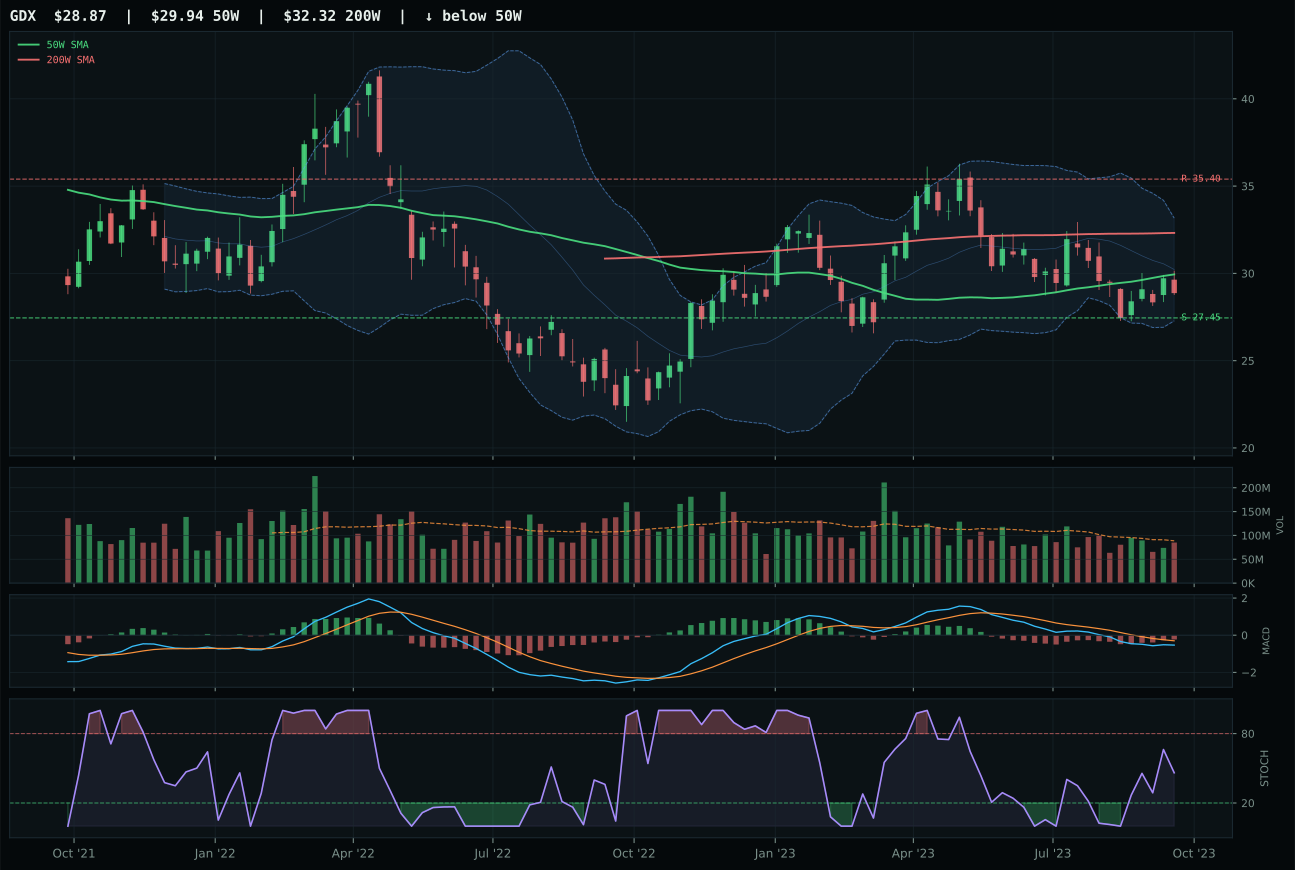
GDX has a neutral structure profile with -2.4% 13-week relative strength versus SPY.
Extension and support failure are the main tactical risks.
Tracked, but not top-2 eligible because: structurally broken.
GLD wins in a tight contest, narrowly edging SLV despite technically inferior momentum. GLD's advantage lies in timing precision and risk/reward geometry: at 1.8% from the 50W with perfect pullback-into-support structure, GLD offers the cleanest entry point. The timing score of 100.0 reflects MACD that is bearish but improving and stochastic RSI at 0.50, neutral but not yet capitulating—optimal conditions for a shallow retest before recovery. Risk/reward of 90.0 is pristine: only 1.9% downside to support at 175.33 versus -4.7% upside to resistance, a 2.5-to-1 reward-to-risk ratio. SLV shows superior momentum with 5.5% RS versus SPY and 4.9% 13W return, making it technically stronger, but its risk/reward dropped to 76.3 due to wider structure and lower r/r efficiency. The -1.0 point gap between winner and runner-up signals this is a close call between gold's stability and silver's momentum. GLD's selection reflects a preference for clean entry geometry over extended momentum in a macro regime where dollar stability matters.
Precious Metals receives 5% allocation as tier-2, with a category score of 53.4 that reflects balanced but not dominant technical conditions. The macro fit is neutral at 53.0/100, with only dollar pressure at +3 providing mild tailwind; liquidity stress and credit stress are not firing in this regime. This is a rare category where macro is neither helping nor hurting meaningfully. GLD's technical evidence sits at 75.9/100, driven by strong trend at 94.3 and excellent timing at 100.0, offset by only 54.7 momentum confirmation. The 0.2% 13W return shows zero directional progress, yet the setup is mechanically sound. The allocation rationale is diversification into a financial hedge that is pulling into support during a late-cycle reflation. Gold is not a conviction bet on inflation or dollar weakness; it is a technical entry into a known safe-haven asset at a point where downside risk is capped. To earn tier-1 status, gold would need either breakout confirmation above 187.46 on heavy volume or a macro shift toward explicit credit stress or liquidity constraints. Until then, 5% acknowledges gold's defensive utility without betting on directional conviction.
Industrial Metals — COPX
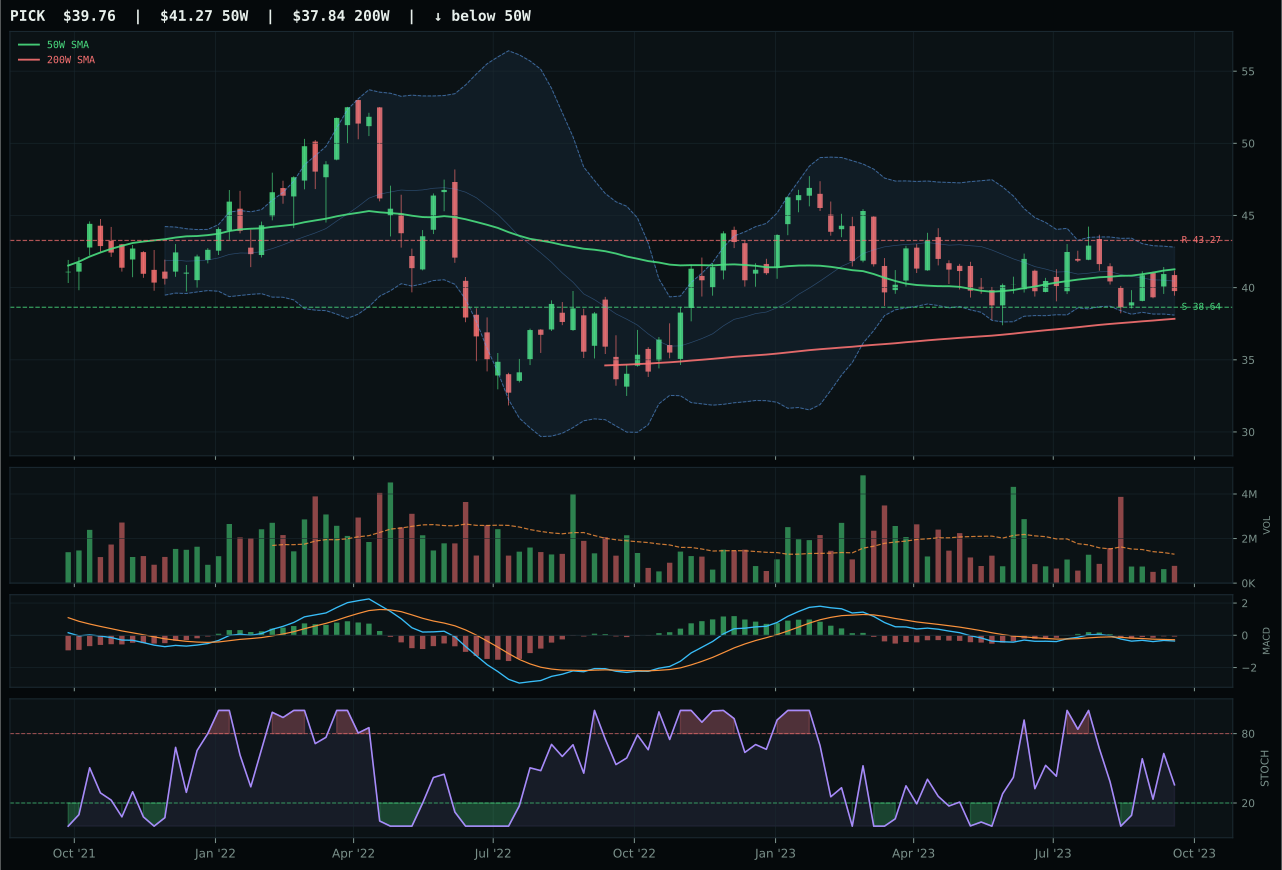
PICK has a pullback into support profile with 0.7% 13-week relative strength versus SPY.
A failed hold above support would weaken the setup.
Actionable but governed by invalidation levels.
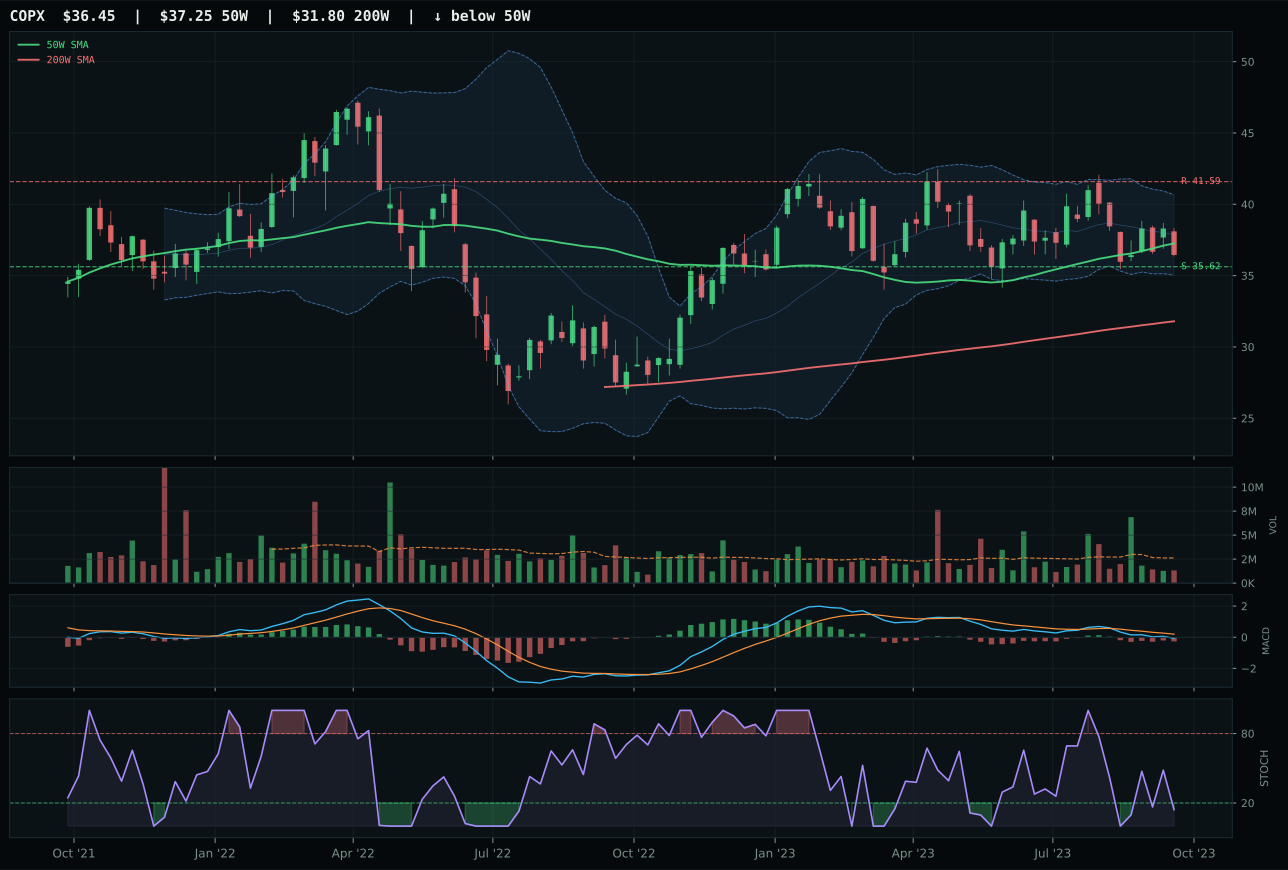
COPX has a pullback into support profile with -1.9% 13-week relative strength versus SPY.
A failed hold above support would weaken the setup.
Actionable but governed by invalidation levels.
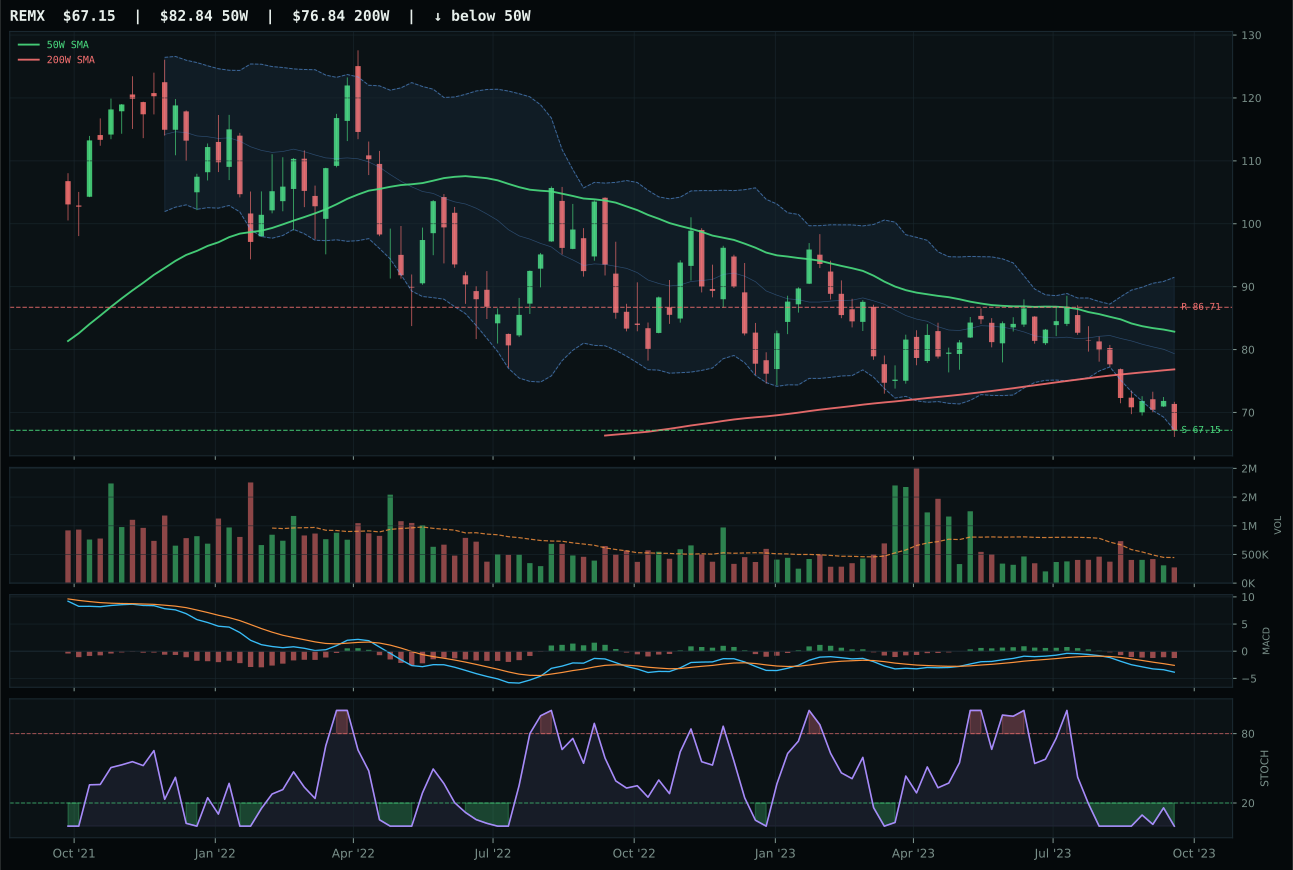
REMX has a pullback into support profile with -16.8% 13-week relative strength versus SPY.
A failed hold above support would weaken the setup.
Actionable but governed by invalidation levels.
COPX wins narrowly despite PICK's superior momentum because COPX better balances timing with structure. COPX sits -2.2% from the 50W with pristine pullback-into-support geometry; MACD is bearish but improving, stochastic RSI is oversold at 0.14, and the Fibonacci repair zone at 0.382 aligns exactly with the timing inflection. Timing score of 100.0 rewards this precision. Risk/reward is exceptional at 90.0: support at 35.62 offers 2.3% downside cushion while resistance at 41.59 caps upside at -12.4%, an asymmetric setup that favors patience. PICK shows 0.7% RS versus SPY and 0.0% 13W return—technically stronger—yet its timing score was weaker due to broader support/resistance bands and less precise Fibonacci alignment. The -5.8 point gap reflects COPX's superior architecture: copper as a scarcity play has cleaner macro sponsorship than diversified mining, and COPX's cleaner pullback setup outweighs PICK's better momentum.
Industrial Metals receives 5% as tier-2, supported by a strong category score of 49.1 and macro fit of 68.0/100. Metals scarcity is active (+14), commodity breadth positive is at +10, and real asset sponsorship at +6 all back industrial metals in late-cycle reflation. The macro environment is explicitly constructive. COPX's technical evidence is 59.1/100, solidly middle-of-the-road, driven by solid timing at 100.0 offset by only 41.7 momentum confirmation and 65.2 trend. The 13W return of -2.5% and -1.9% RS versus SPY show this is a repair trade, not a momentum trade. The allocation is fundamentally a macro call: if energy and infrastructure spending drive commodity demand, copper scarcity will compound returns. The thin participation at 0.51x the 20W average shows this is quiet accumulation, not panic buying. For tier-1 status, COPX would need volume to swell above 1.0x the 20W average and price to reclaim the 50W cleanly. Until then, 5% is a patient macro allocation that accepts current weakness in exchange for thematic exposure to industrial rebound scenarios.
Utilities & Infrastructure — XLU
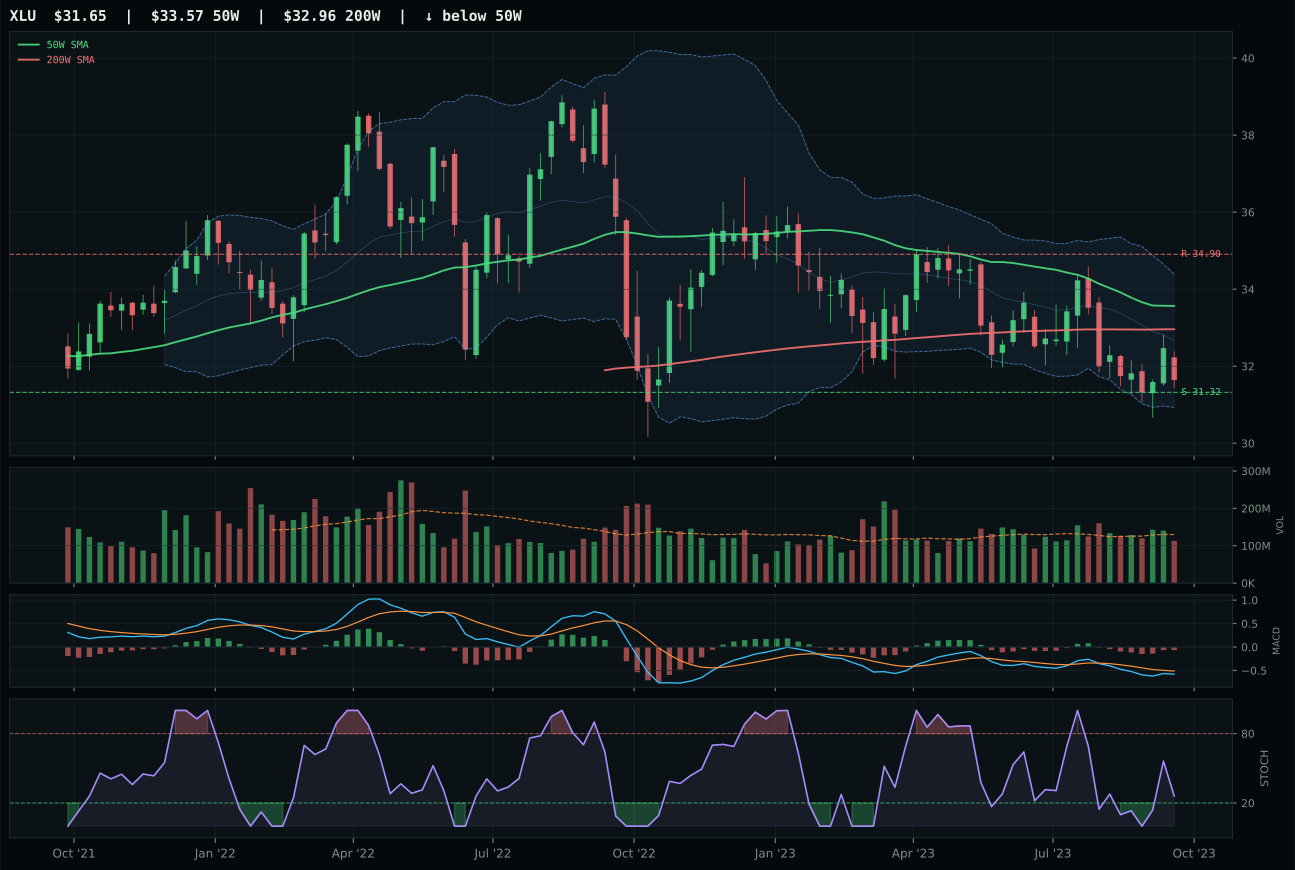
XLU has a pullback into support profile with -2.0% 13-week relative strength versus SPY.
A failed hold above support would weaken the setup.
Actionable but governed by invalidation levels.
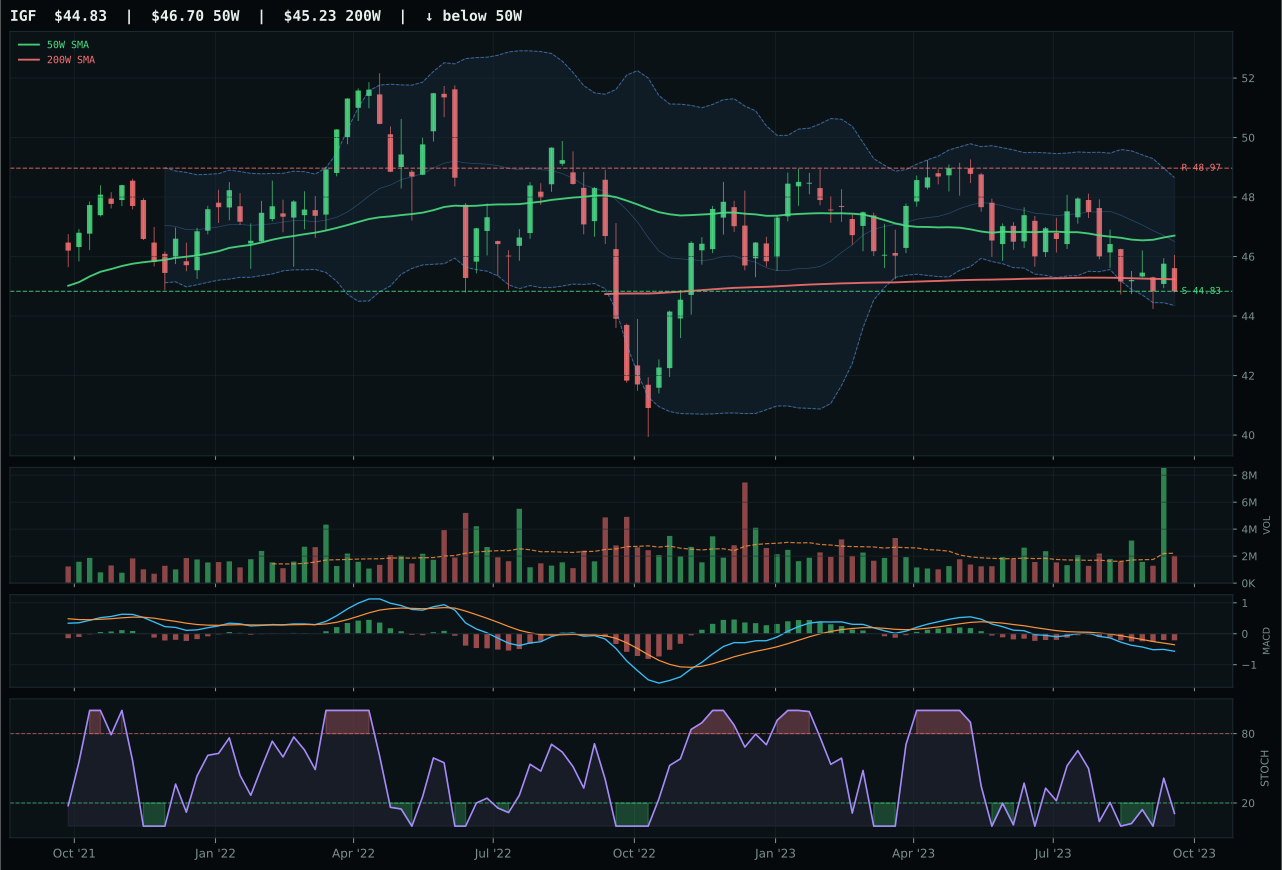
IGF has a pullback into support profile with -1.9% 13-week relative strength versus SPY.
A failed hold above support would weaken the setup.
Actionable but governed by invalidation levels.
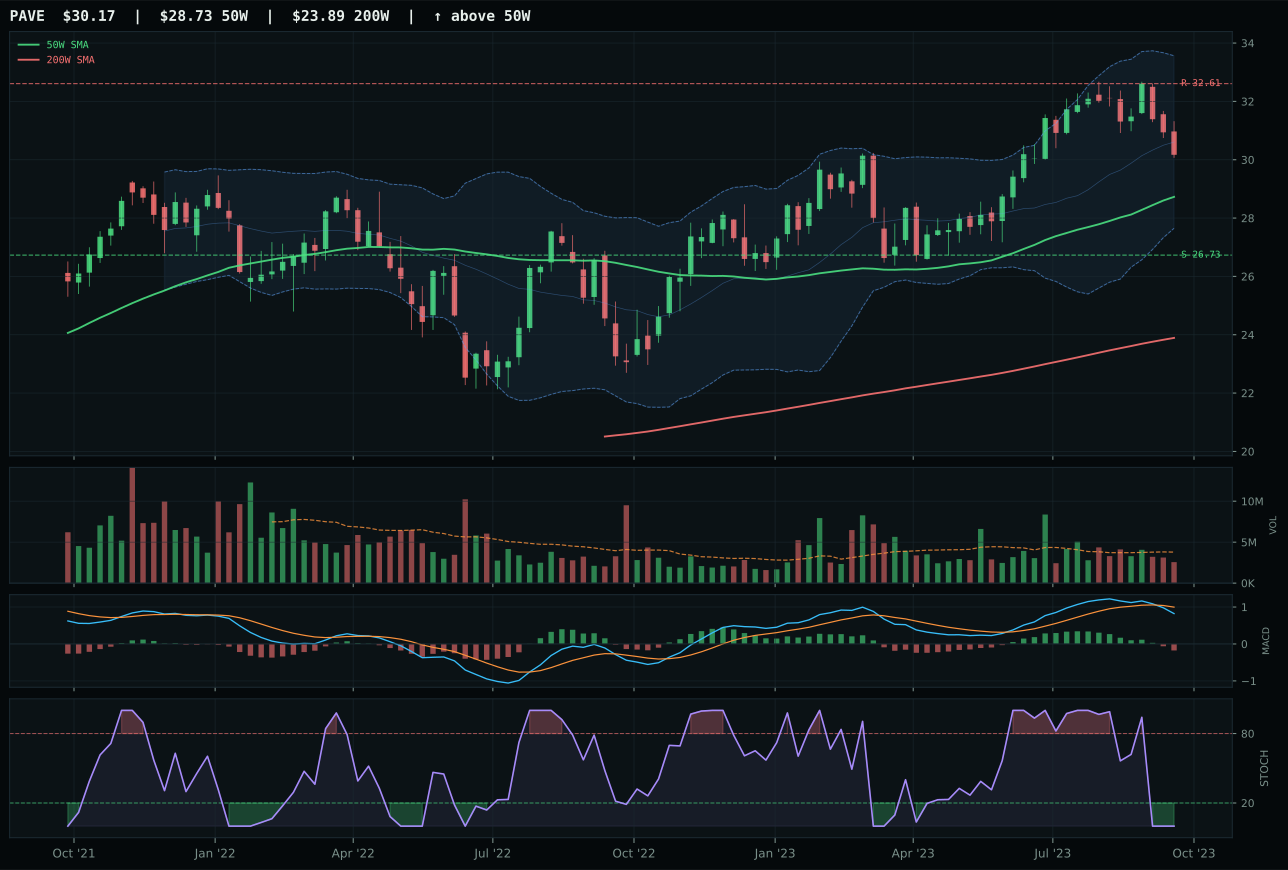
PAVE has a neutral structure profile with 1.1% 13-week relative strength versus SPY.
A failed hold above support would weaken the setup.
Actionable but governed by invalidation levels.
XLU wins by excelling at the low-risk retest trade, even though IGF shows superior technical composites. XLU sits -5.7% from the 50W with a pullback-into-support setup offering 1.0% downside to 31.32 support versus -9.3% upside to 34.90 resistance—a capped, defined risk structure. Timing of 93.0 reflects perfect conditions: MACD is bearish but improving, stochastic RSI is rising mid-zone at 0.26 (not oversold, showing early reversal structure), and Fibonacci repair at 0.786 aligns near support. Risk/reward of 90.0 is exceptional. IGF shows superior momentum (45 vs 45) and trend (45 vs 45), but its risk/reward dropped to 72.0 because it sits at a larger distance from its 50W support zone, and stochastic RSI is oversold (0.00) rather than rising. In defensive setups, oversold can suggest capitulation, but rising mid-zone suggests early institutional re-entry without panic. XLU's selection reflects timing precision over raw technical strength.
Utilities & Infrastructure receives 5% as tier-2, supported by a category score of 41.0 and macro fit of 49.0/100. The macro is mixed: the broad market bear is active (+4), which actually supports defensive utilities, but inflation pressure is active (-6), which penalizes fixed-income-proxies. The regime is neutral-to-mildly-negative for utilities, making this an income-and-stability allocation rather than a growth or momentum play. XLU's technical evidence is only 39.8/100, the lowest among category winners, reflecting trend at 45.0 and momentum at 45.0 both showing repair mode. The 13W return of -2.7% and -2.0% RS versus SPY show utilities are lagging. The allocation case rests entirely on risk-reward geometry and macro defensiveness: in late-cycle drawdowns, regulated utilities and infrastructure provide income and volatility dampening. The composition of pullback-into-support with rising stochastic RSI suggests patient accumulation rather than capitulation, making this an early-entry positioning trade. To earn tier-1 status, XLU would need either a broad market stabilization signal (SPY finding support) or explicit credit stress signals that spike demand for defensive income. Until then, 5% is a measured hedge against equity volatility with steady income in a mixed macro environment.
Agriculture & Livestock — MOO
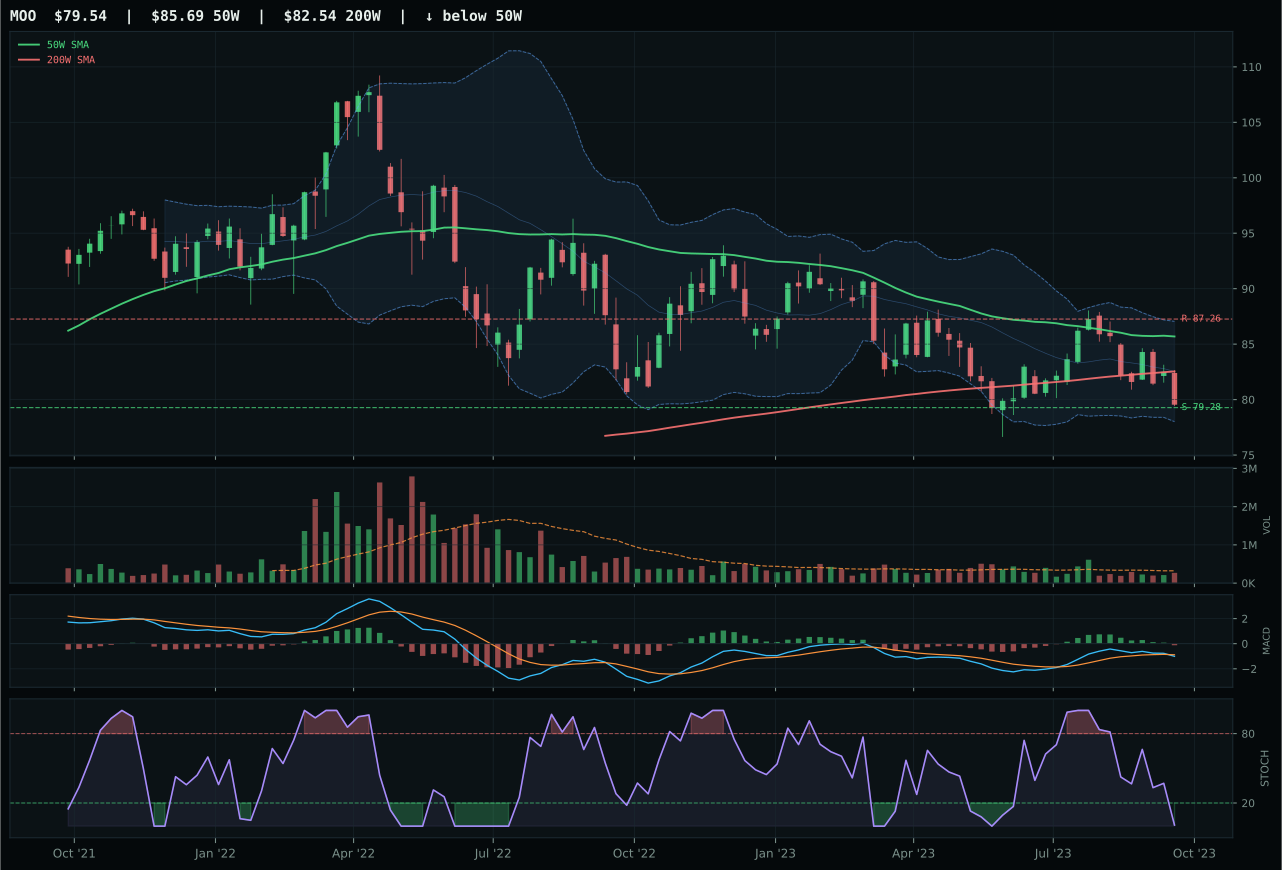
MOO has a pullback into support profile with -0.6% 13-week relative strength versus SPY.
A failed hold above support would weaken the setup.
Actionable but governed by invalidation levels.
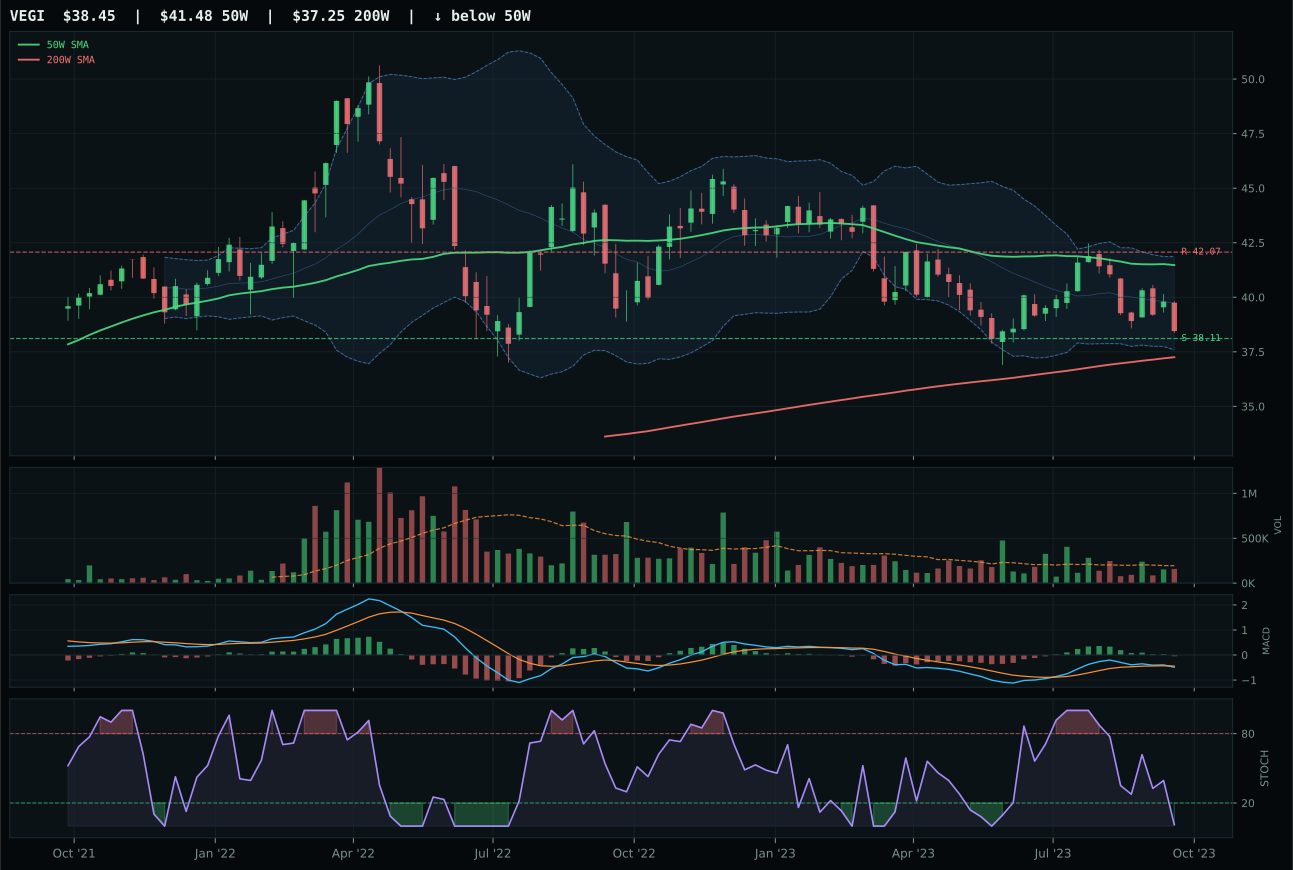
VEGI has a pullback into support profile with -1.2% 13-week relative strength versus SPY.
A failed hold above support would weaken the setup.
Tracked, but not top-2 eligible because: .
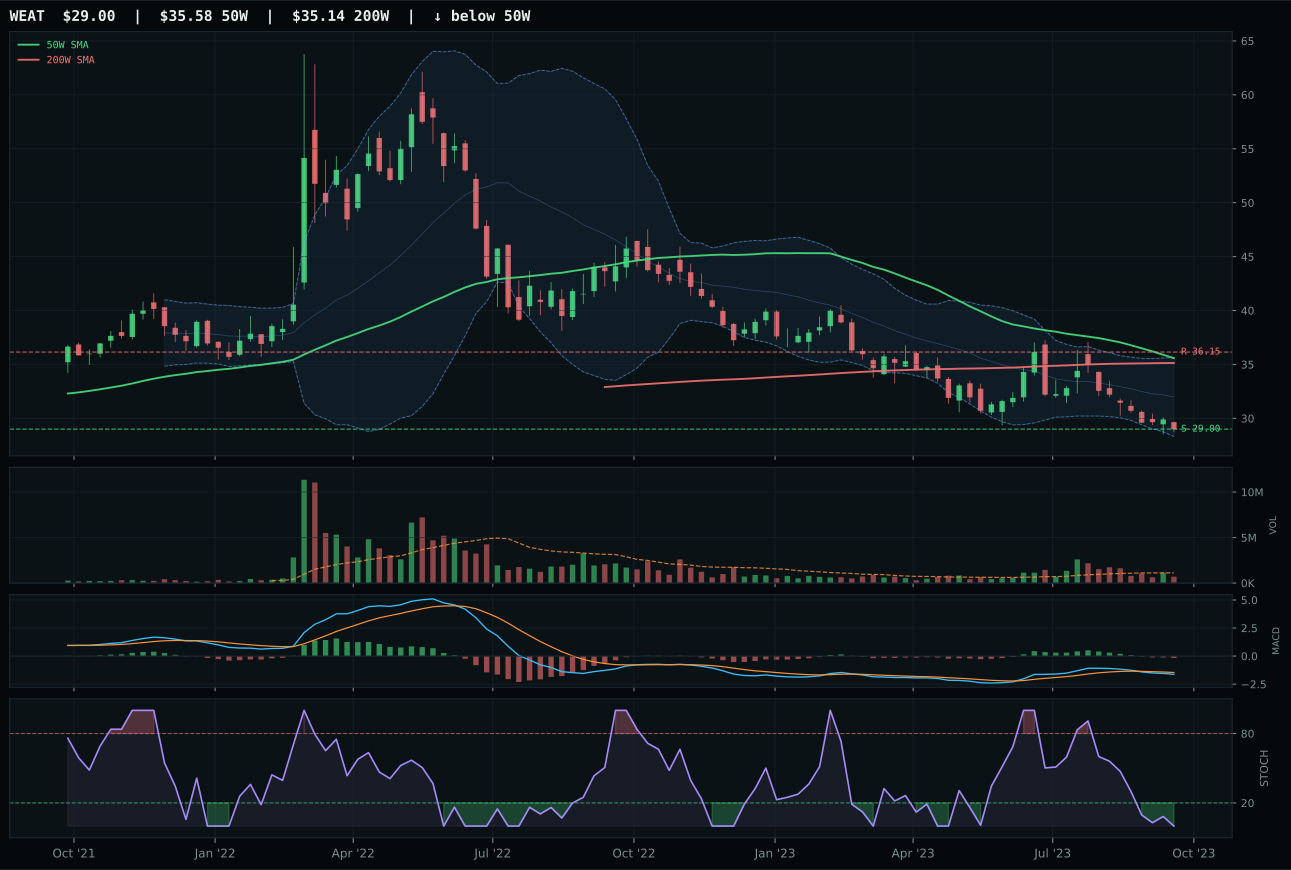
WEAT has a pullback into support profile with -19.1% 13-week relative strength versus SPY.
A failed hold above support would weaken the setup.
Actionable but governed by invalidation levels.
MOO wins decisively despite terrible momentum because it wins the support-holding game. Price is -7.2% from the 50W and below the 200W, signaling repair mode, but the timing score of 80.0 reflects a near-perfect technical pullback setup. Support at 79.28 is defined, Fibonacci repair zone at 0.786 aligns with that level, and MACD is bearish/weakening but holding above zero—not in freefall. Stochastic RSI at 0.01 is pancake-flat, suggesting capitulation rather than selling pressure. Risk/reward of 90.0 is exceptional: 0.3% downside to support versus -8.8% upside to resistance, which means the asymmetry favors patience. VEGI lost on a slim -0.6 point gap; the only difference is category-relative strength at 0.0% for VEGI versus 0.6% for MOO. Both face identical MACD, identical setup structure, and identical macro tailwinds. The 17.0-point winner's margin versus WEAT reflects proper diversification logic—MOO carries real liquidity and institutional access, while WEAT is a thin, speculative agricultural futures proxy.
Agriculture & Livestock receives 5% allocation despite a final score of 40.9 that ranks in the middle tier. The macro fit is exceptional at 90.0/100—supply shortage is active (+13), inflation pressure at +10, and real asset sponsorship at +8 all align with Late-Cycle Reflation conditions. This is one of the few categories where macro is doing heavy lifting for a weak technical position. MOO's technical evidence sits at only 35.8/100, driven by trend at 36.1 and momentum at 30.2, both reflective of a repair-mode setup. The allocation is not a conviction call on mean reversion but rather a macro hedge: if commodity scarcity persists and inflation remains sticky, agricultural equities will compound. The 13W return of -1.2% with -0.6% relative strength shows this sector is being ignored by momentum traders, creating an asymmetric risk/reward for patient capital. For this to move to tier-1, the technical setup would need to turn constructive—price reclaiming the 50W with volume—not just timing bottom patterns. Until then, 5% reflects a macro allocation that accepts near-term weakness in exchange for thematic exposure to supply constraints.
Defense & Aerospace — XAR
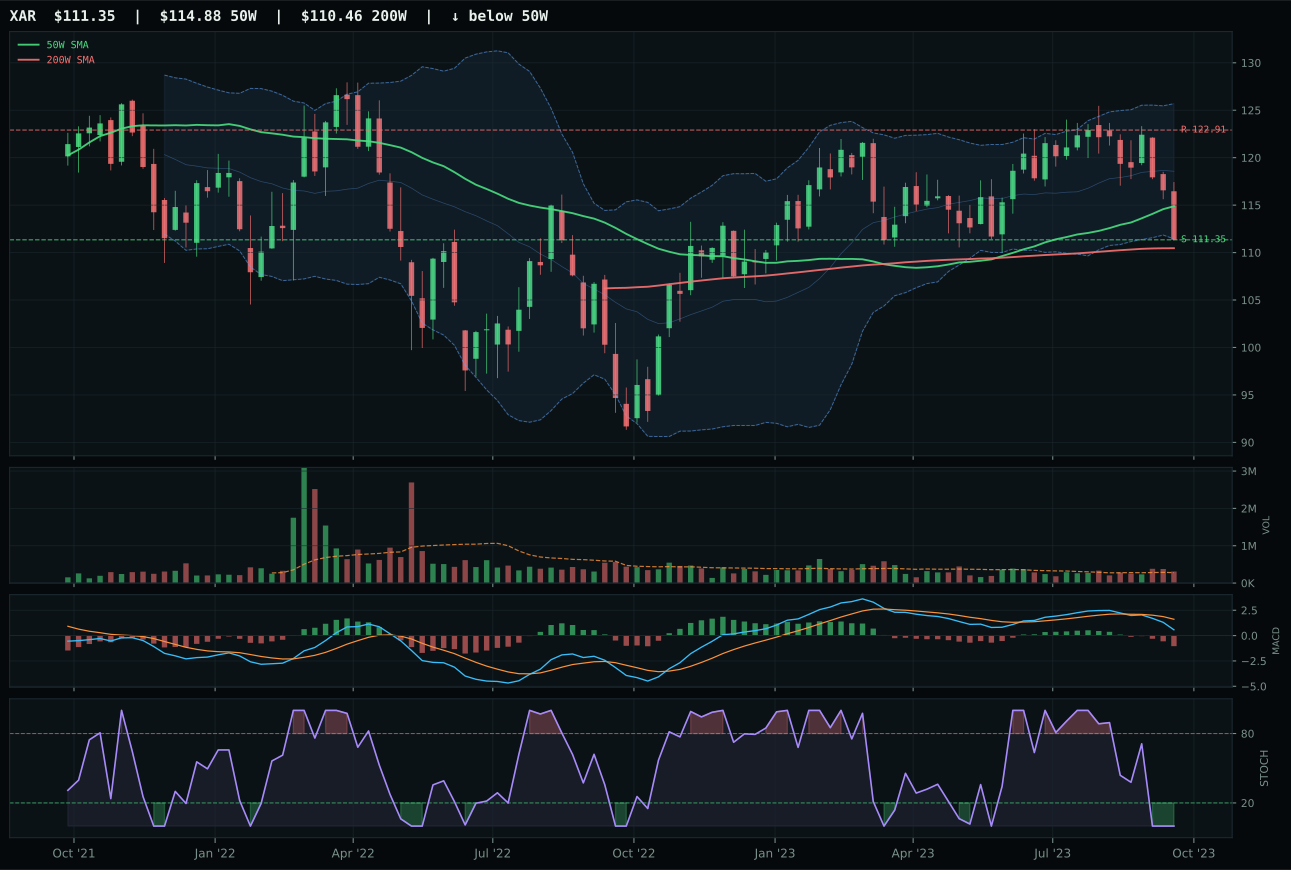
XAR has a pullback into support profile with -4.9% 13-week relative strength versus SPY.
A failed hold above support would weaken the setup.
Actionable but governed by invalidation levels.
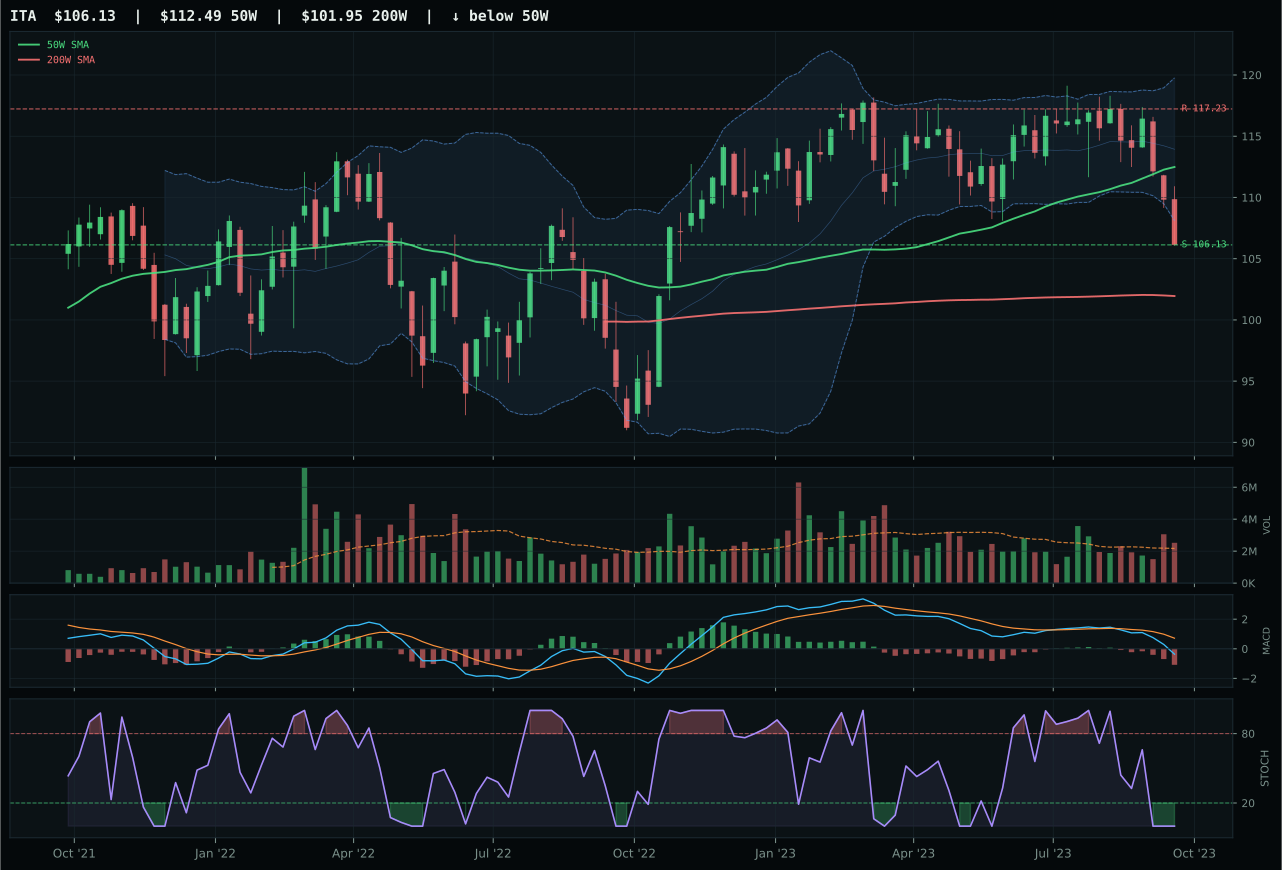
ITA has a pullback into support profile with -6.0% 13-week relative strength versus SPY.
A failed hold above support would weaken the setup.
Actionable but governed by invalidation levels.
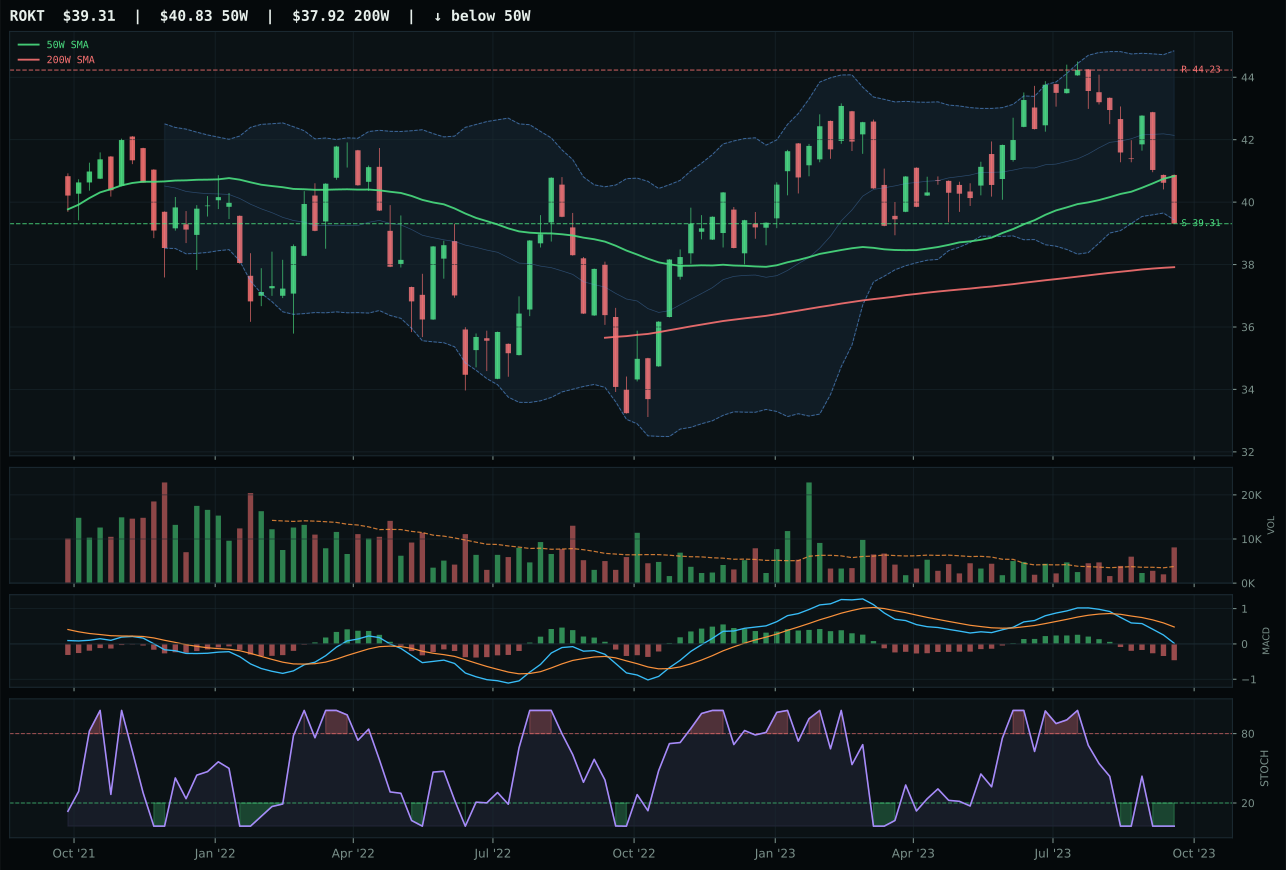
ROKT has a pullback into support profile with -6.5% 13-week relative strength versus SPY.
A failed hold above support would weaken the setup.
Tracked, but not top-2 eligible because: .
XAR wins by excelling at what this market structure rewards: pullback into support with extreme timing edge. Price sits at -3.1% from the 50W with the chart pulling toward 111.35 support, giving this setup a clean invalidation zone—if support breaks, the trade is wrong. The timing score of 100.0 reflects perfect conditions: MACD is bearish/weakening, stochastic RSI is at 0.00, and Fibonacci support at 0.382 aligns near the technical support zone. Volume at 1.10x the 20W average shows real participation, and the risk/reward of 74.2 is exceptional—upside to resistance is -9.4% (capped), while downside to support is 0.0% (defined). ITA lost because its timing registered only 87.0 despite a nearly identical setup; the difference lies in price proximity to key levels and support solidity. XAR's 1.1% category-relative strength edge is marginal, but the 6.8-point composite advantage comes from superior timing and superior risk/reward, making this a mechanically sound entry point rather than a momentum chase.
Defense & Aerospace receives 5% as tier-2, held back despite a 29.8 category score by two higher-ranking categories. The macro fit of 66.0/100 is notably strong—Late-Cycle Reflation aids this sector (+6), the broad market bear is active (+6), and dollar pressure (+3) actually supports defense spending. However, the technical evidence is only 34.3/100 for the winner, reflecting a category in repair rather than growth. XAR's 13W return of -5.5% and -4.9% relative strength versus SPY show a sector in drawdown mode. The allocation case rests on mean reversion logic: support is defined, timing is pristine, and macro conditions for defense durability remain stable. The broad market bear and dollar strength could extend the pullback, making this more of a patient accumulation zone than an urgent add. To earn tier-1 status, XAR would need to reclaim the 50W with volume confirmation, signaling institutional re-entry rather than a support bounce. Until then, 5% positions us for the mean-reversion trade without overcommitting to a sector that is still in technical repair.
Technology — CIBR
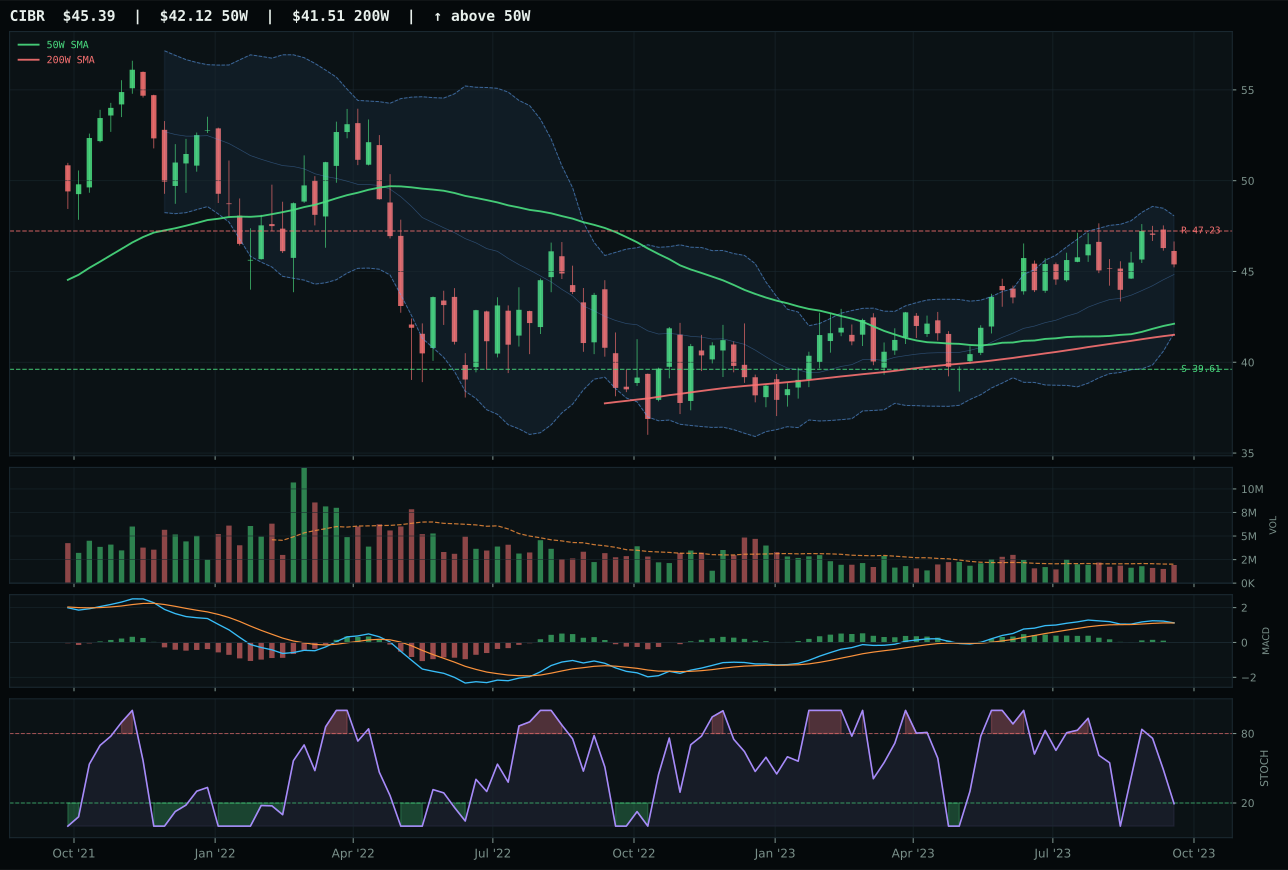
CIBR has a neutral structure profile with 3.9% 13-week relative strength versus SPY.
A failed hold above support would weaken the setup.
Actionable but governed by invalidation levels.
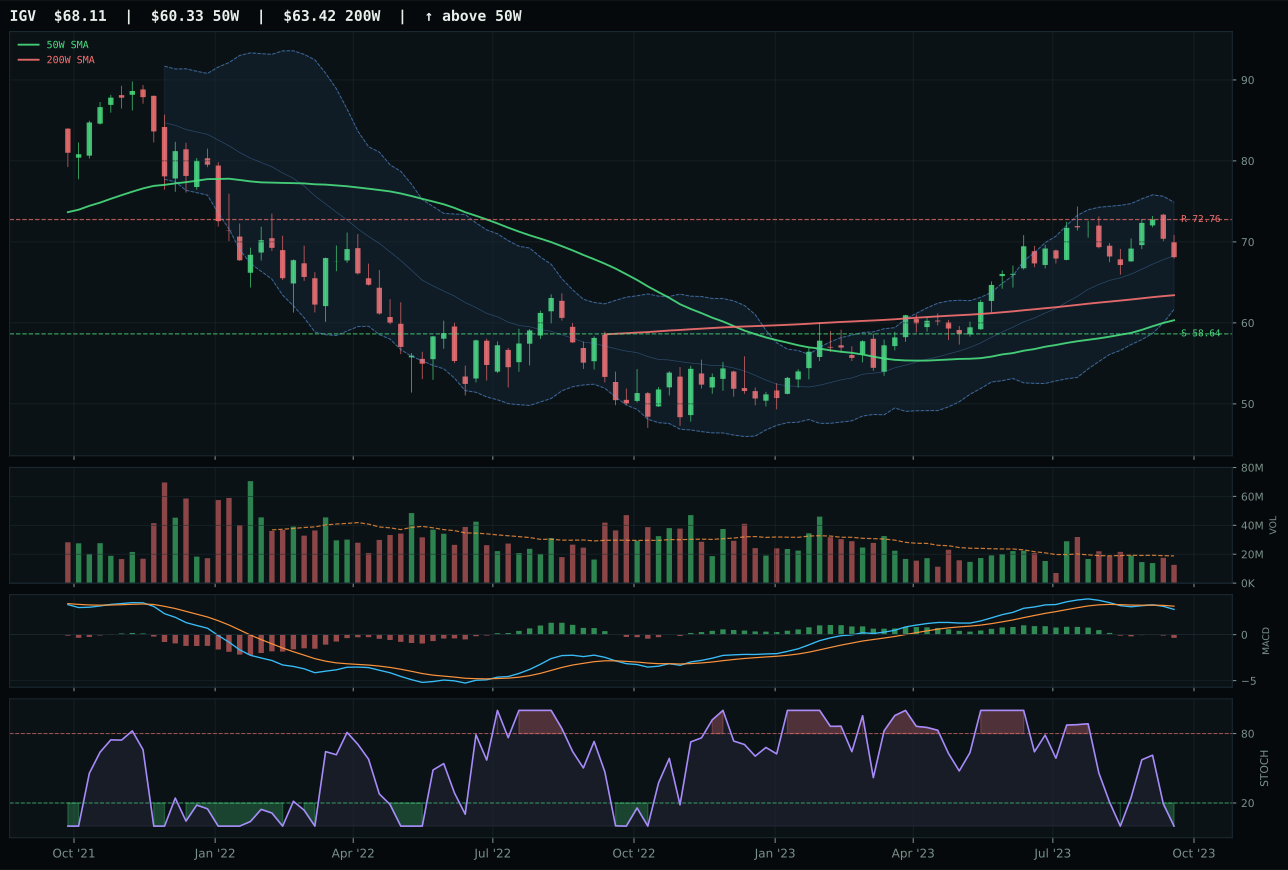
IGV has a neutral structure profile with 1.8% 13-week relative strength versus SPY.
A failed hold above support would weaken the setup.
Actionable but governed by invalidation levels.
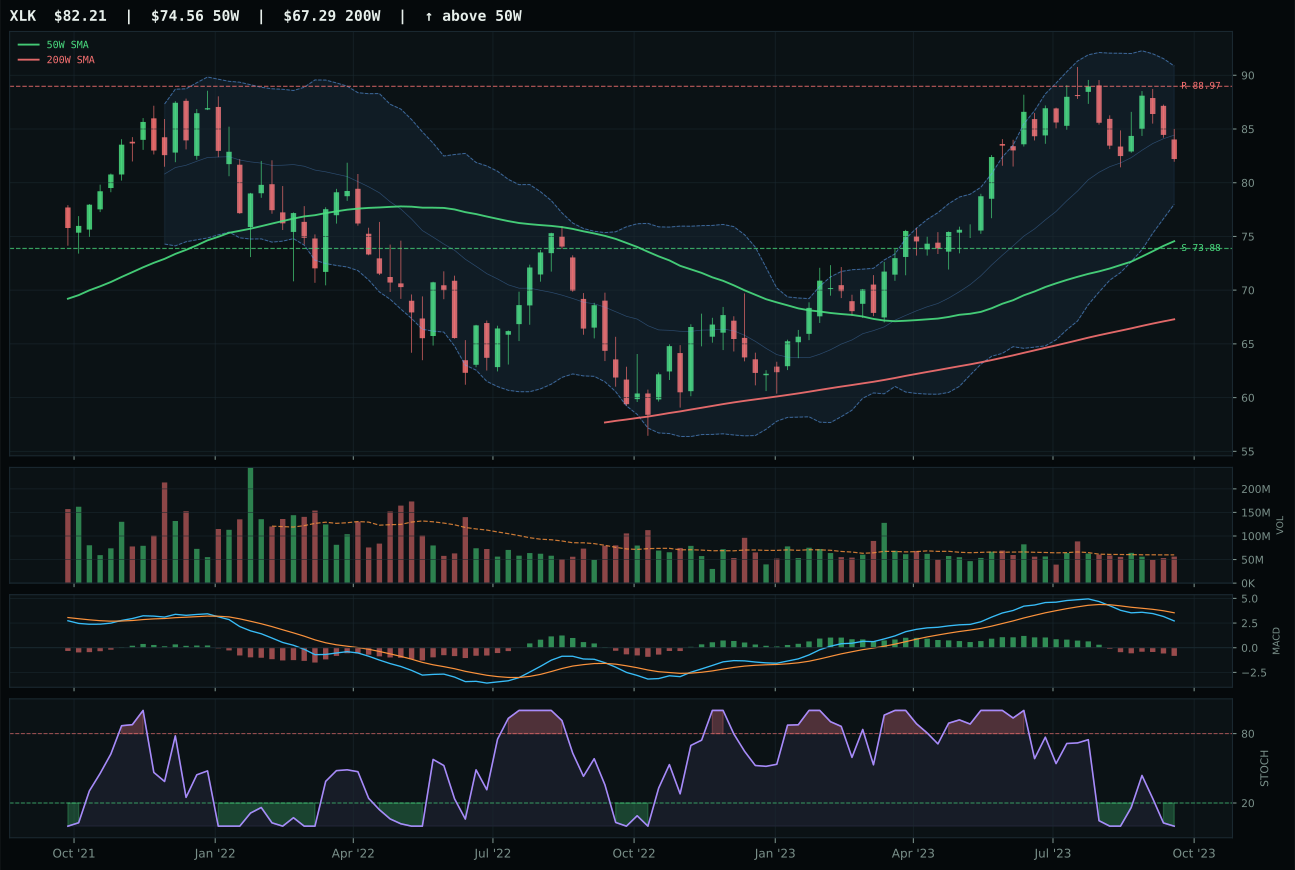
XLK has a neutral structure profile with -1.9% 13-week relative strength versus SPY.
A failed hold above support would weaken the setup.
Actionable but governed by invalidation levels.
CIBR wins the category because its relative strength versus SPY at 3.9% and category-relative strength at 2.1% demonstrate active accumulation in a technically sound setup. Price sits comfortably above both the 50W and 200W moving averages with a stable 0.3% slope, and volume at 0.96x the 20W average confirms the move is not speculative but measured. The timing setup is neutral-to-bullish: MACD is bullish but flattening—not yet rolling over—while the stochastic RSI at 0.19 suggests oversold conditions that can extend a rally rather than cap it. IGV lost despite neutral structure because its MACD is bearish/weakening, its 1.8% RS versus SPY trails CIBR by 210 basis points, and it sits 12.9% from the 50W—a stretched entry that penalizes late buyers. CIBR's 11.1-point edge in the composite score reflects cleaner breadth and better volume confirmation in a setup that rewards cybersecurity's relative defensiveness in a late-cycle regime.
Technology receives 5% allocation as a tier-2 category, ranking behind higher-conviction setups but still meriting capital deployment. The category's final score of 25.9 came under pressure from a 24.0/100 macro fit—liquidity stress at -10 and credit stress at -7 are real headwinds for growth-duration assets in this regime. However, CIBR's technical evidence at 70.8/100 and its 2.1% category-relative strength edge proved just sufficient to warrant a position. The tension here is straightforward: the macro backdrop is hostile to technology, yet CIBR's momentum confirmation and volume-price sponsorship remain intact. For this category to move to top-2 status, either the active macro descriptors would need to shift—credit stress would need to ease materially—or CIBR would need to break above 187.46 resistance with heavy volume confirmation. Until then, 5% reflects measured exposure to the one technology name that is not being sold by meaningful smart money.
AI — AIQ
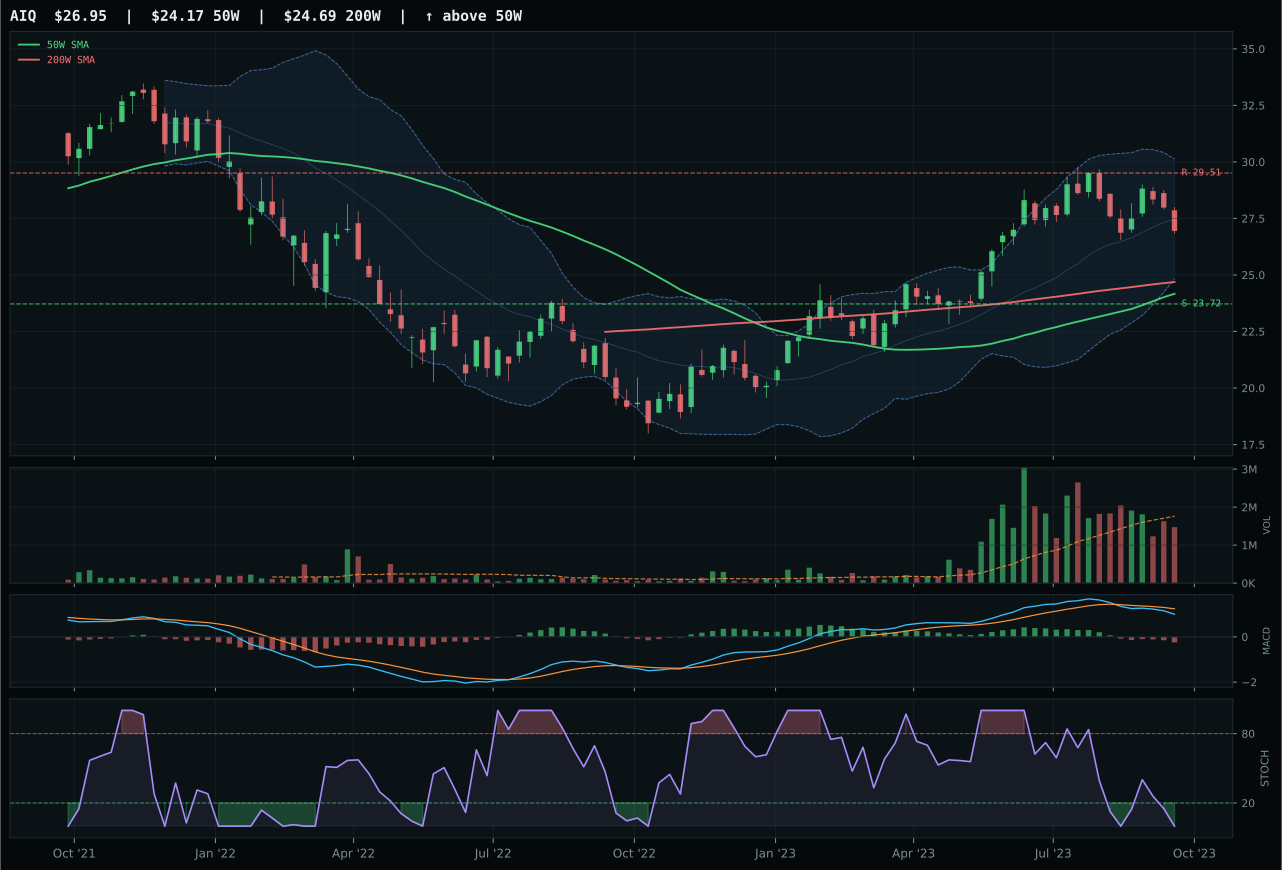
AIQ has a neutral structure profile with -1.1% 13-week relative strength versus SPY.
A failed hold above support would weaken the setup.
Actionable but governed by invalidation levels.
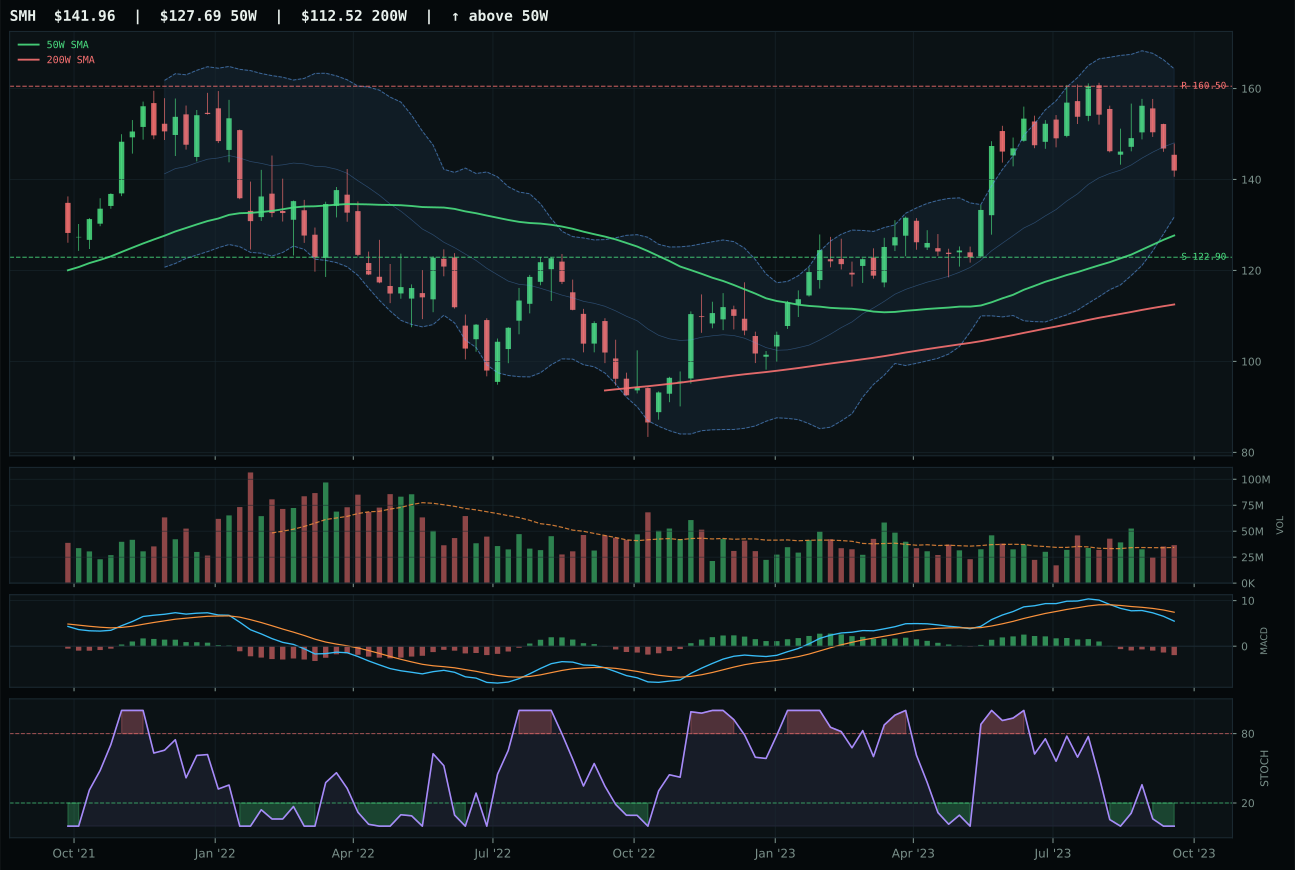
SMH has a neutral structure profile with -3.1% 13-week relative strength versus SPY.
A failed hold above support would weaken the setup.
Actionable but governed by invalidation levels.
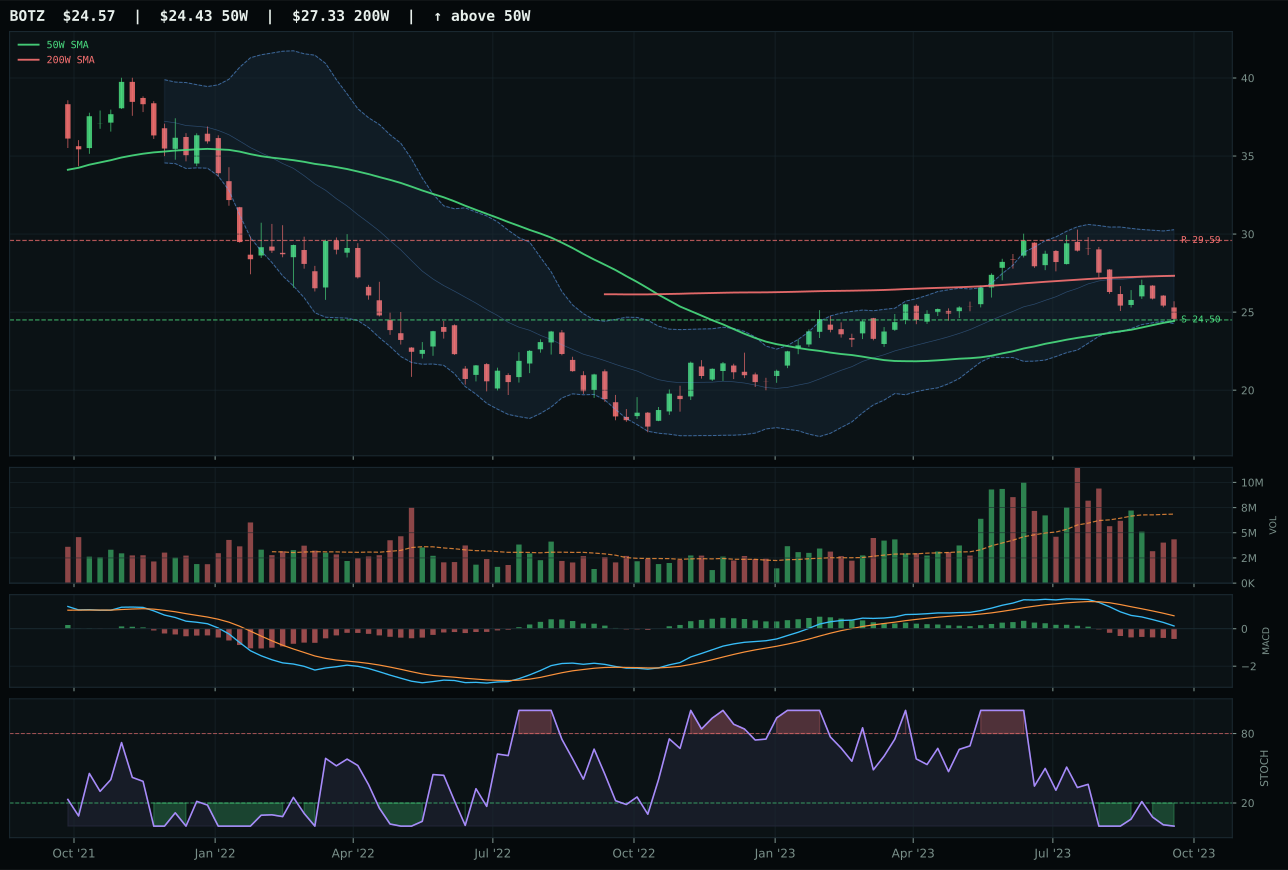
BOTZ has a pullback into support profile with -11.4% 13-week relative strength versus SPY.
A failed hold above support would weaken the setup.
Actionable but governed by invalidation levels.
AIQ wins a weak category by winning weaker. Its 2.0% category-relative strength versus -3.1% for SMH provides the only meaningful edge, though both names are underwater on a 13W basis at -1.7% and -3.8% respectively. Price remains above the 50W and 200W, but that uptrend is mechanical—MACD is bearish/weakening, stochastic RSI is at 0.00, and volume at 0.84x the 20W average shows thin participation. The timing score of 70.0 reflects distance to the 50W at 11.5%, which is actually generous given the bearish MACD. SMH's composite of 61 versus AIQ's 64 masks identical macro pressure: both face -10 liquidity stress and -7 credit stress, making this a choice between two underwater positions. AIQ's structure cleanliness at 33.3 is weak, but so is SMH's at the category level. The 3.0-point score gap is decided almost entirely by the 2.0% relative strength edge.
AI receives 0% allocation and ranks outside the portfolio this week as the 9th or 10th category. The final category score of 17.8 reflects catastrophic macro fit at 18.0/100, driven by -12 liquidity stress, -8 credit stress, and -8 broad market bear all firing simultaneously. Technical evidence of 42.9/100 for the winner cannot overcome this backdrop. The category failed eligibility not because of a single technical break but because the macro regime is explicitly hostile to speculative, duration-heavy AI software. Both AIQ and SMH are extended from their 50W, and when both MACD and breadth are deteriorating, extended positions become liabilities. For AI to earn even tier-2 status, liquidity stress would need to reverse and the broad market bear would need to show real signs of fading—neither is evident this week. The category's composite technical setup remains bearish/weakening with overbought stochastic RSI readings that could suggest capitulation, but the timing is wrong. Zero allocation here is not a forecast; it is a regime call.
Emerging Markets — ILF
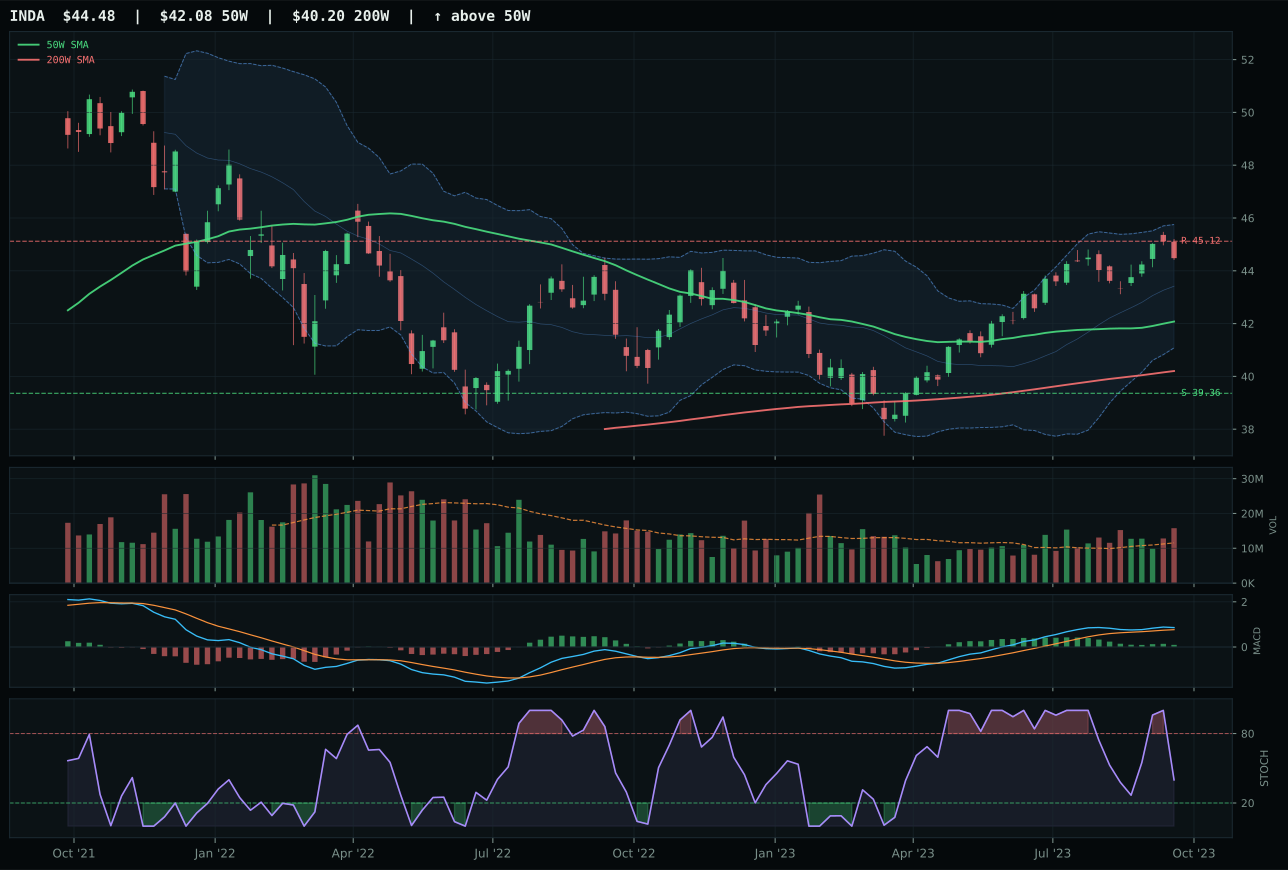
INDA has a neutral structure profile with 5.1% 13-week relative strength versus SPY.
A failed hold above support would weaken the setup.
Actionable but governed by invalidation levels.
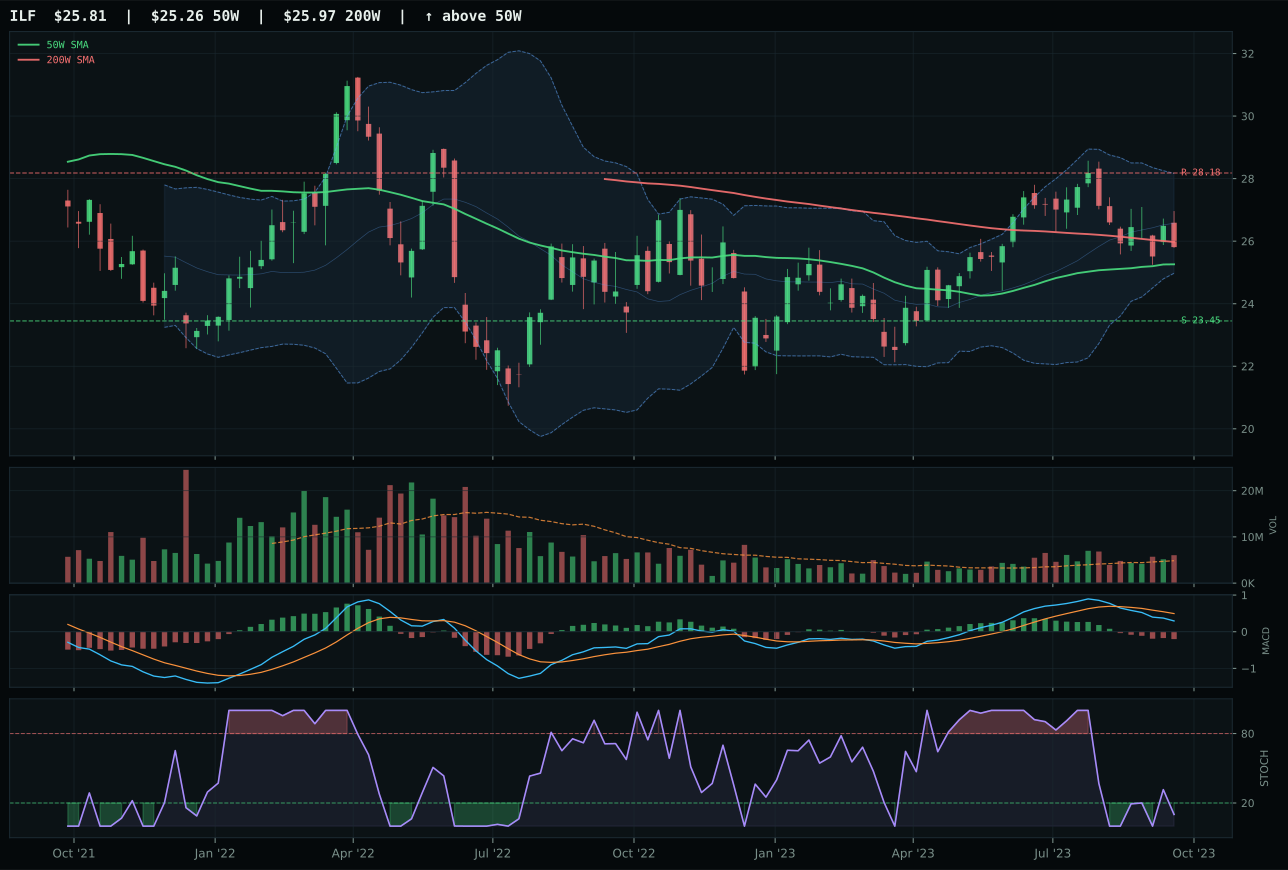
ILF has a compression near 50W profile with -4.3% 13-week relative strength versus SPY.
A failed hold above support would weaken the setup.
Actionable but governed by invalidation levels.
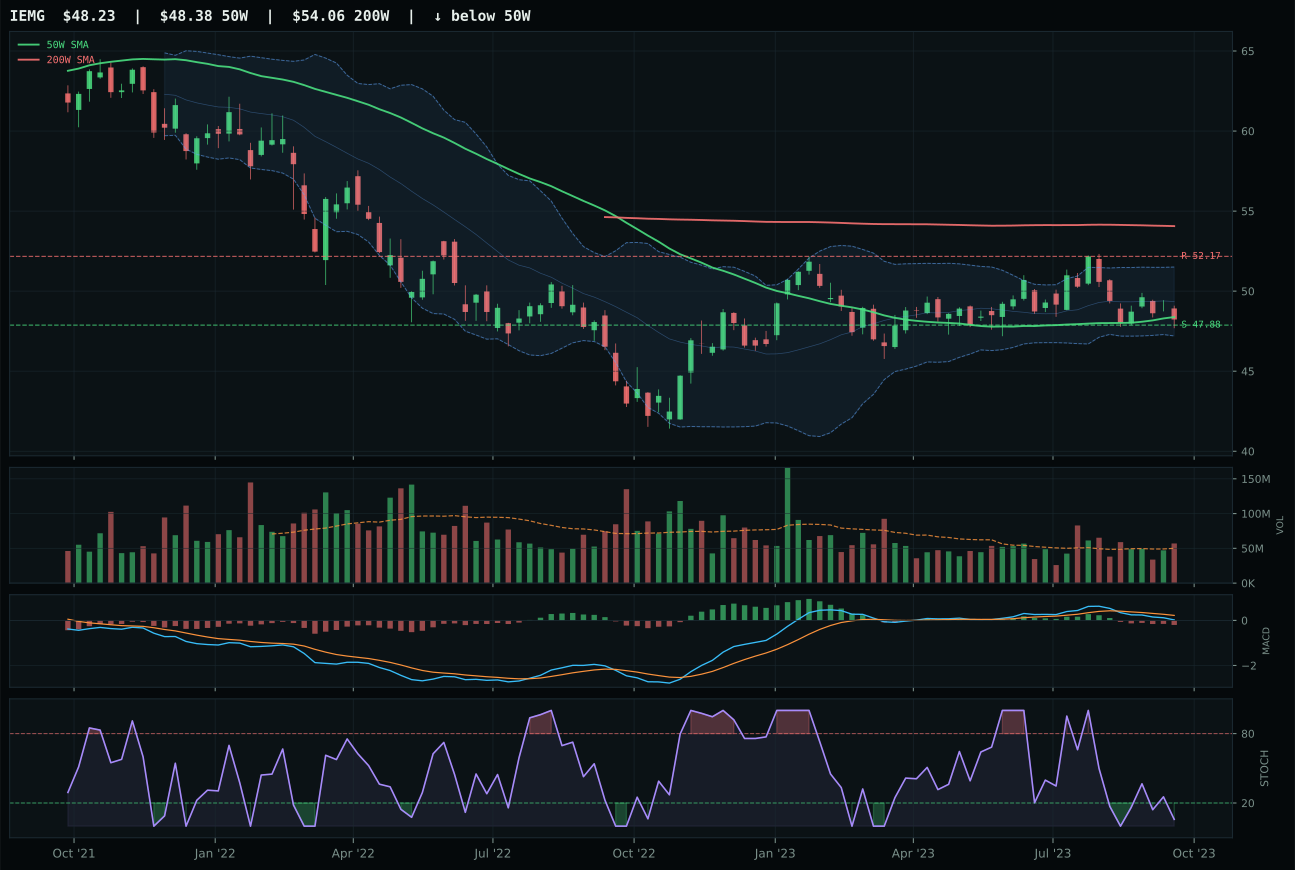
IEMG has a pullback into support profile with -0.4% 13-week relative strength versus SPY.
Extension and support failure are the main tactical risks.
Tracked, but not top-2 eligible because: structurally broken.
ILF wins a weak field by winning narrowly. Its timing score of 95.0 is exceptional—price sits only 2.2% from the 50W in a compression-near-50W setup, with MACD bearish/weakening and stochastic RSI oversold at 0.10, creating perfect retest geometry. Support at 23.45 and resistance at 28.18 define a clean 10.1% downside and -8.4% upside ratio, a 1.2-to-1 asymmetry that favors patience. The risk/reward of 68.0 is the strongest in the category. However, the 13W return of -4.9% and -4.3% RS versus SPY show ILF is underwater, and momentum confirmation of only 18.0 reflects weak breadth. INDA technically dominates with 76.9 technical evidence and 5.1% RS versus SPY, but its timing registers only 70.0 and its risk/reward 47.0—worse odds for entry. ILF wins because timing and risk/reward asymmetry matter more in a weak regime than raw momentum. The -15.4 point gap versus INDA reflects categorical rejection of India growth exposure in the current macro environment.
Emerging Markets receives 0% allocation and ranks outside the portfolio this week, failing on catastrophic macro fit of 7.0/100. The active macro descriptors are explicitly hostile: dollar pressure at -14, credit stress at -10, liquidity stress at -10, and broad market bear at -9 all fire simultaneously against emerging market exposure. Late-Cycle Reflation normally favors EM commodity stories, but this regime has flipped: dollar strength and credit stress make EM liabilities. ILF's technical evidence of 30.3/100 is weak (momentum at 18.0, volume-price at 26.7), and while the timing setup is mechanically sound, it cannot overcome macro headwinds. INDA's superior technical evidence of 76.9 would normally merit consideration, but its macro fit at 35.0/100 is still deeply negative. For Emerging Markets to earn even tier-2 status at 5%, dollar pressure would need to reverse materially and liquidity stress would need to ease. Neither is evident. This is a regime exclusion: the portfolio is not forecasting EM weakness long-term, but the current macro state explicitly penalizes EM. The ILF compression setup will hold support and possibly bounce, but the risk is that dollar strength extends and credit concerns widen, pushing ILF 10%+ lower despite the attractive timing entry. Zero allocation acknowledges that even clean entries cannot overcome hostile macro conditions.