
2023-09-15
Informational purposes only. The content in this report, including allocations, analysis, and commentary, is provided solely for informational and educational purposes. It does not constitute financial advice, investment advice, trading advice, or any other type of advice. Past performance does not guarantee future results. Always conduct your own research and consult a qualified financial professional before making investment decisions.
Weekly Allocation
| Ticker | Category | Weight | Role |
|---|---|---|---|
| FBTC | 50% | Overlay | |
| XLE | Traditional Energy | 10% | Top-2 (10%) |
| URNM | Nuclear Energy | 10% | Top-2 (10%) |
| GLD | Precious Metals | 5% | Tier-2 (5%) |
| COPX | Industrial Metals | 5% | Tier-2 (5%) |
| XLU | Utilities & Infrastructure | 5% | Tier-2 (5%) |
| MOO | Agriculture & Livestock | 5% | Tier-2 (5%) |
| XAR | Defense & Aerospace | 5% | Tier-2 (5%) |
| CIBR | Technology | 5% | Tier-2 (5%) |
Trade Instructions — Monday Open
Sell the tranche from 2023-08-18 (completing its 4-week hold). Buy the new tranche. Instructions show net portfolio changes — same-asset positions cancel, weight changes show the delta.
| Action | Ticker | Instruction |
|---|---|---|
| SELL | AIQ | Sell entire AIQ position (1.25% of portfolio) |
| SELL | ITA | Sell 33% of ITA position (reduce 3.75% → 2.50%) |
| BUY | XAR | Buy XAR — 50.00% of freed cash (adds 1.25% to portfolio) |
| BUY | XLU | Buy XLU — 50.00% of freed cash (adds 1.25% to portfolio) |
Current Portfolio After Trade
Combined holdings across all 4 active tranches. Each tranche is 25% of the portfolio.
| Ticker | % of Portfolio | Weight Bar |
|---|---|---|
| FBTC | 50.00% | |
| XLE | 10.00% | |
| URNM | 10.00% | |
| MOO | 5.00% | |
| CIBR | 3.75% | |
| GLD | 3.75% | |
| PAVE | 3.75% | |
| ITA | 2.50% | |
| COPX | 2.50% | |
| PICK | 2.50% | |
| XAR | 2.50% | |
| SLV | 1.25% | |
| IGV | 1.25% | |
| XLU | 1.25% |
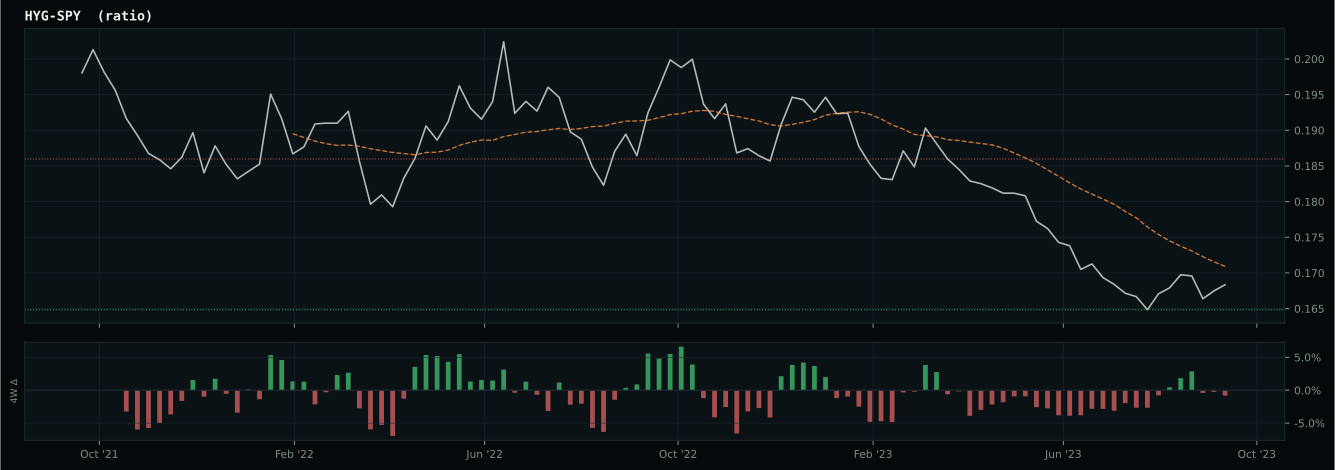
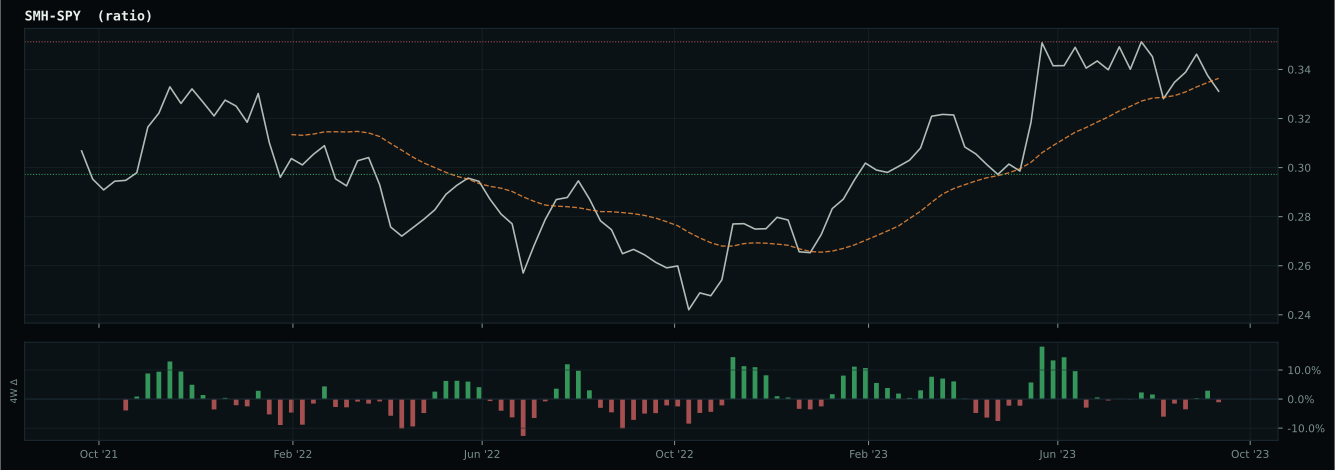
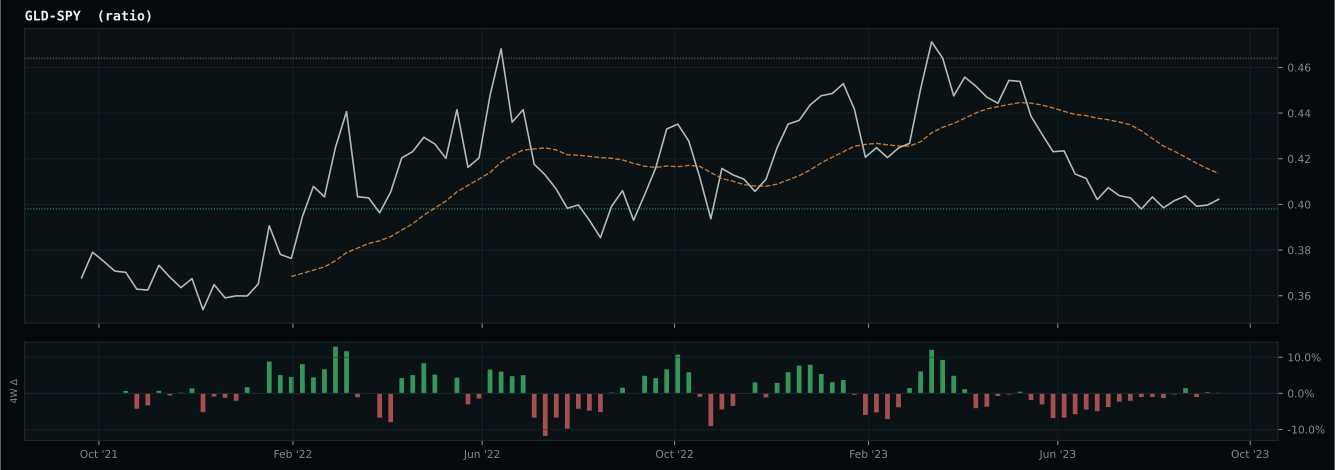
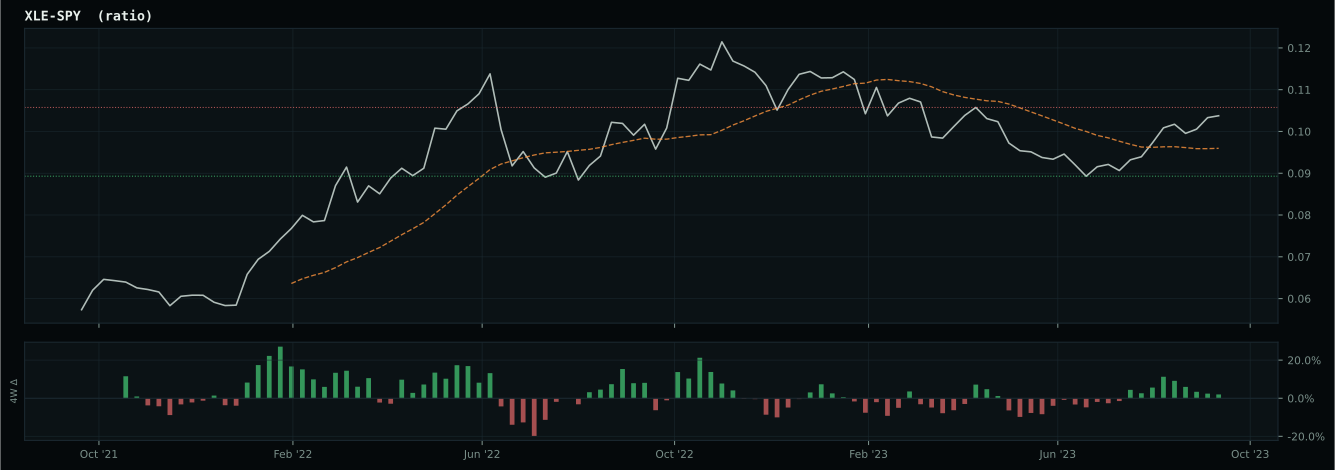
Macro Regime — Late-Cycle Reflation
Macro Evidence Charts
Market-implied signals behind the macro regime scores. Each ratio compares two assets; the direction and slope of the ratio is what the macro engine reads.
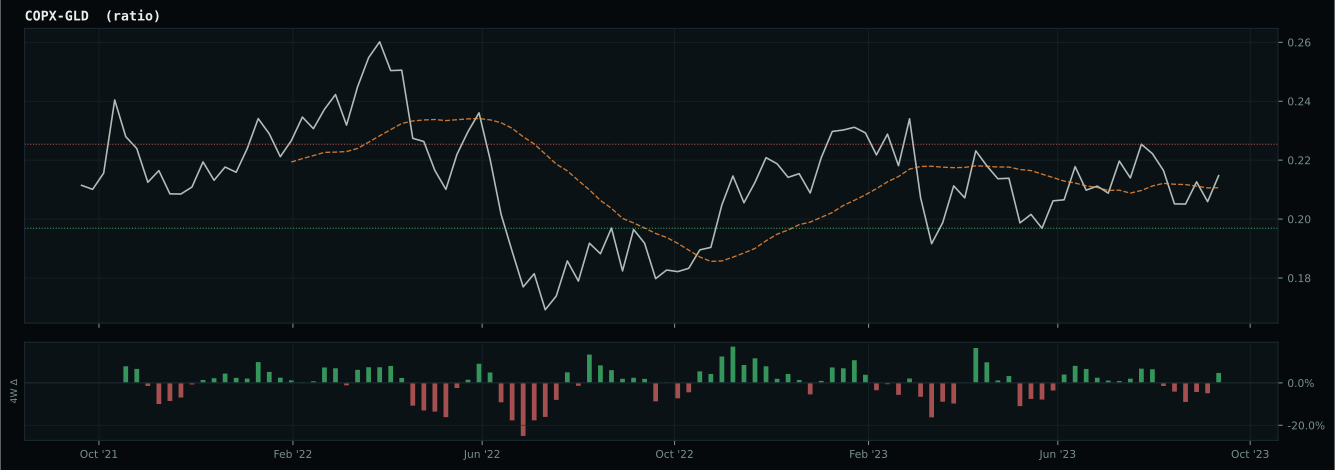
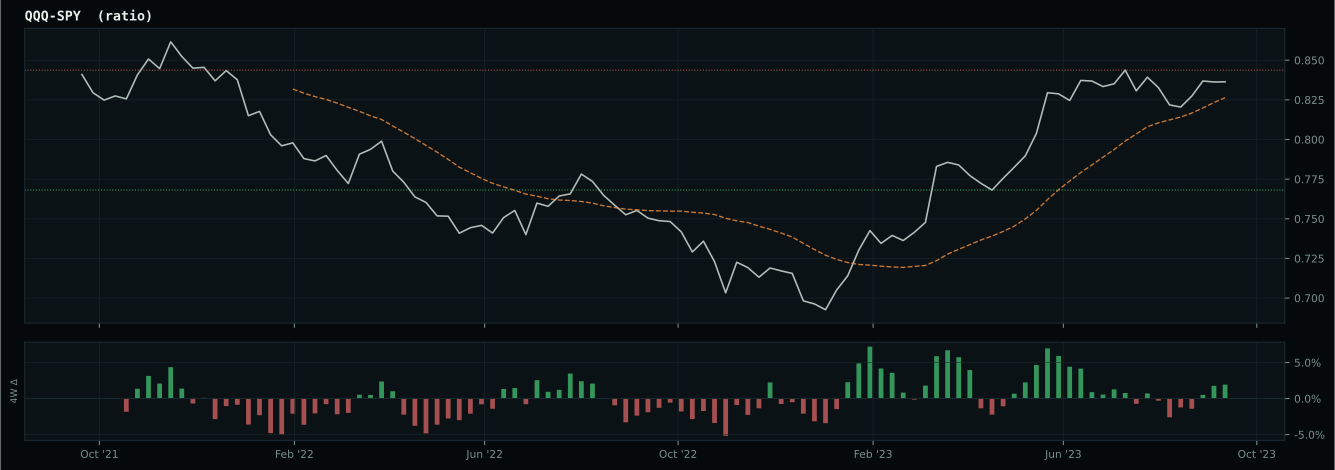
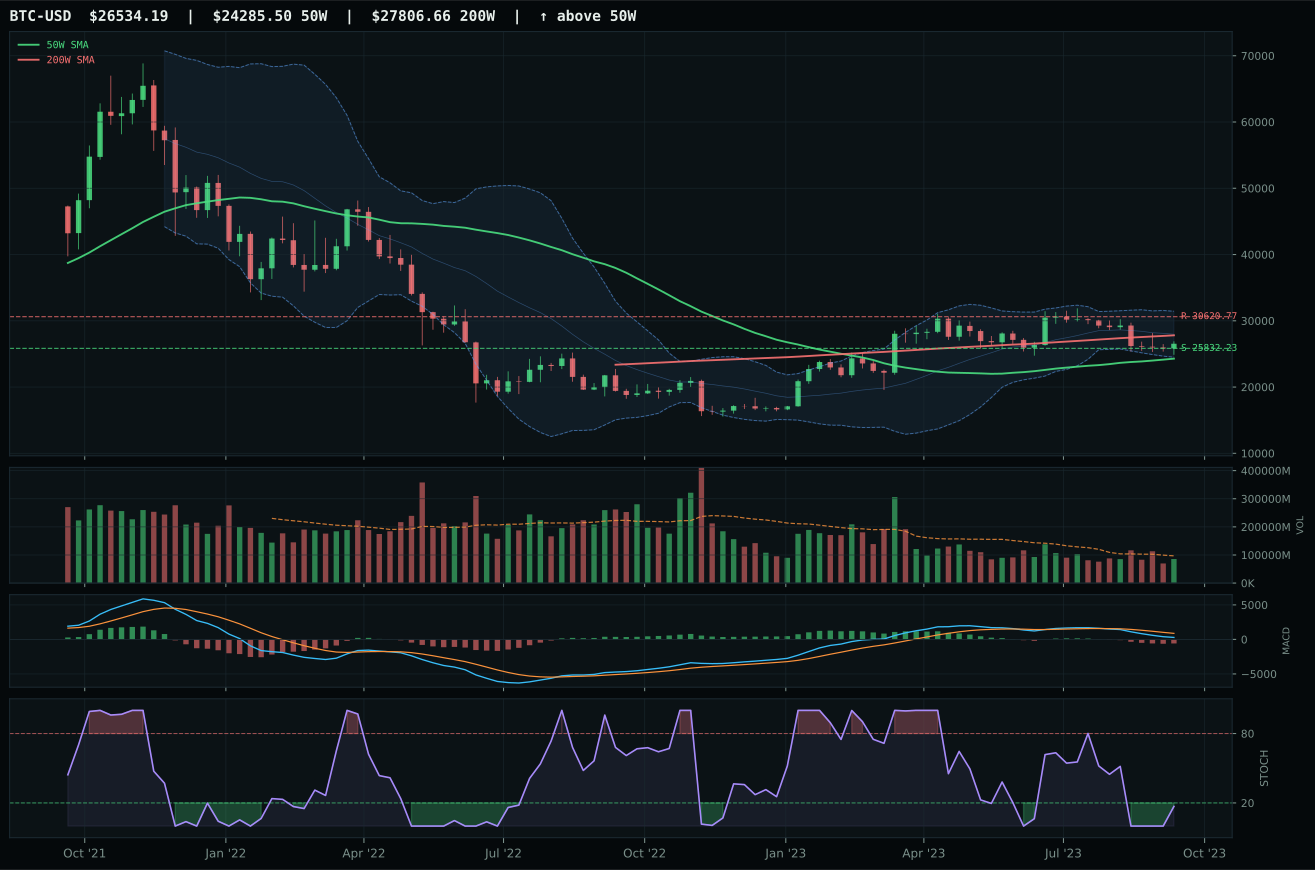
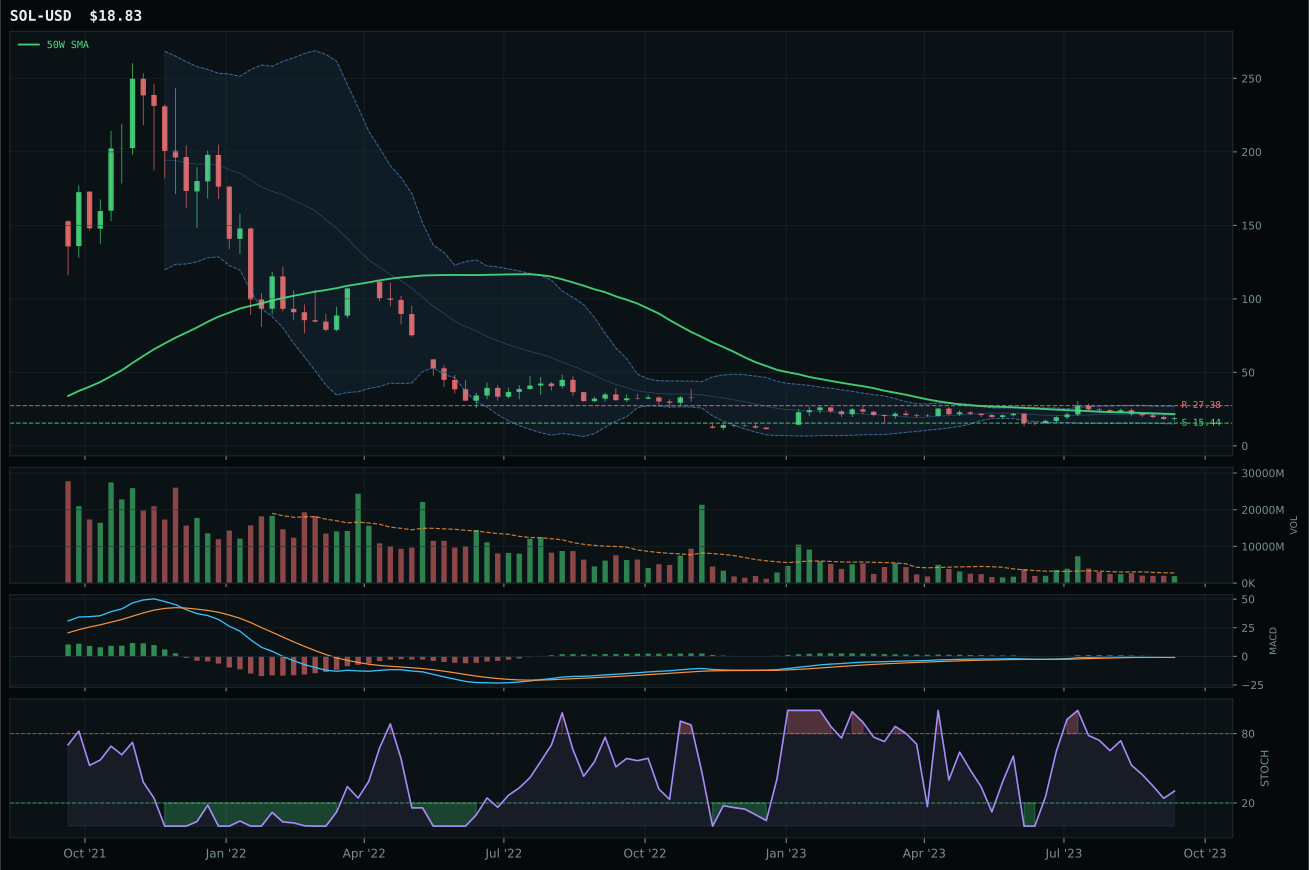
Crypto Regime — TrendBTC
post-touch structure is too wide to count as a range; max/min close ratio is 1.88
TrendBTC confirmed: 2 consecutive closes above rising/flat 50W SMA
one or more available conditions failed
Category Rankings
| Rank | Category | Winner | Score | Alloc | 4W Ret | Peers (4W) |
|---|---|---|---|---|---|---|
| 1 | Traditional Energy | XLE | 82.0 | 20% | -2.29% | XOP -0.9% · FCG +1.1% |
| 2 | Nuclear Energy | URNM | 71.0 | 20% | -4.01% | URA -5.2% · NLR -3.6% |
| 3 | Precious Metals | GLD | 45.0 | 10% | -0.55% | SLV -2.4% · GDX -2.6% |
| 4 | Industrial Metals | COPX | 44.8 | 10% | -8.14% | PICK -5.2% · REMX -11.9% |
| 5 | Utilities & Infrastructure | XLU | 43.9 | 10% | -7.82% | IGF -6.5% · PAVE -2.0% |
| 6 | Agriculture & Livestock | MOO | 41.9 | 10% | -7.27% | VEGI -5.7% · WEAT -1.7% |
| 7 | Defense & Aerospace | XAR | 33.1 | 10% | -0.03% | ITA -0.4% · ROKT -1.9% |
| 8 | Technology | CIBR | 29.3 | 10% | +0.39% | IGV +0.1% · XLK +0.5% |
| 9 | AI | AIQ | 15.4 | 0% | -2.66% | SMH +2.1% · BOTZ -4.3% |
| 10 | Emerging Markets | INDA | 9.6 | 0% | -1.04% | ILF -5.5% · IEMG -3.0% |
Traditional Energy — XLE
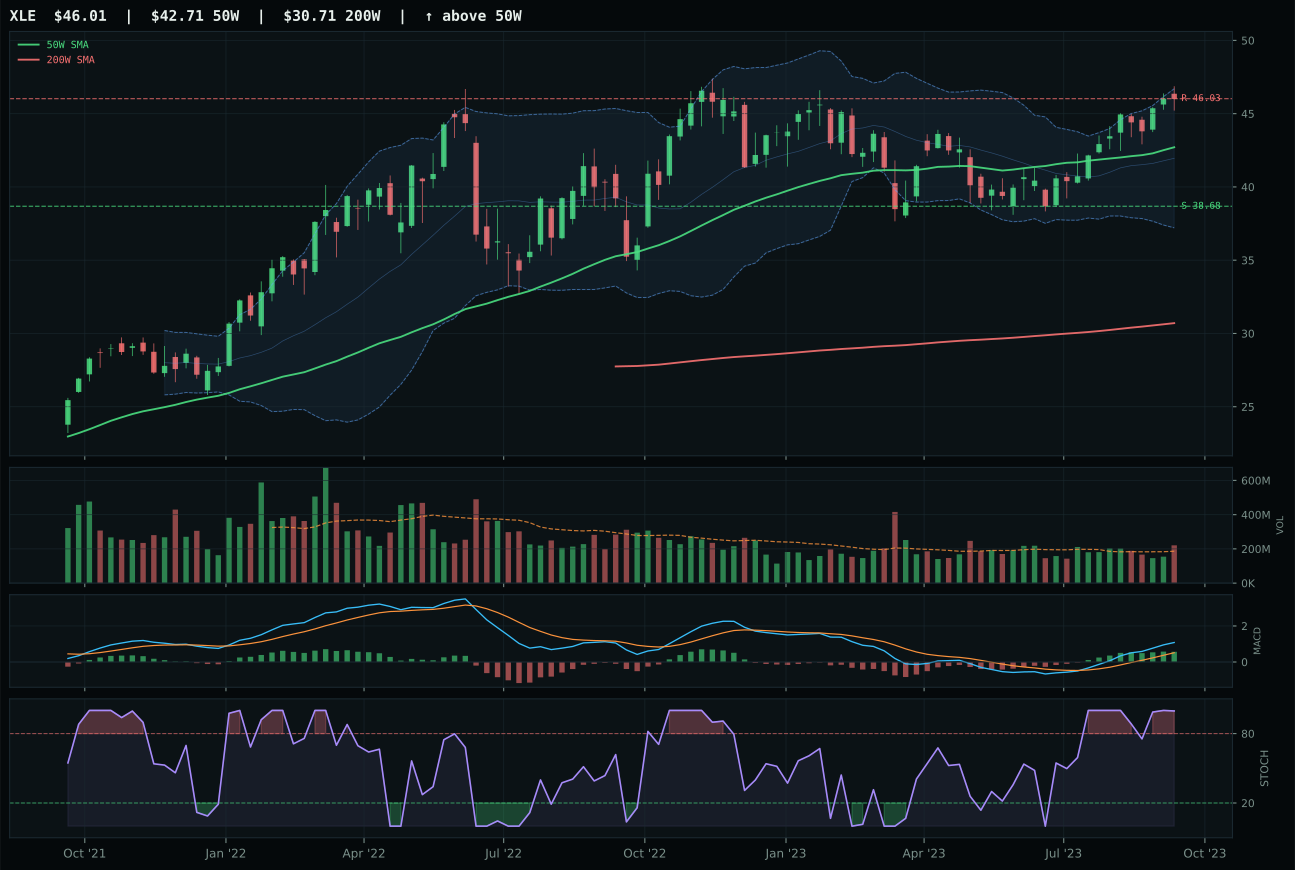
XLE has a neutral structure profile with 12.9% 13-week relative strength versus SPY.
A failed hold above support would weaken the setup.
Actionable but governed by invalidation levels.
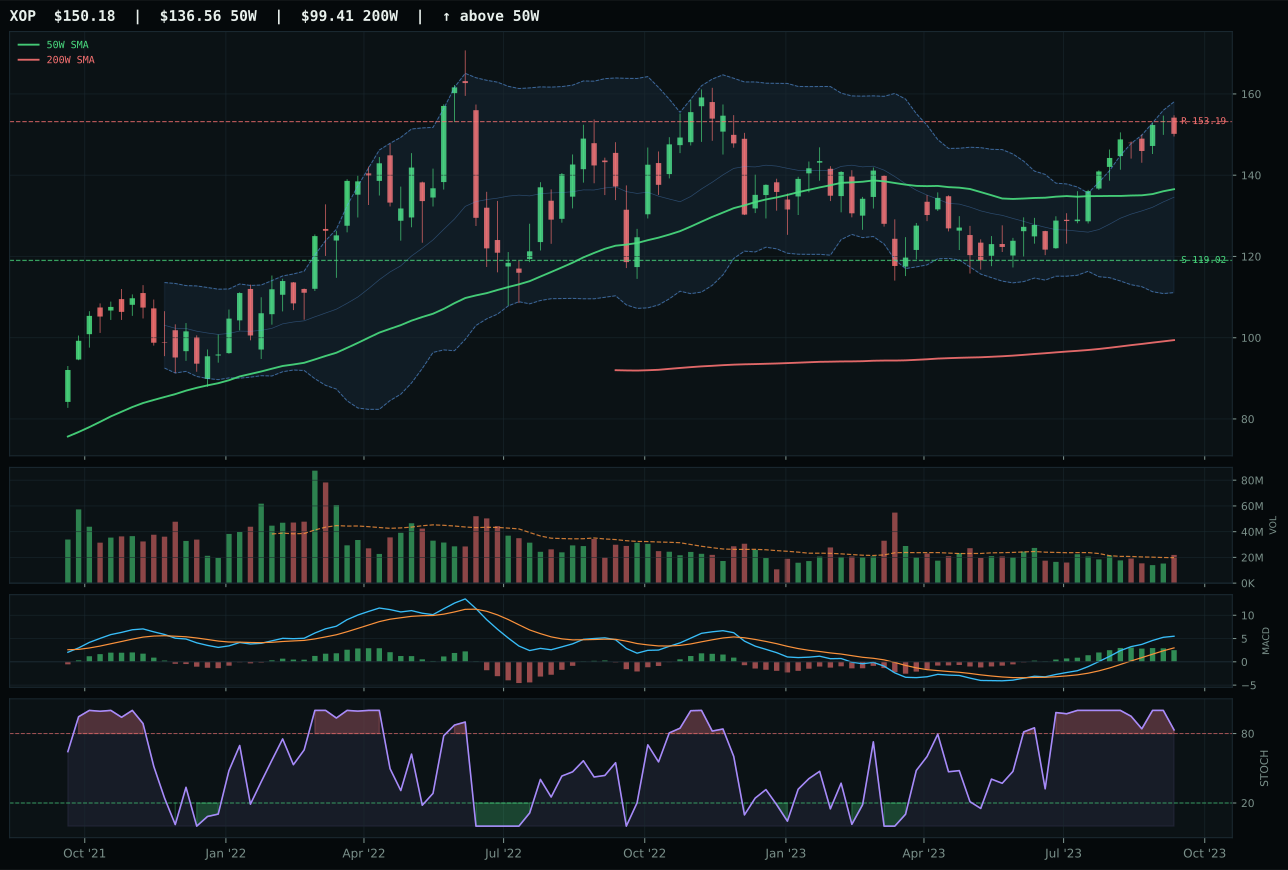
XOP has a neutral structure profile with 16.7% 13-week relative strength versus SPY.
A failed hold above support would weaken the setup.
Actionable but governed by invalidation levels.
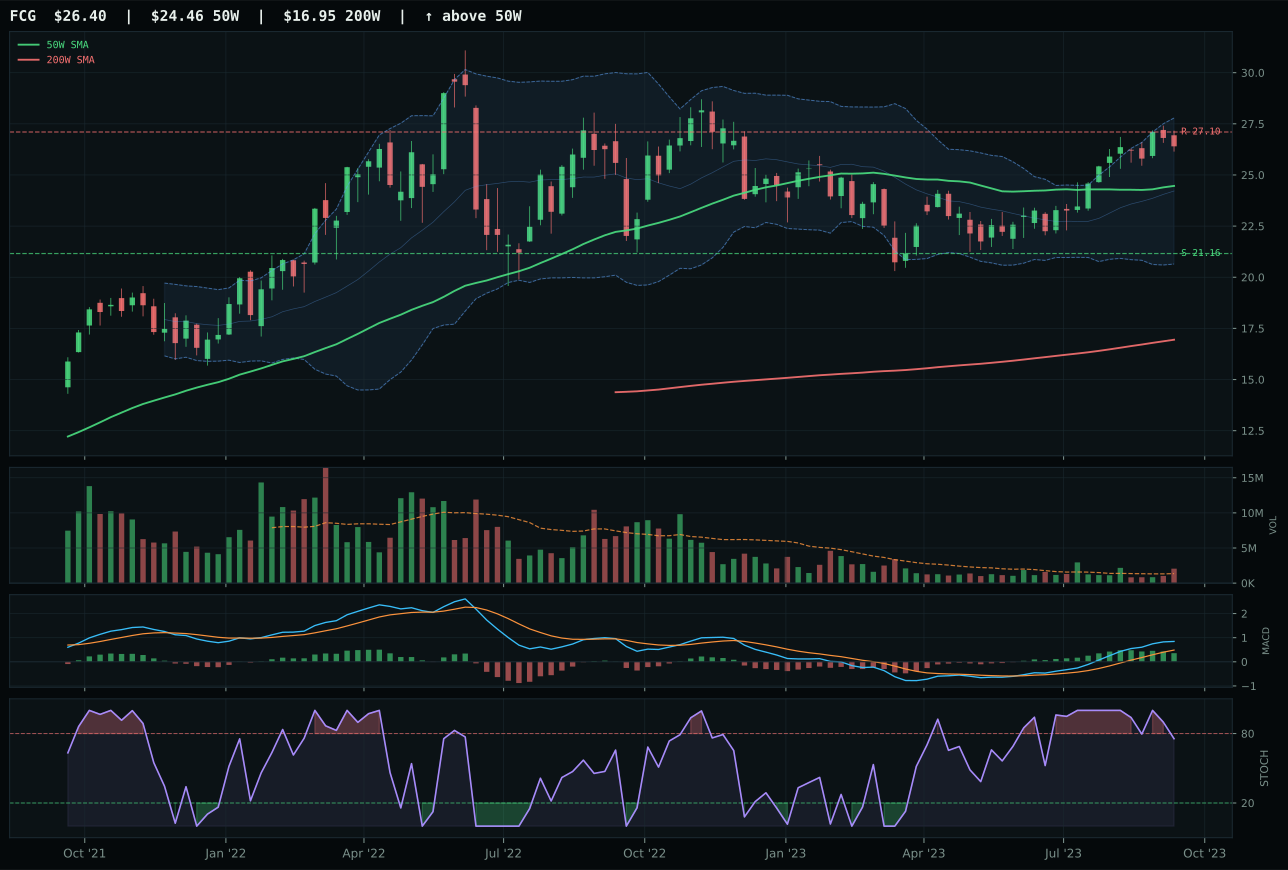
FCG has a neutral structure profile with 12.6% 13-week relative strength versus SPY.
A failed hold above support would weaken the setup.
Actionable but governed by invalidation levels.
XLE dominates the energy category with a commanding 82.0 final score and claims a top-2 slot with perfect technical and momentum alignment. Trend is 100/100: price 7.7% above the 50W with +0.5% slope and +12.9% SPY-relative strength—the signature of a sustained institutional bid. Stochastic RSI at overbought momentum (1.00) and MACD bullish improving confirm fresh capital flooding the complex. Volume at 1.19x 20W average shows above-average participation without distribution signals. XOP runners-up at 77.3 composite, but XLE's timing of 75 crushes XOP's 52 because MACD bullish improving beats bullish but flattening—XLE is building momentum while XOP is plateauing. Risk/reward at 45.0 shows limited upside (–0.0% to resistance 46.03) and 18.9% downside to support 38.68, an asymmetric risk that matters only if the macro thesis reverses. The 100/100 momentum confirmation score is the clincher: 13W return of 13.8%, 4W return of 3.6%, and category-relative strength of 0.0% proves XLE is the category expression.
Traditional Energy commands 10% top-2 allocation with a category-level macro fit of 90.0/100—matching Agriculture's strength but underpinned by energy scarcity (+16), inflation pressure (+10), supply shortage (+9), and real asset sponsorship (+7) in a late-cycle reflation regime. Oil and natural gas producers are the primary hedge against stagflation: they benefit from price spikes during growth-constrained periods and offer cash-generation ballast when equities compress multiples. XLE's integrated cash-flow model (majors with downstream hedges) provides additional downside protection versus pure-play explorers like XOP. The 10% weighting reflects conviction that energy will outperform equities and bonds throughout late-cycle reflation, acting as a real-asset anchor for the portfolio. Technicals support duration: 7.7% extension from the 50W is manageable for a 13W leader, support at 38.68 is 18.9% away, and volume sponsorship suggests new money is still entering. To lose allocation, XLE would need to break below support on heavy volume or suffer a sharp geopolitical de-escalation. The macro regime—high inflation, tight supply, stagflation risk—is unlikely to reverse quickly.
Nuclear Energy — URNM
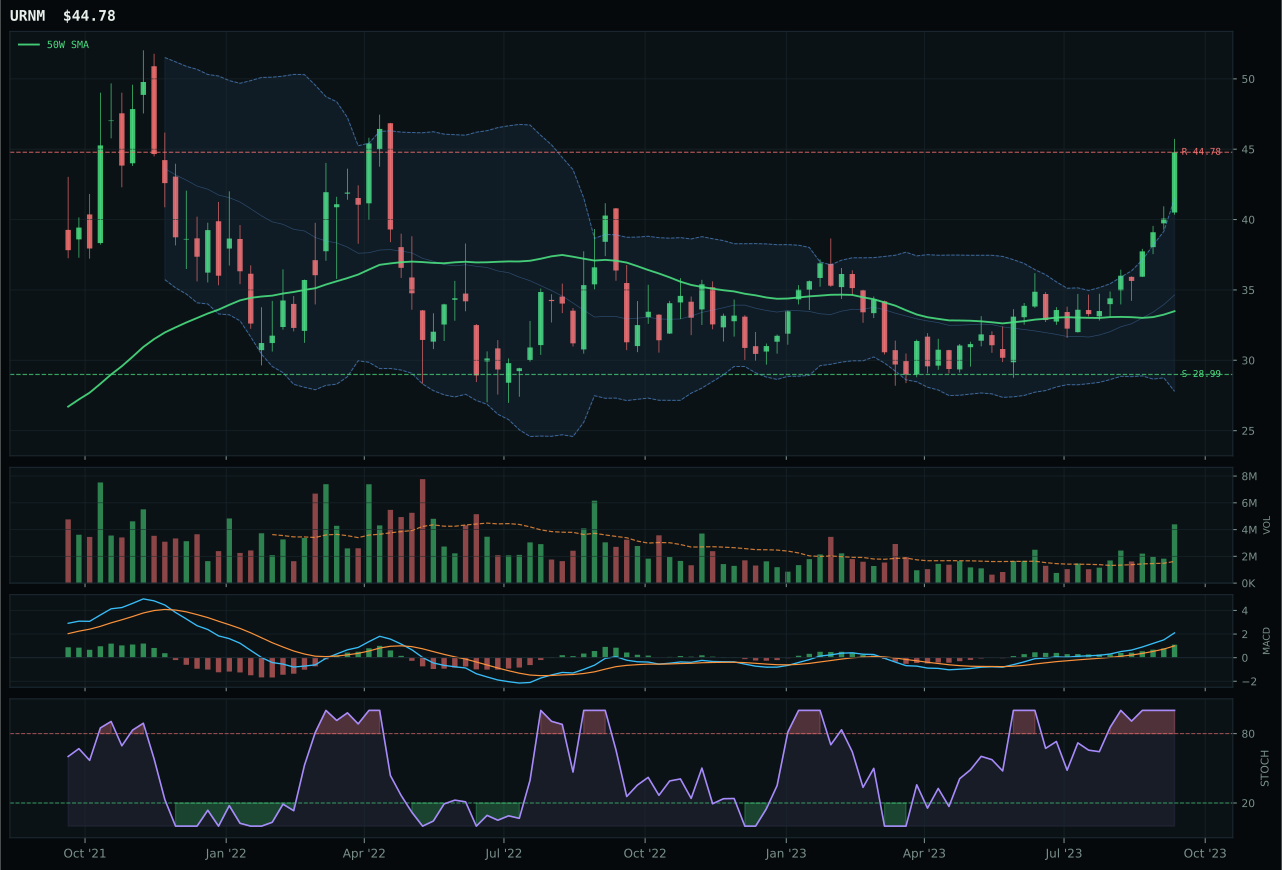
URNM has a vertical extension profile with 27.5% 13-week relative strength versus SPY.
A failed hold above support would weaken the setup.
Actionable but governed by invalidation levels.
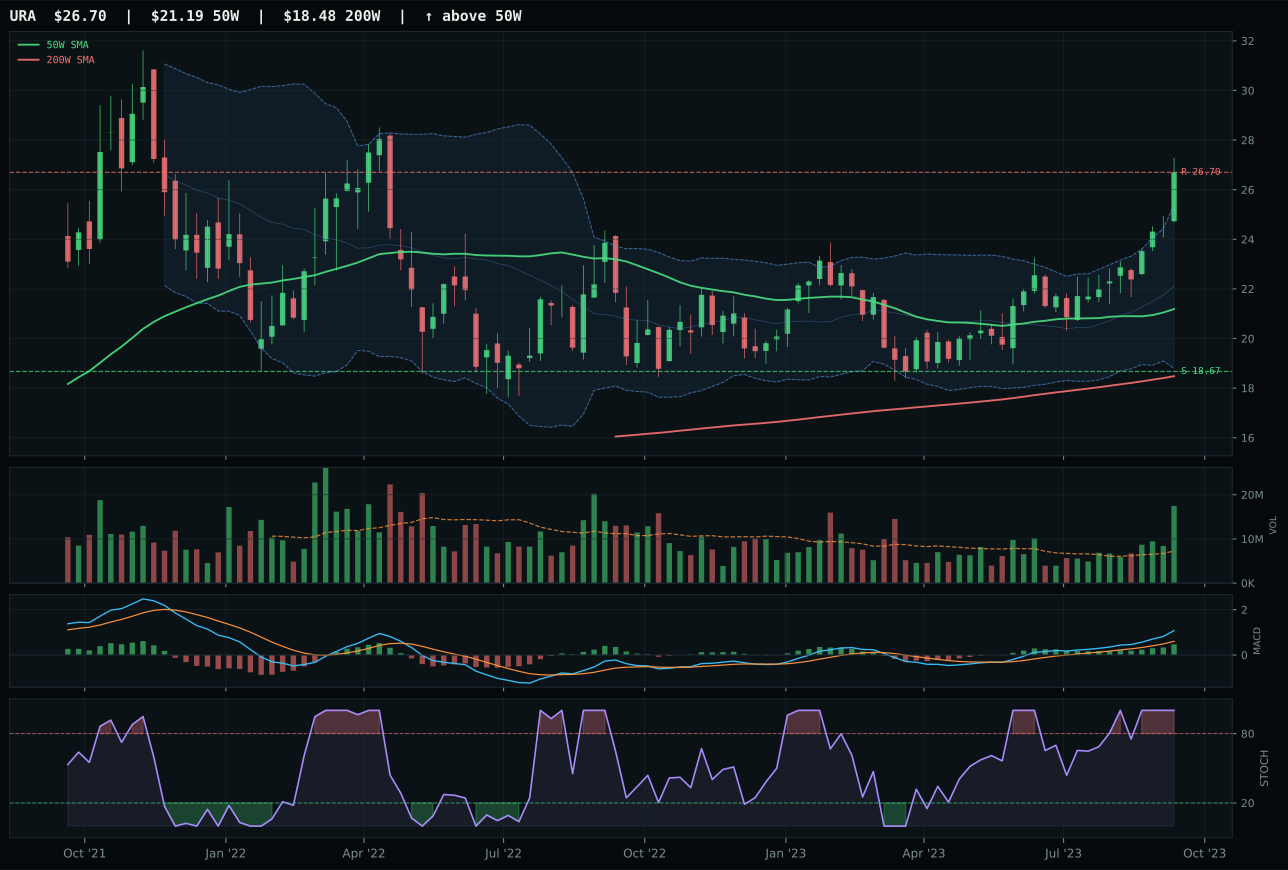
URA has a vertical extension profile with 17.5% 13-week relative strength versus SPY.
A failed hold above support would weaken the setup.
Actionable but governed by invalidation levels.
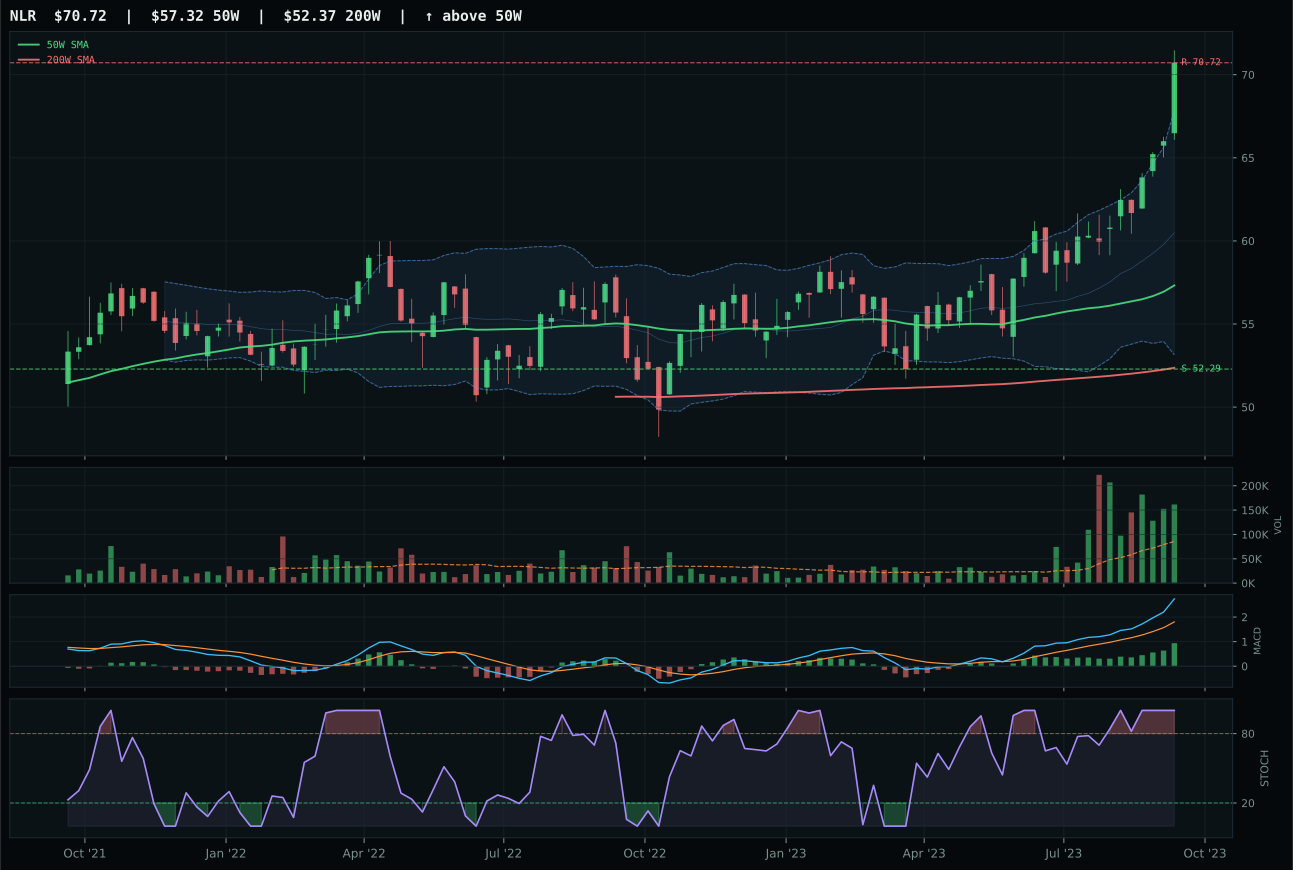
NLR has a vertical extension profile with 15.8% 13-week relative strength versus SPY.
A failed hold above support would weaken the setup.
Tracked, but not top-2 eligible because: .
URNM claims the second top-2 slot on pure relative strength and momentum confirmation, posting a 100/100 momentum score against URA's identical 100 momentum but with 10.0% category-relative outperformance. Setup is vertical extension at 33.7% above the 50W—extreme overextension that normally disqualifies entries—yet volume at 2.71x 20W average shows accumulation not distribution, and persistence 100/100 signals trend persistence despite extended entry. MACD bullish improving and stochastic RSI overbought momentum confirm fresh capital, while 28.4% 13W and 25.6% 4W returns prove this is not a bounce but a structural move. URA trails on the same category-relative strength (0.0% vs 10.0%), making URNM the category leader despite inferior timing (37 vs 37—a tie). Risk/reward at 44.6 shows 0.0% upside to resistance 44.78 and 54.5% downside to support 28.99, yet the 100/100 momentum confirmation overrides asymmetric downside risk because trend persistence is more important than entry perfection.
Nuclear Energy earns 10% top-2 allocation on a category-level macro fit of 64.0/100, where energy scarcity (+9), real asset sponsorship (+7), inflation pressure (+3), and late-cycle reflation (+7) support secular demand for uranium despite near-term extension. URNM's vertical-extension setup is the portfolio's most aggressive technical entry, but momentum confirmation at 100/100 and volume accumulation at 2.71x average justify the conviction. Uranium is a true scarcity commodity: global production lags increasing reactors, and late-cycle reflation favors electricity-dependent industries and decarbonization capex. The 10% allocation reflects a two-sided bet: (1) energy transition demand for uranium as coal retires and (2) stagflation-driven inflation in utilities and power, which nuclear hedges. Drawdown risk is real: 54.5% downside to support 28.99 means a break of that level on volume would cut allocation sharply. Catalysts to hold allocation include continued reactor announcements, inflation accelerating, and energy scarcity deepening. Catalysts to cut include commodity-price deflation or recession signals that would collapse both inflation-sensitive upside and electricity demand.
Precious Metals — GLD
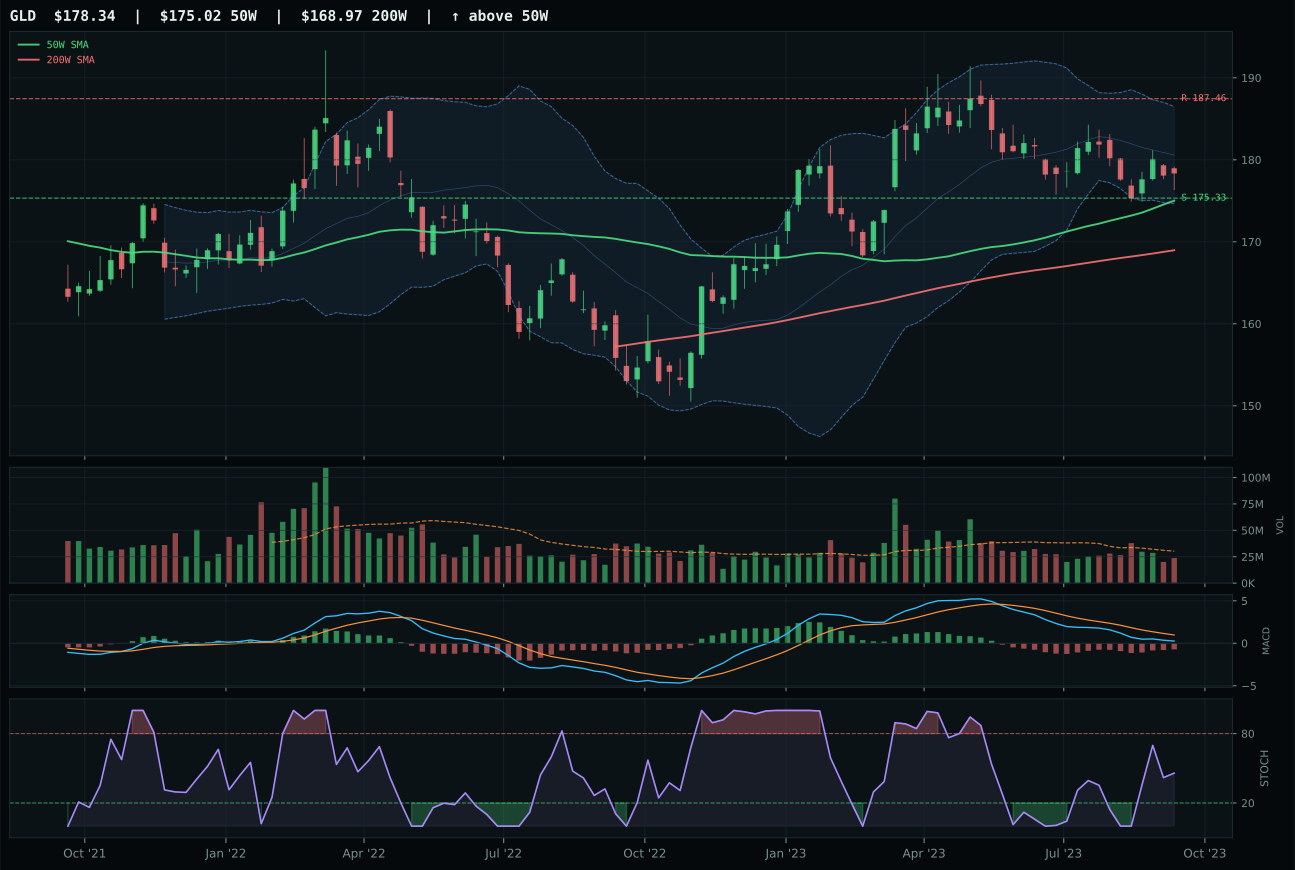
GLD has a pullback into support profile with -2.7% 13-week relative strength versus SPY.
A failed hold above support would weaken the setup.
Actionable but governed by invalidation levels.
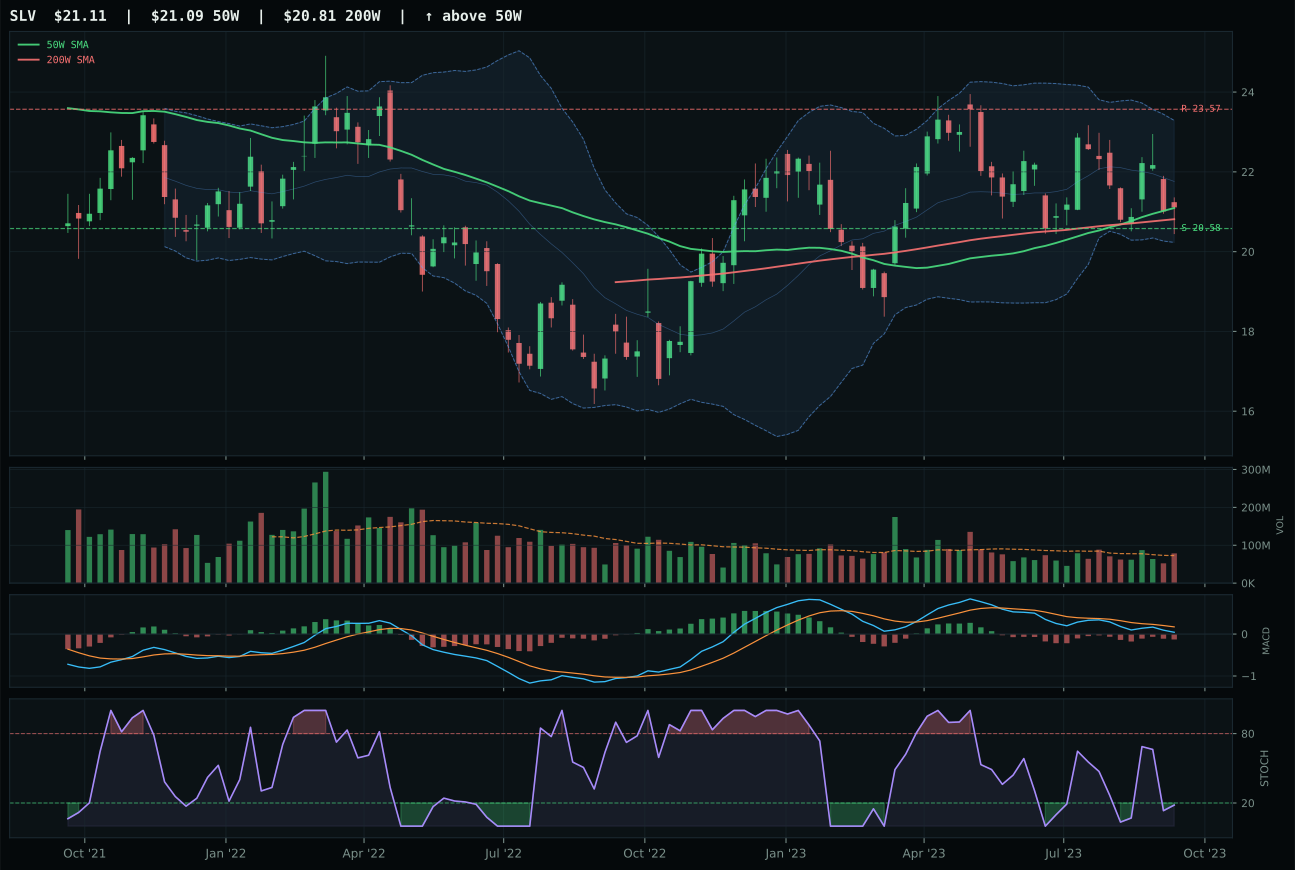
SLV has a pullback into support profile with -5.7% 13-week relative strength versus SPY.
A failed hold above support would weaken the setup.
Actionable but governed by invalidation levels.
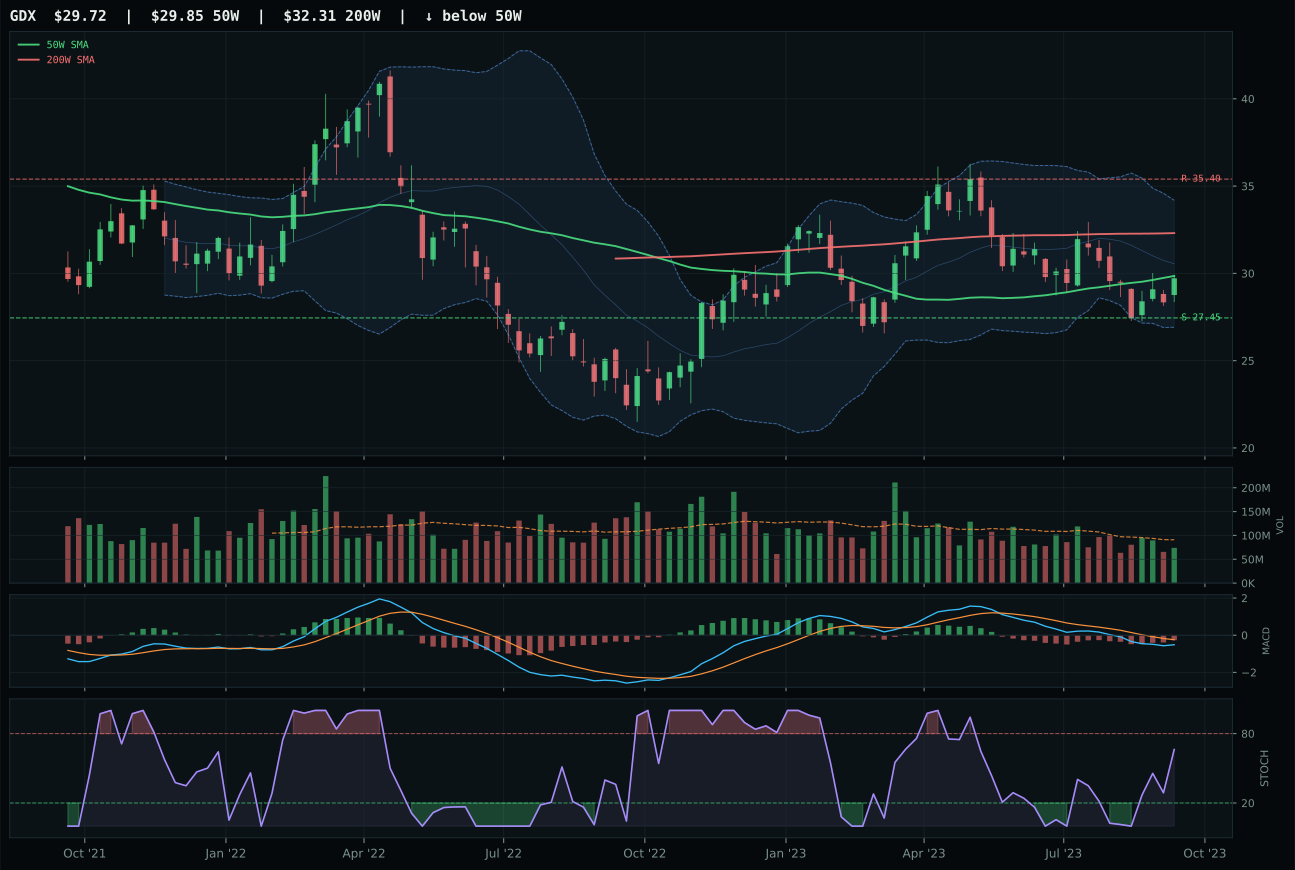
GDX has a compression near 50W profile with -6.2% 13-week relative strength versus SPY.
Extension and support failure are the main tactical risks.
Tracked, but not top-2 eligible because: structurally broken.
GLD edges SLV by combining superior structure quality and stochastic timing. At 1.9% above the 50W, GLD sits in the optimal zone for entry sponsorship, while SLV at deeper pullback shows more distance risk. GLD's stochastic RSI rising mid-zone at 0.46 contrasts with SLV's oversold, giving GLD the technical advantage of early-stage recovery momentum. MACD bearish but improving favors both, yet GLD's cleanliness score of 58.3 and compression of 90.9 signal tighter consolidation before the next leg. Risk/reward at 90.0 for GLD is exceptional: only 1.7% downside to support 175.33 but 4.9% upside to resistance 187.46—a 3:1 payoff ratio. The 3.5-point composite gap (87 vs 83) is the tightest between category finalists, confirming the match-up's closeness, yet GLD's 3.0% category-relative outperformance proves it is the tactical favorite.
Precious Metals receives 5% tier-2 allocation despite category-level macro fit of only 53.0/100, held primarily by dollar pressure active (+3). The low macro score reflects monetary and credit headwinds: liquidity stress typically suppresses precious metals as investors sell safe assets to cover margin calls. Yet GLD's technicals and 79.0 representative technical evidence justify holding the position as a hedging sleeve. Gold acts as a monetary backstop in late-cycle reflation scenarios where inflation accelerates but growth slows—a stagflation insurance premium. The pullback into support near 175.33 offers a defined stop-loss, limiting downside risk to 1.7%. For GLD to advance to top-2 status, the macro regime would need to shift toward explicit currency or sovereign-debt stress, triggering defensive rotations into bars and coins. For now, the 5% reflects a balance: meaningful macro headwinds offset by technical setup quality and portfolio hedge value.
Industrial Metals — COPX
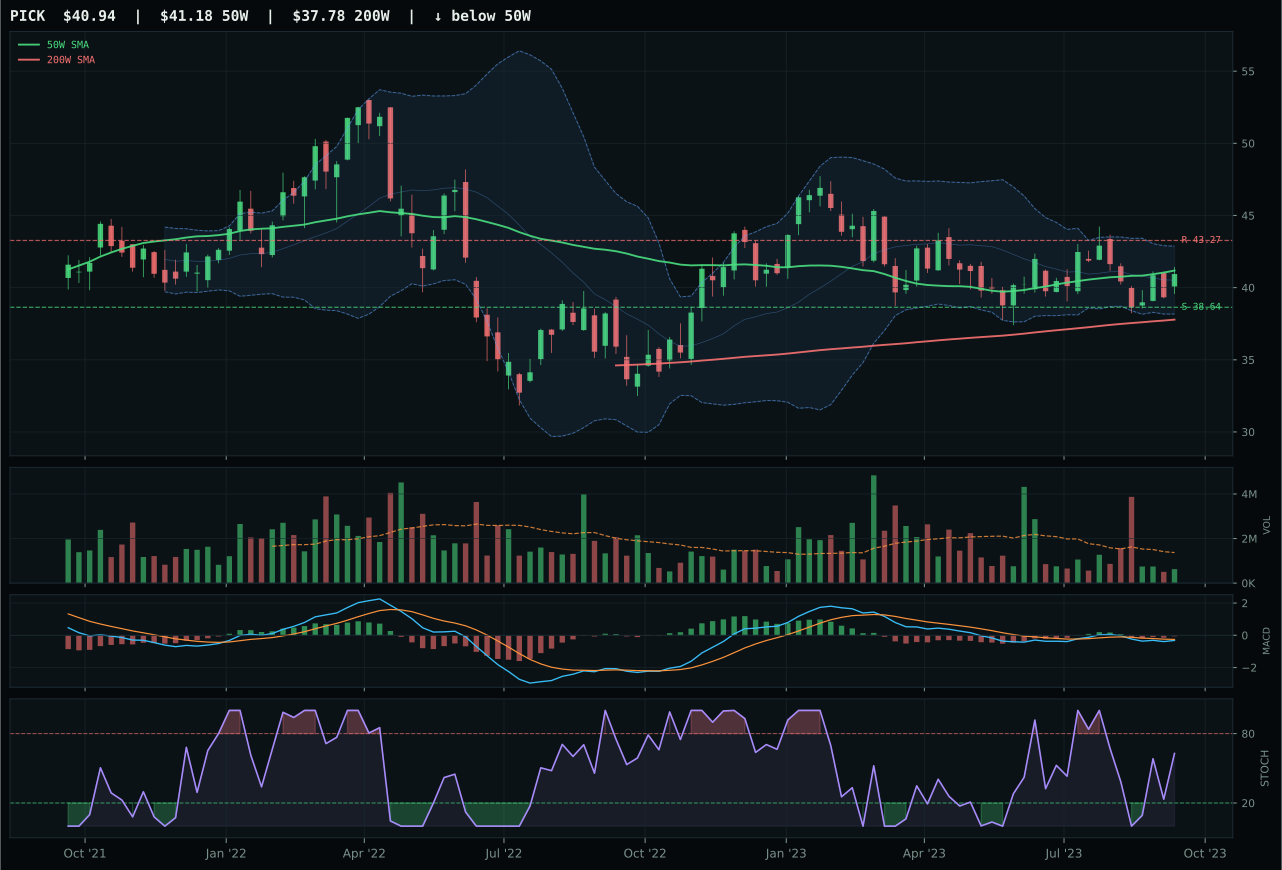
PICK has a compression near 50W profile with -3.4% 13-week relative strength versus SPY.
A failed hold above support would weaken the setup.
Actionable but governed by invalidation levels.
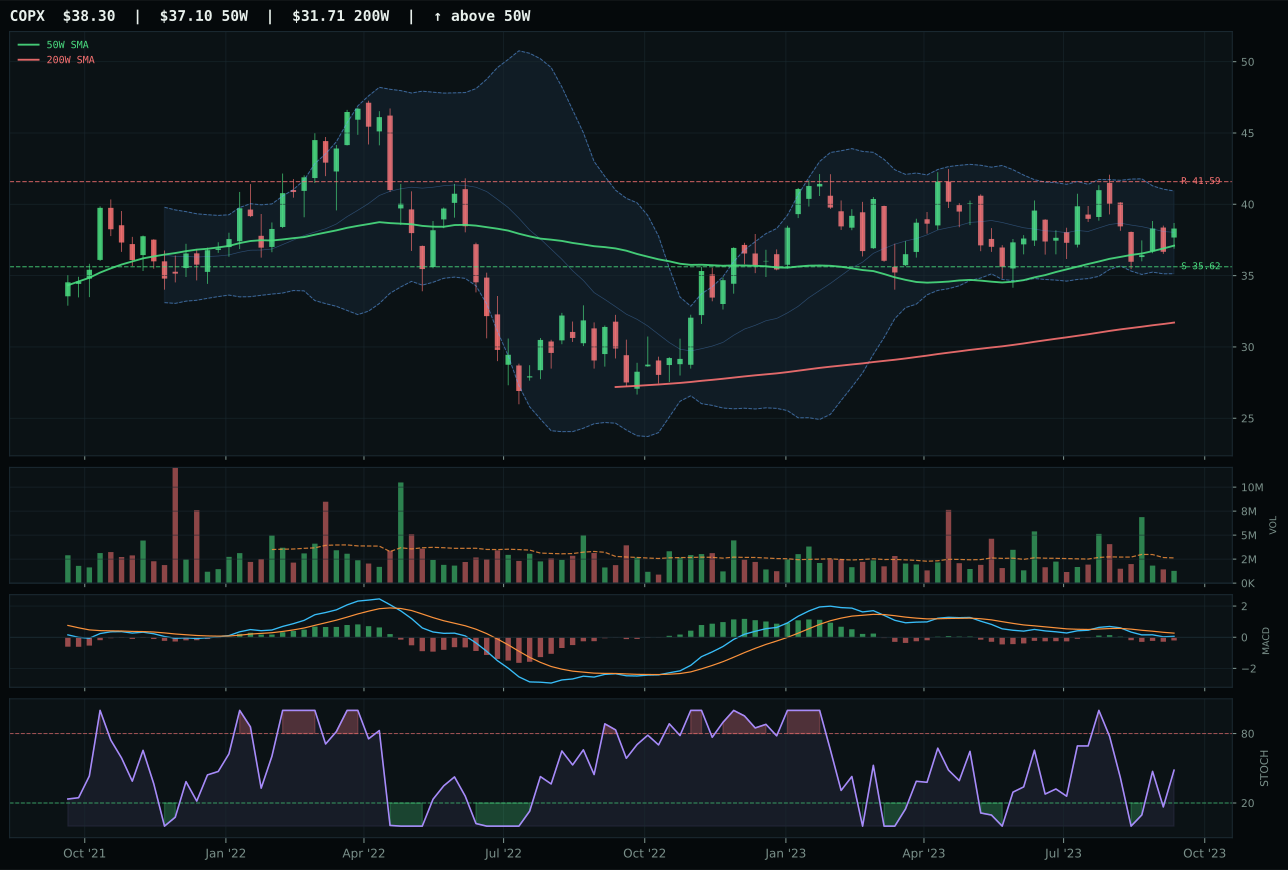
COPX has a neutral structure profile with -4.1% 13-week relative strength versus SPY.
A failed hold above support would weaken the setup.
Actionable but governed by invalidation levels.
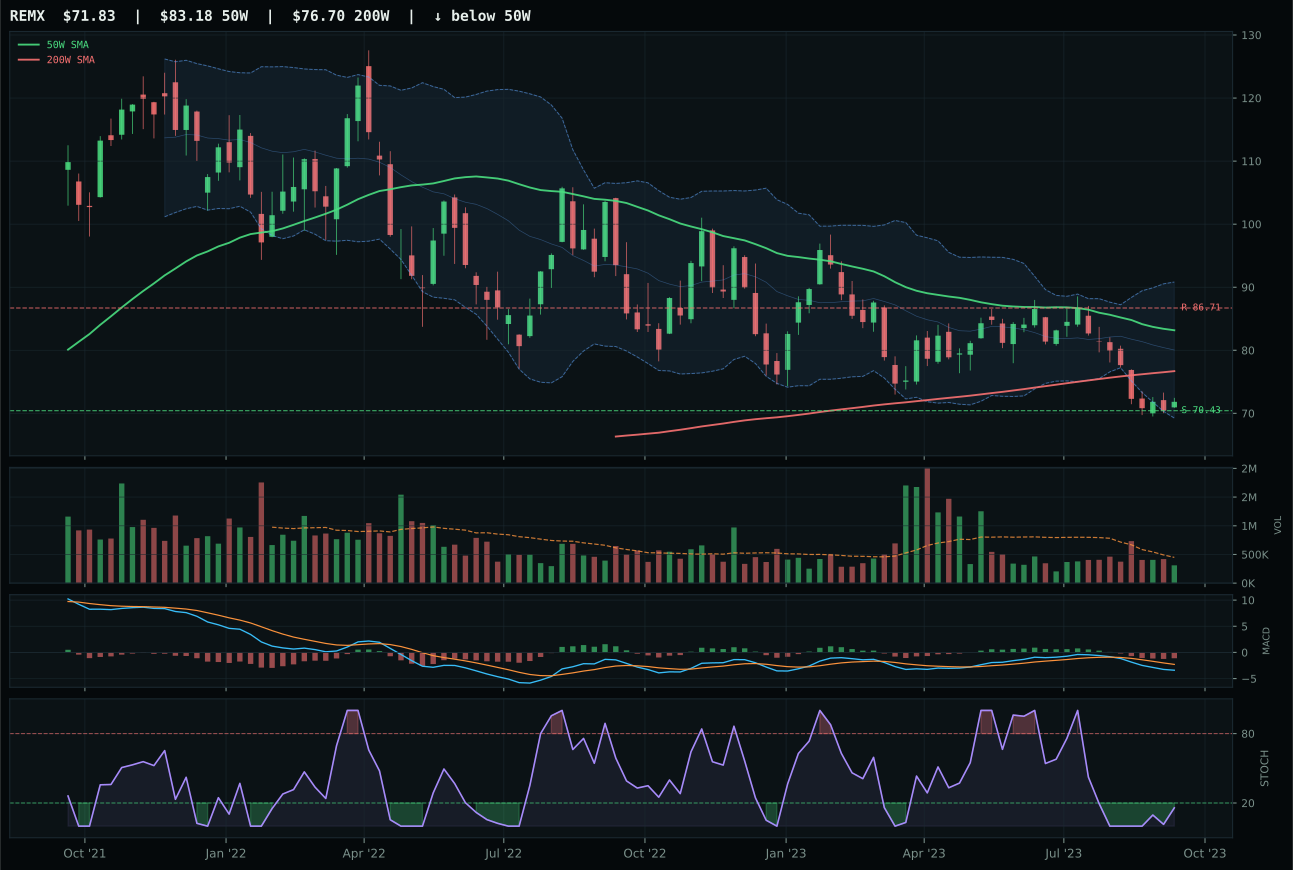
REMX has a pullback into support profile with -17.9% 13-week relative strength versus SPY.
A failed hold above support would weaken the setup.
Actionable but governed by invalidation levels.
COPX wins over PICK by a nose, despite PICK posting a higher composite score of 75 versus COPX's 68. The reason: PICK's superior technical score (60.0) is offset by COPX's positioning as copper scarcity play within the category-relative strength and macro narrative. COPX sits 3.2% above the 50W in neutral structure with stochastic RSI rising mid-zone at 0.48, while PICK shows compression near the 50W with stronger absolute technicals but less category leadership. Both trade on metals-scarcity macro tailwinds; COPX's thin volume at 0.49x average suggests patient institutional accumulation, whereas PICK's above-average participation is wider and less selective. Risk/reward favors COPX at 63.9 versus PICK's 69, signaling COPX is less extended and offers better entry discipline. The category-relative strength of 0.0% for COPX versus 0.7% for PICK is marginal, but COPX's positioning as the copper exposure during energy-transition demand gives it the nod.
Industrial Metals holds 5% tier-2 allocation, supported by a category-level macro fit of 68.0/100 where metals scarcity (+14), commodity breadth positive (+10), real asset sponsorship (+6), and late-cycle reflation (+10) converge. The category ranks third overall on macro fit, behind Agriculture's 90 and Energy's 90, reflecting genuine supply-side constraints and energy-transition demand for copper and zinc. Yet COPX's weak risk/reward at 63.9—only 7.5% upside to resistance 41.59 versus 7.5% downside to support 35.62—and thin volume warn against aggressive positioning. The allocation persists because the macro regime heavily favors real assets, and metals are the ultimate leveraged proxy to inflation and capex. To upgrade to top-2, COPX would need to break above 41.59 on volume acceleration, proving institutional conviction. Alternatively, a spike in inflation-print expectations or energy-scarcity headlines could elevate the entire category. For now, 5% respects the macro setup while capping concentration risk.
Utilities & Infrastructure — XLU
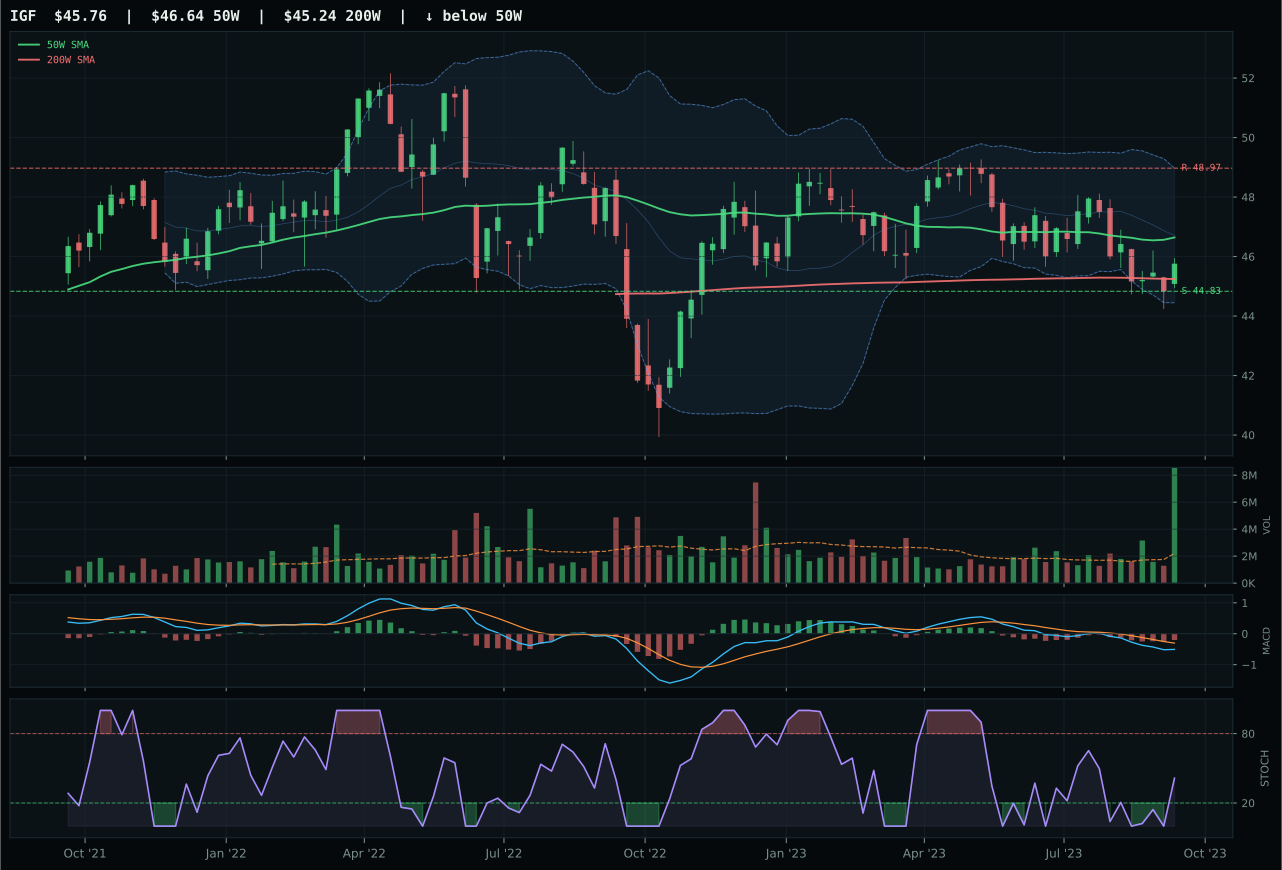
IGF has a pullback into support profile with -4.3% 13-week relative strength versus SPY.
A failed hold above support would weaken the setup.
Actionable but governed by invalidation levels.
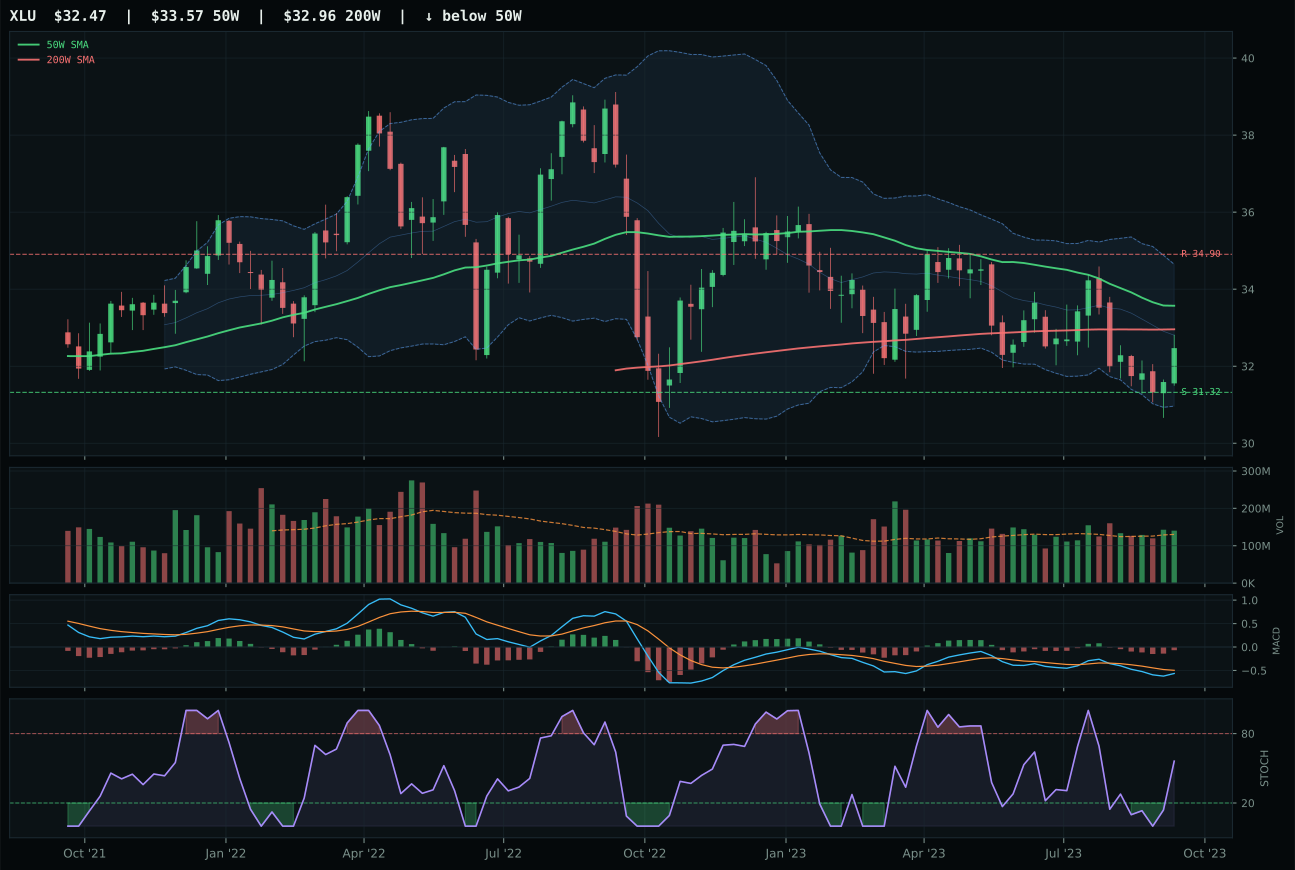
XLU has a pullback into support profile with -4.4% 13-week relative strength versus SPY.
A failed hold above support would weaken the setup.
Actionable but governed by invalidation levels.
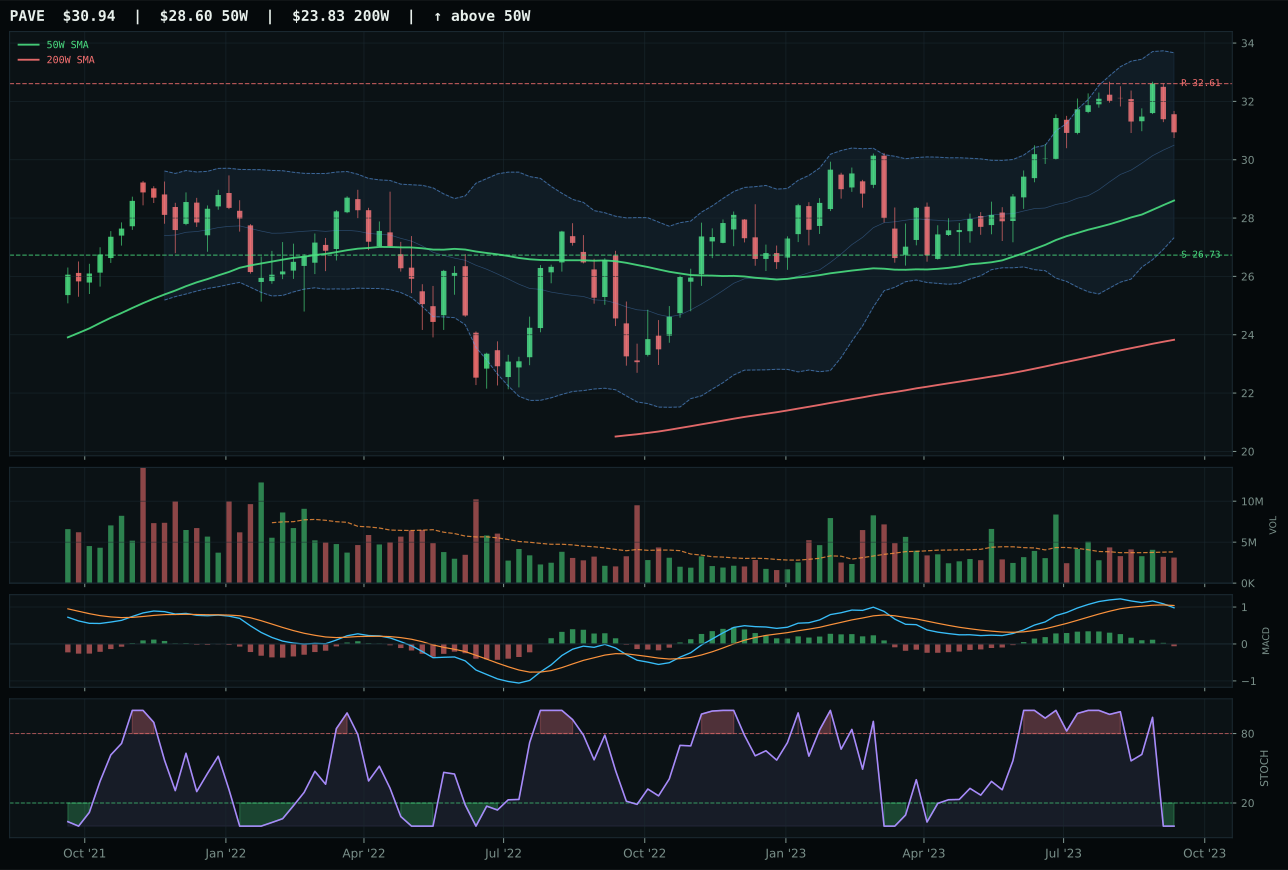
PAVE has a neutral structure profile with 1.6% 13-week relative strength versus SPY.
A failed hold above support would weaken the setup.
Actionable but governed by invalidation levels.
XLU wins Utilities & Infrastructure by default: it is the representative in a category where all three ETFs show weak technicals and uneven macro sponsorship. XLU sits 3.3% below the 50W (below all trend references) with a trend score of only 41.4, but timing is flawless at 100/100 because price rests in the deep value zone near Fib 0.618, MACD bearish but improving, and stochastic RSI rising mid-zone at 0.56 signal classic value-trap recovery setup. Risk/reward is the category's strength at 87.2: only 3.7% downside to support 31.32 but 7.0% upside to resistance 34.90, a favorable 2:1 payoff for mean-reversion trades. IGF scored 76 composite versus XLU's 60, but IGF's stronger trend and momentum could not overcome XLU's superior risk/reward and timing discipline in a weakening sector. Volume neutral at 1.08x average suggests neither panic capitulation nor conviction accumulation.
Utilities & Infrastructure holds 5% tier-2 allocation on the strength of macro regime support (late-cycle reflation +4, broad-market bear +4, transition/mixed +4), totaling 49.0/100 category-level macro fit. The sector acts as a volatility shock absorber and inflation-hedge proxy for bond-like allocations, ideal in late-cycle when equity multiples compress but rates remain sticky. XLU's pullback into support near 31.32 offers a defined entry for value-oriented positions, with only 3.7% capital-at-risk below that level. However, the weak trend score (41.4) and deteriorating relative strength (–4.4% vs SPY) warn that utilities are lagging equities despite sector rotation tailwinds. Inflation pressure (–6) and dollar pressure headwinds limit upside. To upgrade to top-2, utilities would need either (1) equity-market weakness that accelerates defensive rotation into yield, or (2) Fed pivot signals that cut long-duration real-rate concerns. For now, 5% reflects a balanced stance: meaningful macro support but weak technicals and structural underperformance justify a modest allocation rather than conviction sizing.
Agriculture & Livestock — MOO
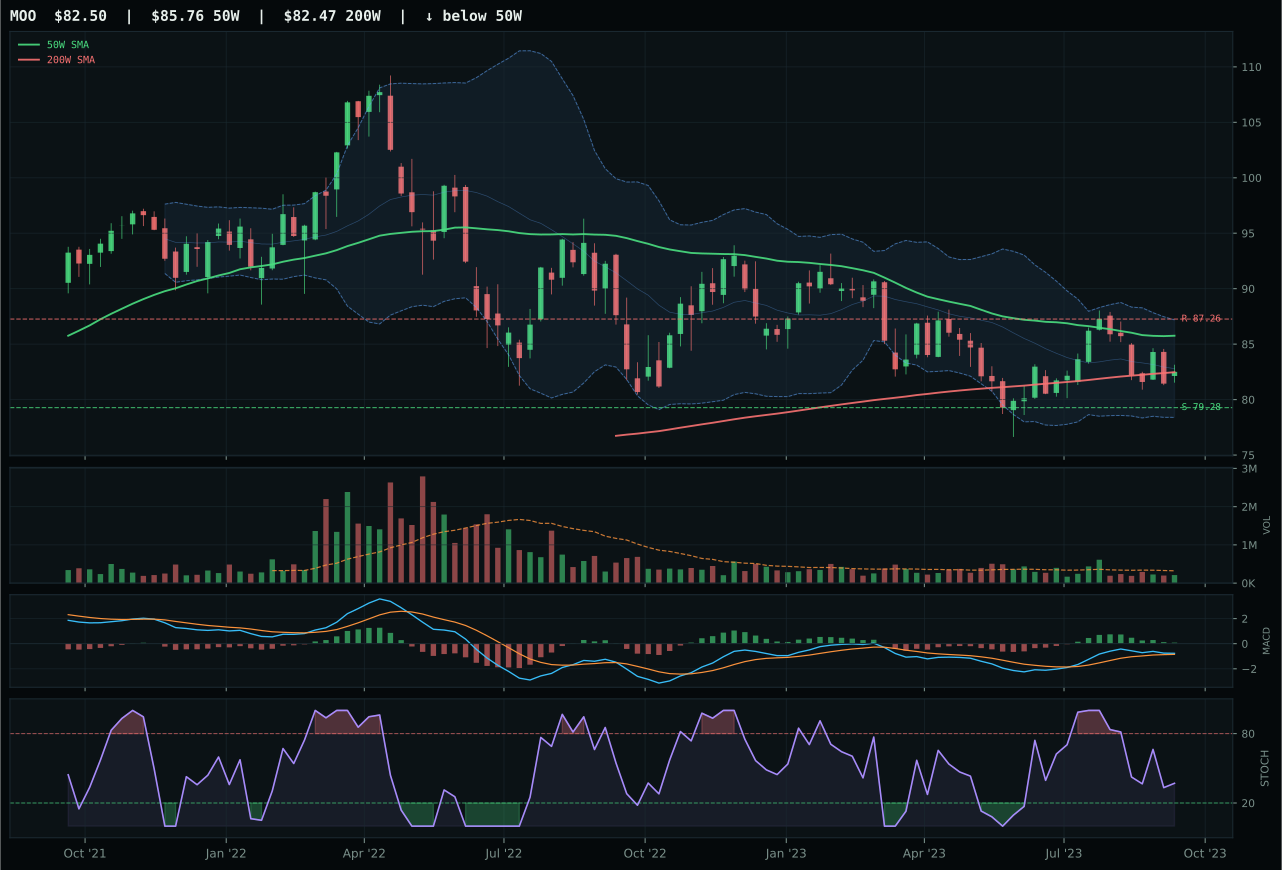
MOO has a pullback into support profile with -1.5% 13-week relative strength versus SPY.
A failed hold above support would weaken the setup.
Actionable but governed by invalidation levels.
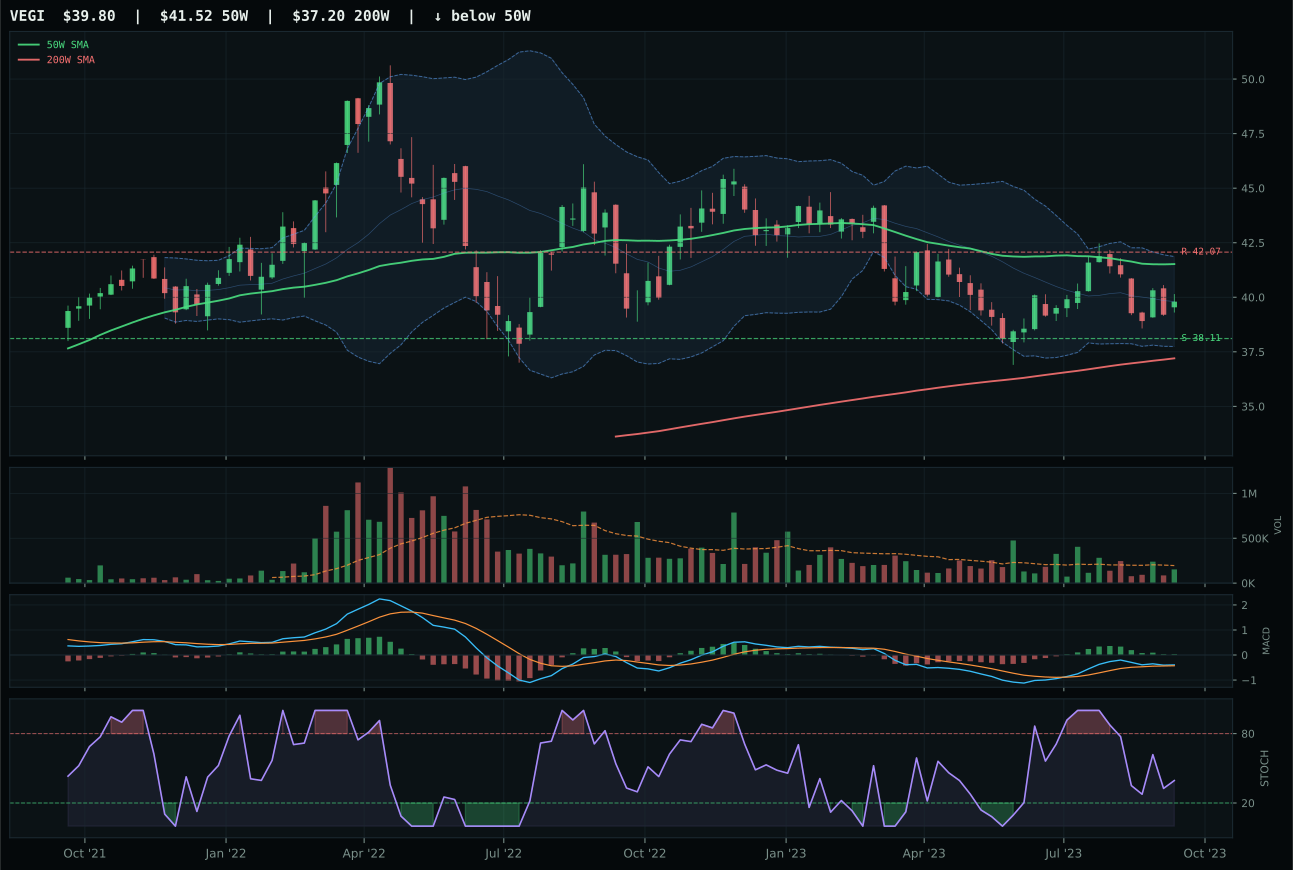
VEGI has a pullback into support profile with -1.6% 13-week relative strength versus SPY.
A failed hold above support would weaken the setup.
Tracked, but not top-2 eligible because: .
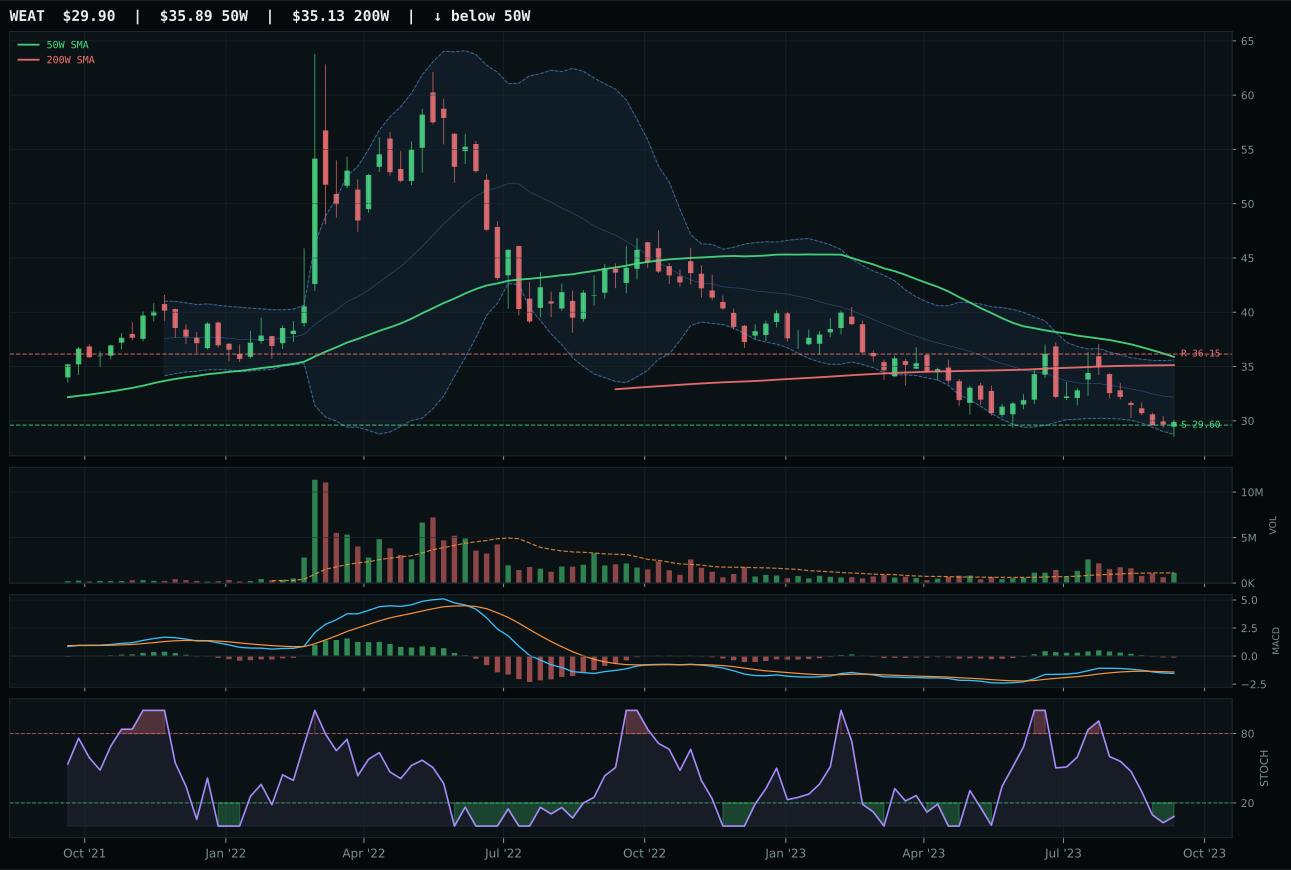
WEAT has a pullback into support profile with -13.7% 13-week relative strength versus SPY.
A failed hold above support would weaken the setup.
Actionable but governed by invalidation levels.
MOO wins with a flawless 100/100 timing score, sitting 3.8% below the 50W yet anchored above the 200W—the textbook reset setup. Price rests in the deep retracement zone near Fib 0.618 at 83.24, while MACD bullish but flattening and stochastic RSI rising mid-zone at 0.37 confirm early-stage accumulation without overbought rejection. Risk/reward is outstanding at 77.2, with 4.1% downside to support 79.28 and 5.5% upside to resistance 87.26—an asymmetric payoff for patient capital. VEGI trails on several counts: weaker risk/reward at 74.9, neutral volume versus MOO's thin participation (which paradoxically offers less distribution risk), and 0.0% category-relative strength. The 19.1-point composite gap (78 vs 58) reflects MOO's superior structure and macro positioning within the agribusiness complex.
Agriculture & Livestock earns a 5% tier-2 allocation backed by a category-level macro fit of 90.0/100—the highest across all categories this week. Supply shortage active (+13), inflation pressure active (+10), real asset sponsorship active (+8), and commodity breadth positive active (+5) create a fortress macro setup for agriculturals in late-cycle reflation. MOO's technical foundation compounds this: the pullback into support at 79.28 offers a defined entry with capital preservation if violated. Thin volume at 0.65x average suggests patient accumulation rather than speculative chase, ideal for the macro regime. The allocation reflects conviction that agricultural inflation and supply scarcity will drive this complex higher over the next 8–12 weeks. To upgrade to top-2 status, MOO would need to break above 87.26 resistance on increasing volume and prove macro sponsorship is converting from price pressure to momentum. For now, 5% is appropriate for a category with excellent macro fit but still-negative 13W returns.
Defense & Aerospace — XAR
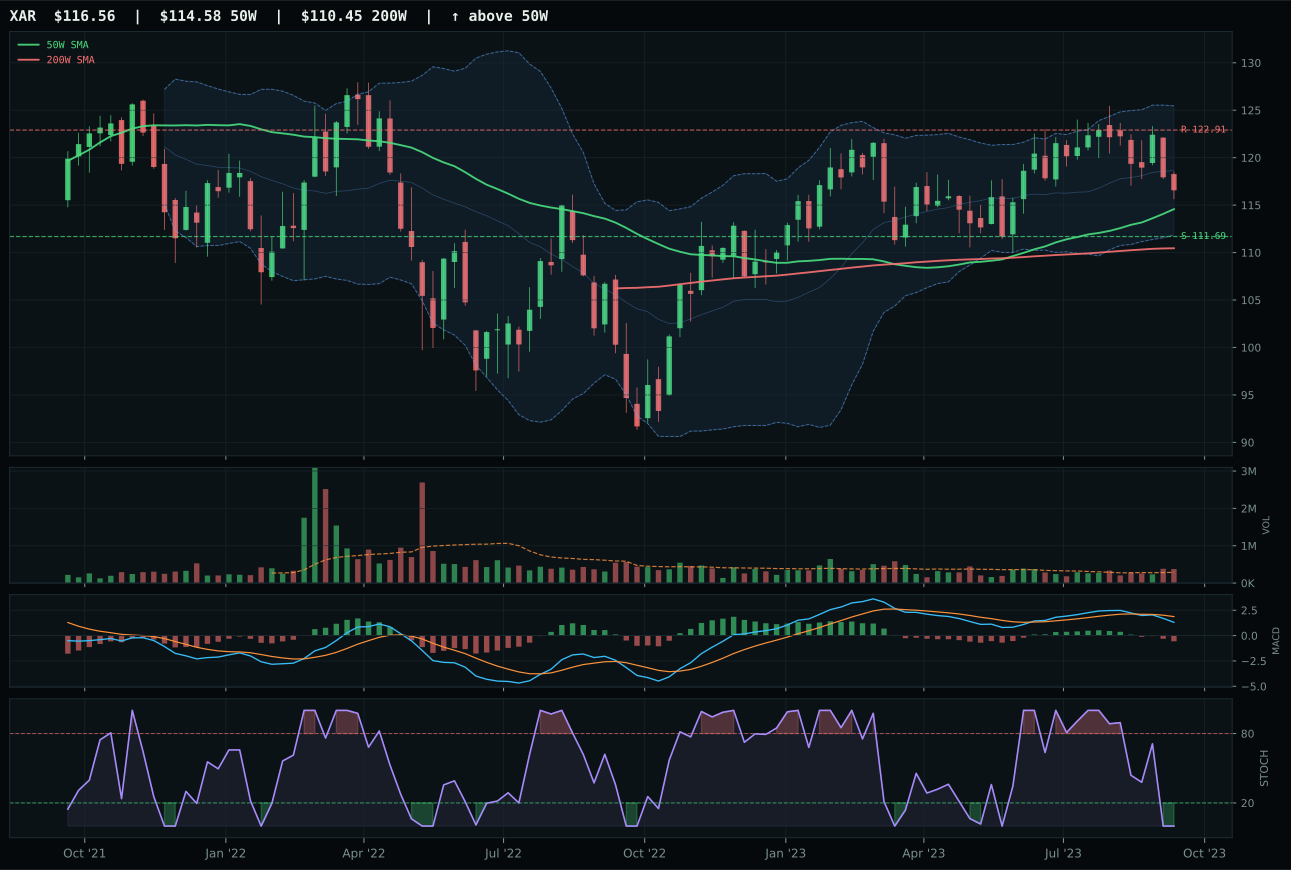
XAR has a pullback into support profile with -4.1% 13-week relative strength versus SPY.
A failed hold above support would weaken the setup.
Actionable but governed by invalidation levels.
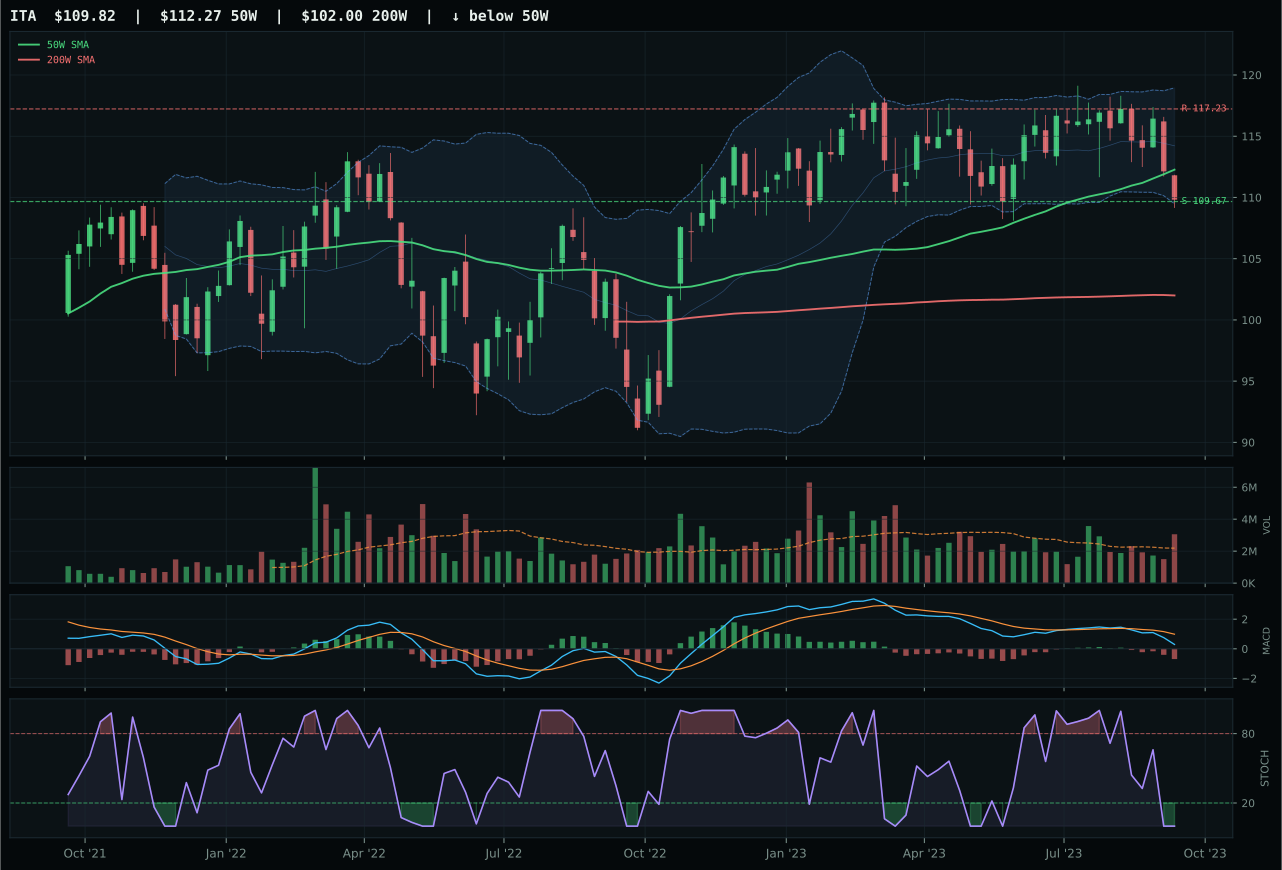
ITA has a pullback into support profile with -6.1% 13-week relative strength versus SPY.
A failed hold above support would weaken the setup.
Actionable but governed by invalidation levels.
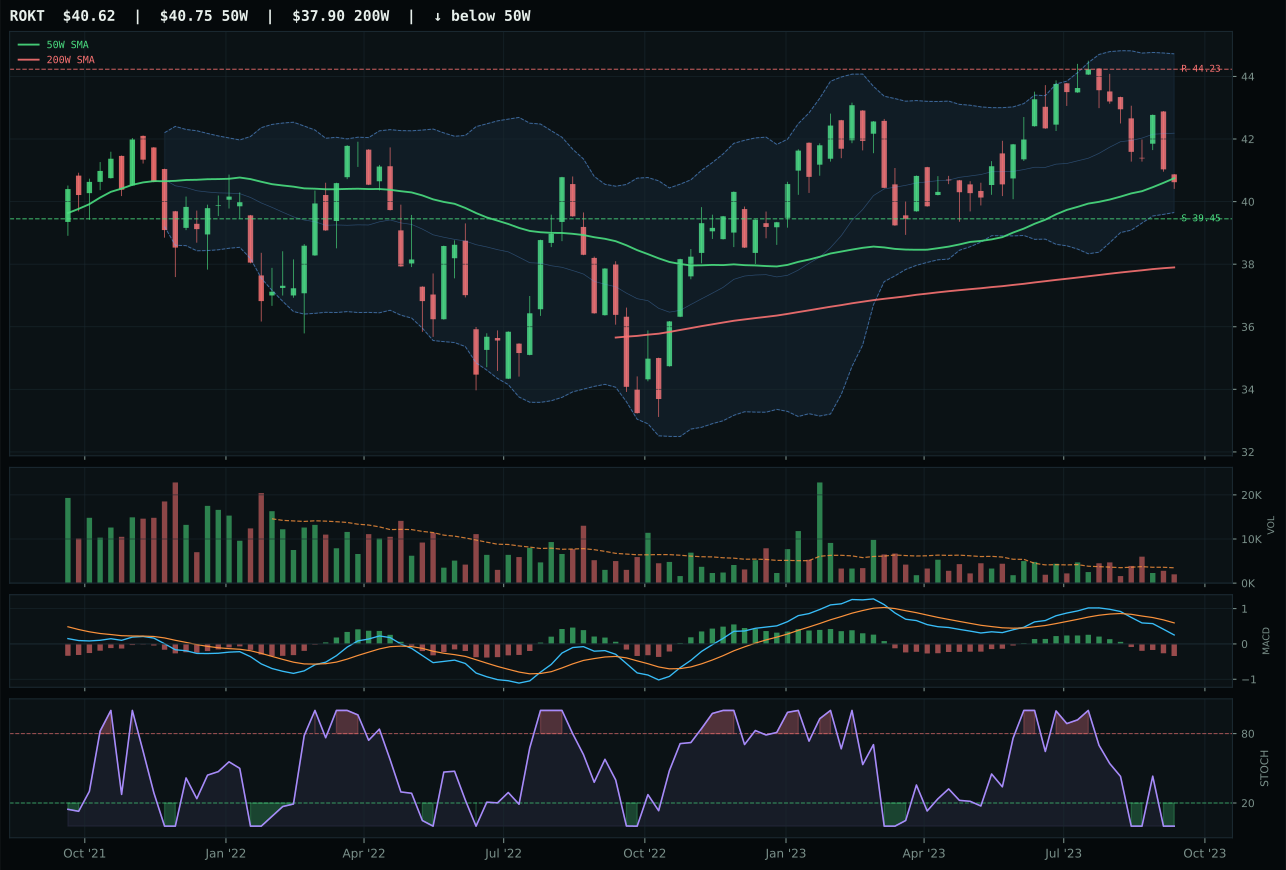
ROKT has a pullback into support profile with -7.0% 13-week relative strength versus SPY.
A failed hold above support would weaken the setup.
Tracked, but not top-2 eligible because: .
XAR defeats ITA by winning on category-relative strength at 2.0% versus ITA's flat 0.0%, a critical edge in a weak category. Both ETFs share identical pullback-into-support setups with 95/100 timing scores and oversold stochastic RSI, but XAR trades above ITA by holding 1.7% from the 50W versus deeper pullback risk elsewhere. Volume at 1.31x 20W average shows above-average institutional participation behind XAR's move into support at 111.69. MACD bearish/weakening and stochastic oversold at 0.00 mean neither ETF is leading the tape—this is a value entry, not a momentum chase. Risk/reward at 66.3 (upside –5.2% to resistance, downside 4.4% to support) is defensive, appropriate for a sector that is up –3.2% in 13W despite macro tailwinds.
Defense & Aerospace holds a 5% tier-2 allocation, supported by a category-level macro fit of 66.0/100 where late-cycle reflation, broad-market bear, and dollar pressure combine to favor yield-bearing equities with secular geopolitical sponsorship. The 33.1 category score ranks above Technology but below energy and uranium, making it a respectable third-tier candidate in a crowded week. XAR's positioning reflects macro conviction: fiscal defense spending accelerates in late-cycle inflation, and the pullback into support near 111.69 offers a technical reset point for entry. However, the category's –4.1% SPY-relative return and only 2.0% category-relative outperformance signal structural underperformance. Allocation persists because defensive businesses with moat characteristics and government contracts remain anchors in volatile markets. A breakout above 122.91 resistance on volume would upgrade the category; failure to hold support would trigger a review.
Technology — CIBR
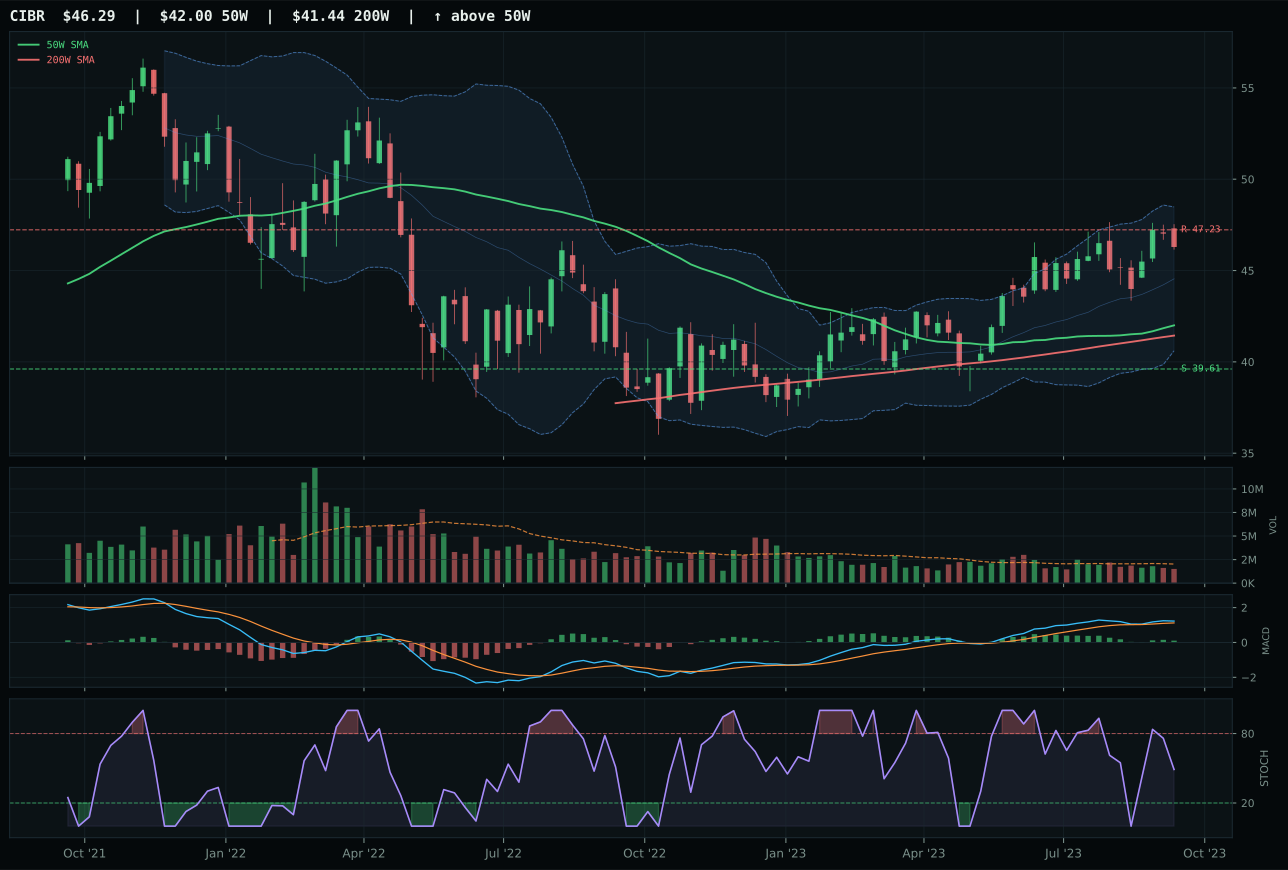
CIBR has a neutral structure profile with 0.3% 13-week relative strength versus SPY.
A failed hold above support would weaken the setup.
Actionable but governed by invalidation levels.
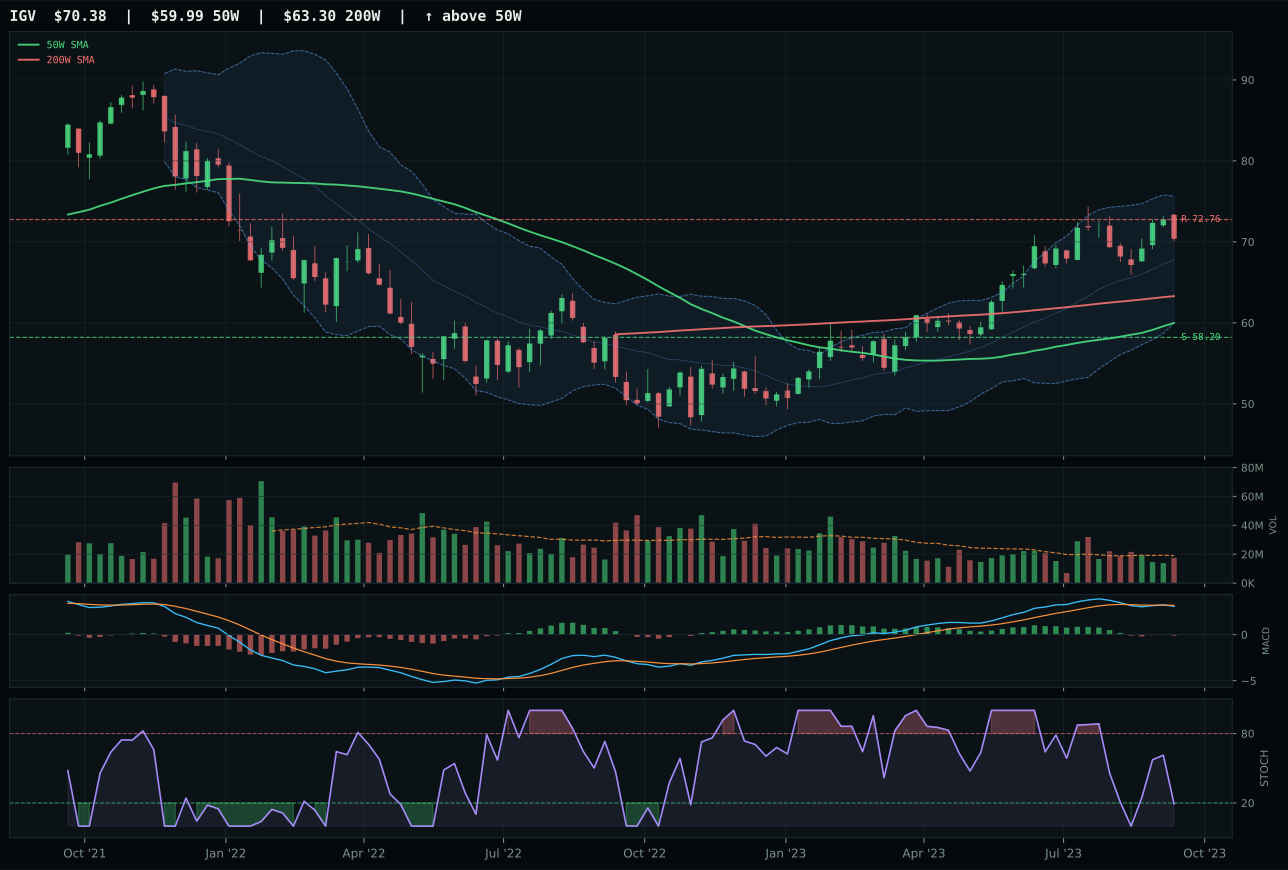
IGV has a vertical extension profile with 0.4% 13-week relative strength versus SPY.
A failed hold above support would weaken the setup.
Actionable but governed by invalidation levels.
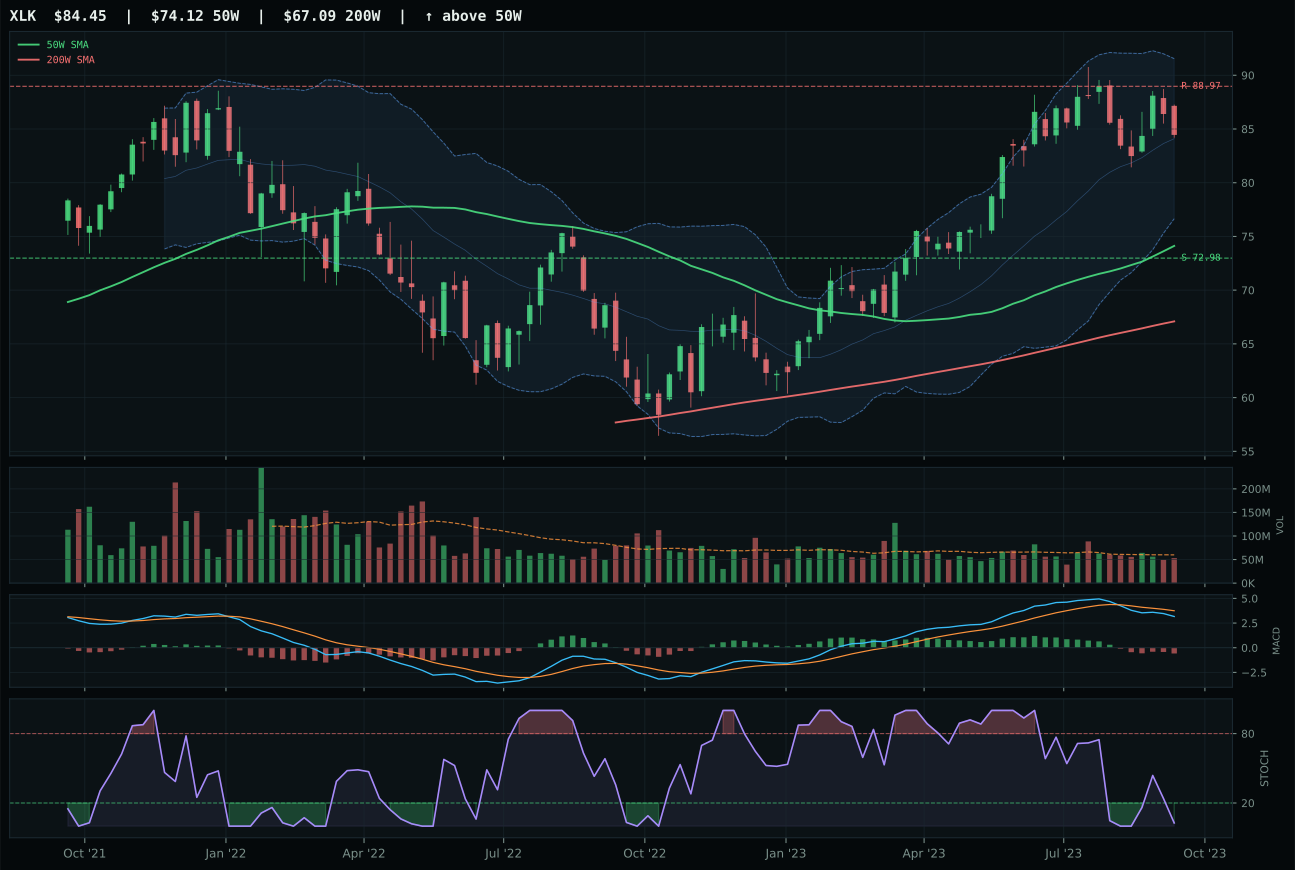
XLK has a neutral structure profile with -3.4% 13-week relative strength versus SPY.
A failed hold above support would weaken the setup.
Actionable but governed by invalidation levels.
CIBR wins the Technology category by combining trend leadership with superior timing discipline. Price sits 10.2% above the 50-week moving average—still in the accumulation zone—while MACD bullish and improving confirms fresh buying momentum. Stochastic RSI rising from mid-zone at 0.49 signals entry strength without overbought rejection, whereas IGV at 17.3% extension and bearish MACD shows late-stage overstay. The 14.1-point gap between CIBR's 78 composite and IGV's 64 reflects CIBR's neutral structure (cleanliness 58.3, compression 80.6) versus IGV's vertical extension vulnerability. Support sits at 39.61 with resistance at 47.23—a 16.9% downside buffer and only 2.0% upside—so risk asymmetry is balanced for a tier-2 position.
Technology earns 5% allocation as a tier-2 category, ranked below stronger macro and technical setups but retained for its defensive positioning in late-cycle reflation. Category-level macro fit is only 24.0/100, dragged down by active liquidity stress (–10), credit stress (–7), and dollar pressure (–5)—conditions that typically hurt high-multiple software and AI plays. CIBR's cybersecurity focus acts as a secular hedge within the category: it trades on infrastructure urgency rather than multiple expansion. To climb into top-2 territory, Technology would need either macro relief from credit stress descriptors or a cleaner breakout above resistance 47.23 with confirmed volume sponsorship above 1.0x average participation. For now, the allocation reflects cautious conviction—exposure to technology's structural growth without betting the portfolio on a multiple re-rating.
AI — AIQ
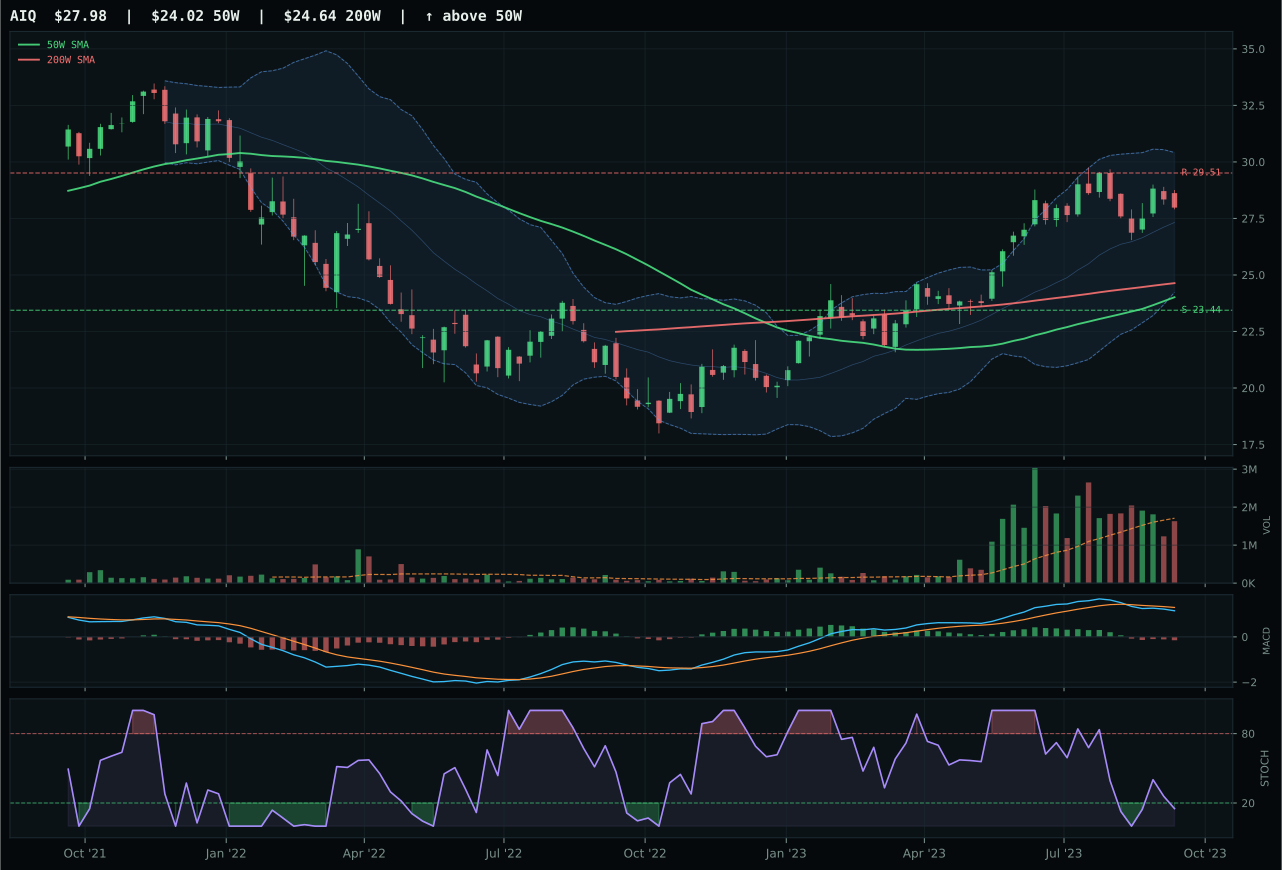
AIQ has a vertical extension profile with -2.1% 13-week relative strength versus SPY.
A failed hold above support would weaken the setup.
Actionable but governed by invalidation levels.
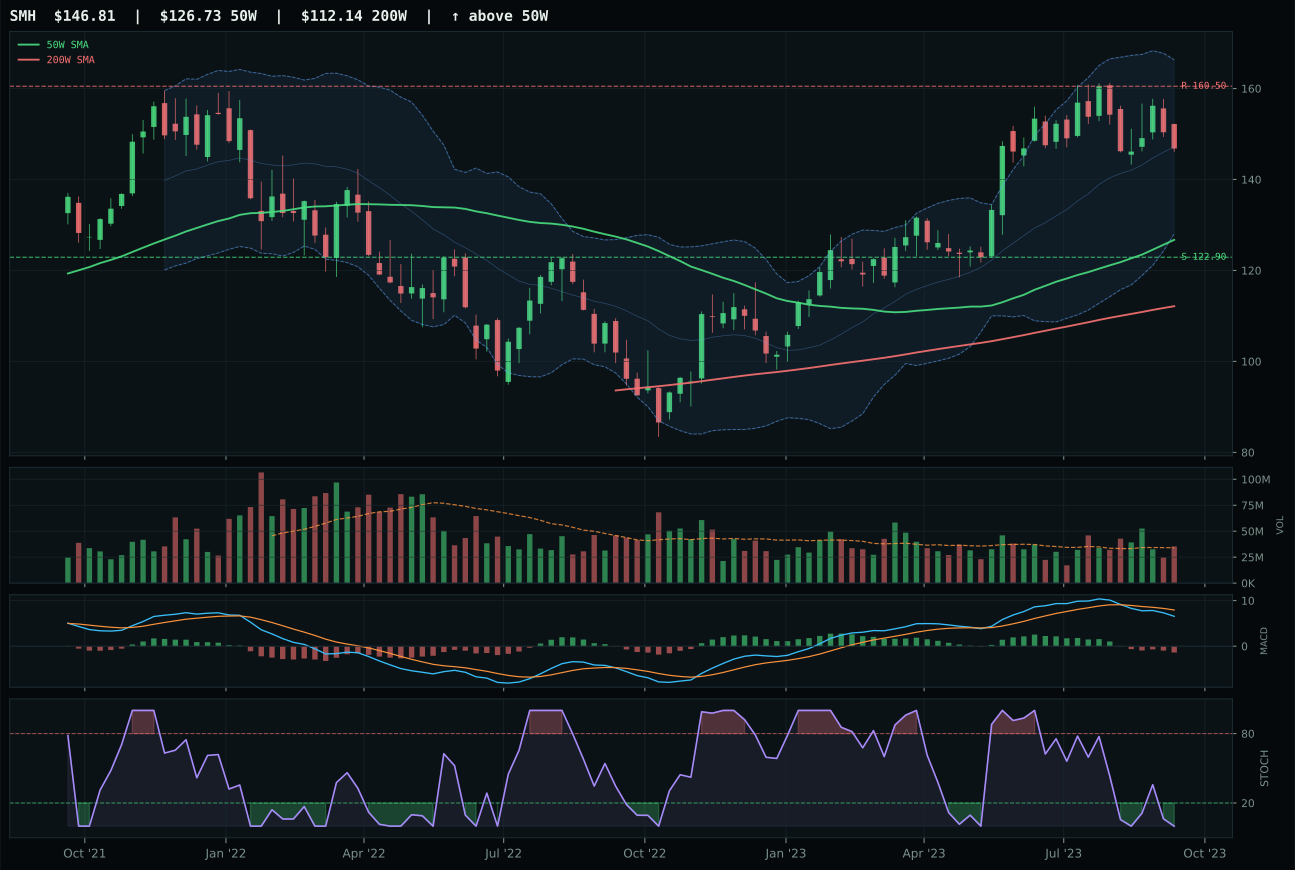
SMH has a vertical extension profile with -5.2% 13-week relative strength versus SPY.
A failed hold above support would weaken the setup.
Actionable but governed by invalidation levels.
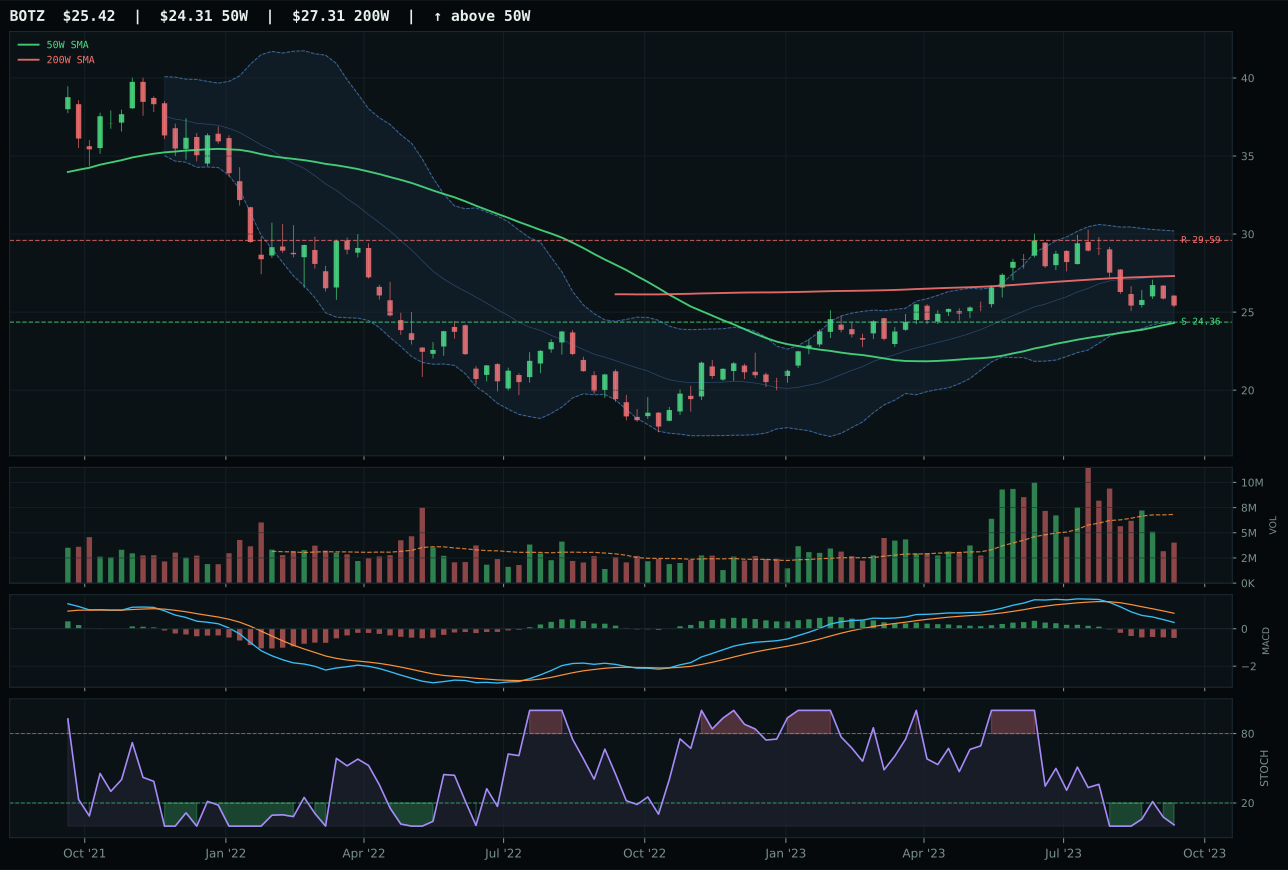
BOTZ has a pullback into support profile with -15.0% 13-week relative strength versus SPY.
A failed hold above support would weaken the setup.
Actionable but governed by invalidation levels.
AIQ wins the AI category on relative strength inside its three-ETF basket, posting 3.1% outperformance versus SMH's flat 0.0% category-relative gain. The setup is vertical extension at 16.5% above the 50W, a penalizing factor that depresses timing to 62, yet AIQ's stochastic RSI turning up from oversold at 0.15 offers a 13W momentum edge (–1.2% vs SMH's –4.3%). MACD bearish/weakening is a red flag on both ETFs, but AIQ's category-relative strength of 3.1% proves it is the least-crowded exit trade if sentiment rolls. The 7.1-point composite gap (57 vs 50) is narrow enough to signal neither ETF deserves allocation; both suffer from compressed risk/reward (AIQ 49.8, SMH 53), where downside to support is 19.4% but upside to resistance yields only –5.2%.
AI receives 0% allocation this week, ranked 9th or 10th among all categories. The final score of 15.4 reflects a category-level macro fit of just 18.0/100, hammered by active liquidity stress (–12), credit stress (–8), broad-market bear headwind (–8), and dollar pressure (–4). The entire three-ETF basket is trading on extended sentiment and overbought setups near 52-week highs; SMH and BOTZ are especially vulnerable, with BOTZ showing –15.0% SPY-relative weakness and near-zero momentum. For AI to earn any allocation slot, the category needs either a pullback to neutral structure/compression to reset entry risk, or a reversal of the broad-market-bear and credit-stress descriptors that currently suppress tech allocations. Late-cycle reflation favors real assets over duration-sensitive software; only a shift to rate-cut speculation or a dramatic valuation reset would restore AI's standing.
Emerging Markets — INDA
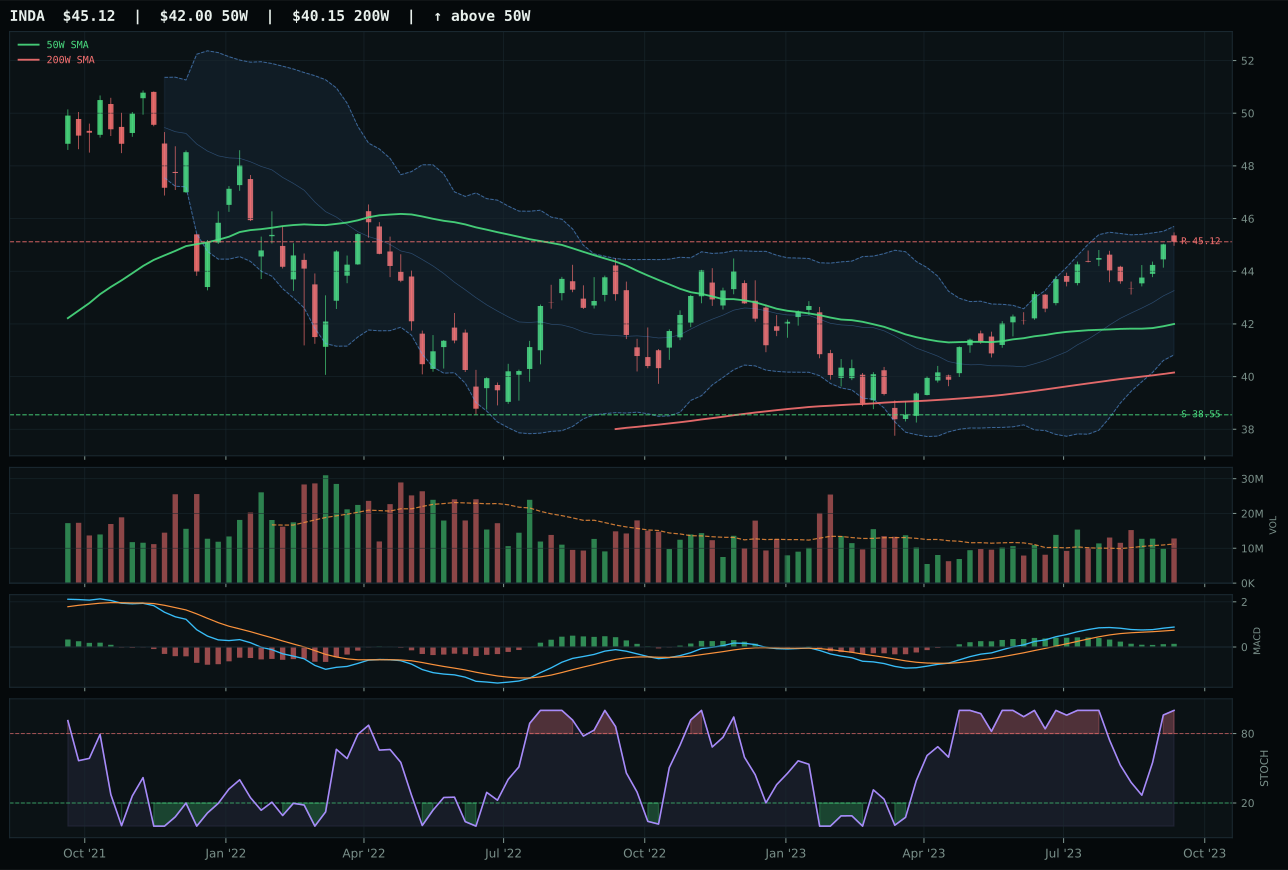
INDA has a neutral structure profile with 3.7% 13-week relative strength versus SPY.
A failed hold above support would weaken the setup.
Actionable but governed by invalidation levels.
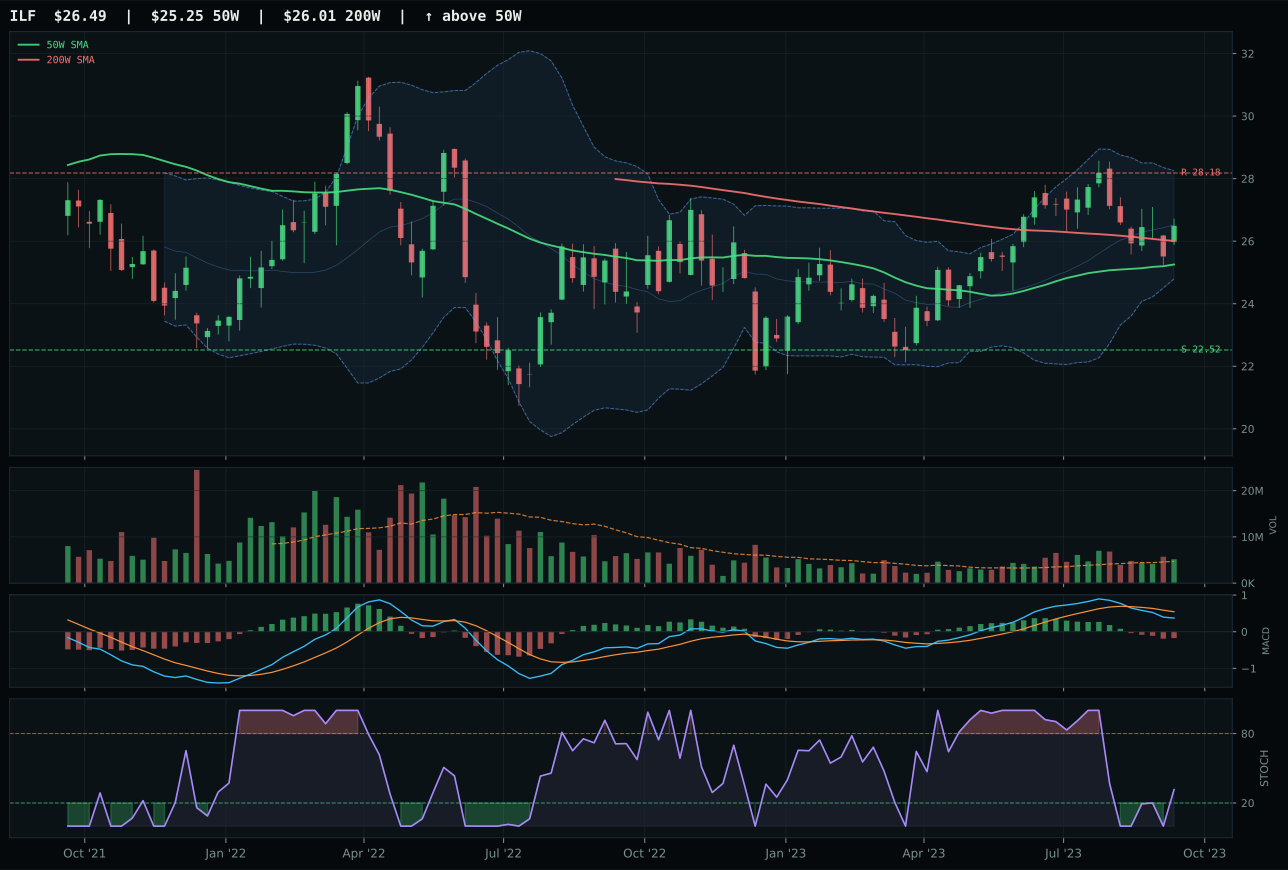
ILF has a neutral structure profile with -4.2% 13-week relative strength versus SPY.
A failed hold above support would weaken the setup.
Actionable but governed by invalidation levels.
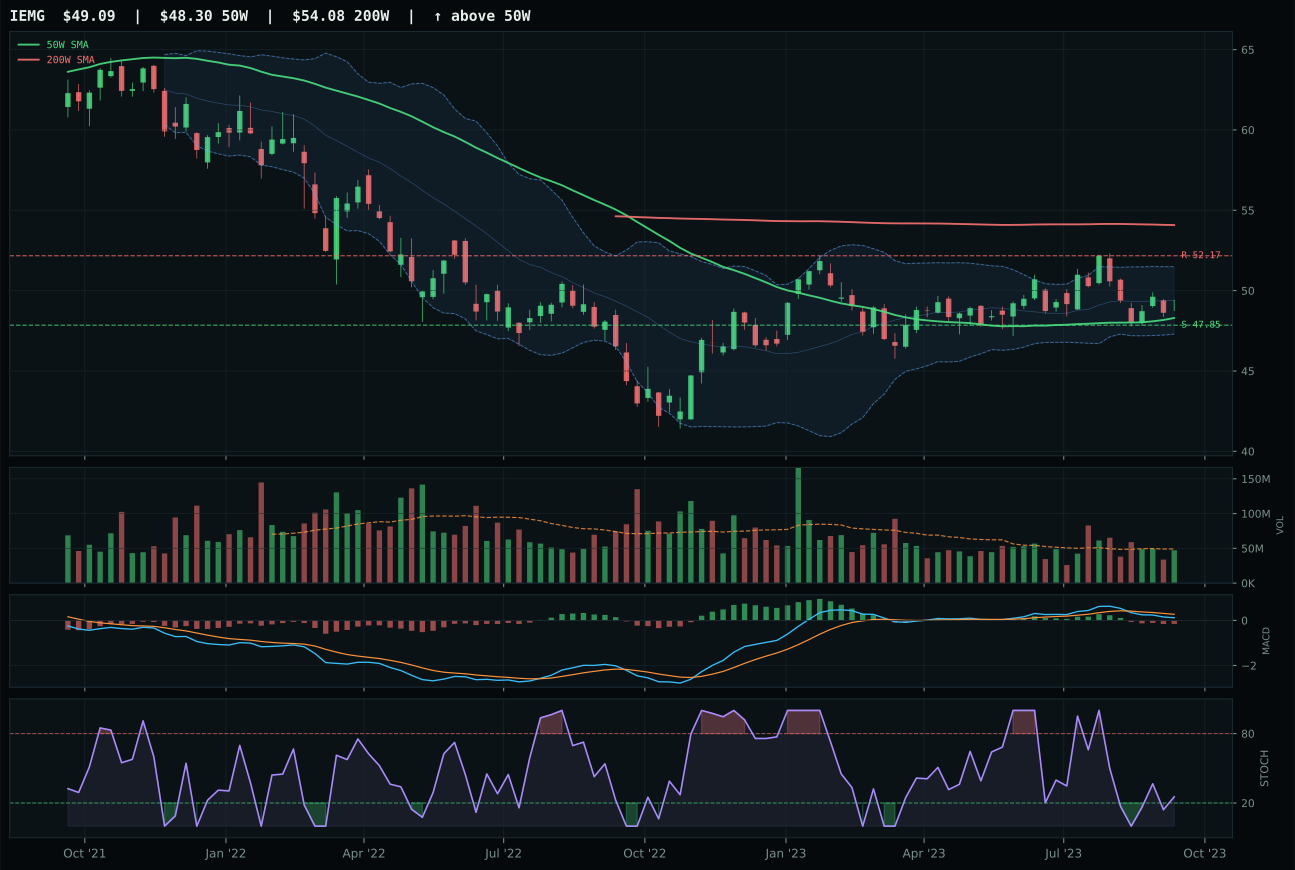
IEMG has a pullback into support profile with -4.1% 13-week relative strength versus SPY.
A failed hold above support would weaken the setup.
Actionable but governed by invalidation levels.
INDA wins Emerging Markets on technical merit despite a collapsing macro fit, posting 82.7/100 technical evidence and 90.6/100 momentum confirmation. Price is 7.4% above the 50W with neutral structure, compression 91.6, and support/resistance at 38.55/45.12. Stochastic RSI is overbought momentum at 1.00 but MACD is bullish but flattening—a setup that signals strength without fresh acceleration. Category-relative strength of 7.8% proves INDA is the strongest India/emerging-market lever in its basket, beating ILF's –0.1% and IEMG's flat performance. Yet the 17.8-point gap versus ILF (81 composite vs 63) obscures a deeper problem: both are trading on extended sentiment into overbought extremes. ILF's MACD bearish/weakening and stochastic rising mid-zone suggest it is already rolling over from a lower base, making INDA the lesser evil but not a compelling setup.
Emerging Markets receives 0% allocation this week, ranked 9th or 10th, with a final category score of 9.6 and a catastrophic category-level macro fit of 7.0/100. Dollar pressure active (–14), credit stress active (–10), liquidity stress active (–10), and broad-market bear active (–9) create a perfect storm for emerging-market currencies and equities. Late-cycle reflation with tight Fed policy favors developed markets with hard currency issuance over EM currencies under pressure. INDA's strong 3.7% SPY-relative return masks a shallow 4.6% 13W return and overbought technicals, meaning the outperformance is tactical rather than structural. For Emerging Markets to re-enter the allocation, the category would need (1) explicit Fed rate-cut signals, (2) a reversal of dollar-strength tailwinds, or (3) a de-escalation of credit-stress concerns that currently suppress EM credit spreads. INDA's technicals would also benefit from a pullback to the 50W (currently 7.4% extended) to reset entry risk. Until macro shifts, the allocation correctly stays at zero; this is not a category to force into a portfolio designed for late-cycle real-asset sponsorship.