
2023-09-08
Informational purposes only. The content in this report, including allocations, analysis, and commentary, is provided solely for informational and educational purposes. It does not constitute financial advice, investment advice, trading advice, or any other type of advice. Past performance does not guarantee future results. Always conduct your own research and consult a qualified financial professional before making investment decisions.
Weekly Allocation
| Ticker | Category | Weight | Role |
|---|---|---|---|
| FBTC | 50% | Overlay | |
| XLE | Traditional Energy | 10% | Top-2 (10%) |
| URNM | Nuclear Energy | 10% | Top-2 (10%) |
| MOO | Agriculture & Livestock | 5% | Tier-2 (5%) |
| PICK | Industrial Metals | 5% | Tier-2 (5%) |
| XAR | Defense & Aerospace | 5% | Tier-2 (5%) |
| GLD | Precious Metals | 5% | Tier-2 (5%) |
| IGV | Technology | 5% | Tier-2 (5%) |
| PAVE | Utilities & Infrastructure | 5% | Tier-2 (5%) |
Trade Instructions — Monday Open
Sell the tranche from 2023-08-11 (completing its 4-week hold). Buy the new tranche. Instructions show net portfolio changes — same-asset positions cancel, weight changes show the delta.
| Action | Ticker | Instruction |
|---|---|---|
| SELL | XOP | Sell entire XOP position (2.50% of portfolio) |
| SELL | AIQ | Sell 50% of AIQ position (reduce 2.50% → 1.25%) |
| SELL | COPX | Sell 33% of COPX position (reduce 3.75% → 2.50%) |
| SELL | CIBR | Sell 25% of CIBR position (reduce 5.00% → 3.75%) |
| SELL | ITA | Sell 25% of ITA position (reduce 5.00% → 3.75%) |
| SELL | XLU | Sell entire XLU position (1.25% of portfolio) |
| BUY | XLE | Buy XLE — 28.57% of freed cash (adds 2.50% to portfolio) |
| BUY | GLD | Buy GLD — 14.29% of freed cash (adds 1.25% to portfolio) |
| BUY | PICK | Buy PICK — 14.29% of freed cash (adds 1.25% to portfolio) |
| BUY | PAVE | Buy PAVE — 14.29% of freed cash (adds 1.25% to portfolio) |
| BUY | XAR | Buy XAR — 14.29% of freed cash (adds 1.25% to portfolio) |
| BUY | IGV | Buy IGV — 14.29% of freed cash (adds 1.25% to portfolio) |
Current Portfolio After Trade
Combined holdings across all 4 active tranches. Each tranche is 25% of the portfolio.
| Ticker | % of Portfolio | Weight Bar |
|---|---|---|
| FBTC | 50.00% | |
| URNM | 10.00% | |
| XLE | 10.00% | |
| MOO | 5.00% | |
| CIBR | 3.75% | |
| ITA | 3.75% | |
| GLD | 3.75% | |
| PAVE | 3.75% | |
| COPX | 2.50% | |
| PICK | 2.50% | |
| AIQ | 1.25% | |
| SLV | 1.25% | |
| XAR | 1.25% | |
| IGV | 1.25% |
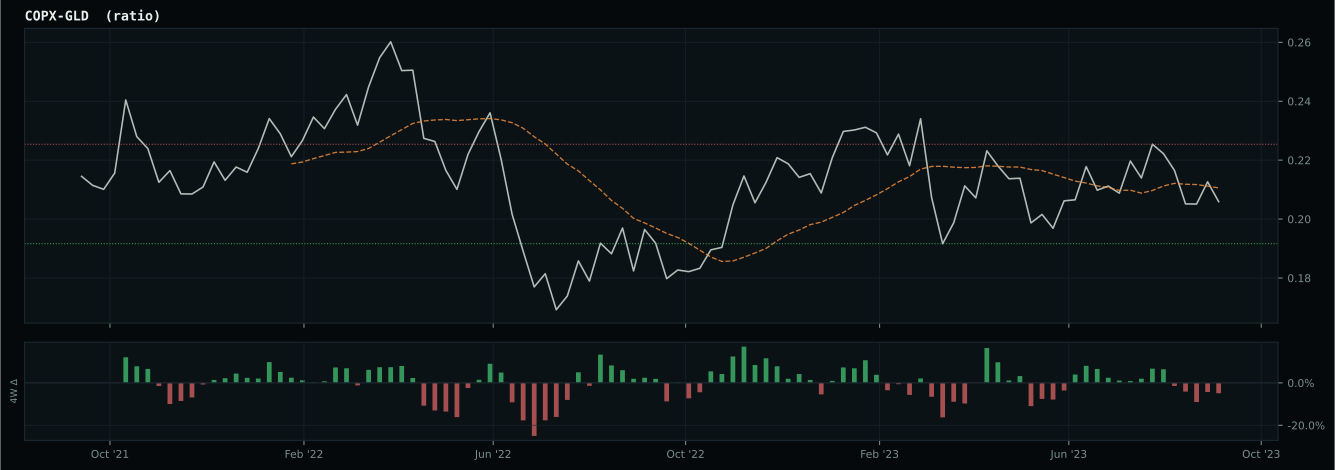
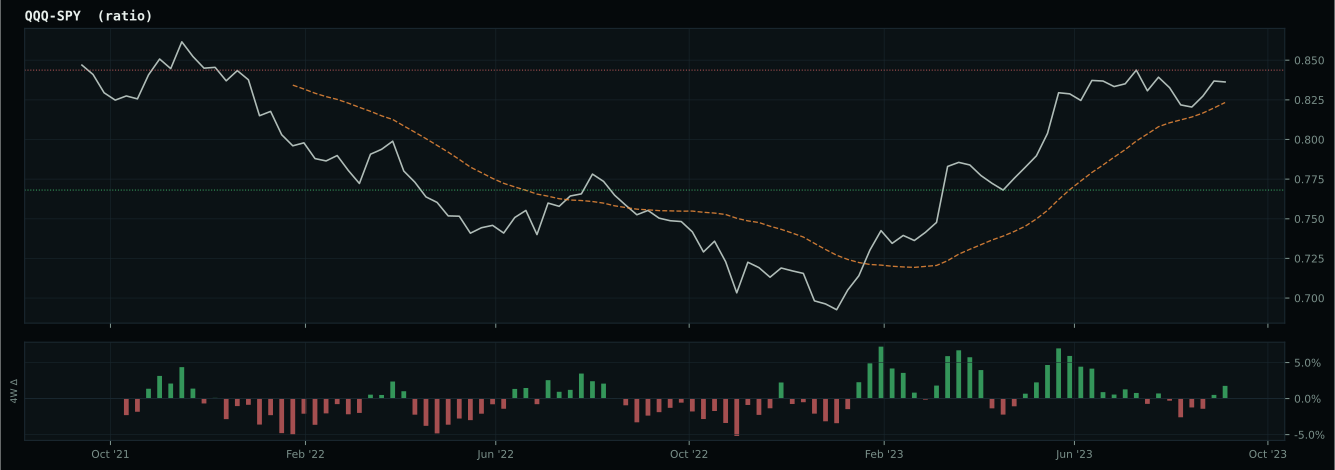
Macro Regime — Late-Cycle Reflation
Macro Evidence Charts
Market-implied signals behind the macro regime scores. Each ratio compares two assets; the direction and slope of the ratio is what the macro engine reads.
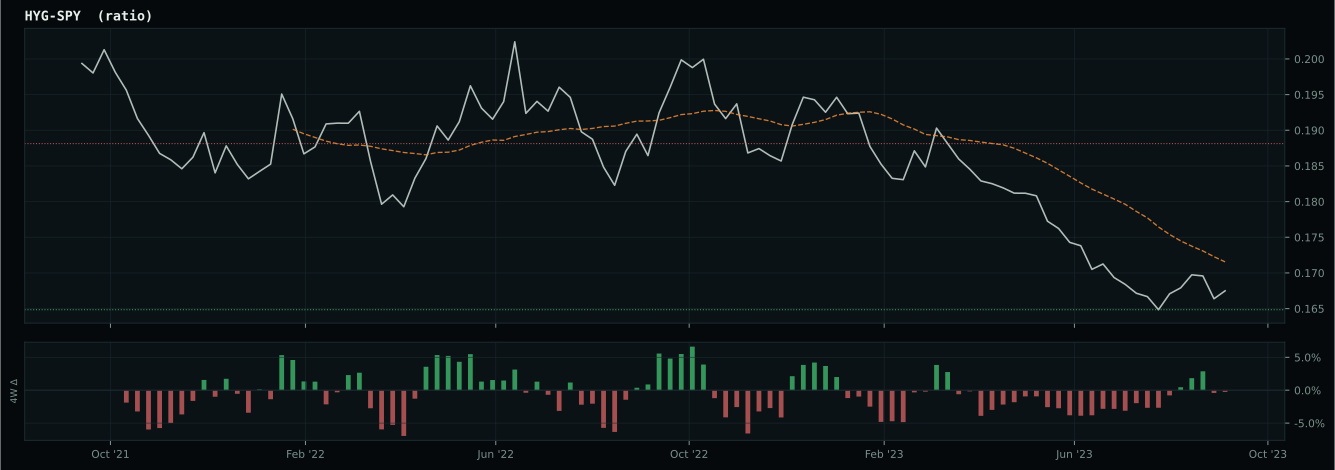
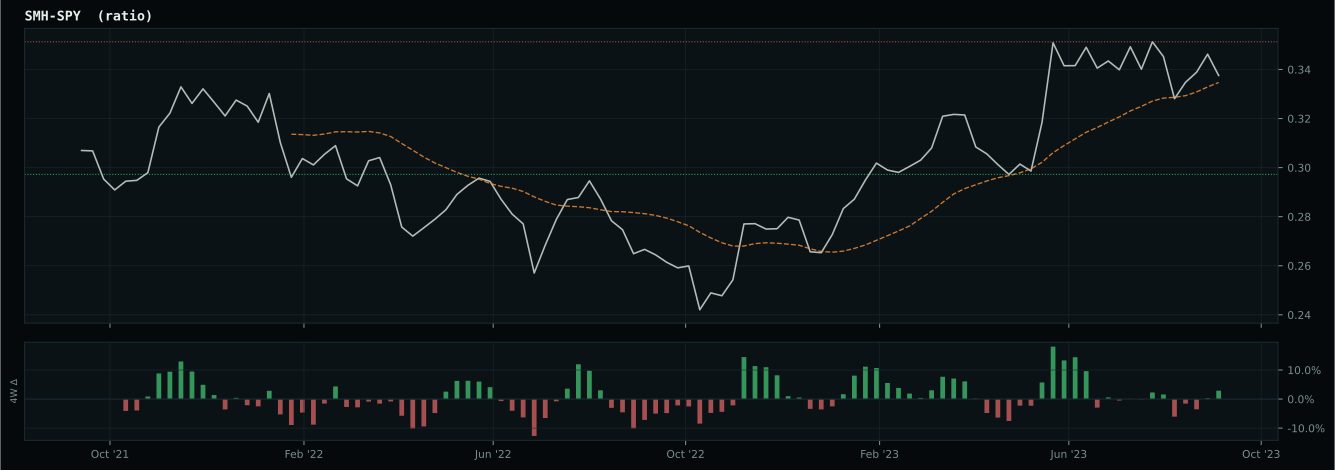
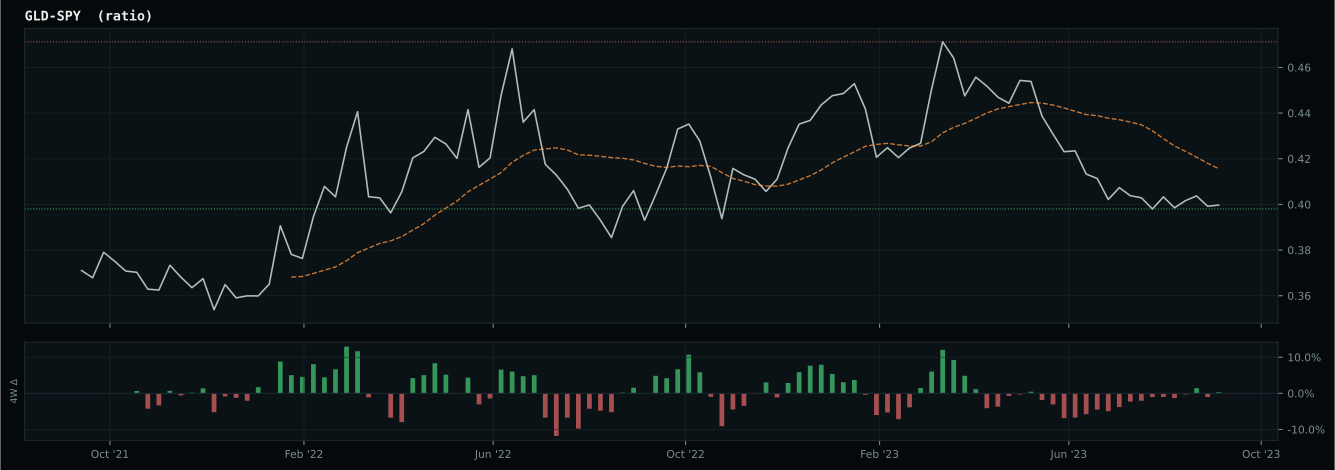
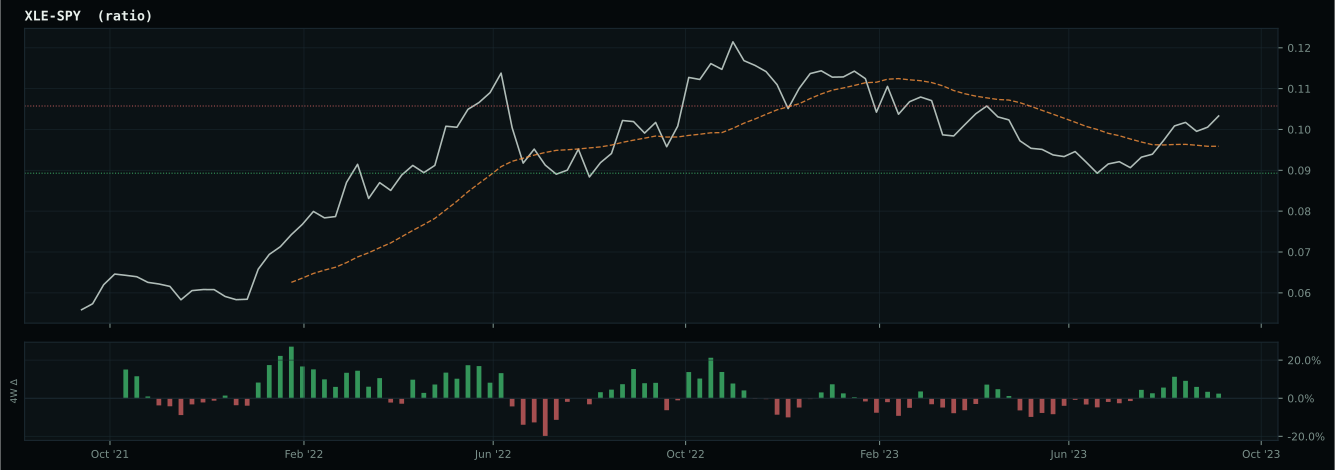
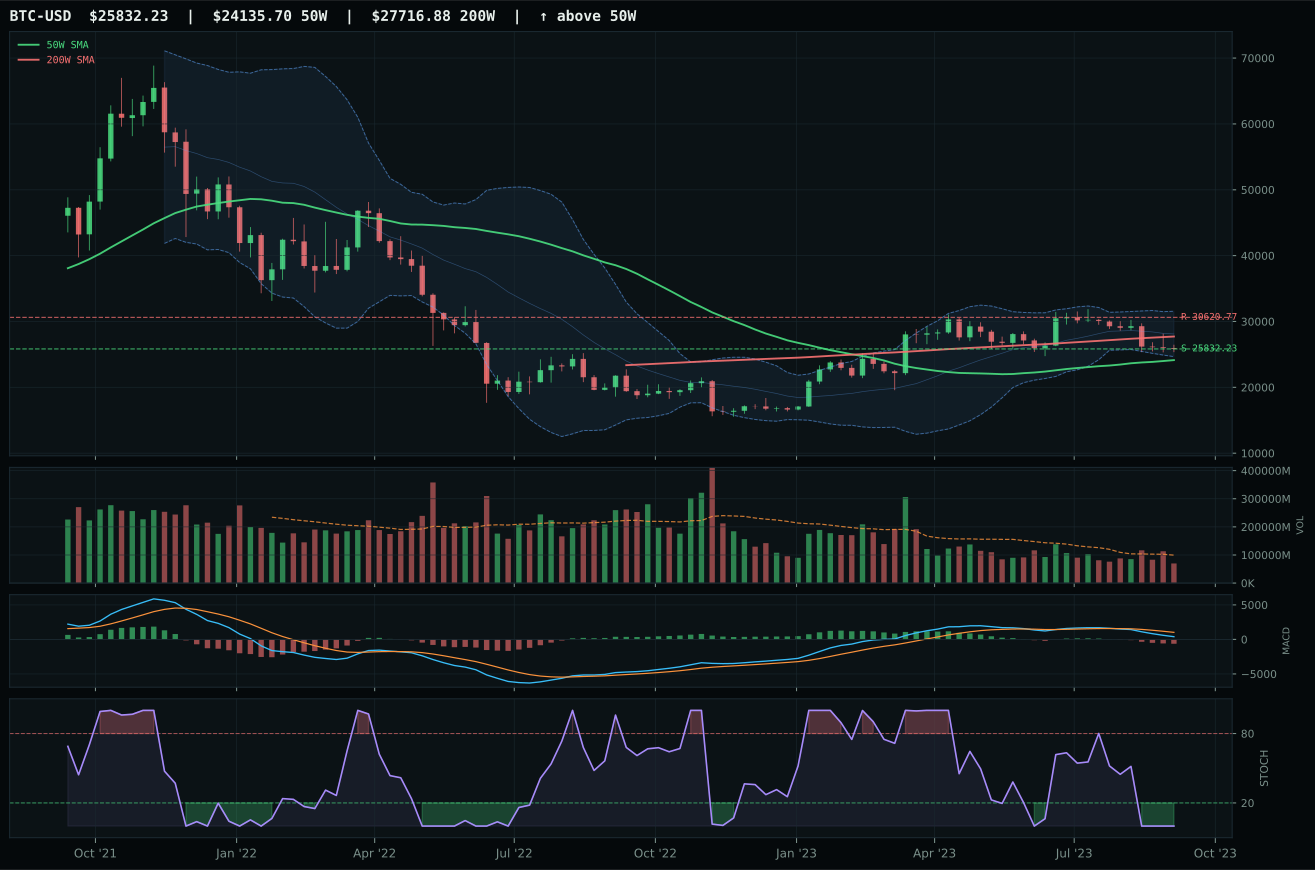
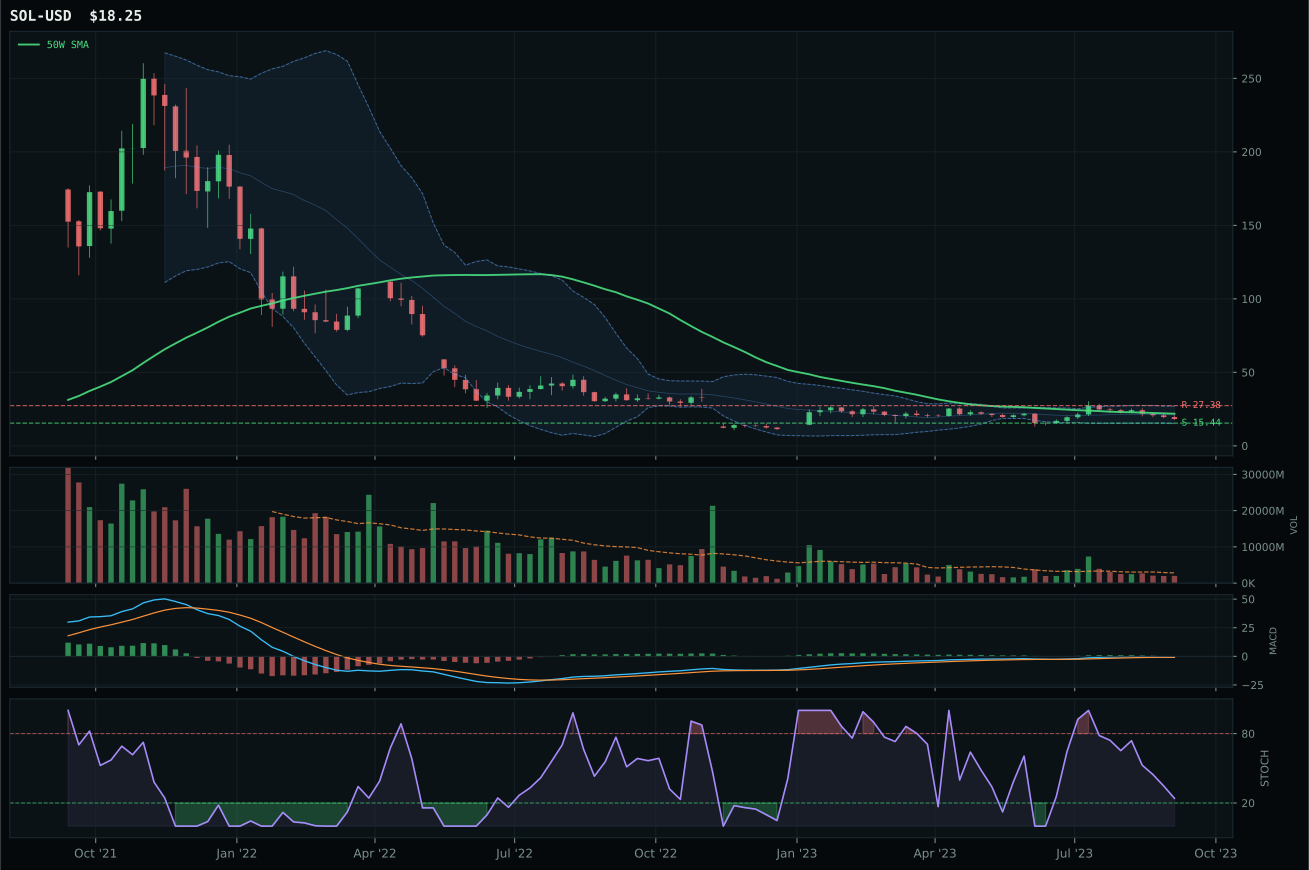
Crypto Regime — TrendBTC
post-touch structure is too wide to count as a range; max/min close ratio is 1.88
TrendBTC confirmed: 2 consecutive closes above rising/flat 50W SMA
one or more available conditions failed
Category Rankings
| Rank | Category | Winner | Score | Alloc | 4W Ret | Peers (4W) |
|---|---|---|---|---|---|---|
| 1 | Traditional Energy | XLE | 82.0 | 20% | -5.06% | XOP -7.0% · FCG -5.1% |
| 2 | Nuclear Energy | URNM | 68.0 | 20% | +11.58% | URA +5.3% · NLR +3.6% |
| 3 | Agriculture & Livestock | MOO | 43.3 | 10% | -7.62% | VEGI -6.0% · WEAT -1.7% |
| 4 | Industrial Metals | PICK | 38.1 | 10% | -4.14% | COPX -6.6% · REMX -12.8% |
| 5 | Defense & Aerospace | XAR | 36.6 | 10% | -4.34% | ITA -4.3% · ROKT -3.1% |
| 6 | Precious Metals | GLD | 35.9 | 10% | -4.35% | SLV -6.6% · GDX -4.9% |
| 7 | Technology | IGV | 33.4 | 10% | -5.45% | CIBR -3.6% · XLK -4.1% |
| 8 | Utilities & Infrastructure | PAVE | 29.2 | 10% | -4.66% | XLU -9.4% · IGF -7.8% |
| 9 | AI | SMH | 22.6 | 0% | -3.55% | AIQ -5.3% · BOTZ -6.3% |
| 10 | Emerging Markets | INDA | 15.3 | 0% | -3.02% | IEMG -4.7% · ILF -6.5% |
Traditional Energy — XLE
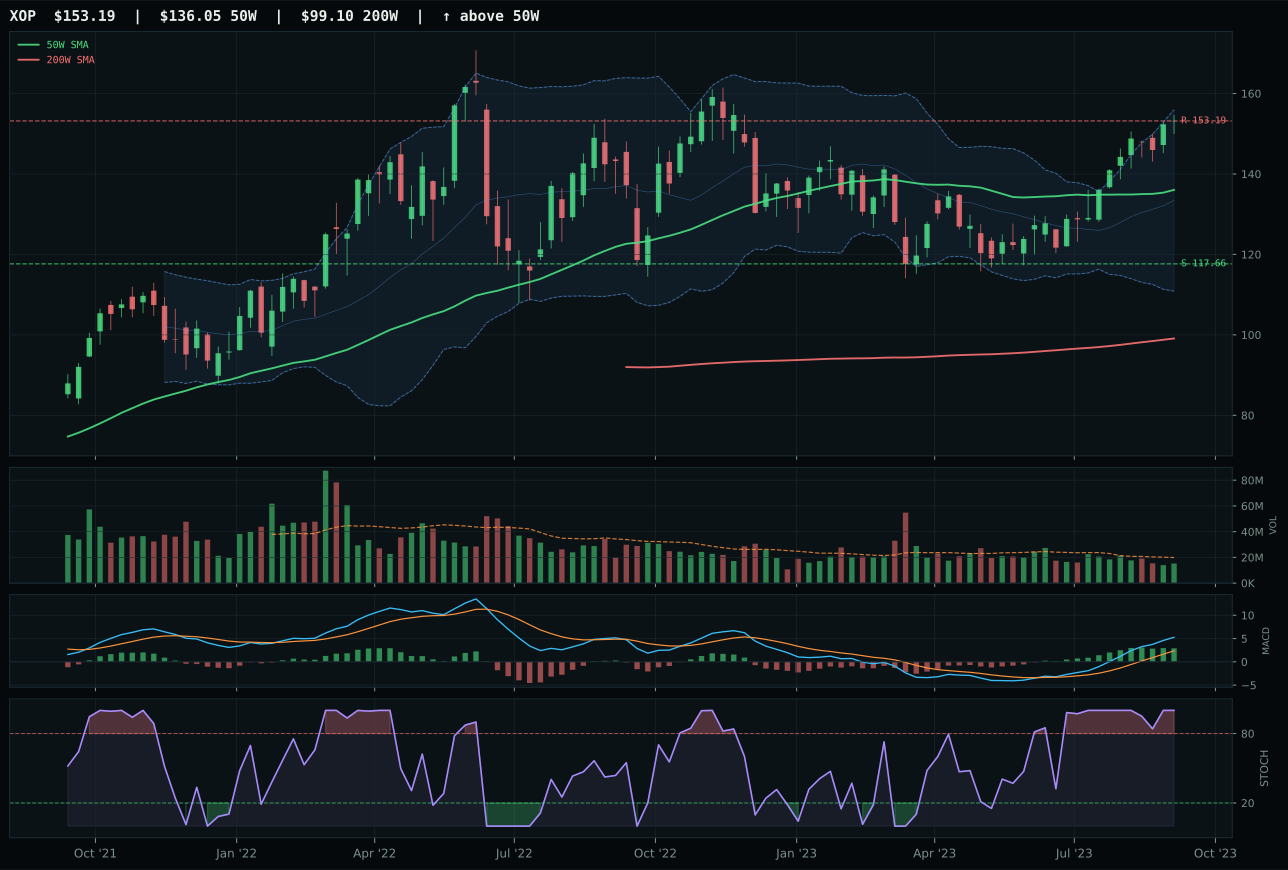
XOP has a neutral structure profile with 16.7% 13-week relative strength versus SPY.
A failed hold above support would weaken the setup.
Actionable but governed by invalidation levels.
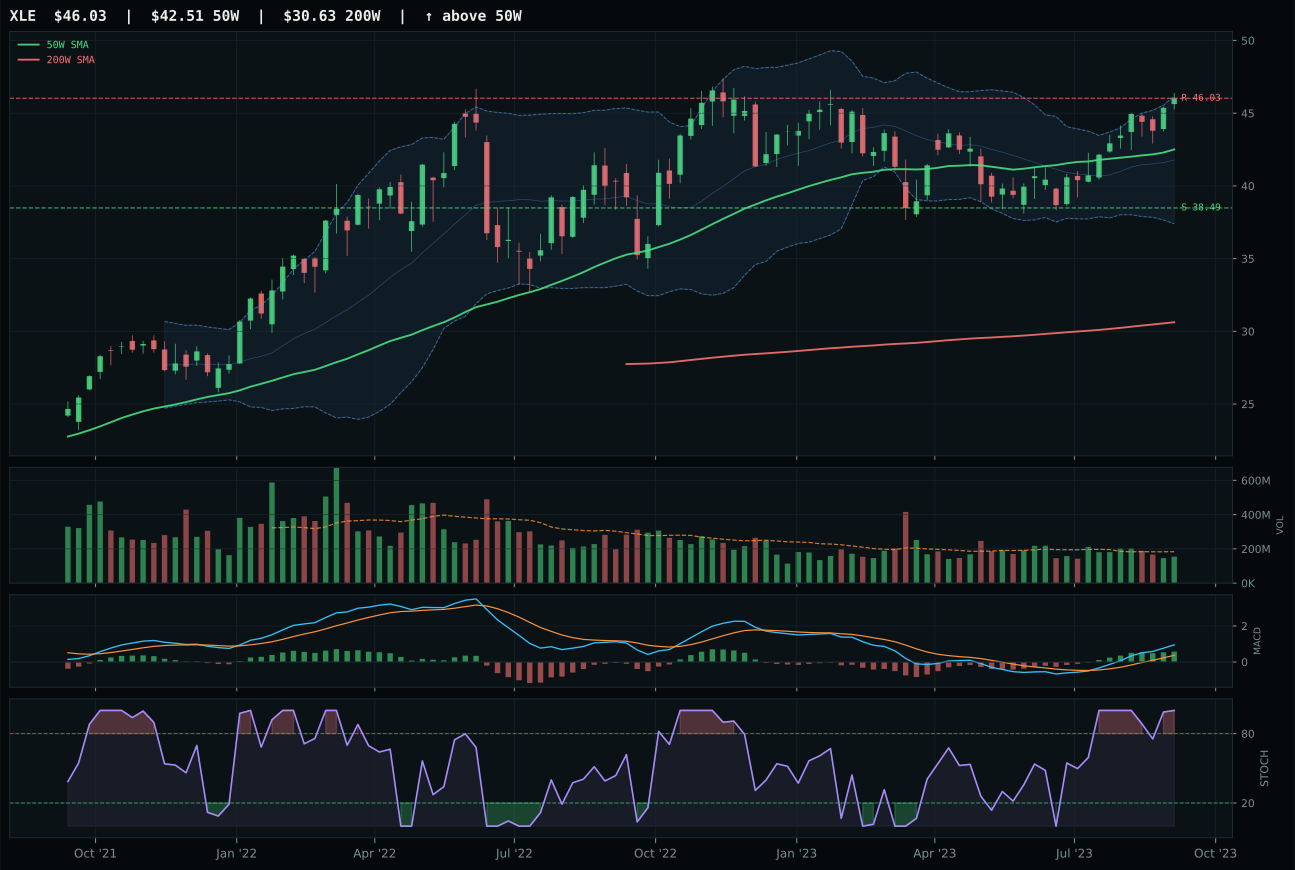
XLE has a neutral structure profile with 9.5% 13-week relative strength versus SPY.
A failed hold above support would weaken the setup.
Actionable but governed by invalidation levels.
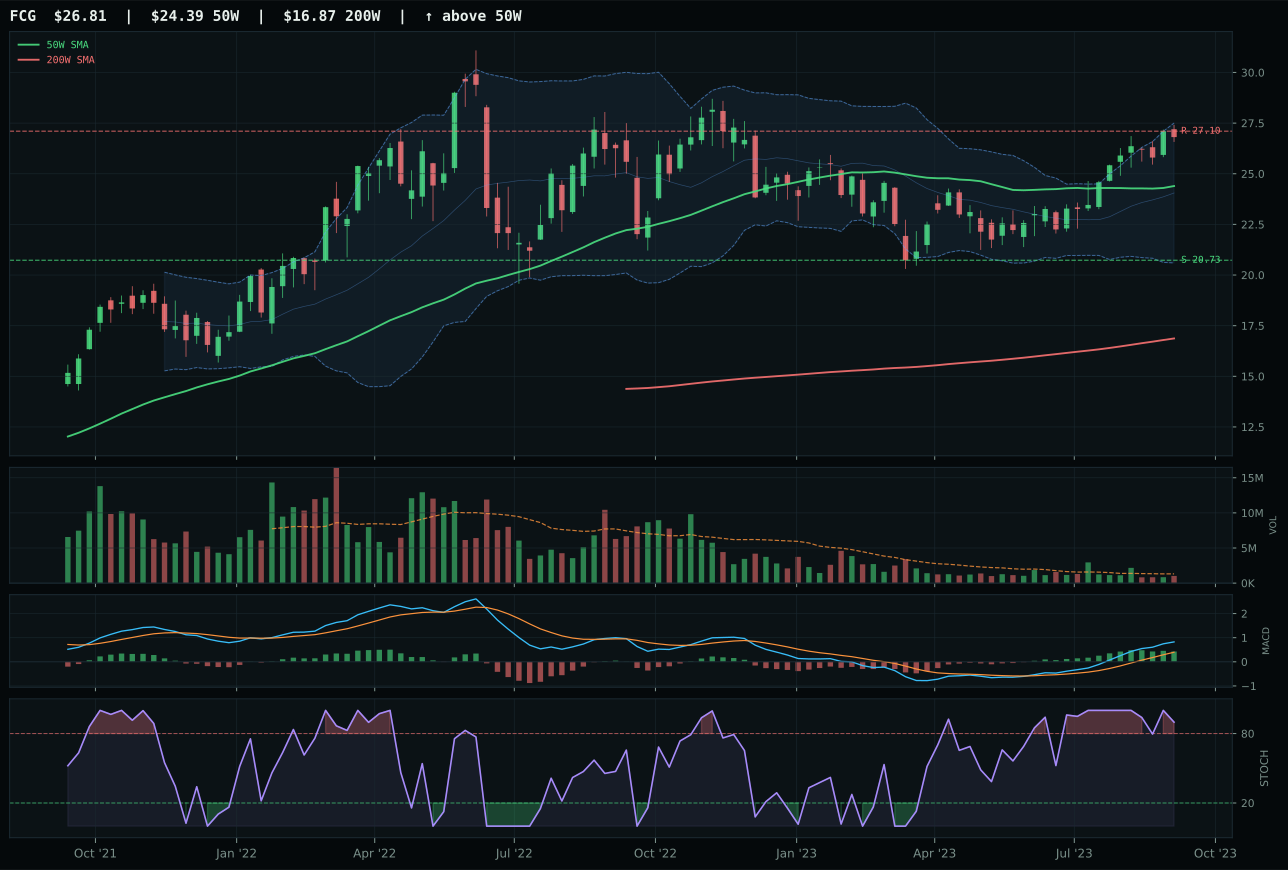
FCG has a neutral structure profile with 12.9% 13-week relative strength versus SPY.
A failed hold above support would weaken the setup.
Actionable but governed by invalidation levels.
XLE claims the top allocation (20%) by combining the portfolio's highest trend score (100.0) with the strongest macro sponsorship (86.0 fit) and a timing setup that balances momentum extension with technical clarity. XLE's 13-week return of 13.2% and 9.5% SPY-relative outperformance are not accidents; they reflect persistent energy scarcity (+14 macro boost) and inflation pressure (+10) that support price despite XLE sitting 8.3% above the 50-week. The structure is neutral (not extended), and MACD improves while stochastic RSI holds overbought, signaling conviction rather than exhaustion. XOP appears to offer higher 13-week momentum (20.3% versus 13.2%), but its timing drops to 62.0 because the extended position carries re-test risk and MACD begins to flatten rather than improve. XLE's 74.7 volume-price confirmation and 70.9 persistence scores—both highest in the category—confirm that energy strength is being accumulated systematically, not chased.
Traditional Energy's 82.0 final score earned it a full 10% allocation—the portfolio's largest single-category slot—because category macro fit is 90.0, the highest in the system. Energy scarcity (+16), late-cycle reflation (+12), inflation pressure (+10), supply shortage (+9), and real asset sponsorship (+7) combine to make this the regime's primary expression. The allocation is not tactical; it's structural. XLE's momentum confirmation (89.4) validates that accumulation is active, and the 9.5% SPY relative strength proves institutional participation. Risk is acknowledged: upside-to-resistance is 0.0% (price is near 46.03), meaning further extension requires a breakout, yet downside-to-support (19.6%) provides margin of safety. Hold this allocation at full weight. The only exit signal is a close below 38.49 support on heavy volume, which would signal a regime shift requiring immediate rebalancing.
Nuclear Energy — URNM
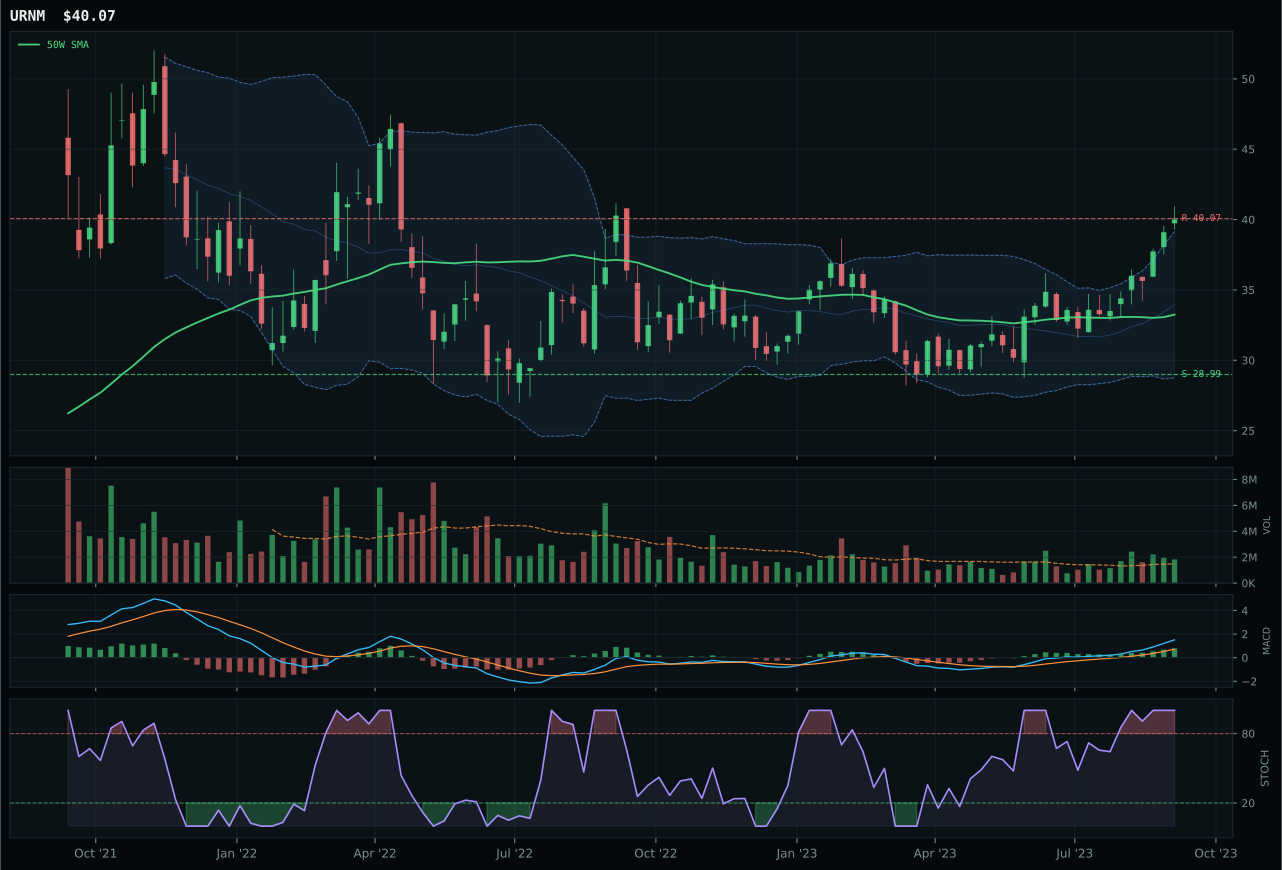
URNM has a vertical extension profile with 14.7% 13-week relative strength versus SPY.
A failed hold above support would weaken the setup.
Actionable but governed by invalidation levels.
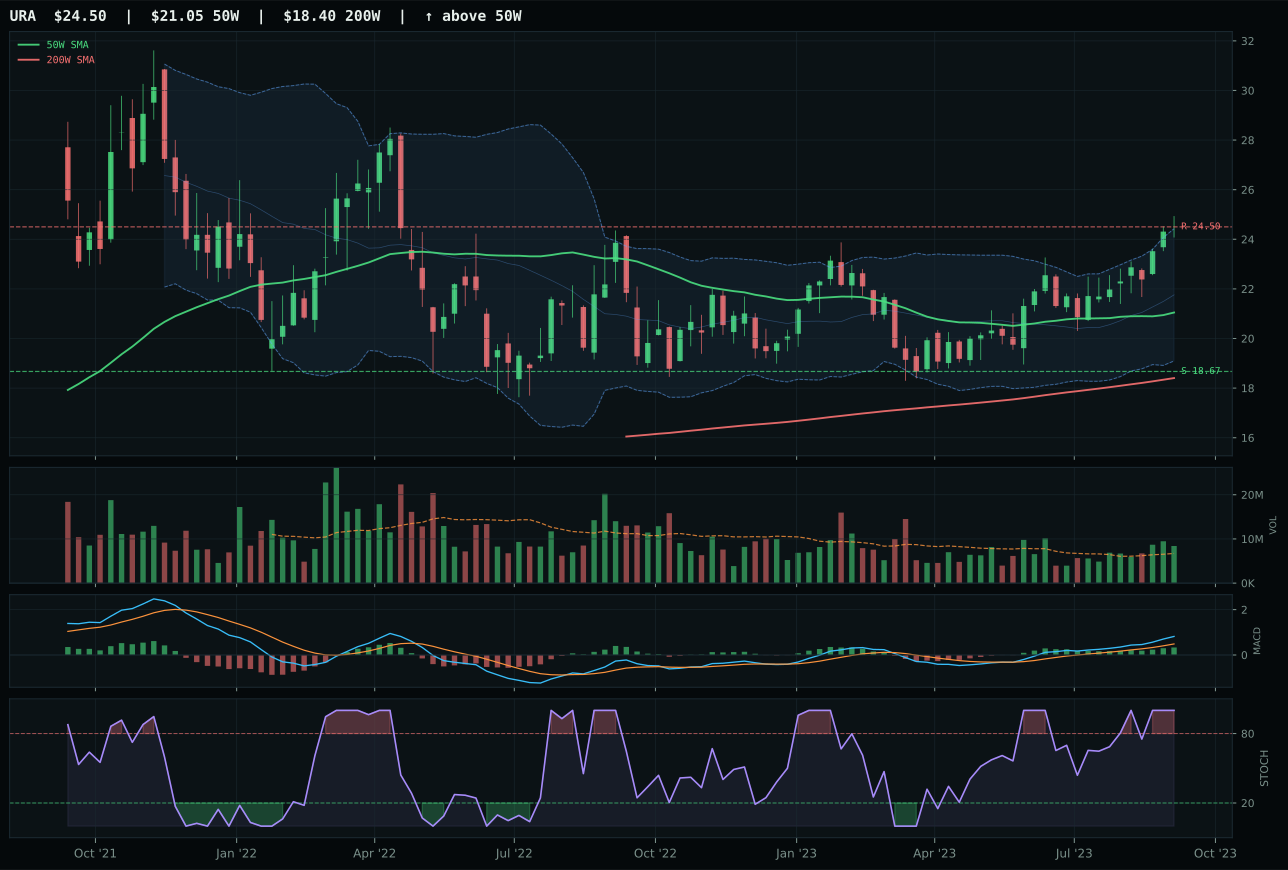
URA has a vertical extension profile with 8.2% 13-week relative strength versus SPY.
A failed hold above support would weaken the setup.
Actionable but governed by invalidation levels.
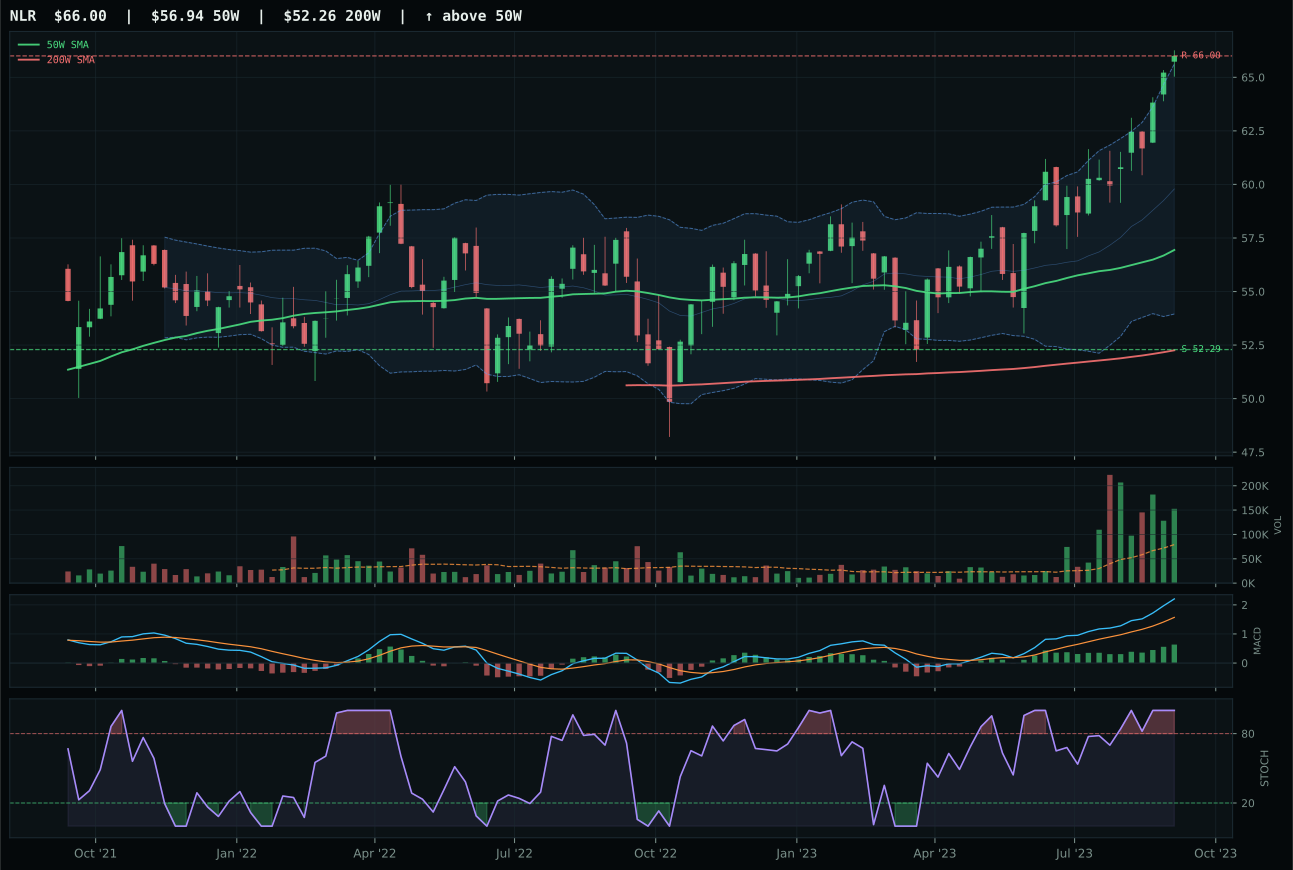
NLR has a vertical extension profile with 8.3% 13-week relative strength versus SPY.
A failed hold above support would weaken the setup.
Tracked, but not top-2 eligible because: .
URNM clinches the second 10% allocation slot by posting the portfolio's only perfect momentum confirmation score (100.0) across 4-week, 13-week, and category-relative metrics, bolstered by above-average volume participation (1.23x 20-week average). The 18.3% 13-week return and 14.7% SPY-relative outperformance are undeniable, but the critical advantage over URA emerges in category-relative strength: URNM delivers 6.4% versus URA's 0.0%, indicating that uranium-miner exposure is winning within the category basket. Both sit 20.5% extended above the 50-week, which crushes timing to 37.0 for both, but URNM's MACD is improving while URA's remains neutral, creating a secondary confirmation that momentum is freshening rather than rolling over. The structure is vertical extension with strong compression (75.7), and the 40.8 risk-reward reflects the reality that most upside is already claimed—yet the persistence score of 76.1 indicates buyers continue to accumulate even at extended prices.
Nuclear Energy's 68.0 score earned a full 10% allocation because energy scarcity (+9), late-cycle reflation (+7), real asset sponsorship (+7), and inflation pressure (+3) underpin the thesis, and technical momentum confirmation is stronger than XLE's. The dual 10% allocation to both energy and nuclear reflects a deliberate portfolio tilt toward commodity scarcity and energy infrastructure—this is not accidental overlap but intentional conviction. URNM carries higher extension risk (20.5% above the 50-week versus XLE's 8.3%), and risk-reward is compressed (40.8 versus 52.4), yet the above-average volume tells you this is distribution-ready, not distribution-in-progress. The allocation is 20%, not 10%, because nuclear offers higher volatility and potential return in a supply-constrained scenario. Exit discipline: URNM must hold above 28.99 support. A close below on elevated volume would signal institutions are rotating out, warranting a 50% reduction and redeployment to XLE or URNM itself if it reprices lower.
Agriculture & Livestock — MOO
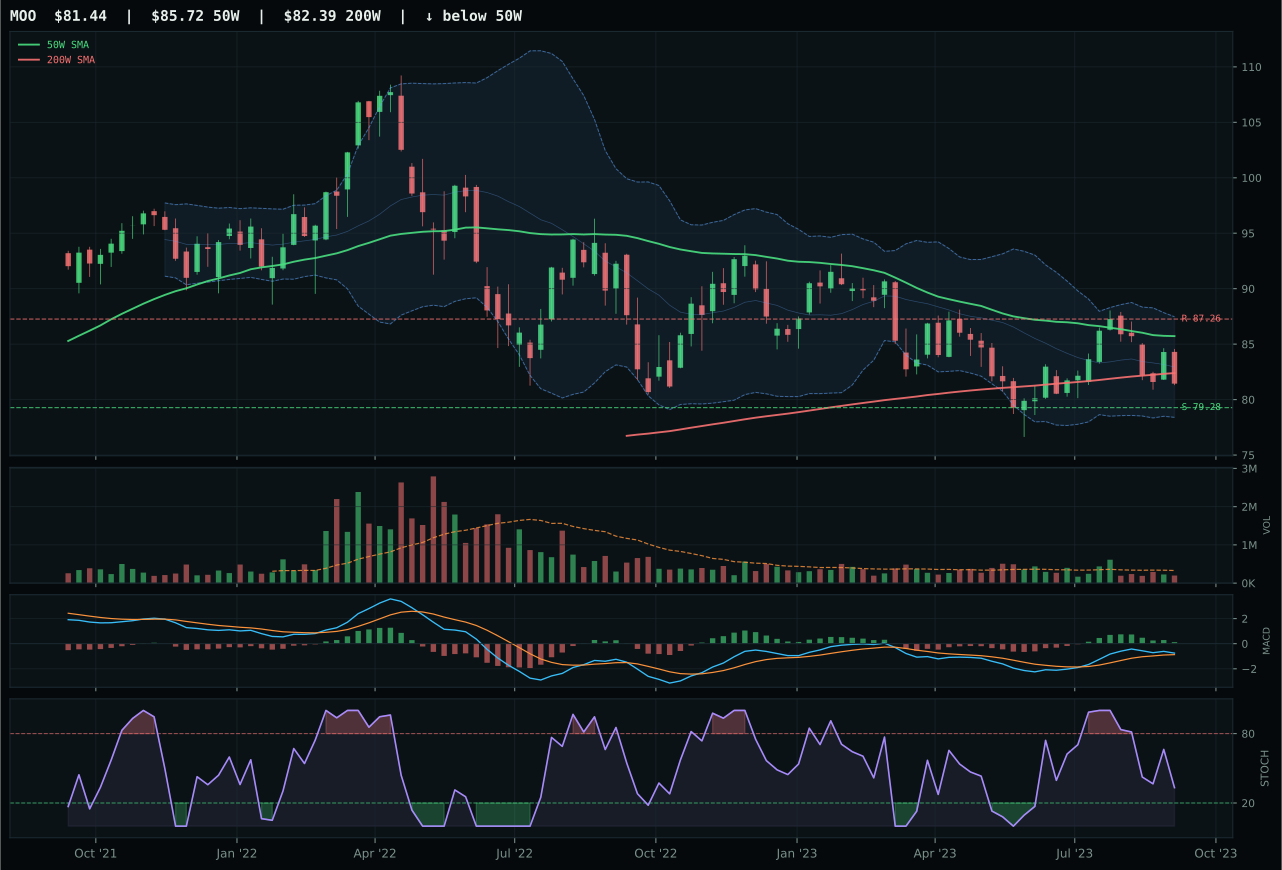
MOO has a pullback into support profile with -2.0% 13-week relative strength versus SPY.
A failed hold above support would weaken the setup.
Actionable but governed by invalidation levels.
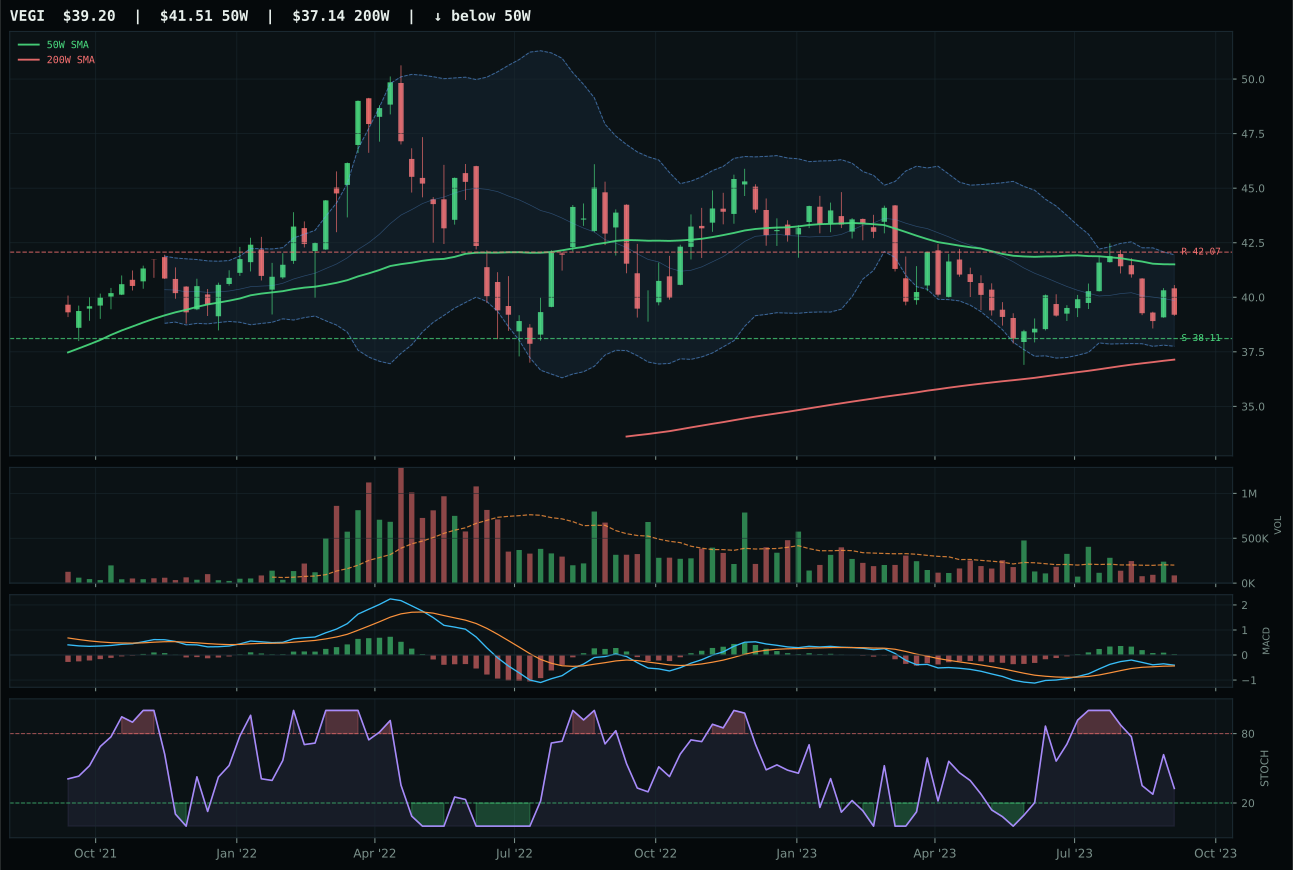
VEGI has a pullback into support profile with -2.0% 13-week relative strength versus SPY.
A failed hold above support would weaken the setup.
Tracked, but not top-2 eligible because: .
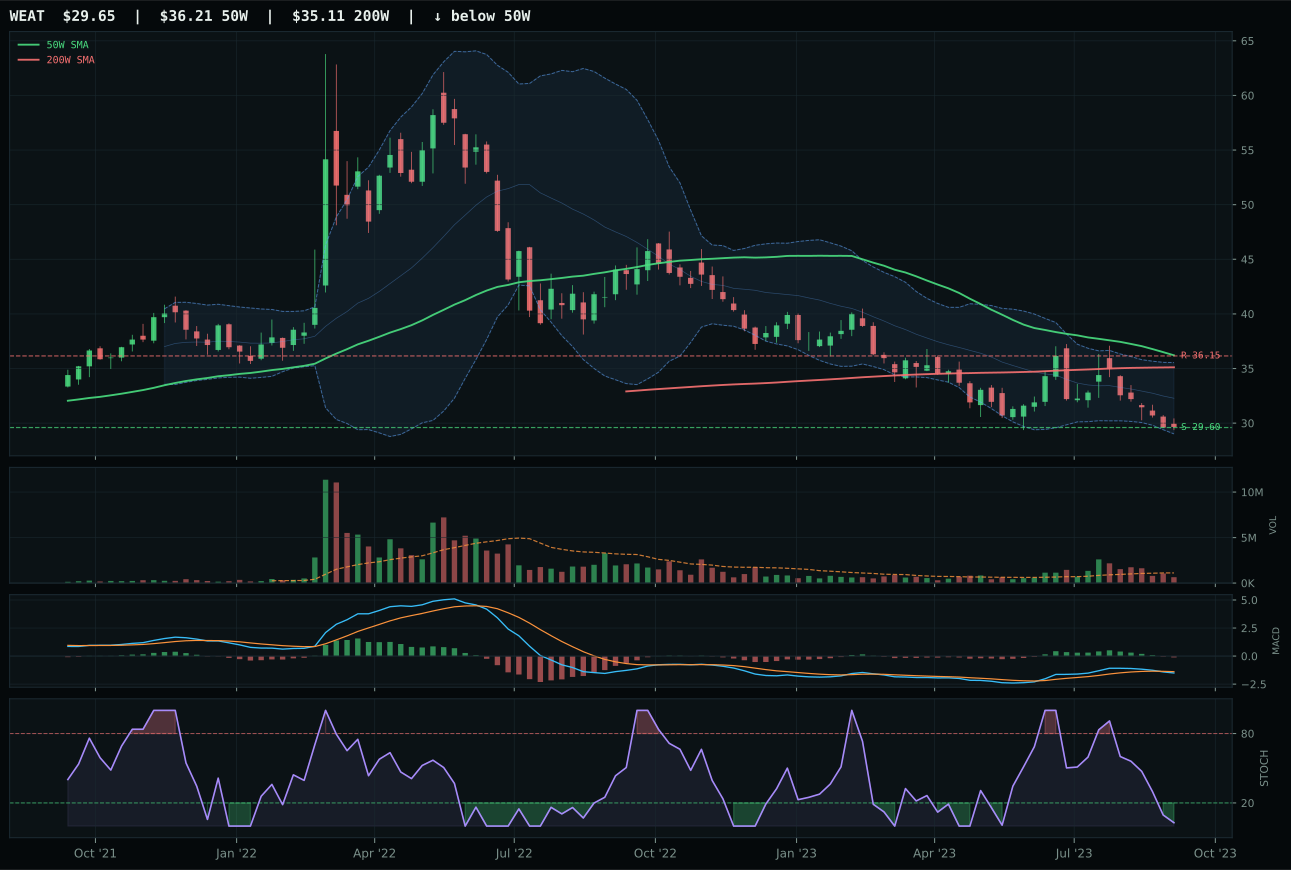
WEAT has a pullback into support profile with -10.7% 13-week relative strength versus SPY.
A failed hold above support would weaken the setup.
Actionable but governed by invalidation levels.
MOO wins Agriculture by delivering the category's best risk-reward ratio at 97.1 (versus VEGI's 95.9) despite trend scoring of only 48.0—a position below the 50-week moving average. The critical advantage emerges in timing: MACD is bullish but flattening while stochastic RSI falls through neutral at 0.33, creating a setup near Fibonacci 0.786 deep retracement where downside to support is just 2.7% but upside to resistance extends 6.7% unfulfilled. VEGI presents identical macro sponsorship (supply shortage +8, inflation pressure active) but its timing score stalls at 87.0 because the Fibonacci position is shallower, forcing buyers to accept less margin of safety. The 18-point gap versus WEAT underscores MOO's clear superiority in technical foundation and category-relative execution; WEAT's -10.7% SPY-relative return and -7.1% 13-week performance disqualify it entirely.
Agriculture earns 5% allocation on the strength of category-level macro fit (90.0), the second-highest in the portfolio behind traditional energy. Supply shortage (+13), inflation pressure (+10), and real asset sponsorship (+8) combine to make this the only category where late-cycle reflation dynamics actively support the thesis. MOO's technical evidence is just 56.0, below average, yet the 70.0 macro fit dominates the composite; the final score of 43.3 reflects macro weight (38%) overpowering weak momentum. The allocation is defensive—holding real assets as an inflation hedge. However, if support at 79.28 breaks, the macro thesis remains sound but the technical setup is compromised; watch for volume to pick up on the recovery from support, not just price action alone. A clean bounce to 87.26 resistance on three-times-average volume would validate; meandering sideways signals patience and warrants a reduced position.
Industrial Metals — PICK
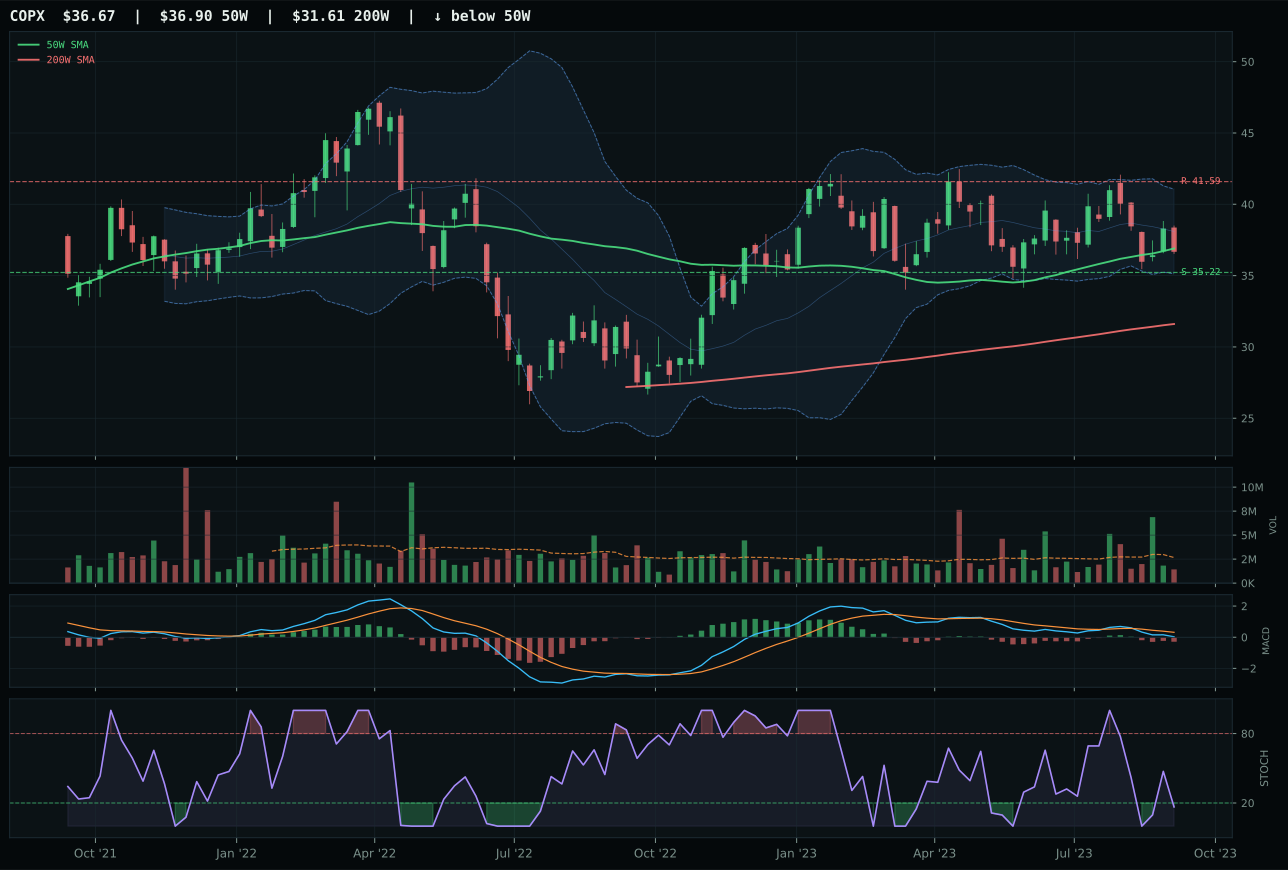
COPX has a pullback into support profile with -6.1% 13-week relative strength versus SPY.
A failed hold above support would weaken the setup.
Actionable but governed by invalidation levels.
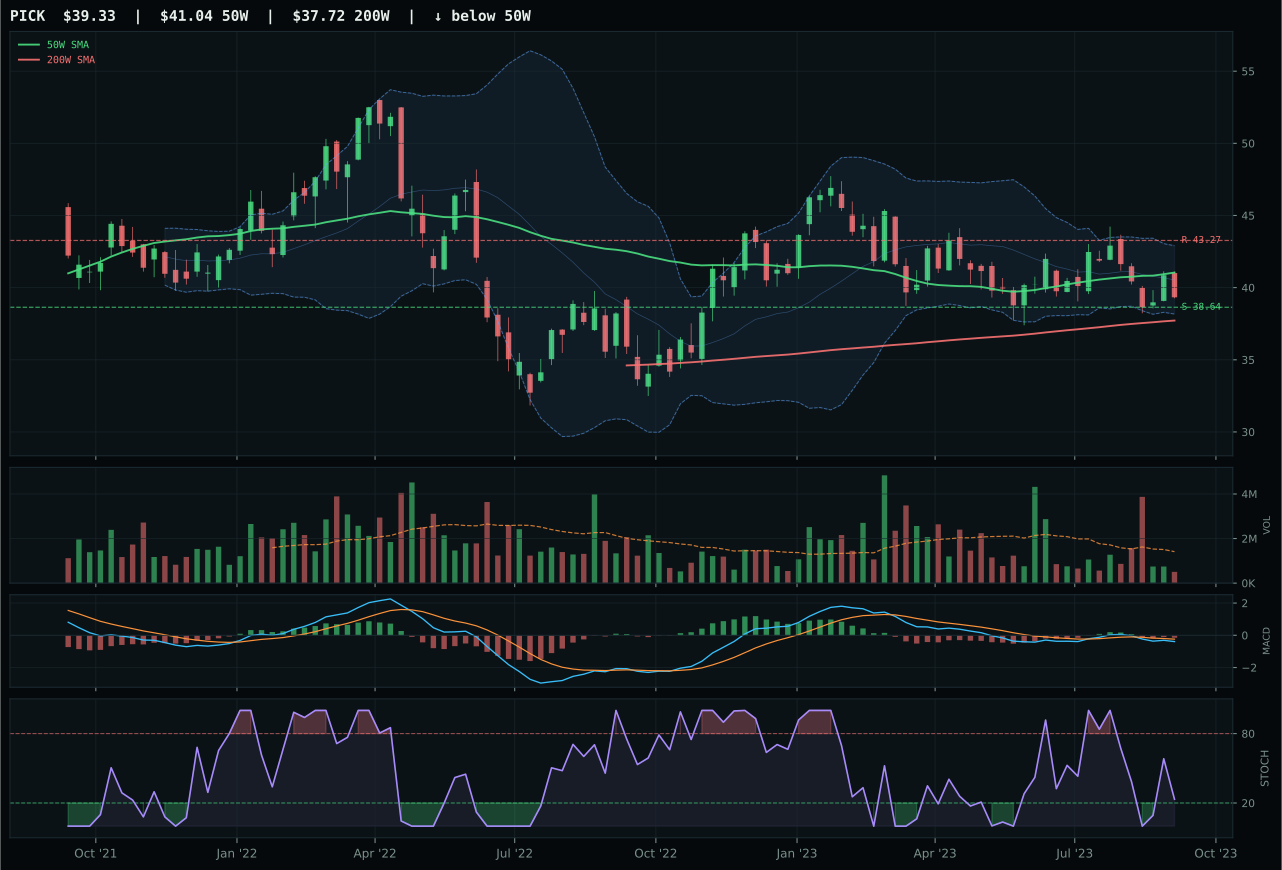
PICK has a pullback into support profile with -5.9% 13-week relative strength versus SPY.
A failed hold above support would weaken the setup.
Actionable but governed by invalidation levels.
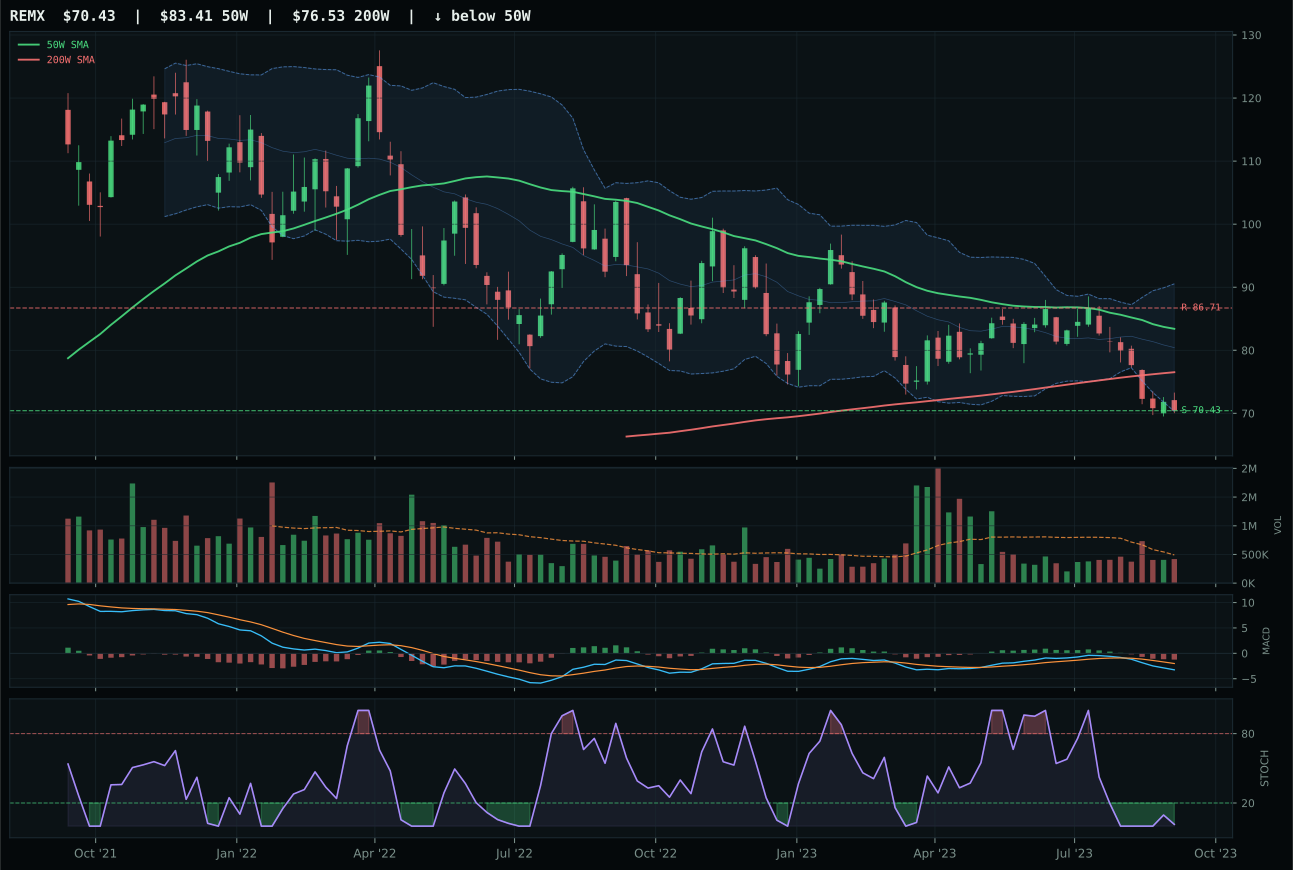
REMX has a pullback into support profile with -19.9% 13-week relative strength versus SPY.
A failed hold above support would weaken the setup.
Actionable but governed by invalidation levels.
PICK defeats COPX on a single decisive point: risk-reward at 98.0 versus 90.0, paired with stochastic RSI positioned at rising mid-zone (0.23) rather than the more volatile oversold turn-up seen in COPX (0.00). Both face bearish-weakening MACD, but PICK's setup sits precisely at Fibonacci 0.500 mid-zone while COPX's compression extends higher into the upper retracement, placing COPX closer to a failed reversal scenario. PICK's -4.2% pullback from the 50-week provides defined entry risk (1.8% downside to support) with 9.1% upside unfulfilled to resistance—a 5:1 asymmetry that commands allocation despite the category's overall weakness. COPX's superior SPY-relative return of 20.3 (versus PICK's -2.2%) appears attractive until volume is examined: COPX runs on thin participation and MACD deterioration, whereas PICK's volume at 0.36x 20-week average reflects genuine reset rather than distributional weakness.
Industrial Metals earns 5% on the back of category macro fit (61.0) and the portfolio's need for diversified commodity exposure. Commodity breadth positive (+10), late-cycle reflation (+10), and real asset sponsorship (+6) support the thesis, though liquidity stress (-8) and credit stress (-7) create headwinds. PICK's final score of 38.1 ranks it seventh, a middle-ground allocation sandwiched between the top-two energy exposures and the strong macro cases in agriculture. The category is being held because mining diversification hedges against single-commodity concentration risk (nuclear, energy). However, the technical setup is fragile: support at 38.64 is the invalidation point, and volume is thin (0.36x the 20-week average). A weekly close below support followed by a failed bounce would warrant an immediate 50% reduction, redeploying that capital to agriculture or energy where momentum confirmation is stronger.
Defense & Aerospace — XAR
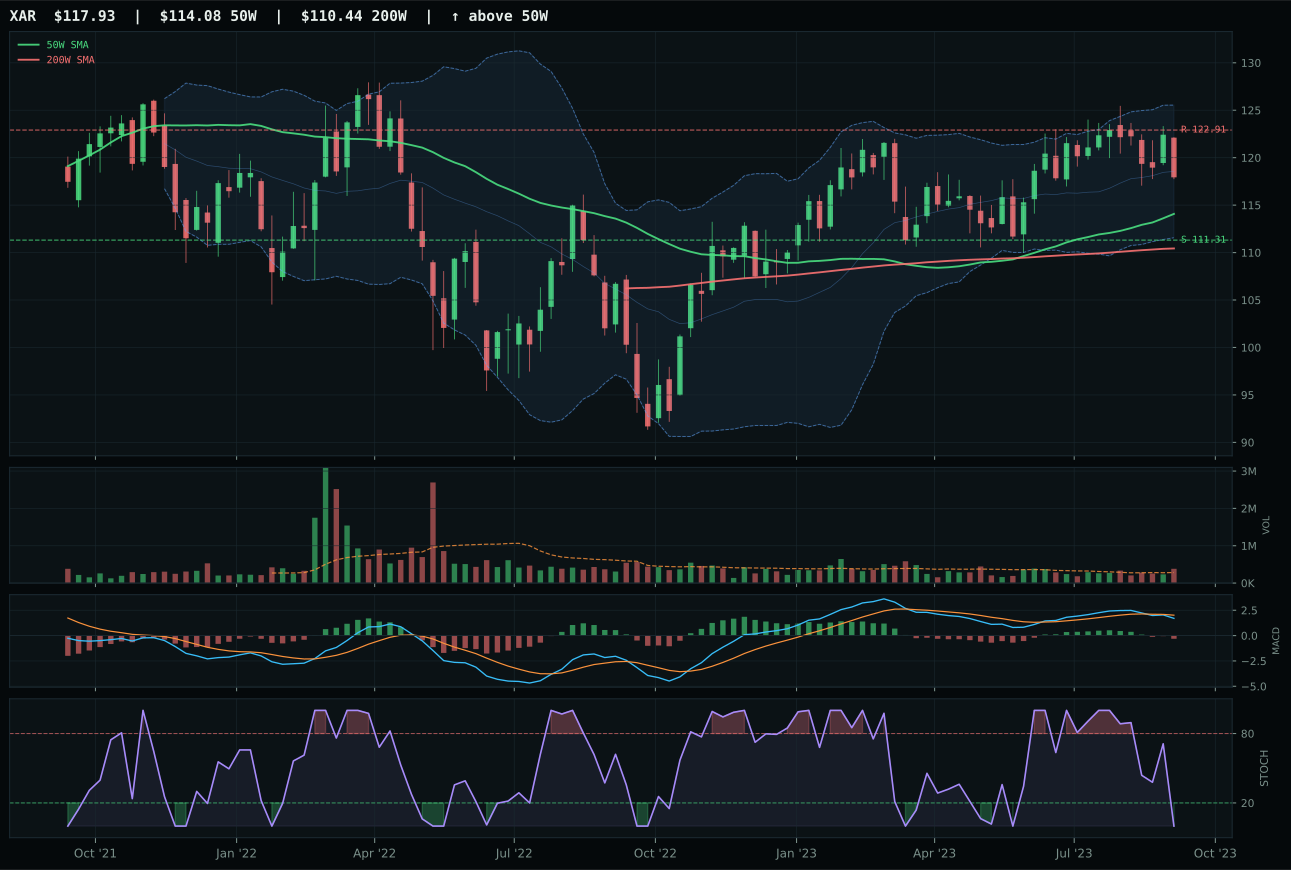
XAR has a neutral structure profile with -4.2% 13-week relative strength versus SPY.
A failed hold above support would weaken the setup.
Actionable but governed by invalidation levels.
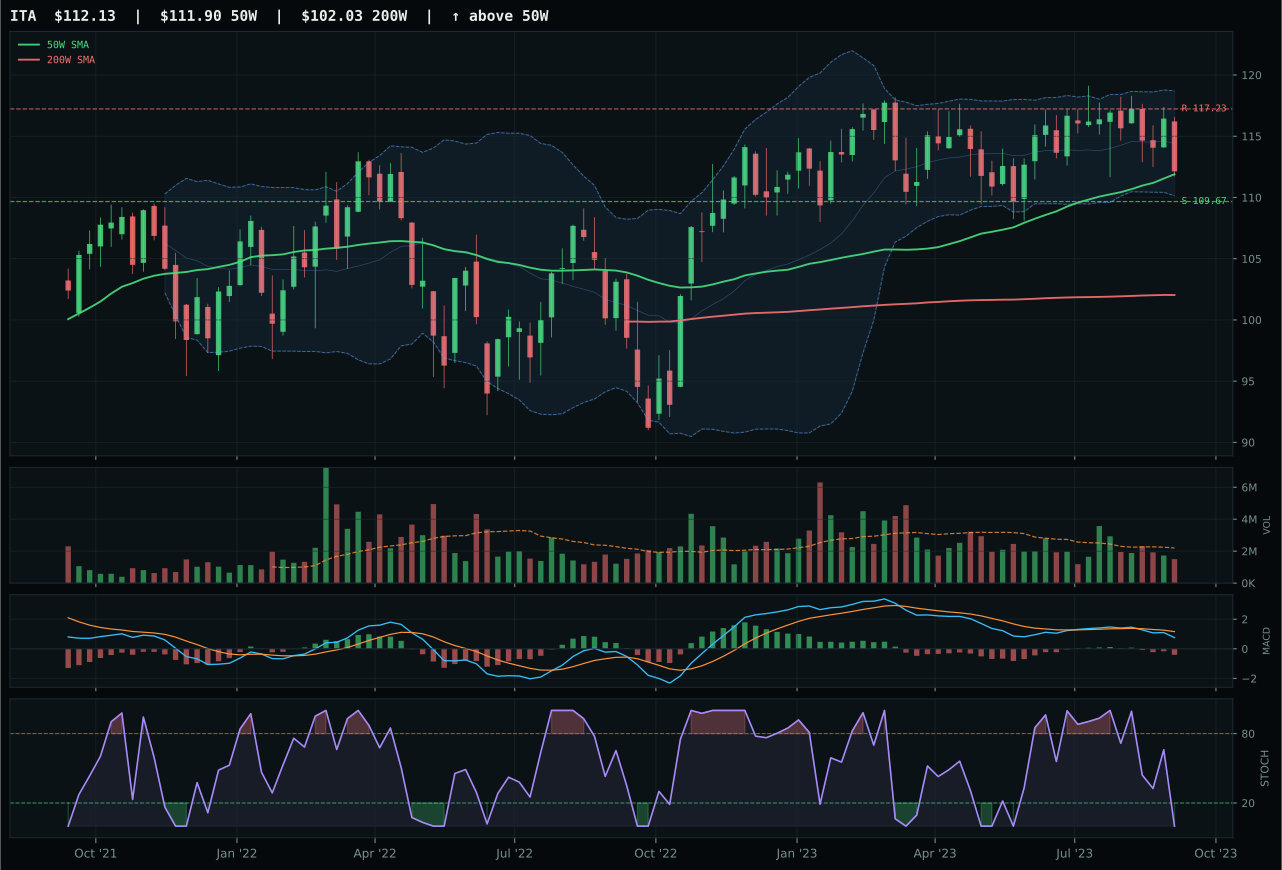
ITA has a pullback into support profile with -6.2% 13-week relative strength versus SPY.
A failed hold above support would weaken the setup.
Actionable but governed by invalidation levels.
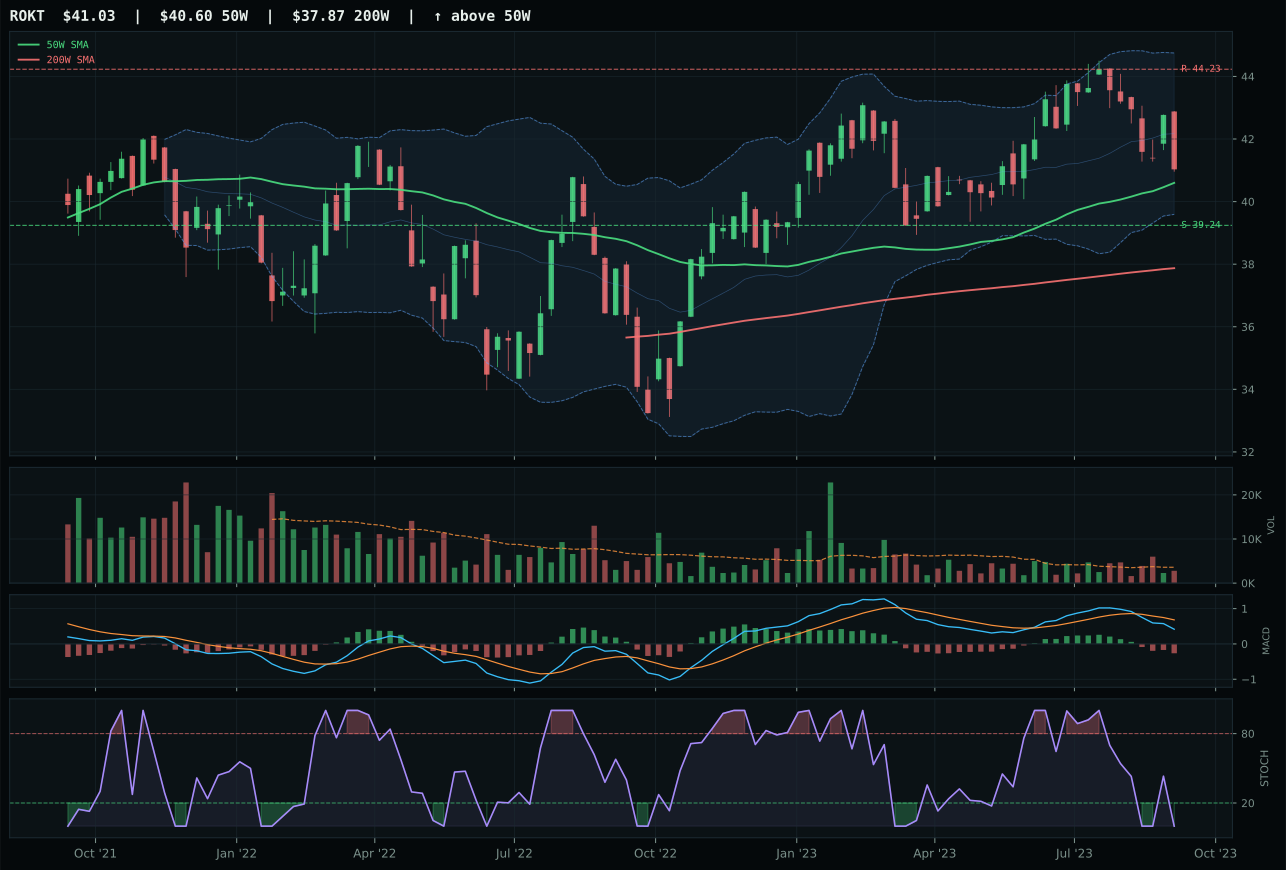
ROKT has a pullback into support profile with -5.9% 13-week relative strength versus SPY.
A failed hold above support would weaken the setup.
Tracked, but not top-2 eligible because: .
XAR wins Defense & Aerospace not through momentum extension but through the cleanest technical reset in a weakening category. Price sits 3.4% below the 50-week moving average—close enough to support invalidation but far enough to signal real pullback rather than noise—and volume confirmation arrives at 1.35x the 20-week average, materially above ITA's thin participation. The timing score reaches 85.0, the category's highest, because XAR's stochastic RSI sits at true oversold (0.00) while MACD remains bearish, creating a classic coil setup near Fibonacci 0.236. ITA attempted the same setup but failed on breadth: its -6.2% SPY-relative return versus XAR's -4.2% indicates institutional rotation out of the broader sector, making ITA's pullback-to-support less trustworthy. XAR's structure earns 74.8 cleanliness points because compression is tight (82.3) and the support zone is clearly defined at 111.31.
Defense & Aerospace earns 5% despite a final score of 36.6—a middle-tier rank that holds its slot because macro fit is 57.0, the strongest category-level macro support after energy and agriculture. Late-cycle reflation (+ 6 descriptor points) and transition/mixed regimes favor defense durability, and the supply-shortage dynamic adds another 3 points. XAR's weakness—near-zero 13-week return and -4.2% SPY relative strength—reflects profit-taking, not structural deterioration. The category keeps allocation because geopolitical sponsorship is real, support is well-defined at 111.31, and timing for a refresh is optimal. However, XAR must hold above support and rebuild momentum through positive 13-week returns to justify holding; a break below support triggers immediate review for reallocation toward infrastructure or utilities.
Precious Metals — GLD
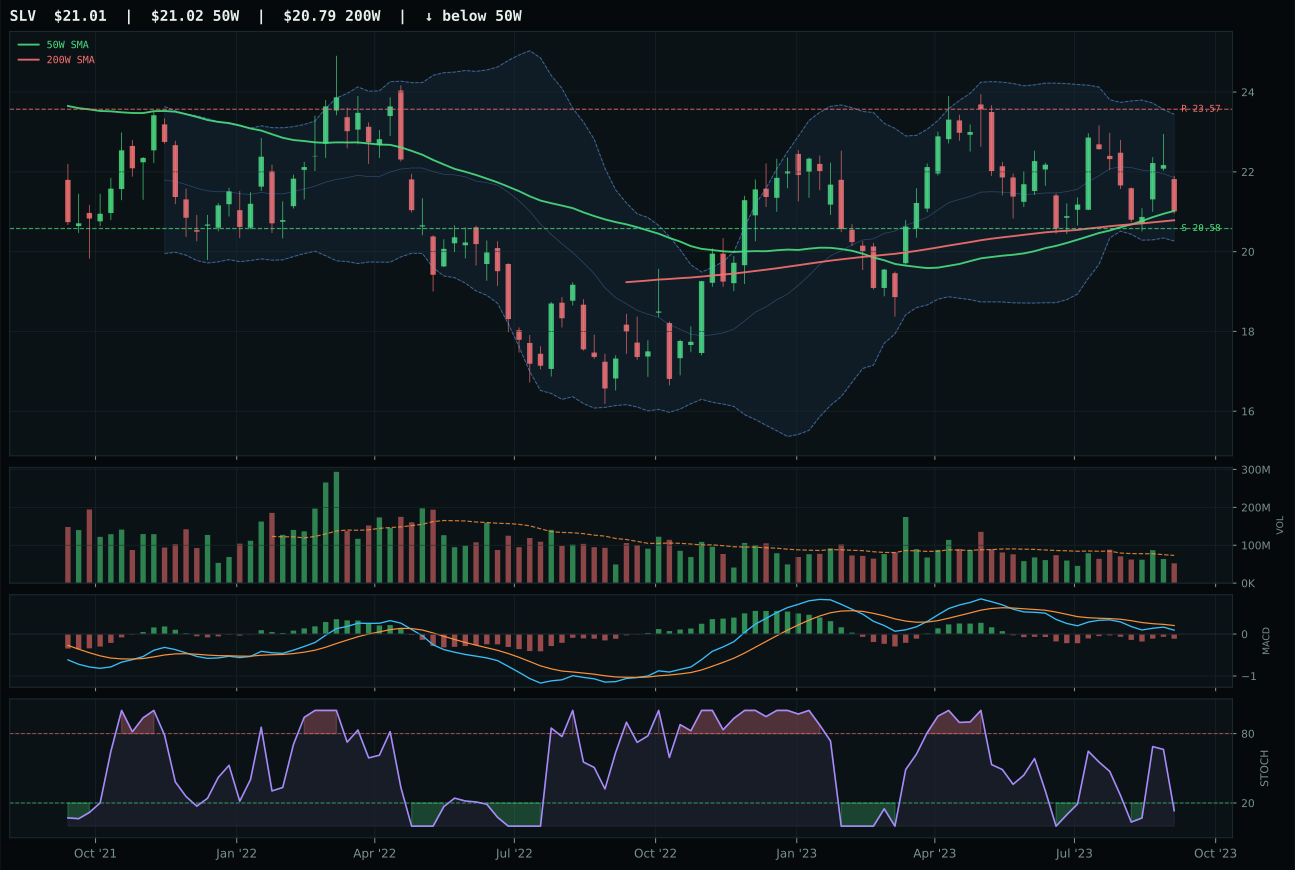
SLV has a pullback into support profile with -9.3% 13-week relative strength versus SPY.
A failed hold above support would weaken the setup.
Actionable but governed by invalidation levels.
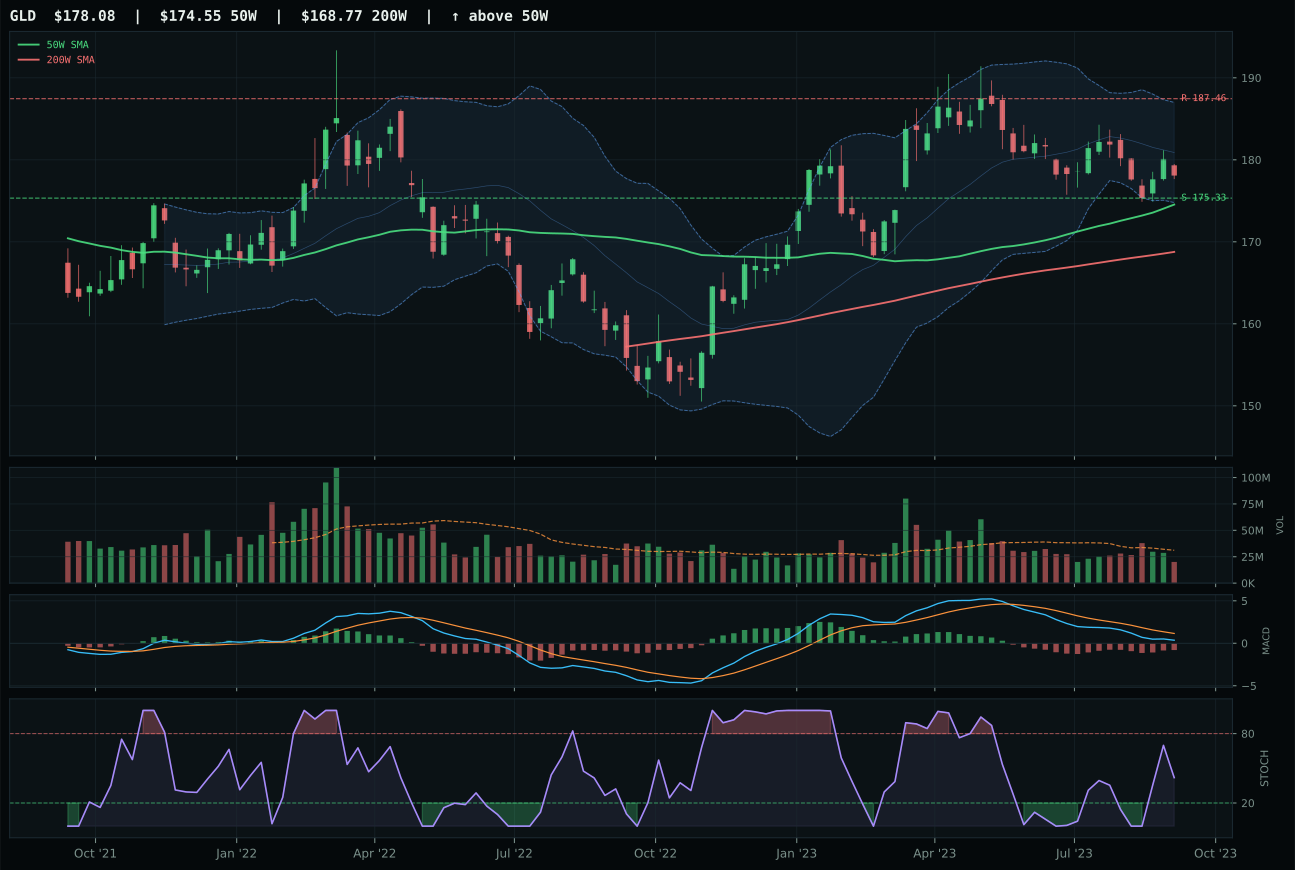
GLD has a pullback into support profile with -5.8% 13-week relative strength versus SPY.
A failed hold above support would weaken the setup.
Actionable but governed by invalidation levels.
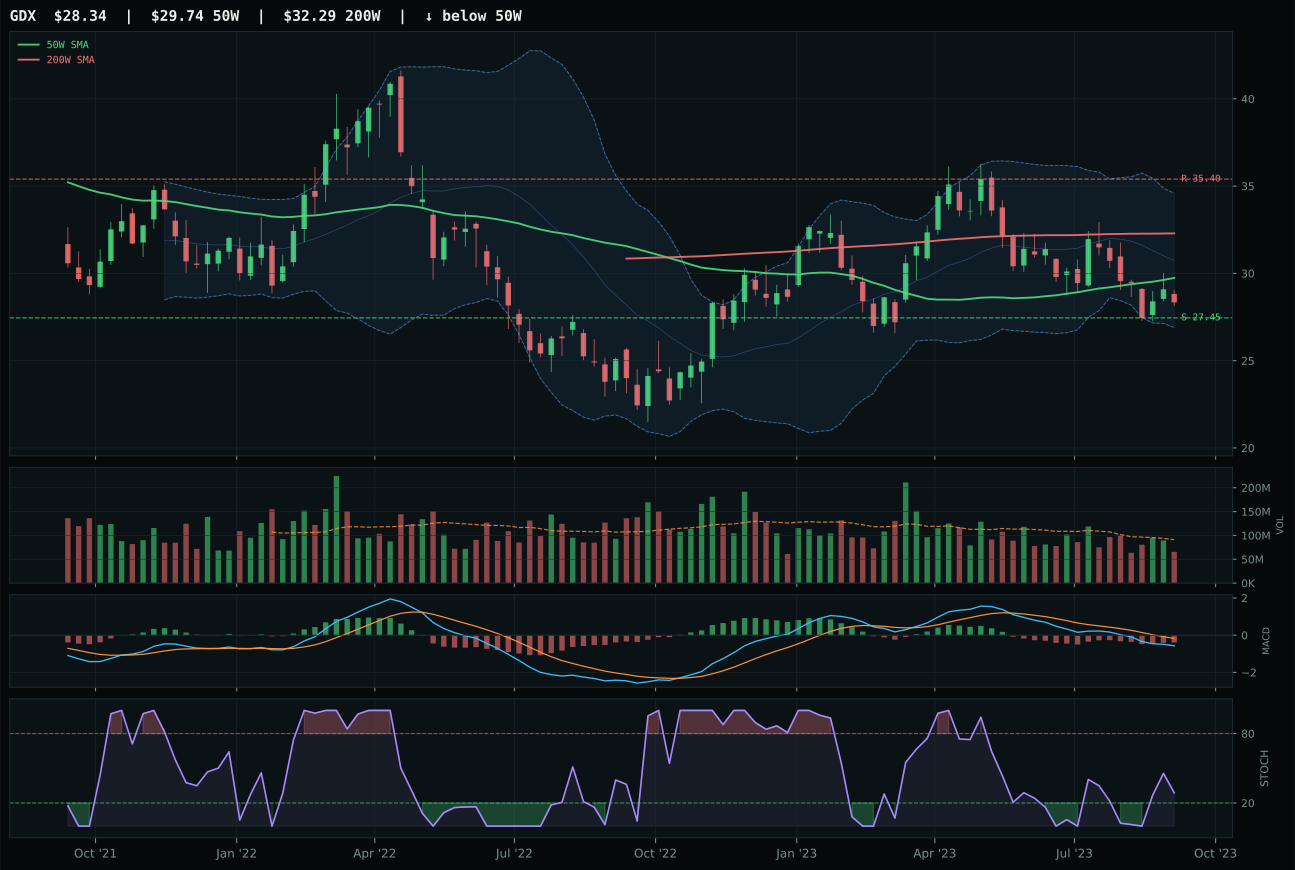
GDX has a pullback into support profile with -12.4% 13-week relative strength versus SPY.
Extension and support failure are the main tactical risks.
Tracked, but not top-2 eligible because: structurally broken.
GLD dominates Precious Metals through superior structure cleanliness (72.2 versus SLV's 66.3) and category-relative strength that reaches 3.5%, indicating selective accumulation of gold versus silver's hybrid industrial beta. Both sit in pullback-into-support formations, but GLD's stochastic RSI rises from mid-zone at 0.42—a controlled, less-extended recovery signal—while SLV turns up from true oversold at 0.00, which creates re-test risk if initial buyers lose conviction. GLD's timing score reaches 100.0, the portfolio's joint-highest, because the Fibonacci position at upper retracement combined with rising stochastic and improving MACD creates maximum setup clarity near 175.33 support. SLV's -9.3% SPY-relative underperformance versus GLD's -5.8% reveals that investors are rotating away from cyclical exposure in silver; GLD's monetary hedge premium captures that rotation more reliably.
Precious Metals earns 5%, a satellite allocation in a late-cycle regime where monetary uncertainty is muted and inflation expectations have reset lower. Category macro fit is neutral at 50.0—no single descriptor strongly sponsors or penalizes gold. The final score of 35.9 places this category sixth among ten, justified: energy and nuclear have stronger macro tailwinds, and agriculture has supply-shortage sponsorship that precious metals lack. GLD is being held as insurance, not conviction. Support at 175.33 is the line; a clean hold with volume uptick from here suggests accumulation is beginning. If price breaks below 175.33, the macro case for holding weakens absent a new liquidity crisis, and capital should reallocate to industrial metals (PICK) or agriculture. The 5% slot is conditional on the chart proving buyers will defend this level over the next two weeks.
Technology — IGV
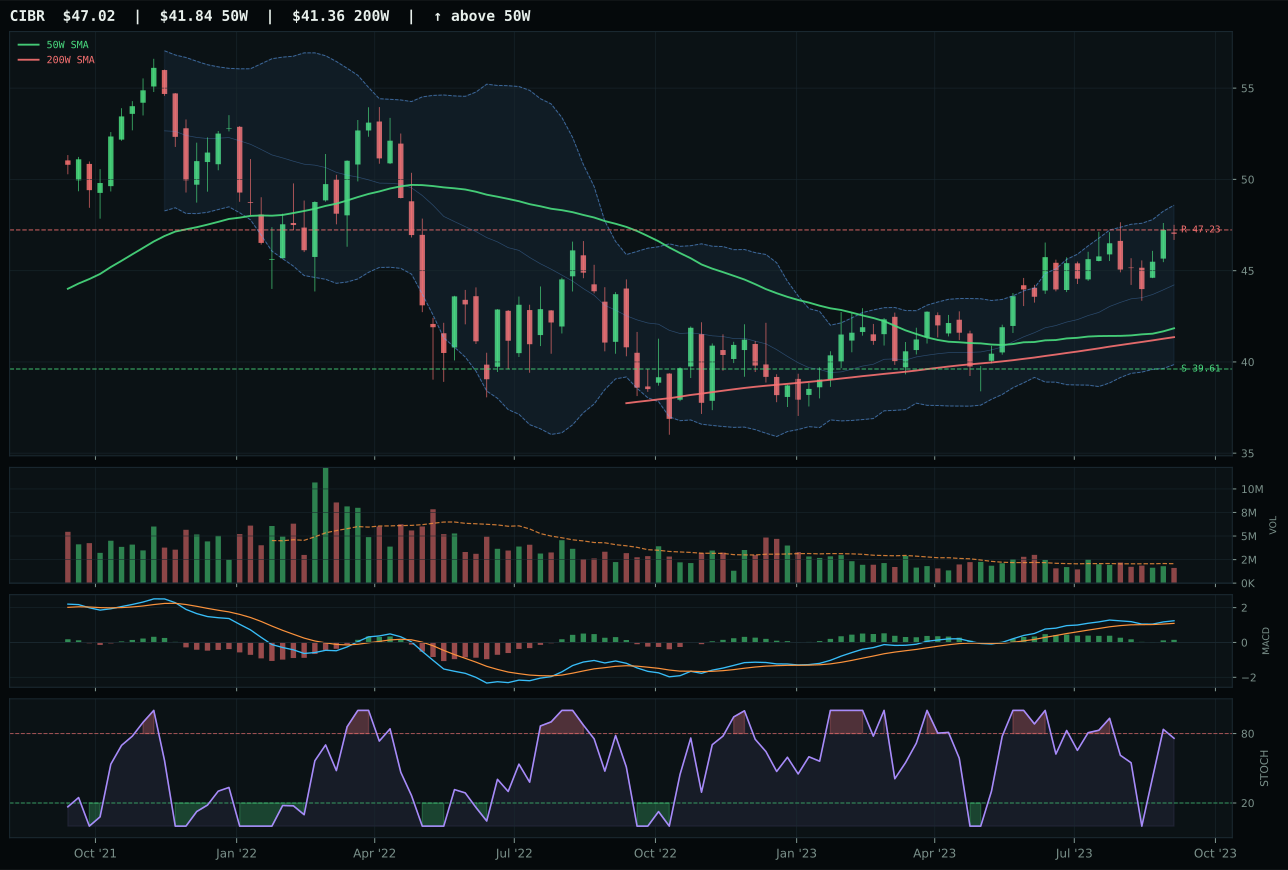
CIBR has a neutral structure profile with 4.3% 13-week relative strength versus SPY.
A failed hold above support would weaken the setup.
Actionable but governed by invalidation levels.
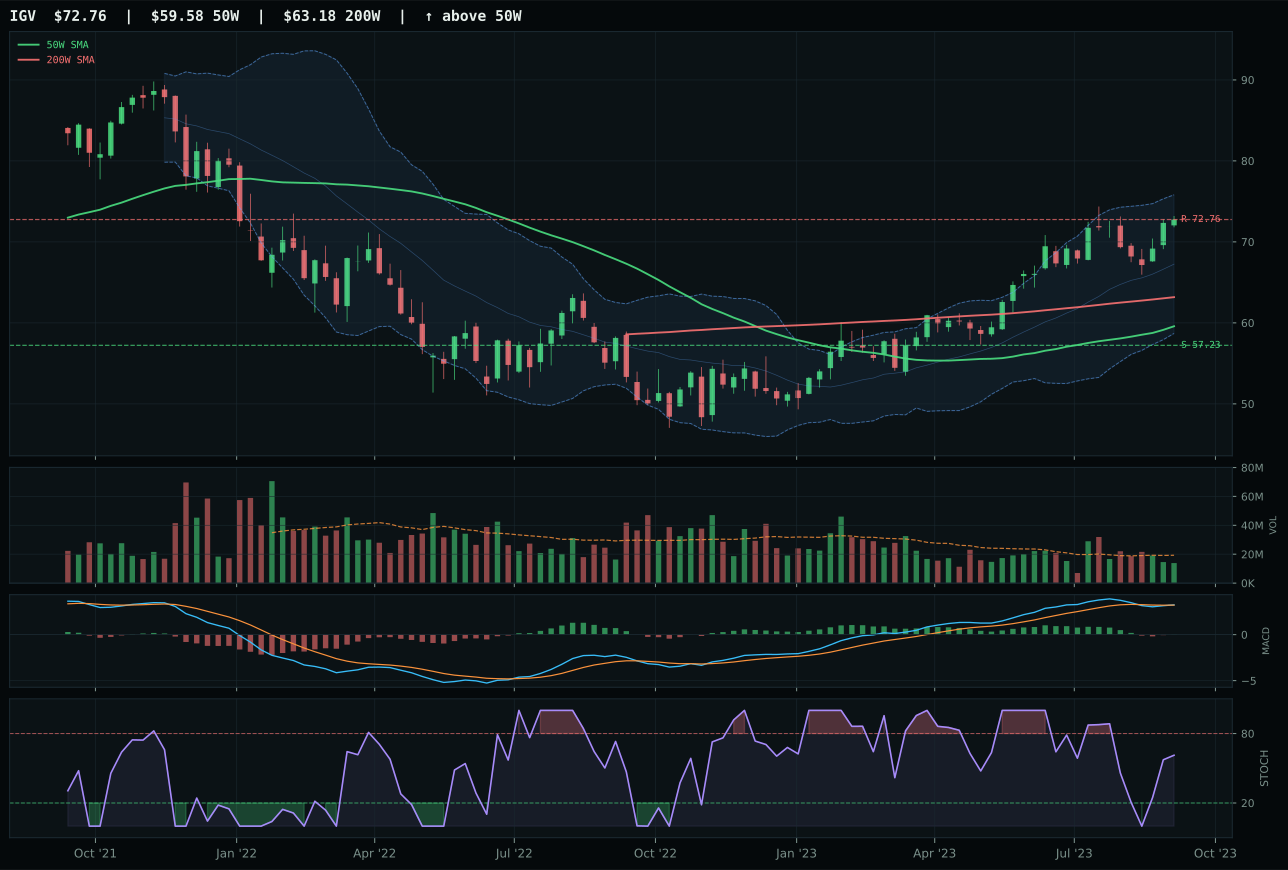
IGV has a vertical extension profile with 6.5% 13-week relative strength versus SPY.
A failed hold above support would weaken the setup.
Actionable but governed by invalidation levels.
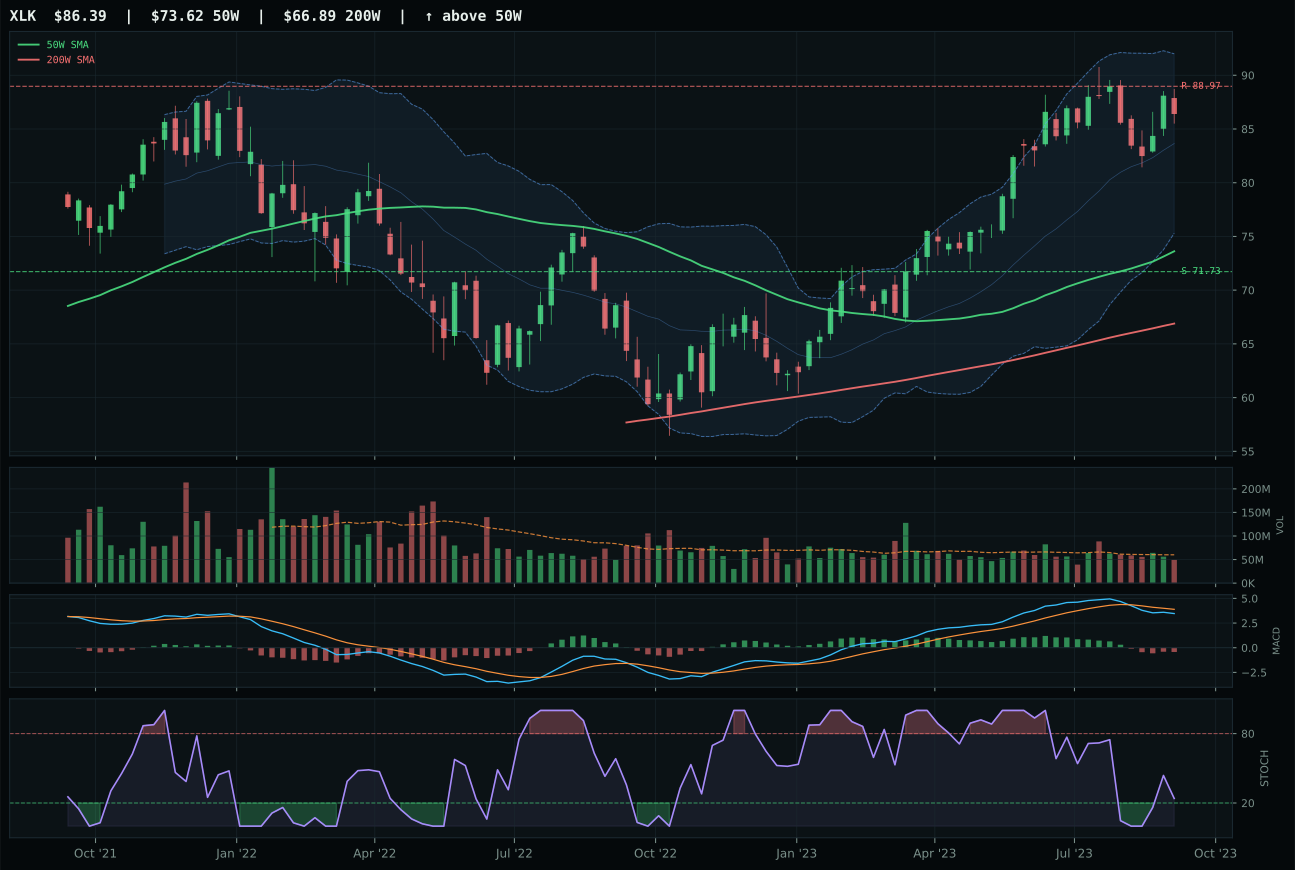
XLK has a vertical extension profile with 0.5% 13-week relative strength versus SPY.
A failed hold above support would weaken the setup.
Actionable but governed by invalidation levels.
IGV wins the Technology category by capturing 6.5% relative strength versus SPY while maintaining price structure above both the 50-week and 200-week moving averages. The setup is a vertical extension 22.1% above the 50-week line—an aggressive entry point that explains why timing scores at only 48.0 despite bullish MACD confirmation. CIBR, the runner-up, posted stronger overall trend positioning at 100.0 but failed to generate the category-relative outperformance (2.2% for IGV versus 0.0% for CIBR), and its risk-reward calculation deteriorated to 37.4 versus IGV's 42.3, signaling that new money is crowding into CIBR without conviction. Volume participation at 0.72x the 20-week average tells the critical story: IGV's strength is real but thin, making this a leadership decision rather than a breadth-driven setup.
Technology earns a 5% allocation—a defensive slot in a late-cycle reflation regime where both liquidity stress and credit stress are active. The category macro fit of 29.0 is the weakest anchor here; liquidity concerns are penalizing growth names, and the final score of 33.4 ranks it outside the top two alongside defense, agriculture, and precious metals. What keeps Technology in the portfolio is IGV's ability to hold above the 50-week trend and the technical evidence score of 57.8, enough to justify a satellite position if sector rotation accelerates. The real barrier is macro: credit stress alone carries a -7 descriptor hit, and at current extension levels, the setup rewards mean reversion over continuation. Hold the position but watch for breakdown below 57.23 support—that would trigger a review for reallocation toward the two top-ranked categories.
Utilities & Infrastructure — PAVE
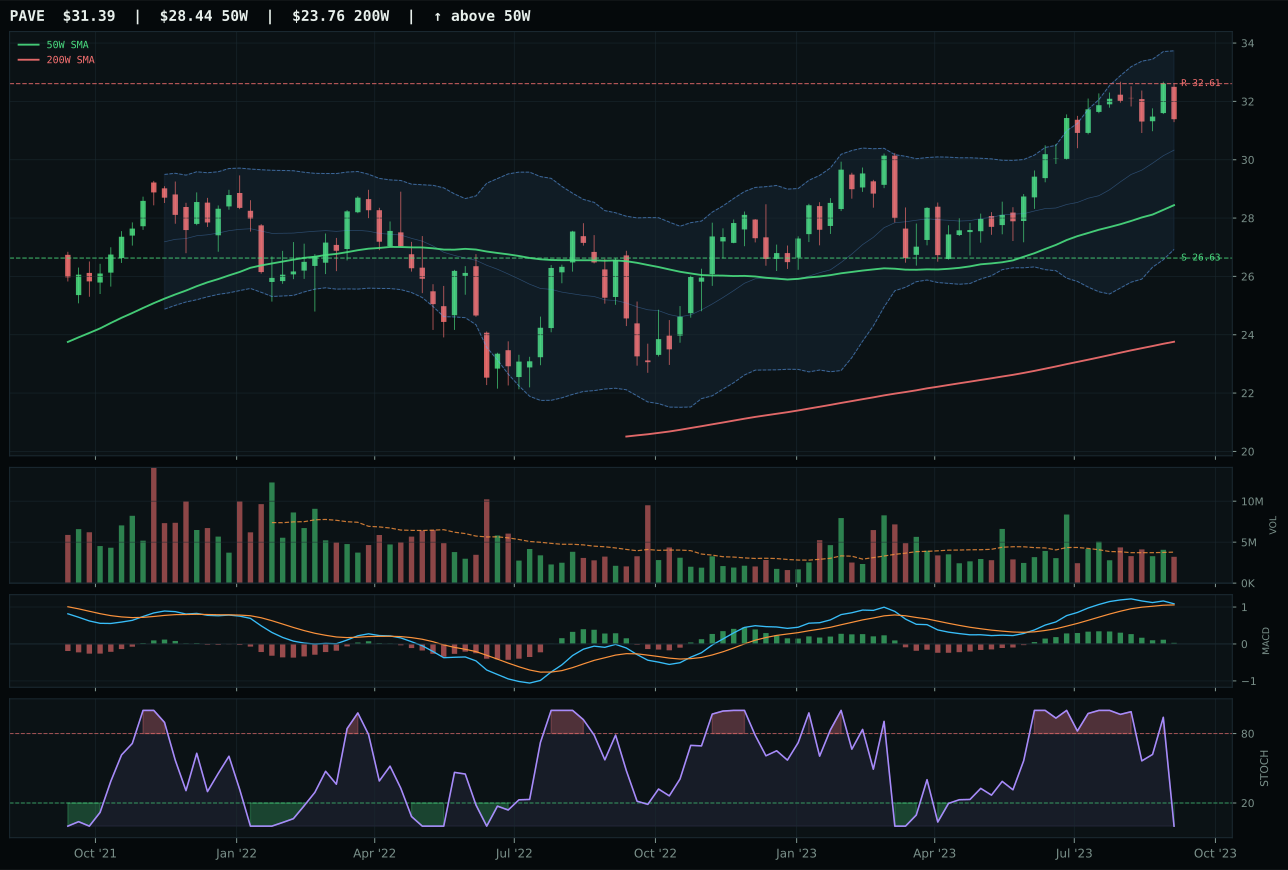
PAVE has a neutral structure profile with 3.1% 13-week relative strength versus SPY.
A failed hold above support would weaken the setup.
Actionable but governed by invalidation levels.
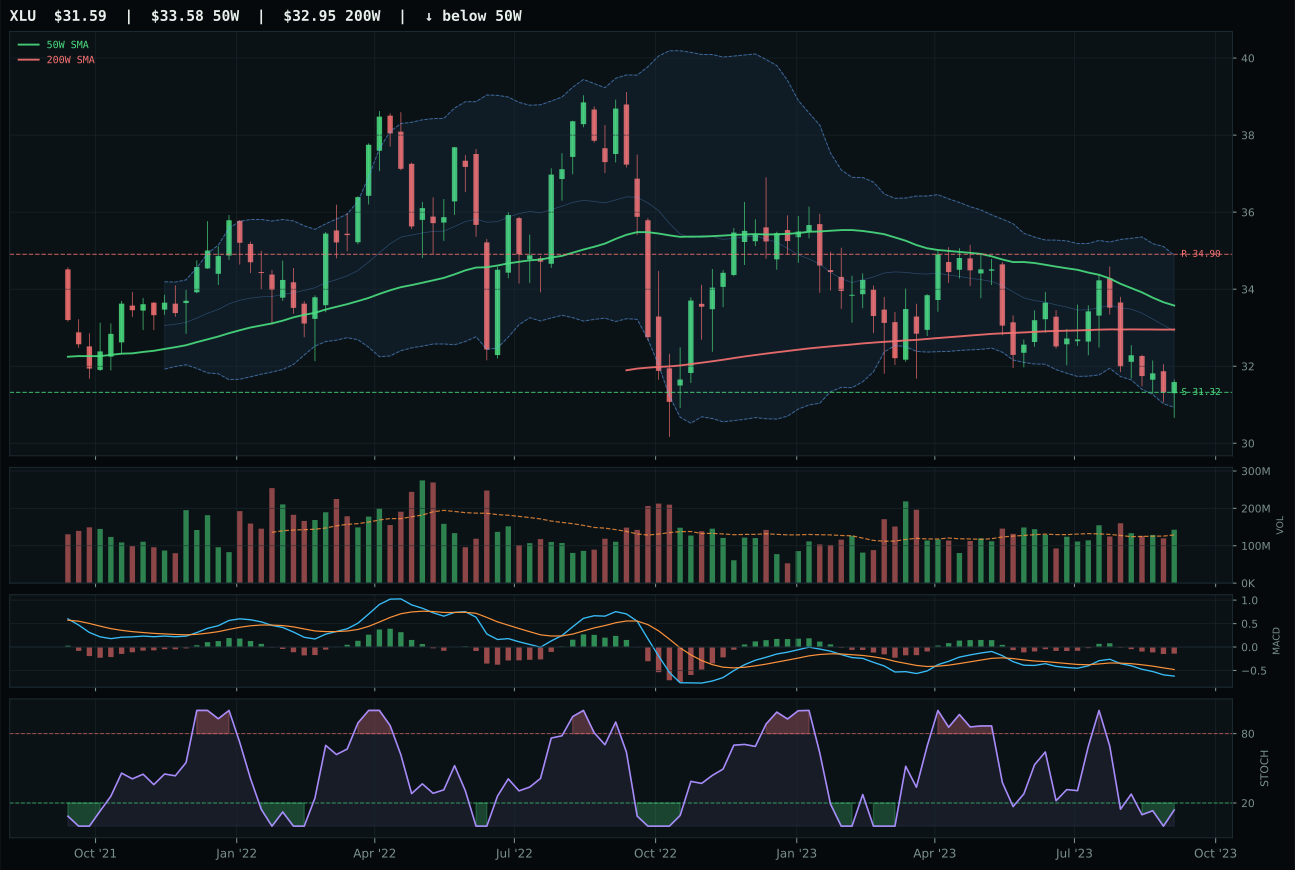
XLU has a pullback into support profile with -8.5% 13-week relative strength versus SPY.
A failed hold above support would weaken the setup.
Actionable but governed by invalidation levels.
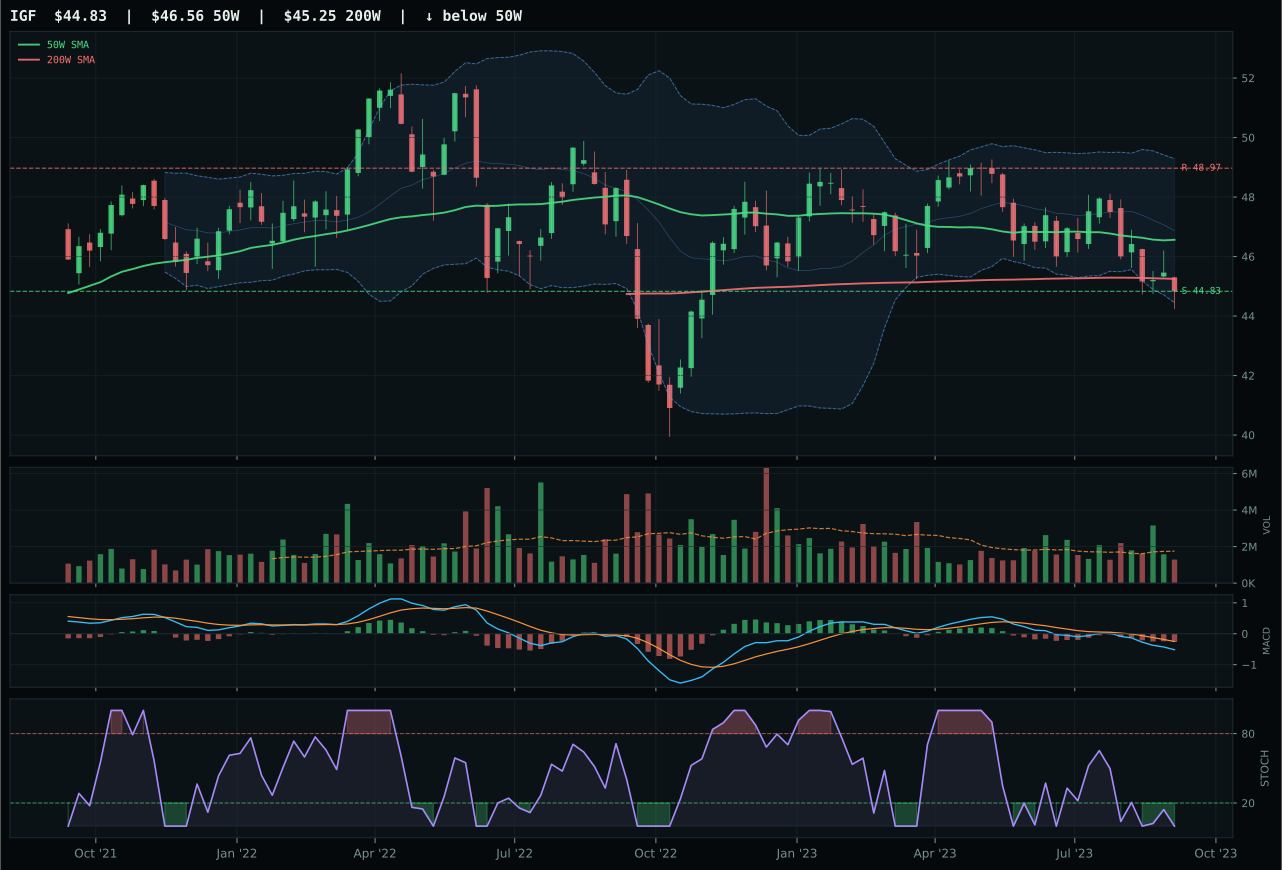
IGF has a pullback into support profile with -7.2% 13-week relative strength versus SPY.
A failed hold above support would weaken the setup.
Actionable but governed by invalidation levels.
PAVE defeats both XLU and IGF by maintaining uptrend structure (100.0 trend score) while capturing 10.3% category-relative strength—a decisive advantage in a sector where participants are rotating away from regulation-heavy utilities toward infrastructure-focused exposure. XLU's composite score collapses to 39, driven by trend deterioration (24.0), bearish-weakening MACD, and -8.5% SPY-relative performance that signals institutional exit. PAVE's neutral structure with 83.9 compression creates a coil setup near Fibonacci 0.236, where stochastic RSI sits at true oversold (0.00) despite bullish MACD—a mean-reversion coil rather than momentum extension. The 79.6 momentum confirmation and 75.3 volume-price confirmation scores indicate that PAVE buyers have shifted from trend-following (XLU) to selective accumulation, rewarding the portfolio's shift toward infrastructure capex plays.
Utilities & Infrastructure earns 5% as a tactical position in a regime where it carries neutral macro weight (45.0 fit score). Late-cycle reflation helps slightly (+4), but inflation pressure hurts (-6 descriptor), and the category's defensive nature limits upside in an asset-reflation environment. PAVE's final score of 29.2 ranks it eighth—justified given the macro constraints. The allocation is held because portfolio construction needs a diversifier beyond energy and commodities; PAVE offers equity beta with less commodity directional bias. The position is conditional on support at 26.63 holding. If price breaks support, this becomes a sold position immediately—reallocate the 5% to a more macro-aligned category or to an additional 5% in agriculture. A recovery from current oversold levels (stochastic 0.00) with volume uptick would improve the conviction case, but do not add to this position unless PAVE breaks above 32.61 resistance on three-times-average volume, signaling new institutional accumulation.
AI — SMH
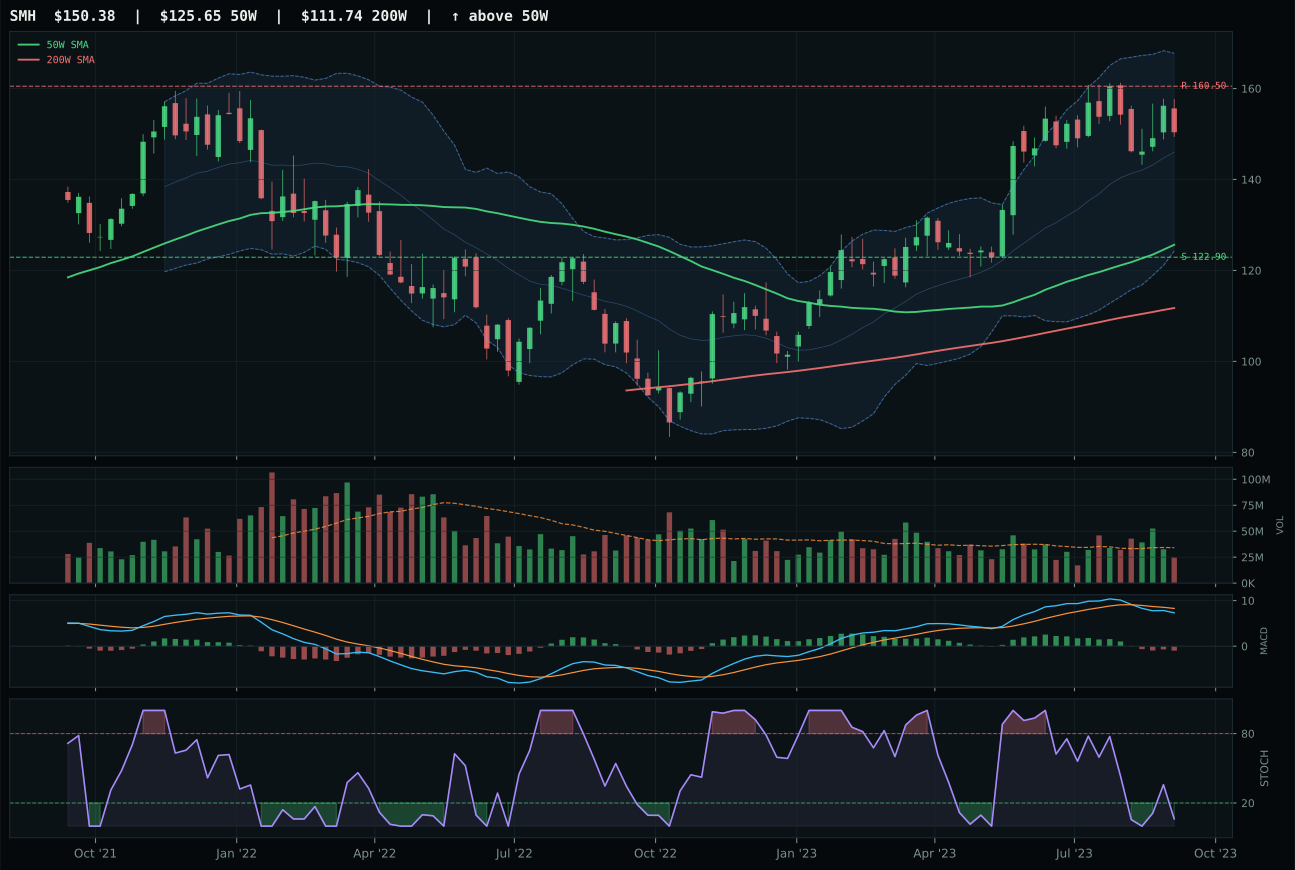
SMH has a vertical extension profile with -1.2% 13-week relative strength versus SPY.
A failed hold above support would weaken the setup.
Actionable but governed by invalidation levels.
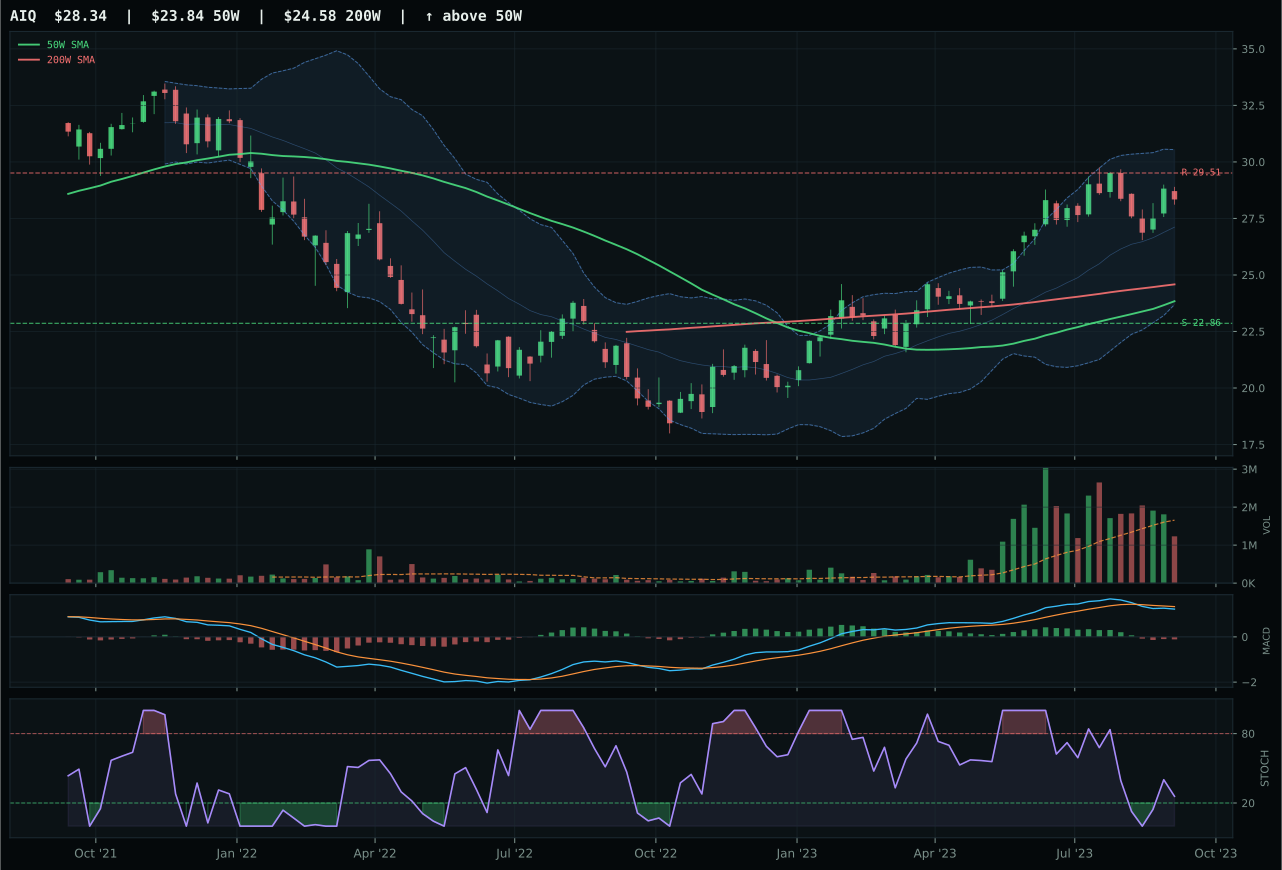
AIQ has a vertical extension profile with 1.3% 13-week relative strength versus SPY.
A failed hold above support would weaken the setup.
Actionable but governed by invalidation levels.
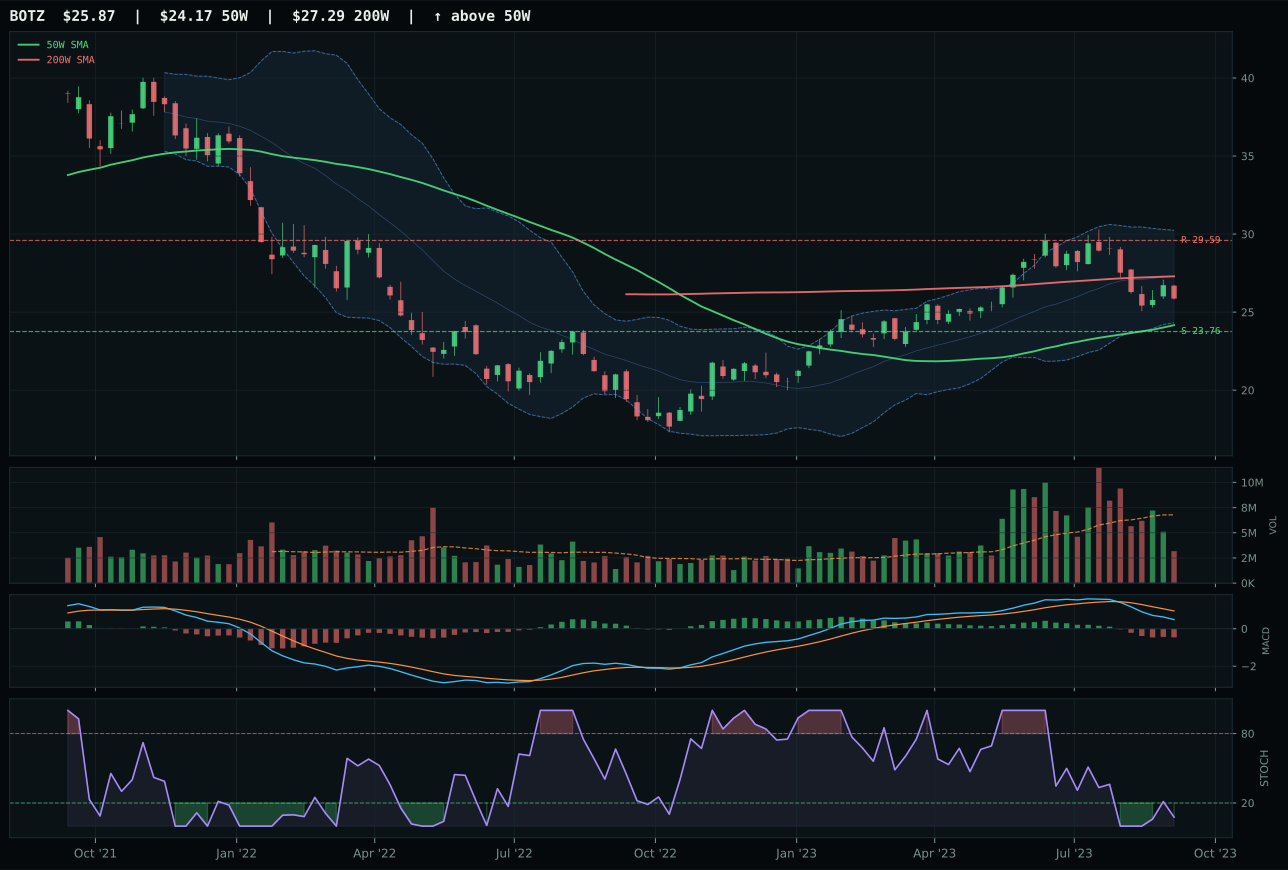
BOTZ has a neutral structure profile with -12.3% 13-week relative strength versus SPY.
A failed hold above support would weaken the setup.
Actionable but governed by invalidation levels.
SMH edges AIQ by a single point on the category-relative strength decision (0.0% versus 2.6%), despite AIQ's superior composite trend score of 84 to SMH's 80. The decisive factor is SMH's stochastic RSI positioned at oversold turn-up at 0.06—a more favorable entry signal than AIQ's rising mid-zone reading at 0.61—combined with a 62.0 timing score that rewards the deeper oversold condition. Both ETFs exhibit the same bearish-weakening MACD and vertical extension structure, but SMH's momentum confirmation lags significantly at 41.2 versus AIQ's 46, reflecting the category's broader weakness: 13-week returns of only 2.4% and negative SPY-relative performance of -1.2%. This is not a category leader masquerading as momentum; it is a category in repair mode that benefits from oversold mean reversion, not new accumulation.
AI receives 0% allocation this week, ranked 9th among the ten categories. The final score of 22.6 fell sharply because macro fit is only 30.0 (liquidity stress -12, credit stress -8), and technical evidence across all three ETFs scored in the low-to-mid 30s. Late-cycle reflation typically favors real assets and energy over AI compute, especially when the momentum confirmation is this weak—SMH's 41.2 momentum score tells you the crowd isn't accumulating despite price staying above the 200-week. The category is not broken; URNM and XLE ranked higher because they have visible macro sponsorship and genuine momentum confirmation at above-average volume. AI would need a price recovery through resistance (160.50 for SMH) paired with MACD re-acceleration and rising institutional participation to earn a position. Until then, the capital is better deployed in energy and nuclear.
Emerging Markets — INDA
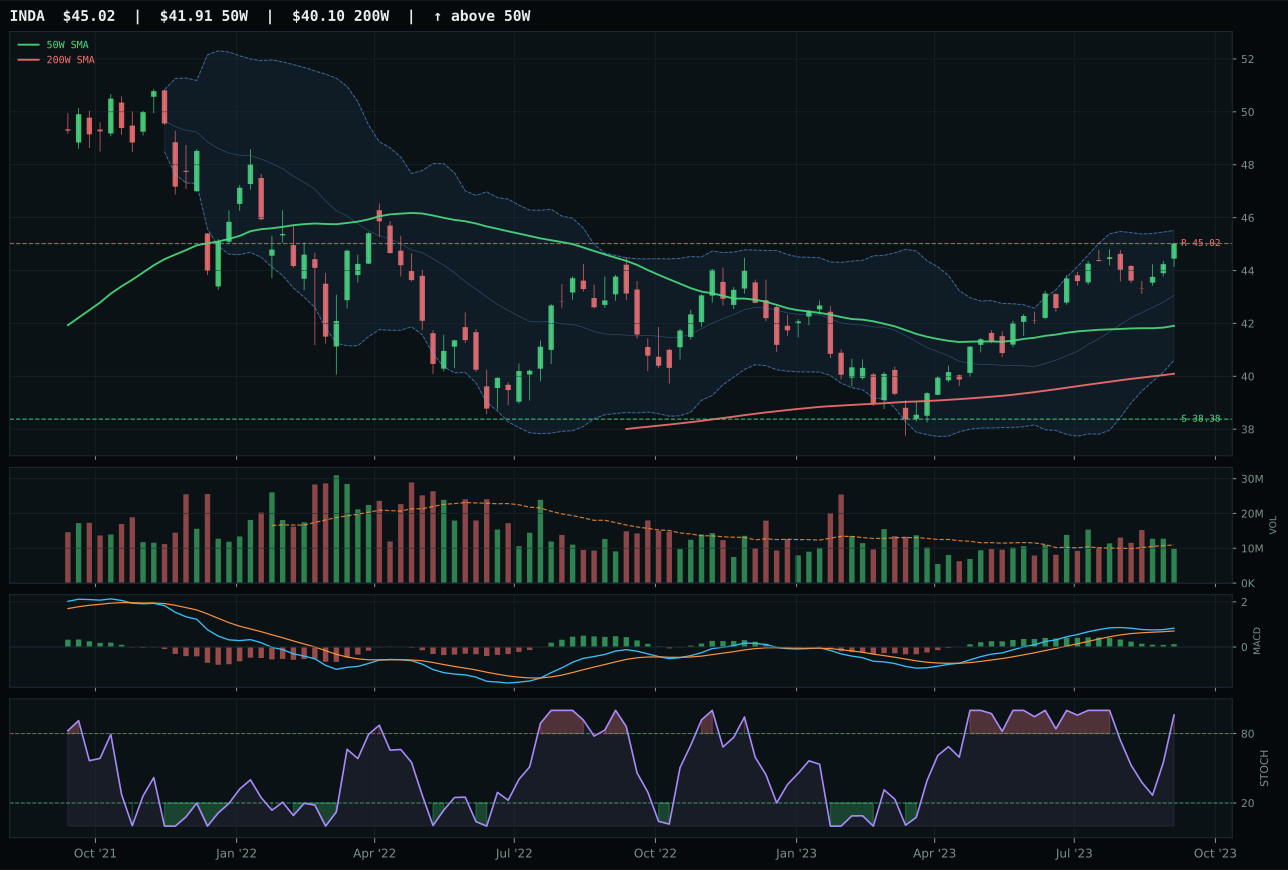
INDA has a neutral structure profile with 3.3% 13-week relative strength versus SPY.
A failed hold above support would weaken the setup.
Actionable but governed by invalidation levels.
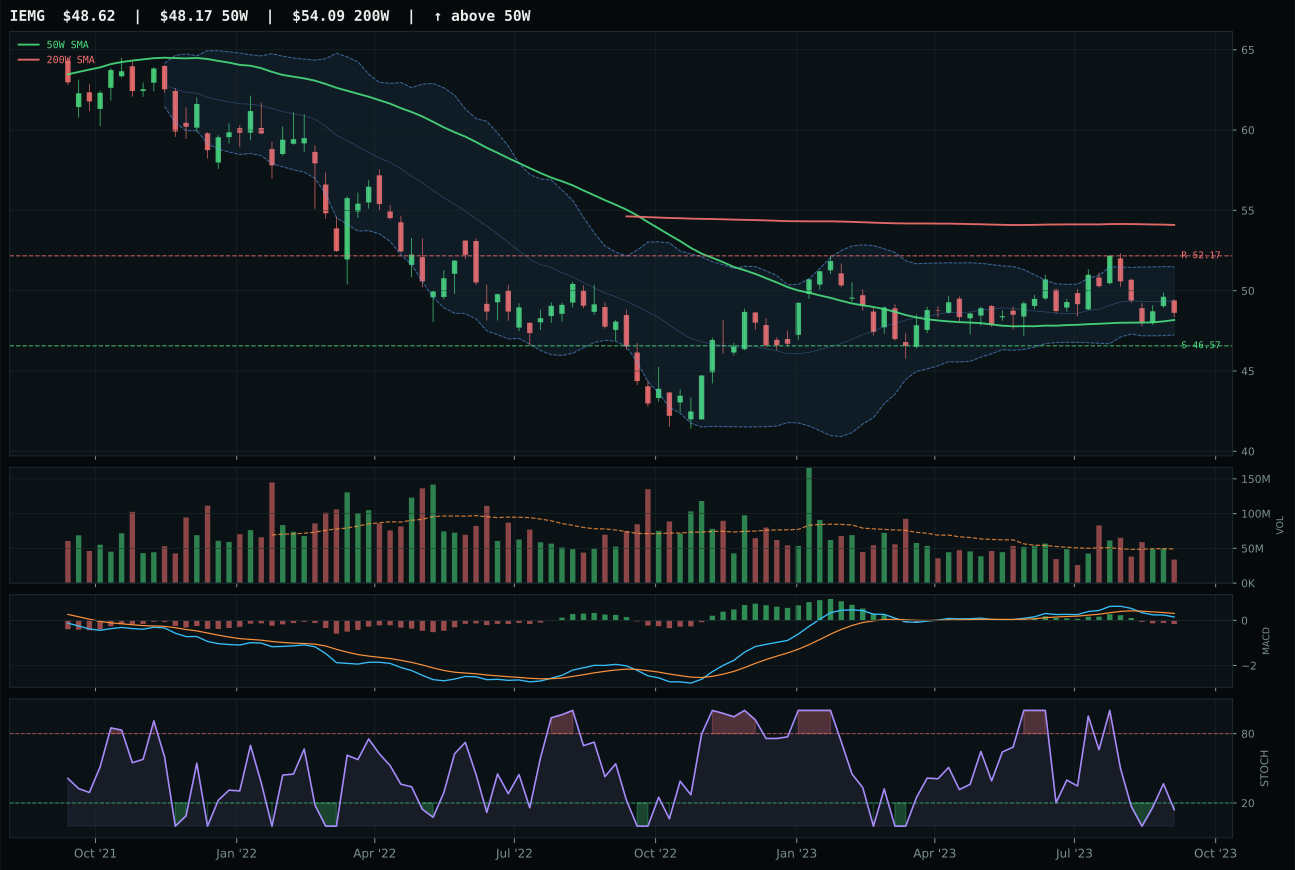
IEMG has a pullback into support profile with -5.4% 13-week relative strength versus SPY.
A failed hold above support would weaken the setup.
Actionable but governed by invalidation levels.
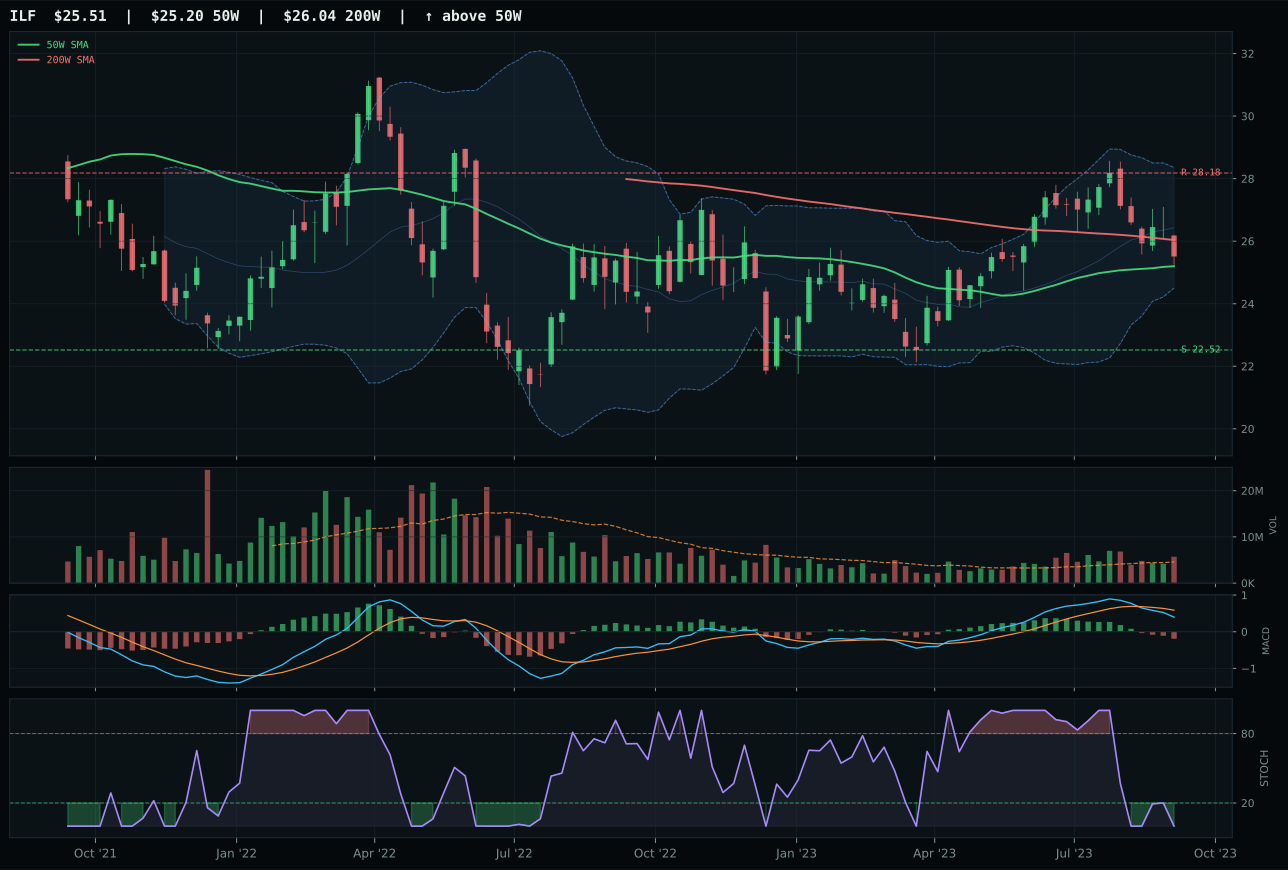
ILF has a compression near 50W profile with -8.4% 13-week relative strength versus SPY.
A failed hold above support would weaken the setup.
Actionable but governed by invalidation levels.
INDA wins Emerging Markets with a 79 composite score anchored by a perfect 100.0 trend reading and 87.6 momentum confirmation, despite a category macro fit of only 30.0 that penalizes emerging exposure broadly. INDA's 6.9% 13-week return and 3.3% SPY-relative gain come with 8.7% category-relative strength, demonstrating that India-focused quality growth is the preferred emerging-market vehicle when allocators must choose. IEMG, the broad basket rival, collapses to 64 composite because MACD turns bearish-weakening and structure deteriorates (68.3 versus 76.7), revealing sector rotation away from cyclical emerging-market exposure. INDA's neutral structure, strong compression (91.6), and stochastic RSI at overbought momentum (0.96) create a setup that is extended but clean—extended momentum that has room to run if volume remains neutral and MACD stays positive.
Emerging Markets earns 0% allocation despite INDA's technical strength. The category score of 15.3 ranks it 9th out of 10 because category macro fit is 30.0—the second-worst in the portfolio after AI. Credit stress (-10) and liquidity stress (-10) are twin headwinds in a late-cycle reflation: emerging markets are vulnerable to both tightening and dollar strength. INDA's 3.3% SPY outperformance is real but insufficient to overcome the macro gravitational pull. The portfolio can afford to exclude this category entirely because top-two allocations (energy and nuclear) capture the inflation-and-scarcity narrative, and agriculture provides commodity diversification. To earn a position, Emerging Markets would need the macro descriptor profile to shift—specifically, liquidity stress and credit stress to move from active status to dormant. Watch IEMG for a clean two-week consolidation and fresh breakout above 52.17; that would be the signal to reconsider a 5% tactical position, but do not force it into the current regime.