
2023-09-01
Informational purposes only. The content in this report, including allocations, analysis, and commentary, is provided solely for informational and educational purposes. It does not constitute financial advice, investment advice, trading advice, or any other type of advice. Past performance does not guarantee future results. Always conduct your own research and consult a qualified financial professional before making investment decisions.
Weekly Allocation
| Ticker | Category | Weight | Role |
|---|---|---|---|
| FBTC | 50% | Overlay | |
| XLE | Traditional Energy | 10% | Top-2 (10%) |
| URNM | Nuclear Energy | 10% | Top-2 (10%) |
| COPX | Industrial Metals | 5% | Tier-2 (5%) |
| MOO | Agriculture & Livestock | 5% | Tier-2 (5%) |
| ITA | Defense & Aerospace | 5% | Tier-2 (5%) |
| CIBR | Technology | 5% | Tier-2 (5%) |
| PAVE | Utilities & Infrastructure | 5% | Tier-2 (5%) |
| GLD | Precious Metals | 5% | Tier-2 (5%) |
Trade Instructions — Monday Open
Sell the tranche from 2023-08-04 (completing its 4-week hold). Buy the new tranche. Instructions show net portfolio changes — same-asset positions cancel, weight changes show the delta.
| Action | Ticker | Instruction |
|---|---|---|
| SELL | XOP | Sell 50% of XOP position (reduce 5.00% → 2.50%) |
| SELL | URA | Sell entire URA position (2.50% of portfolio) |
| SELL | IGV | Sell entire IGV position (1.25% of portfolio) |
| SELL | SMH | Sell entire SMH position (1.25% of portfolio) |
| SELL | XAR | Sell entire XAR position (1.25% of portfolio) |
| SELL | INDA | Sell entire INDA position (1.25% of portfolio) |
| BUY | URNM | Buy URNM — 25.00% of freed cash (adds 2.50% to portfolio) |
| BUY | CIBR | Buy CIBR — 12.50% of freed cash (adds 1.25% to portfolio) |
| BUY | ITA | Buy ITA — 12.50% of freed cash (adds 1.25% to portfolio) |
| BUY | XLE | Buy XLE — 25.00% of freed cash (adds 2.50% to portfolio) |
| BUY | GLD | Buy GLD — 12.50% of freed cash (adds 1.25% to portfolio) |
| BUY | PAVE | Buy PAVE — 12.50% of freed cash (adds 1.25% to portfolio) |
Current Portfolio After Trade
Combined holdings across all 4 active tranches. Each tranche is 25% of the portfolio.
| Ticker | % of Portfolio | Weight Bar |
|---|---|---|
| FBTC | 50.00% | |
| URNM | 10.00% | |
| XLE | 7.50% | |
| MOO | 5.00% | |
| CIBR | 5.00% | |
| ITA | 5.00% | |
| COPX | 3.75% | |
| XOP | 2.50% | |
| AIQ | 2.50% | |
| GLD | 2.50% | |
| PAVE | 2.50% | |
| XLU | 1.25% | |
| PICK | 1.25% | |
| SLV | 1.25% |
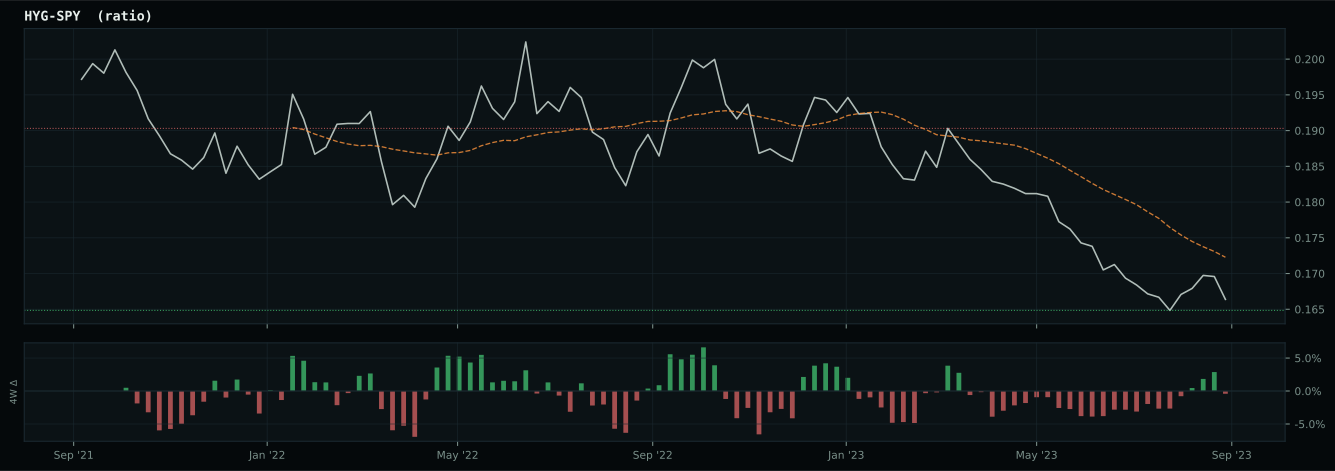
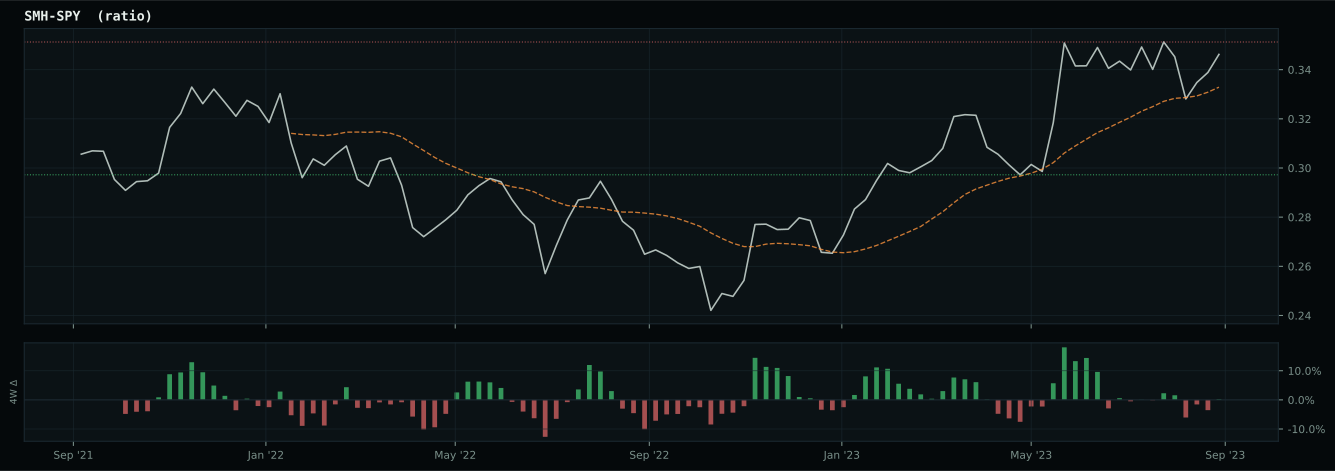
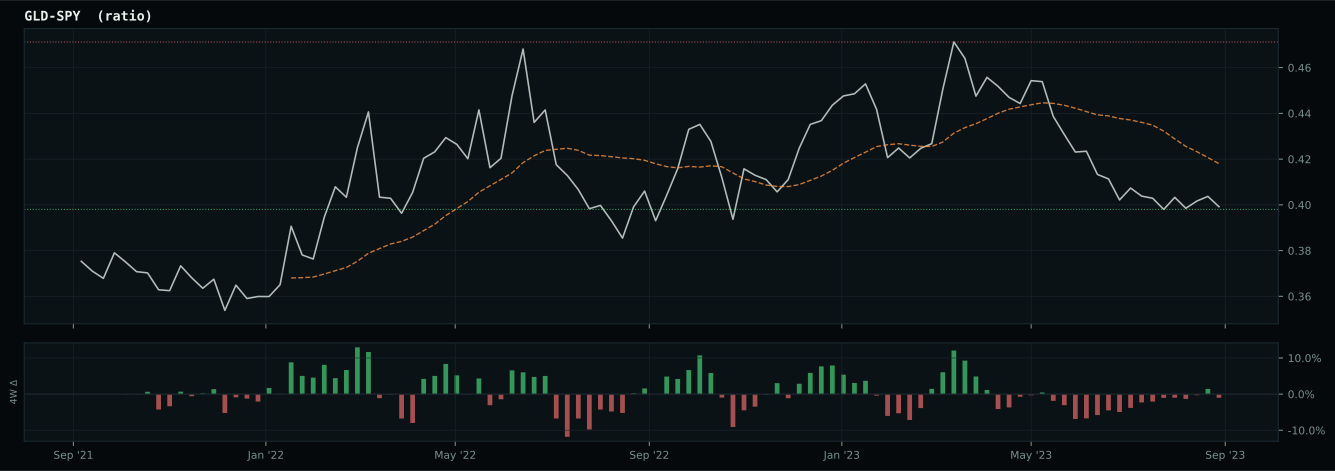
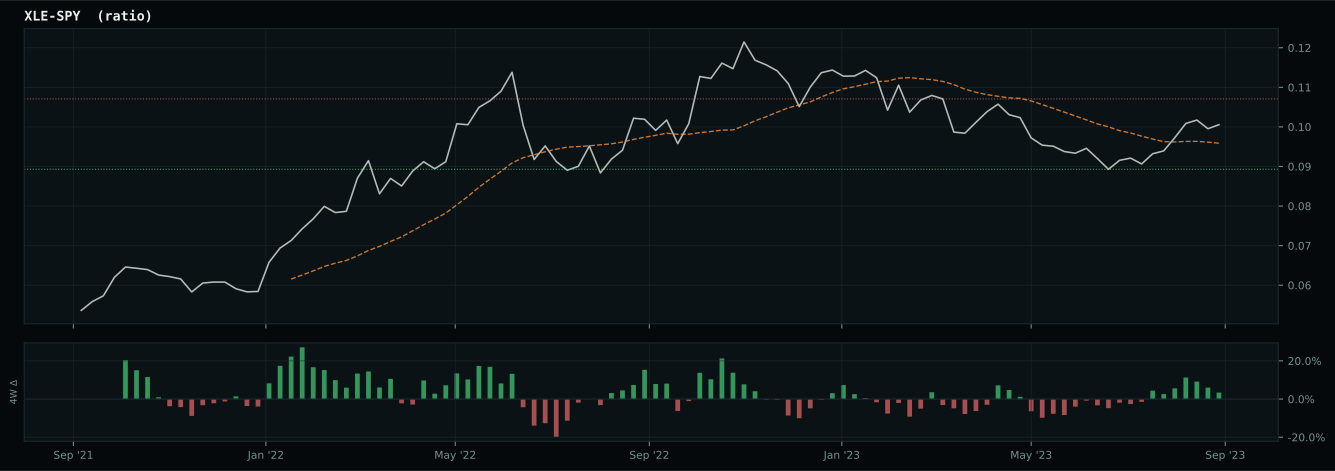
Macro Regime — Late-Cycle Reflation
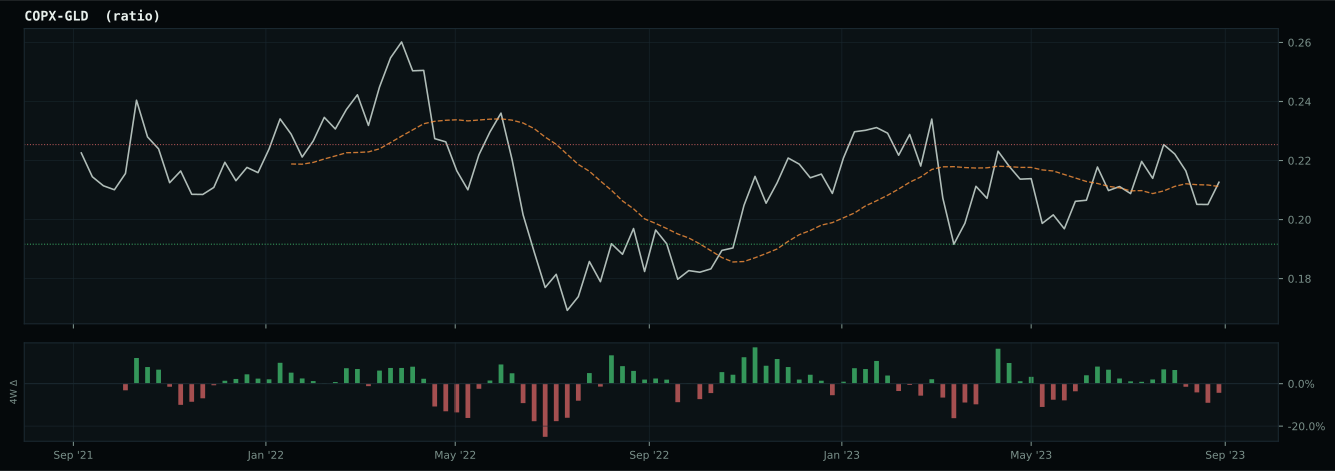
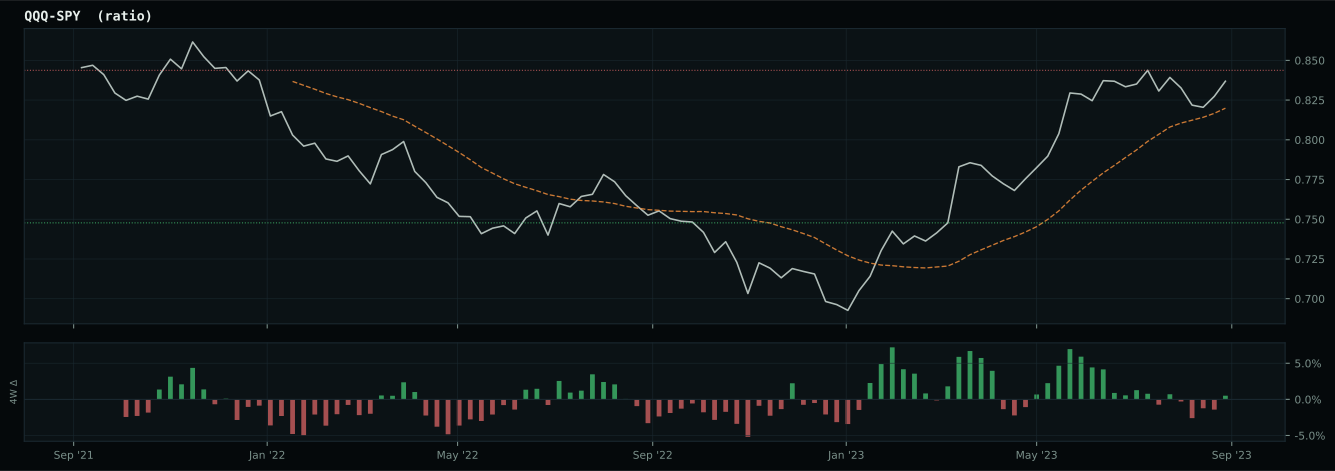
Macro Evidence Charts
Market-implied signals behind the macro regime scores. Each ratio compares two assets; the direction and slope of the ratio is what the macro engine reads.
Crypto Regime — TrendBTC
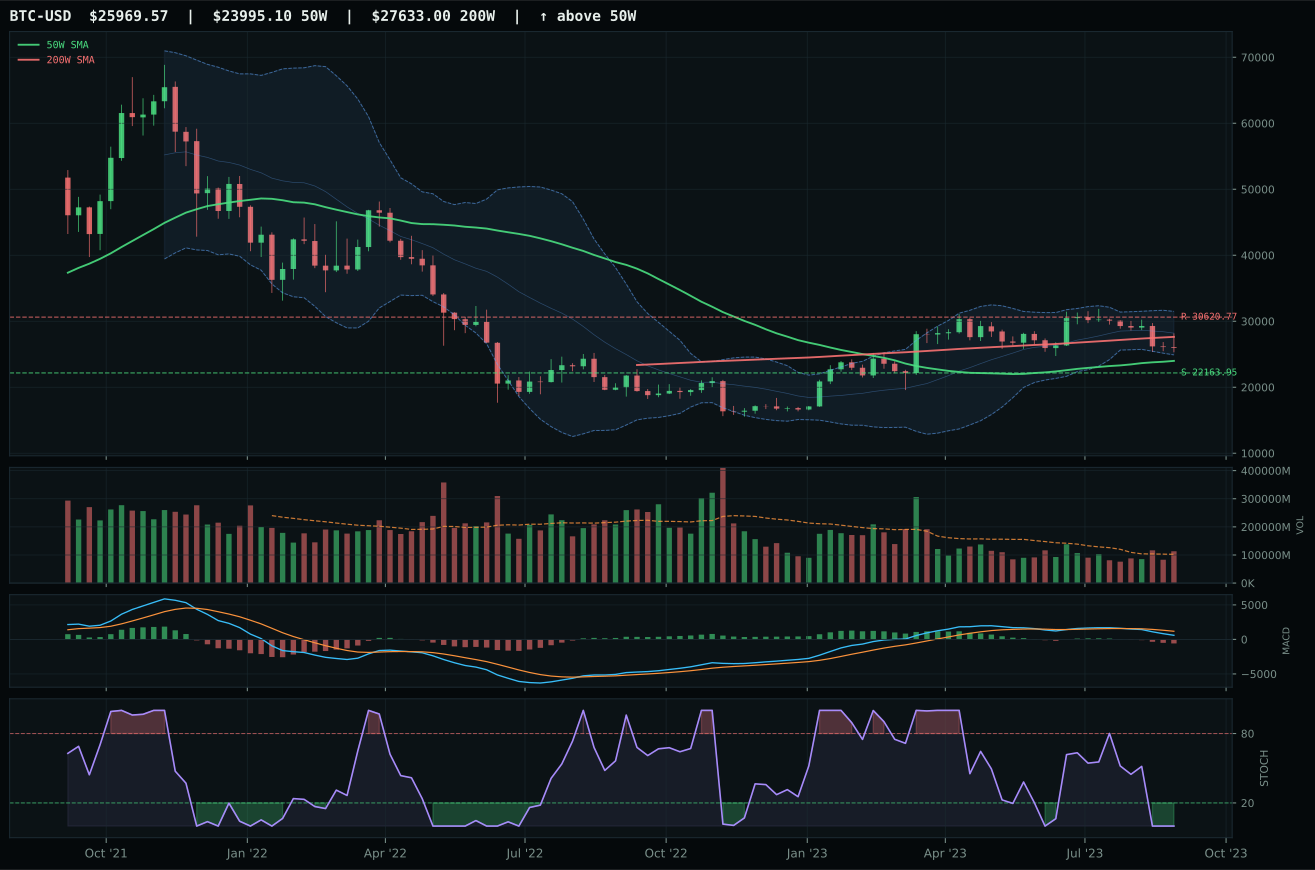
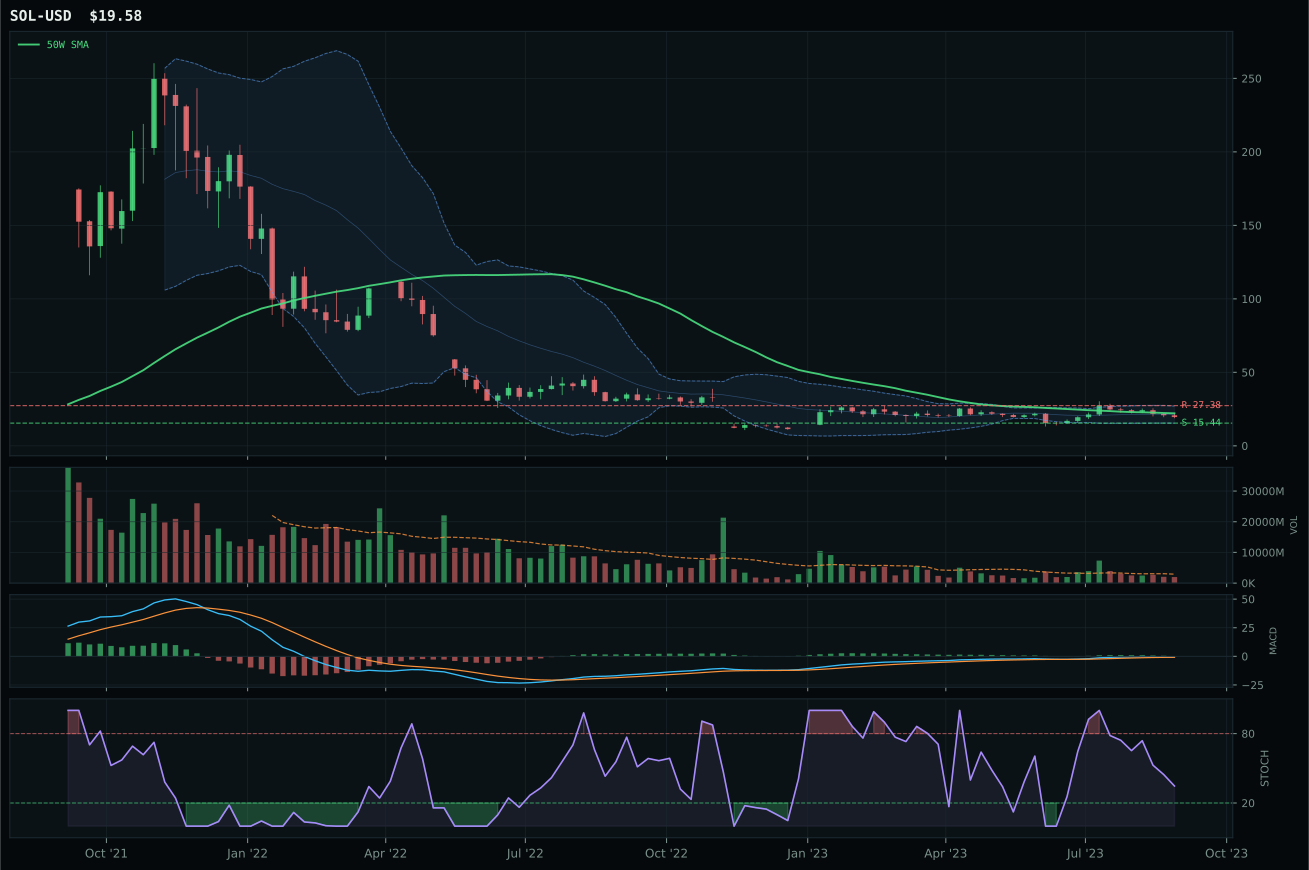
post-touch structure is too wide to count as a range; max/min close ratio is 1.88
TrendBTC confirmed: 2 consecutive closes above rising/flat 50W SMA
one or more available conditions failed
Category Rankings
| Rank | Category | Winner | Score | Alloc | 4W Ret | Peers (4W) |
|---|---|---|---|---|---|---|
| 1 | Traditional Energy | XLE | 81.6 | 20% | -1.07% | XOP -3.4% · FCG -4.5% |
| 2 | Nuclear Energy | URNM | 67.9 | 20% | +18.50% | URA +9.8% · NLR +7.0% |
| 3 | Industrial Metals | COPX | 46.7 | 10% | -5.92% | PICK -3.7% · REMX -8.4% |
| 4 | Agriculture & Livestock | MOO | 42.1 | 10% | -7.07% | VEGI -6.2% · WEAT -6.2% |
| 5 | Defense & Aerospace | ITA | 40.1 | 10% | -8.95% | XAR -8.4% · ROKT -8.4% |
| 6 | Technology | CIBR | 34.0 | 10% | -3.65% | XLK -6.7% · IGV -5.2% |
| 7 | Utilities & Infrastructure | PAVE | 32.2 | 10% | -6.95% | IGF -4.9% · XLU -6.4% |
| 8 | Precious Metals | GLD | 30.5 | 10% | -5.07% | SLV -9.8% · GDX -7.8% |
| 9 | AI | AIQ | 29.3 | 0% | -6.34% | SMH -6.7% · BOTZ -7.1% |
| 10 | Emerging Markets | INDA | 24.4 | 0% | -0.40% | ILF -2.8% · IEMG -3.8% |
Traditional Energy — XLE
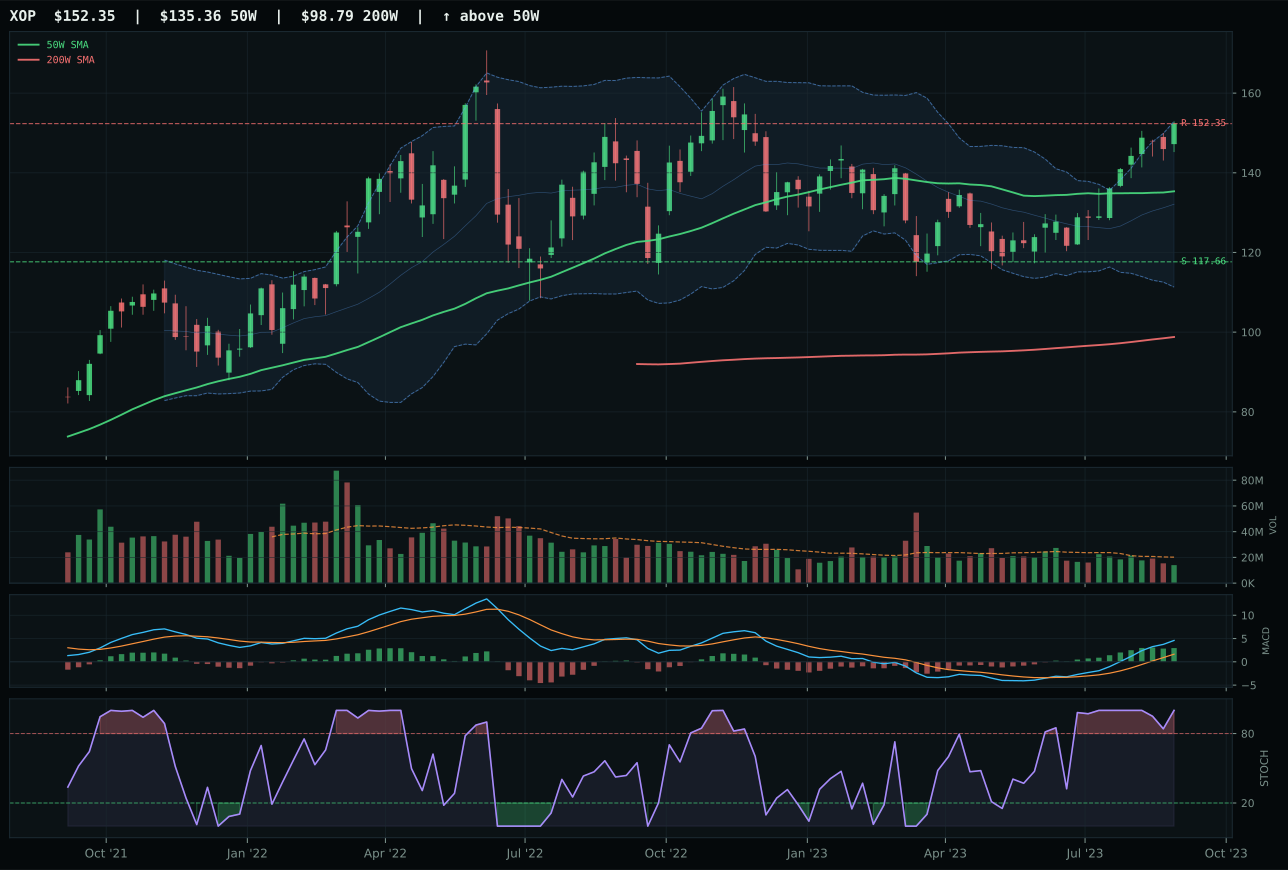
XOP has a neutral structure profile with 17.6% 13-week relative strength versus SPY.
A failed hold above support would weaken the setup.
Actionable but governed by invalidation levels.
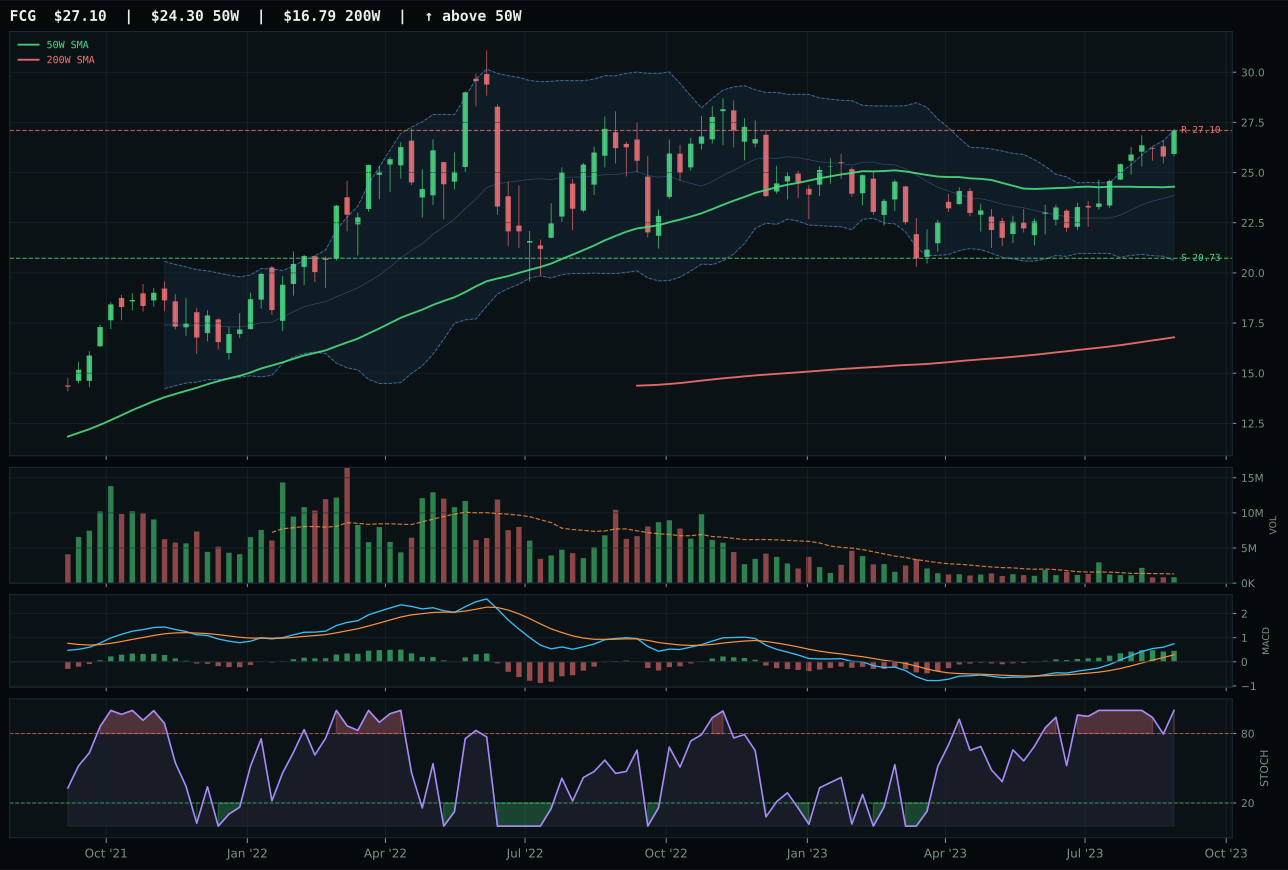
FCG has a neutral structure profile with 14.6% 13-week relative strength versus SPY.
A failed hold above support would weaken the setup.
Actionable but governed by invalidation levels.
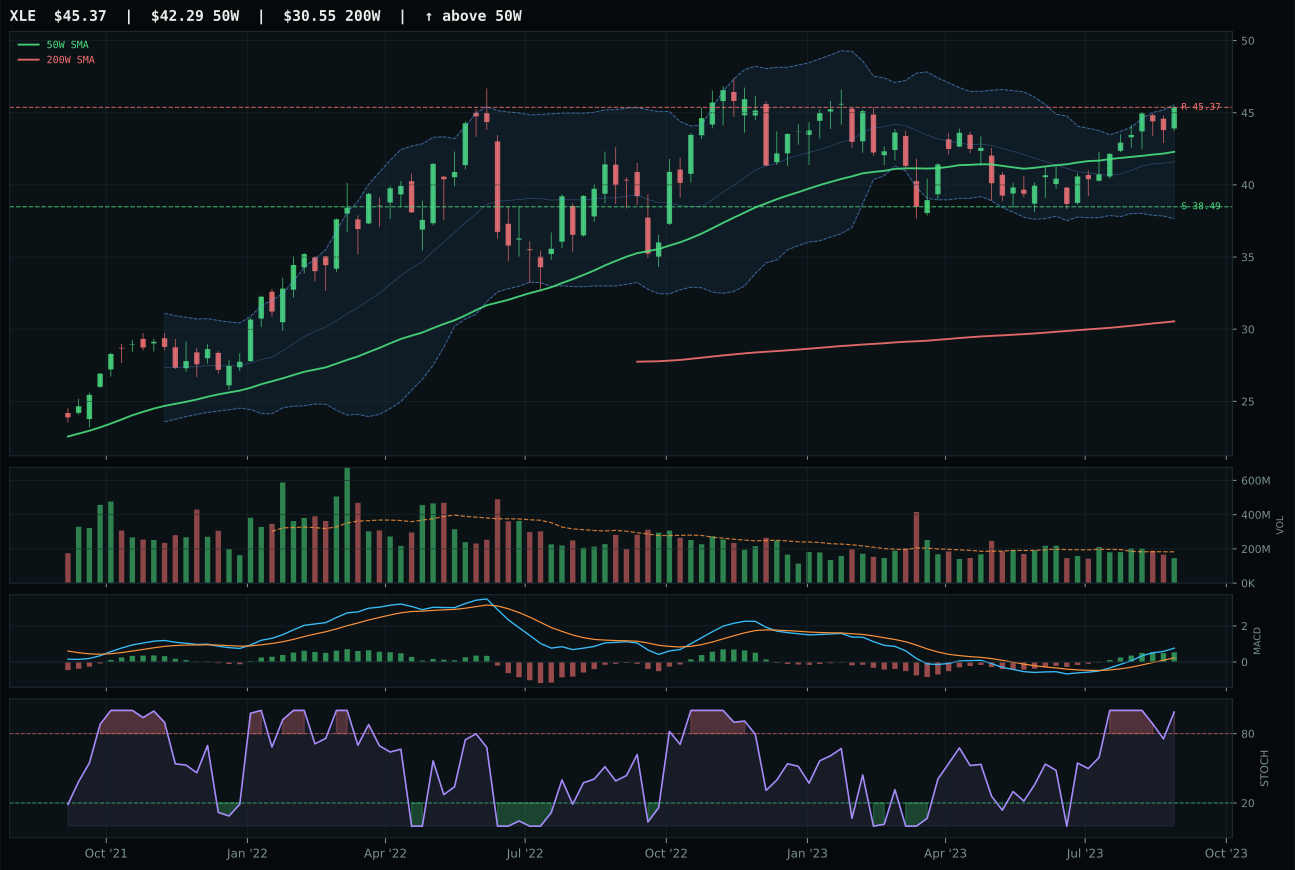
XLE has a neutral structure profile with 8.1% 13-week relative strength versus SPY.
A failed hold above support would weaken the setup.
Actionable but governed by invalidation levels.
XLE claims top-2 allocation with an 81.6 category score and wins the three-ETF basket decisively despite XOP carrying superior momentum at 100.0 versus XLE's 78.2. XLE's advantage is structural and disciplined: it sits only 7.3% above the 50W—a measured advance without the 12.6% extension that XOP carries—and its MACD is bullish and improving while stochastic RSI is overbought but rolling over at 0.99, signaling mature strength rather than speculative enthusiasm. The 100.0 trend score reflects integrated energy cash-flow defense; price is above both 50W and 200W with 0.3% slope and 8.1% RS versus SPY, meaning fundamental buyers are driving this advance, not momentum chasers. XOP's 17.6% RS versus SPY and thin volume participation (versus XLE's neutral volume) are red flags for extension risk. XLE's risk/reward of 53.0 beats XOP's 49.9 because downside to support is deeper (17.9% vs undefined), creating a cleaner stop-loss architecture. The score gap of 4.3 points in a two-horse race confirms XLE's superior risk-adjusted setup.
Traditional Energy is allocated 10% in top-2 overweight tier, justified by the strongest category score in the portfolio at 81.6. Category macro fit is exceptional at 90.0/100, with energy scarcity active at +16 points, Late-Cycle Reflation adding +12, inflation pressure at +10, and supply shortage at +9. This is structural macro sponsorship with genuine commodity scarcity beneath it. XLE's technical evidence of 65.5 is solid if not elite, but the macro alignment is overwhelming; in this regime, energy equities are a core real-asset proxy. The 13.6% 13W return shows institutional accumulation building beneath the headlines. XLE's 8.1% RS versus SPY is material without being extended—this is a category where late buyers can still participate. Volume confirmation at 0.80x is neutral rather than enthusiastic, meaning the move has room to expand if liquidity accelerates. Allocate the full 10% with conviction; this category's macro case will persist through the quarter. Consider rebalancing only if XLE closes below the 38.49 support level on rising volume, which would signal that institutional buyers are capitulating rather than accumulating. The energy allocation is durable as long as energy scarcity remains active and late-cycle reflation persists.
Nuclear Energy — URNM
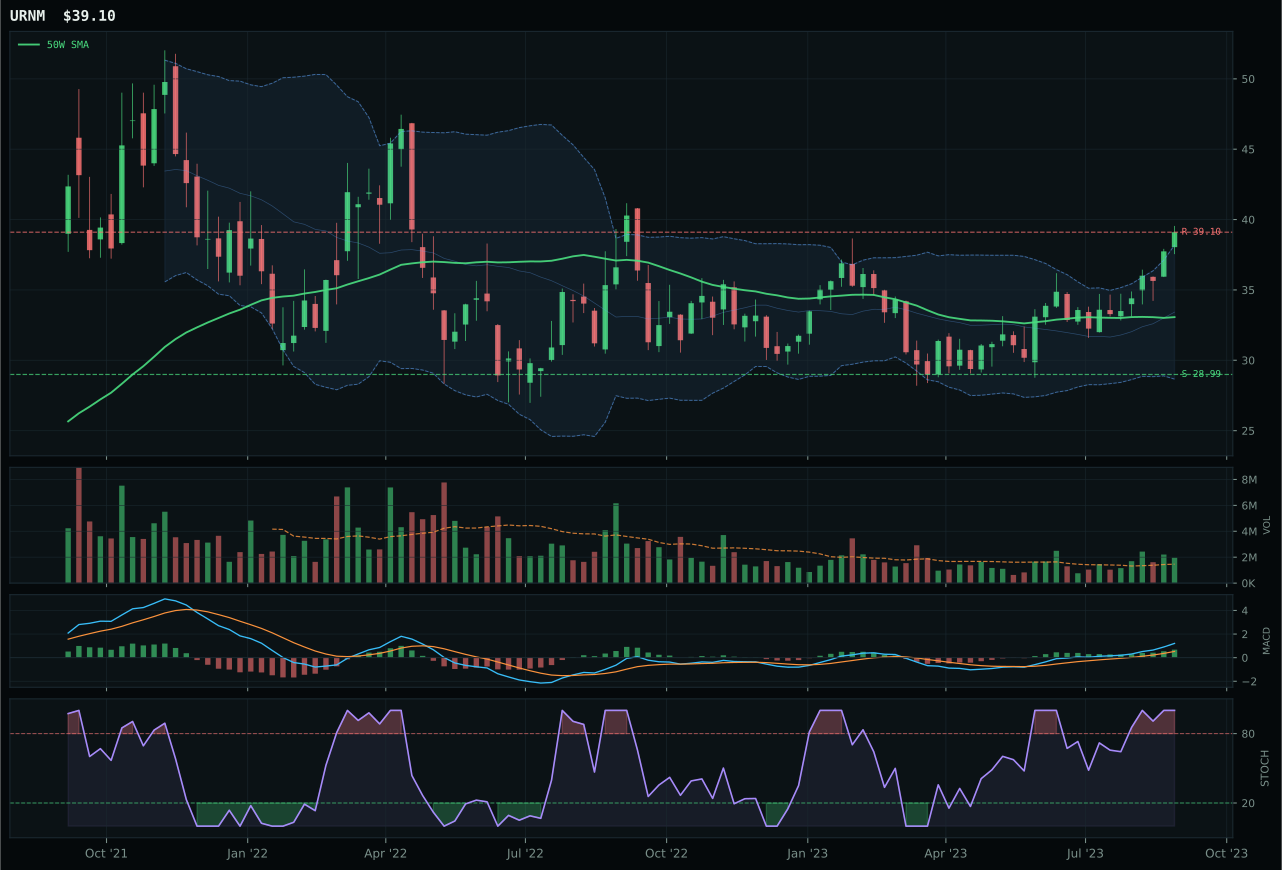
URNM has a vertical extension profile with 12.7% 13-week relative strength versus SPY.
A failed hold above support would weaken the setup.
Actionable but governed by invalidation levels.
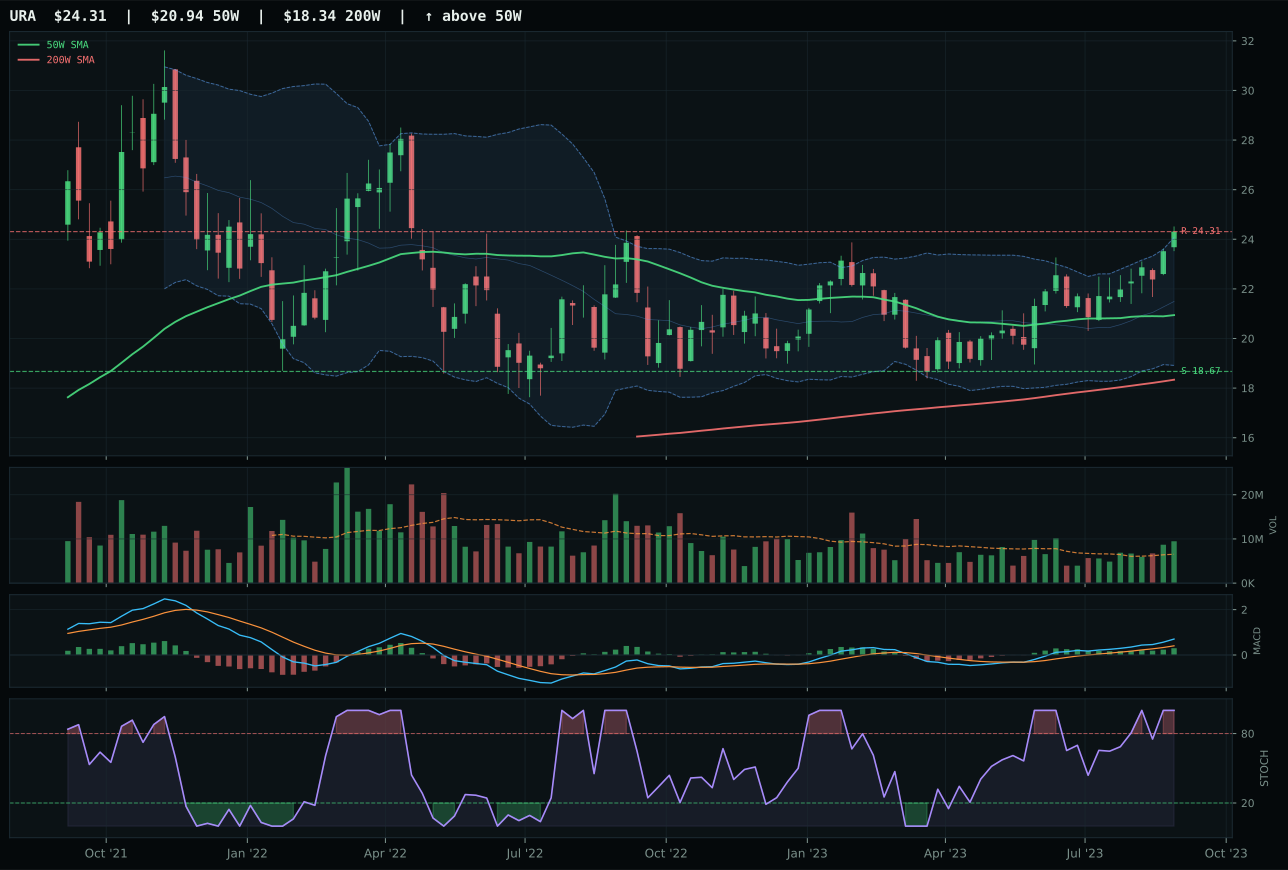
URA has a vertical extension profile with 8.6% 13-week relative strength versus SPY.
A failed hold above support would weaken the setup.
Actionable but governed by invalidation levels.
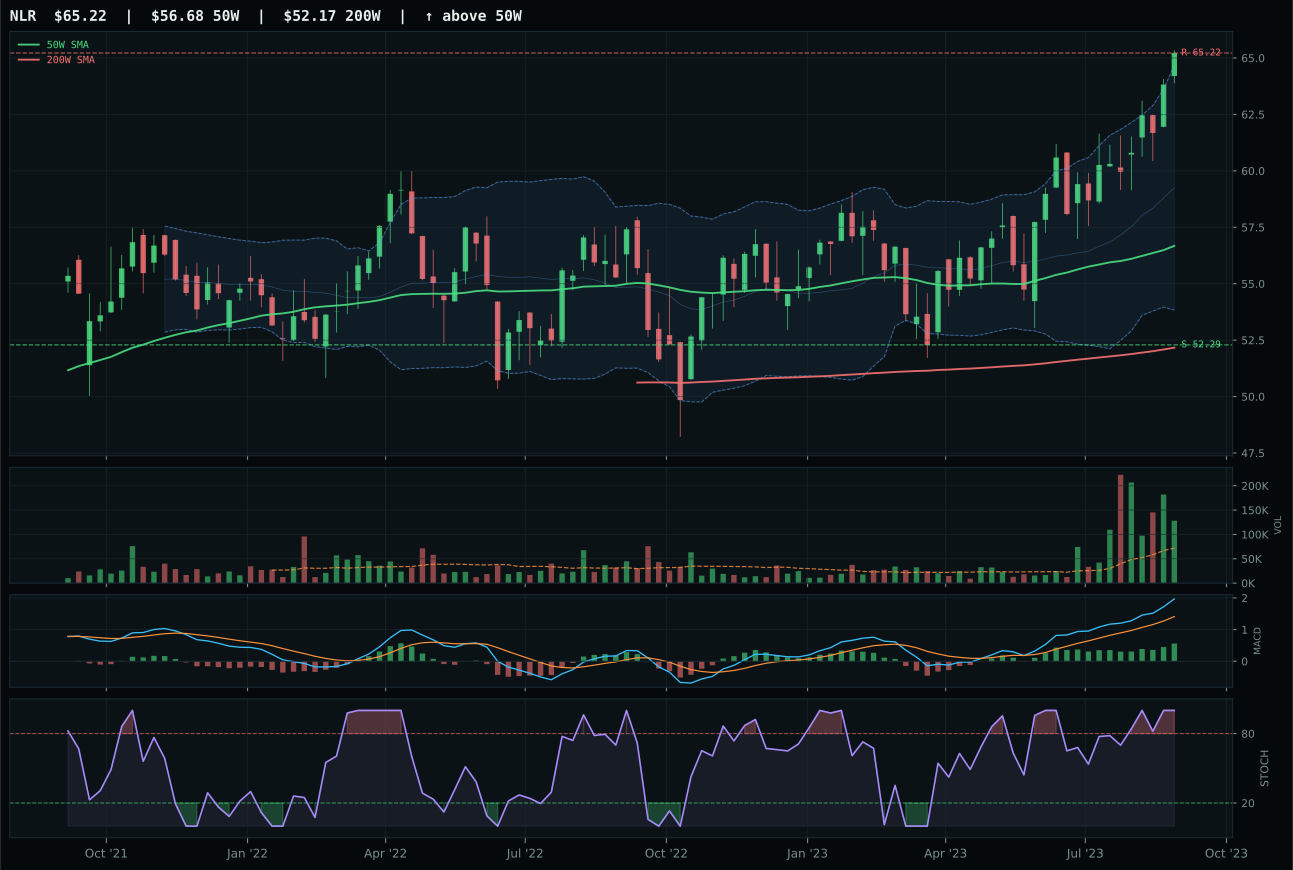
NLR has a vertical extension profile with 7.5% 13-week relative strength versus SPY.
A failed hold above support would weaken the setup.
Tracked, but not top-2 eligible because: .
URNM wins the nuclear basket with a 4.1-point advantage over URA by combining better category-relative strength (4.0% vs 0.0%) with slightly superior timing entry mechanics despite being extended at 18.2% from the 50W. URNM's vertical extension structure would normally be penalizing, and the timing score of 45 reflects that concern; however, the MACD is bullish and improving with stochastic RSI overbought at full 1.00, and the 1.34x above-average volume participation shows institutional buyers are actively defending the position into extension. URA carries higher trend score of 100 and better risk/reward structure, but its neutral timing of 37 reveals the setup is less defined—price is further extended at Fib 0.236 near the 52W high with less mechanical structure. Both instruments show identical momentum confirmation of 100.0 from 13W returns in the 14-18% range, but URNM's 4.0% category-relative strength edge proves uranium miners are winning the accumulation race. The 13.7% 4W return on URNM versus 8.2% on URA confirms that recent buyer aggression is favoring the miner exposure.
Nuclear Energy is allocated 10% in top-2 overweight tier, justified by a 67.9 category score that reflects the strongest momentum confirmation in the entire portfolio at 100.0. URNM's technical evidence is elite at 86.8/100, combining perfect trend score of 90.0 and perfect momentum confirmation. Category macro fit is 64.0/100, with energy scarcity active at +9 points, real asset sponsorship at +7, and Late-Cycle Reflation adding +7. This is a category where technical and macro alignment converge powerfully. URNM's 18.2% extension from the 50W is the only structural concern, but the above-average volume participation and bullish improving MACD confirm that this is institutional accumulation into strength rather than speculative enthusiasm. The 18.1% 13W return is the second-highest in the portfolio after PAVE, but here the momentum is supported by genuine macro tailwinds (energy scarcity, uranium fuel demand for new nuclear plants). Allocate the full 10% with the understanding that URNM's extended valuation creates downside risk to support at 28.99 if sentiment shifts; however, the current evidence suggests that this is structural capital rotation into energy and real assets. Reduce allocation to 5% only if URNM closes below support on rising volume with MACD rolling negative, signaling institutional exit rather than consolidation.
Industrial Metals — COPX
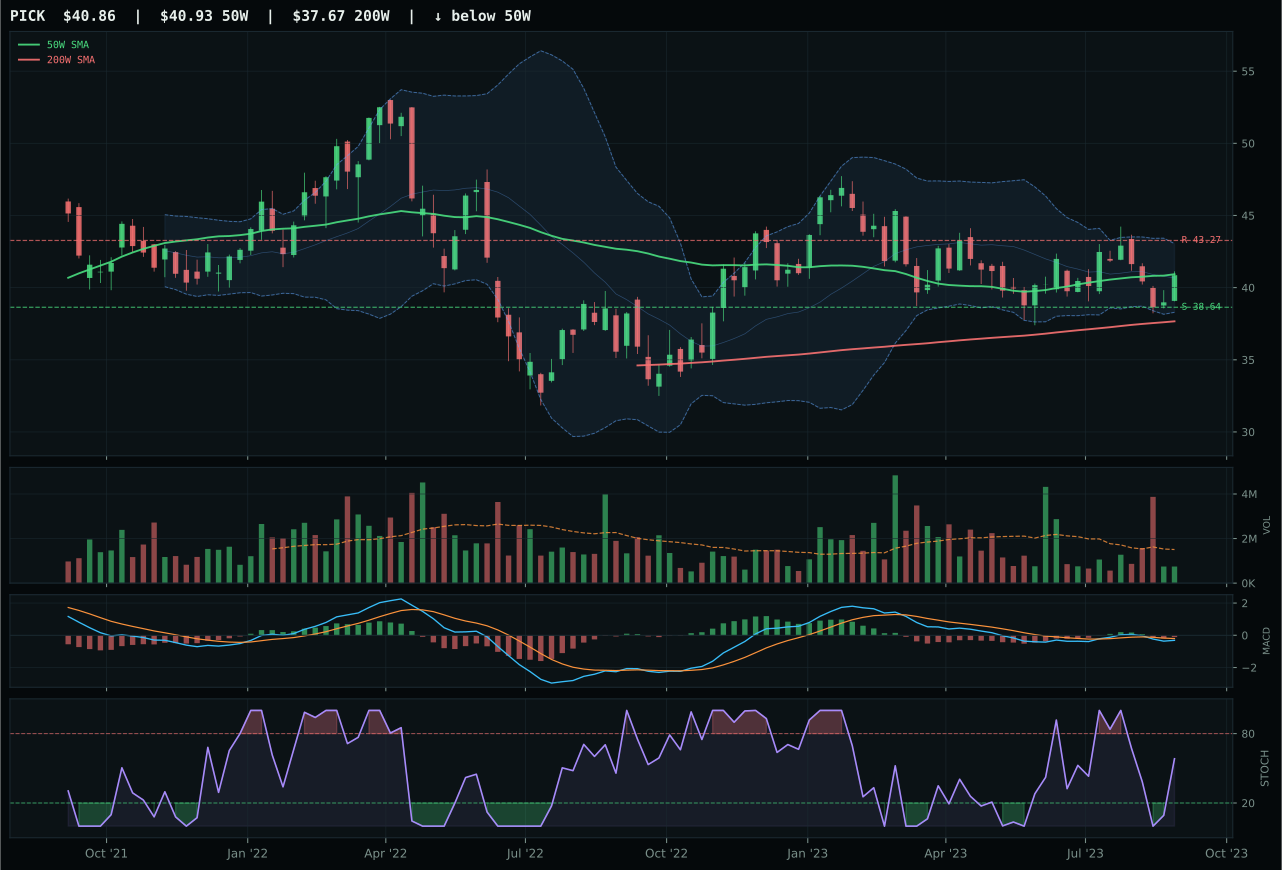
PICK has a compression near 50W profile with -3.7% 13-week relative strength versus SPY.
A failed hold above support would weaken the setup.
Actionable but governed by invalidation levels.
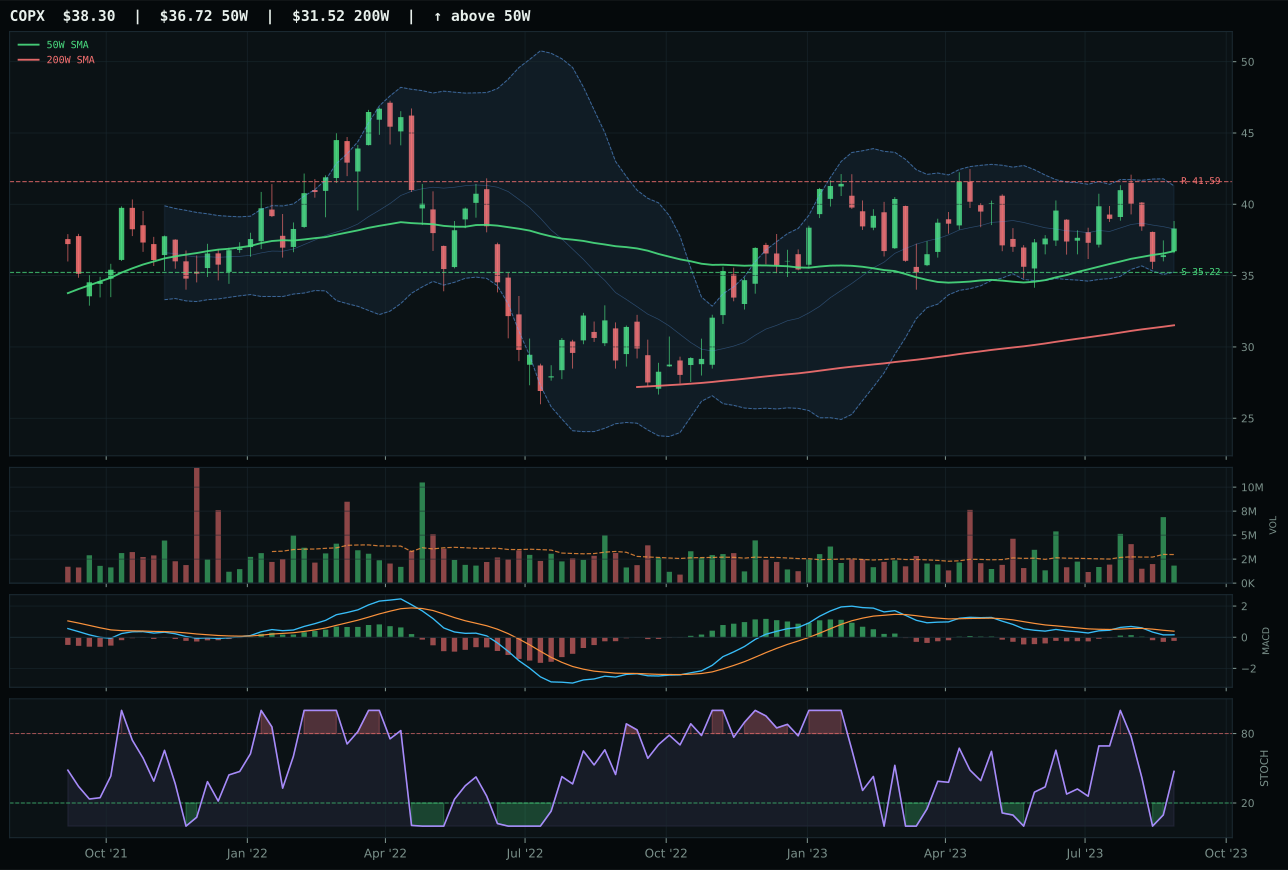
COPX has a neutral structure profile with -2.8% 13-week relative strength versus SPY.
A failed hold above support would weaken the setup.
Actionable but governed by invalidation levels.
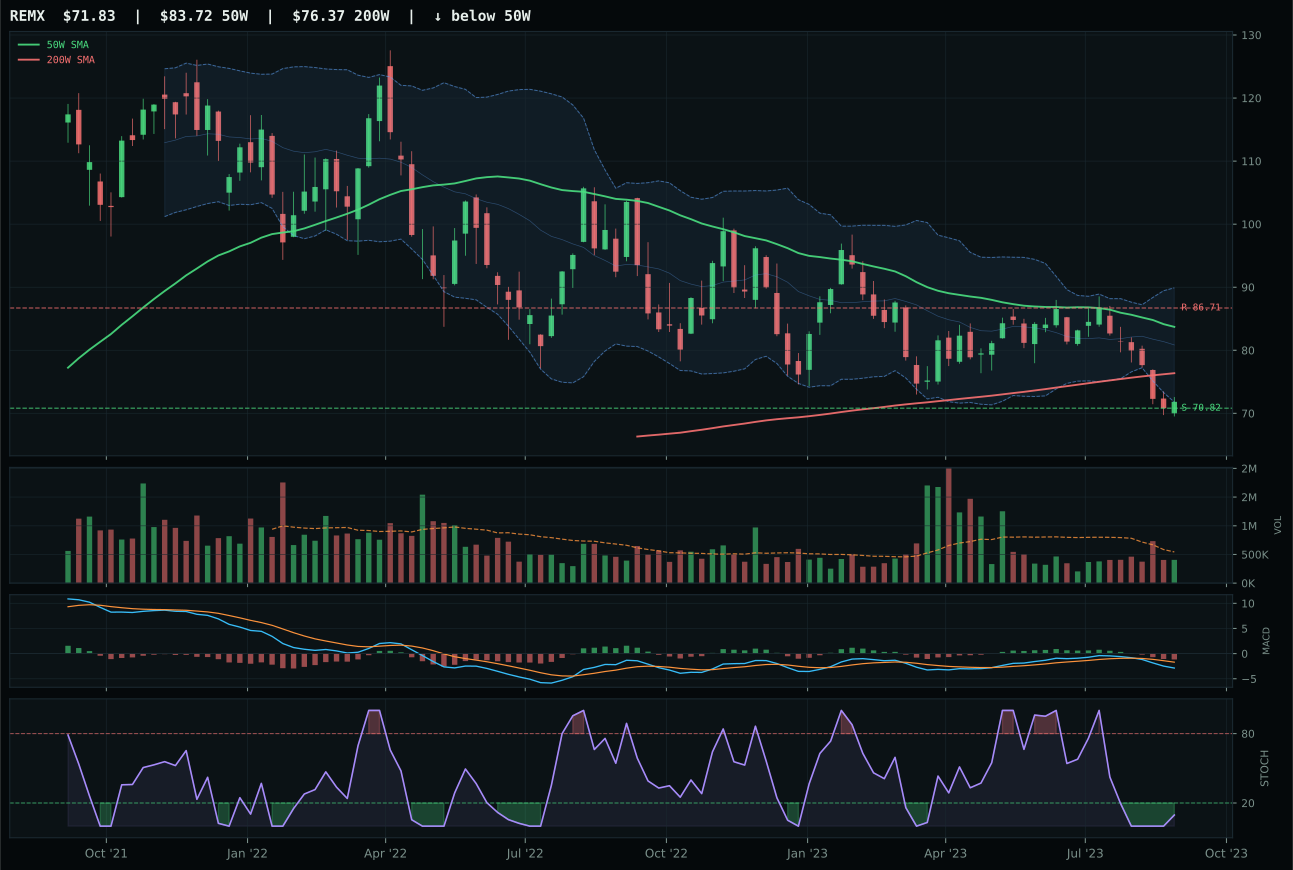
REMX has a pullback into support profile with -20.1% 13-week relative strength versus SPY.
A failed hold above support would weaken the setup.
Actionable but governed by invalidation levels.
COPX wins industrial metals with a 3.1-point margin over PICK by owning superior trend score (77.7 vs 51) and better category-relative strength at 0.9% versus PICK's 0.0%. Copper scarcity is the right narrative in a late-cycle reflation regime, and COPX's neutral structure with 4.3% distance from the 50W creates a measured entry point, not an extended chase. The 93.0 timing score reflects upper retracement zone positioning near Fib 0.236, where consolidation can produce directional expansion in either direction—COPX has defined the entry without overextension. PICK's compression structure near the 50W looks tactically attractive for mean reversion, but the 1.7% 13W return trails COPX's 2.6%, and most critically, PICK's -3.7% RS versus SPY shows lagging participation compared to COPX's -2.8%. Both charts show thin volume participation and deteriorating MACD, but COPX's price action is being accumulated by slightly more institutional buyers. The thin volume participation is actually a feature in this reset regime, not a bug—it suggests patient accumulation rather than forced selling.
Industrial Metals earns 5% allocation in tier-2, positioned directly below the top-2 energy and nuclear categories by score at 46.7. Category macro fit is strong at 75.0/100, with metals scarcity active at +14 points, commodity breadth positive at +10, and Late-Cycle Reflation adding +10. This is a structural narrative alignment rather than momentum-driven allocation. COPX's technical evidence of 44.4 is serviceable but not compelling; the real thesis is macro sponsorship of industrial metals in an inflationary, supply-constrained regime. Risk/reward is favorable at 61.3, with downside to support at 8.7% and upside resistance at -7.9% (meaning price is already near Fib resistance), but volume and momentum confirmation are both weak. The thin volume at 0.61x the 20W average and momentum confirmation of only 22.0 indicate that buyer participation is not yet aggressive. Hold the 5% allocation as a structural real-asset hedge and commodity-breadth exposure, but do not expect sharp returns until COPX's price breaks decisively above 41.59 resistance with volume acceleration to 1.2x or higher—confirmation that scarcity premium is transitioning from narrative to active accumulation.
Agriculture & Livestock — MOO
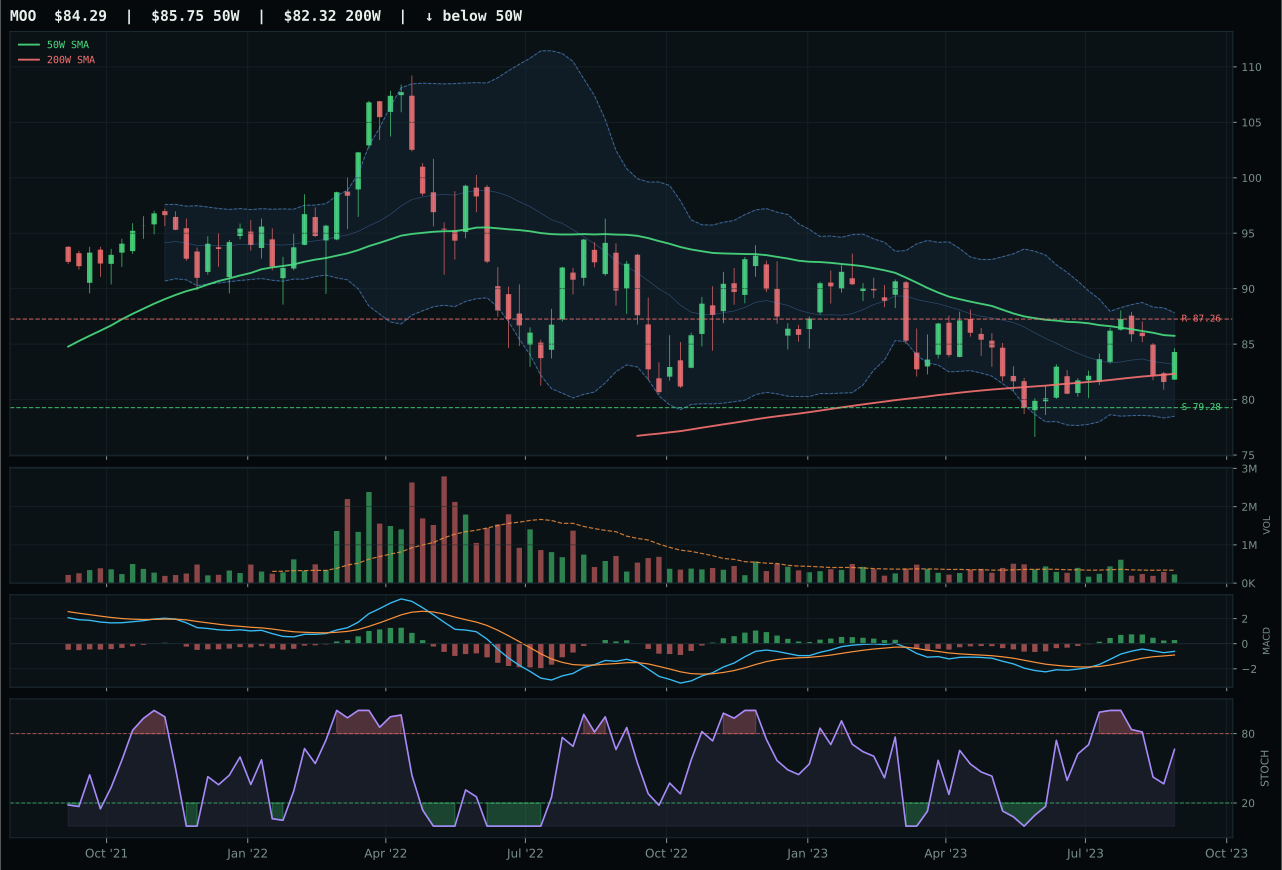
MOO has a compression near 50W profile with 0.1% 13-week relative strength versus SPY.
A failed hold above support would weaken the setup.
Actionable but governed by invalidation levels.
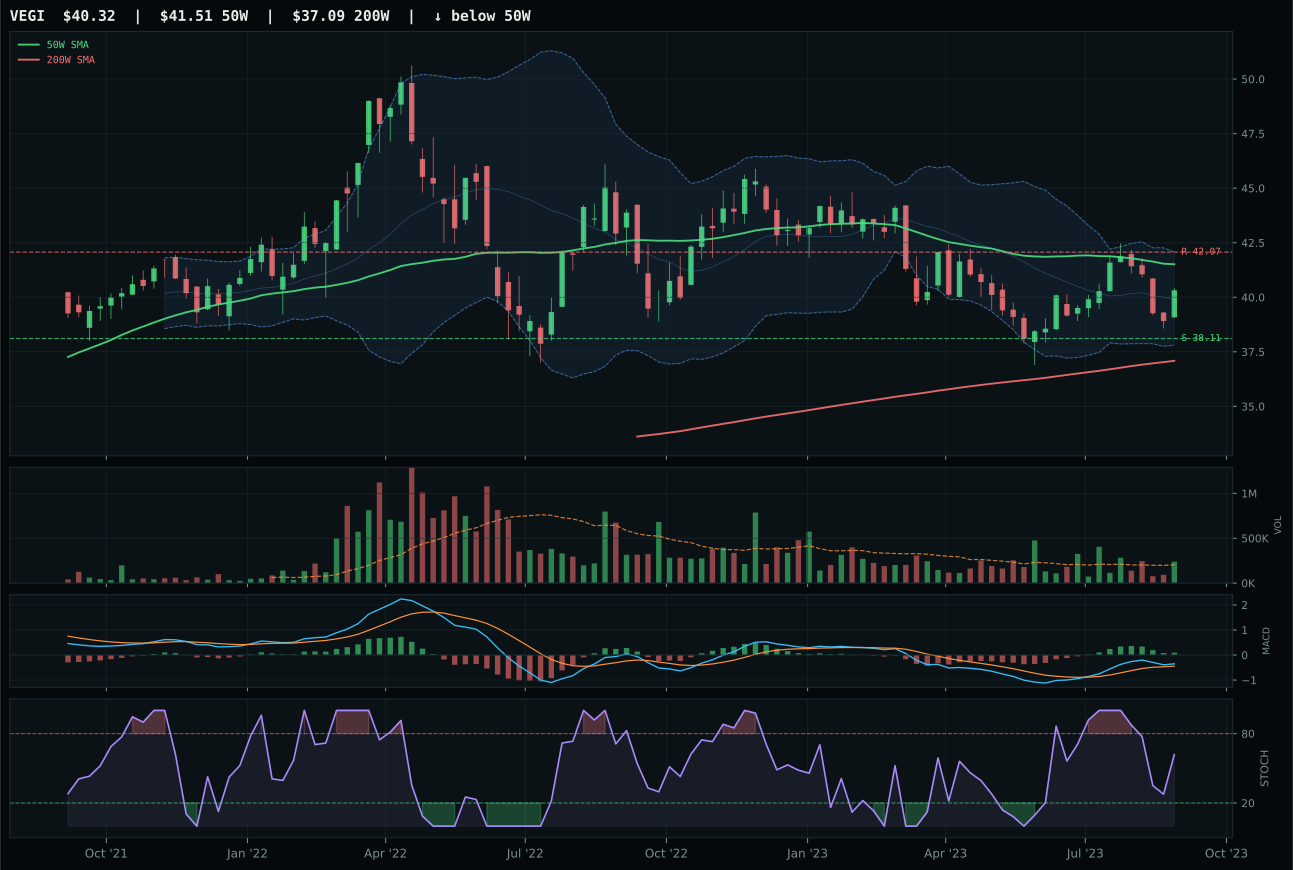
VEGI has a compression near 50W profile with -0.5% 13-week relative strength versus SPY.
A failed hold above support would weaken the setup.
Tracked, but not top-2 eligible because: .
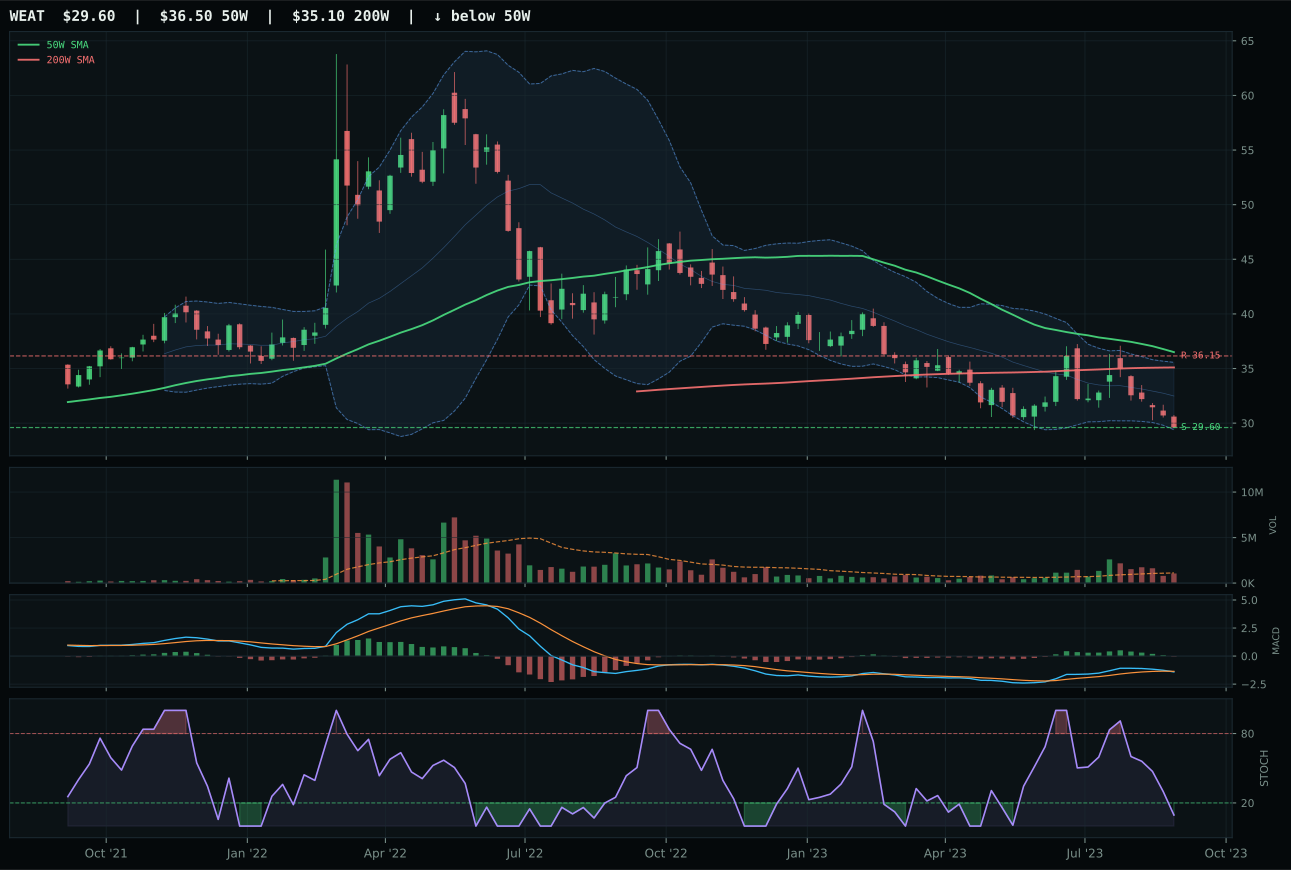
WEAT has a pullback into support profile with -11.8% 13-week relative strength versus SPY.
A failed hold above support would weaken the setup.
Actionable but governed by invalidation levels.
MOO wins decisively over VEGI with an 18.2-point advantage by owning the single most important technical element in this category: perfect 100.0 timing score from sitting just 1.7% below the 50W. Price sits in the middle retracement zone near Fib 0.500, creating a symmetrical risk/reward with 6.3% downside to support and 3.4% upside to resistance—defined territory where buyers and sellers are balanced. VEGI is deeper in retracement at a lower Fib level, which should be better for value, but MOO's compression structure near the 50W with 84.7 compression ratio means buyers have been accumulating quietly rather than capitulating into weakness. MACD is bullish but flattening for both, yet MOO's category-relative strength edge of 0.6% versus 0.0% shows that agribusiness cash flows are winning against pure agriculture producers. VEGI actually carries above-average volume participation versus MOO's thin participation, but in a reset setup the lower volume is confirmation of patient accumulation rather than desperation selling.
Agriculture earns 5% allocation in tier-2, supported by the strongest category-level macro fit in the entire portfolio at 90.0/100. Supply shortage is active at +13 points, inflation pressure at +10, and Late-Cycle Reflation itself adds +8, creating a near-perfect macro alignment for real assets in this regime. MOO's technical evidence score of 66.0 is solid but not exceptional, placing the category firmly in the middle tier by setup quality. The real driver is macro: commodity breadth positive is active, real asset sponsorship is active, and the supply shock narrative is structural rather than cyclical. MOO's 100.0 timing score is almost unique in this week's universe, reflecting the rare setup where price is neither extended nor oversold. The 5.5% 13W return shows gentle momentum rather than speculative enthusiasm, which is exactly the right temperament for a reflation hedge. The category would justify promotion to 10% tier-2 if URNM or XLE showed signs of relative weakness, or if MOO's price could punch above the 87.26 resistance and hold above the 50W with volume confirmation—evidence that the quiet accumulation is transitioning into active buyer defense.
Defense & Aerospace — ITA
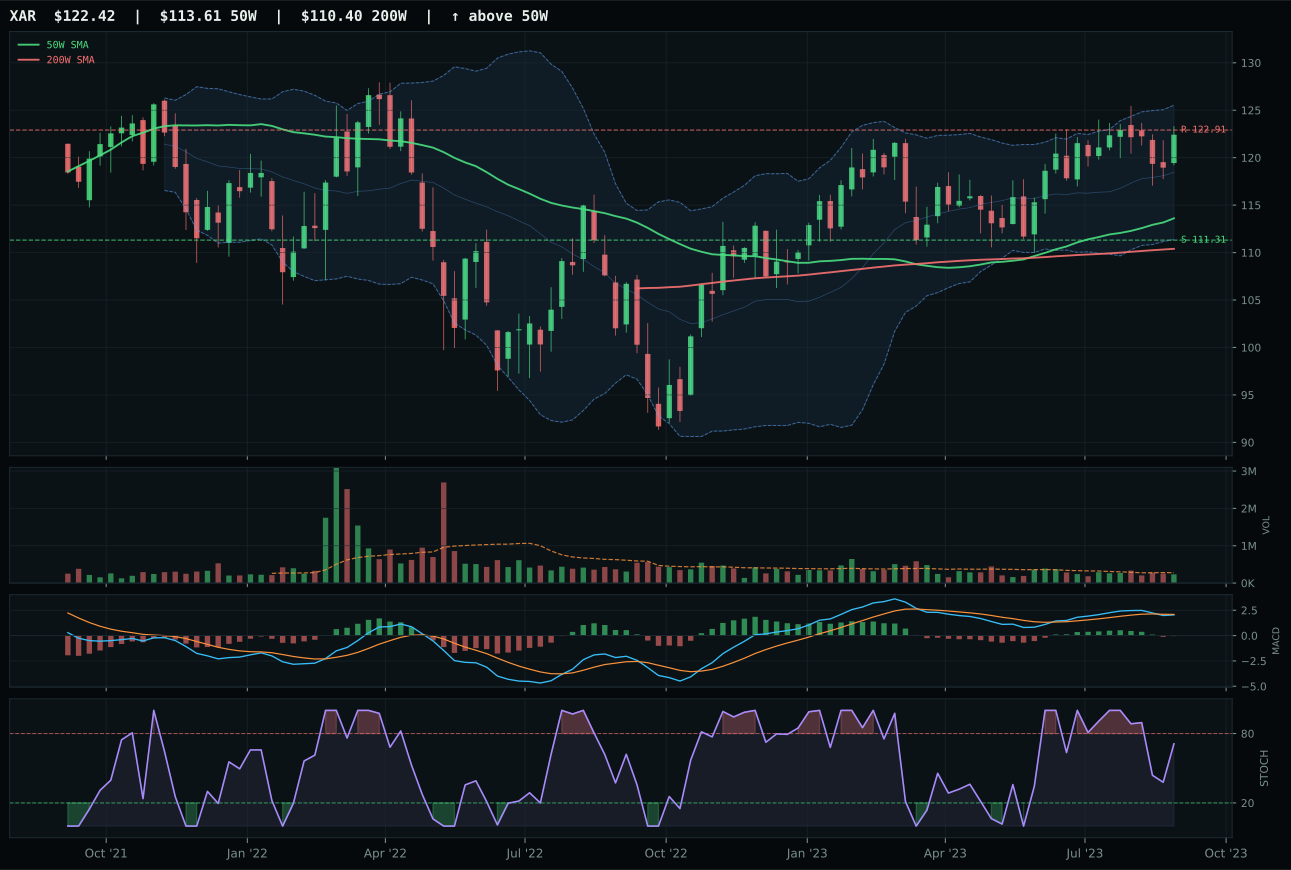
XAR has a neutral structure profile with 0.7% 13-week relative strength versus SPY.
A failed hold above support would weaken the setup.
Actionable but governed by invalidation levels.
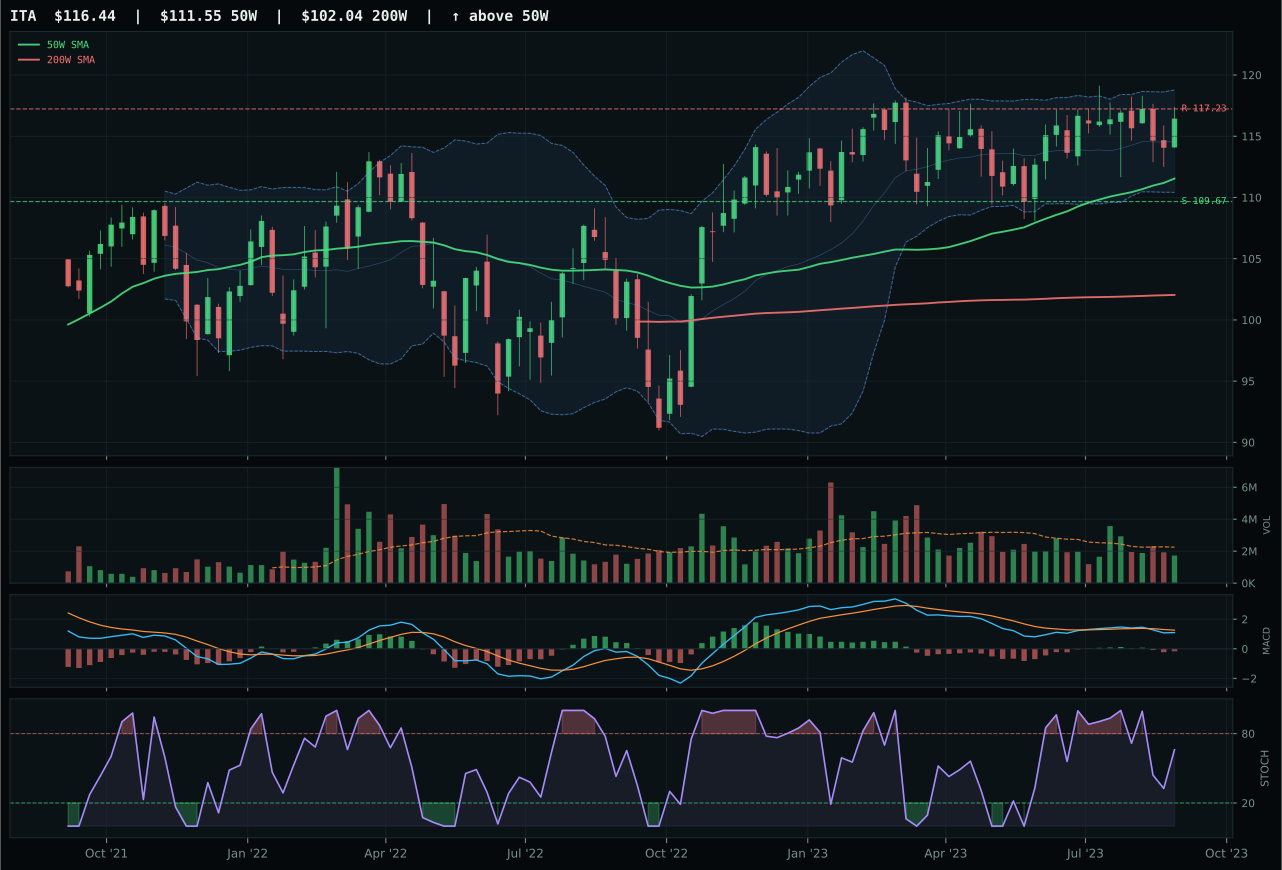
ITA has a neutral structure profile with -2.1% 13-week relative strength versus SPY.
A failed hold above support would weaken the setup.
Actionable but governed by invalidation levels.
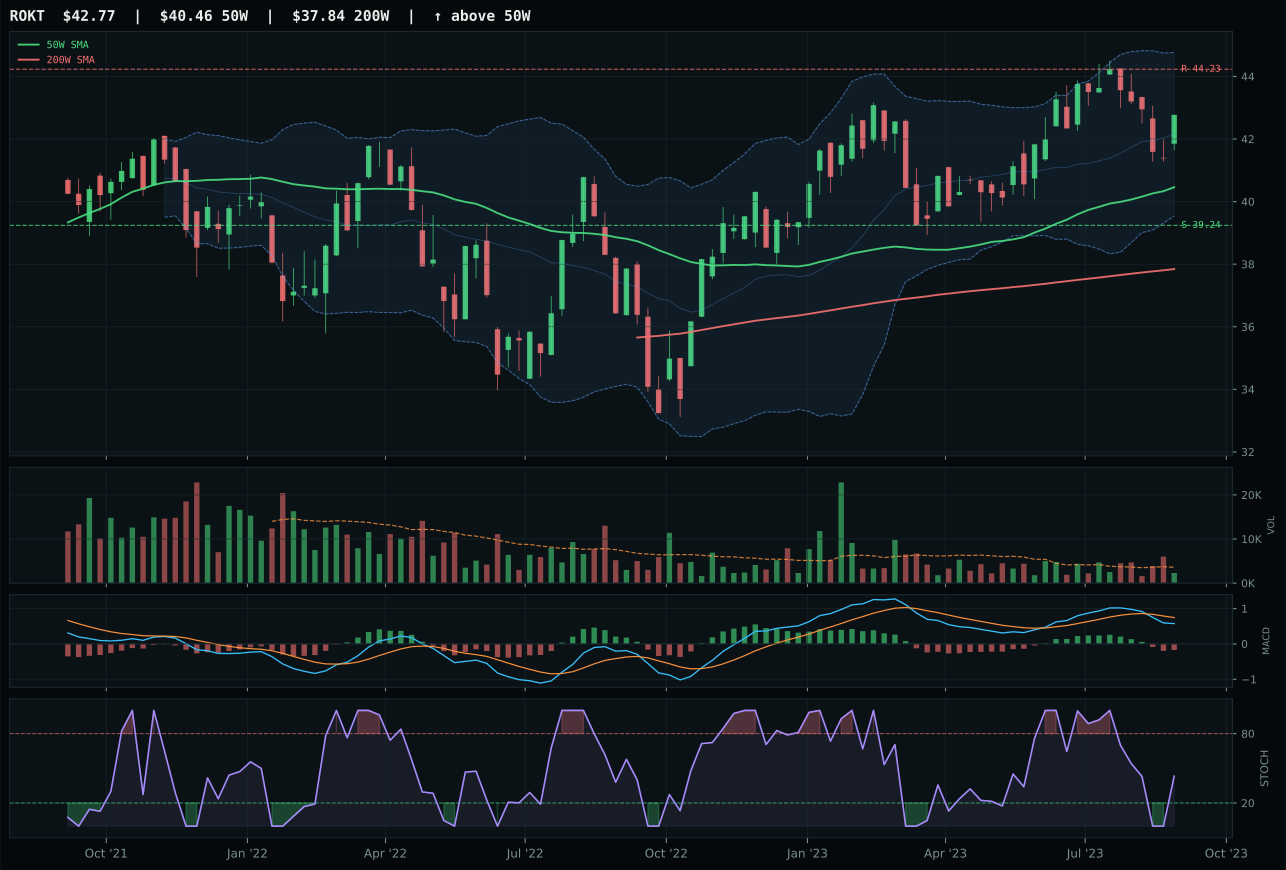
ROKT has a neutral structure profile with -3.2% 13-week relative strength versus SPY.
A failed hold above support would weaken the setup.
Tracked, but not top-2 eligible because: .
ITA wins a razor-thin decision over XAR by just 0.5 points, claiming the representative position through superior timing entry mechanics rather than any fundamental technical advantage. ITA sits only 4.4% above the 50W—a textbook reset position—while XAR is 6.2% extended; this small distance advantage elevates ITA's timing score from 70 to 85, the single largest separator. Both charts show neutral structure, falling/neutral stochastic RSI at 0.66, and bearish/weakening MACD, meaning neither is in an active accumulation phase. XAR actually carries slightly better 13W return of 6.2% versus ITA's 3.3% and category-relative strength of 2.8% versus ITA's 0.0%, yet loses because of that timing penalty and a structure cleanliness score 0.4 points lower. The 39.0 risk/reward for ITA versus 37.7 for XAR is also a narrow margin; this is a category where both contenders are marking time rather than advancing.
Defense & Aerospace earns 5% allocation in tier-2, ranked as the fourth or fifth strongest category by score. The 40.1 final score benefits from strong category-level macro fit of 57.0/100, supported by Late-Cycle Reflation at +6 points and credit stress shifting to a +2 benefit rather than a penalty. Real assets and inflation protection dynamics are beginning to favor defense durability, even though momentum confirmation from the representative ETF is weak at 36.7. The technical evidence from ITA is only 42.8/100—well below the median—which means this allocation is fundamentally macro-driven rather than chart-driven. The macro justification is sound in a reflation regime where military supply spending and geopolitical tension remain structural tailwinds, but the technical setup offers minimal entry conviction. Volume is thin at 0.77x the 20W average, persistence is only 44.0, and the 13W return of just 3.3% shows little follow-through from buyers. This category would rise to top-2 consideration if XAR or ITA can break above resistance at 117.23 with volume confirmation and MACD turning bullish/improving; until then, it serves as a patient macro hedge rather than an active conviction play.
Technology — CIBR
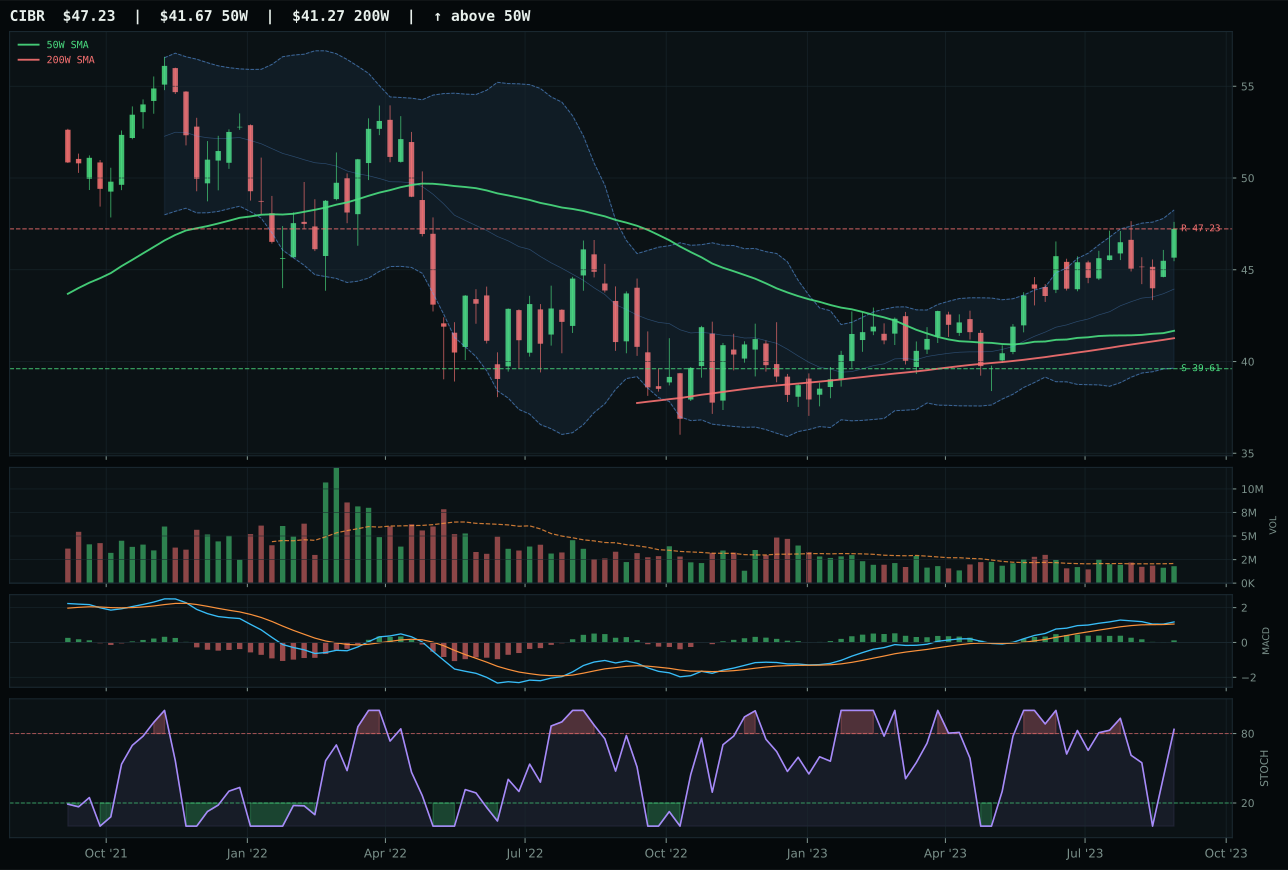
CIBR has a neutral structure profile with 2.0% 13-week relative strength versus SPY.
A failed hold above support would weaken the setup.
Actionable but governed by invalidation levels.
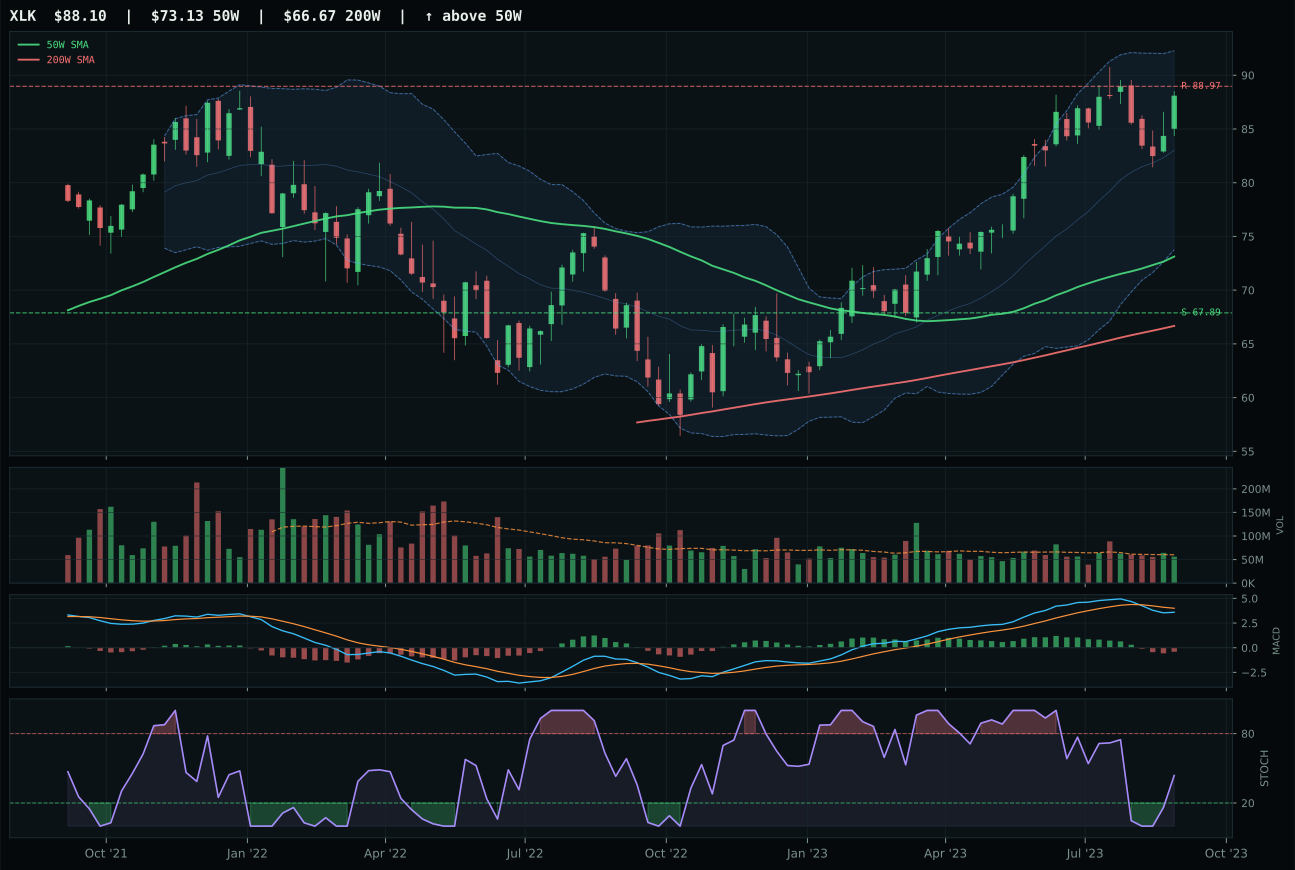
XLK has a vertical extension profile with 0.1% 13-week relative strength versus SPY.
A failed hold above support would weaken the setup.
Actionable but governed by invalidation levels.
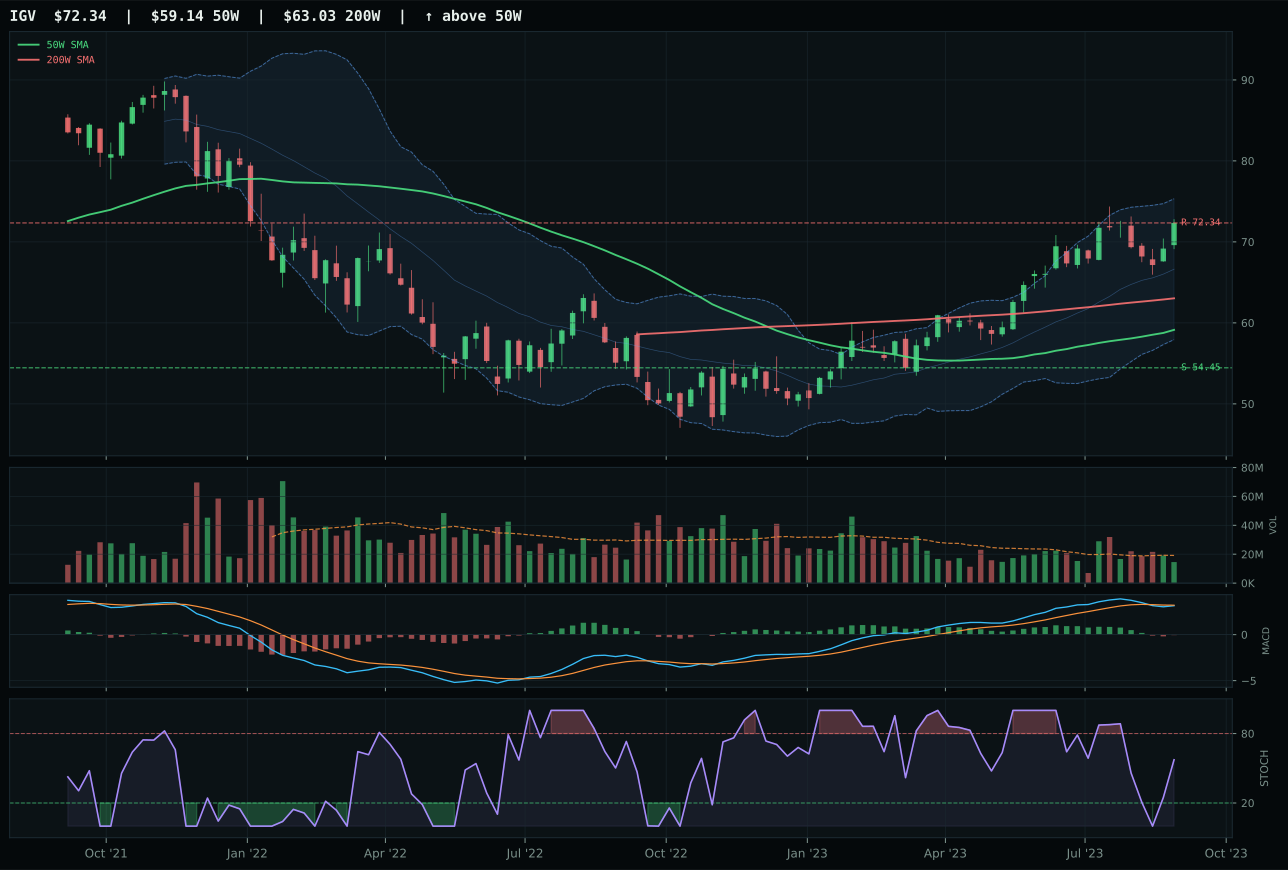
IGV has a vertical extension profile with 4.1% 13-week relative strength versus SPY.
A failed hold above support would weaken the setup.
Actionable but governed by invalidation levels.
CIBR wins the category with a 19.5-point advantage over XLK by combining neutral chart structure with disciplined momentum confirmation. The cybersecurity ETF sits 13.3% above its 50-week moving average—extended enough to matter but not overheated—with a bullish MACD that is flattening rather than rolling over, signaling caution about further upside. Its relative strength against SPY stands at 2.0% and category-relative strength at 0.0%, meaning it's performing exactly in line with peer leadership without the excess premium that would signal late-stage accumulation. XLK lost here because it's stretched 20.5% from its 50W, its MACD has already deteriorated to bearish/weakening, and it carries a timing score of 48 versus CIBR's 54—a gap that reflects the fundamental problem: XLK's buyers arrived late. Volume remains neutral for both, so the decision turns on setup quality and momentum structure, both of which favor the more measured advance in CIBR.
Technology earns 5% allocation as a tier-2 category this week, holding third place overall. The category's 34.0 final score reflects a technical environment that is not yet broken but has lost the structural conviction needed for top-2 consideration. Late-Cycle Reflation has activated liquidity stress as a headwind at -10 points, offsetting risk-appetite sponsorship of +9; credit stress adds another -7 points. The macro fit score of 38.0/100 is adequate but not compelling, and when weighted 38% against the ETF technical evidence at 62%, it drags the entire category below the threshold of XLE and URNM. CIBR's trend score of 99 is the strongest in the technology basket, but momentum confirmation of only 75.7 and volume-price sponsorship at 69.1 reveal that accumulation is tentative. The category would need to see MACD confirm above the current flattening resistance, liquidity stress to lift, or relative strength to accelerate above 3.0% versus SPY to justify promotion to the 10% tier-2 slot currently reserved for energy and nuclear.
Utilities & Infrastructure — PAVE
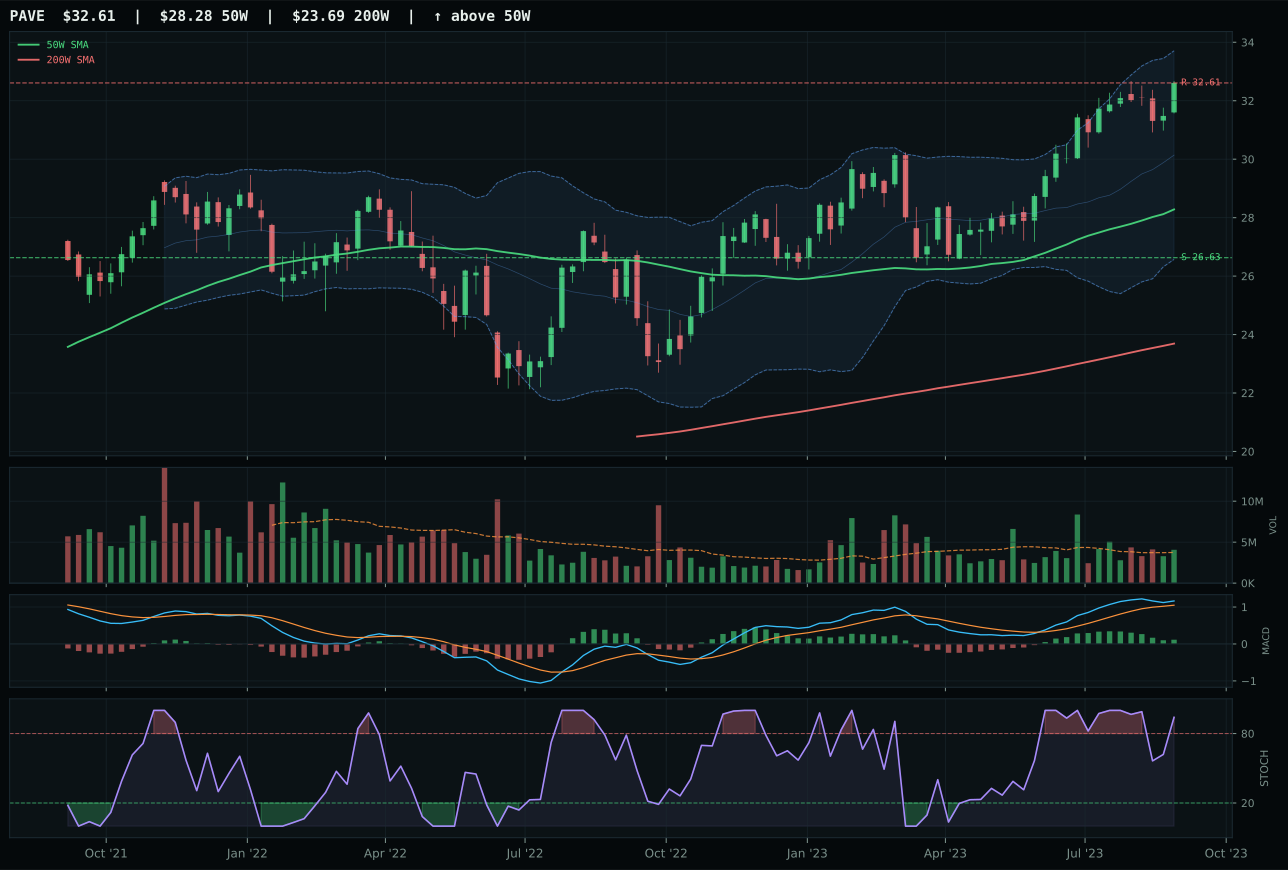
PAVE has a vertical extension profile with 8.0% 13-week relative strength versus SPY.
A failed hold above support would weaken the setup.
Actionable but governed by invalidation levels.
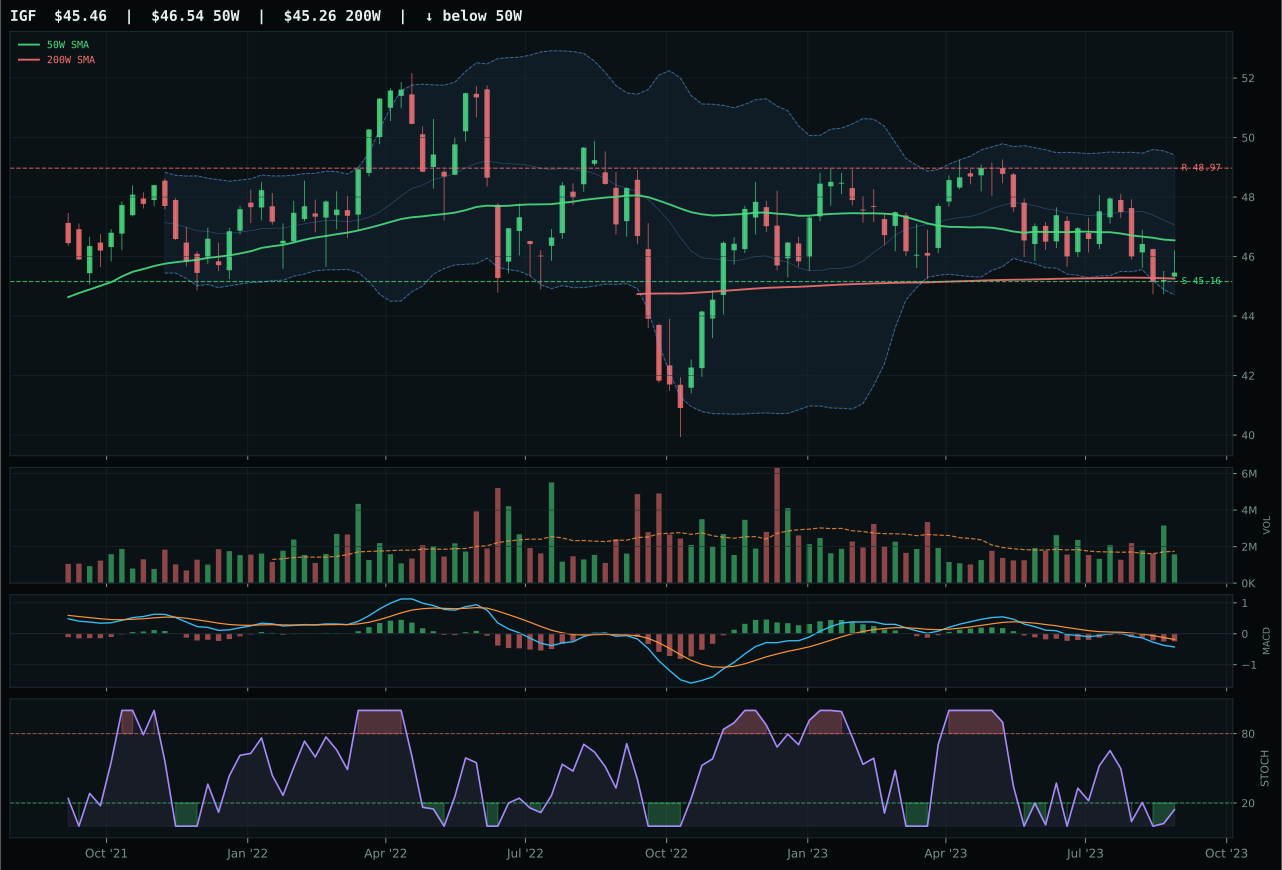
IGF has a pullback into support profile with -8.8% 13-week relative strength versus SPY.
A failed hold above support would weaken the setup.
Actionable but governed by invalidation levels.
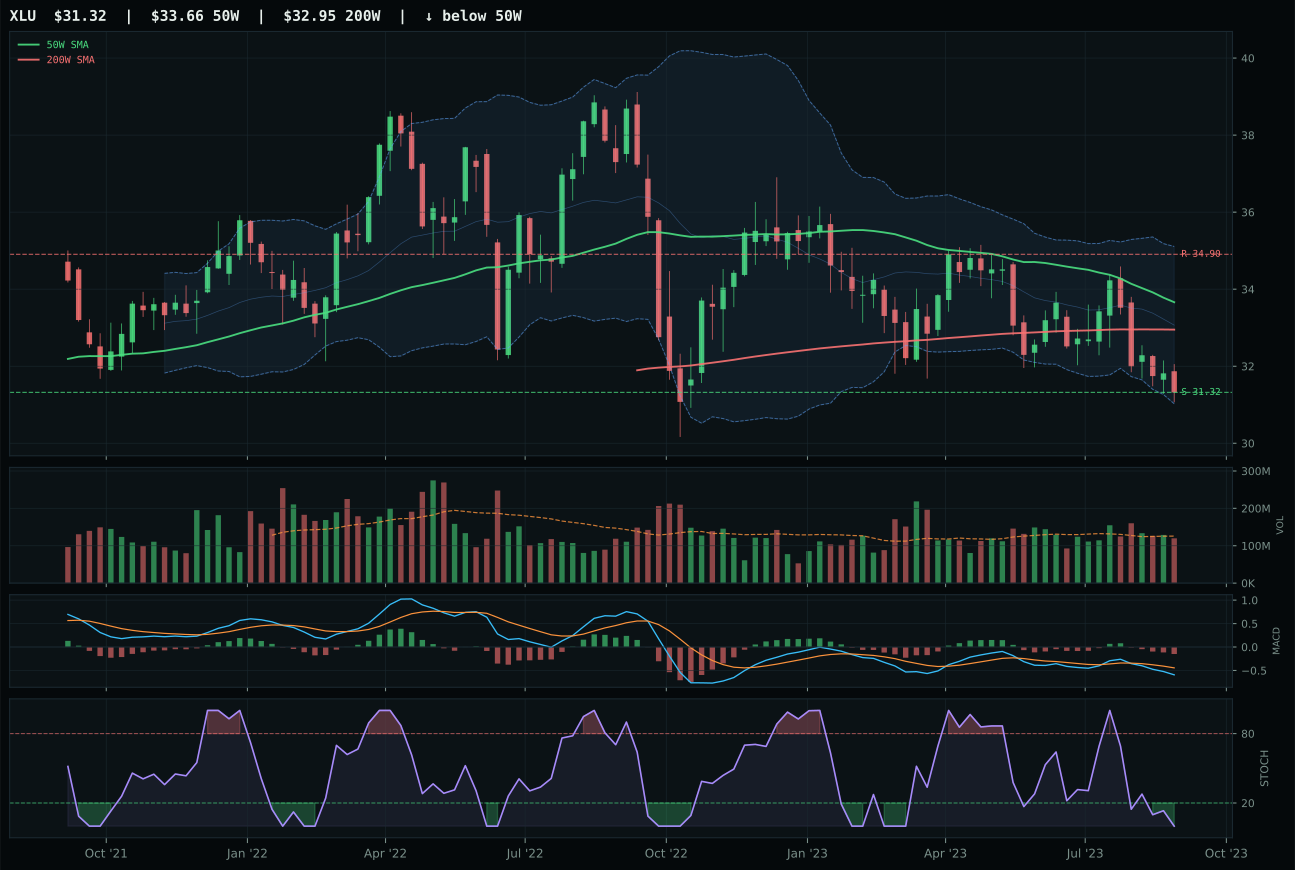
XLU has a pullback into support profile with -9.2% 13-week relative strength versus SPY.
A failed hold above support would weaken the setup.
Actionable but governed by invalidation levels.
PAVE wins the infrastructure category decisively over IGF through perfect trend score (100.0) combined with perfect momentum confirmation (100.0), though the timing entry is compromised by vertical extension at 15.3% from the 50W. Domestic infrastructure is showing the strongest relative strength in this category sleeve at 8.0% versus SPY, and category-relative strength of 16.8% is dominant—infrastructure capex is clearly winning against global infrastructure income (IGF at -8.8% RS/SPY) and utilities (XLU at -9.2%). PAVE's MACD is bullish but flattening, which is appropriate for an extended position; stochastic RSI is overbought rolling over at 0.94, signaling mature strength. The 13.5% 13W return and 1.8% 4W return show sustained accumulation. IGF's bearish/weakening MACD and oversold stochastic are clear disconfirmations; the global infrastructure narrative has deteriorated while domestic infrastructure capex accelerates.
Utilities & Infrastructure earns 5% allocation in tier-2, positioned lower than energy or metals by score at 32.2. Category macro fit is neutral to mildly negative at 43.0/100, with inflation pressure acting as a headwind at -6 points and liquidity stress at -3 points. Late-Cycle Reflation provides a modest +4 boost, but this is not a category riding macro tailwinds. PAVE's technical evidence of 60.1 is above the median, and the perfect trend and momentum confirmation scores are genuinely impressive—this is an active accumulation story. The 15.3% extension and 22.0 timing score reveal that entry risk is now material; buyers at this level are betting on infrastructure capex persistence through the reflation cycle. The allocation is justified by conviction in the capex secular cycle, not by macro regime fit. Hold the 5% but understand this is a secular-theme bet rather than a macro-regime bet. If inflation pressure were to intensify or if PAVE breaks below support at 26.63 on rising volume, reduce the allocation to zero; the category only works in environments where capex demand exceeds cost inflation, and that environment is eroding as interest rates normalize.
Precious Metals — GLD
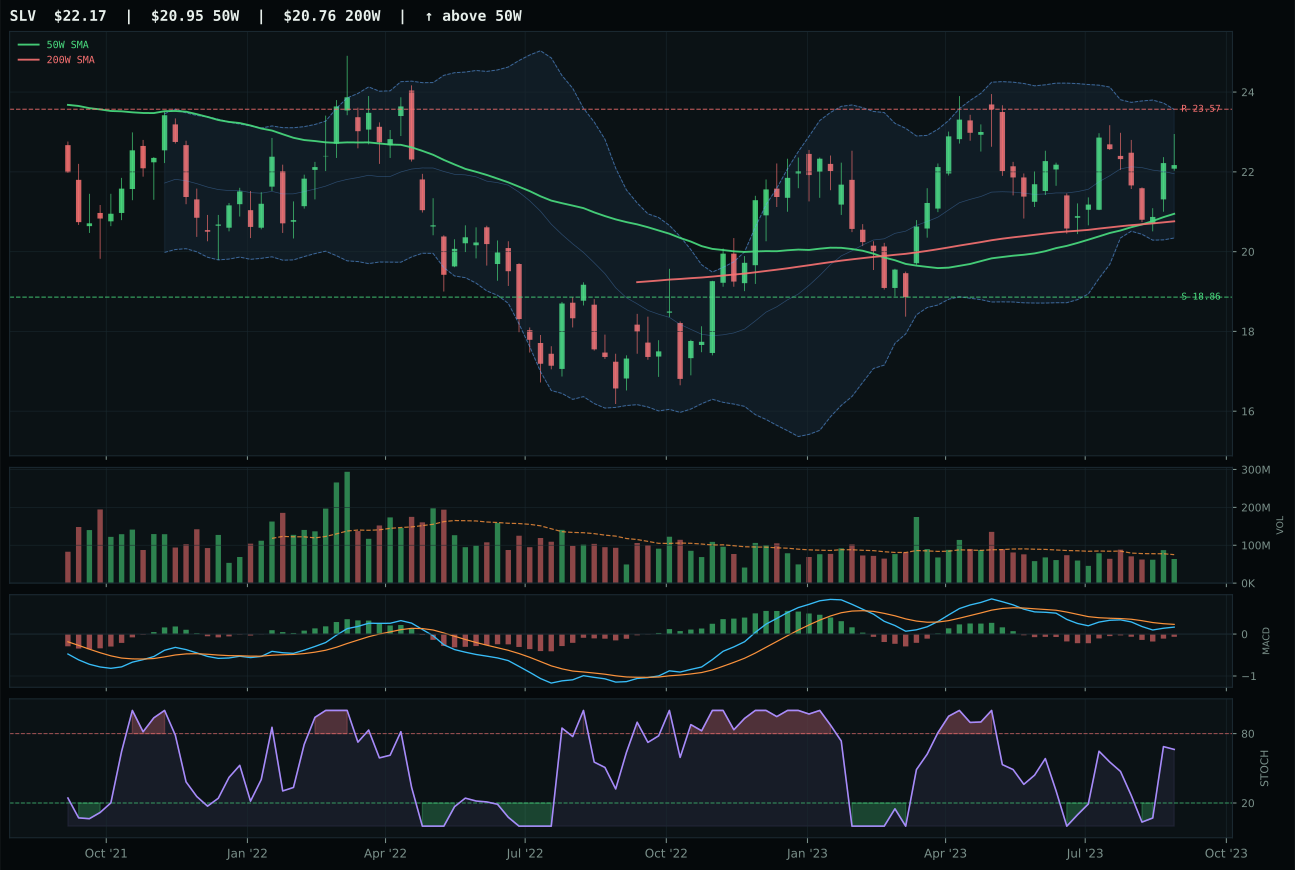
SLV has a neutral structure profile with -3.2% 13-week relative strength versus SPY.
A failed hold above support would weaken the setup.
Actionable but governed by invalidation levels.
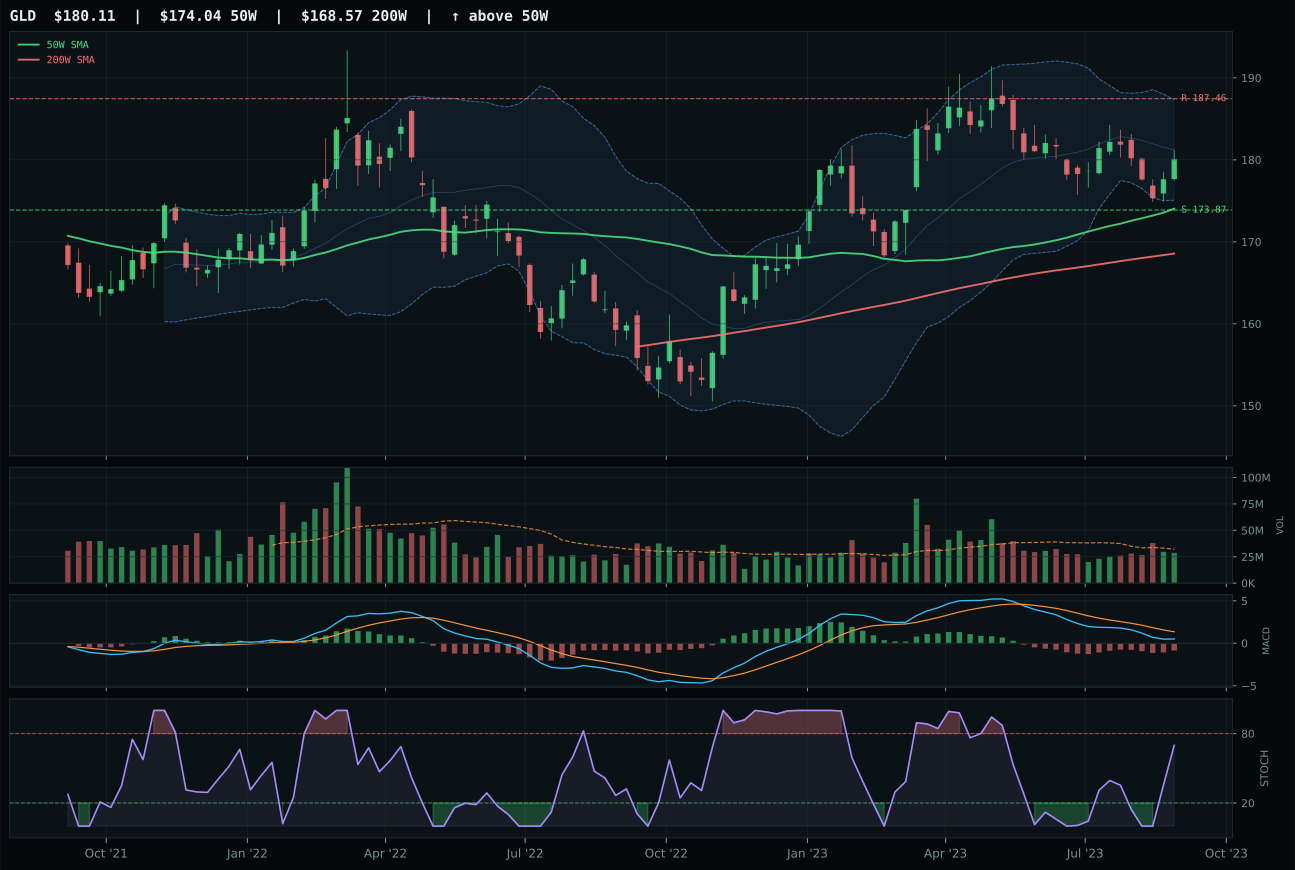
GLD has a pullback into support profile with -6.0% 13-week relative strength versus SPY.
A failed hold above support would weaken the setup.
Actionable but governed by invalidation levels.
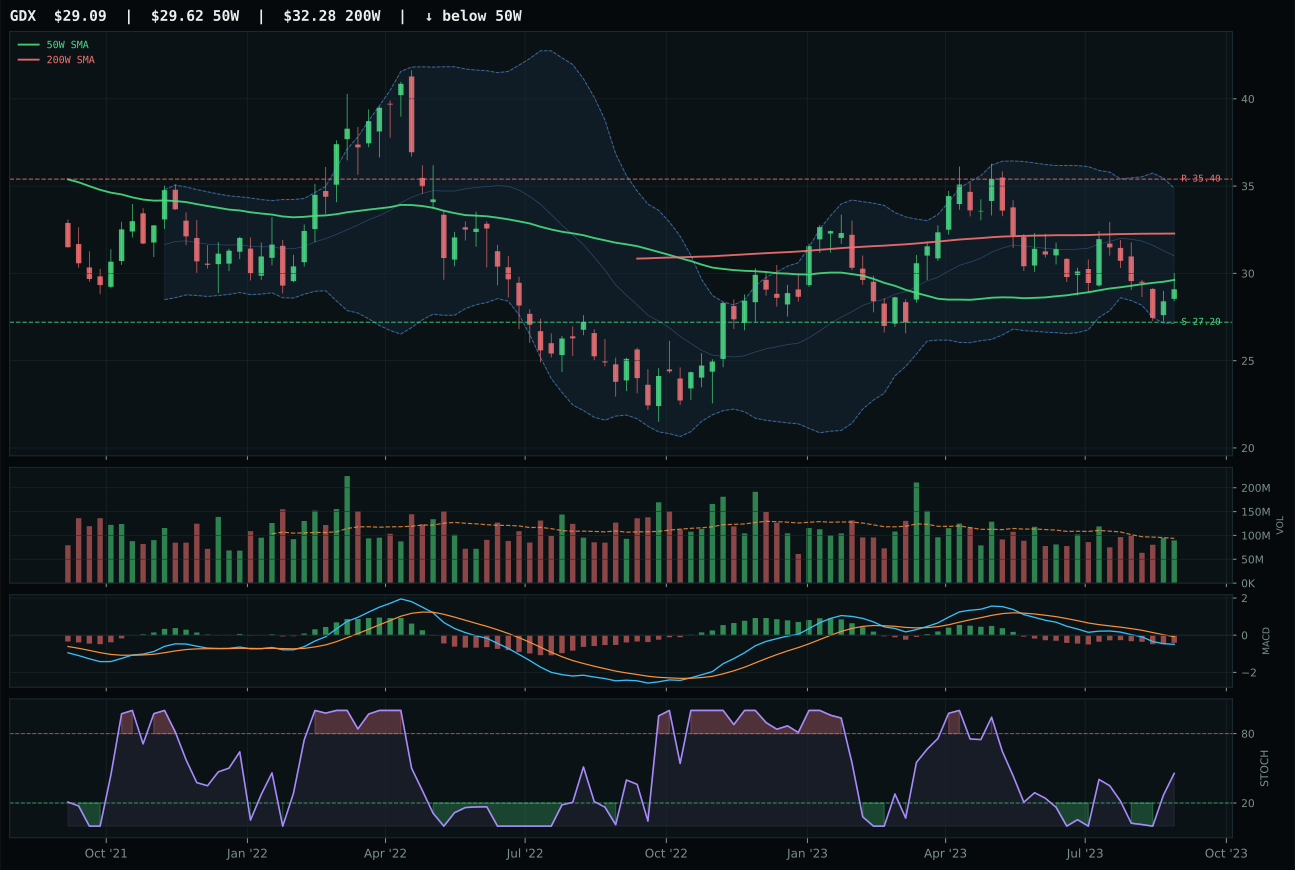
GDX has a compression near 50W profile with -12.8% 13-week relative strength versus SPY.
Extension and support failure are the main tactical risks.
Tracked, but not top-2 eligible because: structurally broken.
GLD wins the metals category decisively over SLV through superior structure and timing entry architecture, not momentum leadership. Gold sits 3.5% above the 50W in pullback-into-support formation, granting it a perfect 100.0 timing score—the setup is defined with support at 173.87 and resistance at 187.46, giving traders a clear invalidation level. SLV's timing score of 78 reflects neutral structure that lacks this precision entry definition. GLD's risk/reward of 64.7 beats SLV's 51.1 because the asymmetry is better: 3.6% downside to support versus 3.9% upside penalty for resistance, versus SLV's wider and less favorable asymmetry. Both instruments show bearish/weakening MACD and rising mid-zone stochastic RSI, meaning momentum is not yet confirmed, but GLD's -0.5% 13W return versus SLV's +2.2% matters less than structure; the gold position is offering a defined entry risk/reward, while silver is chasing from neutral territory without that mechanical precision.
Precious Metals receives 5% allocation in tier-2 despite a weak 30.5 final score, reflecting a category that is macro-driven but technically fragile. Category macro fit is only 46.0/100, with risk appetite positive penalizing metals at -4 points—a regime-specific headwind that will persist as long as late-cycle reflation continues. GLD's technical evidence is 45.8/100, barely above the minimum threshold, with momentum confirmation at only 25.3 and volume-price sponsorship at 40.1. This is not a category with institutional accumulation; it is a category held for hedging optionality in an uncertain regime. The 100.0 timing score from GLD's pullback-into-support setup is the only genuine technical argument for holding the position. The precious metals allocation would strengthen immediately if liquidity stress were to activate or if credit stress shifted from neutral to active; currently, risk appetite is the dominant descriptor and it is working against the category. Maintain the 5% sleeve as a tail-risk hedge, but promote metals to 10% only if GLD closes below support at 173.87 and then recovers with volume confirmation, or if macro descriptors shift to show early-stage liquidity or credit stress—signals that would make the hedging value material rather than theoretical.
AI — AIQ
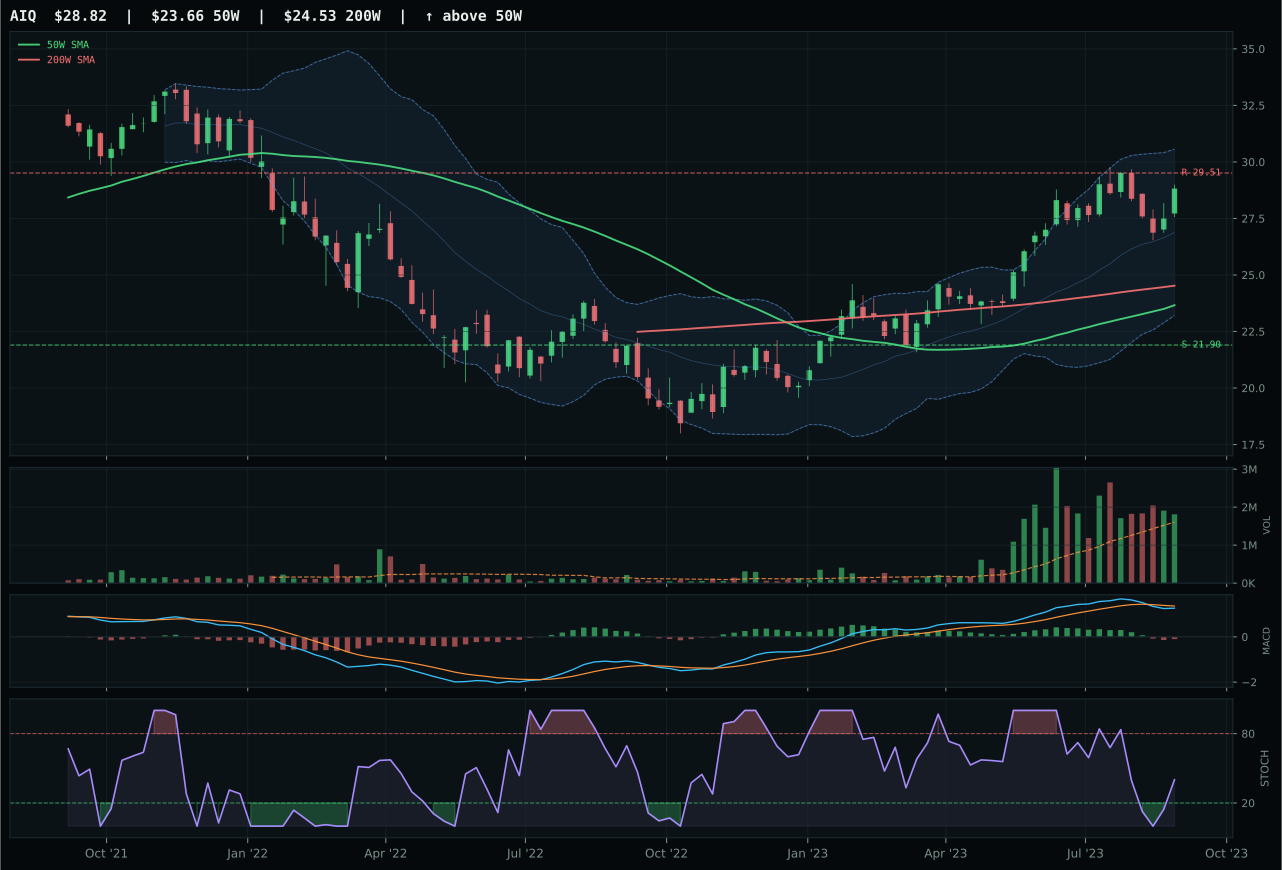
AIQ has a vertical extension profile with 2.3% 13-week relative strength versus SPY.
A failed hold above support would weaken the setup.
Actionable but governed by invalidation levels.
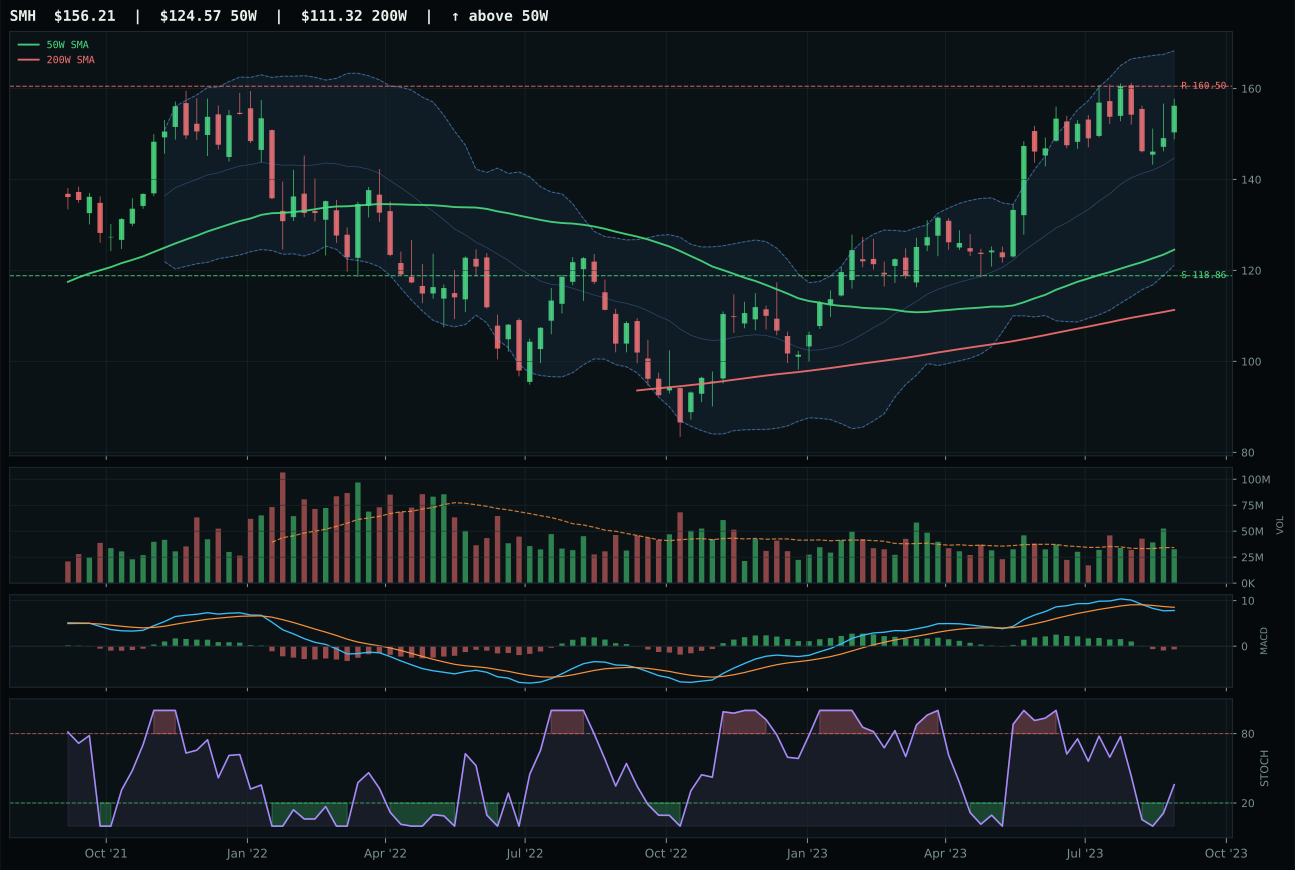
SMH has a vertical extension profile with 1.5% 13-week relative strength versus SPY.
A failed hold above support would weaken the setup.
Actionable but governed by invalidation levels.
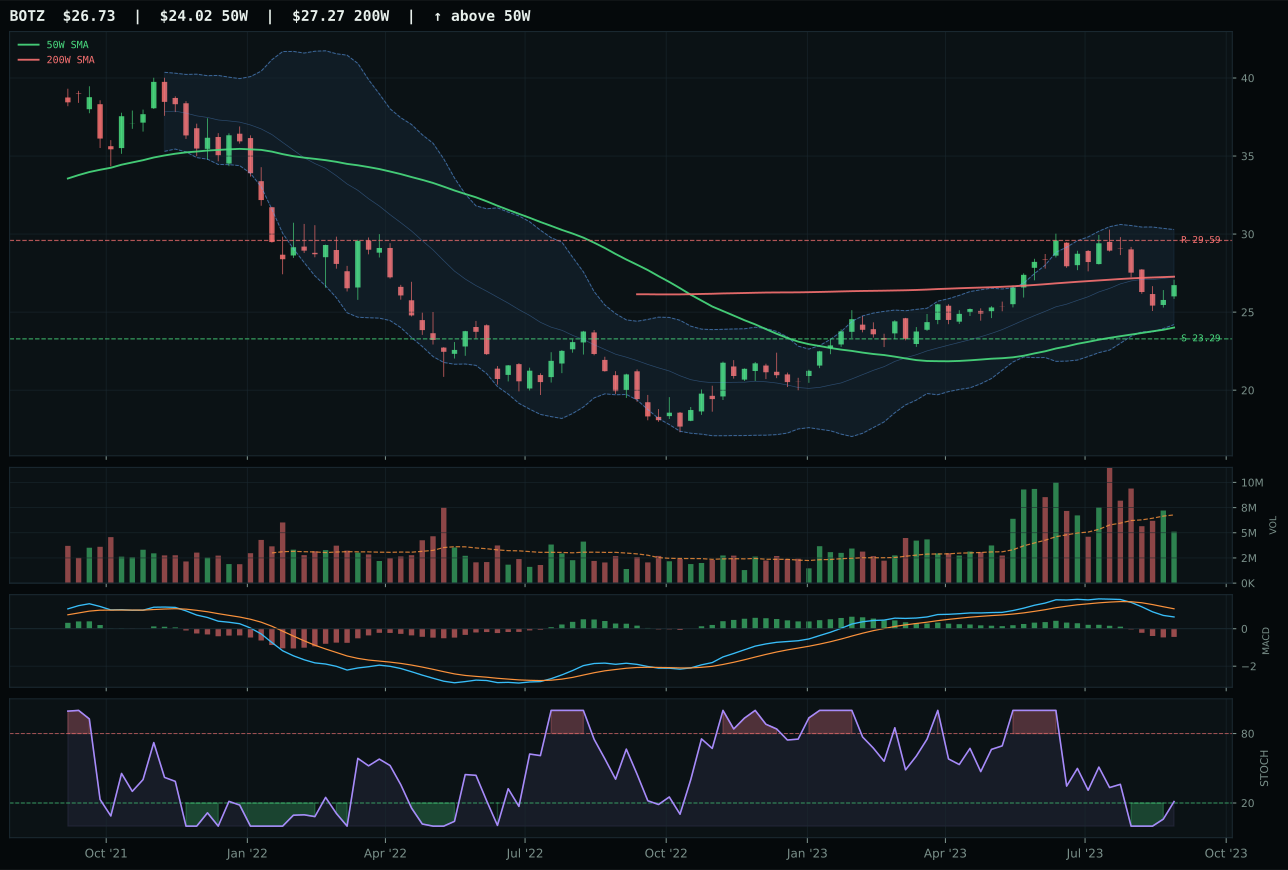
BOTZ has a neutral structure profile with -10.7% 13-week relative strength versus SPY.
A failed hold above support would weaken the setup.
Actionable but governed by invalidation levels.
AIQ wins a contested category with just 9.3 points over SMH by leveraging above-average volume participation and fractionally better category-relative strength of 0.9%. The AI software fund is extended at 21.8% above the 50W, which normally triggers a severe penalty for entry risk—and the timing score of 48 reflects that reality—but the 1.13x volume confirmation and SMH's neutral volume participation create a meaningful technical separation. AIQ's MACD is already bearish/weakening and stochastic RSI is only rising mid-zone at 0.40, meaning the momentum is not confirmed; however, the 7.8% 13-week return and 2.3% RS versus SPY show the move has institutional sponsorship. SMH's 1.5% RS versus SPY is respectable but insufficient when volume confirmation is absent, and its structure quality score of 70.1 trails AIQ's 74.0. Both setups are vertical extension with diminishing upside risk/reward, but AIQ's active buying at the top of the move is the only material technical advantage in an otherwise weak category.
AI receives 0% allocation this week, ranked outside the investable universe at 9th or 10th place. The category's 29.3 final score is dragged down by a macro fit of only 40.0/100 in a regime where liquidity stress is active at -12 points and credit stress is active at -8 points. Late-Cycle Reflation is providing no tailwind; risk appetite is +10 but insufficient to overcome the structural headwinds. The technical evidence score of 48.9 for the representative ETF (AIQ) is below the median across all 10 categories, and when combined with macro resistance, the category fails the eligibility screen entirely. Even AIQ's 7.8% 13-week return cannot offset the fact that price is now 21.8% extended from the 50W, the risk/reward sits at only 38.3 with downside of 31.6% to support and upside near zero, and MACD confirmation is deteriorating into the very liquidity stress that is currently penalizing growth exposure. This category would need to reset to support first, see MACD stabilize into bullish/improving territory, and liquidity stress to lift materially before earning any allocation.
Emerging Markets — INDA
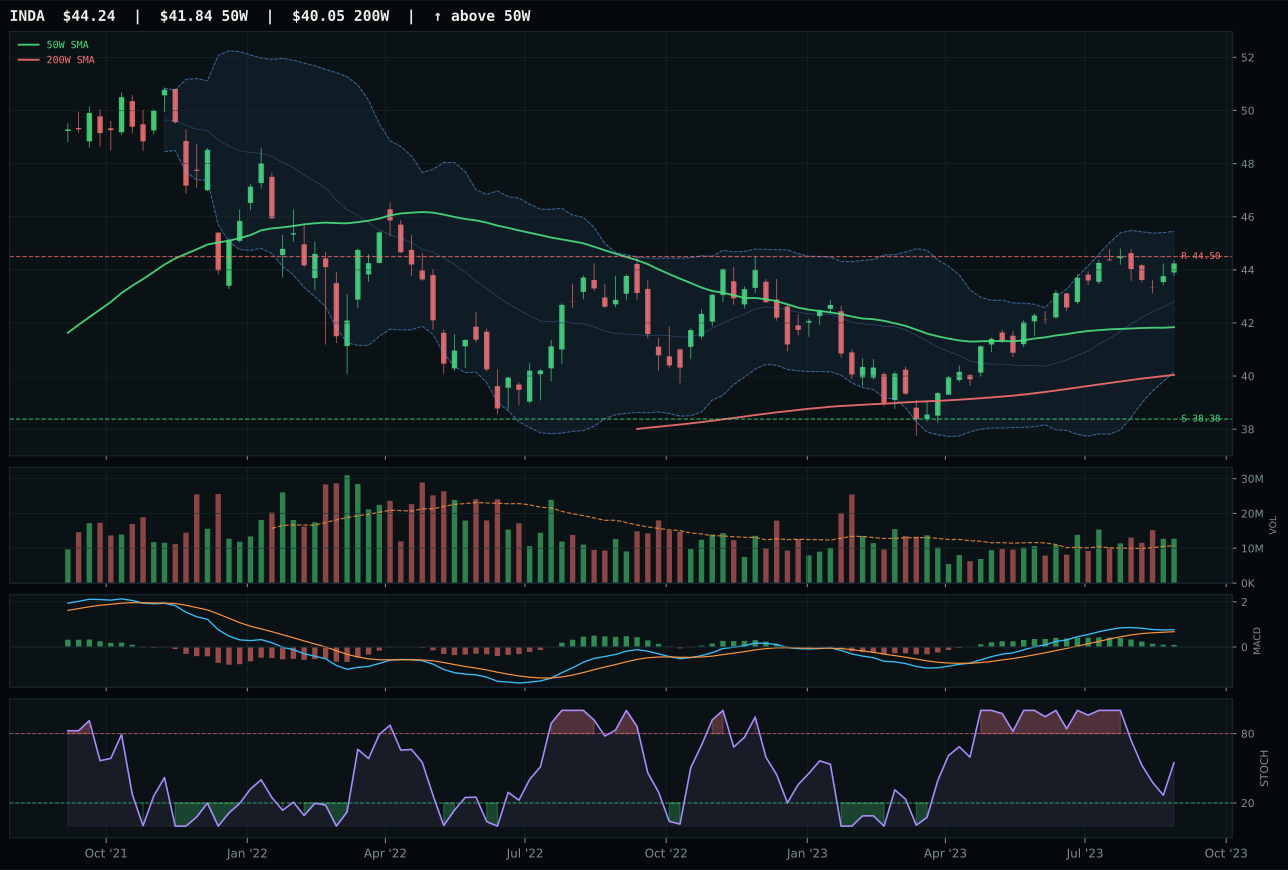
INDA has a neutral structure profile with -0.8% 13-week relative strength versus SPY.
A failed hold above support would weaken the setup.
Actionable but governed by invalidation levels.
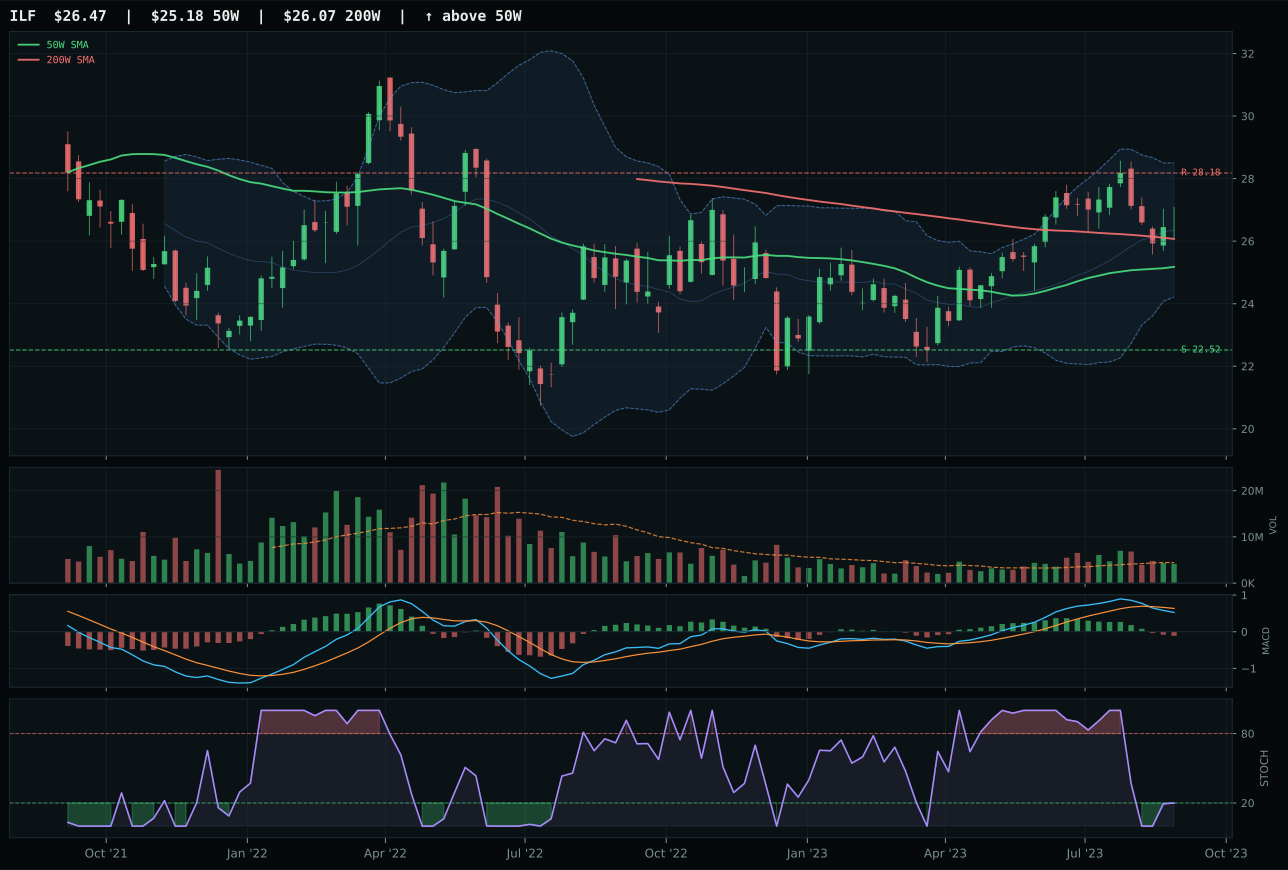
ILF has a neutral structure profile with -3.0% 13-week relative strength versus SPY.
A failed hold above support would weaken the setup.
Actionable but governed by invalidation levels.
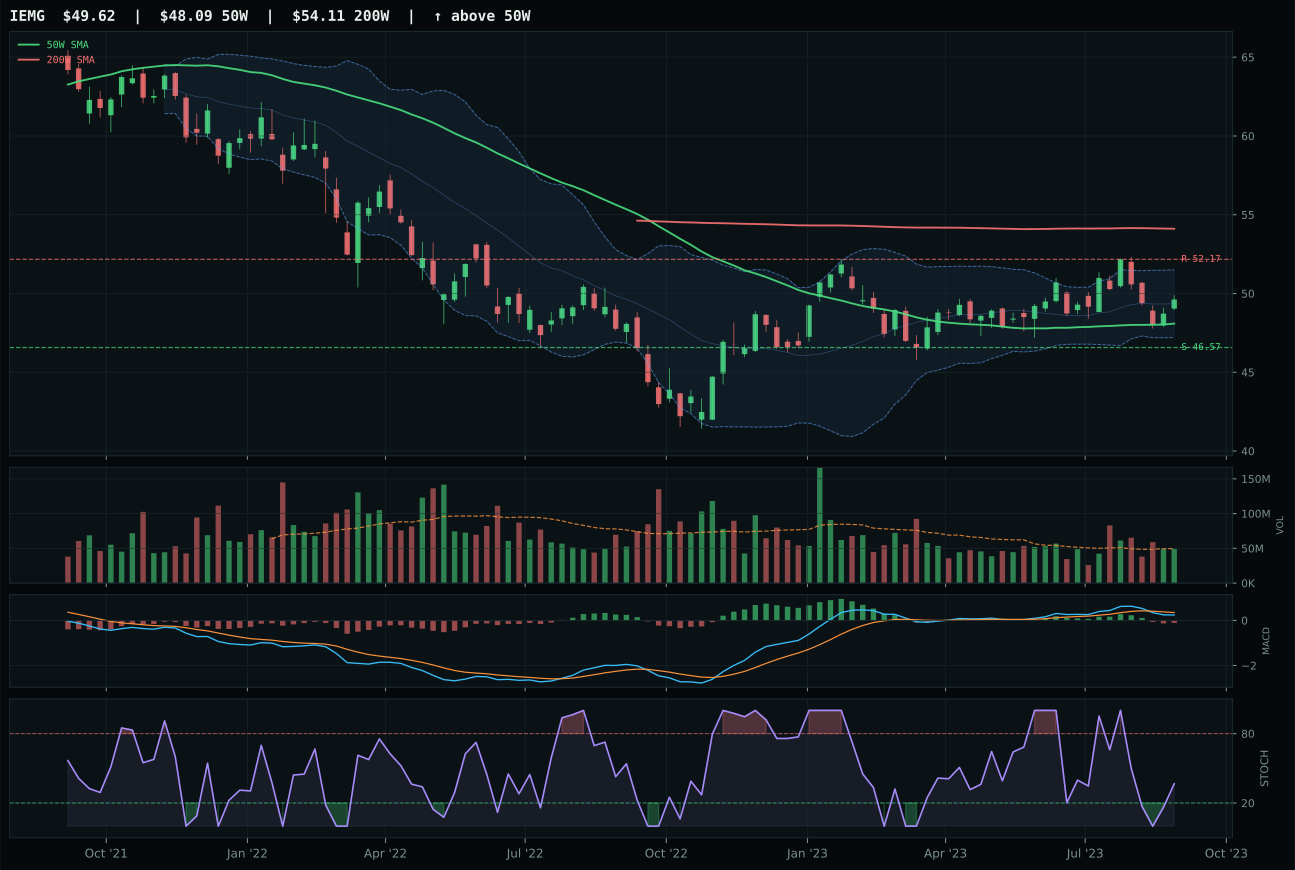
IEMG has a neutral structure profile with -4.6% 13-week relative strength versus SPY.
A failed hold above support would weaken the setup.
Actionable but governed by invalidation levels.
INDA wins the emerging markets category with an 11.9-point advantage over ILF through superior chart structure and cleaner MACD confirmation. India quality exposure sits at a neutral 5.7% distance from the 50W with near 52W high / extension Fib placement, presenting a compact entry architecture. INDA's MACD is bullish but flattening at 78.0 timing score, while ILF's MACD is already bearish/weakening, a material deterioration in momentum sponsorship. INDA's 79.3 structure score beats ILF's 74.1 because the compression ratio of 91.5 versus the comparable metric shows tighter, more organized consolidation. Both instruments show above-average volume participation in INDA's case (1.18x) versus neutral in ILF, and category-relative strength of 2.2% versus 0.0% reveals that Indian equities have modestly stronger institutional support. The 4.6% 13W return is gentle momentum, not aggressive chasing, which fits the setup's neutral structure profile perfectly.
Emerging Markets receives 0% allocation this week, ranked outside the investable universe. The category's 24.4 final score is fundamentally crippled by macro fit of only 38.0/100 in a regime where credit stress is active at -10 points and liquidity stress is active at -10 points—a double penalty that no technical strength can overcome. Late-Cycle Reflation is neutral for emerging markets; risk appetite is +8 but insufficient to offset the credit and liquidity headwinds. Even INDA's strong technical evidence of 73.7 cannot carry the category into allocation territory when macro conditions are so unfavorable. The 4.6% 13W return shows gentle momentum, but the -0.8% RS versus SPY reveals that emerging equities are lagging U.S. market leadership in this regime. This category would require a material shift in credit or liquidity stress indicators to earn allocation—specifically, activation of a risk-off environment where credit stress lifts or liquidity stress becomes a positive hedge. Currently, the category is a high-risk trade in a regime favoring real assets and energy, not emerging market equity beta. Revisit Emerging Markets only if credit stress or liquidity stress activate, indicating a defensive regime shift that would favor diversified emerging market exposure.