
2023-08-25
Informational purposes only. The content in this report, including allocations, analysis, and commentary, is provided solely for informational and educational purposes. It does not constitute financial advice, investment advice, trading advice, or any other type of advice. Past performance does not guarantee future results. Always conduct your own research and consult a qualified financial professional before making investment decisions.
Weekly Allocation
| Ticker | Category | Weight | Role |
|---|---|---|---|
| FBTC | 50% | Overlay | |
| XLE | Traditional Energy | 10% | Top-2 (10%) |
| URNM | Nuclear Energy | 10% | Top-2 (10%) |
| PICK | Industrial Metals | 5% | Tier-2 (5%) |
| MOO | Agriculture & Livestock | 5% | Tier-2 (5%) |
| ITA | Defense & Aerospace | 5% | Tier-2 (5%) |
| SLV | Precious Metals | 5% | Tier-2 (5%) |
| PAVE | Utilities & Infrastructure | 5% | Tier-2 (5%) |
| CIBR | Technology | 5% | Tier-2 (5%) |
Trade Instructions — Monday Open
Sell the tranche from 2023-07-28 (completing its 4-week hold). Buy the new tranche. Instructions show net portfolio changes — same-asset positions cancel, weight changes show the delta.
| Action | Ticker | Instruction |
|---|---|---|
| SELL | COPX | Sell 40% of COPX position (reduce 6.25% → 3.75%) |
| SELL | FCG | Sell entire FCG position (2.50% of portfolio) |
| SELL | AIQ | Sell 33% of AIQ position (reduce 3.75% → 2.50%) |
| SELL | IGV | Sell 50% of IGV position (reduce 2.50% → 1.25%) |
| SELL | ILF | Sell entire ILF position (1.25% of portfolio) |
| SELL | XLU | Sell 50% of XLU position (reduce 2.50% → 1.25%) |
| SELL | URA | Sell 33% of URA position (reduce 3.75% → 2.50%) |
| BUY | URNM | Buy URNM — 22.22% of freed cash (adds 2.50% to portfolio) |
| BUY | CIBR | Buy CIBR — 11.11% of freed cash (adds 1.25% to portfolio) |
| BUY | ITA | Buy ITA — 11.11% of freed cash (adds 1.25% to portfolio) |
| BUY | XLE | Buy XLE — 22.22% of freed cash (adds 2.50% to portfolio) |
| BUY | PICK | Buy PICK — 11.11% of freed cash (adds 1.25% to portfolio) |
| BUY | SLV | Buy SLV — 11.11% of freed cash (adds 1.25% to portfolio) |
| BUY | PAVE | Buy PAVE — 11.11% of freed cash (adds 1.25% to portfolio) |
Current Portfolio After Trade
Combined holdings across all 4 active tranches. Each tranche is 25% of the portfolio.
| Ticker | % of Portfolio | Weight Bar |
|---|---|---|
| FBTC | 50.00% | |
| URNM | 7.50% | |
| MOO | 5.00% | |
| XOP | 5.00% | |
| XLE | 5.00% | |
| CIBR | 3.75% | |
| ITA | 3.75% | |
| COPX | 3.75% | |
| AIQ | 2.50% | |
| URA | 2.50% | |
| IGV | 1.25% | |
| XLU | 1.25% | |
| SMH | 1.25% | |
| XAR | 1.25% | |
| INDA | 1.25% | |
| GLD | 1.25% | |
| PICK | 1.25% | |
| SLV | 1.25% | |
| PAVE | 1.25% |
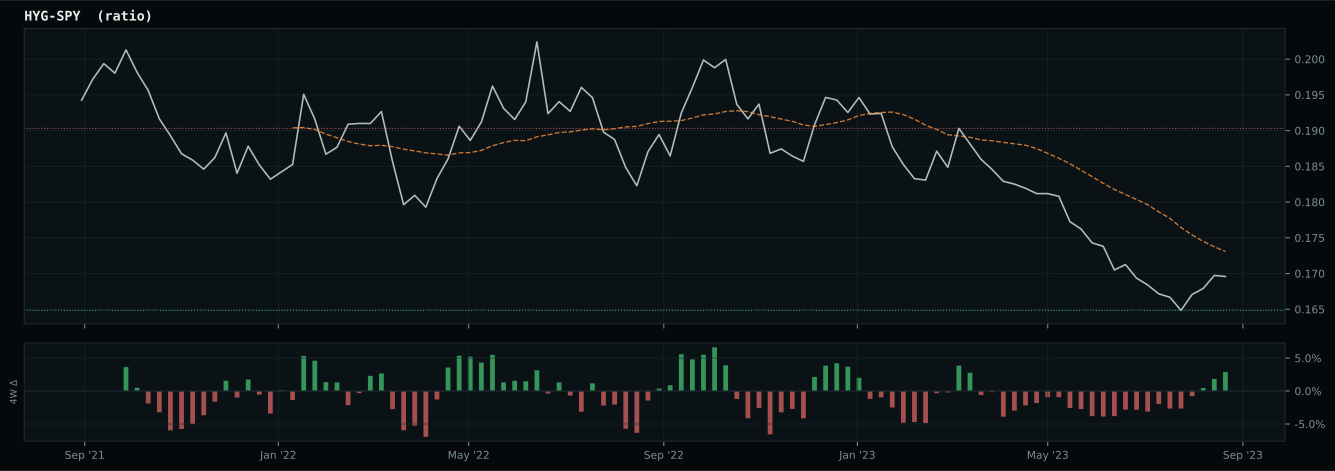
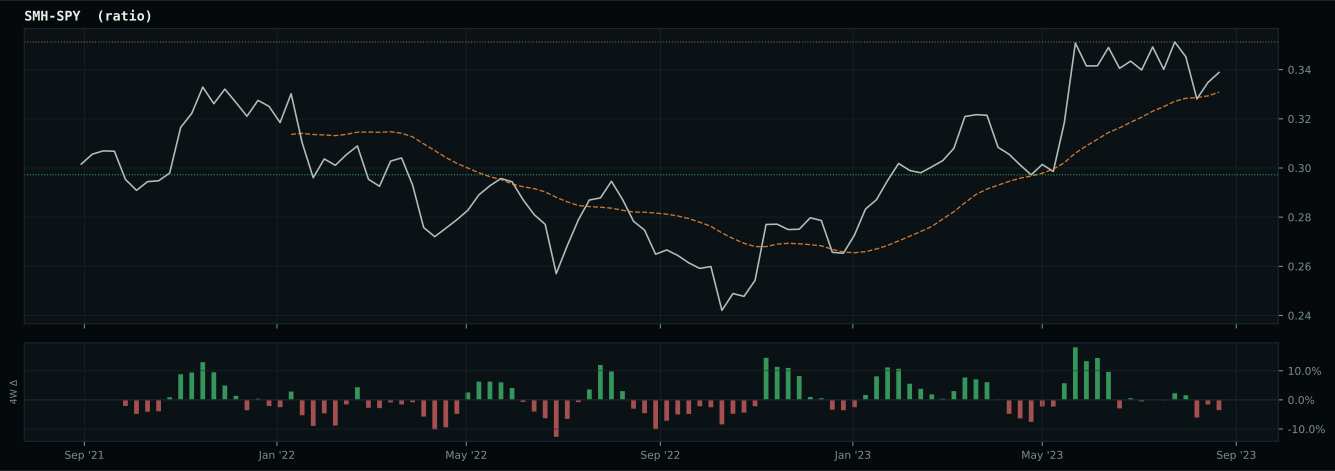
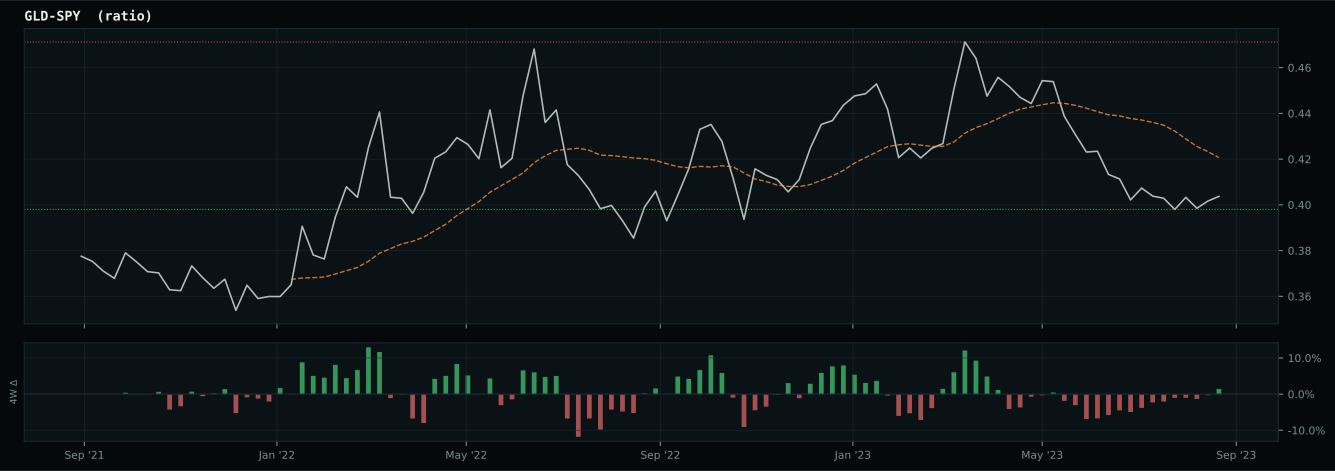
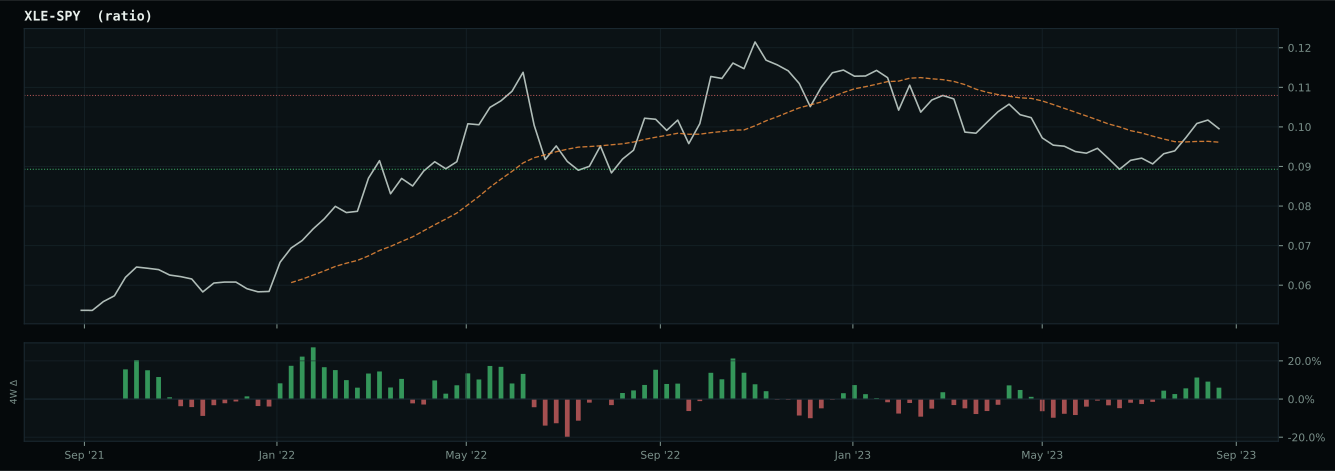
Macro Regime — Late-Cycle Reflation
Macro Evidence Charts
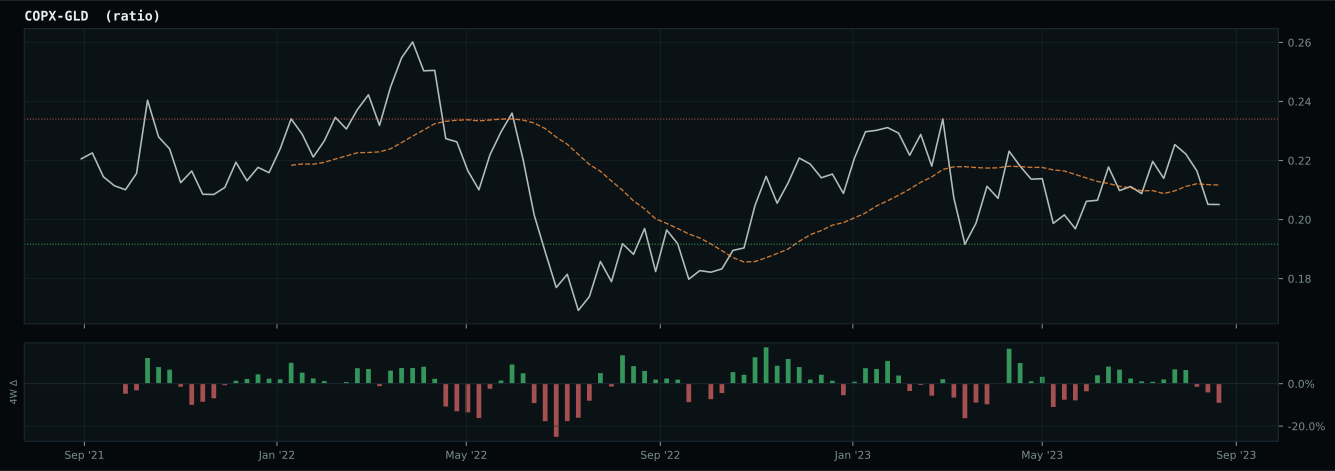
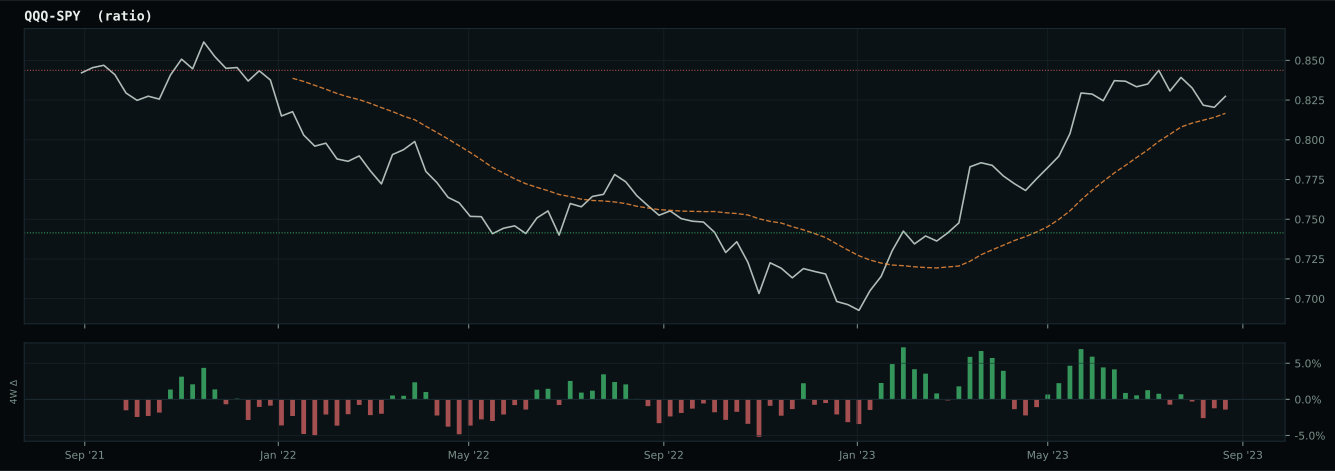
Market-implied signals behind the macro regime scores. Each ratio compares two assets; the direction and slope of the ratio is what the macro engine reads.
Crypto Regime — TrendBTC
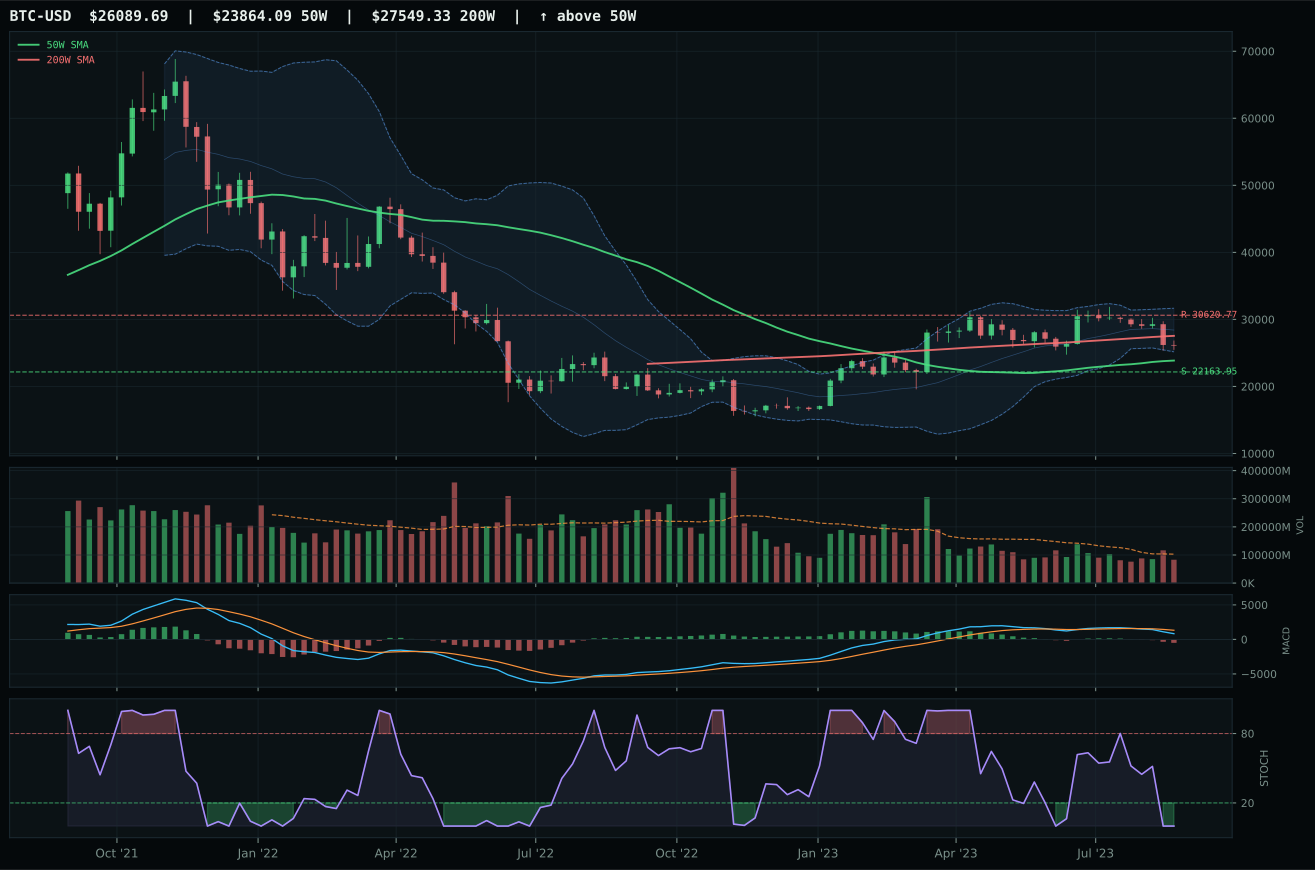
post-touch structure is too wide to count as a range; max/min close ratio is 1.88
TrendBTC confirmed: 2 consecutive closes above rising/flat 50W SMA
one or more available conditions failed
Category Rankings
| Rank | Category | Winner | Score | Alloc | 4W Ret | Peers (4W) |
|---|---|---|---|---|---|---|
| 1 | Traditional Energy | XLE | 82.4 | 20% | +1.42% | FCG -3.7% · XOP -2.6% |
| 2 | Nuclear Energy | URNM | 71.2 | 20% | +21.08% | URA +14.4% · NLR +10.9% |
| 3 | Industrial Metals | PICK | 46.3 | 10% | +0.77% | COPX -1.9% · REMX -5.3% |
| 4 | Agriculture & Livestock | MOO | 45.5 | 10% | -3.74% | VEGI -2.4% · WEAT -4.7% |
| 5 | Defense & Aerospace | ITA | 37.1 | 10% | -7.24% | XAR -7.2% · ROKT -6.4% |
| 6 | Precious Metals | SLV | 33.0 | 10% | -2.72% | GLD +0.4% · GDX +0.8% |
| 7 | Utilities & Infrastructure | PAVE | 29.5 | 10% | -4.87% | IGF -1.7% · XLU -1.3% |
| 8 | Technology | CIBR | 25.0 | 10% | -0.96% | IGV -2.6% · XLK -3.5% |
| 9 | AI | AIQ | 23.9 | 0% | -3.39% | SMH -6.0% · BOTZ -6.2% |
| 10 | Emerging Markets | INDA | 19.5 | 0% | +1.37% | ILF -3.2% · IEMG -2.4% |
Traditional Energy — XLE
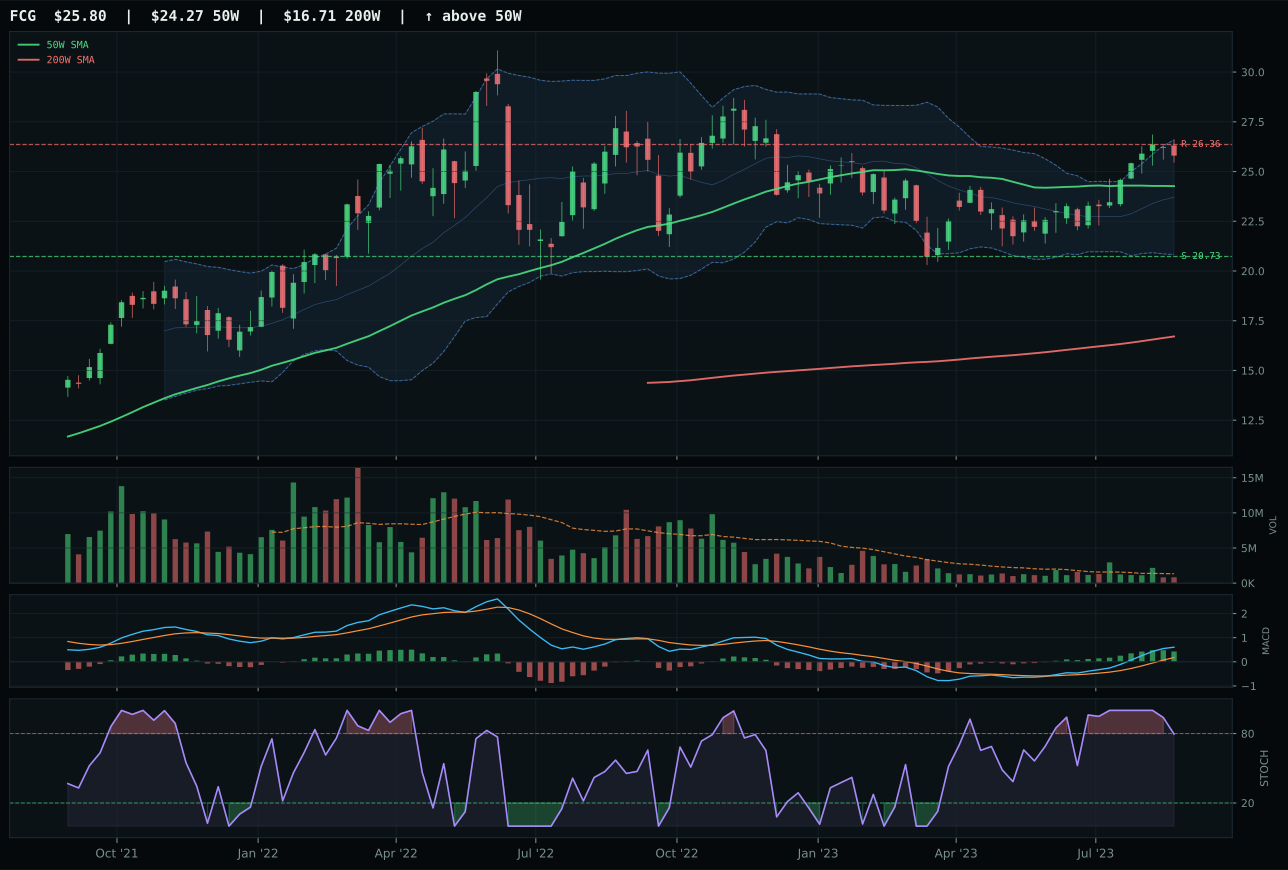
FCG has a neutral structure profile with 11.4% 13-week relative strength versus SPY.
A failed hold above support would weaken the setup.
Actionable but governed by invalidation levels.
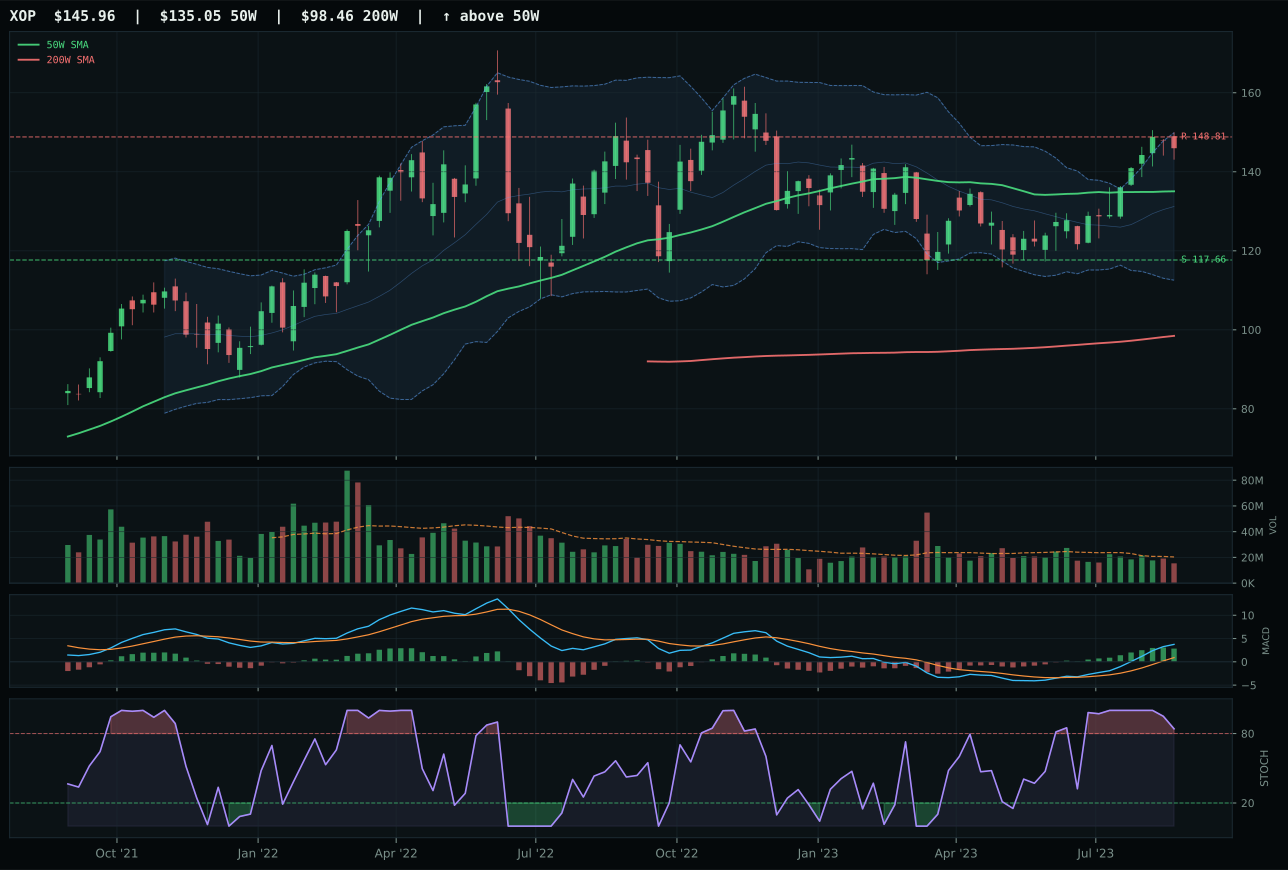
XOP has a neutral structure profile with 14.6% 13-week relative strength versus SPY.
A failed hold above support would weaken the setup.
Actionable but governed by invalidation levels.
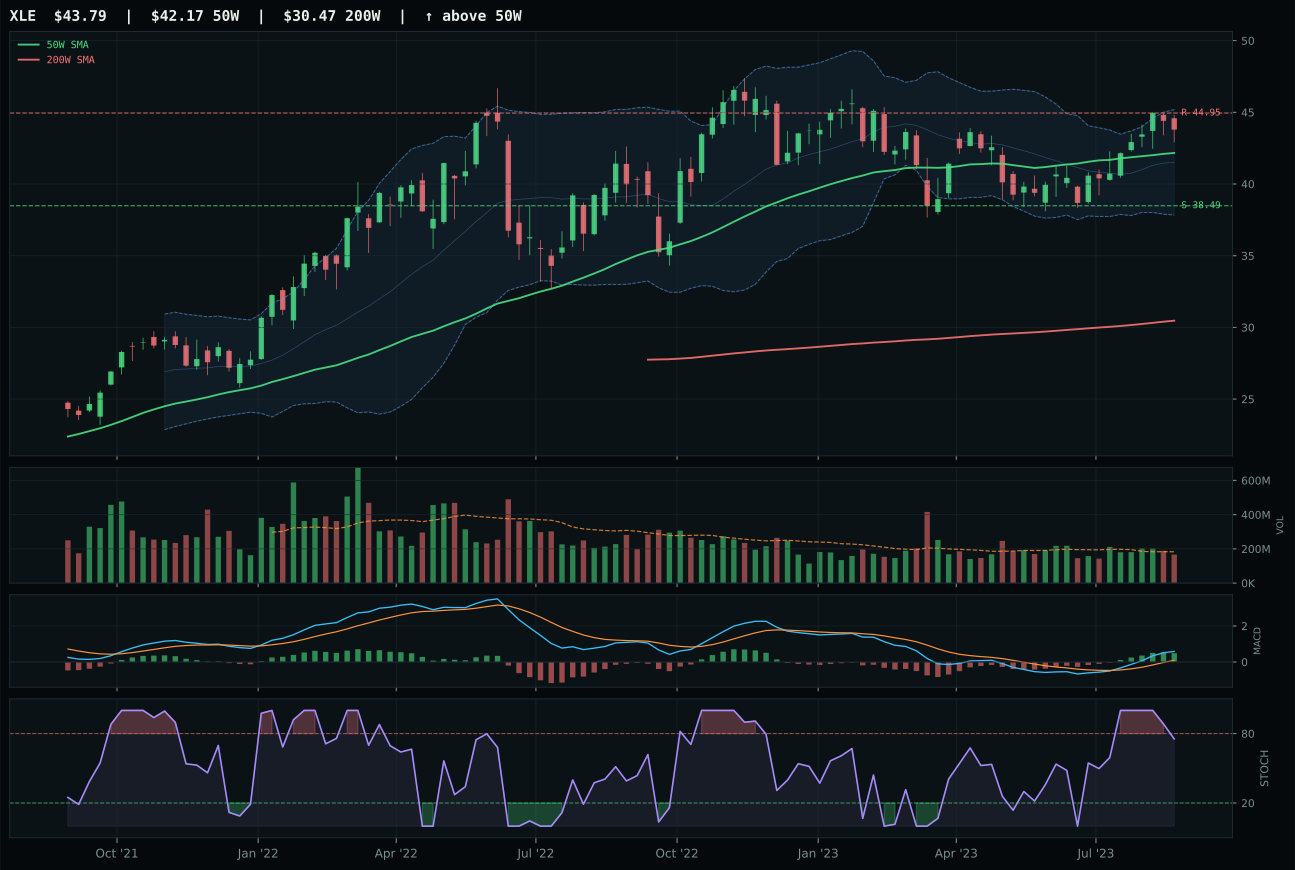
XLE has a neutral structure profile with 6.4% 13-week relative strength versus SPY.
A failed hold above support would weaken the setup.
Actionable but governed by invalidation levels.
XLE won the energy category decisively with a perfect 100.0/100 trend score and a 79.3/100 momentum confirmation that dominated the field. Price sits 3.9% above the 50W with bullish-and-improving MACD, stochastic RSI falling/neutral at 0.75—a setup that rewards patient entry rather than chase—and the 13W return of 11.2% with 6.4% SPY-relative strength confirms genuine institutional accumulation. Volume at 0.91x is neutral, not hot, yet that discipline has prevented XLE from rolling over into the extended-and-vulnerable posture that XOP displays. Risk-reward of 48.4/100 is constrained by proximity to 44.95 resistance (only 2.6% upside), but downside to 38.49 support offers 13.8% cushion. FCG's superior 13W return (16.1%) and RS (11.4%) are offset by weaker timing (75.0 vs 90.0) and thin-participation volume; XOP's overbought roll-over and thin participation created a deteriorating momentum setup despite its equity-relative strength leadership.
Traditional Energy earns 10% as a top-2 overweight allocation, one of the two largest positions in the portfolio. The final 82.4 category score reflects a macro regime perfectly aligned with energy strength: late-cycle reflation is explicitly beneficial (+12), energy scarcity is active (+16), inflation pressure is hot (+10), supply shortage is active (+9), and real asset sponsorship is strong (+7). This combination yields a 90.0/100 macro fit—the second-strongest in the portfolio—directly justifying the top-2 rank. XLE's technical evidence of 79.5/100 is exceptionally solid: trend 100, timing 90, momentum 79, volume-price confirmation 70.8. The allocation reflects both technical strength and macro alignment; energy is not just performing but is positioned to continue performing as real assets lead the cycle. The 10% commitment represents maximum conviction within the current tier structure: energy's combination of momentum confirmation (79.3/100), pricing power inflation, and supply constraints makes it the most reliable performer in a late-cycle, inflationary environment.
Nuclear Energy — URNM
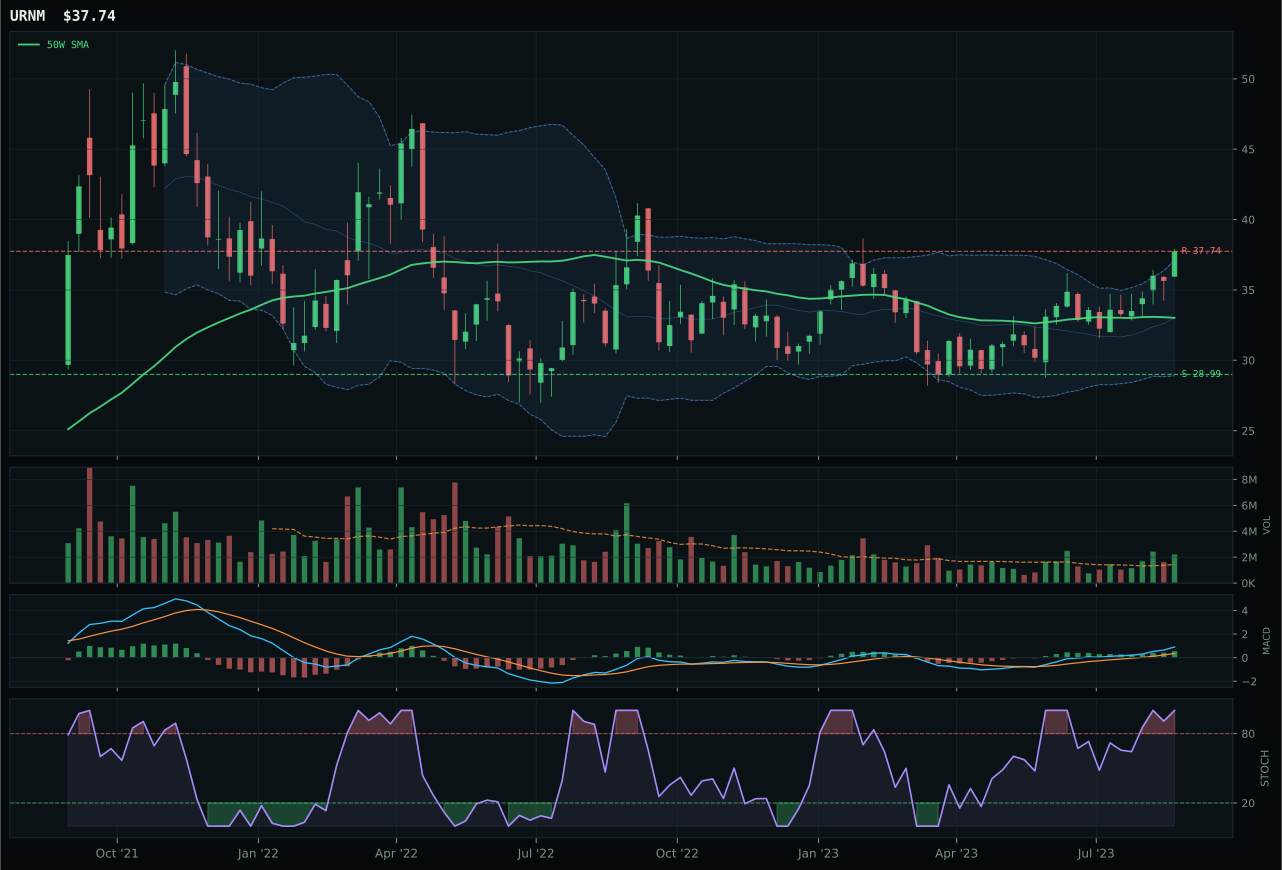
URNM has a neutral structure profile with 20.3% 13-week relative strength versus SPY.
A failed hold above support would weaken the setup.
Actionable but governed by invalidation levels.
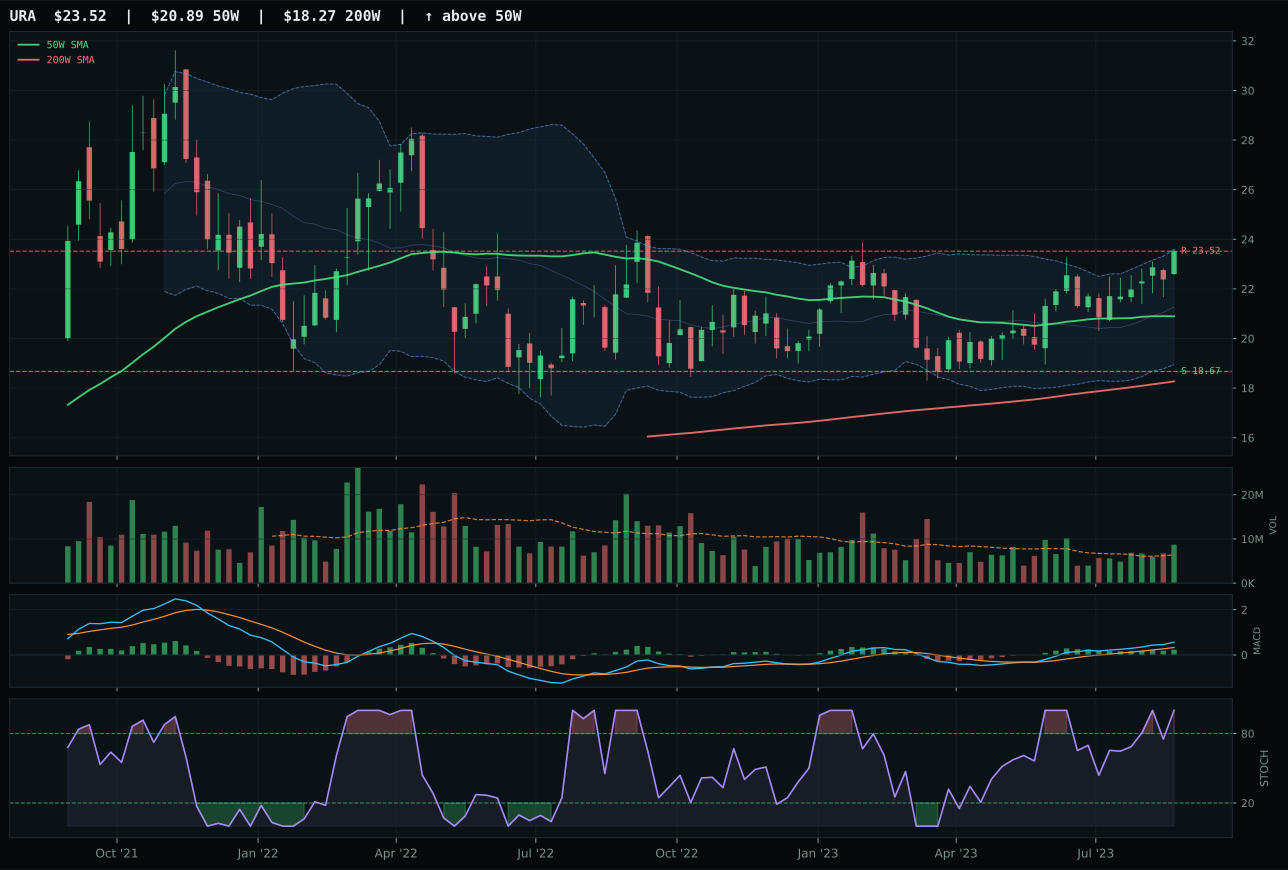
URA has a neutral structure profile with 14.3% 13-week relative strength versus SPY.
A failed hold above support would weaken the setup.
Actionable but governed by invalidation levels.
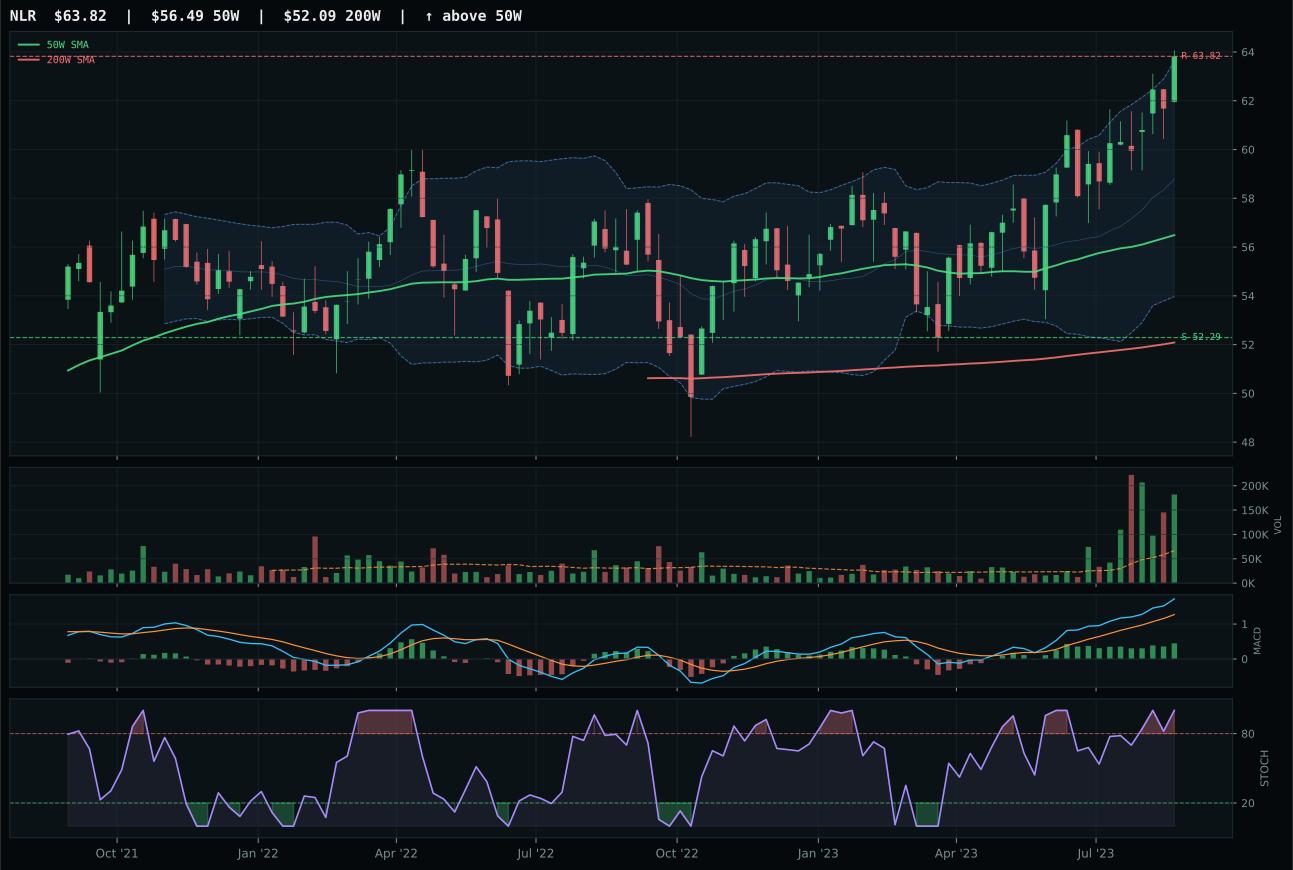
NLR has a neutral structure profile with 11.8% 13-week relative strength versus SPY.
A failed hold above support would weaken the setup.
Tracked, but not top-2 eligible because: .
URNM captured the nuclear category through overwhelming momentum confirmation (100.0/100) and volume-price sponsorship (92.3/100), marking it as the only name where institutional accumulation is visibly accelerating rather than merely holding. The 25.0% 13W return and 20.3% SPY-relative strength are benchmarks of genuine conviction buying; 4W return of 12.7% proves the move is not stale. At 14.3% extended above the 50W, URNM is at entry risk on distance, but the overbought-momentum stochastic RSI of 1.00 combined with bullish-and-improving MACD indicates buyers are still present, not exhausted. Volume of 1.54x average shows accumulation-grade participation. URA's 90.8/100 technical score is superior on breadth grounds, but its 0.0% category-relative strength and above-average (not accumulation) volume reveal distribution rather than conviction. URNM's 100.0/100 technical evidence and 6.0% category-relative strength decisive spread wins despite slightly weaker structure (80.9 vs 77.5 is reversed in URNM's favor).
Nuclear Energy earns 10% as the second top-2 position, ranked at 71.2 with a 64.0/100 macro fit driven by late-cycle reflation (+7), active energy scarcity (+9), real asset sponsorship (+7), and modest inflation pressure (+3). The top-2 allocation is justified by URNM's near-perfect technical evidence of 100.0/100—the only perfect trend/relative strength/volume score in the category universe—despite a weaker timing score reflecting the extension from recent entry points. This is a momentum allocation: URNM's 25.0% 13W return and 20.3% RS versus SPY place it in the strongest performing quartile of all 30 holdings, and the accumulation-range volume confirms that institutional capital is actively rotating into uranium. The allocation is not cheap: price is extended, stochastic RSI is overbought, and timing is only 67.0. But the combination of 1.54x volume participation and 93.7 persistence means this is a trending market, not a bubble about to pop. Energy (both Traditional and Nuclear) represents 20% of the portfolio—a top-heavy bet on scarcity and inflation—which is appropriate given the late-cycle regime and descriptor profile.
Industrial Metals — PICK
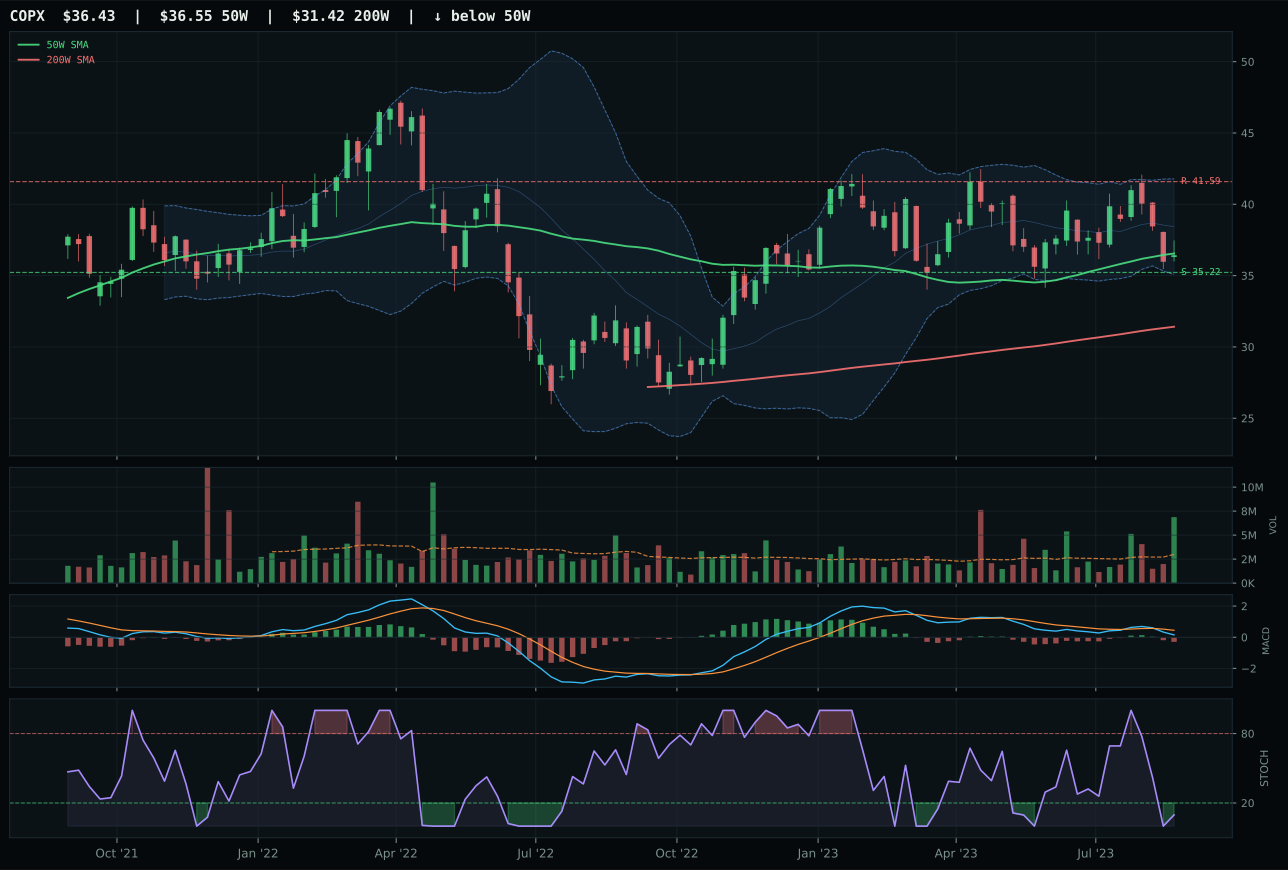
COPX has a pullback into support profile with -2.5% 13-week relative strength versus SPY.
A failed hold above support would weaken the setup.
Actionable but governed by invalidation levels.
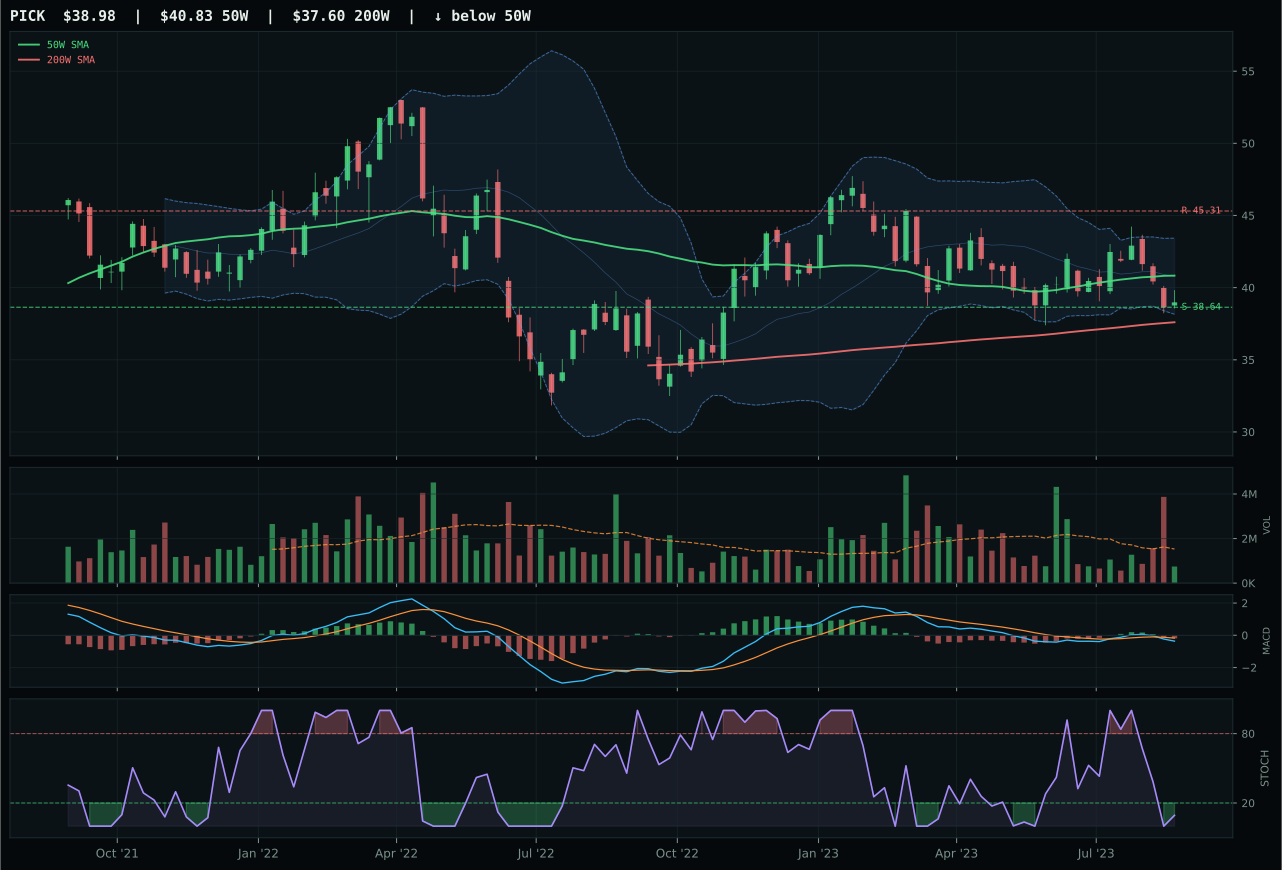
PICK has a pullback into support profile with -4.2% 13-week relative strength versus SPY.
A failed hold above support would weaken the setup.
Actionable but governed by invalidation levels.
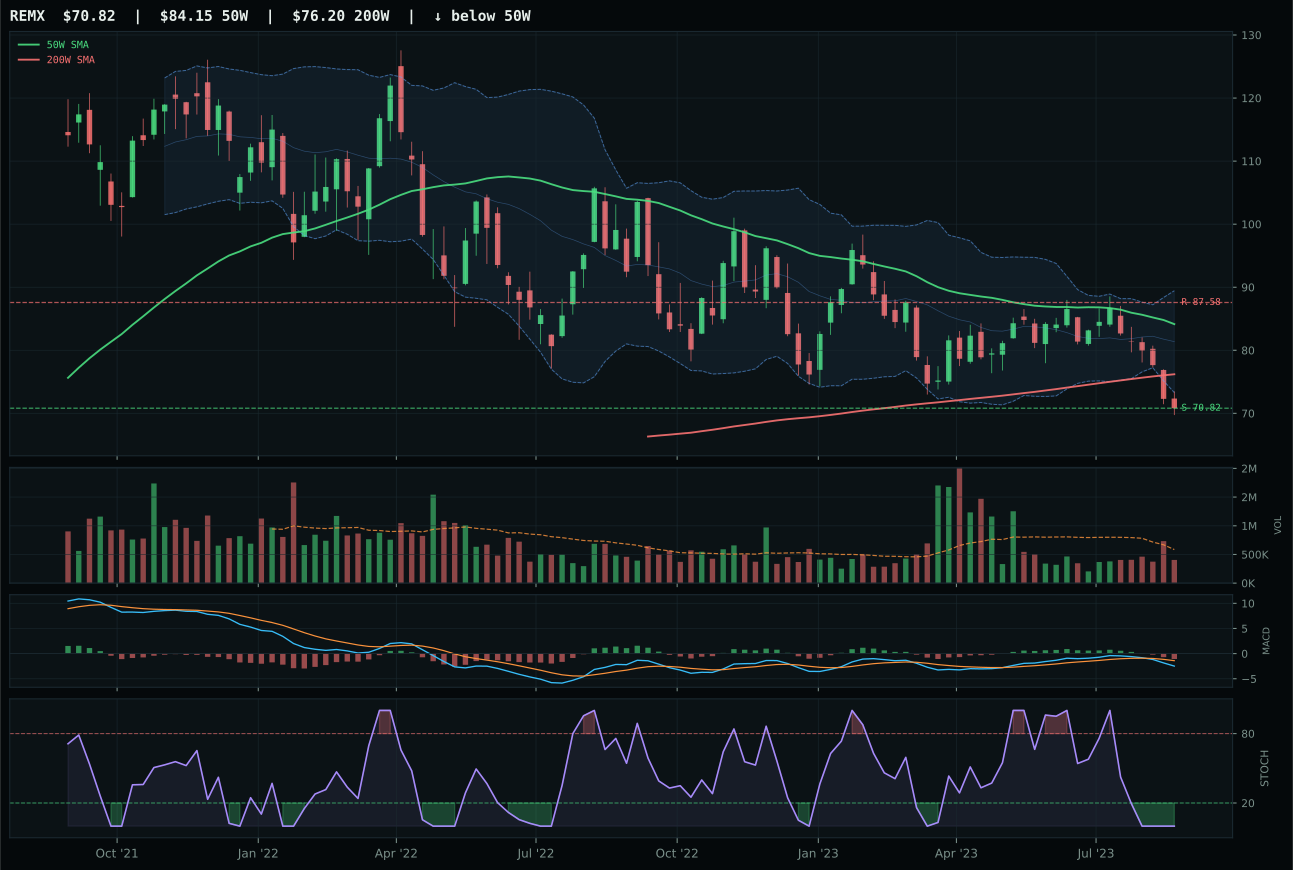
REMX has a pullback into support profile with -17.5% 13-week relative strength versus SPY.
A failed hold above support would weaken the setup.
Actionable but governed by invalidation levels.
PICK edged COPX by posting a perfect 100.0/100 timing score—sitting -4.5% below the 50W at Fib 0.618 (middle retracement/decision zone)—versus COPX's 95.0/100, a small but meaningful advantage in a chart that offers extreme risk-reward (98.0/100). Price at 38.32 validates the setup: just 0.9% from support, positioning for asymmetric recovery if accumulation resumes. COPX's superior technical evidence (47.6/100 vs PICK's 34.7/100) and stronger volume confirmation (accumulation vs thin participation) would normally prevail, but timing and risk-reward override technical breadth in mean-reversion setups. PICK's 0.5% 13W return and -4.2% SPY-relative weakness understate the opportunity; the category-relative strength of 0.0% reflects neutral distribution pressure. The -10.0-point deficit versus COPX on technical grounds was more than recovered through setup quality and macro fit (59.0%).
Industrial Metals holds 5% as a tier-2 position, supported by a strong 46.3 category score and a very bullish 75.0/100 macro fit driven by late-cycle reflation (+10), active metals scarcity (+14), commodity breadth positive (+10), and real asset sponsorship (+6). This is one of the most macro-supportive categories in the portfolio, yet PICK ranks only 9th or 10th overall because technical evidence is weak at 34.7/100—the oversold stochastic and wide discount to moving averages create inflection potential, but volume-price confirmation (28.4/100) and persistence (30.7/100) are among the lowest scores in the portfolio. The tier-2 allocation reflects a macro conviction play: metals scarcity and real asset sponsorship are powerful tailwinds, and PICK's extreme setup offers explosive upside if support at 38.64 holds. The category would move to top-2 only if volume begins accumulating at support and MACD bullish confirmation arrives—until then, it remains a high-conviction but technically fragile position.
Agriculture & Livestock — MOO
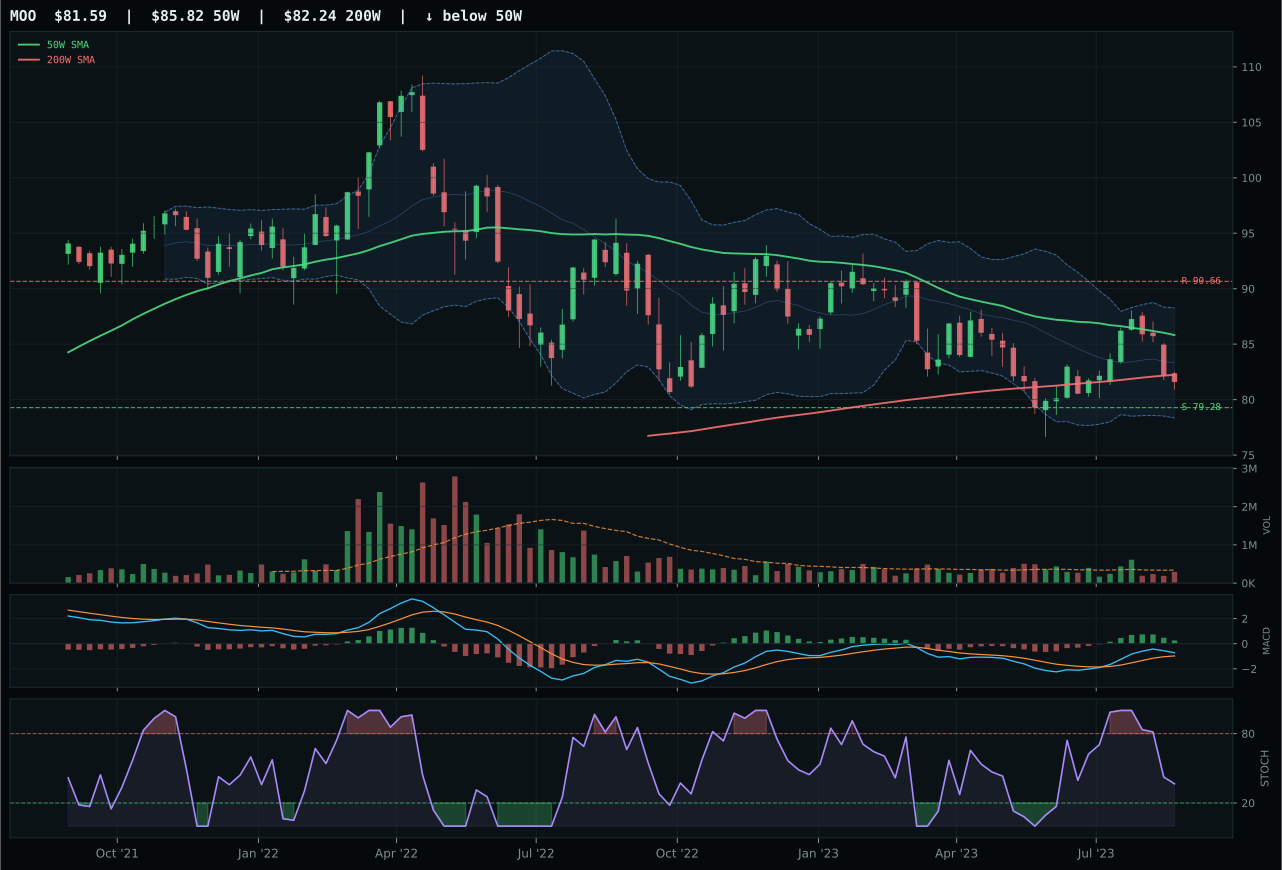
MOO has a pullback into support profile with -1.8% 13-week relative strength versus SPY.
A failed hold above support would weaken the setup.
Actionable but governed by invalidation levels.
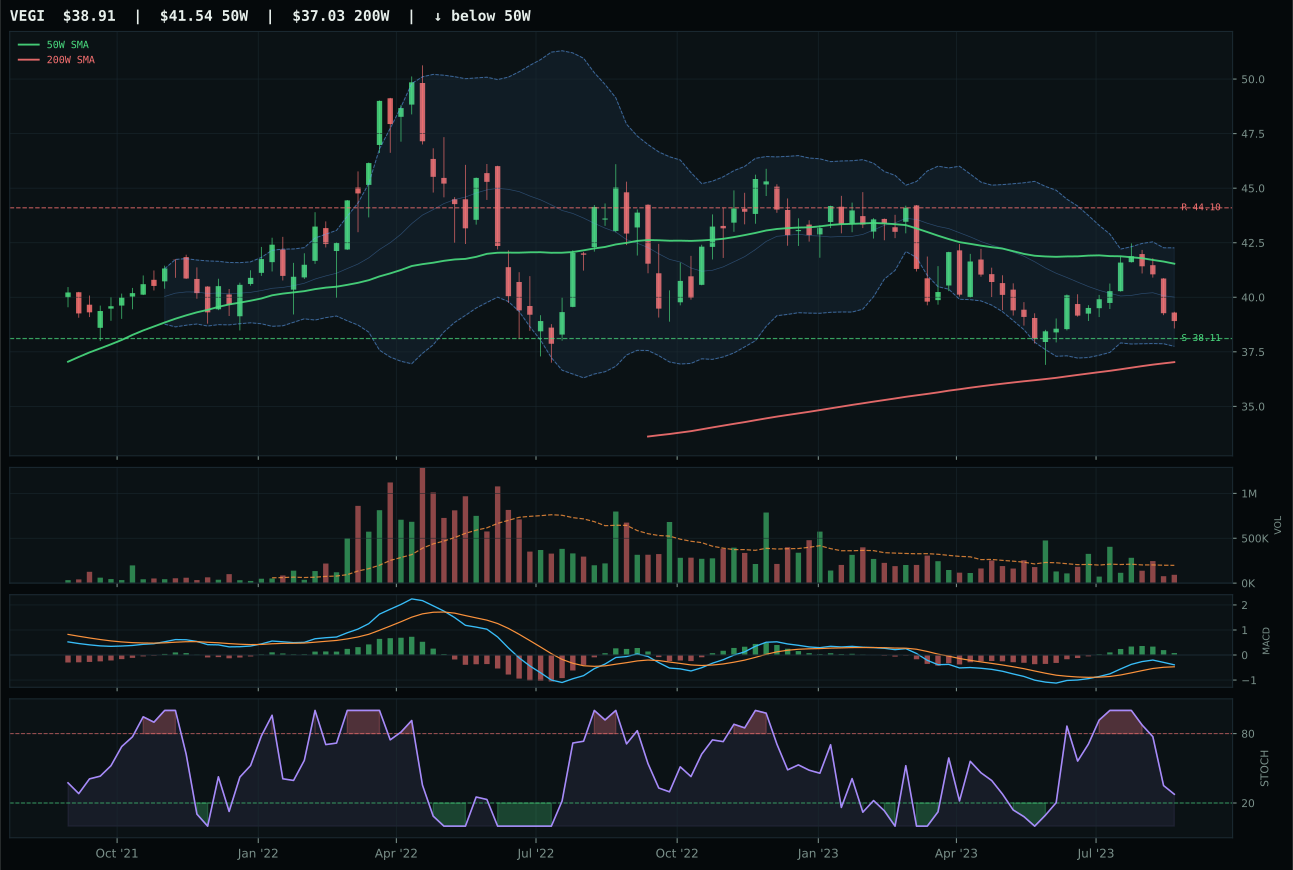
VEGI has a pullback into support profile with -2.7% 13-week relative strength versus SPY.
A failed hold above support would weaken the setup.
Tracked, but not top-2 eligible because: .
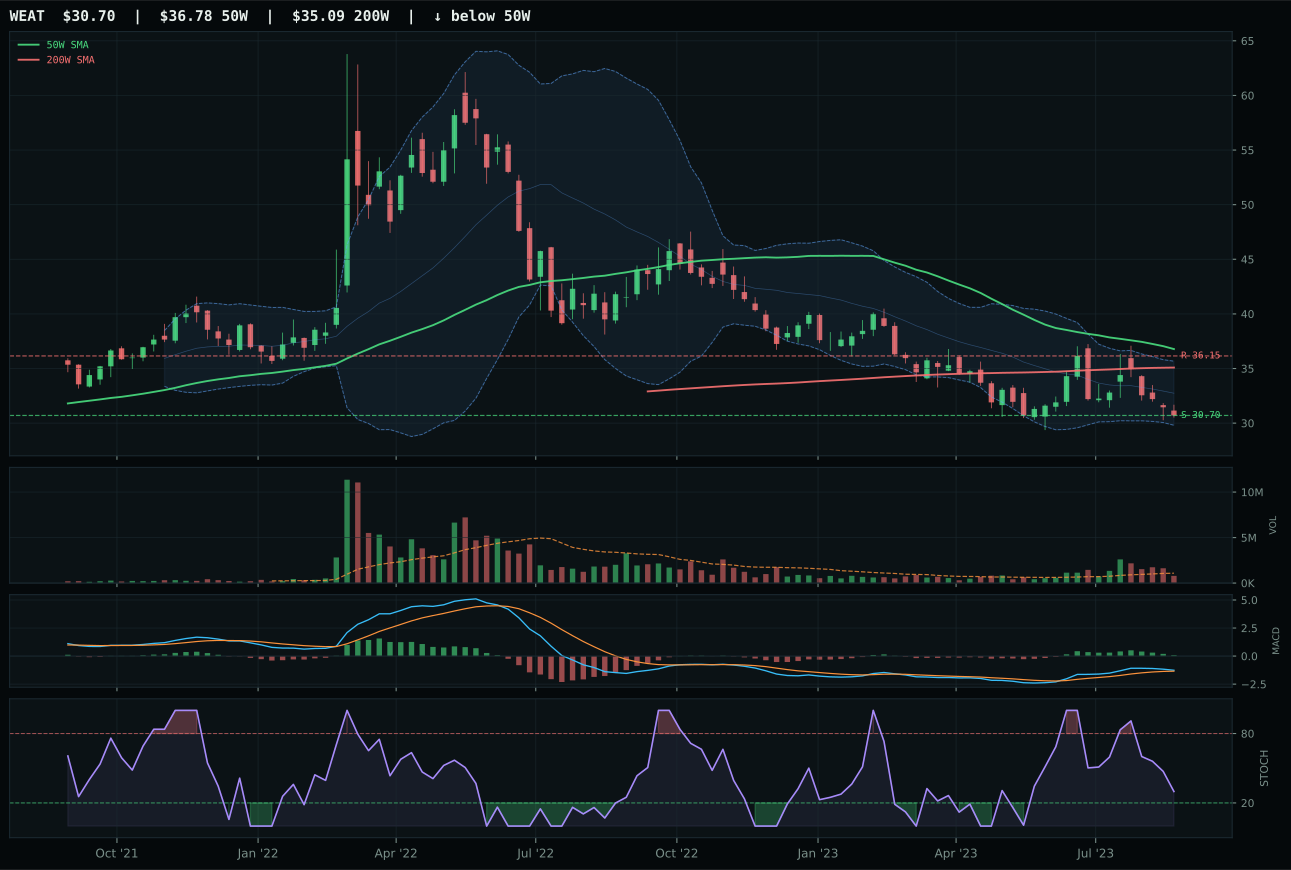
WEAT has a pullback into support profile with -6.7% 13-week relative strength versus SPY.
A failed hold above support would weaken the setup.
Actionable but governed by invalidation levels.
MOO crushed the category with a 98.0/100 risk-reward score by sitting -4.9% below the 50W in deep retracement territory (Fib 0.786 at 80.39), offering 2.9% downside to support and -10.0% upside to resistance—a favorable asymmetry that only pullbacks-into-support can deliver. Its 95.0/100 timing score reflects this perfect setup: bearish-flattening MACD with falling stochastic at 0.37 signals capitulation rather than trend exhaustion, and the 0.8% category-relative strength advantage over VEGI demonstrates marginally better accumulation. Although trend is weak (48.2/100) and 13W return modest (2.9%), the macro fit of 70.0/100—driven by supply shortage (+8), inflation pressure (+7), and real asset sponsorship (+5)—more than compensates. VEGI's 29.3-point deficit reflects weaker risk-reward (90.0), thinner volume participation, and inferior timing (80.0 vs 95.0).
Agriculture & Livestock earns 5% allocation as a tier-2 position backed by the strongest category-level macro fit in the portfolio at 90.0/100. Late-cycle reflation directly helps agricultural commodities (+8), supply shortage is active (+13), inflation pressure is hot (+10), and real asset sponsorship is strongly positive (+5). This macro tailwind is the primary reason the category ranks above Technology, AI, and other growth-dependent sectors despite a technically softer setup. MOO's technical evidence of 58.2/100 is adequate but not dominant, and momentum confirmation at 46.0/100 reflects weak recent price action (2.9% 13W, -6.5% 4W). The tier-2 slot reflects a conviction in the macro regime: in late-cycle inflationary conditions, agricultural real assets with supply constraints are structural winners regardless of short-term momentum. To graduate to top-2, MOO would need to hold support at 79.28 and rebuild volume-price confirmation—if that technical floor holds, the category could challenge for a higher rank.
Defense & Aerospace — ITA
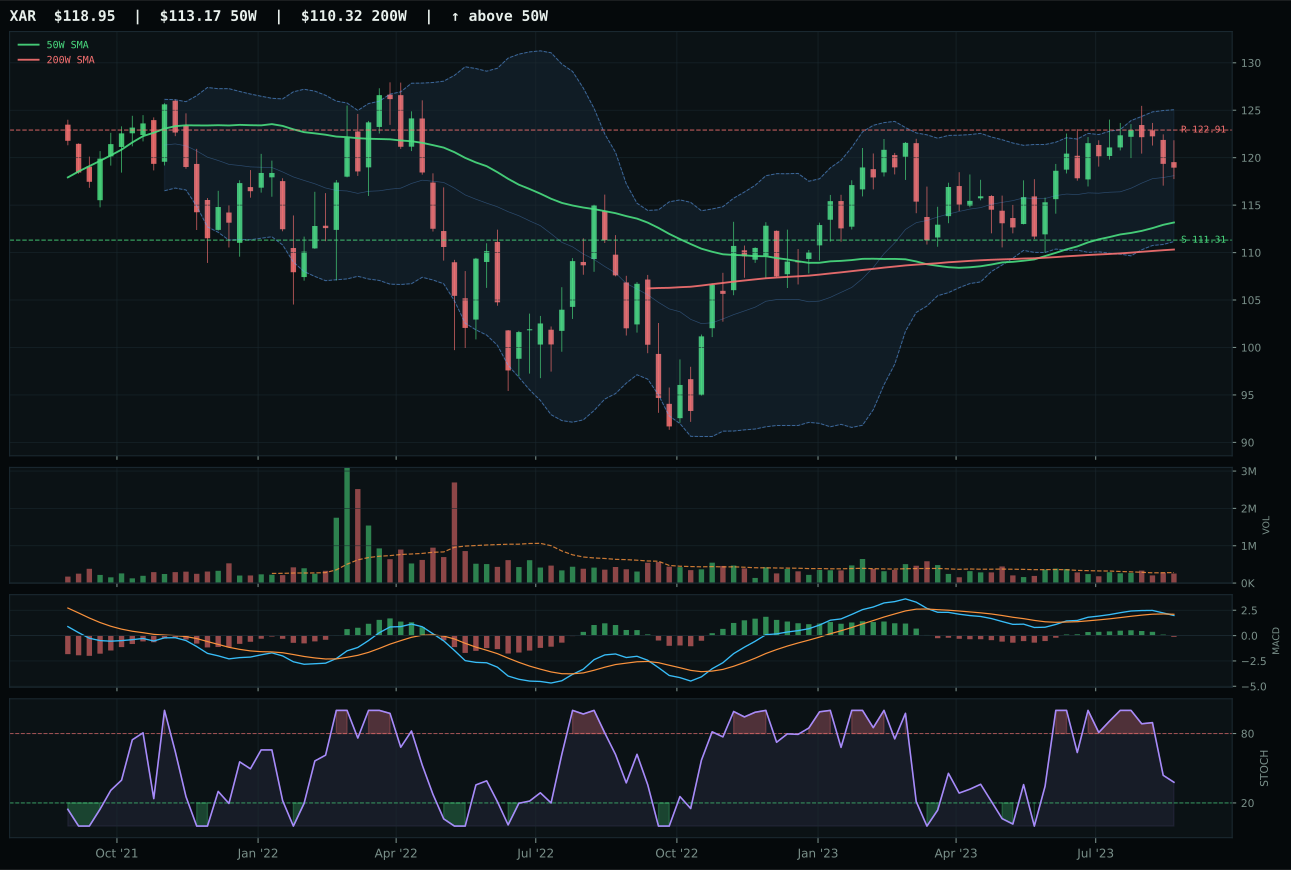
XAR has a neutral structure profile with 1.8% 13-week relative strength versus SPY.
A failed hold above support would weaken the setup.
Actionable but governed by invalidation levels.
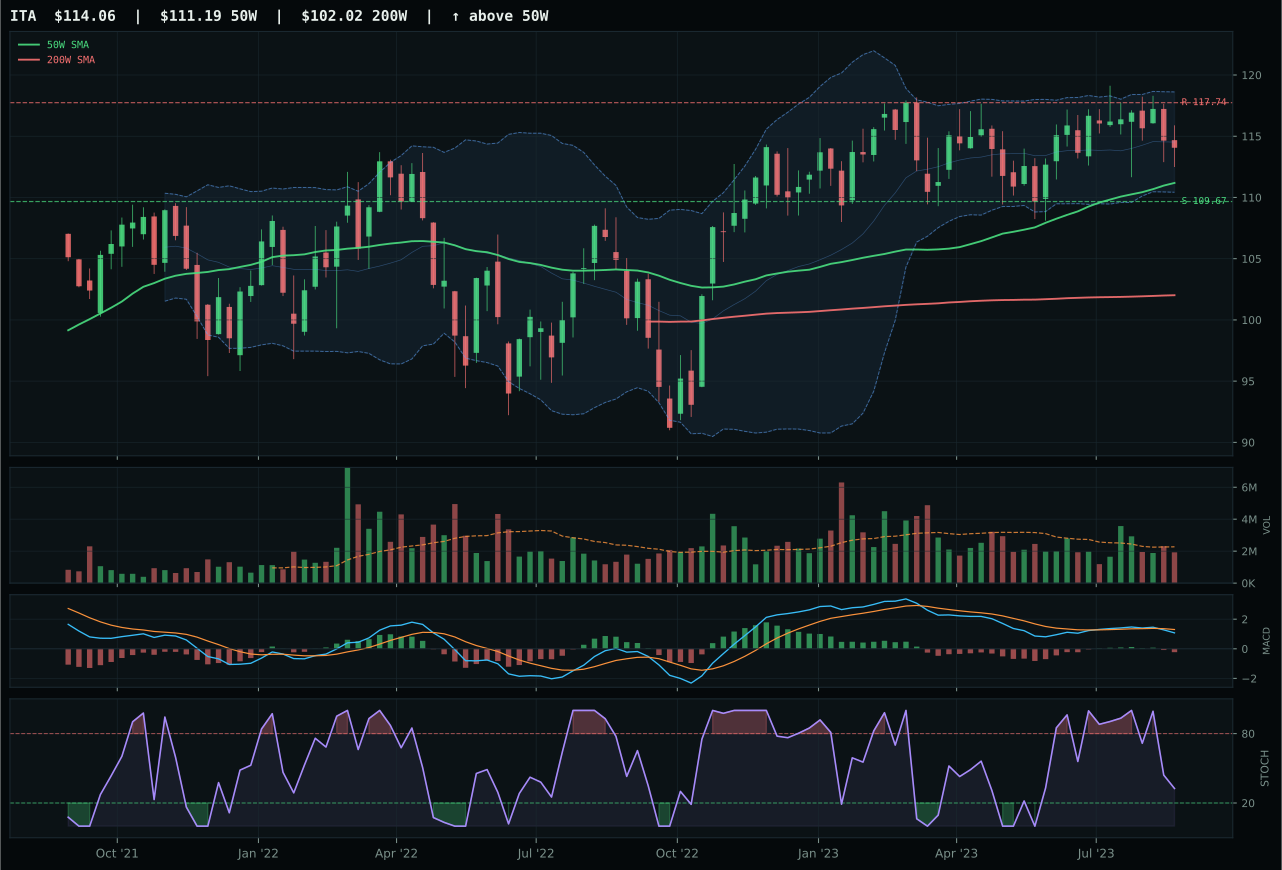
ITA has a pullback into support profile with -0.7% 13-week relative strength versus SPY.
A failed hold above support would weaken the setup.
Actionable but governed by invalidation levels.
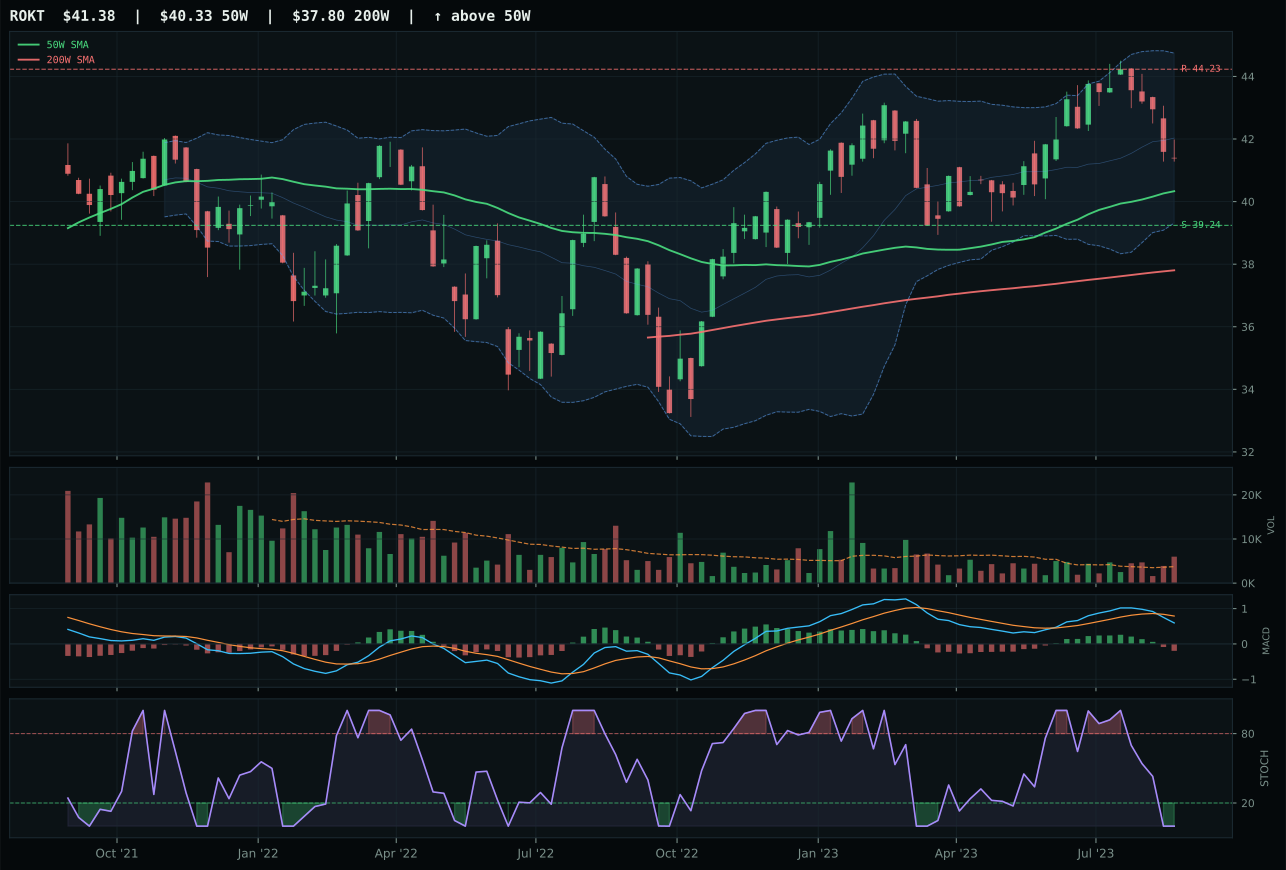
ROKT has a compression near 50W profile with -2.7% 13-week relative strength versus SPY.
A failed hold above support would weaken the setup.
Tracked, but not top-2 eligible because: .
ITA won decisively by pulling into support at 109.67 with exceptional timing of 95.0/100—just 2.6% below the 50W and stochastic RSI falling from neutral—versus XAR's 70.0/100 timing score at broader distance from support. The pullback-into-support structure gives ITA a defined invalidation area that constrains tail risk, a critical advantage when momentum is weak (13W return of 4.0%) and breadth is uncertain. Risk-reward of 59.0/100 (4.0% downside, 3.1% upside cushion) is tighter than XAR's 53.5/100, reflecting better entry geometry. XAR holds 13W return of 6.5% and positive SPY-relative strength of +1.8%, but neither overcomes the timing disadvantage or structural clarity that ITA provides. The 6.1-point final spread reflects a clean win on entry risk rather than on momentum leadership.
Defense & Aerospace holds 5% as a tier-2 position, reflecting a 37.1 category score that lags the top-2 leaders. The category macro fit of 57.0/100 is meaningfully positive—late-cycle reflation adds +6 points, credit stress paradoxically adds +2 (defense is defensive), and liquidity stress subtracts -4—but 57 is not strong enough to displace the top two earners. ITA's technical evidence of 45.5/100 is solid yet not exceptional; momentum confirmation is only 33.9/100 because the 13W return of 4.0% is modest and volume is neutral. The tier-2 allocation reflects a tactical hold: defense has structural merit in late-cycle (government spending is stickier than corporate CapEx), but macro fit is not sufficiently dominant to warrant top-2 ranking. For promotion to top-2, the category would need either a significantly higher macro fit score—perhaps through a geopolitical shock that activates additional positive descriptors—or cleaner technical confirmation with volume accumulation into support.
Precious Metals — SLV
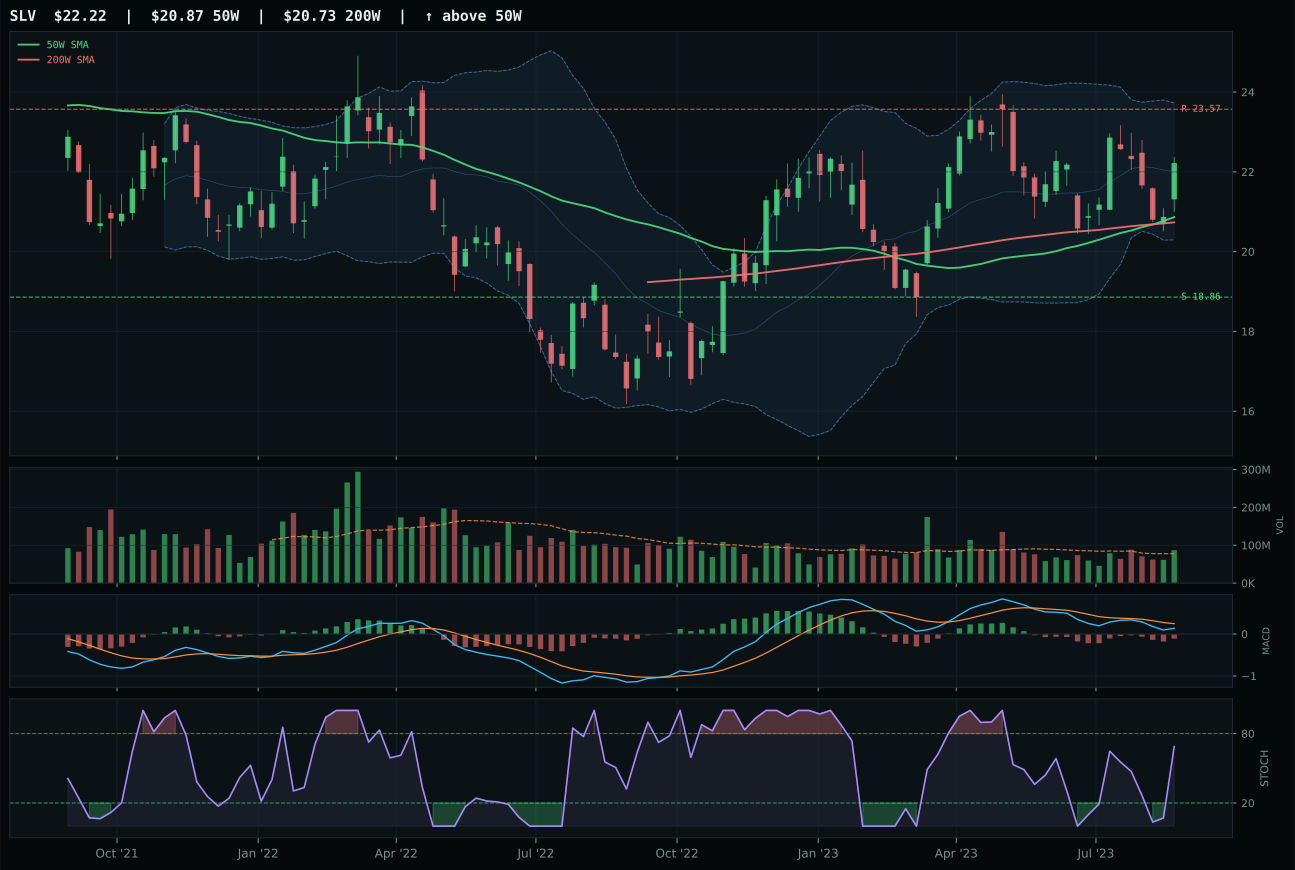
SLV has a neutral structure profile with -0.8% 13-week relative strength versus SPY.
A failed hold above support would weaken the setup.
Actionable but governed by invalidation levels.
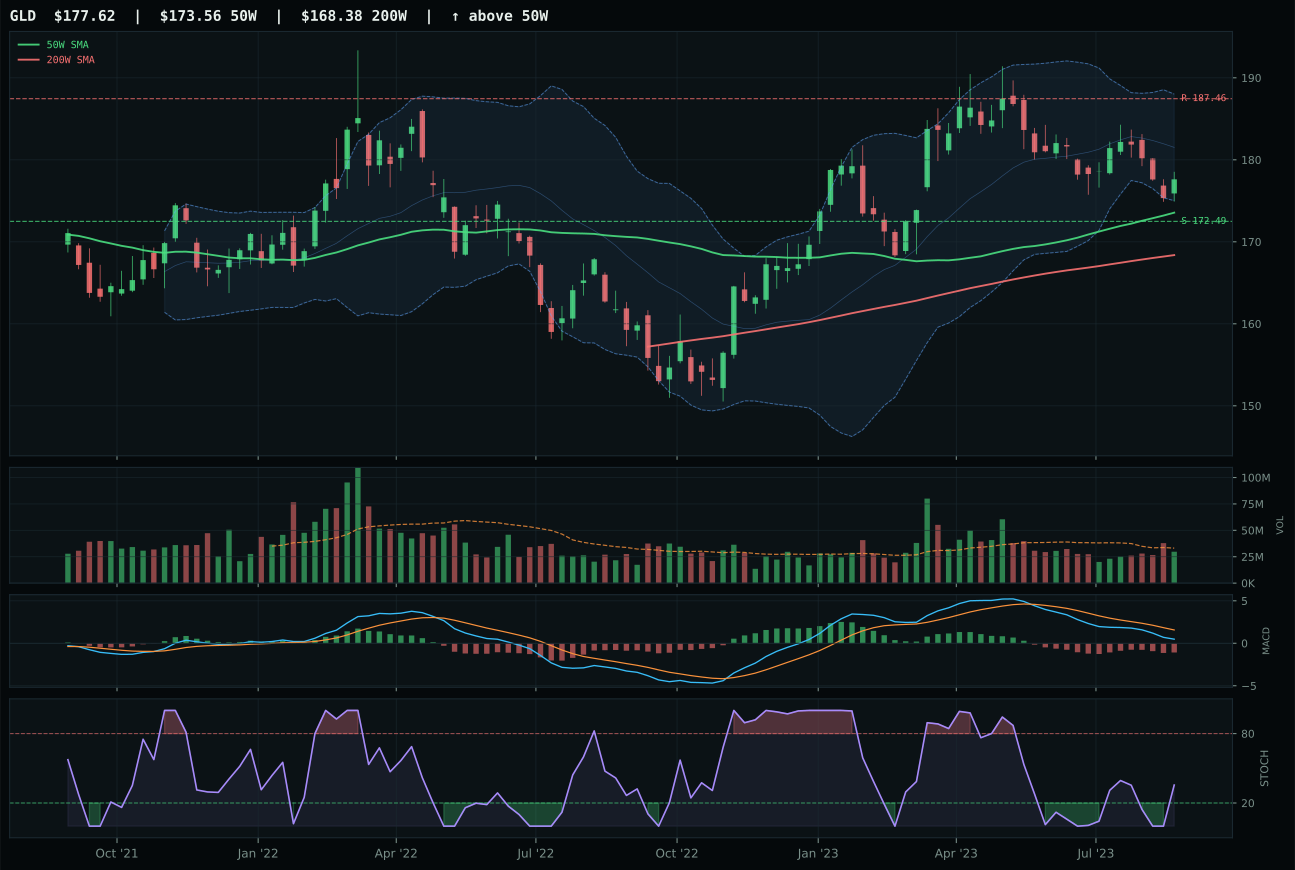
GLD has a pullback into support profile with -6.6% 13-week relative strength versus SPY.
A failed hold above support would weaken the setup.
Actionable but governed by invalidation levels.
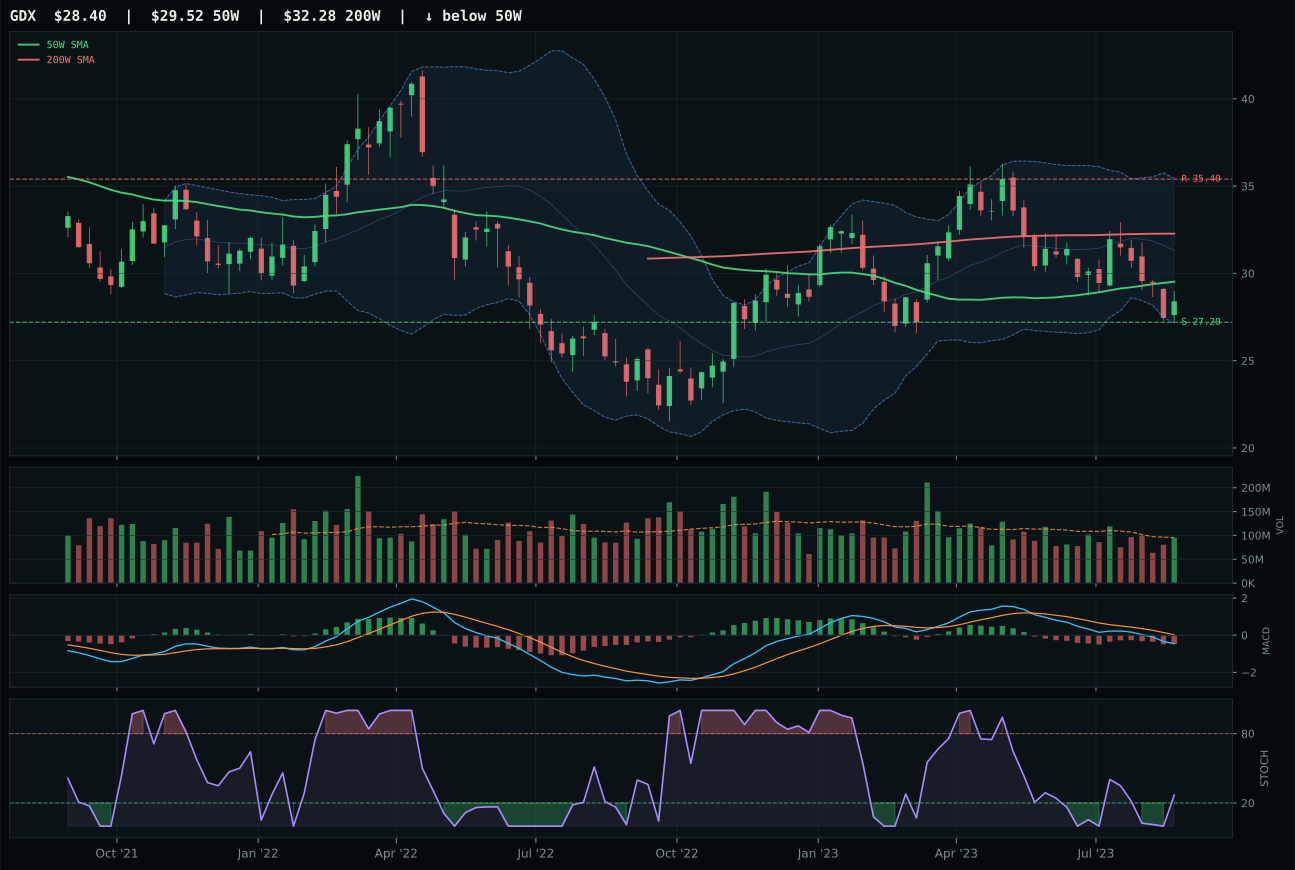
GDX has a pullback into support profile with -11.4% 13-week relative strength versus SPY.
Extension and support failure are the main tactical risks.
Tracked, but not top-2 eligible because: structurally broken.
SLV won a narrow category battle by outperforming on category-relative strength (+5.8% versus GLD's 0.0%) and by holding above-average volume participation (1.12x 20W average) versus GLD's neutral participation, a critical distinction when metals are fighting macro headwinds. Both charts sit in upper retracement territory with bearish-weakening MACD and mid-zone stochastic RSI, but SLV's 6.5% distance from the 50W and 80.8/100 trend score beat GLD's pullback-into-support structure and 72.0/100 trend. The 13W returns diverge sharply: SLV's 3.9% versus GLD's -1.8%, confirming that silver's hybrid monetary-and-industrial beta is capturing marginal strength that pure gold cannot. The -4.3-point deficit between SLV's score (33.0) and GLD's potential (37.3) reveals this is a weak category overall, with GLD still offering superior risk-reward on pullback geometry despite losing the contest.
Precious Metals receives 5% as a tier-2 holding despite a modest 33.0 category score, justified primarily by defensive positioning in a late-cycle regime rather than by technical strength. The category macro fit of 50.0/100 is neutral—no strong descriptor profile favors or penalizes this exposure—which is exactly the point: metals offer hedge value that doesn't require a macro forecast. SLV's technical evidence is 52.6/100 and macro/narrative fit is 57.0/100, balanced but unremarkable. The allocation is insurance, not alpha: in late-cycle reflation, rising inflation expectations (active) and metals scarcity (active at +7) provide modest positive bias, but the category's overall rank reflects the fact that energy, agriculture, and industrials are stronger positions. To earn top-2 status, metals would need either a significant acceleration in inflation pressure descriptors or a technical reset with volume accumulation that SLV is not currently showing. The 5% is a floor position.
Utilities & Infrastructure — PAVE
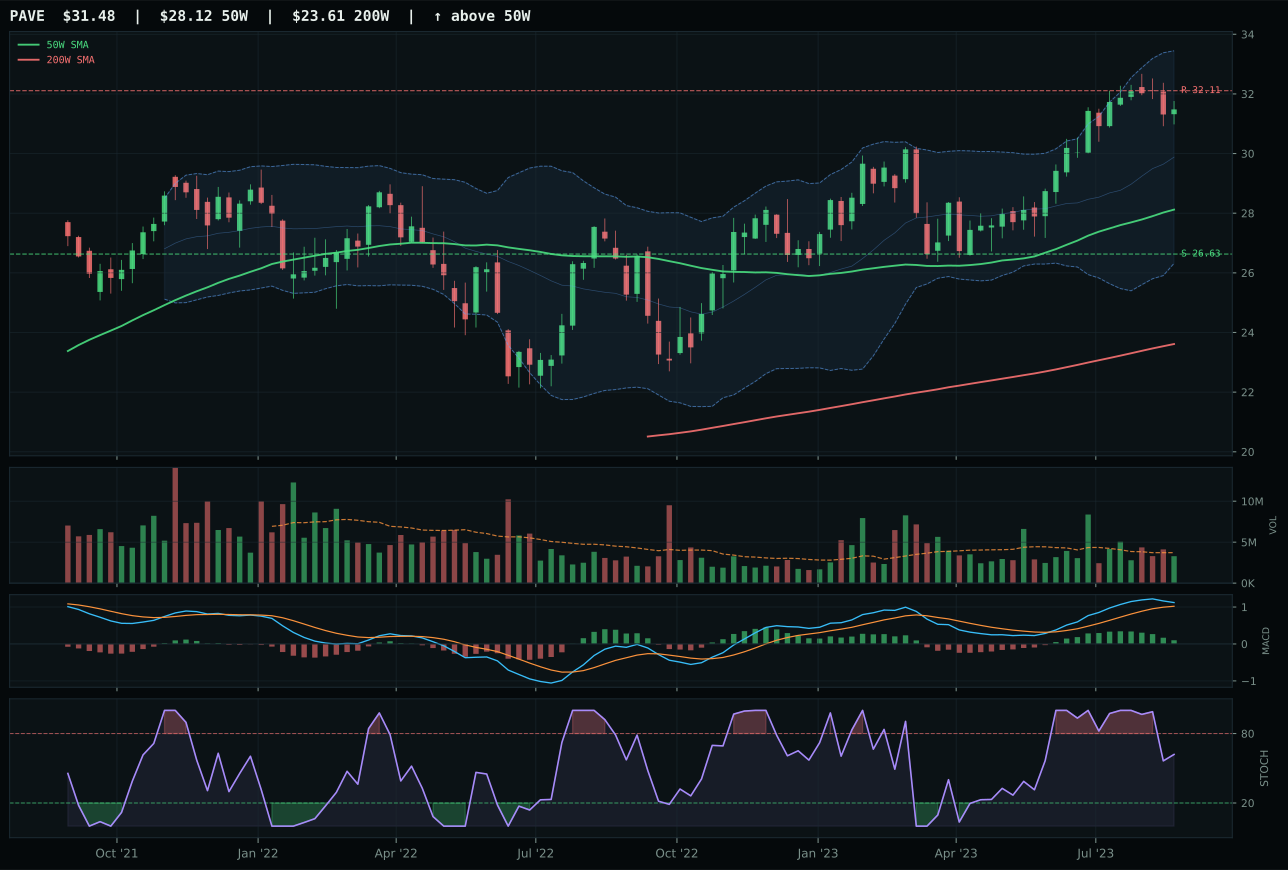
PAVE has a neutral structure profile with 8.1% 13-week relative strength versus SPY.
A failed hold above support would weaken the setup.
Actionable but governed by invalidation levels.
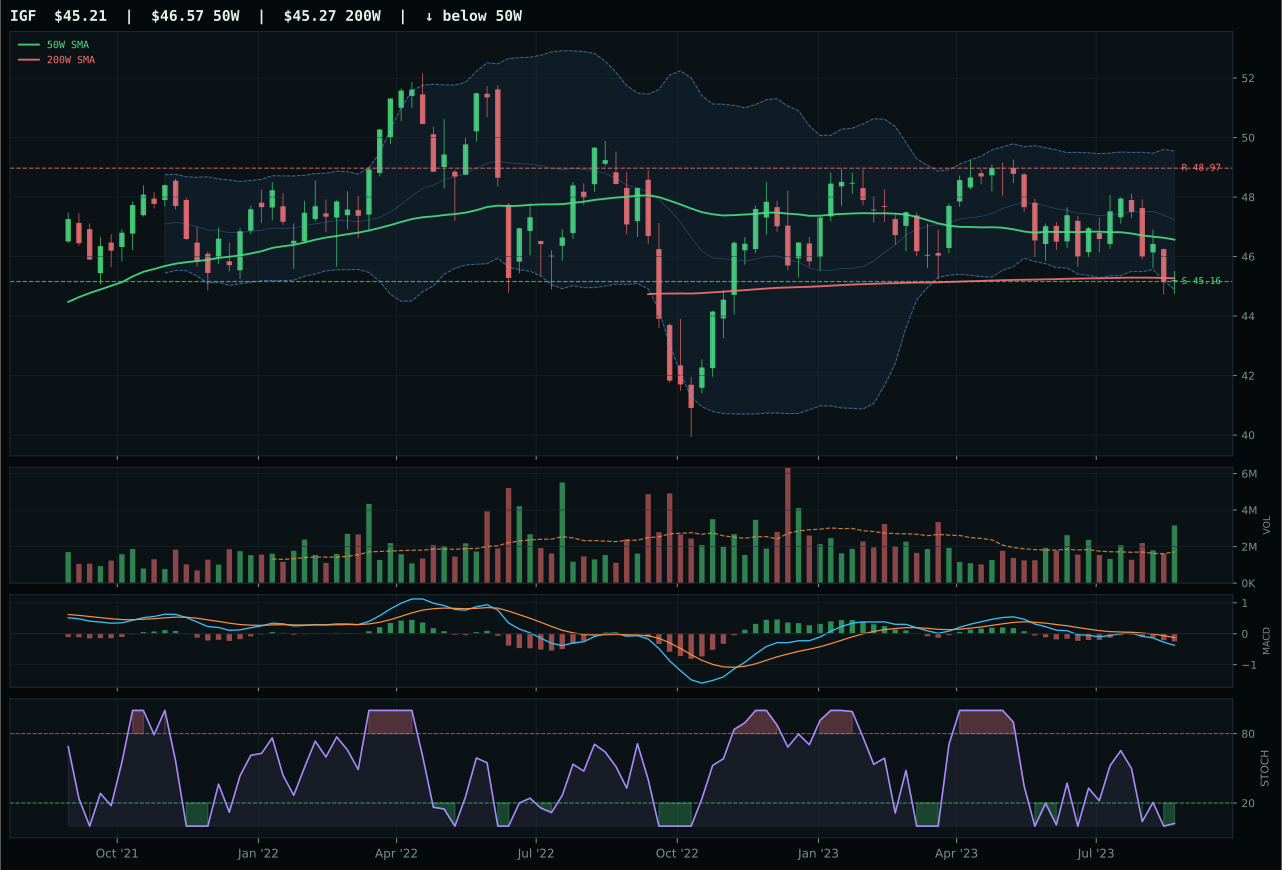
IGF has a pullback into support profile with -7.6% 13-week relative strength versus SPY.
A failed hold above support would weaken the setup.
Actionable but governed by invalidation levels.
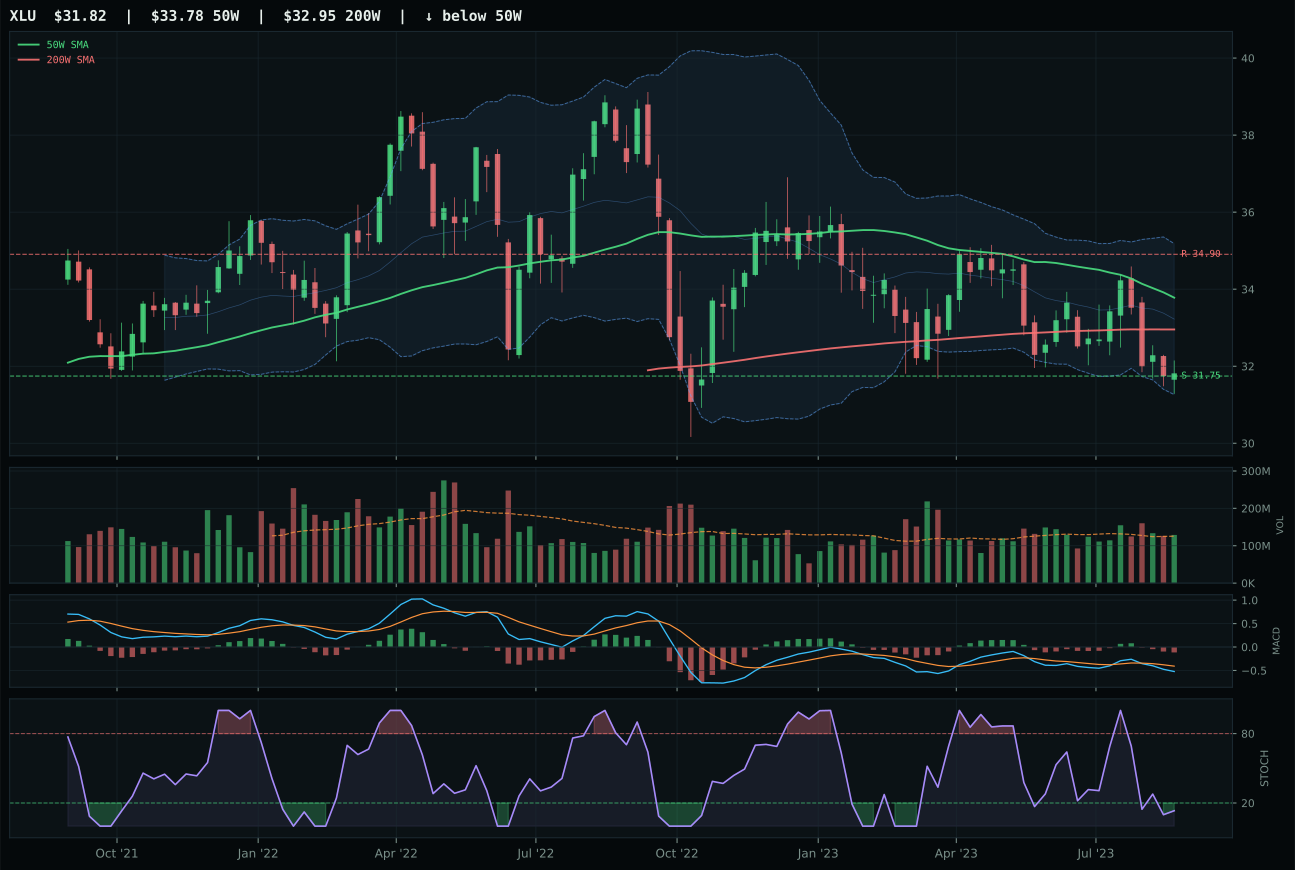
XLU has a pullback into support profile with -6.2% 13-week relative strength versus SPY.
A failed hold above support would weaken the setup.
Actionable but governed by invalidation levels.
PAVE dominated its category through a rare combination of 100.0/100 trend and 100.0/100 momentum confirmation, with 12.9% 13W return and 14.4% category-relative strength proving that domestic infrastructure is capturing genuine institutional conviction in the late-cycle reflation regime. Price sits 11.9% above the 50W with bullish-but-flattening MACD and falling stochastic—disciplined upside momentum without overstretched entry risk—while 85.0/100 volume-price confirmation and 81.1/100 persistence show the move is supported by accumulation rather than spike participation. Risk-reward of 46.9/100 is the only weak component (2.0% upside, 18.2% downside), but that asymmetry reflects the fact that PAVE has already moved without giving back, validating that the entry was sound. IGF's bearish-weakening MACD, oversold stochastic, and -7.6% SPY-relative weakness create a setup that is neither accumulating nor timing well; XLU shows identical deterioration. The 44.8-point gap between PAVE and IGF is among the largest in the portfolio.
Utilities & Infrastructure holds 5% as a tier-2 position despite PAVE's excellent technical setup, because the category macro fit of 45.0/100 is below the tier-2 threshold. Late-cycle reflation adds a modest +4 benefit, but inflation pressure is a -6 headwind (infrastructure is long-duration and rate-sensitive), and liquidity stress subtracts -3 more. PAVE's 84.0 technical evidence and 100.0 momentum scores are among the highest in the portfolio, yet the macro regime is structurally unfavorable for utilities—rising rates compress multiples, and credit stress elevates borrowing costs for infrastructure operators. The 5% allocation reflects a tactical position: PAVE is the best-performing infrastructure name, and inflation's positive commodity/capex impacts can offset rate headwinds. However, the category would need either rate stability (difficult in late-cycle) or clearer inflation-linked earnings growth to advance to tier-2 or top-2 rank. This is a hold because the technicals are strong, but conviction is tempered by macro regime risk.
Technology — CIBR
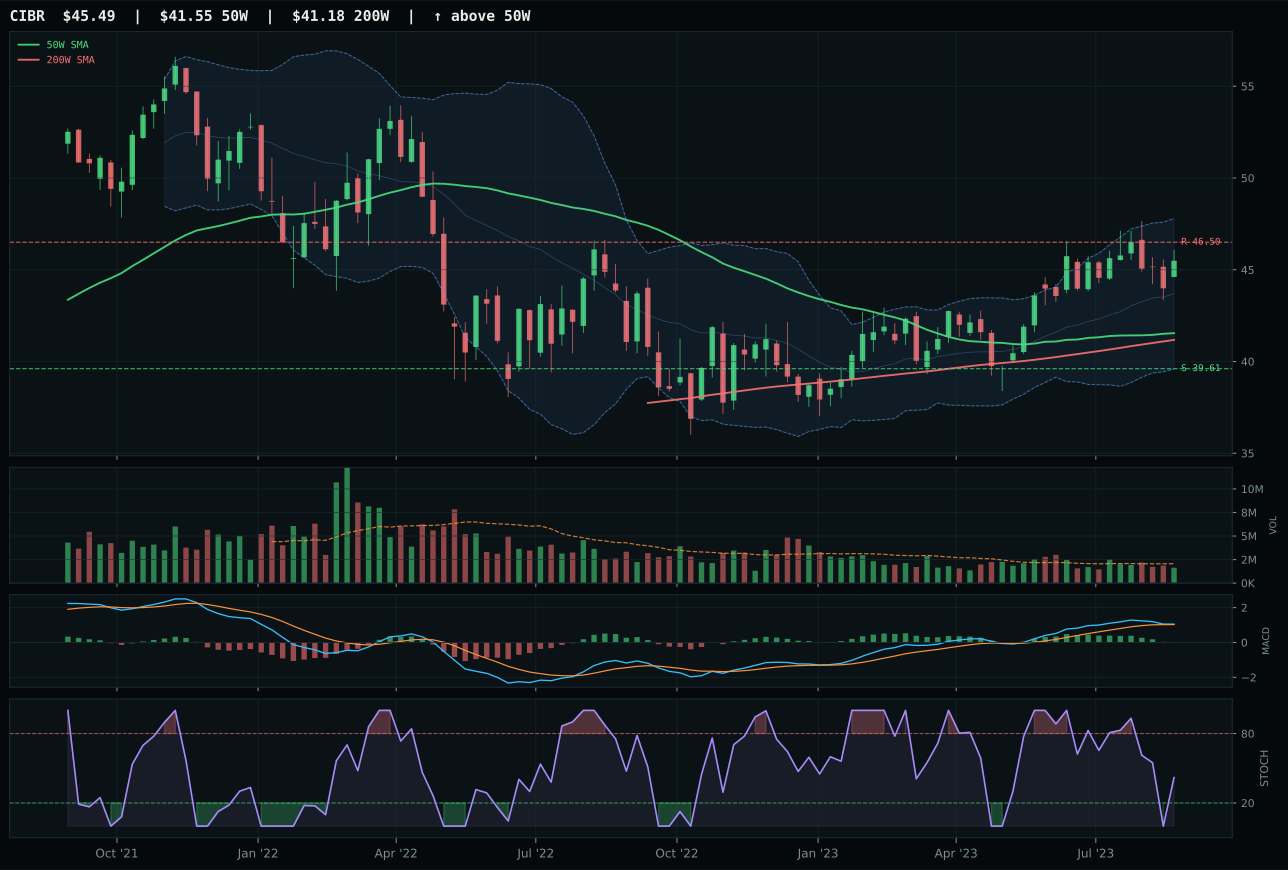
CIBR has a neutral structure profile with -0.4% 13-week relative strength versus SPY.
A failed hold above support would weaken the setup.
Actionable but governed by invalidation levels.
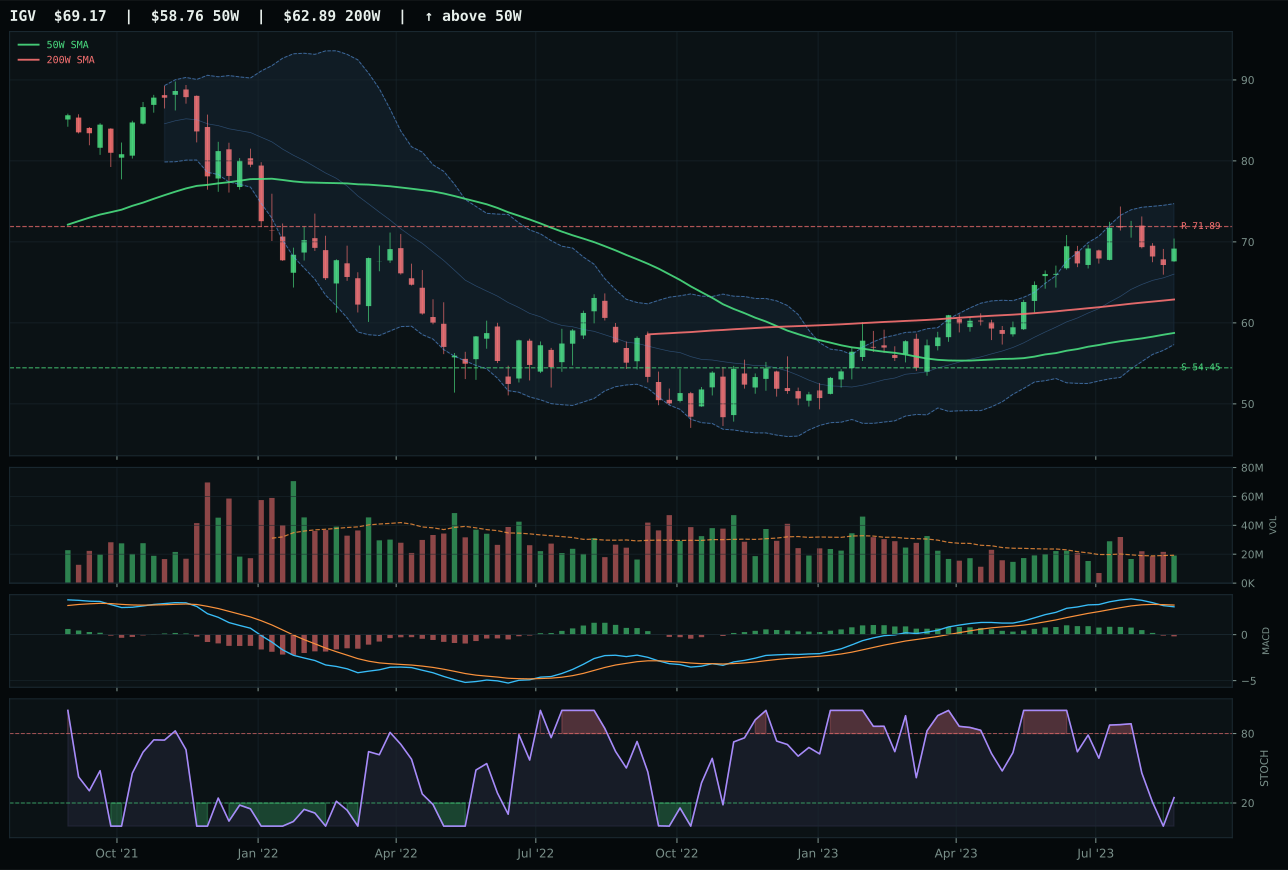
IGV has a vertical extension profile with 2.2% 13-week relative strength versus SPY.
A failed hold above support would weaken the setup.
Actionable but governed by invalidation levels.
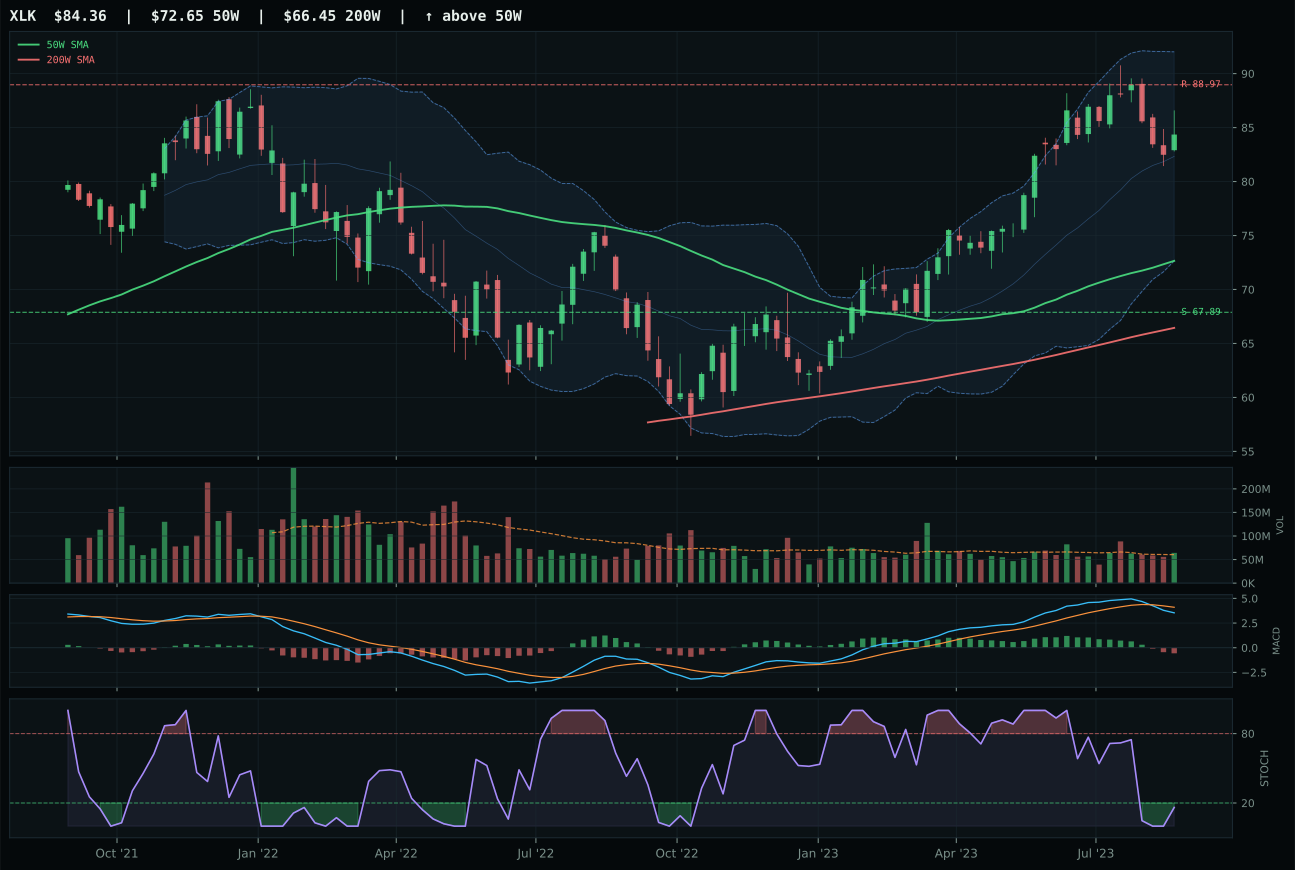
XLK has a vertical extension profile with -2.4% 13-week relative strength versus SPY.
A failed hold above support would weaken the setup.
Actionable but governed by invalidation levels.
CIBR prevails because cybersecurity remains anchored above both the 50-week and 200-week moving averages with a flat but non-deteriorating 50W slope, positioning it as a trend-following candidate in a choppy macro. Its relative strength versus SPY sits at -0.4%, meaning it is neither leading nor lagging the broad market, while its 4.3% 13-week return and neutral category-relative performance (0.0%) signal steady but uninspired price action. IGV lost on multiple fronts: its 17.7% extension above the 50W carries entry risk that CIBR avoids at just 9.5%, its MACD is bearish/weakening versus CIBR's bullish setup, and its timing score of 48.0 versus CIBR's 70.0 reflects the gap between a stretched vertical extension and a controlled pullback structure. Volume at neutral 0.80x confirms neither conviction nor distribution, leaving CIBR as the least painful choice in a category where macro headwinds (active credit and liquidity stress) suppress all three options.
Technology earned 5% as a tier-2 holding, the lowest rung of capital commitment in a normal allocation structure. The category scores 25.0 overall—well below the top-2 threshold—because late-cycle reflation paired with active credit and liquidity stress creates structural headwinds for growth-dependent software and semiconductor names. CIBR's cybersecurity specificity offers marginally better macro fit than broad enterprise software, but even that advantage is modest: the category-level macro fit is 29.0/100, dragged down by -10 points for active liquidity stress and -7 for credit stress. For the position to expand, either the macro regime must shift away from credit tightness or the technical setup must show clean volume accumulation with MACD bullish confirmation—neither condition holds. This is a hold-not-buy slot, justified only as a hedge against relative underperformance if tech finds a floor.
AI — AIQ
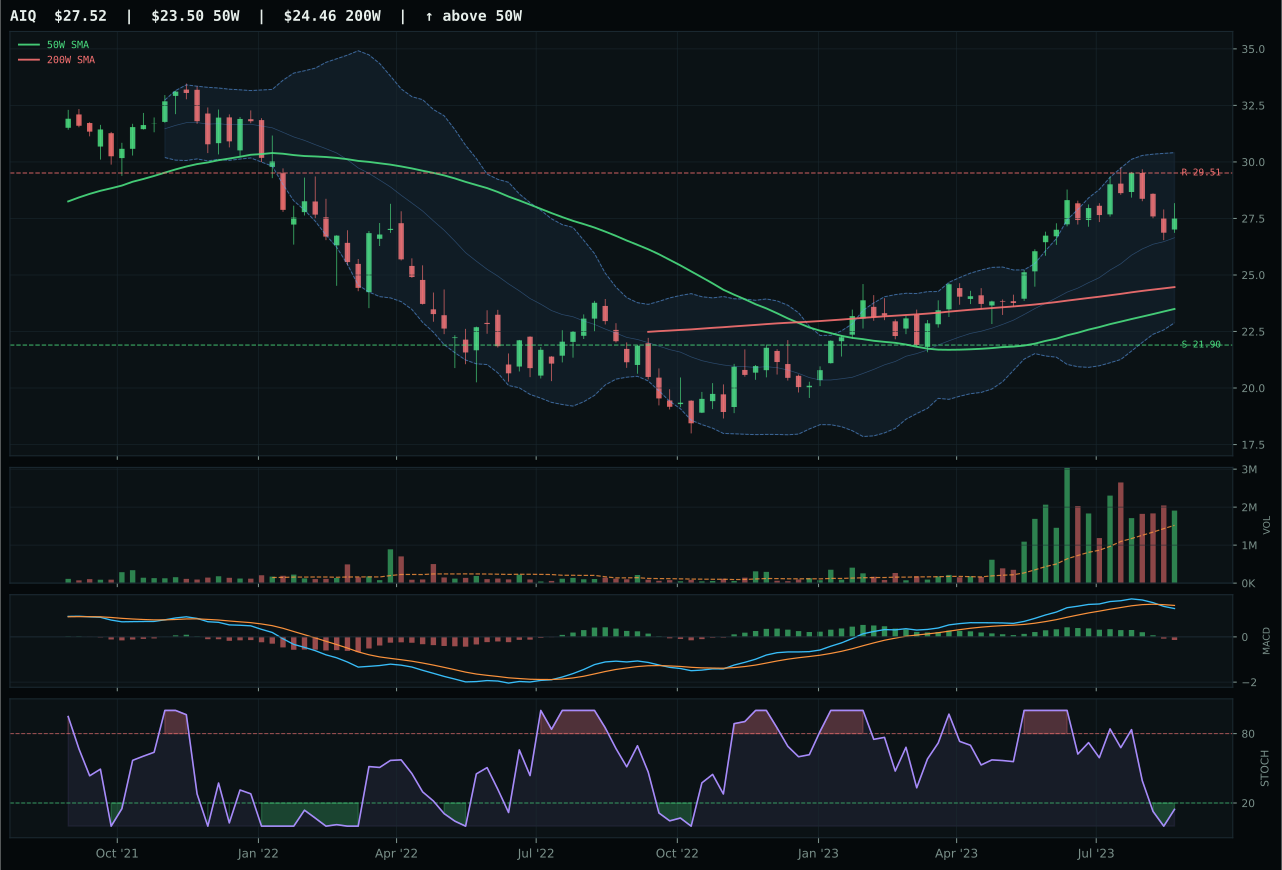
AIQ has a vertical extension profile with 0.9% 13-week relative strength versus SPY.
A failed hold above support would weaken the setup.
Actionable but governed by invalidation levels.
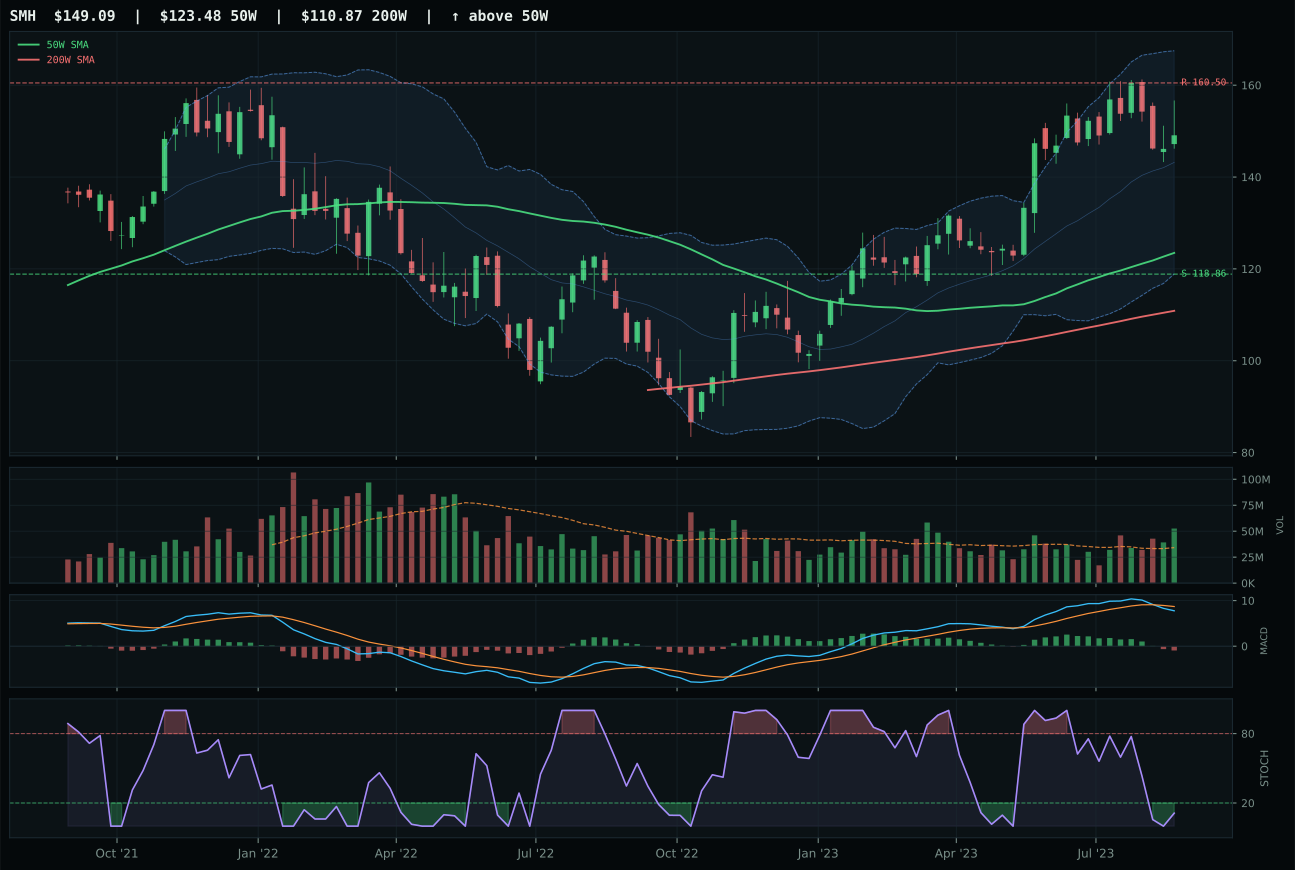
SMH has a vertical extension profile with -3.6% 13-week relative strength versus SPY.
A failed hold above support would weaken the setup.
Actionable but governed by invalidation levels.
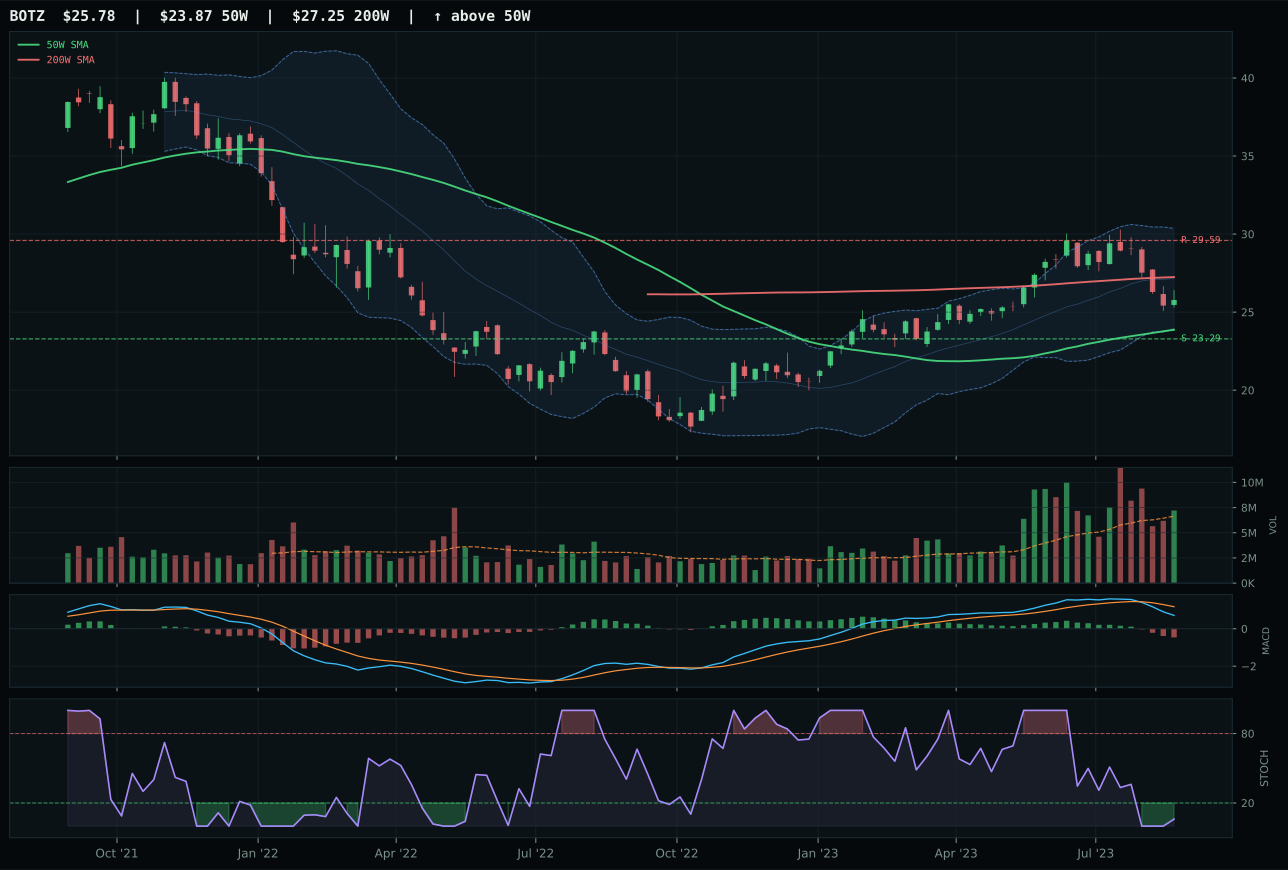
BOTZ has a neutral structure profile with -10.6% 13-week relative strength versus SPY.
A failed hold above support would weaken the setup.
Actionable but governed by invalidation levels.
AIQ won by registering +4.5% category-relative strength against SMH's 0.0%, a decisive measure of which name is actually accumulating sponsorship inside the basket. Both charts sit extended and technically weak—17.1% above the 50W for AIQ, bearish-weakening MACD across both, stochastic RSI oversold—but AIQ's 5.6% thirteen-week return and 0.9% SPY-relative strength give it marginally better breadth confirmation than SMH's -3.6% SPY-relative decline and 1.2% thirteen-week return. The 3.3-point winning margin is narrow because the entire category is fighting upstream against liquidity and credit stress; neither AI software nor AI semiconductors offer clean entry with conviction at these levels. BOTZ collapsed entirely on negative relative strength (-10.6% versus SPY) and a five-week loss of -5.9%, removing it from contention despite its superior timing score.
AI receives 0% allocation this week, ranked 9th or 10th among the 10 categories, reflecting a final score of 23.9 that cannot compete with higher-ranked peers. The macro regime of late-cycle reflation combined with active liquidity stress (-12 points) and credit stress (-8 points) creates a direct headwind for growth-dependent AI and semiconductor names that depend on multiple expansion. Even AIQ's relative strength advantage cannot overcome the category-level macro fit of 30.0/100—far too weak to justify a position. The technical setup is also untenable: vertical extension, oversold stochastics, and bearish/weakening MACD across the board signal exhaustion rather than accumulation. For AI to earn a tier position, the category needs either a macro pivot away from credit stress or a proven technical bottom with volume-price sponsorship moving in tight, confirmed consolidation. Neither is present.
Emerging Markets — INDA
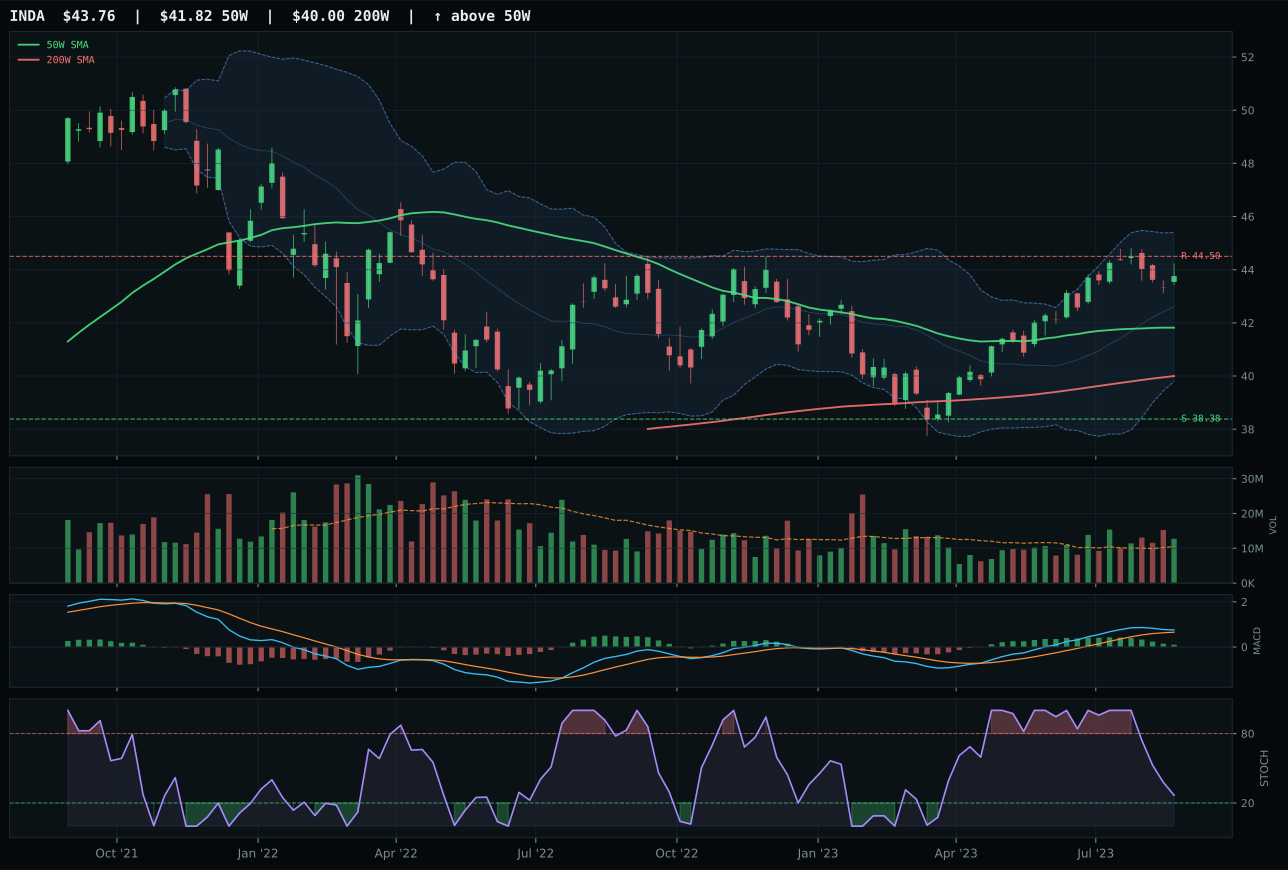
INDA has a neutral structure profile with -0.6% 13-week relative strength versus SPY.
A failed hold above support would weaken the setup.
Actionable but governed by invalidation levels.
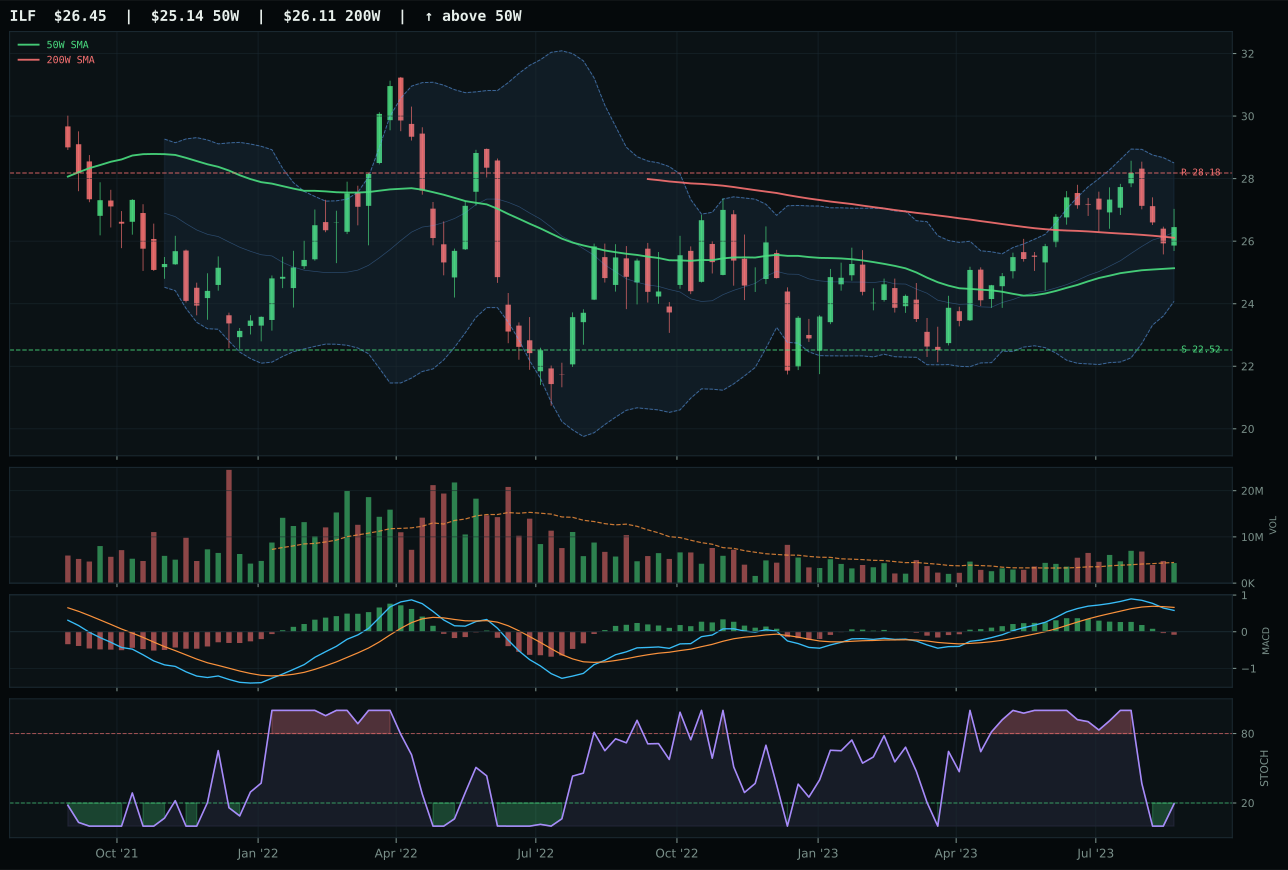
ILF has a neutral structure profile with -1.0% 13-week relative strength versus SPY.
A failed hold above support would weaken the setup.
Actionable but governed by invalidation levels.
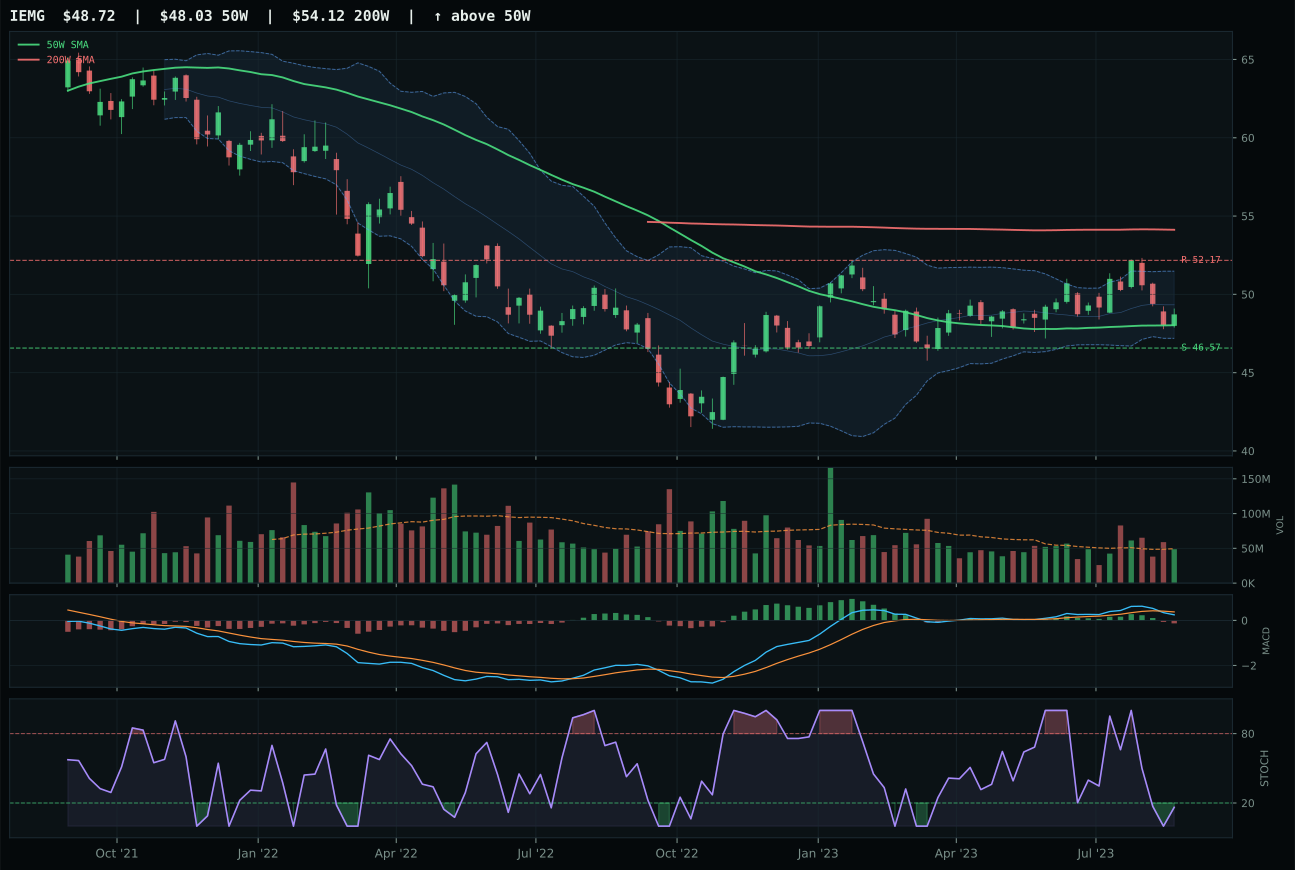
IEMG has a pullback into support profile with -4.3% 13-week relative strength versus SPY.
A failed hold above support would weaken the setup.
Actionable but governed by invalidation levels.
INDA beat the emerging-markets field by posting 85.0/100 timing and 85.1/100 trend scores, with price sitting just 4.6% above the 50W in cleanest positioning among the three candidates. Its 4.1% 13W return and 0.4% category-relative strength edge over ILF—while modest—combine with above-average volume participation (1.21x average) to show that India quality-growth is capturing what global commodity-linked Latin America (ILF) cannot: genuine institutional demand despite the macro headwinds. ILF's bearish-weakening MACD and oversold stochastic, combined with 70.0/100 timing and neutral volume, place it in capitulation territory rather than accumulation; ILF's 3.7% 13W return trails INDA despite negative SPY-relative strength across both. The 12.0-point scoring gap is clean because INDA's structure and timing decisively beat both ILF and the entirely broken IEMG.
Emerging Markets receives 0% allocation this week, ranked 9th or 10th with a final 19.5 score that reflects both weak technicals and hostile macro. The 30.0/100 category-level macro fit is dragged down by credit stress (-10) and liquidity stress (-10)—the two largest headwinds in the descriptor set—leaving no substantive macro tailwind for emerging equity exposure. INDA's technical evidence of 65.3/100 is respectable, but that is insufficient to overcome a macro regime where credit tightening and liquidity withdrawal directly reduce capital flows to emerging markets. The category's 3/2/1 weighted basket averages to only 46.1 before the reasoner applies quality screens, and even INDA's best-in-category score of 56.1 cannot elevate the category. For emerging markets to earn a position, either credit stress must deactivate or emerging central banks must deliver outsized easing (neither is happening), or technicals must show a confirmed bottom with explosive volume. Instead, the basket shows inconsistency: INDA is intact, ILF is rolling over, IEMG is broken. The category is excised entirely.