
2023-08-18
Informational purposes only. The content in this report, including allocations, analysis, and commentary, is provided solely for informational and educational purposes. It does not constitute financial advice, investment advice, trading advice, or any other type of advice. Past performance does not guarantee future results. Always conduct your own research and consult a qualified financial professional before making investment decisions.
Weekly Allocation
| Ticker | Category | Weight | Role |
|---|---|---|---|
| FBTC | 50% | Overlay | |
| XLE | Traditional Energy | 10% | Top-2 (10%) |
| URNM | Nuclear Energy | 10% | Top-2 (10%) |
| CIBR | Technology | 5% | Tier-2 (5%) |
| AIQ | AI | 5% | Tier-2 (5%) |
| MOO | Agriculture & Livestock | 5% | Tier-2 (5%) |
| ITA | Defense & Aerospace | 5% | Tier-2 (5%) |
| COPX | Industrial Metals | 5% | Tier-2 (5%) |
| GLD | Precious Metals | 5% | Tier-2 (5%) |
Trade Instructions — Monday Open
Sell the tranche from 2023-07-21 (completing its 4-week hold). Buy the new tranche. Instructions show net portfolio changes — same-asset positions cancel, weight changes show the delta.
| Action | Ticker | Instruction |
|---|---|---|
| SELL | IGV | Sell 50% of IGV position (reduce 5.00% → 2.50%) |
| SELL | PAVE | Sell entire PAVE position (2.50% of portfolio) |
| SELL | URA | Sell 25% of URA position (reduce 5.00% → 3.75%) |
| SELL | ILF | Sell 50% of ILF position (reduce 2.50% → 1.25%) |
| SELL | XAR | Sell 50% of XAR position (reduce 2.50% → 1.25%) |
| SELL | SLV | Sell entire SLV position (1.25% of portfolio) |
| SELL | SMH | Sell 50% of SMH position (reduce 2.50% → 1.25%) |
| BUY | AIQ | Buy AIQ — 11.11% of freed cash (adds 1.25% to portfolio) |
| BUY | MOO | Buy MOO — 11.11% of freed cash (adds 1.25% to portfolio) |
| BUY | URNM | Buy URNM — 22.22% of freed cash (adds 2.50% to portfolio) |
| BUY | CIBR | Buy CIBR — 11.11% of freed cash (adds 1.25% to portfolio) |
| BUY | ITA | Buy ITA — 11.11% of freed cash (adds 1.25% to portfolio) |
| BUY | XLE | Buy XLE — 22.22% of freed cash (adds 2.50% to portfolio) |
| BUY | GLD | Buy GLD — 11.11% of freed cash (adds 1.25% to portfolio) |
Current Portfolio After Trade
Combined holdings across all 4 active tranches. Each tranche is 25% of the portfolio.
| Ticker | % of Portfolio | Weight Bar |
|---|---|---|
| FBTC | 50.00% | |
| COPX | 6.25% | |
| MOO | 5.00% | |
| XOP | 5.00% | |
| URNM | 5.00% | |
| URA | 3.75% | |
| AIQ | 3.75% | |
| IGV | 2.50% | |
| FCG | 2.50% | |
| XLU | 2.50% | |
| CIBR | 2.50% | |
| ITA | 2.50% | |
| XLE | 2.50% | |
| ILF | 1.25% | |
| XAR | 1.25% | |
| SMH | 1.25% | |
| INDA | 1.25% | |
| GLD | 1.25% |
Macro Regime — Late-Cycle Reflation
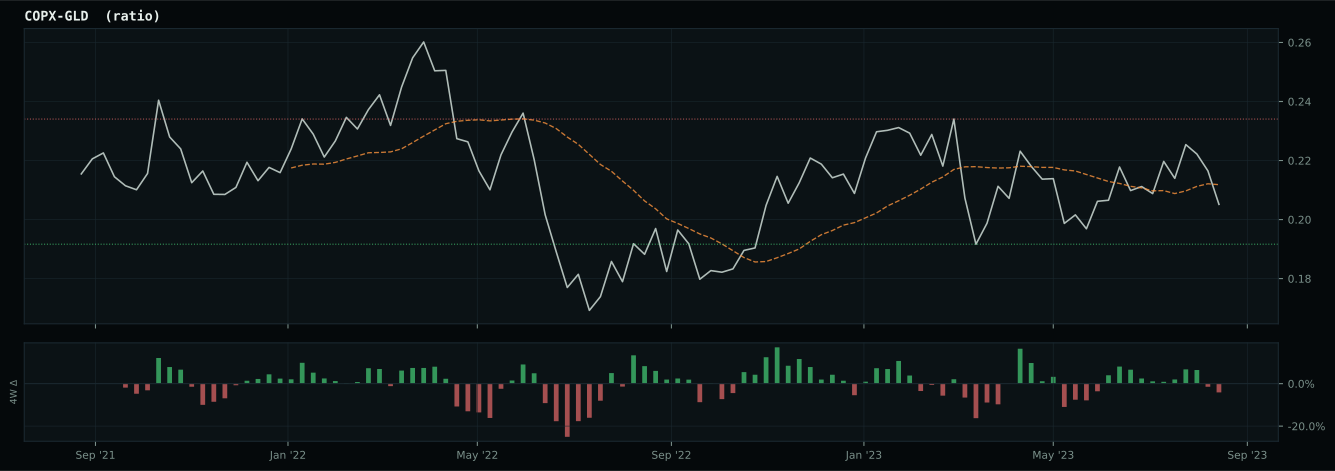
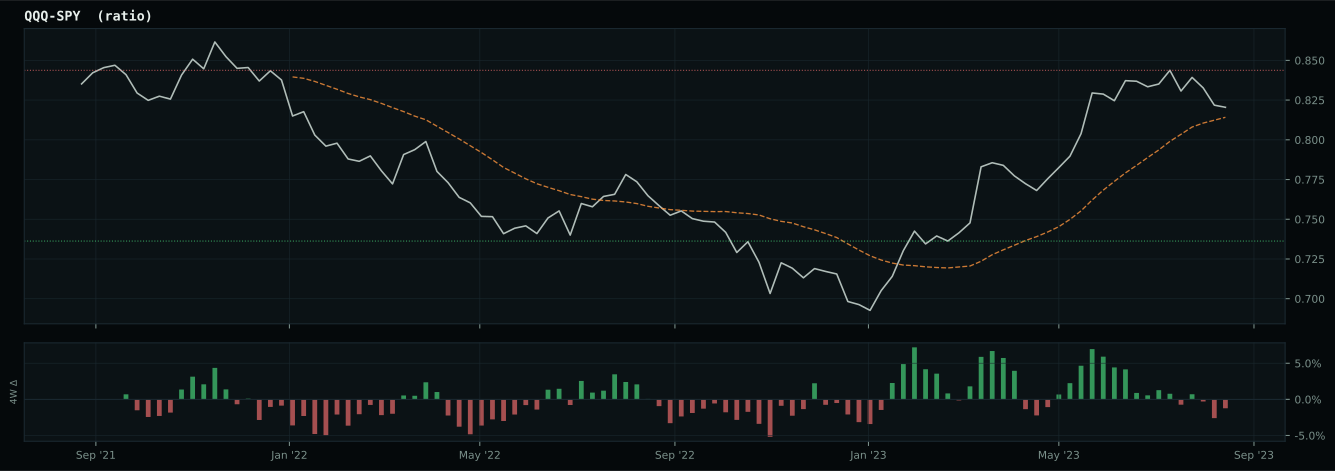
Macro Evidence Charts
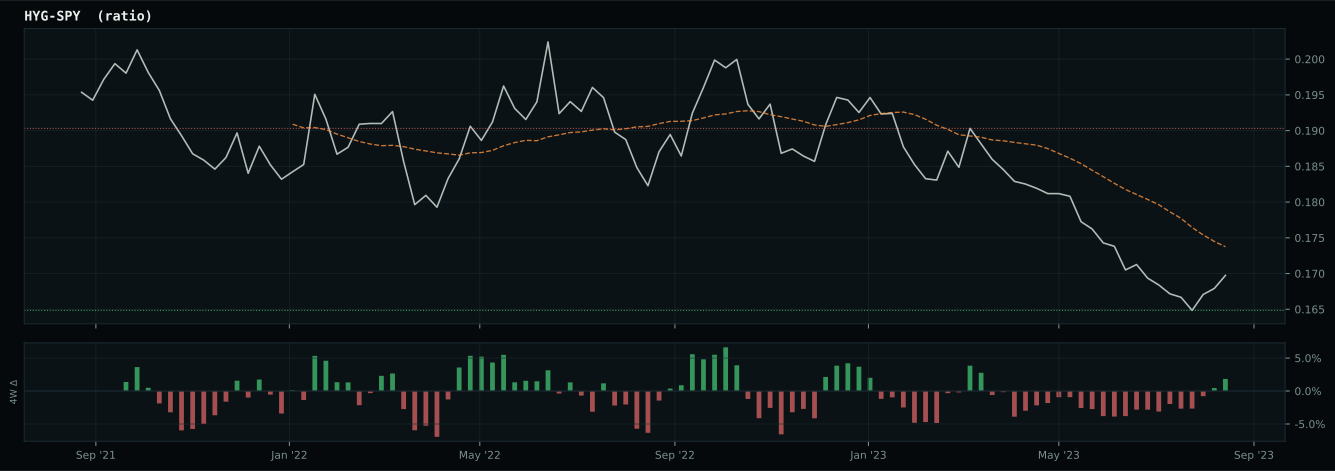
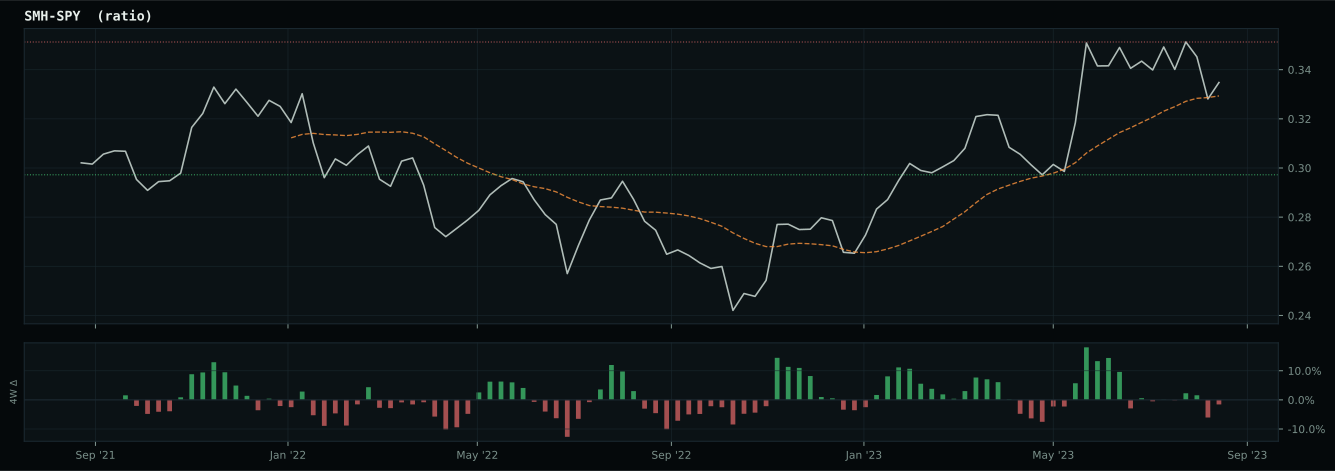
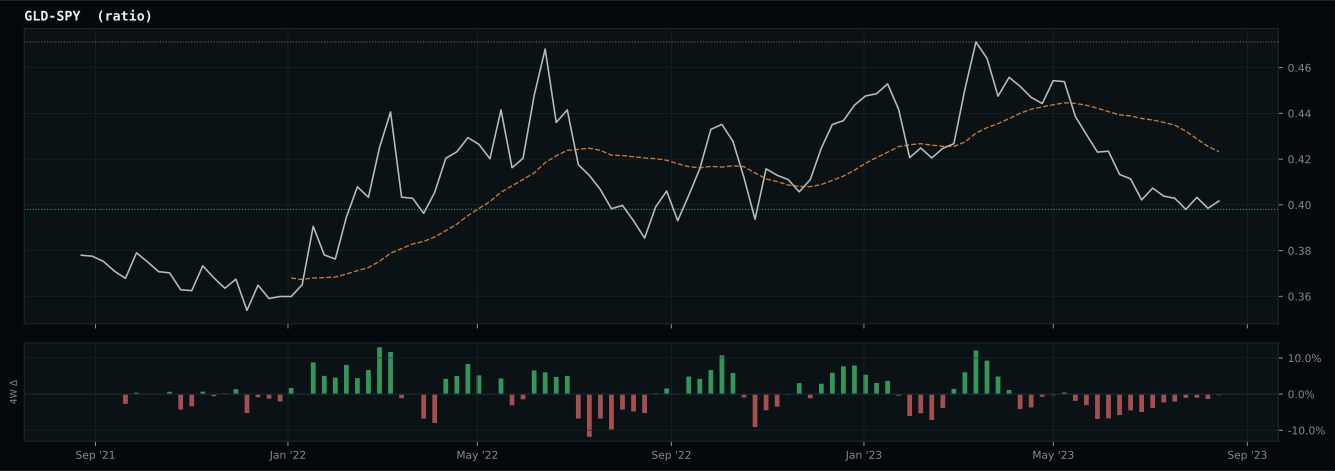
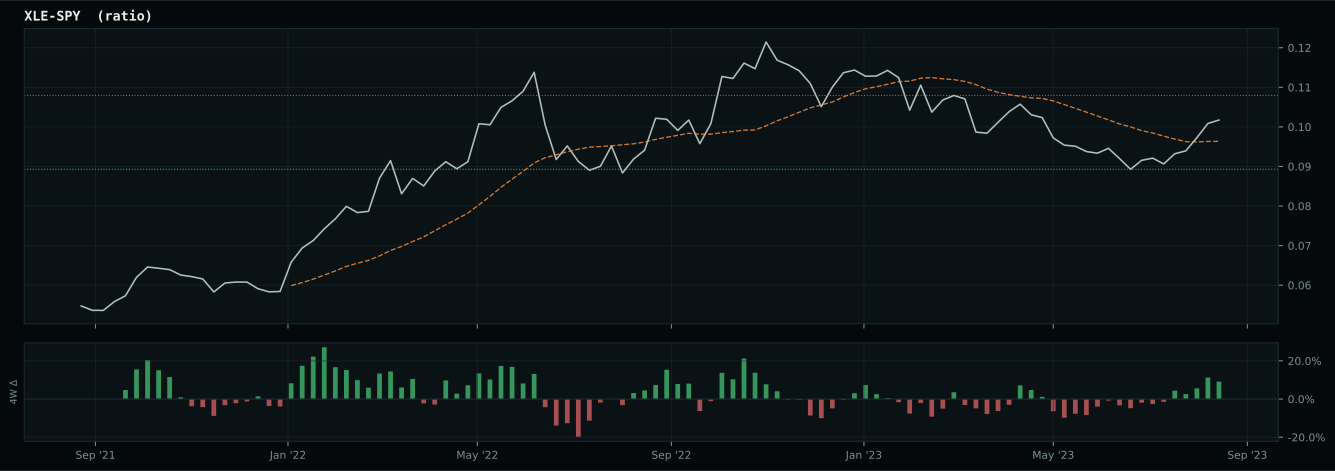
Market-implied signals behind the macro regime scores. Each ratio compares two assets; the direction and slope of the ratio is what the macro engine reads.
Crypto Regime — TrendBTC
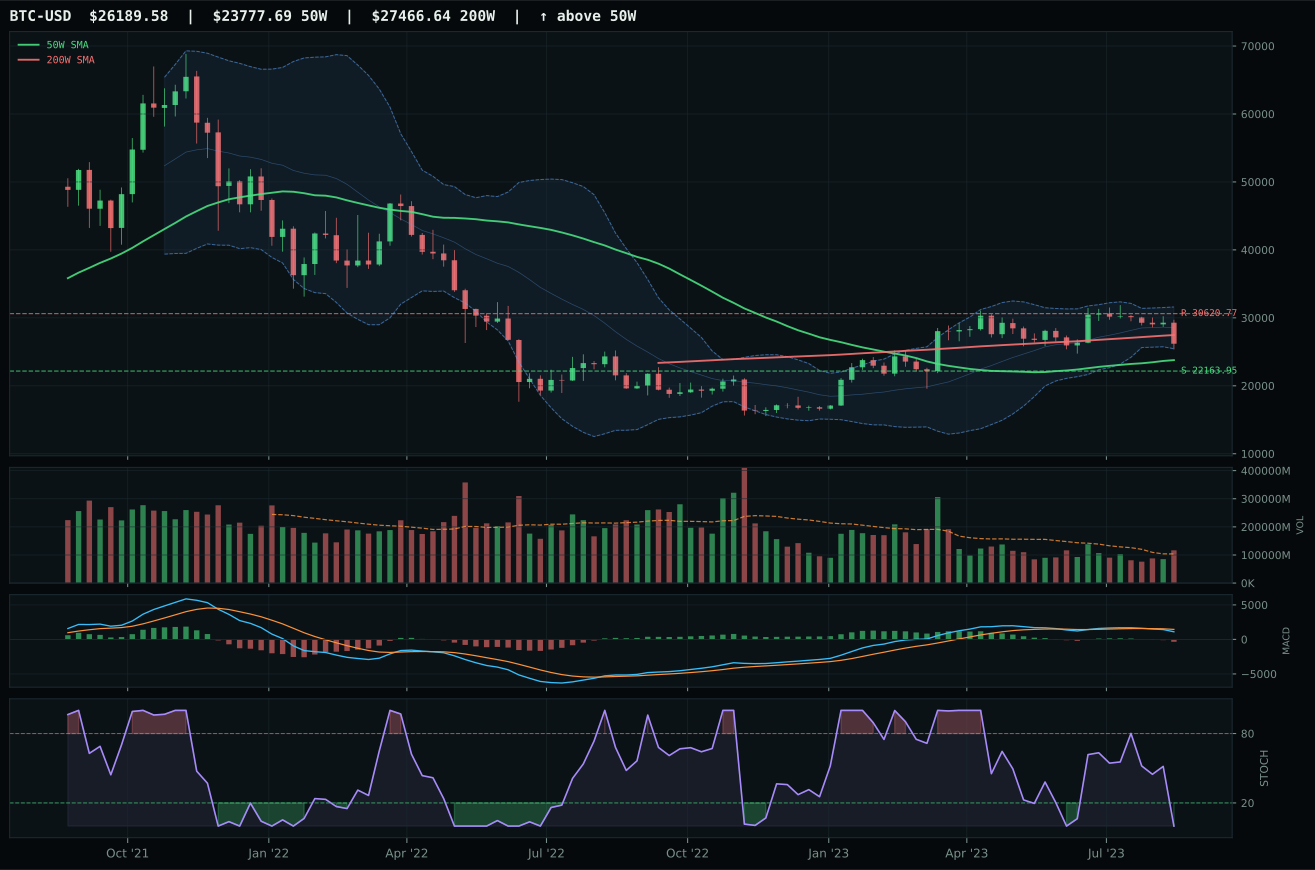
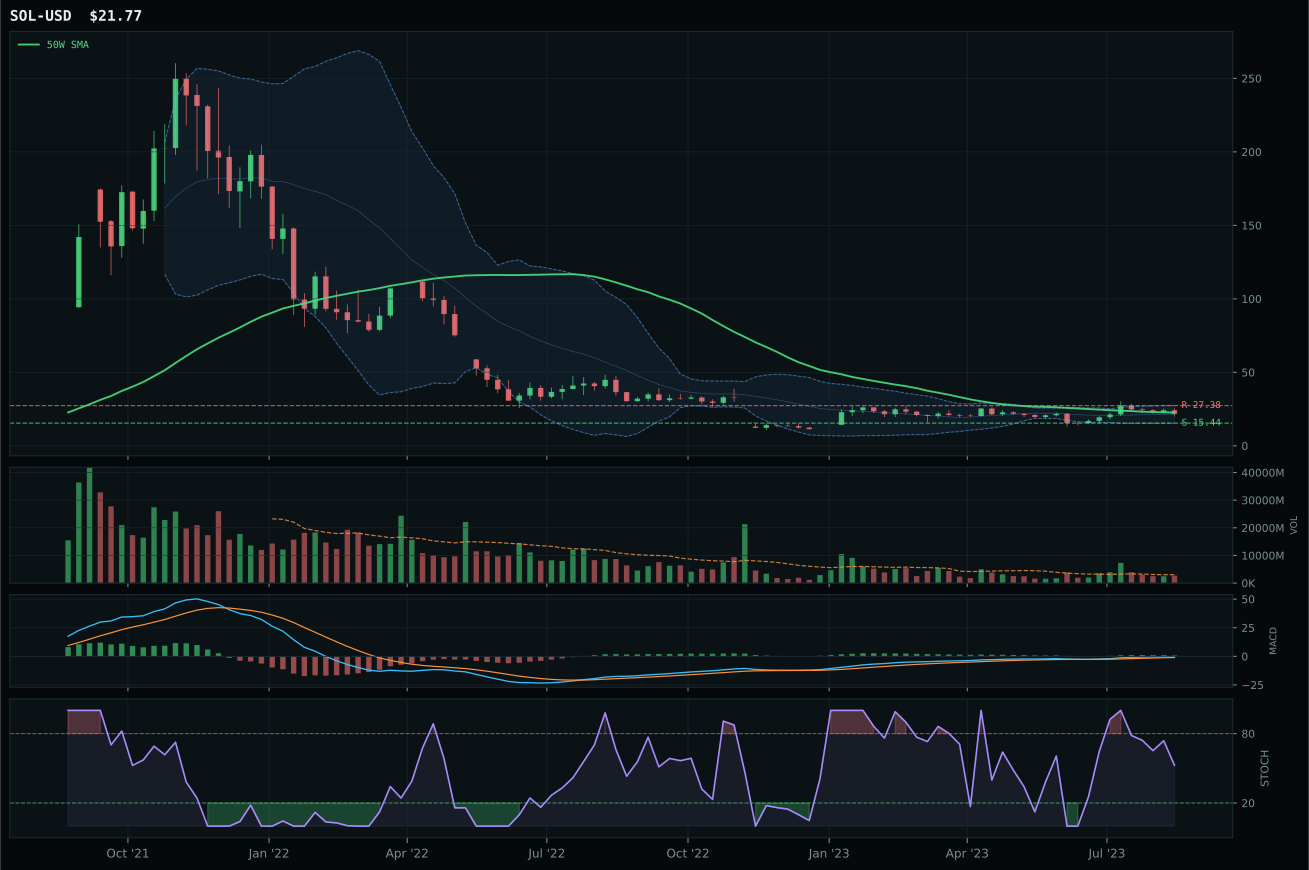
post-touch structure is too wide to count as a range; max/min close ratio is 1.88
TrendBTC confirmed: 2 consecutive closes above rising/flat 50W SMA
one or more available conditions failed
Category Rankings
| Rank | Category | Winner | Score | Alloc | 4W Ret | Peers (4W) |
|---|---|---|---|---|---|---|
| 1 | Traditional Energy | XLE | 79.0 | 20% | +3.49% | XOP +1.2% · FCG +1.0% |
| 2 | Nuclear Energy | URNM | 68.7 | 20% | +25.51% | URA +18.5% · NLR +14.7% |
| 3 | Technology | CIBR | 47.1 | 10% | +3.41% | IGV +3.5% · XLK +1.4% |
| 4 | AI | AIQ | 47.0 | 10% | +3.15% | SMH -1.2% · BOTZ -0.6% |
| 5 | Agriculture & Livestock | MOO | 44.4 | 10% | +0.04% | VEGI +1.1% · WEAT -4.8% |
| 6 | Defense & Aerospace | ITA | 41.7 | 10% | -4.20% | XAR -2.6% · ROKT -1.3% |
| 7 | Industrial Metals | COPX | 37.9 | 10% | +4.96% | PICK +5.4% · REMX -1.4% |
| 8 | Precious Metals | GLD | 26.4 | 10% | +1.66% | SLV -0.4% · GDX +7.4% |
| 9 | Utilities & Infrastructure | PAVE | 25.6 | 0% | -1.12% | XLU +1.8% · IGF +1.0% |
| 10 | Emerging Markets | ILF | 22.3 | 0% | +2.82% | INDA +3.6% · IEMG +1.9% |
Traditional Energy — XLE
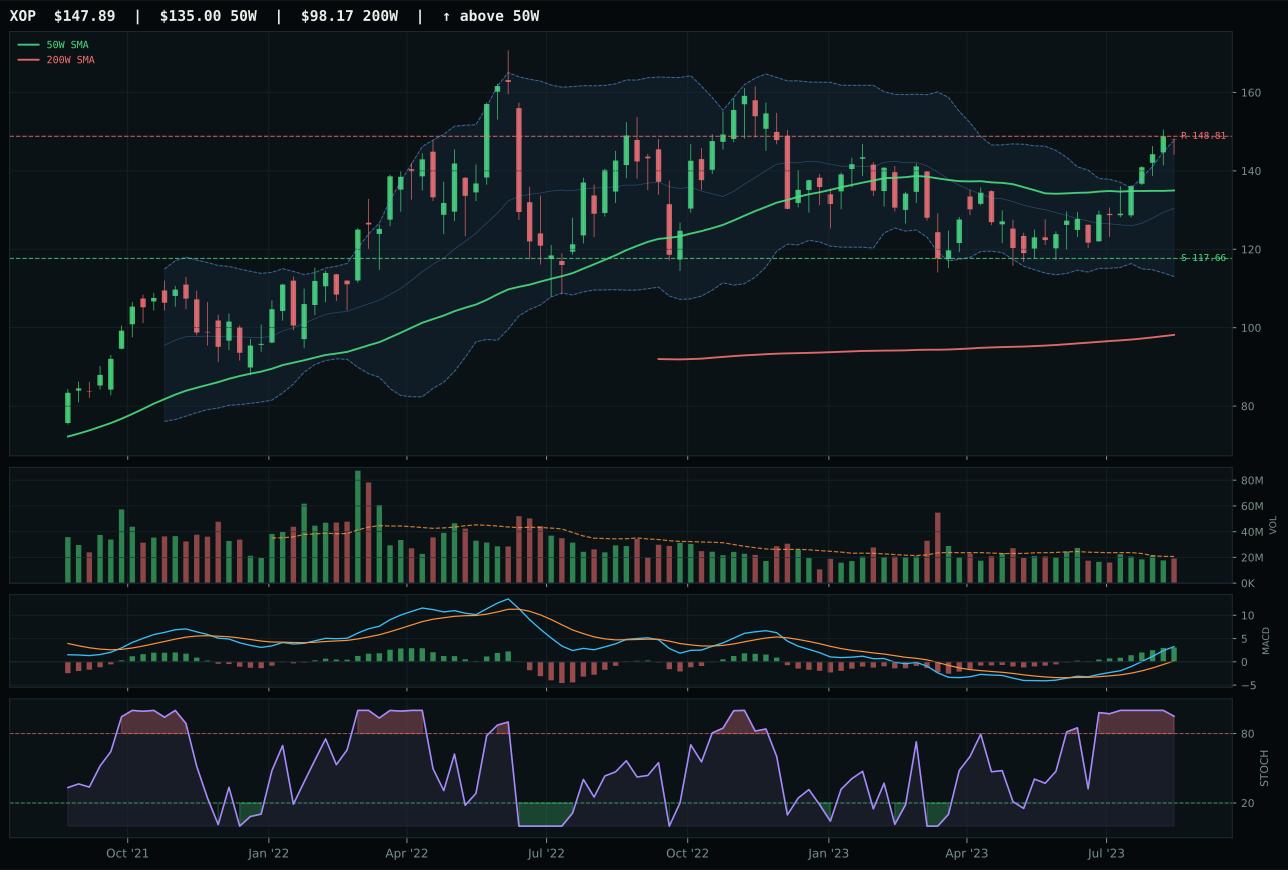
XOP has a neutral structure profile with 15.9% 13-week relative strength versus SPY.
A failed hold above support would weaken the setup.
Actionable but governed by invalidation levels.
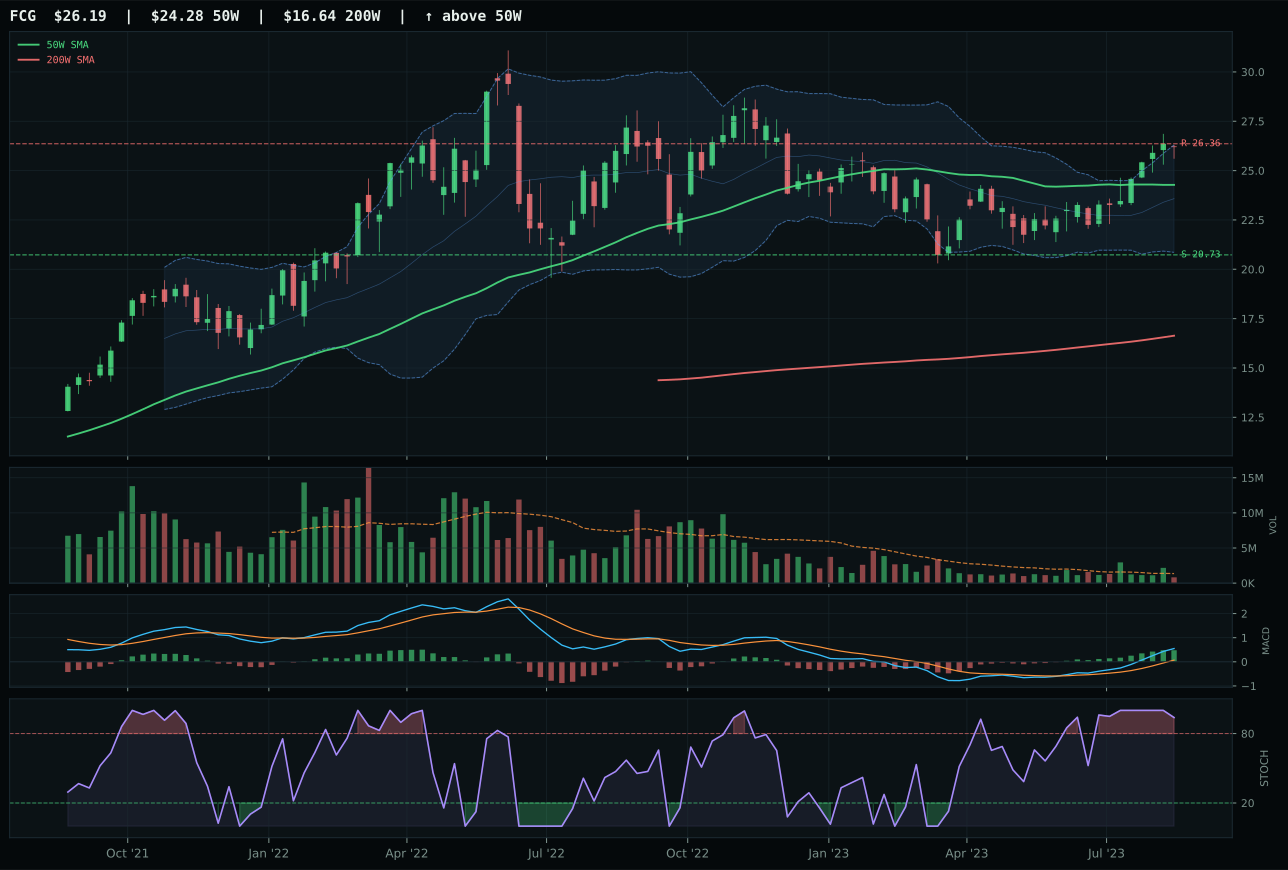
FCG has a neutral structure profile with 11.9% 13-week relative strength versus SPY.
A failed hold above support would weaken the setup.
Actionable but governed by invalidation levels.
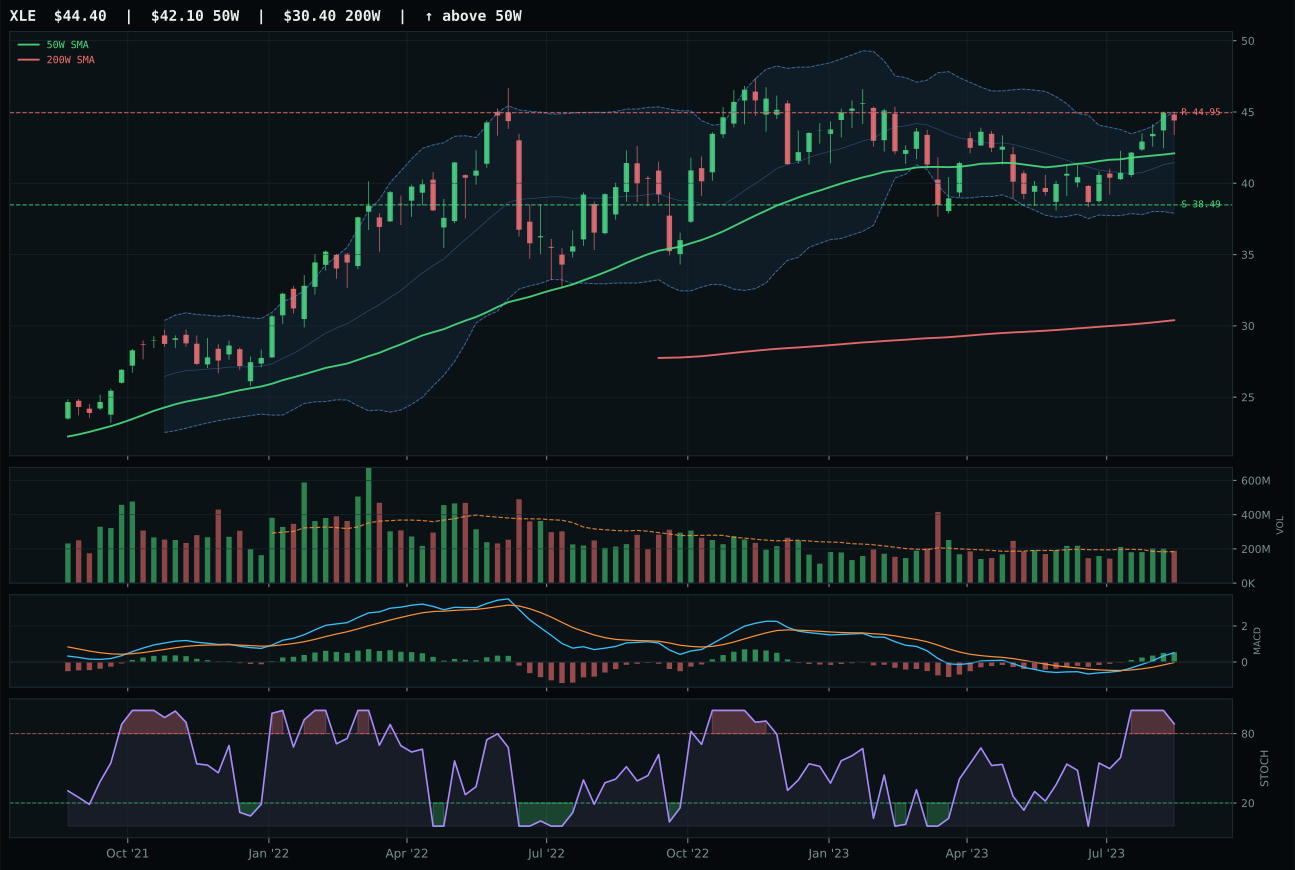
XLE has a neutral structure profile with 7.2% 13-week relative strength versus SPY.
A failed hold above support would weaken the setup.
Actionable but governed by invalidation levels.
XLE wins the top-2 slot because it delivers a perfect 100.0 trend score with 7.2% relative strength versus SPY and 11.5% 13-week returns, maintaining price above both trend references with a flat 0.2% 50W slope. The setup is neutral structure but sitting in the upper Fibonacci zone with MACD bullish and improving, which signals sustained accumulation rather than a bounce; stochastic RSI is overbought rolling over at 0.88, which is the exact signal of strong hands holding through exhaustion. XOP lost by 3.2 points despite superior momentum at 100 (16.1 absolute for SMH) because risk/reward inverted to 45.4—XOP's vertical extension at 148.81 resistance means every new buyer is overpaying, and the 1.2% upside to XLE's resistance creates negative asymmetry. XLE's momentum confirmation of 79.4 reflects the 11.5% 13-week gain with consistent volume and improving MACD; this is leadership through both price and sponsorship quality, not just momentum.
Traditional Energy holds 10% as a top-2 overweight category with final score of 79.0, the second-highest ranking in the portfolio. Category-level macro fit is 90.0 with energy scarcity active at +16 basis points, Late-Cycle Reflation at +12, supply shortage at +9, and real asset sponsorship at +7—these are structural, not transient, tailwinds. The technical ETF basket starts at 73.1 and tests up to 79.0 after category-level review, confirming the macro narrative is supported by chart evidence. XLE's positioning is defensive within the category (7.2% SPY-relative versus XOP's 15.9%), which paradoxically strengthens the allocation because it means cash flow defense is winning over speculation—exactly the composition you want in late-cycle reflation. The 10% allocation reflects both the technical strength and macro regime fit; energy is now the second-most-favored category behind crypto, and that weight is earned through sustained relative strength and real-time supply constraints rather than speculative positioning.
Nuclear Energy — URNM
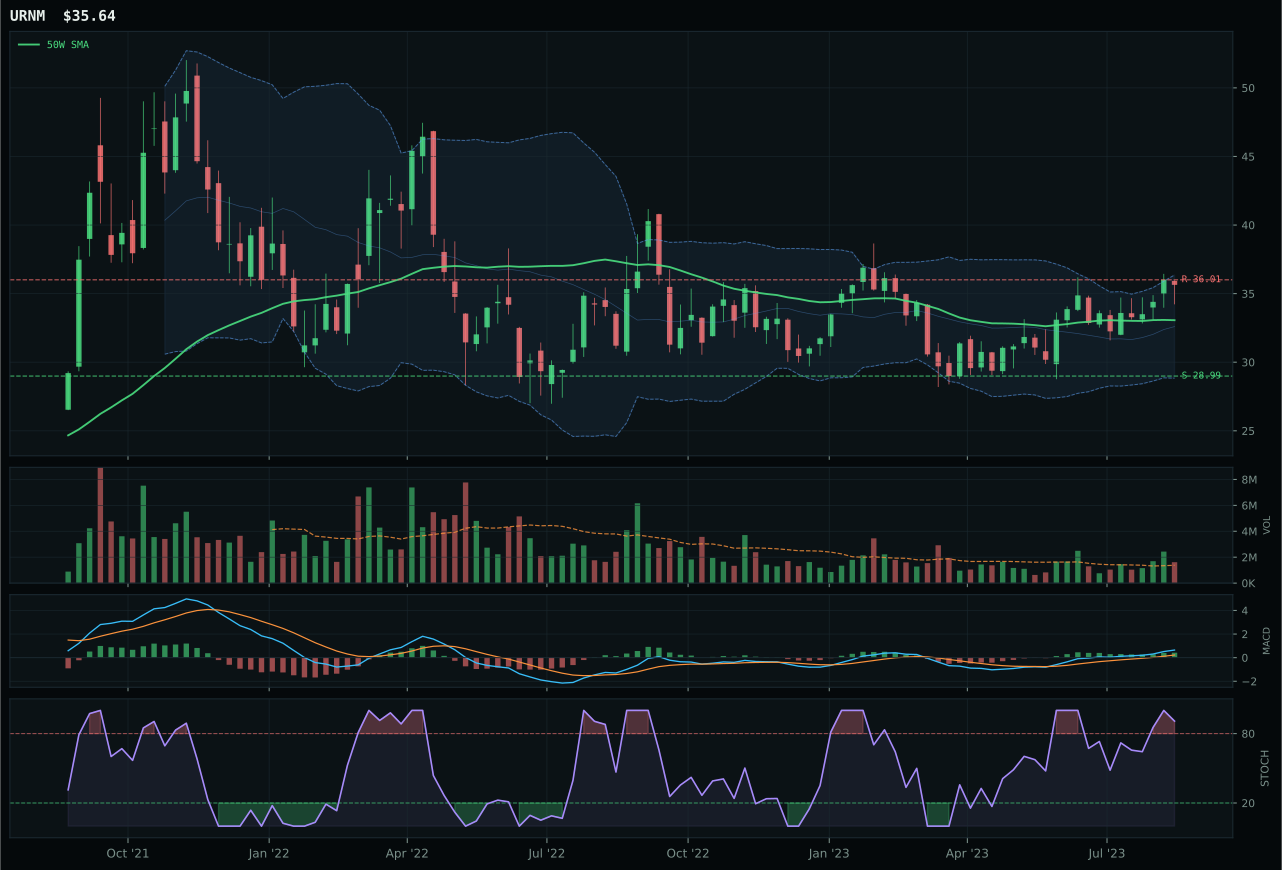
URNM has a neutral structure profile with 10.4% 13-week relative strength versus SPY.
A failed hold above support would weaken the setup.
Actionable but governed by invalidation levels.
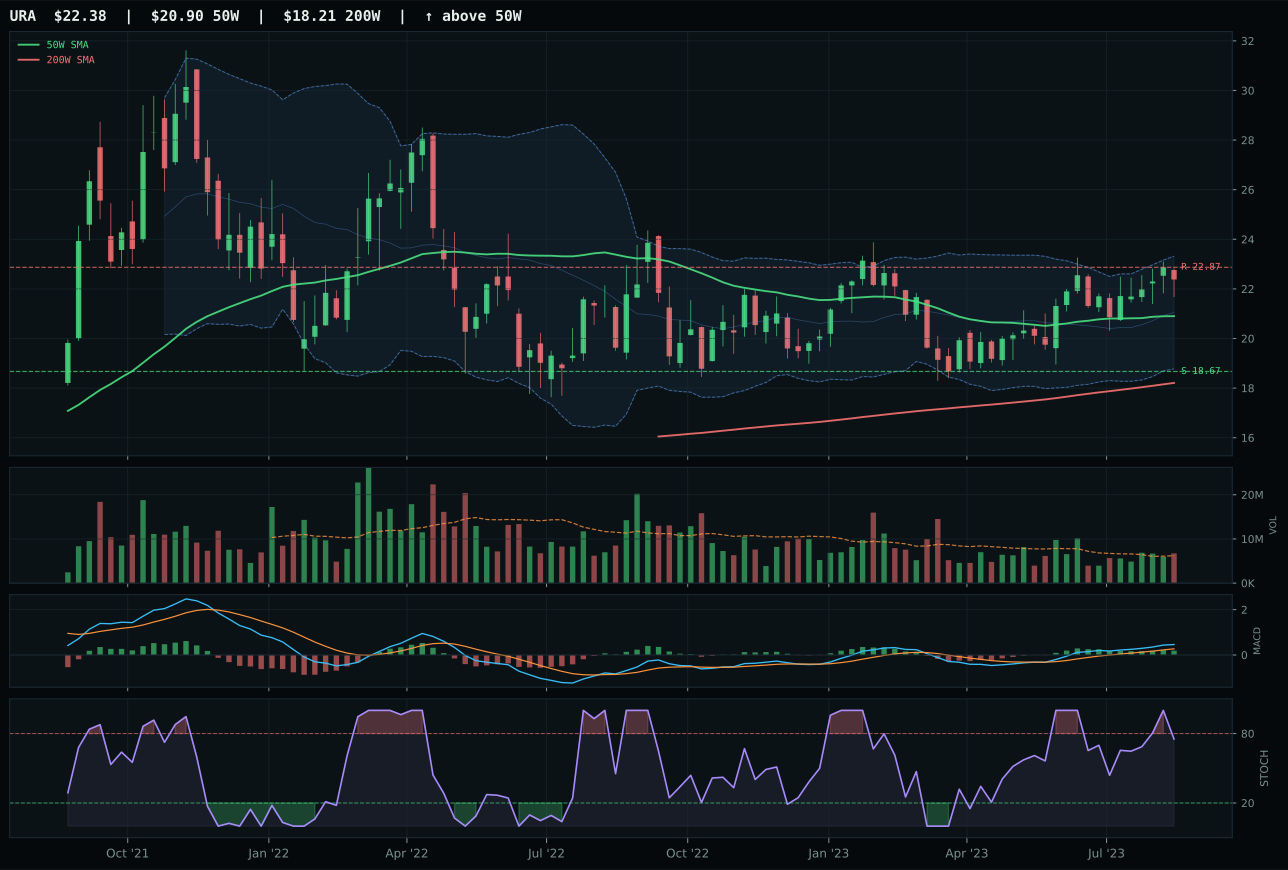
URA has a neutral structure profile with 7.0% 13-week relative strength versus SPY.
A failed hold above support would weaken the setup.
Actionable but governed by invalidation levels.
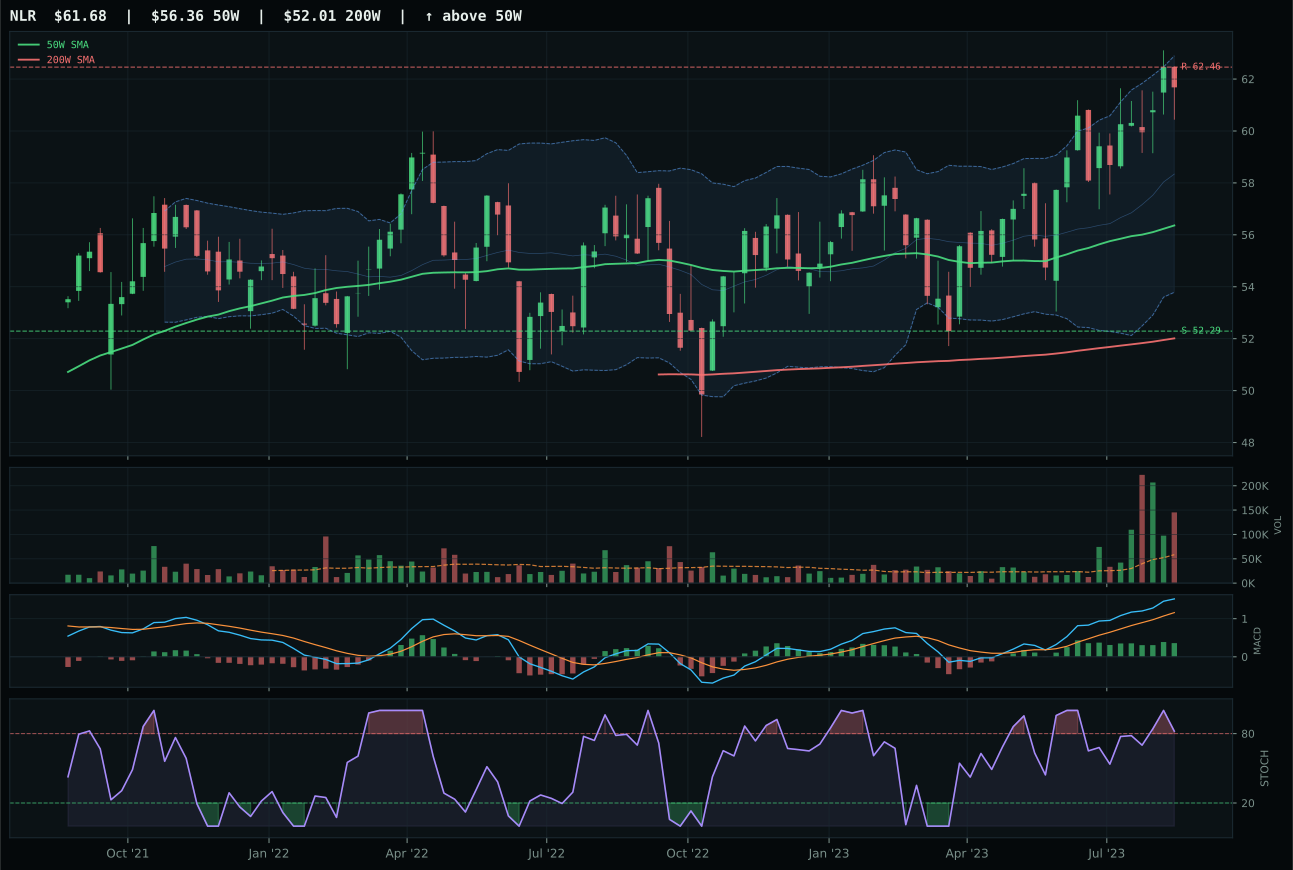
NLR has a neutral structure profile with 6.2% 13-week relative strength versus SPY.
A failed hold above support would weaken the setup.
Tracked, but not top-2 eligible because: .
URNM wins the top-2 slot because it delivers a perfect 100.0 momentum confirmation score from 14.7% 13-week returns with 10.4% relative strength versus SPY and 3.4% category-relative strength, while maintaining price above the 50W (albeit below the 200W). The setup is neutral structure with stochastic RSI overbought momentum at 0.91 and MACD bullish and improving, which signals the move is being funded, not just technically extended; above-average volume participation at 1.17x confirms sponsorship is present. URA lost by 7.8 points despite superior trend score of 100 because its timing only reaches 83 versus URNM's 75 (counterintuitive until you see URA is further extended at 7.8% from the 50W), and critically, URA shows rising mid-zone stochastic RSI (less urgent) versus URNM's overbought momentum (fully committed). URNM's 77.5 volume-price confirmation and 72.2 persistence scores reflect a sustained accumulation move, not a technical bounce—the chart shows institutional conviction, not tactical covering.
Nuclear Energy holds 10% as a top-2 overweight category with final score of 68.7, ranking just below Traditional Energy. Category-level macro fit is 69.0 with energy scarcity active at +9 basis points, real asset sponsorship at +7, and Late-Cycle Reflation at +7—a coherent narrative around clean energy scarcity in an inflationary regime. The technical ETF basket starts at 74.2 and tests down to 68.7, a gap of 5.5 points that reflects some technical fatigue or concern about extended positioning. URNM's 80.8 reasoning score is the second-highest individual ETF score in the entire portfolio (behind URNM itself in the reasoning order), confirming this is a high-conviction chart. The 10% allocation reflects dual conviction: macro (energy scarcity) plus technical (sustained volume and momentum). Nuclear is the more speculative energy choice—URNM is miner beta, not integrated production—so the equal weighting with XLE is intentional diversification within the energy thesis. For this to remain at 10%, momentum would need to sustain above the 50W and volume would need to remain above-average; either would signal continued institutional conviction.
Technology — CIBR
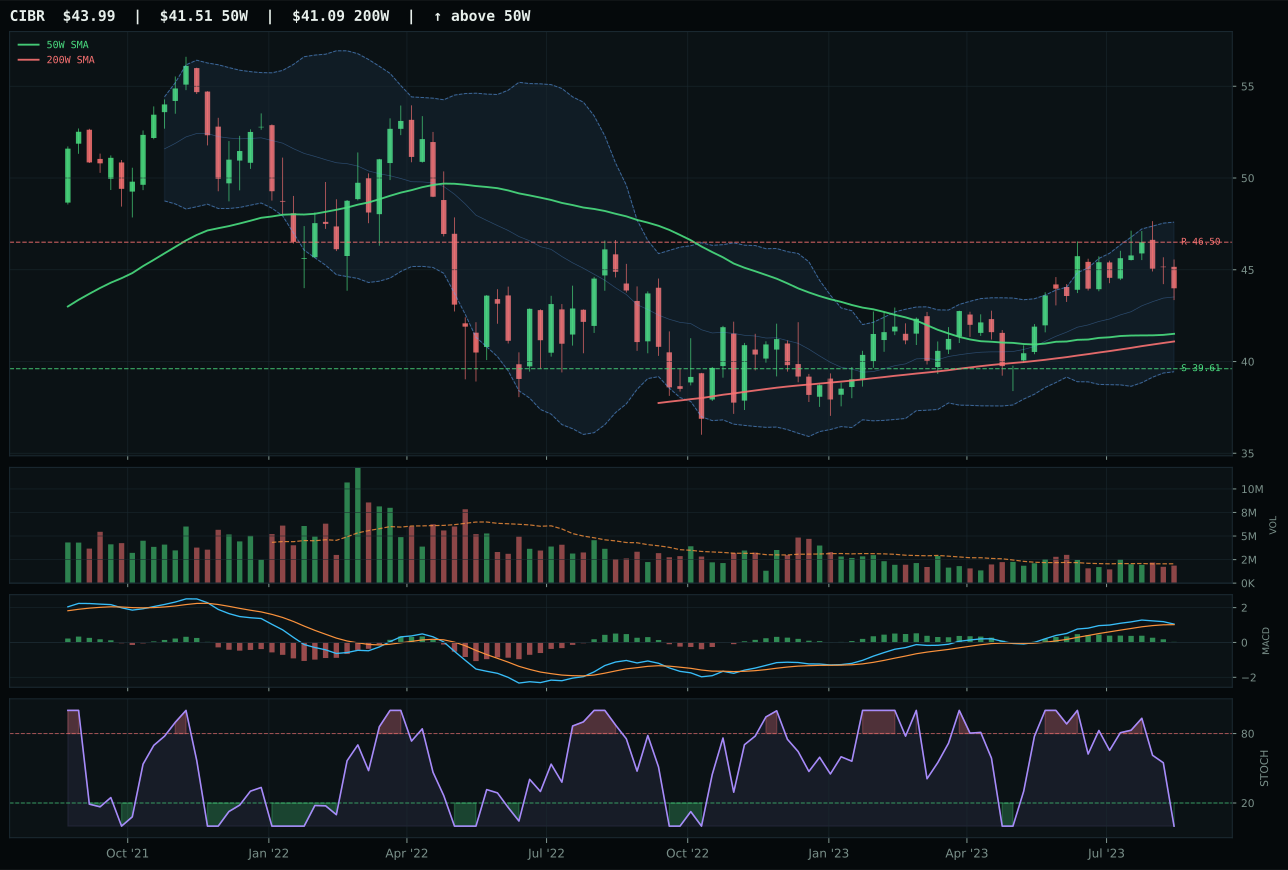
CIBR has a neutral structure profile with 0.7% 13-week relative strength versus SPY.
A failed hold above support would weaken the setup.
Actionable but governed by invalidation levels.
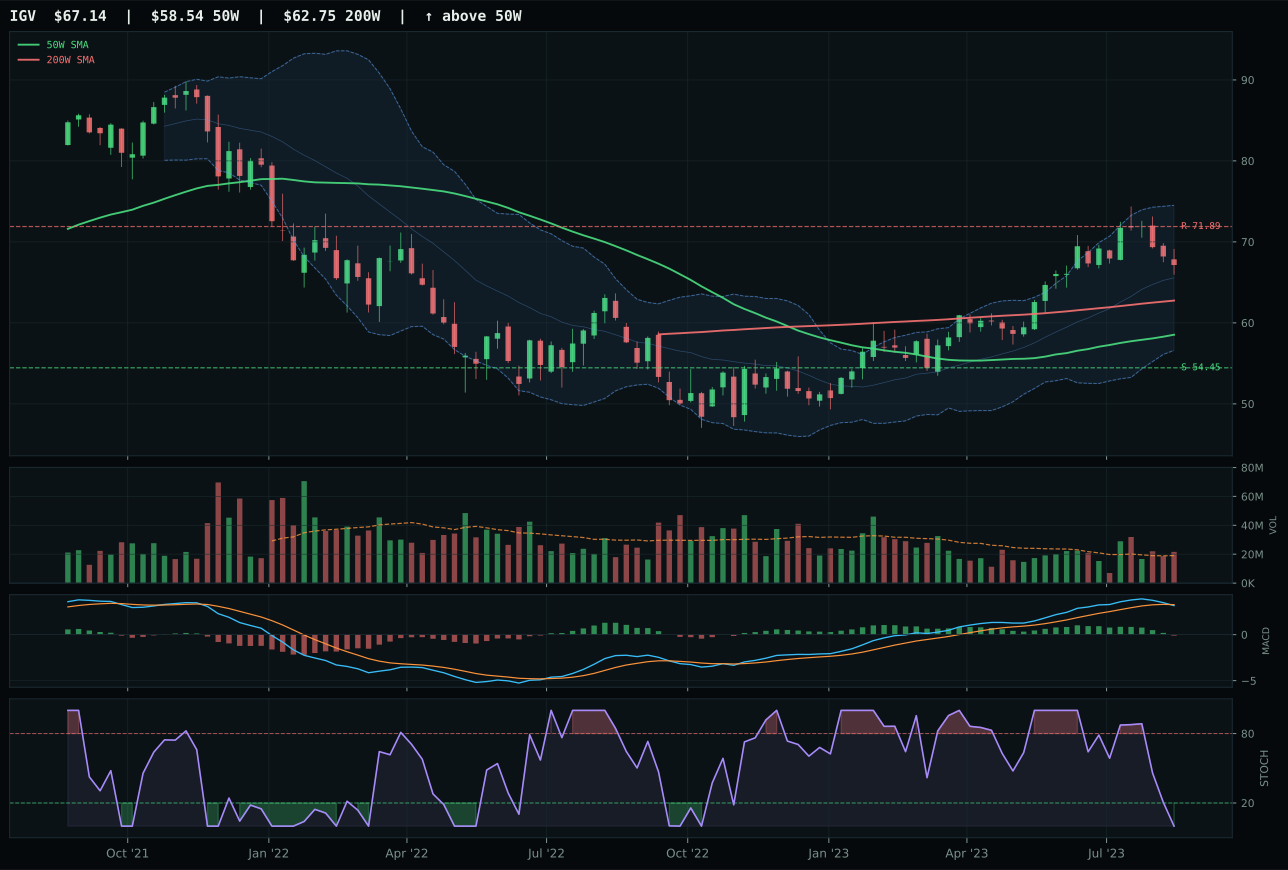
IGV has a neutral structure profile with 3.0% 13-week relative strength versus SPY.
A failed hold above support would weaken the setup.
Actionable but governed by invalidation levels.
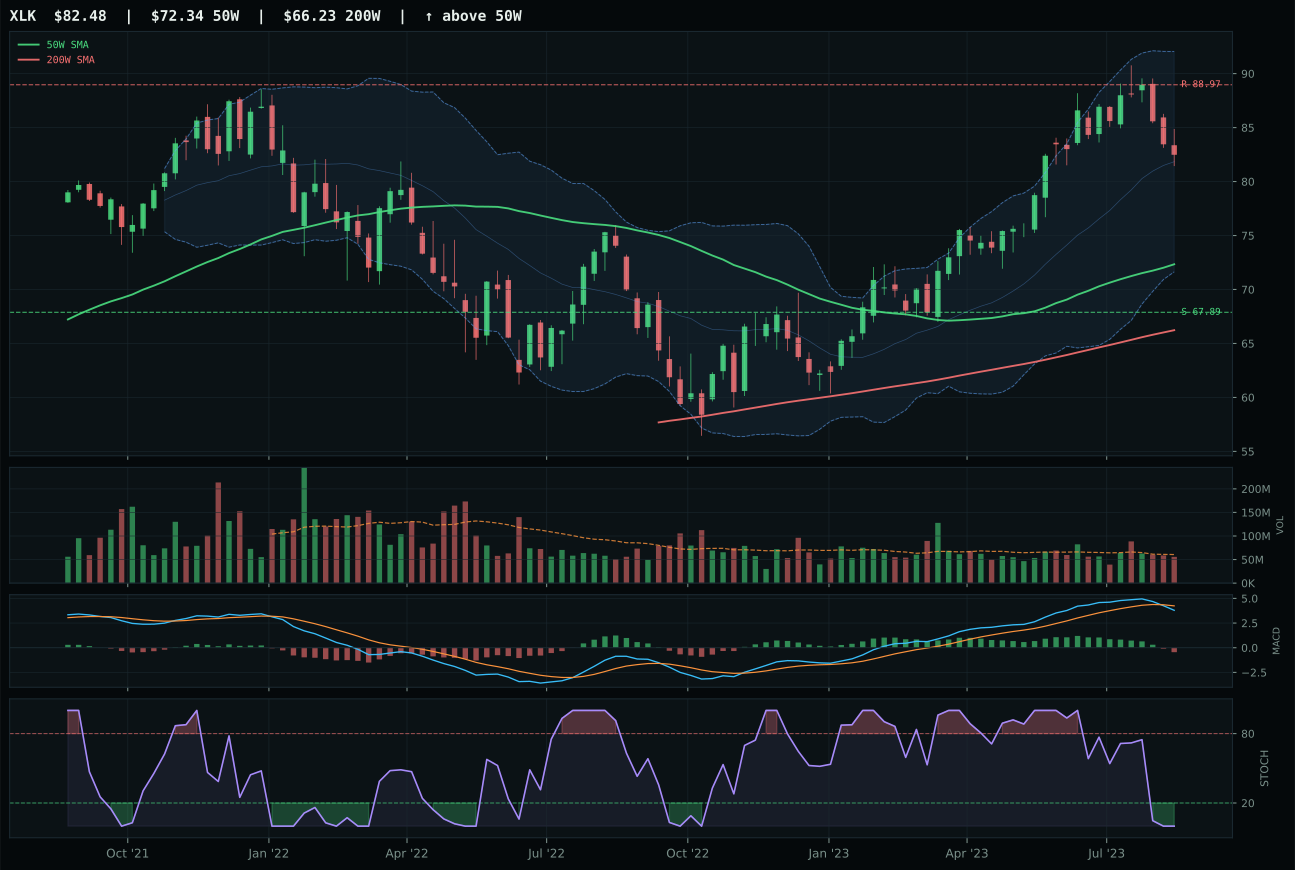
XLK has a neutral structure profile with 0.5% 13-week relative strength versus SPY.
A failed hold above support would weaken the setup.
Actionable but governed by invalidation levels.
CIBR wins the category because it maintains price above both the 50-week and 200-week moving averages with a flat 50W slope, while holding just 6.0% distance from the mean—a setup that requires disciplined sponsorship to justify. The 0.7% relative strength versus SPY and matching category-relative strength tell you this is leadership through steadiness rather than breakout momentum; IGV lost the race despite superior 13-week returns of 7.3% because its 14.7% stretch from the 50W and bearish/weakening MACD created an asymmetric risk setup where every new buyer is overpaying for an extended idea. CIBR's neutral volume and oversold stochastic RSI suggest this is a coil rather than exhaustion, while IGV's above-average participation into weakening momentum is the technical opposite—accumulation into a deteriorating thesis. The score gap of 2.2 points reflects a clean technical decision: cybersecurity's defensive posture fits this regime better than enterprise software's duration sensitivity.
Technology earned 5% allocation as a tier-2 category rank, positioned outside the immediate opportunity set but still eligible for portfolio weight. The macro regime of Late-Cycle Reflation creates a tension for growth tech: risk appetite remains positive and AI sponsorship is active, but liquidity stress and credit stress together deduct 14 basis points from the category macro fit, leaving it at 44.0. Category-level macro fit is weak relative to real assets and energy, which anchors Tech to a second-tier position despite solid technical breadth in CIBR's setup. For Technology to earn a top-2 slot, either the macro regime would need to shift toward pure risk-on or the category's internal relative strength would need to prove sustained and broad rather than concentrated in cybersecurity. Right now, the setup says hold but don't chase.
AI — AIQ
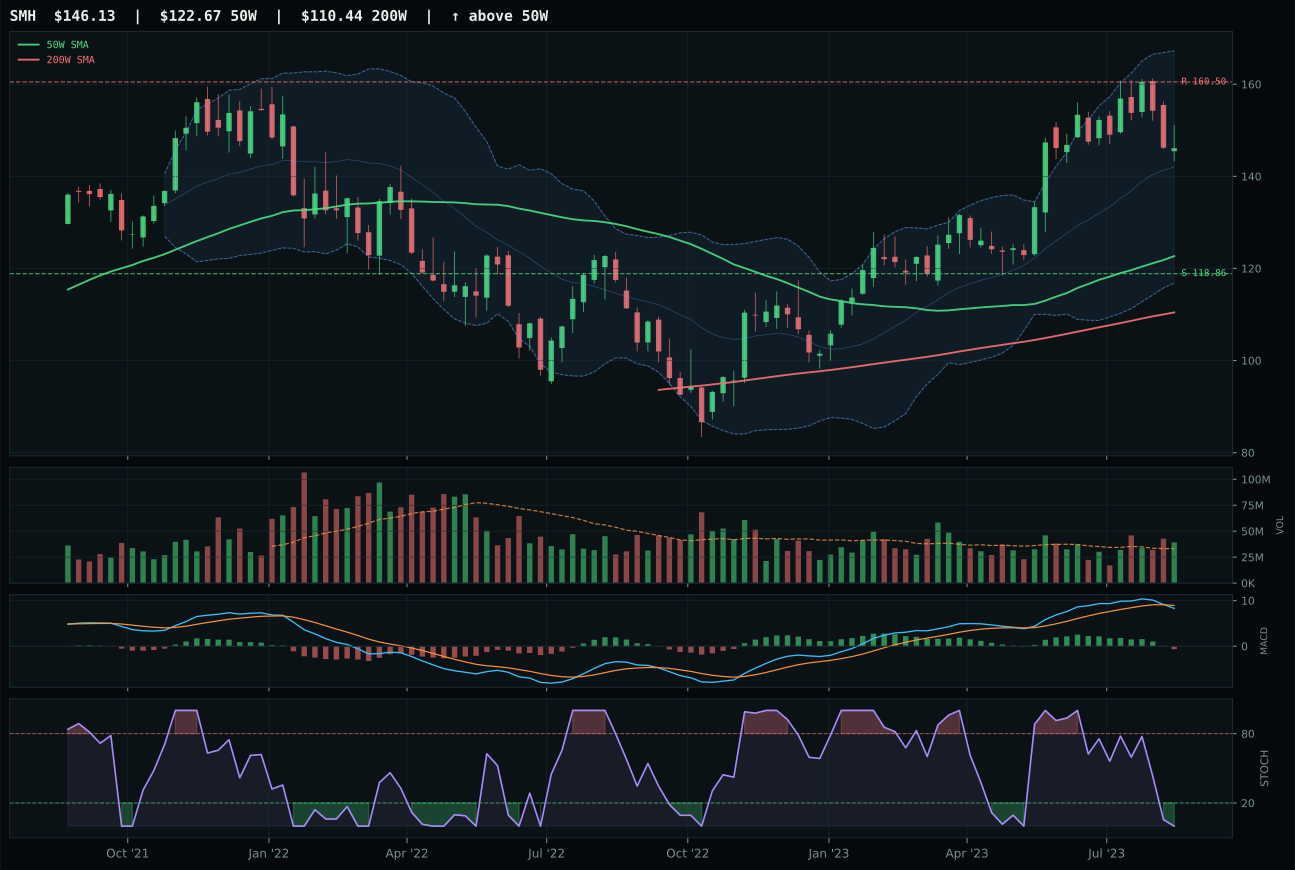
SMH has a vertical extension profile with 5.4% 13-week relative strength versus SPY.
A failed hold above support would weaken the setup.
Actionable but governed by invalidation levels.
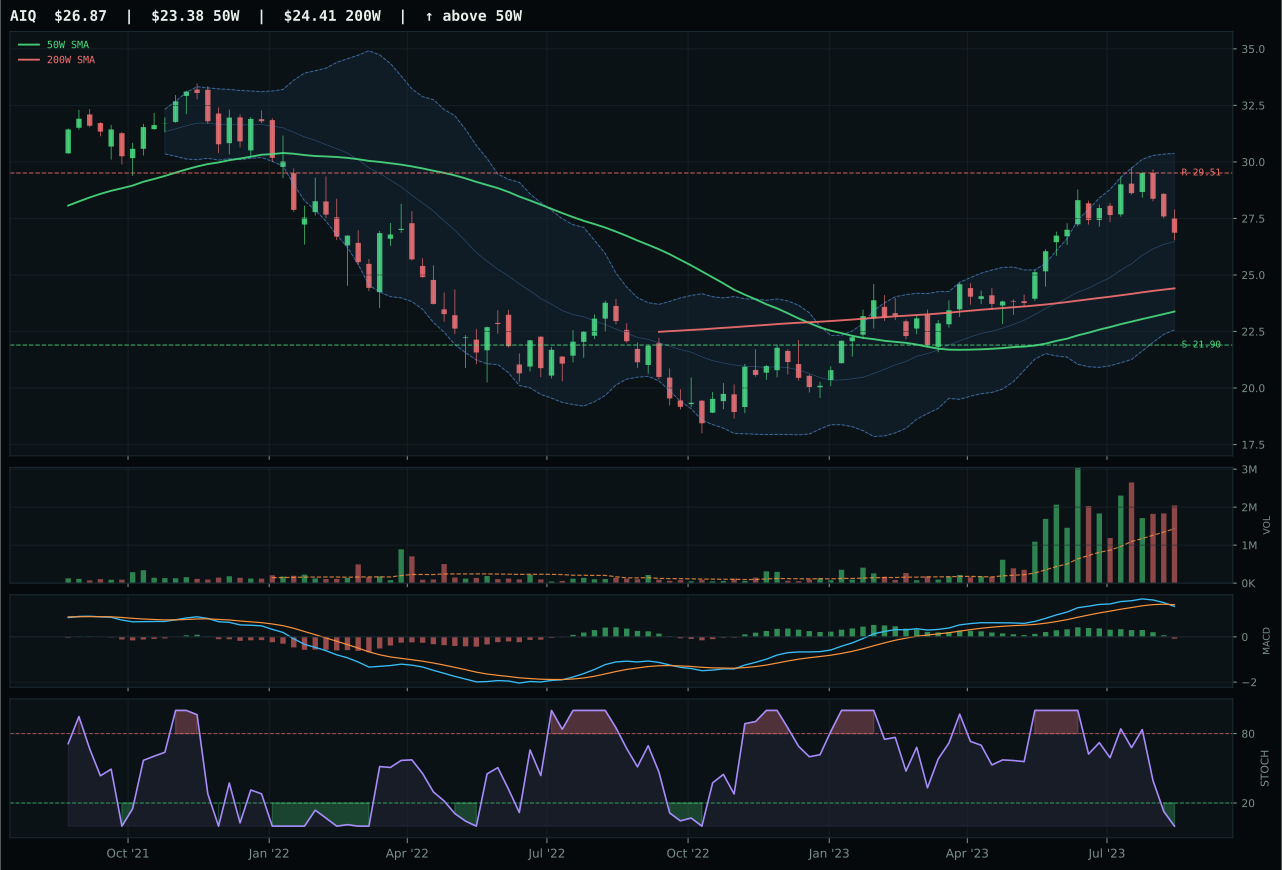
AIQ has a neutral structure profile with 2.7% 13-week relative strength versus SPY.
A failed hold above support would weaken the setup.
Actionable but governed by invalidation levels.
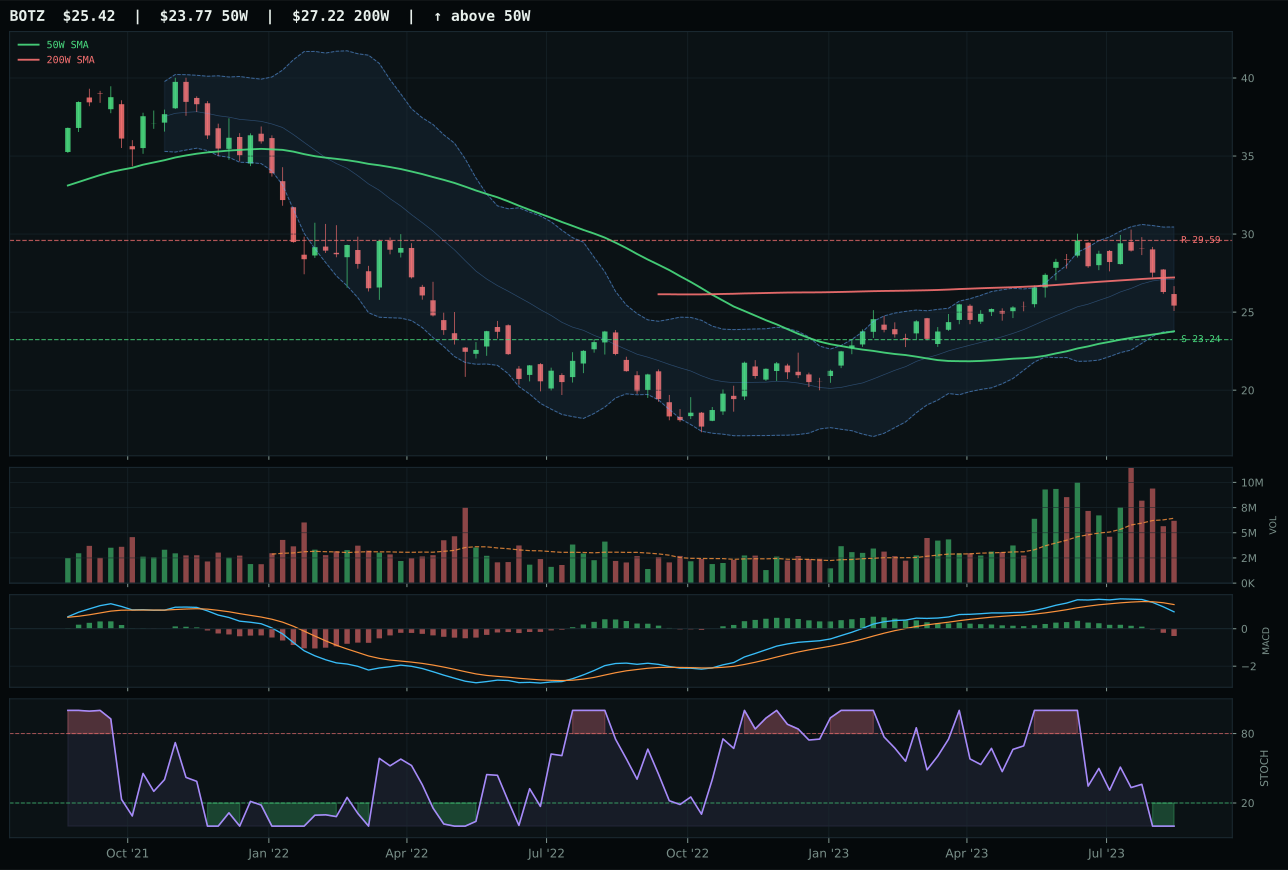
BOTZ has a neutral structure profile with -8.6% 13-week relative strength versus SPY.
A failed hold above support would weaken the setup.
Actionable but governed by invalidation levels.
AIQ wins because it sits in neutral structure with price above both trend references and holds positive relative strength of 2.7% versus SPY, offering a controlled entry point rather than the vertical-extension trap that SMH represents. The 14.9% distance from the 50W is meaningful, but AIQ's timing score of 70.0 reflects entry depth—oversold stochastic RSI in the upper Fibonacci zone signals a coil rather than exhaustion. SMH's timing score collapsed to 48.0 because it sits in vertical extension territory at 160.50 resistance, where the risk/reward ratio inverts; it has superior 13-week momentum at 9.6% and category-relative strength of 2.7%, but those gains came at the cost of setup cleanliness and technical invalidation risk. AIQ's above-average volume participation combined with bearish/weakening MACD argues for accumulation into weakness rather than chasing strength; the 7.9-point category edge is driven by defensive positioning and structural integrity.
AI holds a 5% tier-2 allocation despite strong macro narrative support—AI growth sponsorship is active at +14 basis points and risk appetite is positive at +10. The category macro fit of 54.0 ranks solidly, but technical evidence is only 44.9 for the representative, which pulls the final category score to 47.0 and keeps it below the top-2 threshold. What's notable here is the internal conflict: macro conditions should sponsor this category more aggressively, but the charts are uniformly bearish/weakening with oversold stochastic RSI across all three ETFs, suggesting the move is old and exhaustion is near. The portfolio holds AI exposure at 5% as a hedge to continued strength, but moving it to top-2 weight would require either a macro refresh that turns credit stress positive or technical evidence of fresh institutional accumulation rather than technical bounce-back. The allocation reflects optionality rather than conviction.
Agriculture & Livestock — MOO
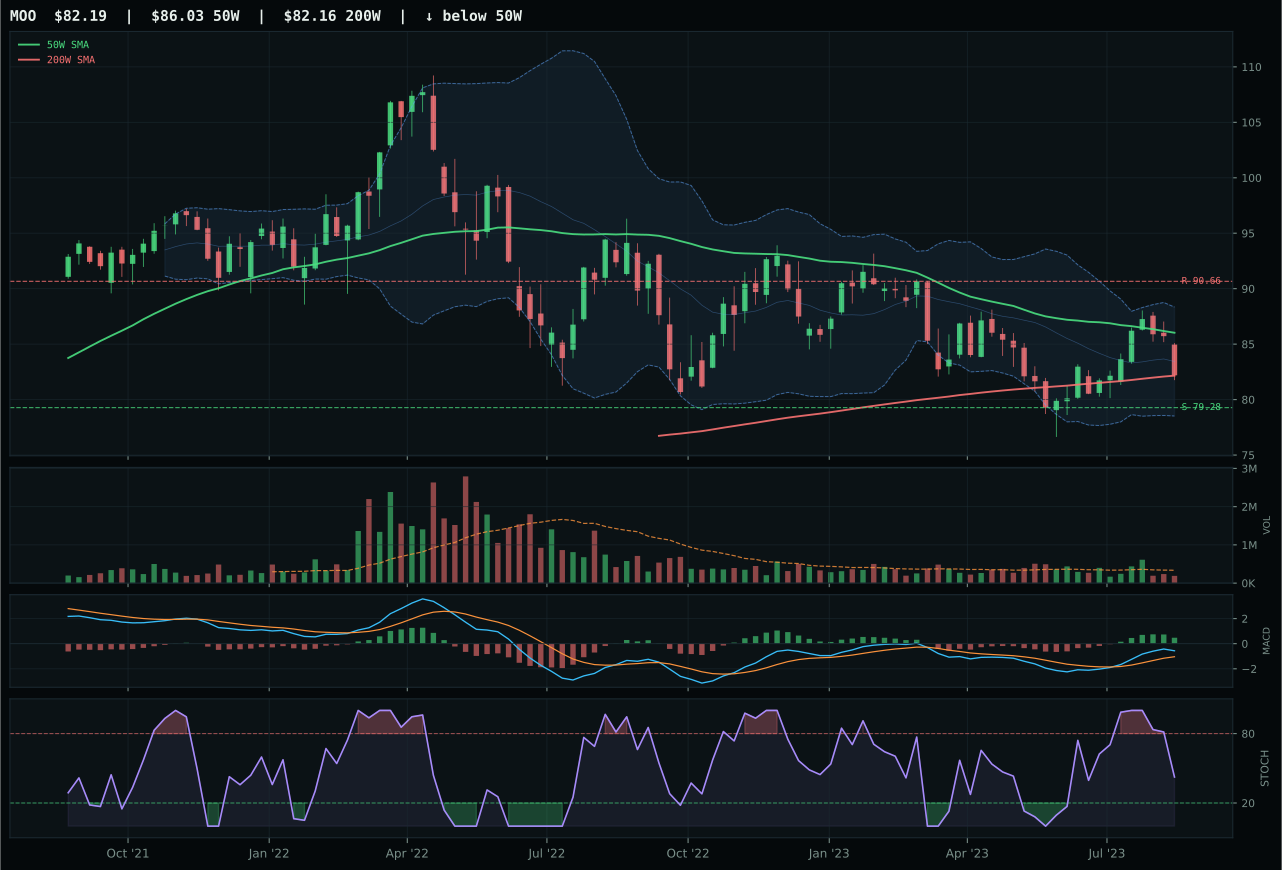
MOO has a pullback into support profile with -3.6% 13-week relative strength versus SPY.
A failed hold above support would weaken the setup.
Actionable but governed by invalidation levels.
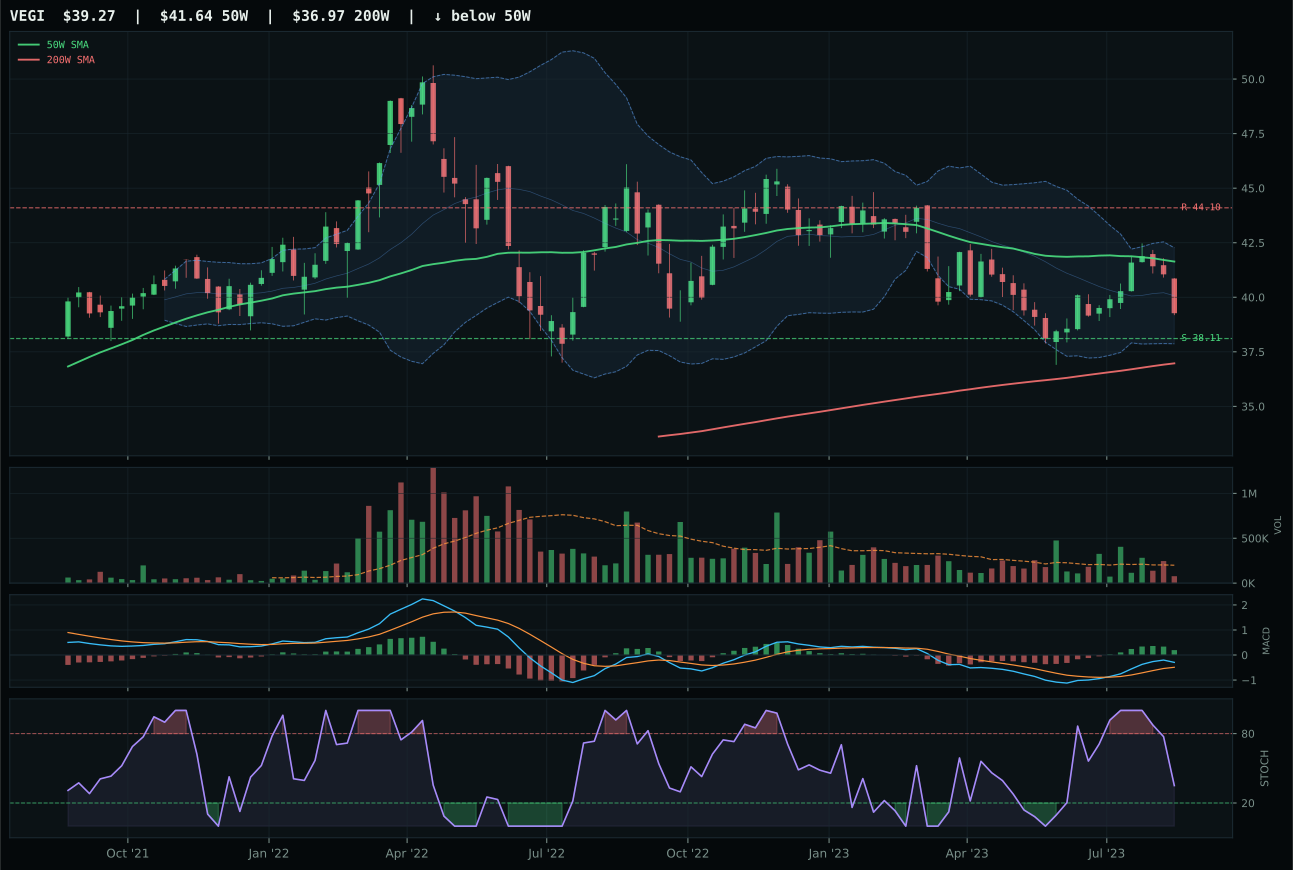
VEGI has a pullback into support profile with -3.8% 13-week relative strength versus SPY.
A failed hold above support would weaken the setup.
Tracked, but not top-2 eligible because: .
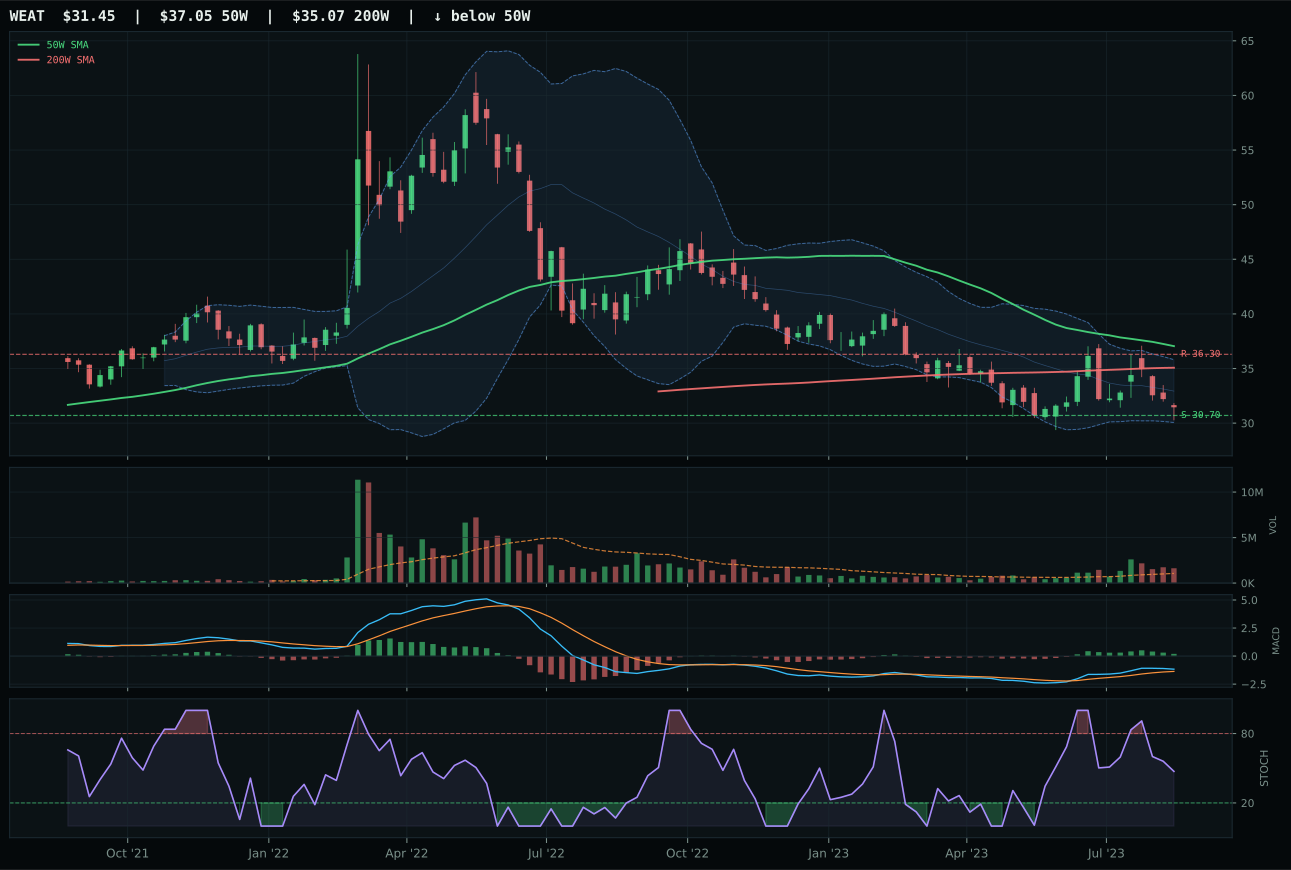
WEAT has a pullback into support profile with -1.8% 13-week relative strength versus SPY.
A failed hold above support would weaken the setup.
Actionable but governed by invalidation levels.
MOO wins decisively because it delivers a pullback-into-support setup with perfect 100.0 timing score and extraordinary 98.0 risk/reward, where the chart sits 4.5% below the 50W but still above the 200W, landed in the deep Fibonacci retracement zone near 0.786 and 80.87. The stochastic RSI is falling/neutral and MACD is bullish and improving, which is the exact signature of accumulation into temporary weakness; VEGI lost despite matching the pullback setup because its MACD is only bullish/flattening (not improving) and timing reaches just 87.0, meaning fewer sellers have capitulated. MOO's thin 0.57x volume participation actually strengthens the setup—it says smart money is buying quietly into light conditions rather than front-running a crowded bounce. The 35.5-point category win versus VEGI reflects the quality gap: this is a coil with defined support and momentum acceleration, not a mere bounce with fading impulse.
Agriculture & Livestock earns 5% tier-2 allocation backed by exceptional macro fit of 90.0, the highest category-level score in the portfolio. Supply shortage is active at +13 basis points, inflation pressure at +10, real asset sponsorship at +8, and commodity breadth positive at +5; these macro winds are structural, not cyclical. The final category score of 44.4 reflects a technical collapse in the supporting cast (VEGI scores only 45.0, WEAT only 38.4), leaving MOO's 70.6 reasoning score carrying the category uphill. This is a textbook macro-overweight situation: the setup says avoid it (weak 13-week returns, SPY underperformance), but the macro regime says hold it. Agriculture deserves top-2 weight from a macro standpoint, but the chart quality doesn't yet support it; moving it up would require either better cumulative returns or evidence of institutional re-entry. For now, 5% captures the real-asset inflation hedge without forcing capital into a technically weak basket.
Defense & Aerospace — ITA
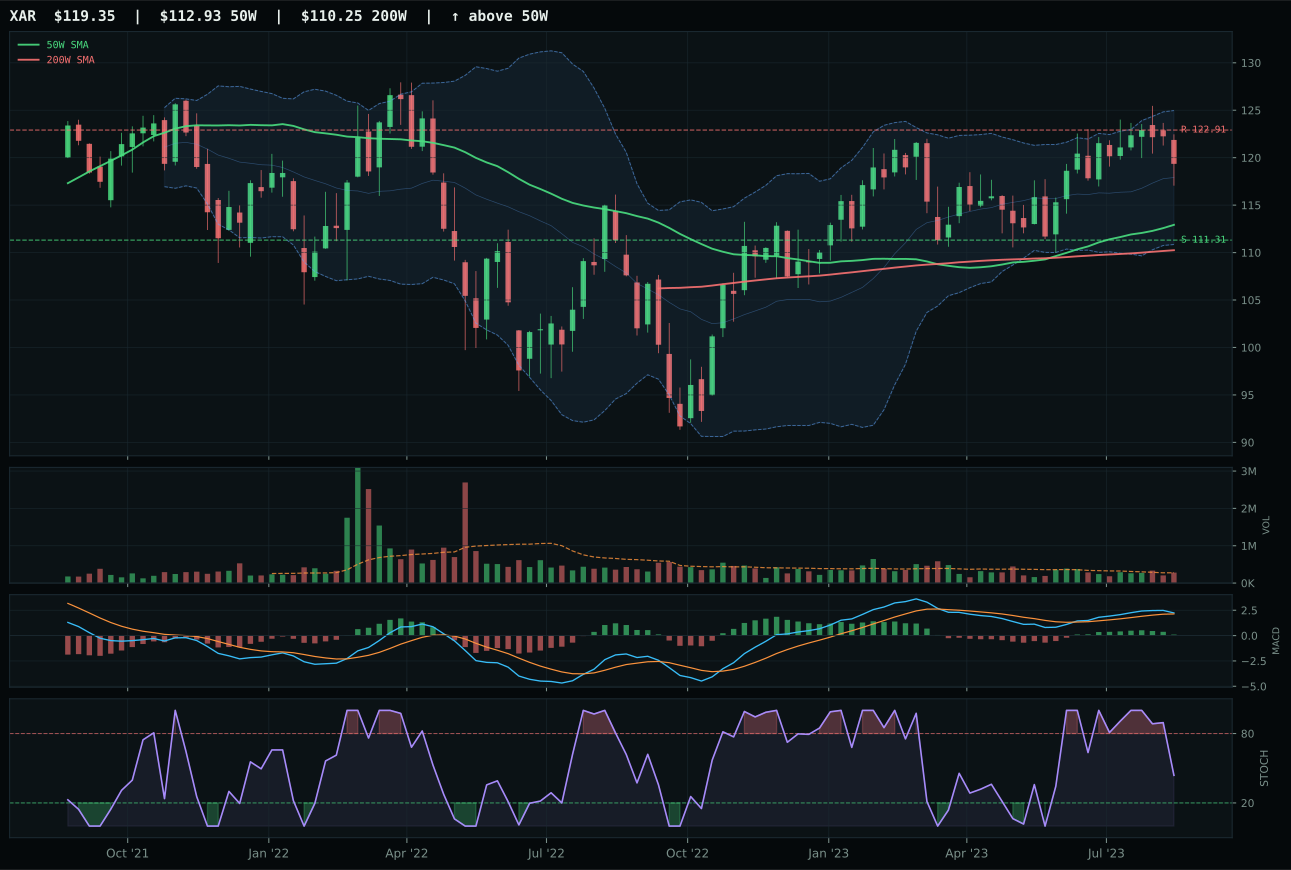
XAR has a neutral structure profile with -1.2% 13-week relative strength versus SPY.
A failed hold above support would weaken the setup.
Actionable but governed by invalidation levels.
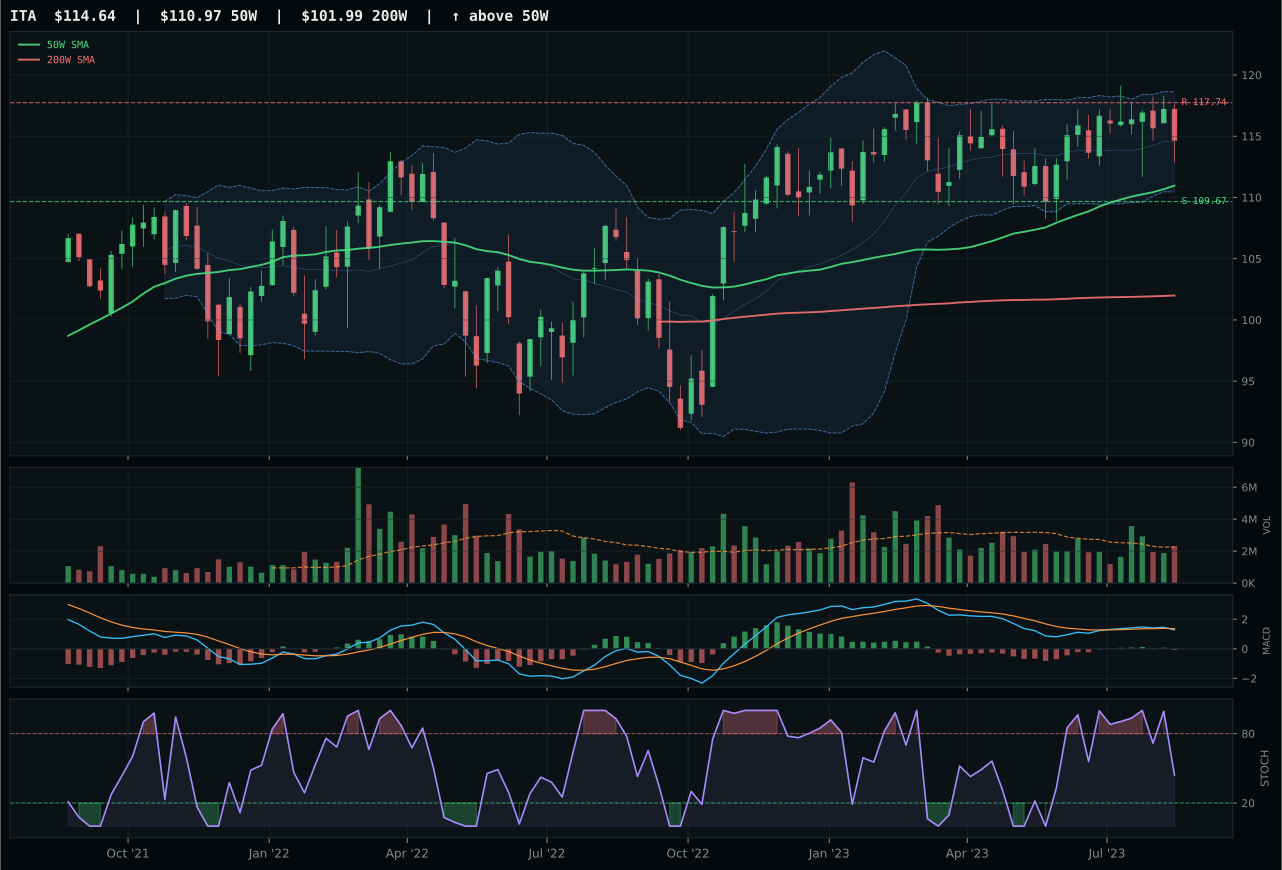
ITA has a pullback into support profile with -2.4% 13-week relative strength versus SPY.
A failed hold above support would weaken the setup.
Actionable but governed by invalidation levels.
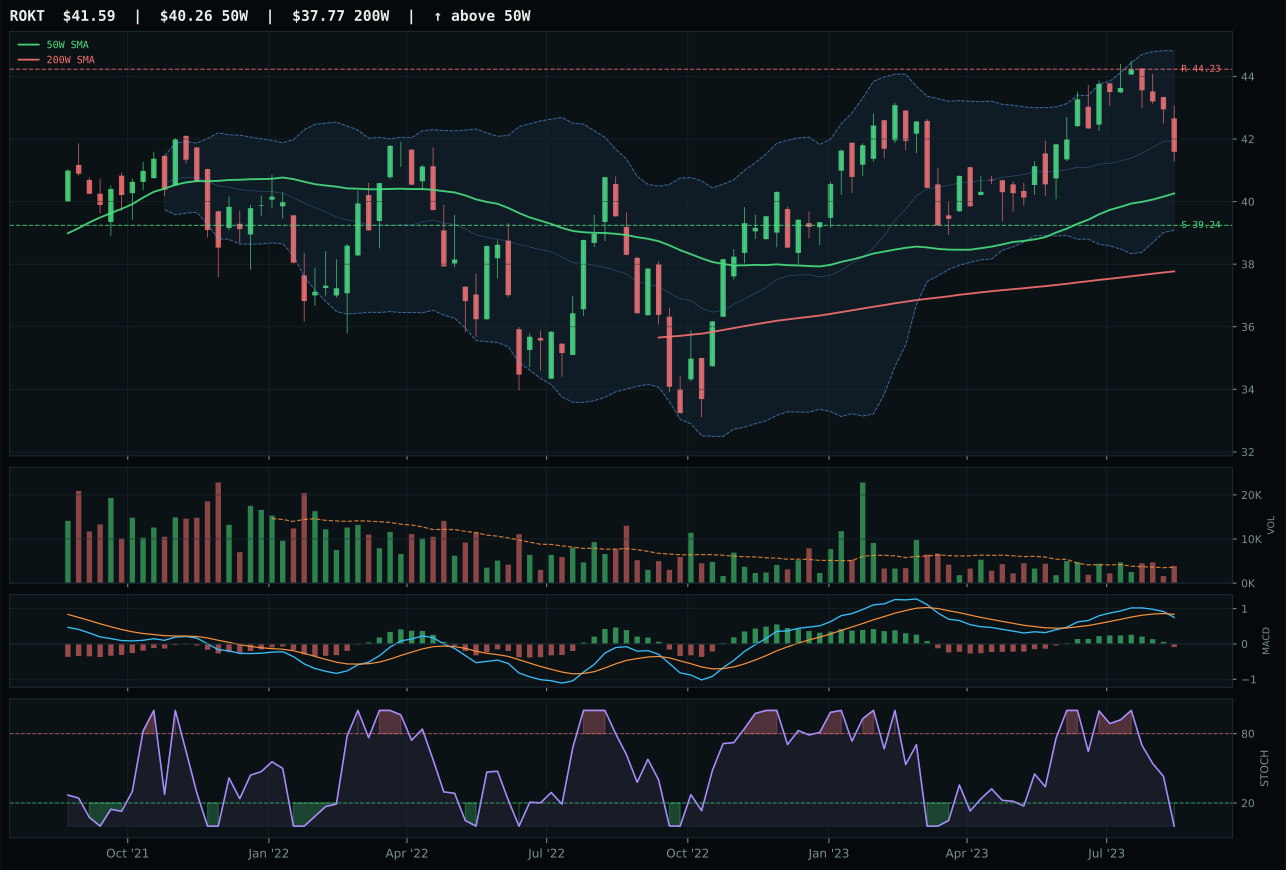
ROKT has a neutral structure profile with -3.2% 13-week relative strength versus SPY.
A failed hold above support would weaken the setup.
Tracked, but not top-2 eligible because: .
ITA wins because it presents a pullback-into-support setup at 109.67 with exceptional timing score of 95.0—the chart is compressed, clean, and sitting near the 50W with falling/neutral stochastic RSI, creating textbook mean-reversion conditions. While the 1.8% 13-week return and -2.4% SPY-relative strength are weak in absolute terms, the chart structure says you're buying at the spot where sellers have exhausted themselves; XAR lost by just 0.3 points because it offers bullish/flattening MACD and neutral structure, but its timing only reaches 70.0 and risk/reward is softer at 52.2 versus ITA's 55.5. ITA's momentum confirmation is depressed at 30.8 because the trend is rolling over, but that low score is actually a feature here—it confirms the setup is cheap on momentum divergence rather than a stale bounce. Volume is neutral across both, so the decision hinges on reversion entry quality; ITA's defined support and superior timing create a higher-probability setup.
Defense & Aerospace earns 5% tier-2 allocation despite the category scoring only 41.7, ranked outside the immediate opportunity set. This is where macro regime actually helps the position: Late-Cycle Reflation adds +6 basis points and transition/mixed sentiment adds +3, giving category-level macro fit of 57.0, which partially offsets weak technical evidence of only 43.8 for the representative. The tension is explicit: ITA has a textbook pullback-into-support chart, but it's a defensive trade in a market that still favors risk-on. The allocation holds here because geopolitical uncertainty and real asset inflation are structural supports for defense spending, and the chart is setting up a lower-risk entry. For this category to reach top-2, either credit stress would need to turn positive (moving capital toward quality and defense durability) or technical breadth would need to improve across all three ETFs. Currently it's a compliance position, not a conviction position.
Industrial Metals — COPX
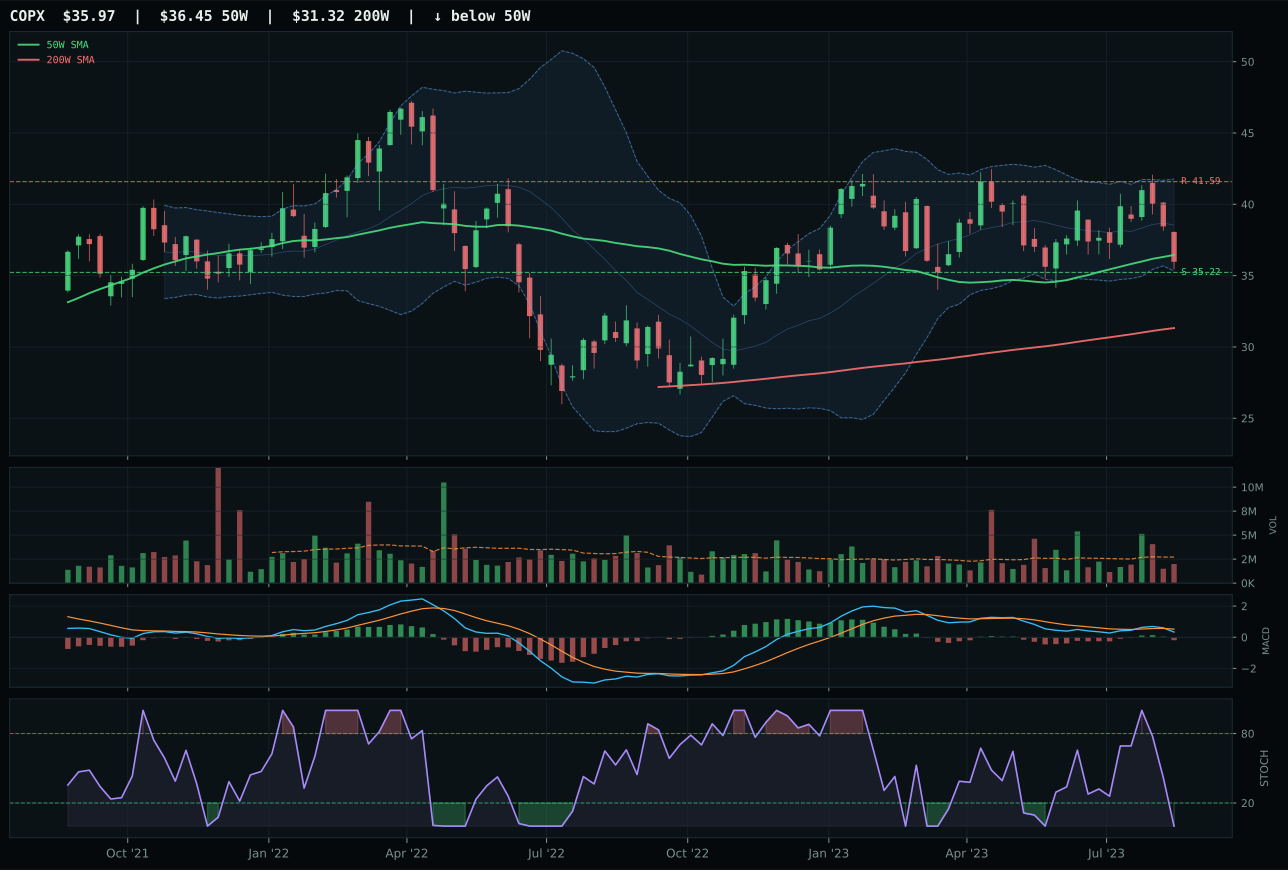
COPX has a pullback into support profile with -7.1% 13-week relative strength versus SPY.
A failed hold above support would weaken the setup.
Actionable but governed by invalidation levels.
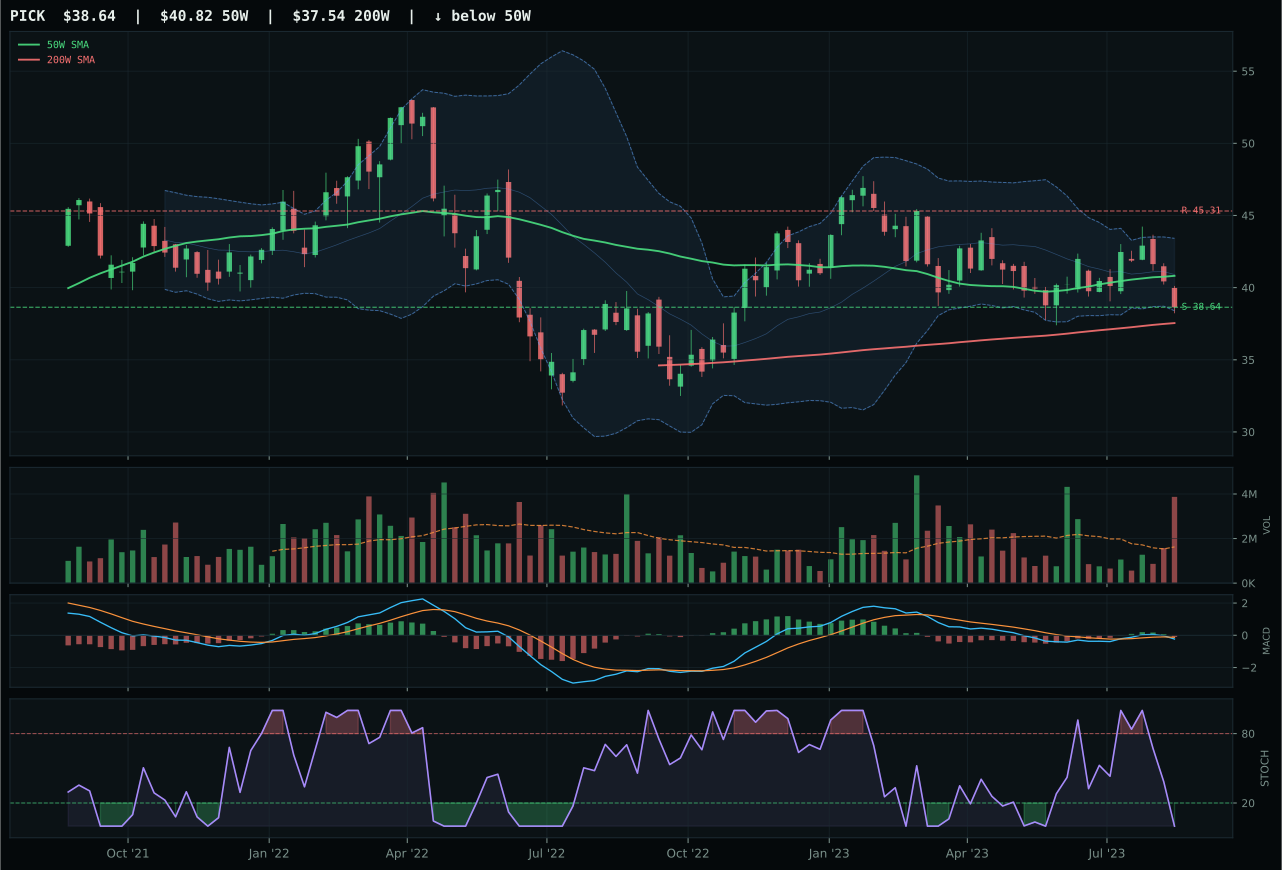
PICK has a pullback into support profile with -7.5% 13-week relative strength versus SPY.
A failed hold above support would weaken the setup.
Actionable but governed by invalidation levels.
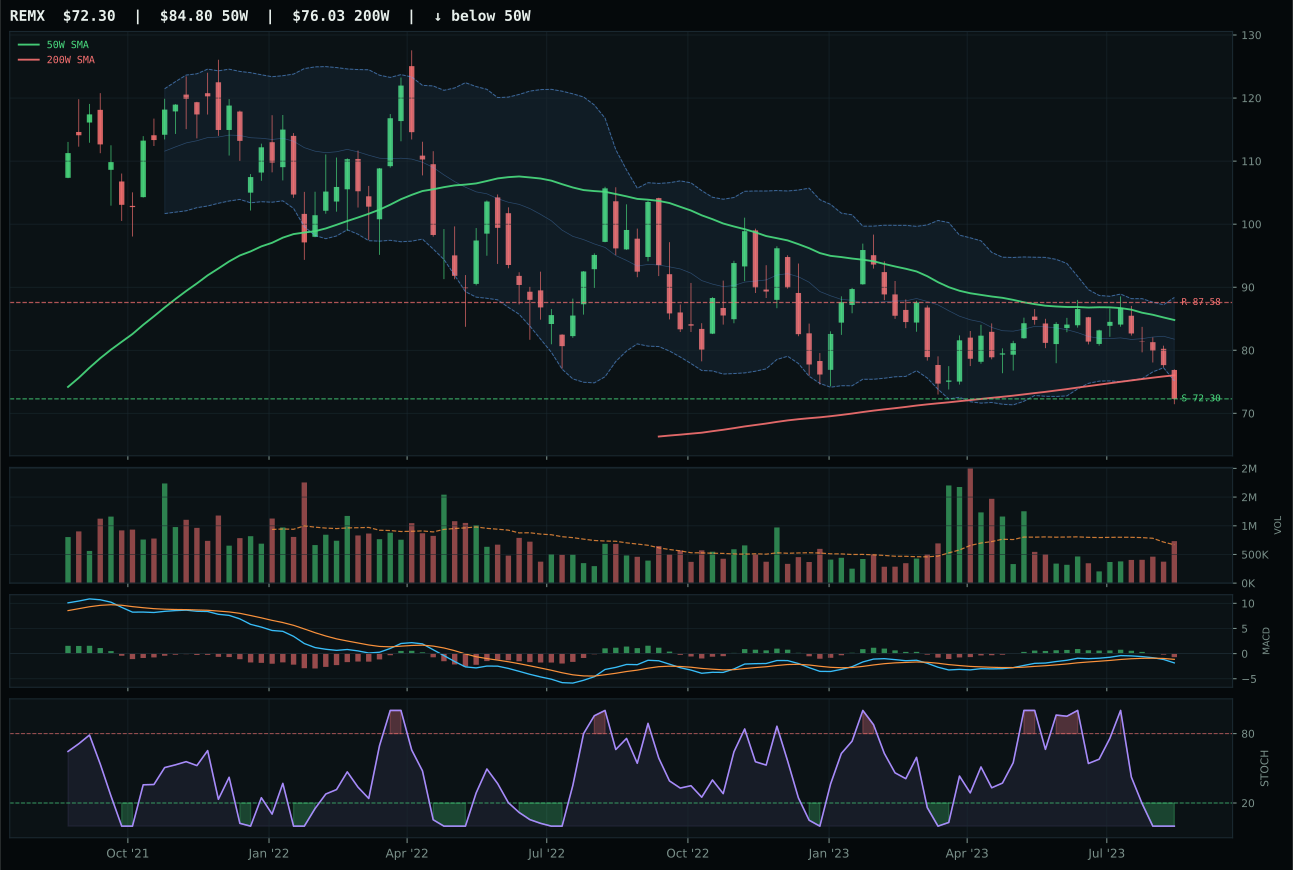
REMX has a pullback into support profile with -19.0% 13-week relative strength versus SPY.
A failed hold above support would weaken the setup.
Actionable but governed by invalidation levels.
COPX wins because it presents a pullback-into-support setup at 35.22 with perfect 100.0 timing and extraordinary 98.0 risk/reward—price sits just 1.3% below the 50W in the middle Fibonacci zone with oversold stochastic RSI and bearish/weakening MACD, creating textbook mean-reversion conditions. PICK lost despite matching the technical setup because its timing only reaches 87.0 (not 100), and critically, PICK shows distribution pressure on volume while COPX has thin but clean participation; thin volume into support is institutional accumulation, distribution pressure is the opposite. COPX's 0.4% category-relative strength edge over the basket median is small, but it confirms this is the most neutral, least crowded entry point within the category. The 5.8-point win is driven by timing precision and volume confirmation rather than trend momentum—a setup where every other condition is optimal except the trend itself, which is exactly when mean reversion offers highest probability.
Industrial Metals earns 5% tier-2 allocation supported by strong category-level macro fit of 75.0, where metals scarcity is active at +14 basis points, commodity breadth positive at +10, and real asset sponsorship at +6. The final category score of 37.9 comes from a 3/2/1 basket starting at 32.0, which is then tested against the macro regime; the gap suggests the technical evidence is materially weaker than the macro support deserves. The tension is real: Late-Cycle Reflation with active scarcity messaging should anchor metals to higher weight, but COPX's trend score is only 46.3 and momentum confirmation collapses to 3.1, meaning the entire category is betting on mean reversion rather than follow-through momentum. This allocation holds because the charts are setting up at support with macro tailwinds, but it's a tactical tactical reversion trade, not a conviction position. For Industrial Metals to reach top-2, either trend evidence would need to stabilize above the 200W or category-relative momentum would need to show positive acceleration; right now it's a value trap with good macro timing.
Precious Metals — GLD
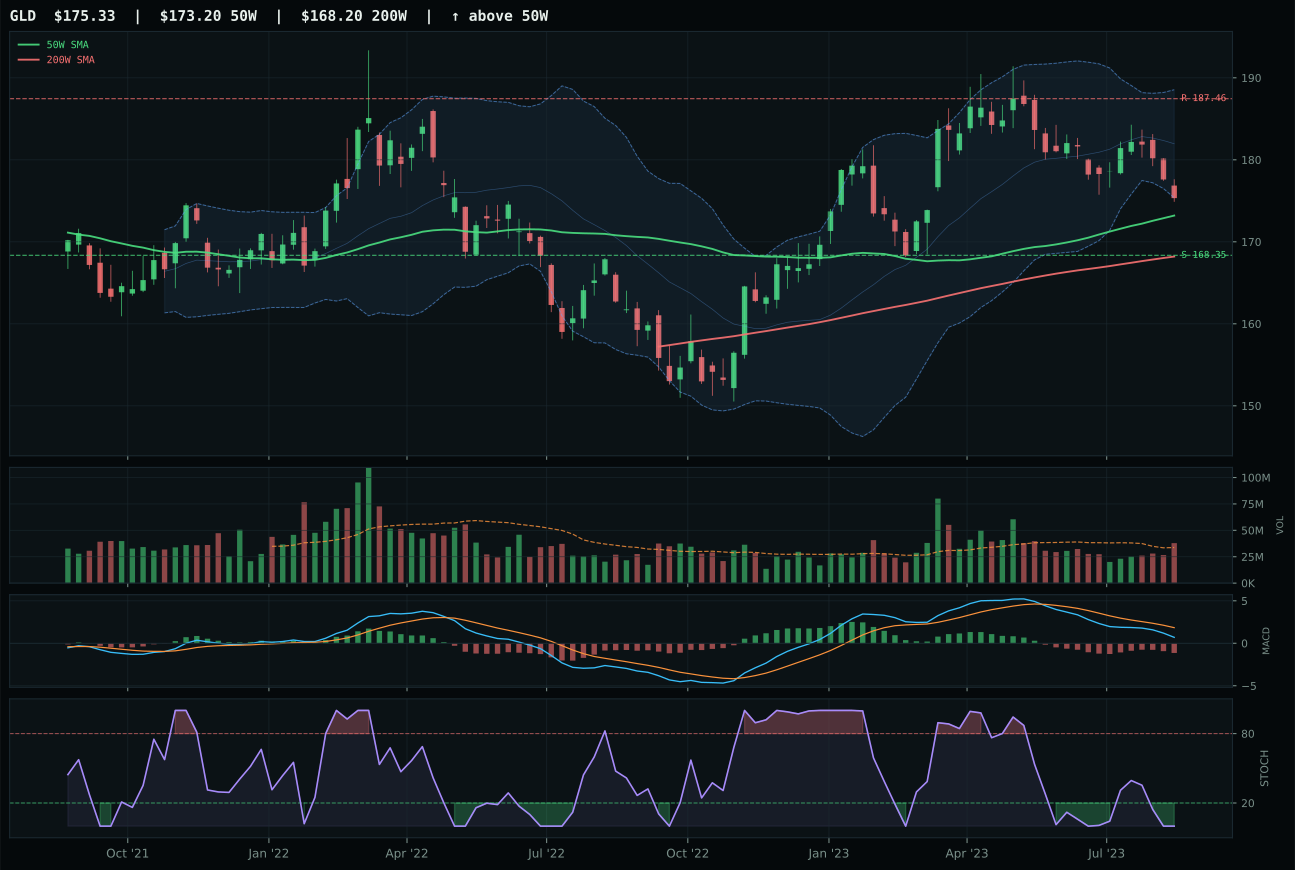
GLD has a pullback into support profile with -8.8% 13-week relative strength versus SPY.
A failed hold above support would weaken the setup.
Actionable but governed by invalidation levels.
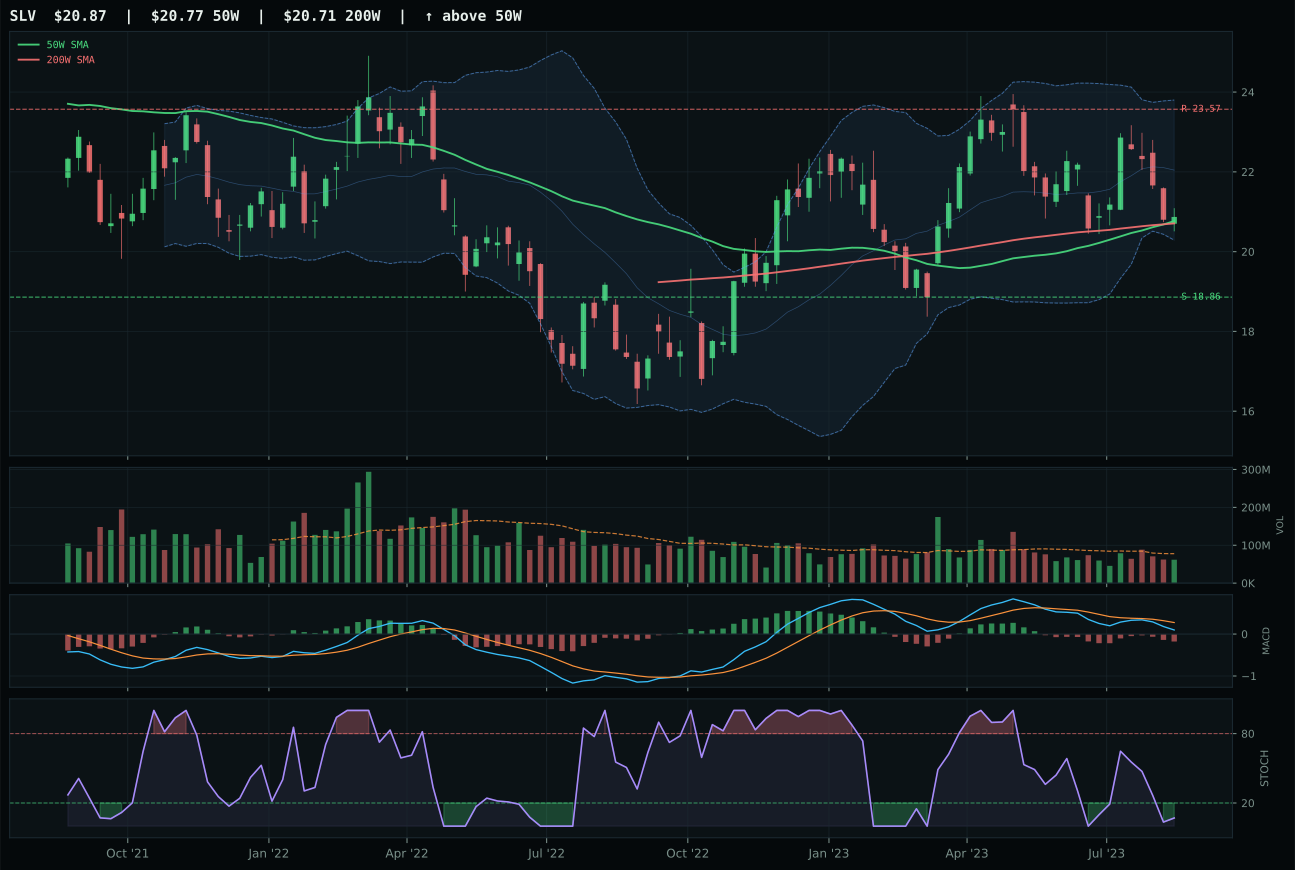
SLV has a compression near 50W profile with -8.8% 13-week relative strength versus SPY.
A failed hold above support would weaken the setup.
Actionable but governed by invalidation levels.
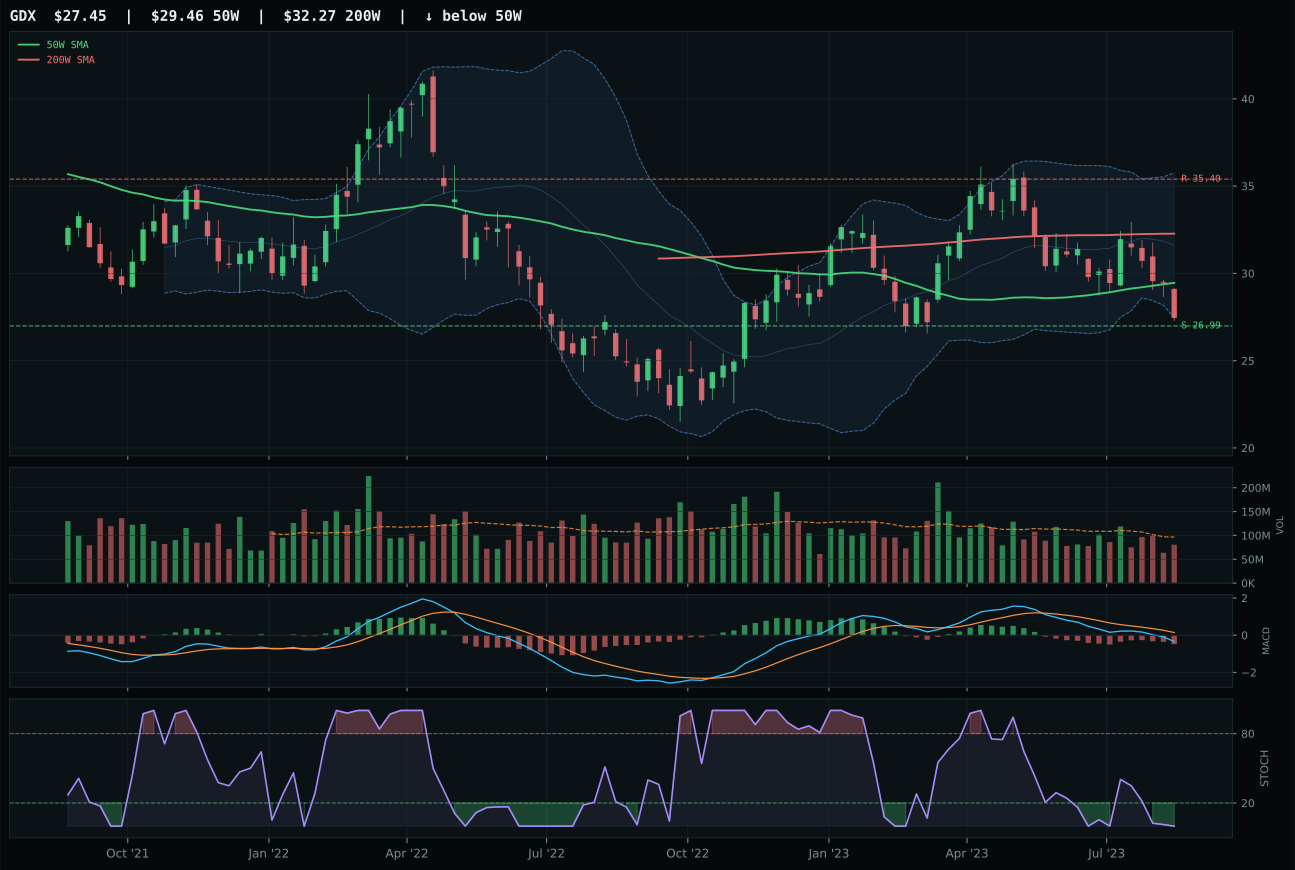
GDX has a pullback into support profile with -18.9% 13-week relative strength versus SPY.
Extension and support failure are the main tactical risks.
Tracked, but not top-2 eligible because: structurally broken.
GLD wins because it holds price above both trend references with a perfect 100.0 timing score from sitting just 1.2% from the 50W in the middle Fibonacci retracement zone—this is the tightest, most defined pullback-into-support setup available. Stochastic RSI is deeply oversold at 0.00 and MACD is bearish/weakening, creating the exact divergence setup where value buyers step in; SLV lost despite matching the 50W compression because its structure score is only 70.8 versus GLD's 76.5, and crucially, GLD has above-average volume participation at 1.12x while SLV has neutral volume. Above-average participation into oversold conditions tells you institutional money is rotating in, not retailing selling; SLV's neutral volume suggests nobody is accumulating yet. The 81.1 risk/reward for GLD versus 72.3 for SLV reflects the same dynamic—GLD has better downside support and more conviction buyers present.
Precious Metals holds 5% tier-2 allocation despite a category score of only 26.4, the weakest position in the portfolio, because the macro regime actively penalizes it. Risk appetite remains positive at -4 basis points (a headwind for gold as a volatility hedge), and the broader macro fit is only 46.0. The reasoning ETF basket starts at 35.6 before category-level testing collapses the final score to 26.4, placing it well outside top-2 contention. What keeps metals in the portfolio at all is the technical setup—GLD's pullback-into-support and perfect timing score represent a near-zero-risk entry point for tail-risk protection. This is portfolio insurance allocated at a moment of technical exhaustion rather than macro conviction. For Precious Metals to graduate to tier-1, risk appetite would need to turn negative and credit stress would need to intensify, shifting capital toward gold as a monetary hedge. Currently, it's a technical bounce in a regime that favors real assets with growth narratives like energy and agriculture.
Utilities & Infrastructure — PAVE
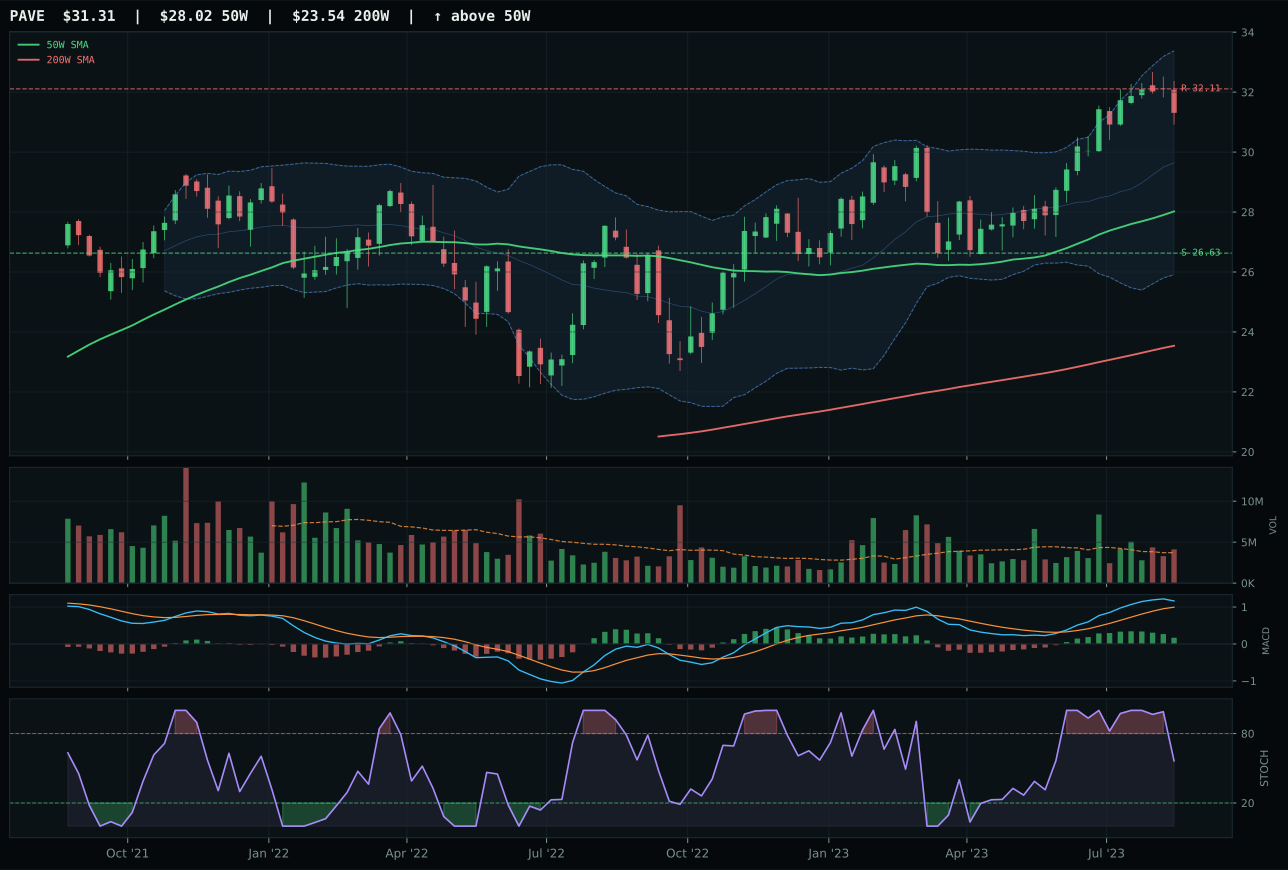
PAVE has a neutral structure profile with 7.1% 13-week relative strength versus SPY.
A failed hold above support would weaken the setup.
Actionable but governed by invalidation levels.
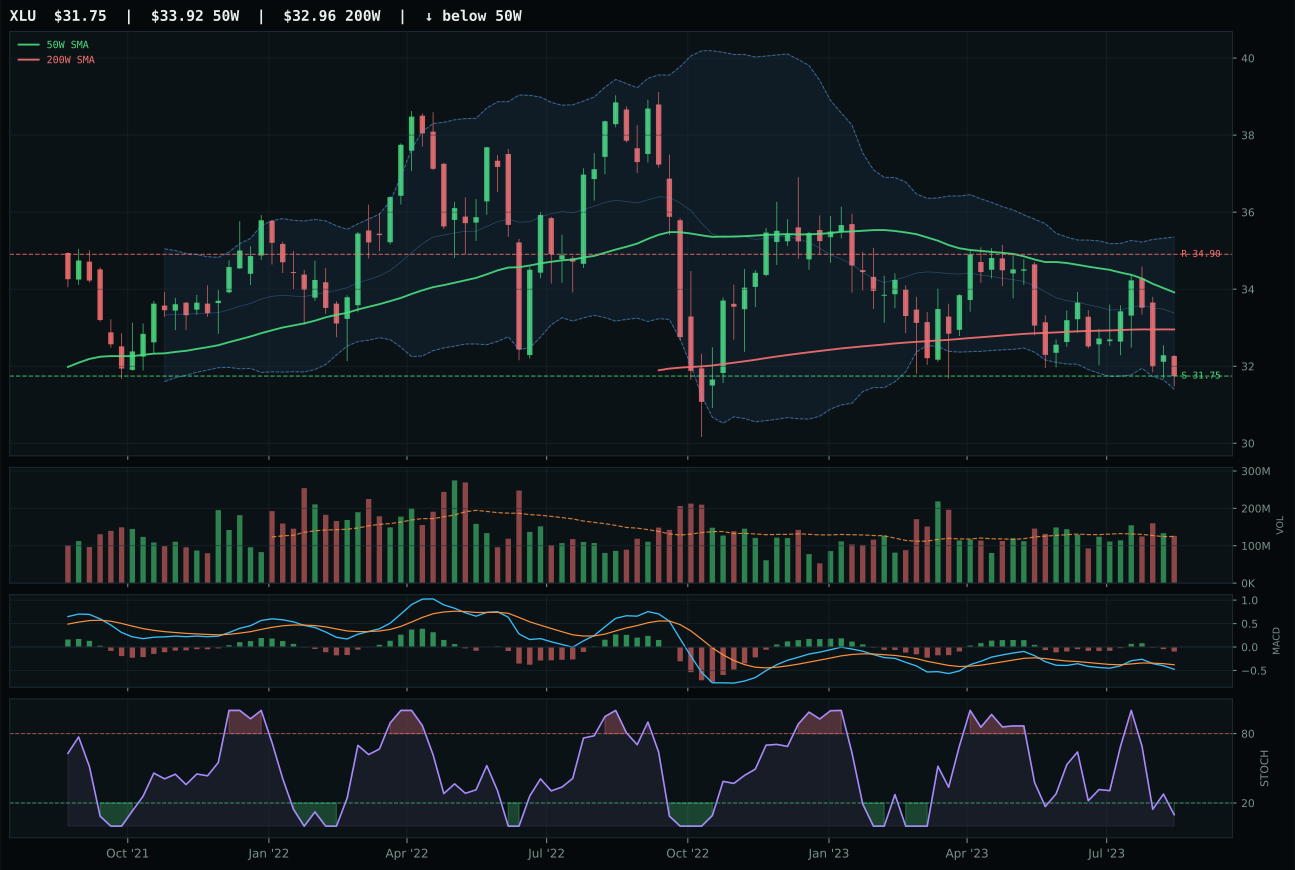
XLU has a pullback into support profile with -8.2% 13-week relative strength versus SPY.
A failed hold above support would weaken the setup.
Actionable but governed by invalidation levels.
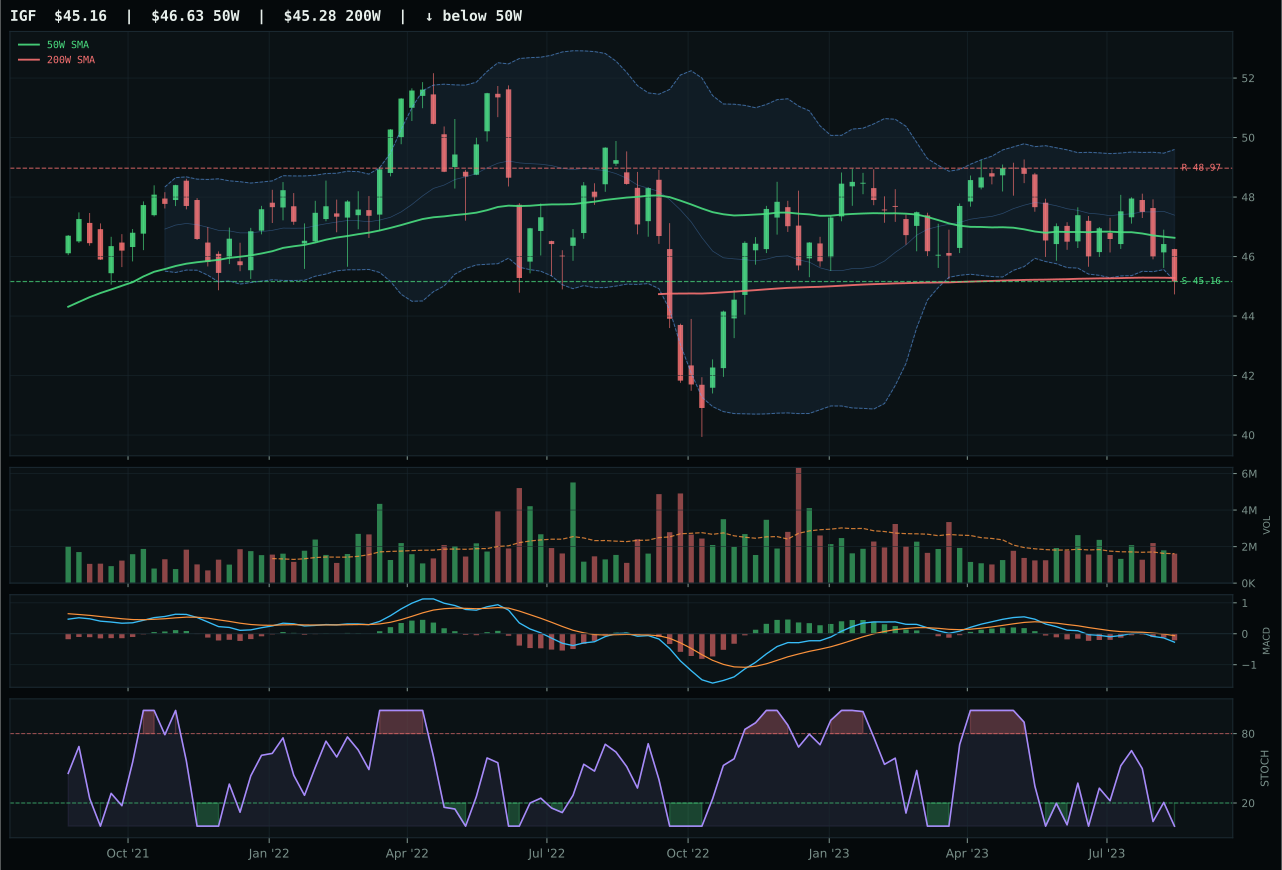
IGF has a pullback into support profile with -9.5% 13-week relative strength versus SPY.
A failed hold above support would weaken the setup.
Actionable but governed by invalidation levels.
PAVE wins decisively with a category gap of 46.3 points because it delivers perfect 100.0 trend and momentum confirmation scores from 11.4% 13-week returns with 7.1% relative strength versus SPY and 15.3% category-relative strength. Price is above both trend references with bullish/flattening MACD and falling/neutral stochastic RSI, creating sustained accumulation conditions; above-average volume participation at 1.11x confirms institutional rotation into the infrastructure trade. XLU lost by an absolute margin because it shows bearish/weakening MACD, oversold stochastic RSI, and pulled back into support—the exact opposite of PAVE's accumulation setup. XLU's -8.2% SPY-relative strength tells you it's being deserted, while PAVE's outperformance and category-relative strength of 15.3 tells you money is flowing into infrastructure over utilities. This is the cleanest technical differentiation in the portfolio: PAVE is winning on trend, momentum, volume, and relative strength all simultaneously.
Utilities & Infrastructure earns 0% allocation this week, excluded entirely from the portfolio despite PAVE's strong technical setup, because category-level macro fit is only 43.0. Late-Cycle Reflation adds +4 basis points in regime support, but inflation pressure is a -6 headwind, and the category is explicitly penalized by positive risk appetite (which favors growth over utilities' yield-based narrative). The technical ETF basket starts at 47.5 and tests down to 25.6, a 21.5-point gap reflecting internal weakness and macro headwinds overwhelming PAVE's strong technicals. PAVE's trend and momentum scores are exceptional, but they're being rejected by the broader regime because utilities are countercyclical and the cycle still has juice. This is a regime exclusion, not a technical rejection—PAVE would be the category leader in any late-stage recession or late-cycle stress scenario, but those conditions aren't present yet. For this category to earn allocation, either credit stress would need to turn sharply positive or inflation pressure would need to stay low enough that utility dividend yields become attractive relative to growth. Right now, PAVE is a trade, not a portfolio position.
Emerging Markets — ILF
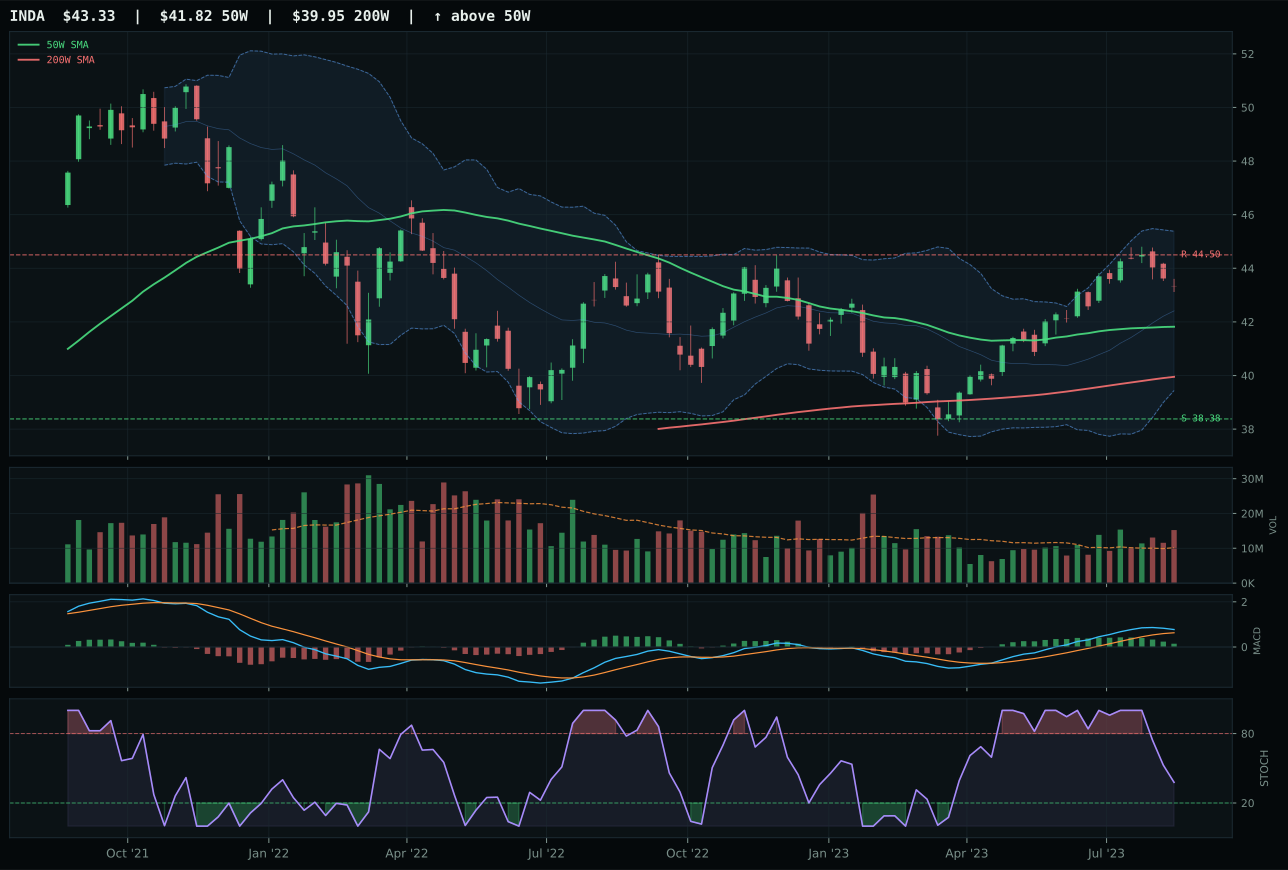
INDA has a neutral structure profile with 1.7% 13-week relative strength versus SPY.
A failed hold above support would weaken the setup.
Actionable but governed by invalidation levels.
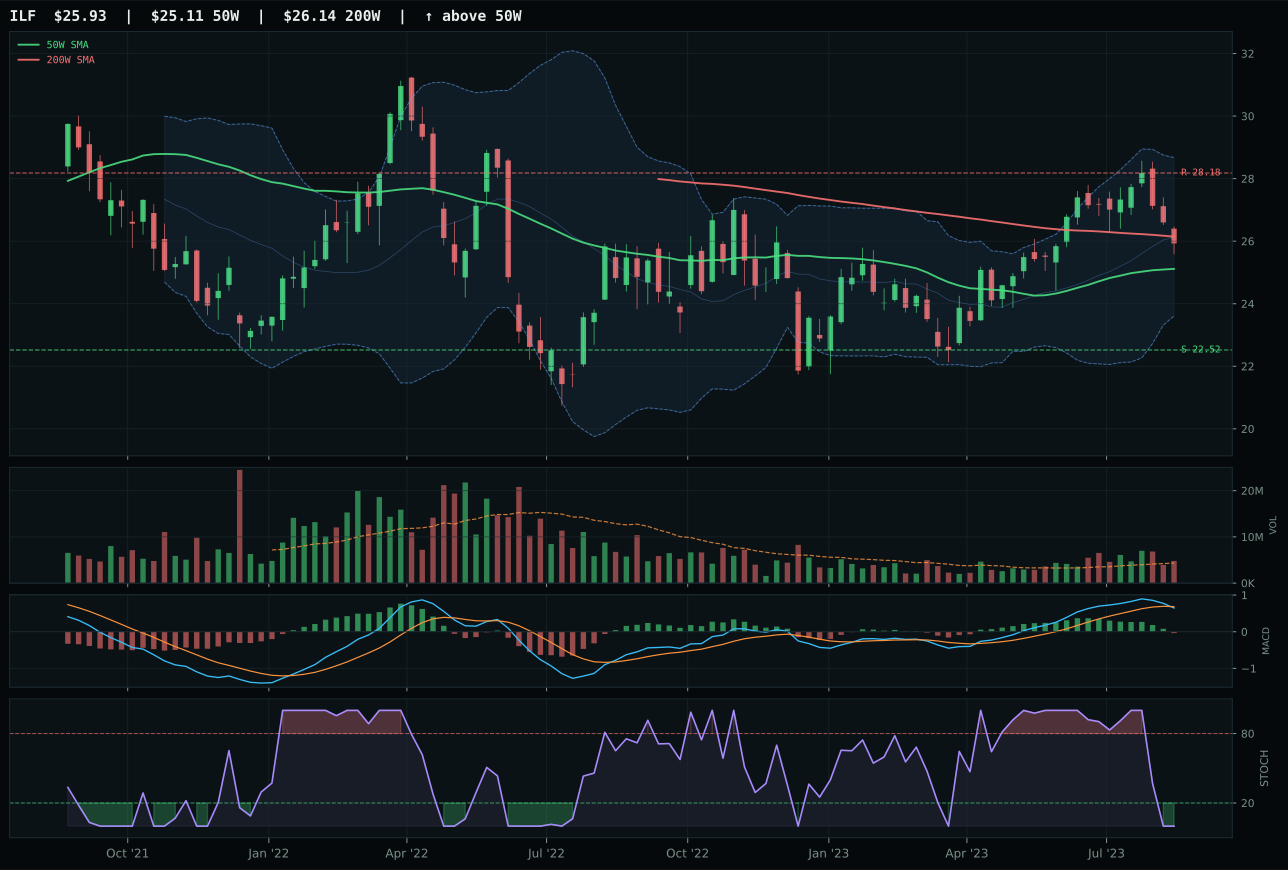
ILF has a neutral structure profile with -2.3% 13-week relative strength versus SPY.
A failed hold above support would weaken the setup.
Actionable but governed by invalidation levels.
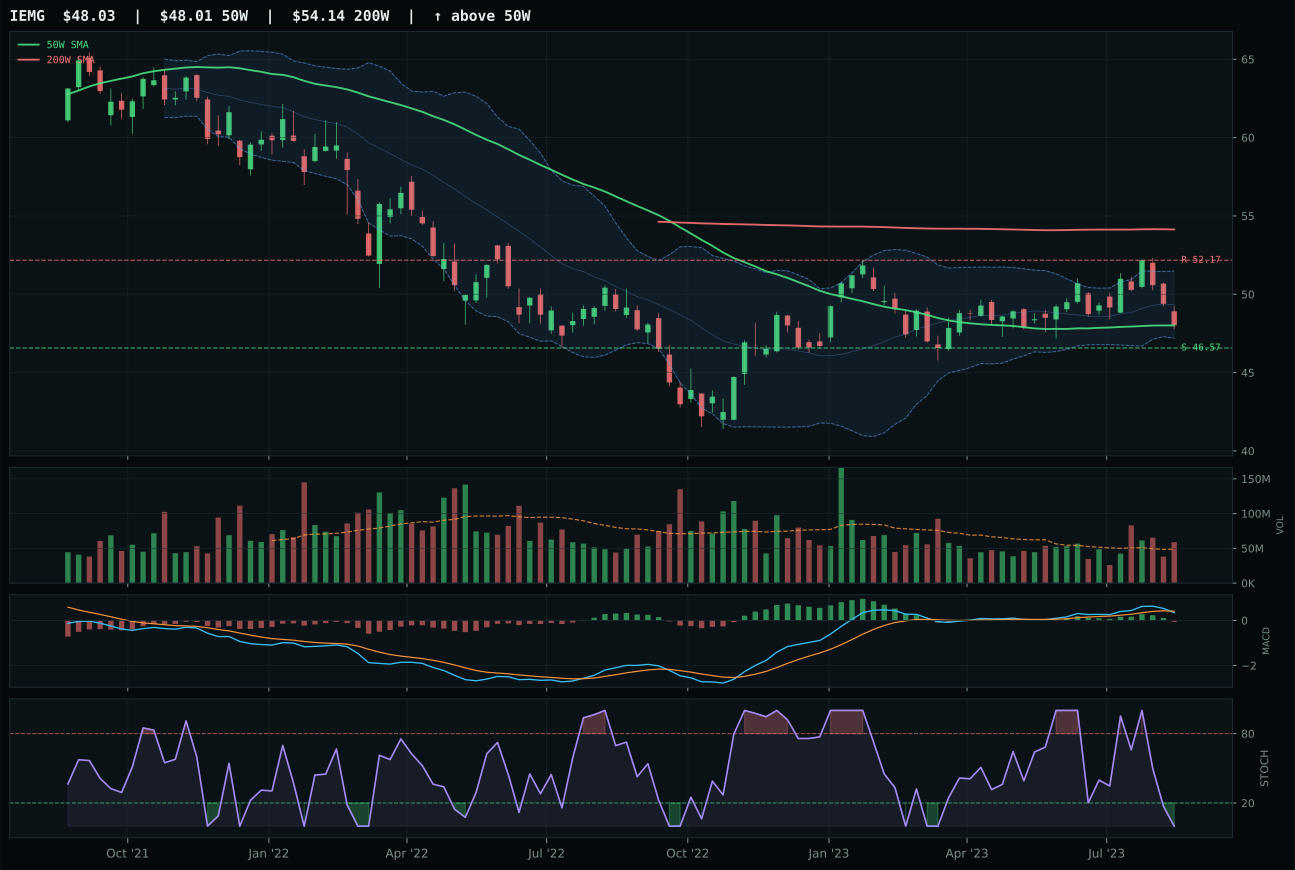
IEMG has a pullback into support profile with -5.1% 13-week relative strength versus SPY.
A failed hold above support would weaken the setup.
Actionable but governed by invalidation levels.
ILF wins the category despite ranking 9th overall because it holds neutral structure with price above the 50W but below the 200W, creating a reset-not-breakout setup, and achieves 85.0 timing score from sitting just 3.2% from the 50W in the middle Fibonacci zone. The oversold stochastic RSI and bearish/weakening MACD confirm early-stage reversion rather than trend confirmation. INDA lost by 17.4 points not because its technical evidence is weak (it scores 79 composite with bullish/flattening MACD and rising momentum), but because its macro narrative doesn't fit: INDA is high-conviction growth exposure in an environment where credit stress and liquidity stress are both active headwinds totaling -20 basis points at category level. ILF's commodity and value beta approach aligns better with the Late-Cycle Reflation regime where inflation sponsorship and real asset breadth are active; the gap reflects regime fit, not chart quality.
Emerging Markets earns 0% allocation this week, excluded entirely from the portfolio as the lowest-ranking category at 22.3. The macro regime actively penalizes it: risk appetite is positive at +8 basis points, but credit stress and liquidity stress combine for -20, leaving category-level macro fit at only 38.0. The technical ETF basket starts at 50.5 and collapses to 22.3 after category testing, a 28-point gap that signals internal divergence—INDA scores 63.3 on strong trend and momentum, but it's being rejected by the macro regime of simultaneous credit and liquidity stress. In late-cycle reflation with tightening financial conditions, emerging market growth narratives are first to be culled. ILF's commodity beta setup is more resilient, but even that can't lift the category above exclusion threshold. For Emerging Markets to earn a tier-2 5% allocation, either credit stress or liquidity stress would need to turn neutral, or risk appetite would need to turn negative (shifting capital toward EM defensiveness). Currently it's correctly positioned outside the opportunity set.