
2023-08-11
Informational purposes only. The content in this report, including allocations, analysis, and commentary, is provided solely for informational and educational purposes. It does not constitute financial advice, investment advice, trading advice, or any other type of advice. Past performance does not guarantee future results. Always conduct your own research and consult a qualified financial professional before making investment decisions.
Weekly Allocation
| Ticker | Category | Weight | Role |
|---|---|---|---|
| FBTC | 50% | Overlay | |
| XOP | Traditional Energy | 10% | Top-2 (10%) |
| URNM | Nuclear Energy | 10% | Top-2 (10%) |
| AIQ | AI | 5% | Tier-2 (5%) |
| COPX | Industrial Metals | 5% | Tier-2 (5%) |
| CIBR | Technology | 5% | Tier-2 (5%) |
| ITA | Defense & Aerospace | 5% | Tier-2 (5%) |
| MOO | Agriculture & Livestock | 5% | Tier-2 (5%) |
| XLU | Utilities & Infrastructure | 5% | Tier-2 (5%) |
Trade Instructions — Monday Open
Sell the tranche from 2023-07-14 (completing its 4-week hold). Buy the new tranche. Instructions show net portfolio changes — same-asset positions cancel, weight changes show the delta.
| Action | Ticker | Instruction |
|---|---|---|
| SELL | AIQ | Sell 33% of AIQ position (reduce 3.75% → 2.50%) |
| SELL | IGV | Sell 33% of IGV position (reduce 7.50% → 5.00%) |
| SELL | PAVE | Sell 33% of PAVE position (reduce 3.75% → 2.50%) |
| SELL | URA | Sell 20% of URA position (reduce 6.25% → 5.00%) |
| SELL | XAR | Sell 33% of XAR position (reduce 3.75% → 2.50%) |
| SELL | GLD | Sell entire GLD position (1.25% of portfolio) |
| SELL | INDA | Sell 50% of INDA position (reduce 2.50% → 1.25%) |
| BUY | MOO | Buy MOO — 12.50% of freed cash (adds 1.25% to portfolio) |
| BUY | XLU | Buy XLU — 12.50% of freed cash (adds 1.25% to portfolio) |
| BUY | XOP | Buy XOP — 25.00% of freed cash (adds 2.50% to portfolio) |
| BUY | URNM | Buy URNM — 25.00% of freed cash (adds 2.50% to portfolio) |
| BUY | CIBR | Buy CIBR — 12.50% of freed cash (adds 1.25% to portfolio) |
| BUY | ITA | Buy ITA — 12.50% of freed cash (adds 1.25% to portfolio) |
Current Portfolio After Trade
Combined holdings across all 4 active tranches. Each tranche is 25% of the portfolio.
| Ticker | % of Portfolio | Weight Bar |
|---|---|---|
| FBTC | 50.00% | |
| COPX | 6.25% | |
| URA | 5.00% | |
| XOP | 5.00% | |
| IGV | 5.00% | |
| MOO | 3.75% | |
| AIQ | 2.50% | |
| PAVE | 2.50% | |
| XAR | 2.50% | |
| ILF | 2.50% | |
| SMH | 2.50% | |
| FCG | 2.50% | |
| XLU | 2.50% | |
| URNM | 2.50% | |
| INDA | 1.25% | |
| SLV | 1.25% | |
| CIBR | 1.25% | |
| ITA | 1.25% |
Macro Regime — Late-Cycle Reflation
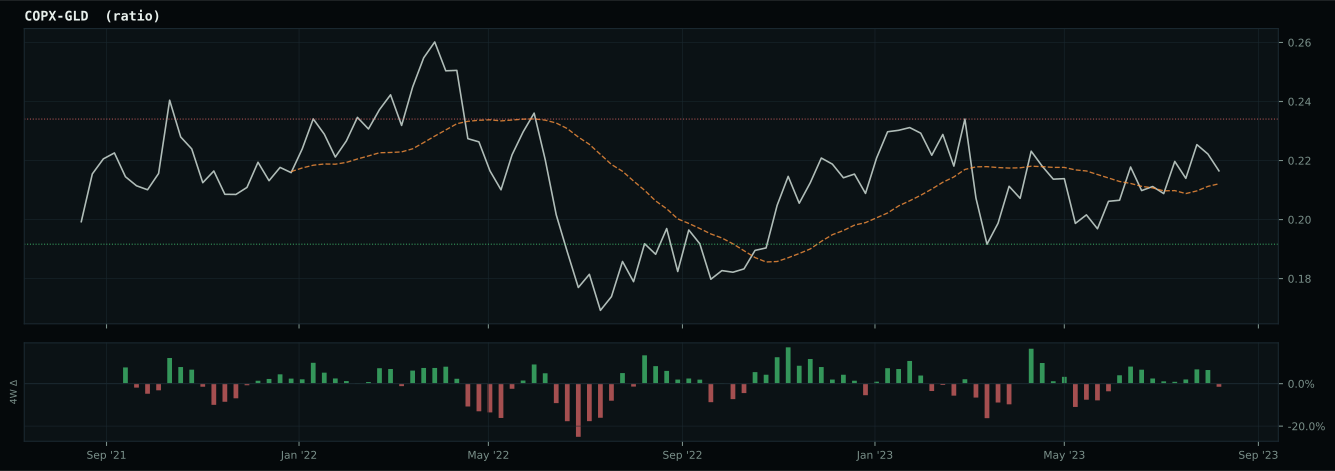
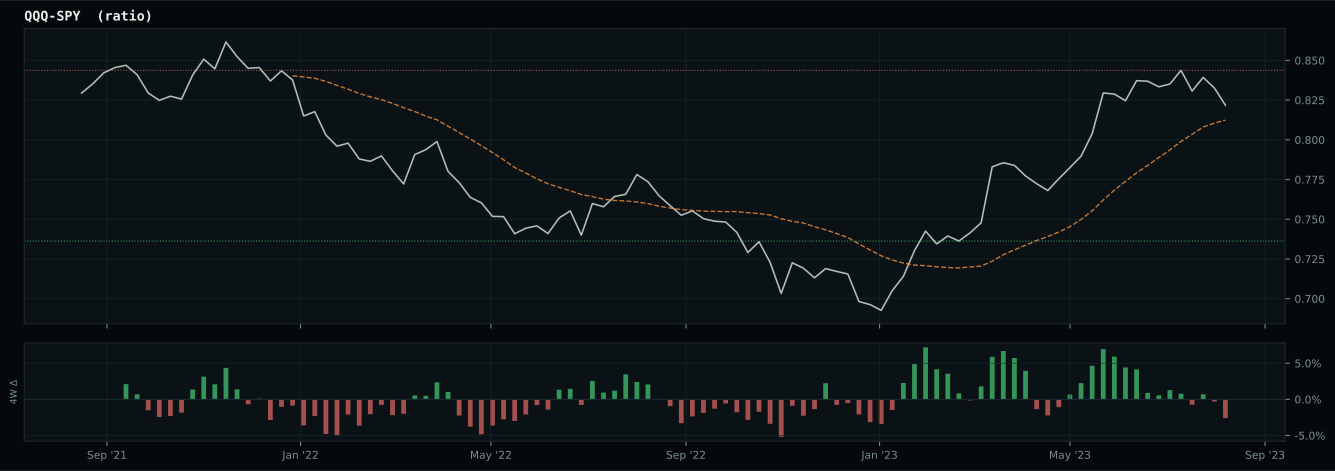
Macro Evidence Charts
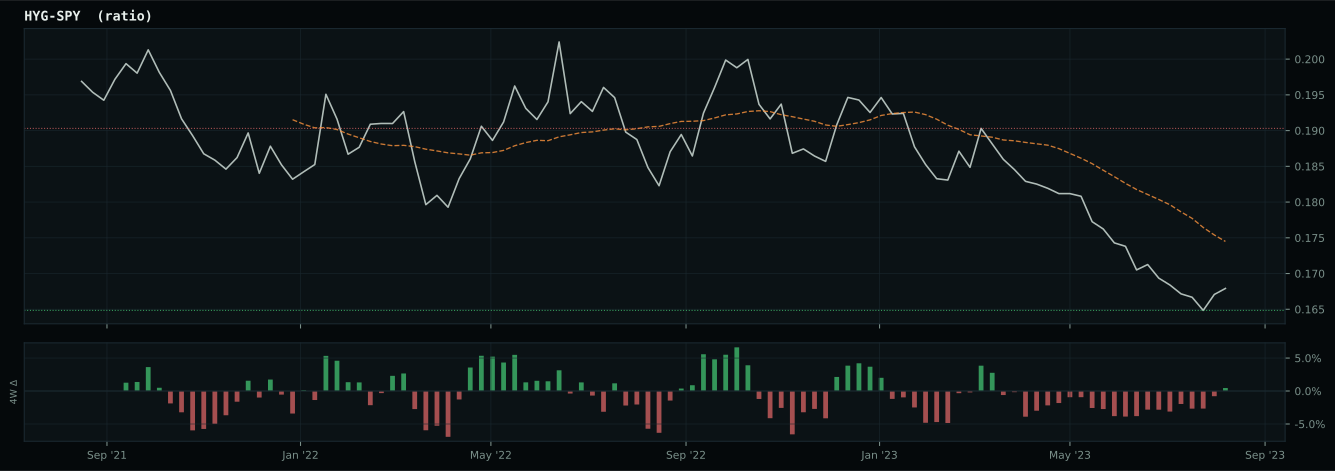
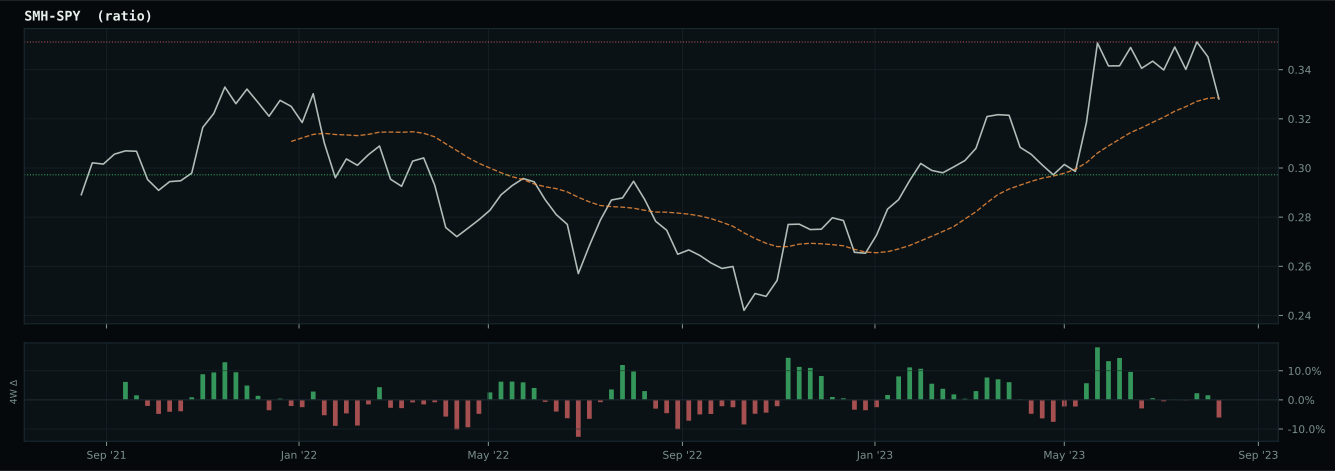
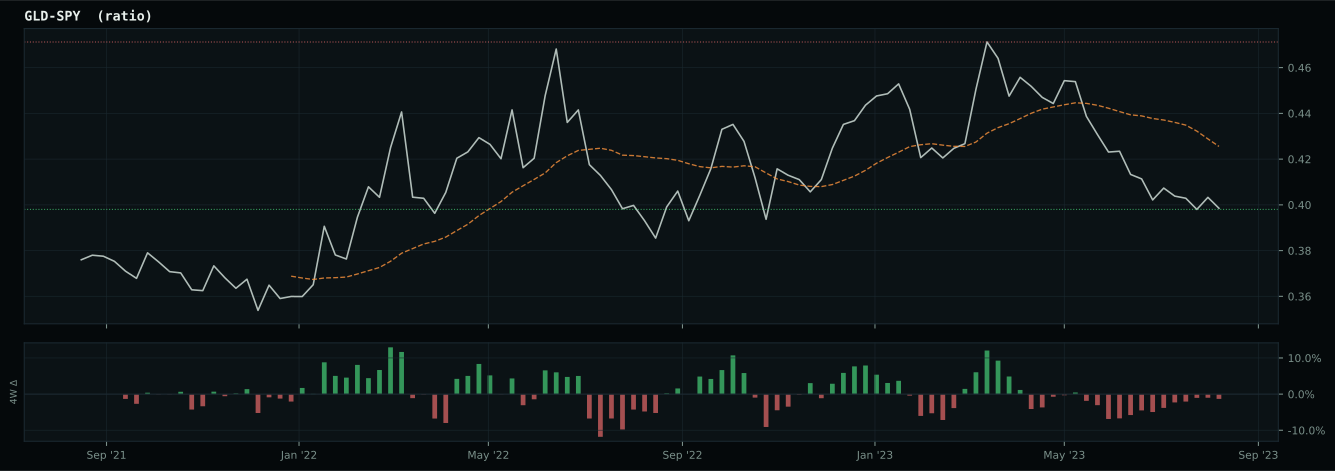
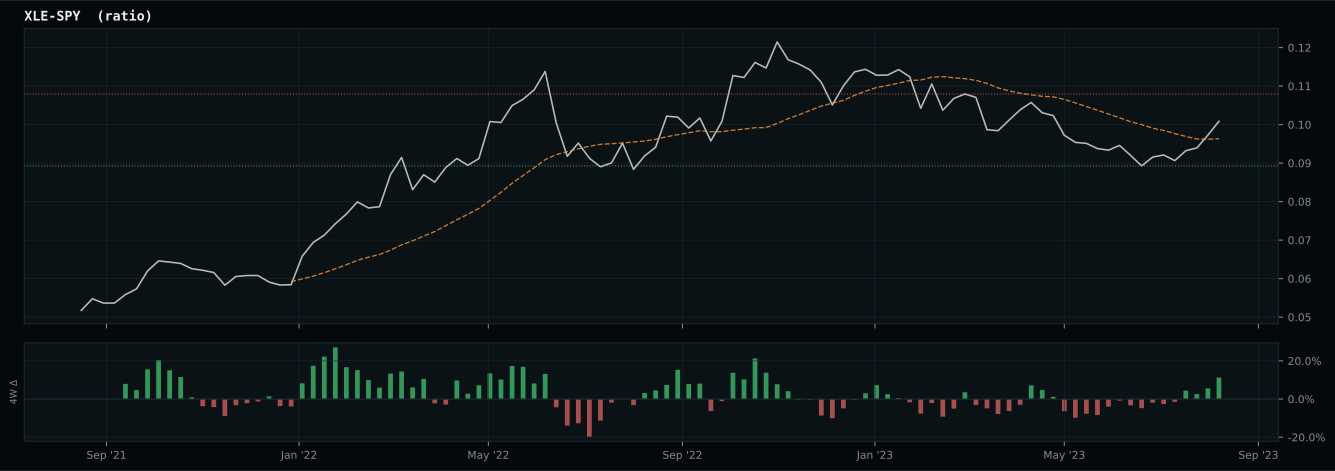
Market-implied signals behind the macro regime scores. Each ratio compares two assets; the direction and slope of the ratio is what the macro engine reads.
Crypto Regime — TrendBTC
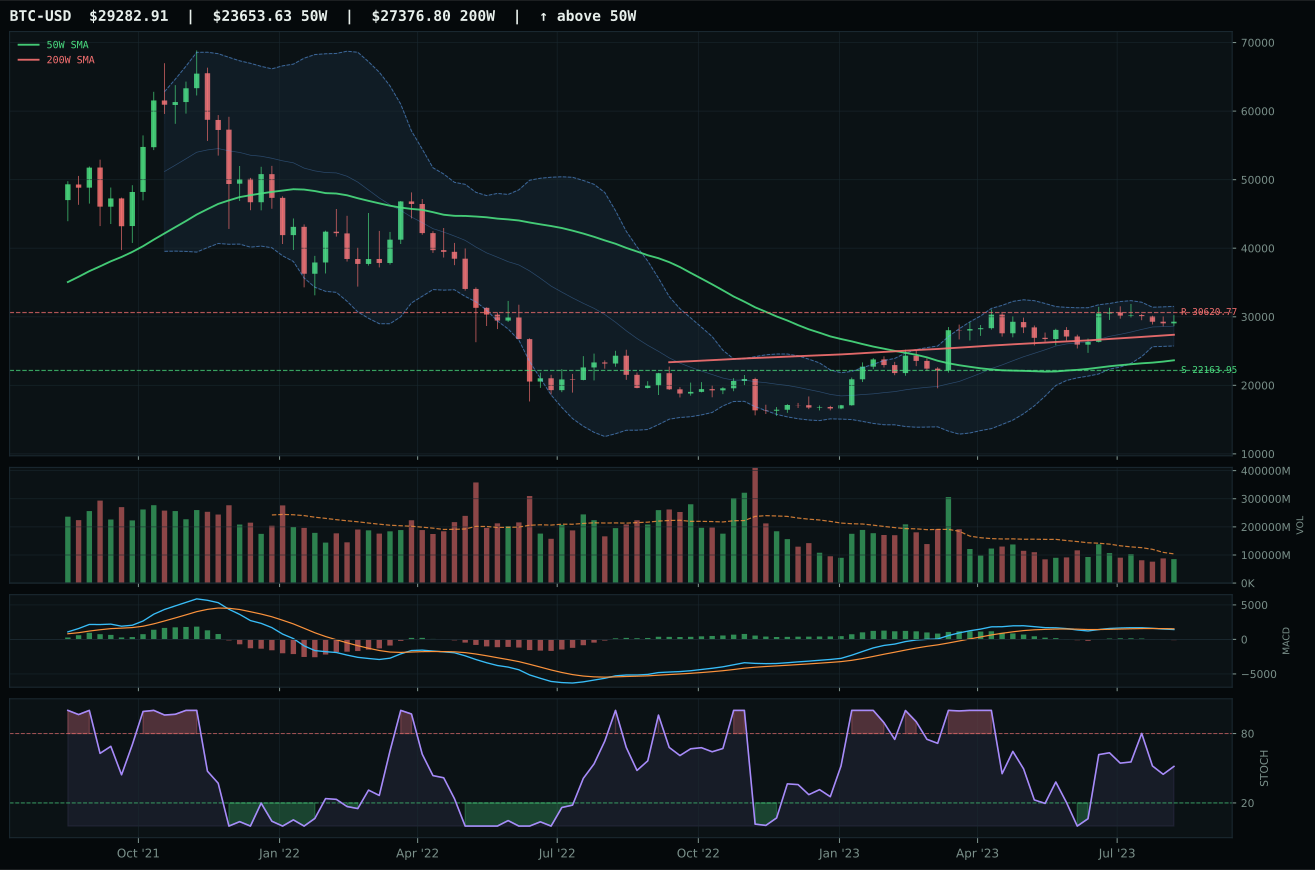
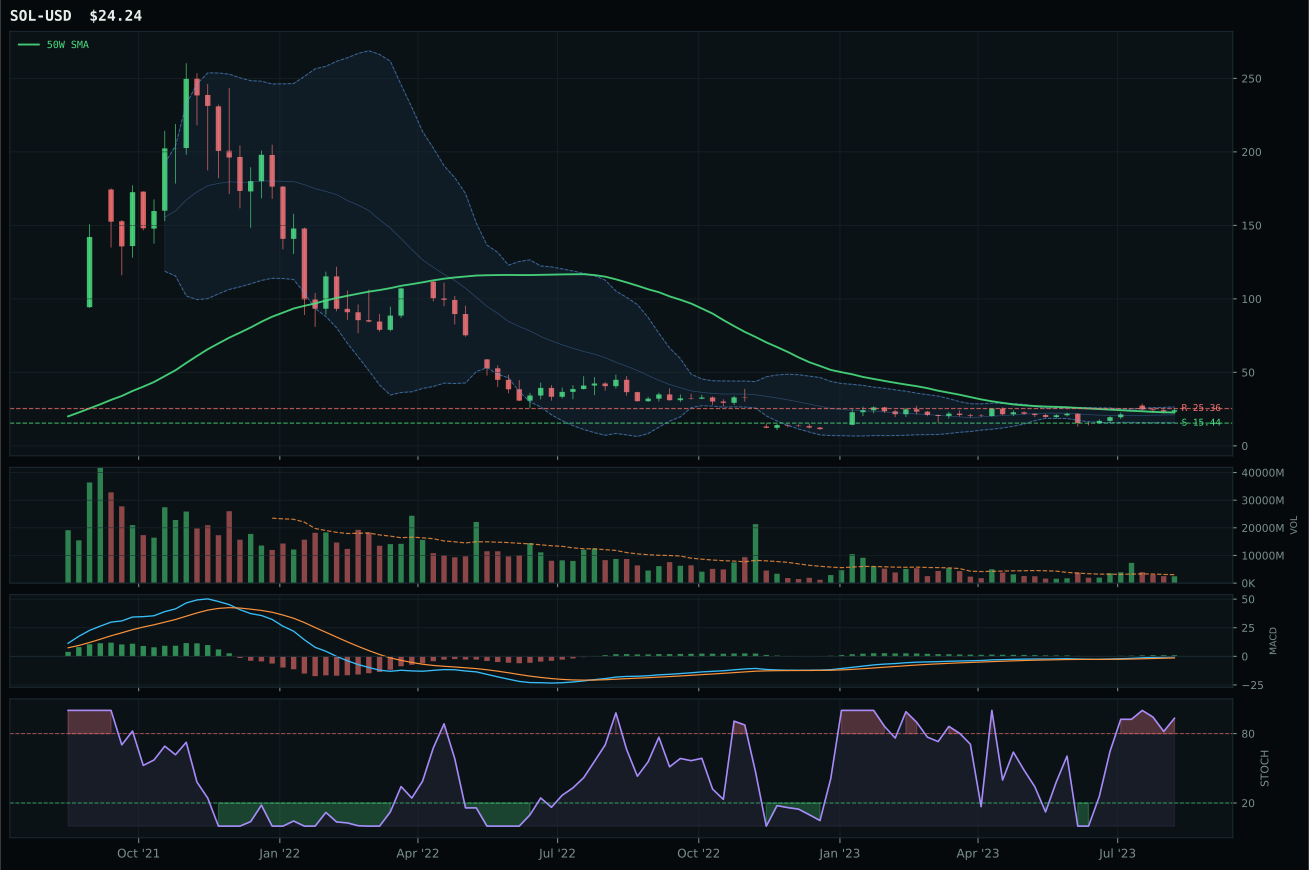
post-touch structure is too wide to count as a range; max/min close ratio is 1.88
TrendBTC confirmed: 2 consecutive closes above rising/flat 50W SMA
one or more available conditions failed
Category Rankings
| Rank | Category | Winner | Score | Alloc | 4W Ret | Peers (4W) |
|---|---|---|---|---|---|---|
| 1 | Traditional Energy | XOP | 90.7 | 20% | +4.17% | FCG +2.7% · XLE +3.4% |
| 2 | Nuclear Energy | URNM | 69.2 | 20% | +12.72% | URA +8.7% · NLR +6.4% |
| 3 | AI | AIQ | 55.4 | 10% | +4.00% | SMH +4.6% · BOTZ -0.4% |
| 4 | Industrial Metals | COPX | 53.6 | 10% | -1.02% | PICK +0.3% · REMX -7.7% |
| 5 | Technology | CIBR | 50.5 | 10% | +4.76% | IGV +8.1% · XLK +4.5% |
| 6 | Defense & Aerospace | ITA | 45.4 | 10% | -4.62% | XAR -3.0% · ROKT -4.2% |
| 7 | Agriculture & Livestock | MOO | 45.2 | 10% | -3.35% | VEGI -3.2% · WEAT -7.0% |
| 8 | Utilities & Infrastructure | XLU | 35.0 | 10% | -2.20% | PAVE -1.6% · IGF -2.5% |
| 9 | Precious Metals | GLD | 33.6 | 0% | +1.19% | SLV +2.6% · GDX -1.2% |
| 10 | Emerging Markets | ILF | 30.0 | 0% | -1.63% | INDA +4.7% · IEMG +0.4% |
Traditional Energy — XOP
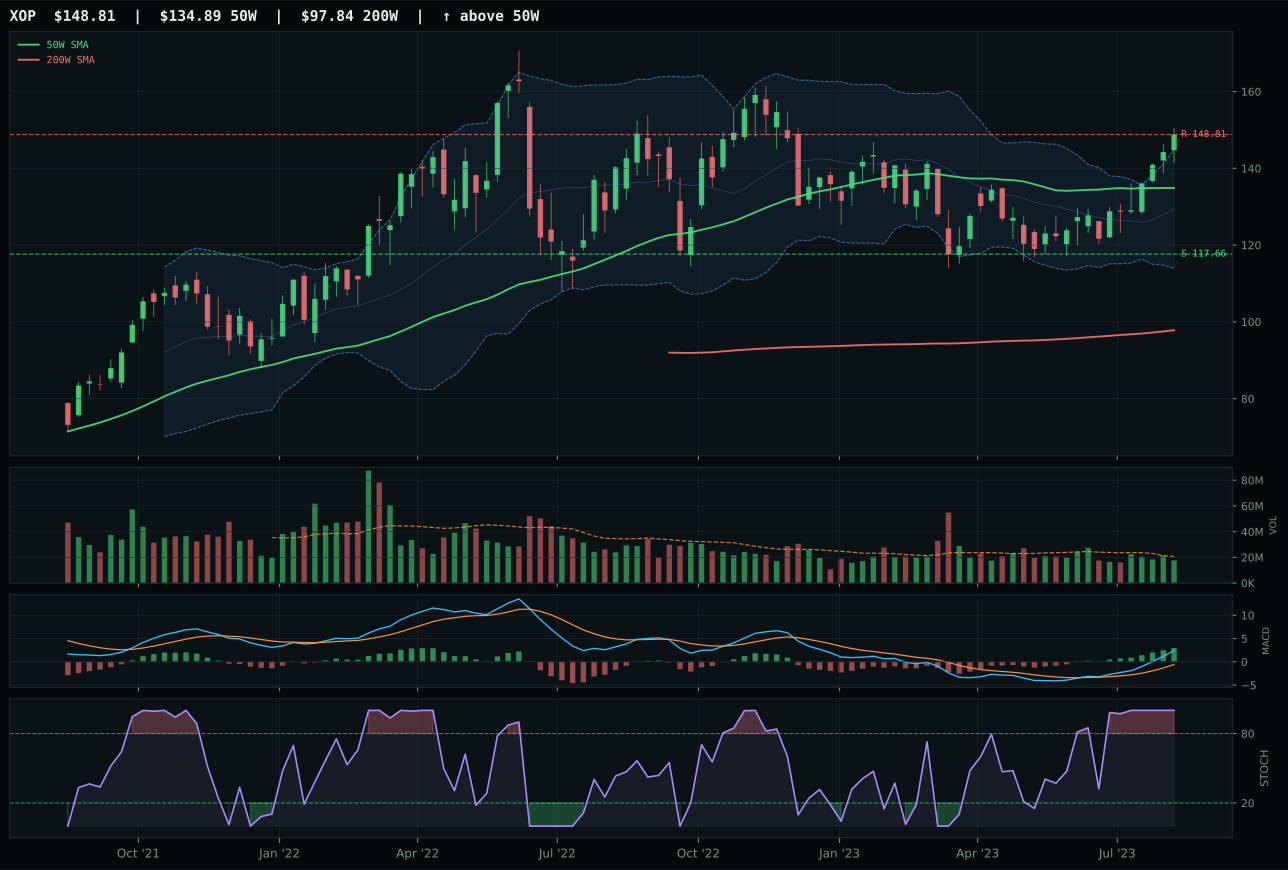
XOP has a neutral structure profile with 16.8% 13-week relative strength versus SPY.
A failed hold above support would weaken the setup.
Actionable but governed by invalidation levels.
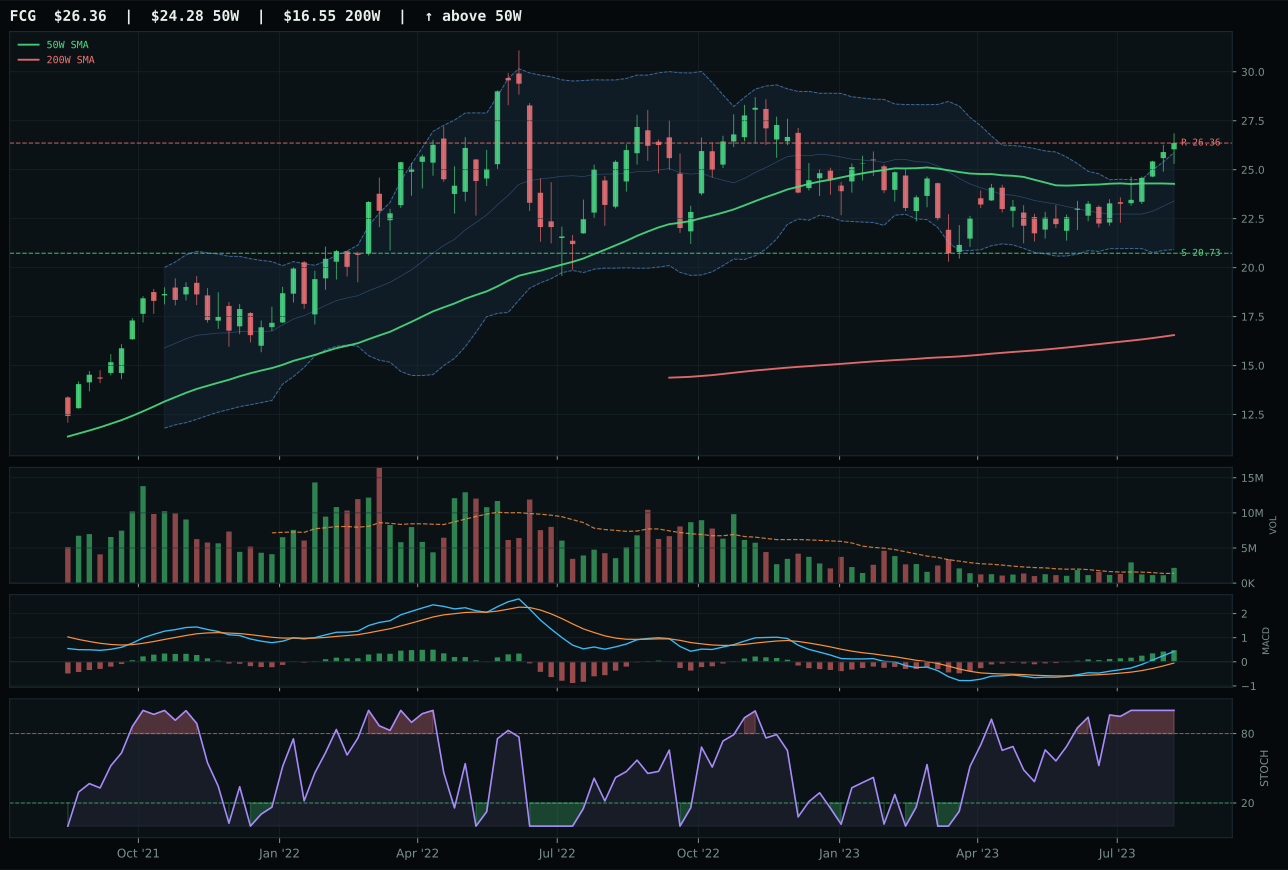
FCG has a neutral structure profile with 12.9% 13-week relative strength versus SPY.
A failed hold above support would weaken the setup.
Actionable but governed by invalidation levels.
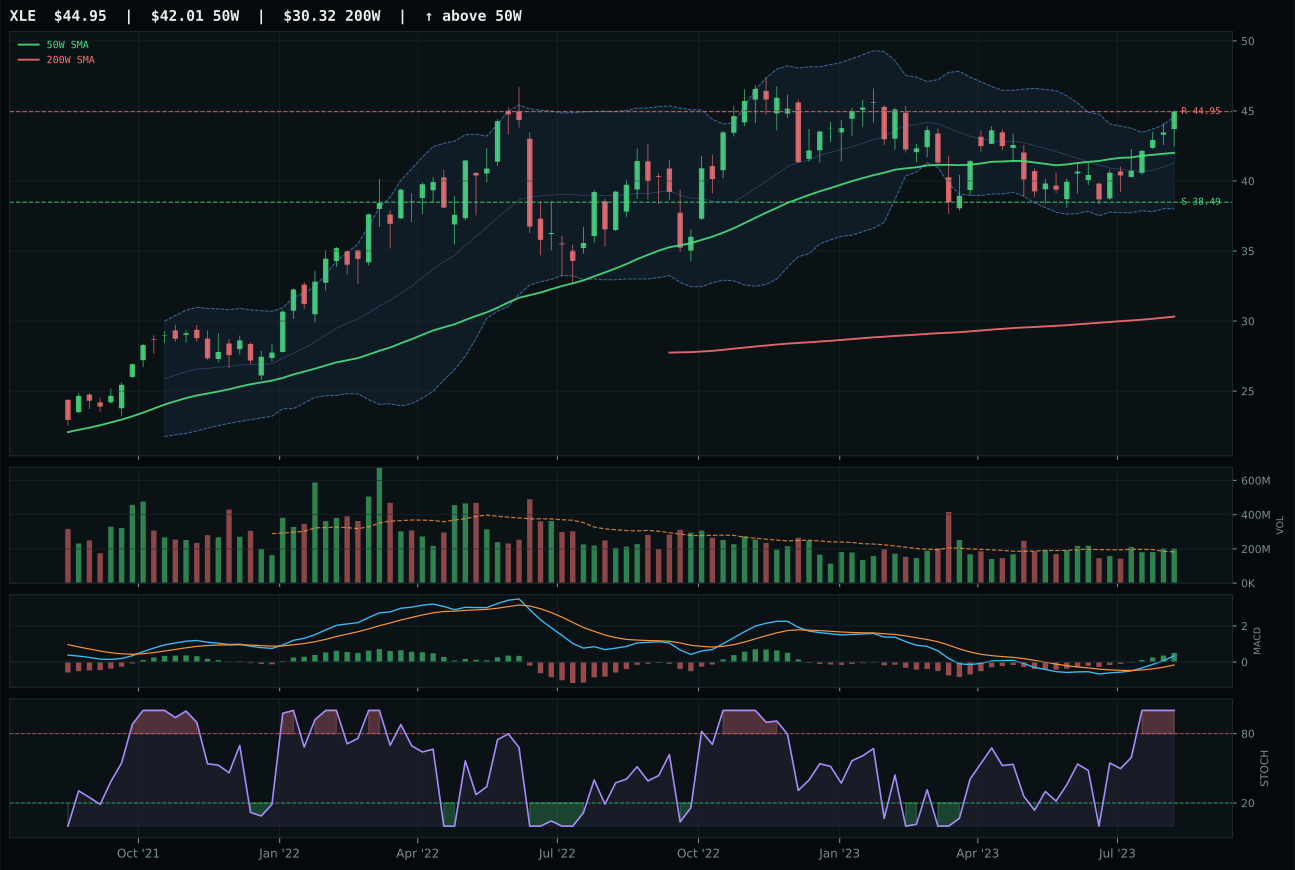
XLE has a neutral structure profile with 6.2% 13-week relative strength versus SPY.
A failed hold above support would weaken the setup.
Actionable but governed by invalidation levels.
XOP wins the energy category despite being ranked third in the reasoned ETF proof order, a reversal that reveals sophisticated setup quality. XOP's 3.8% category-relative strength beats FCG's 0.0% and drives the final representative score above its technical proof rank, illustrating that volume-price sponsorship and chart structure matter as much as pure momentum in late-cycle reflation. XOP's trend score is perfect at 100.0, momentum is perfect at 100.0, and volume-price confirmation is 80.7—the second-best in the trio behind FCG's 93—yet XOP's neutral structure (cleanliness 75.0) and category-relative leadership earned the representative slot. FCG trades at a higher technical level (100.0 technical evidence) with perfect volume accumulation/confirmation, but loses category-relative strength and thus loses the category decision on sponsorship grounds. Both are near 52-week highs, both have overbought stochastic RSI, both have bullish improving MACD, so the deciding factor is whether new accumulation is happening in XOP (yes, through category strength) or whether FCG is the lone momentum leader (no category support).
Traditional Energy earns 10% allocation as a top-2 overweight, the highest-scoring category at 90.7. Energy scarcity is active at +16, Late-Cycle Reflation regime helps by +12, supply shortage is active at +9, inflation pressure at +10, and real asset sponsorship at +7, combining for a 90.0 macro fit that is the highest in the portfolio. XOP's 25.0% 13-week return and 16.8% relative strength versus SPY demonstrate that the technical setup has genuine momentum behind it, not just macro tailwind. The 100.0 momentum confirmation score from 15.3% four-week return and bullish improving MACD confirms active accumulation. This category is the clearest case for overweight: macro regime is maximally favorable, technicals are strongest in the portfolio, relative strength is leading all peers, and volume is confirming the move. Energy remains the portfolio's core conviction trade in a late-cycle inflation regime where supply constraints are the binding constraint.
Nuclear Energy — URNM
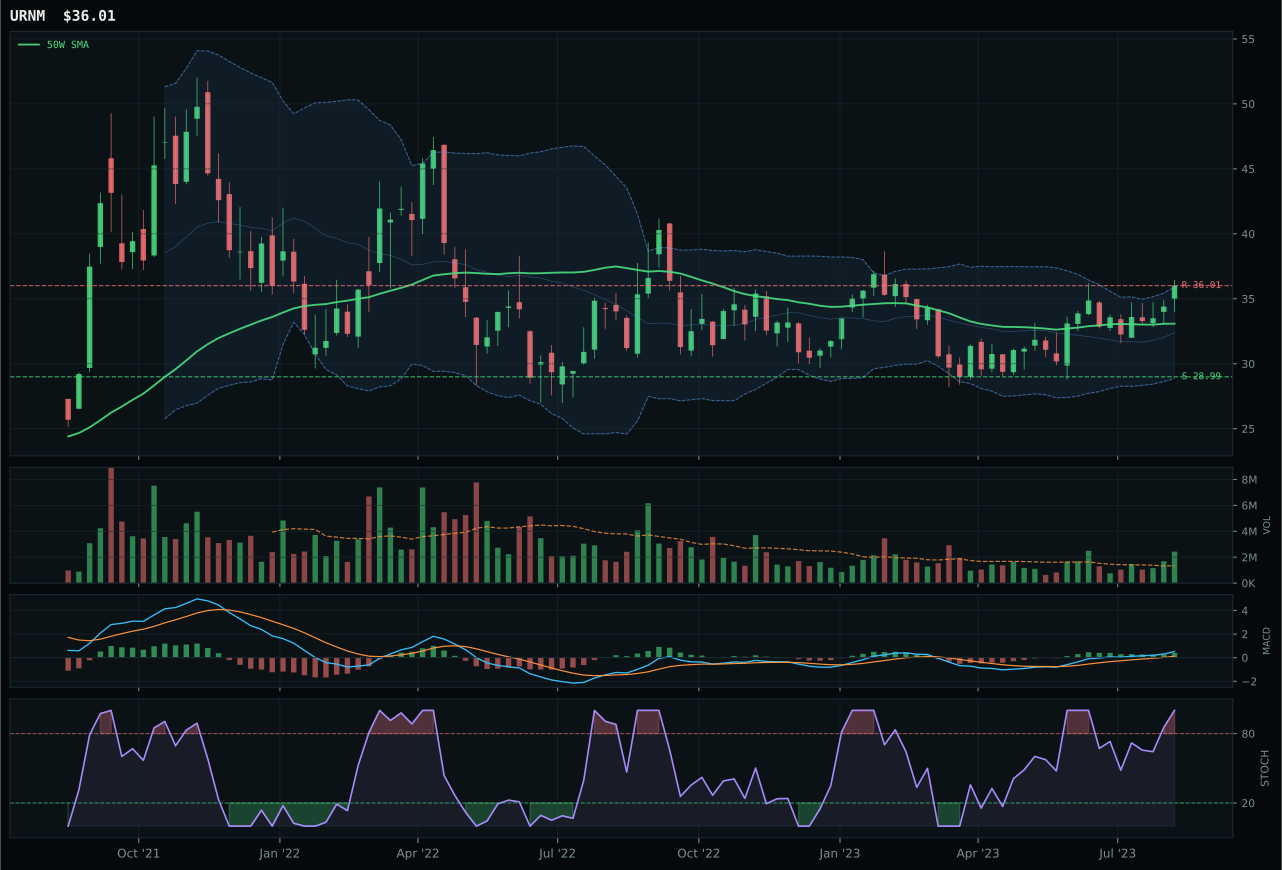
URNM has a neutral structure profile with 4.8% 13-week relative strength versus SPY.
A failed hold above support would weaken the setup.
Actionable but governed by invalidation levels.
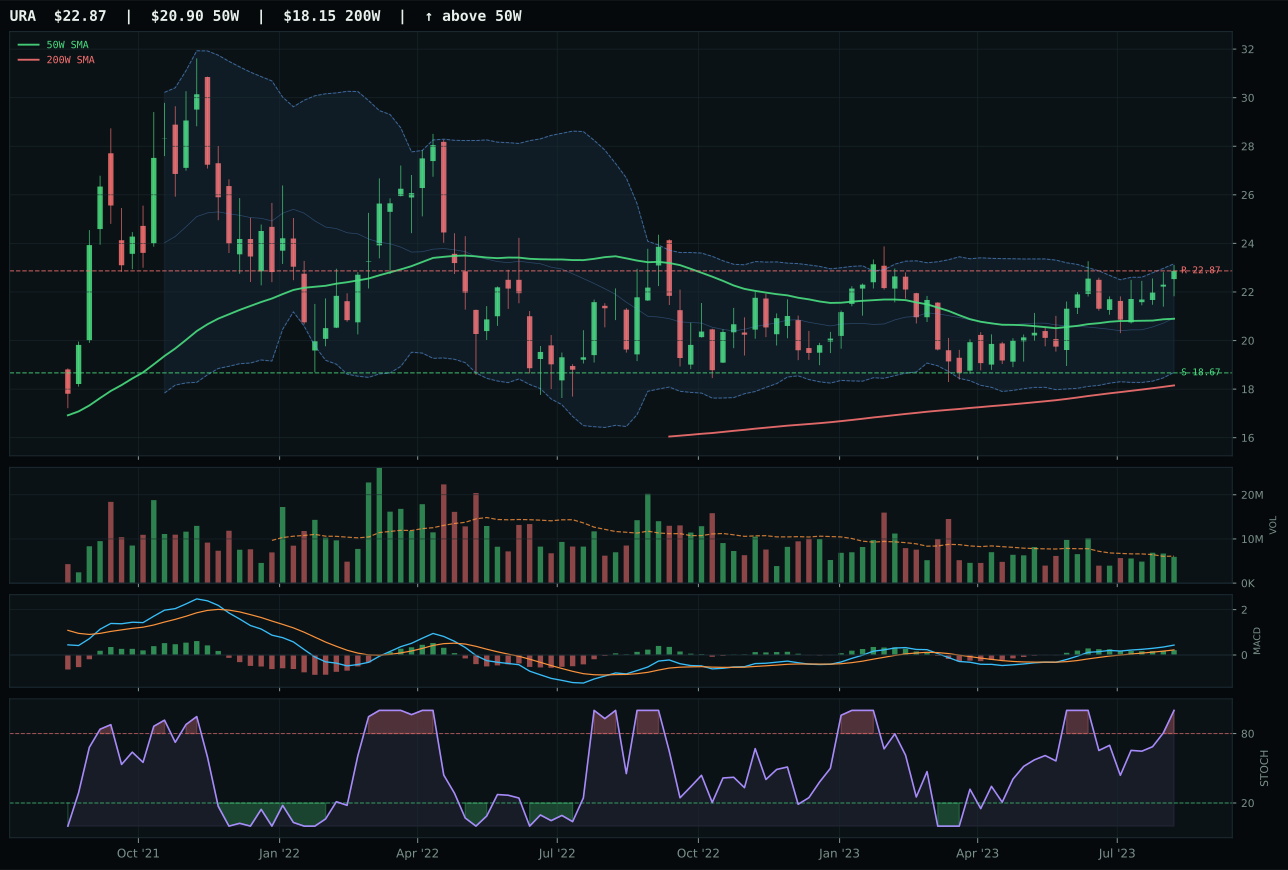
URA has a neutral structure profile with 4.3% 13-week relative strength versus SPY.
A failed hold above support would weaken the setup.
Actionable but governed by invalidation levels.
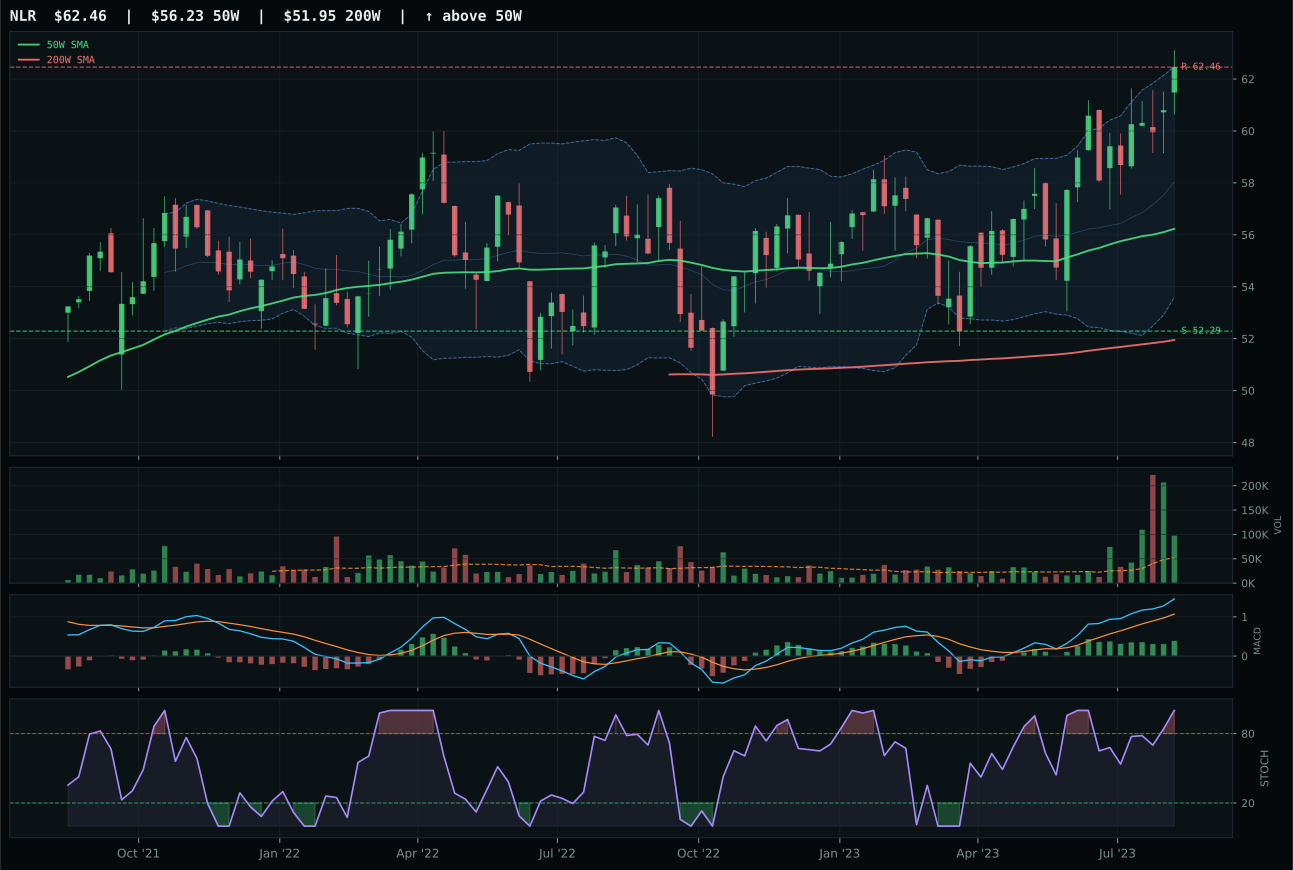
NLR has a neutral structure profile with 0.2% 13-week relative strength versus SPY.
A failed hold above support would weaken the setup.
Tracked, but not top-2 eligible because: .
URNM wins nuclear energy through superior volume confirmation and risk/reward structure, despite being ranked second in the reasoned ETF proof order behind URA. URNM's volume is accumulation/confirmation at 1.81x the 20-week average—the strongest in the basket—while URA sits at neutral volume, and that participation difference drives volume-price confirmation to 89.5 versus URA's lower score. Risk/reward is 64.0 for URNM versus 51.4 for URA, reflecting better support-to-resistance positioning (24.2% downside to 28.99 versus smaller edge in URA). Both are bullish with improving MACD and overbought stochastic RSI, both have 13-week returns in the 12-13% range with +4% to +5% relative strength, but URNM's accumulation pattern and superior risk geometry make it the cleaner entry. URA's 100.0 trend score (price above both moving averages) and slightly stronger technical evidence cannot overcome URNM's volume sponsorship and risk management advantage.
Nuclear Energy earns 10% allocation as a top-2 overweight, the second-highest-scoring category at 69.2. Energy scarcity is active at +9, real asset sponsorship at +7, and Late-Cycle Reflation regime helps by +7, producing a 69.0 macro fit that supports the allocation. URNM's perfect 100.0 momentum confirmation score from 7.2% four-week return and bullish improving MACD, combined with 89.5% volume-price confirmation and 1.81x accumulation volume, signals active institutional buying into a scarcity narrative. The 13.1% 13-week return and 4.8% relative strength versus SPY prove this is not a macro-only story—technicals are confirming the thesis. Allocate 10% as the portfolio's second real asset conviction: uranium supply is structurally tight, energy scarcity is the regime driver, and URNM's accumulation pattern into resistance shows sophisticated money is positioning for a multi-quarter theme. The category's 69.2 score ranks second only to traditional energy among all 10 categories, making this the logical pairing for a commodity and scarcity-driven late-cycle allocation.
AI — AIQ
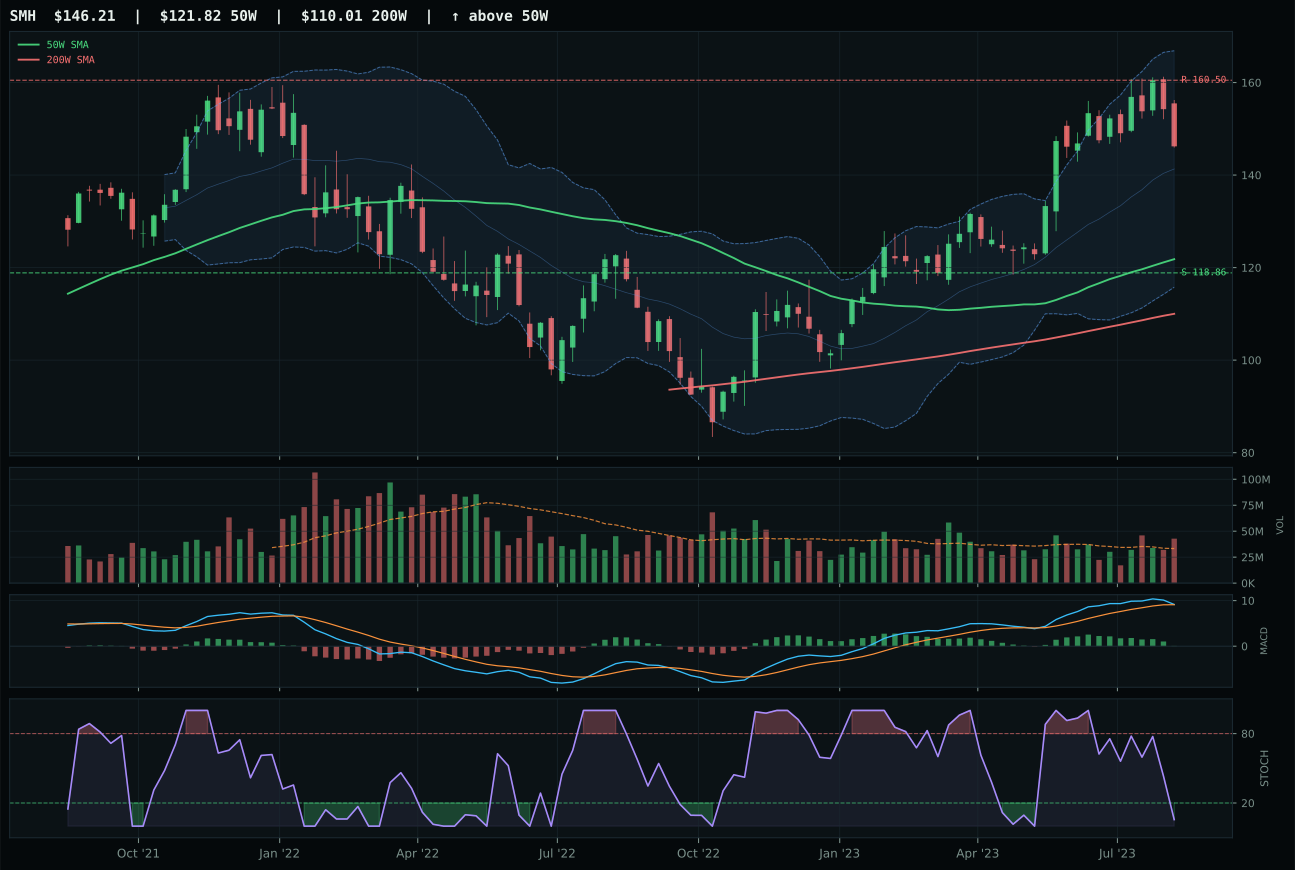
SMH has a vertical extension profile with 10.7% 13-week relative strength versus SPY.
A failed hold above support would weaken the setup.
Actionable but governed by invalidation levels.
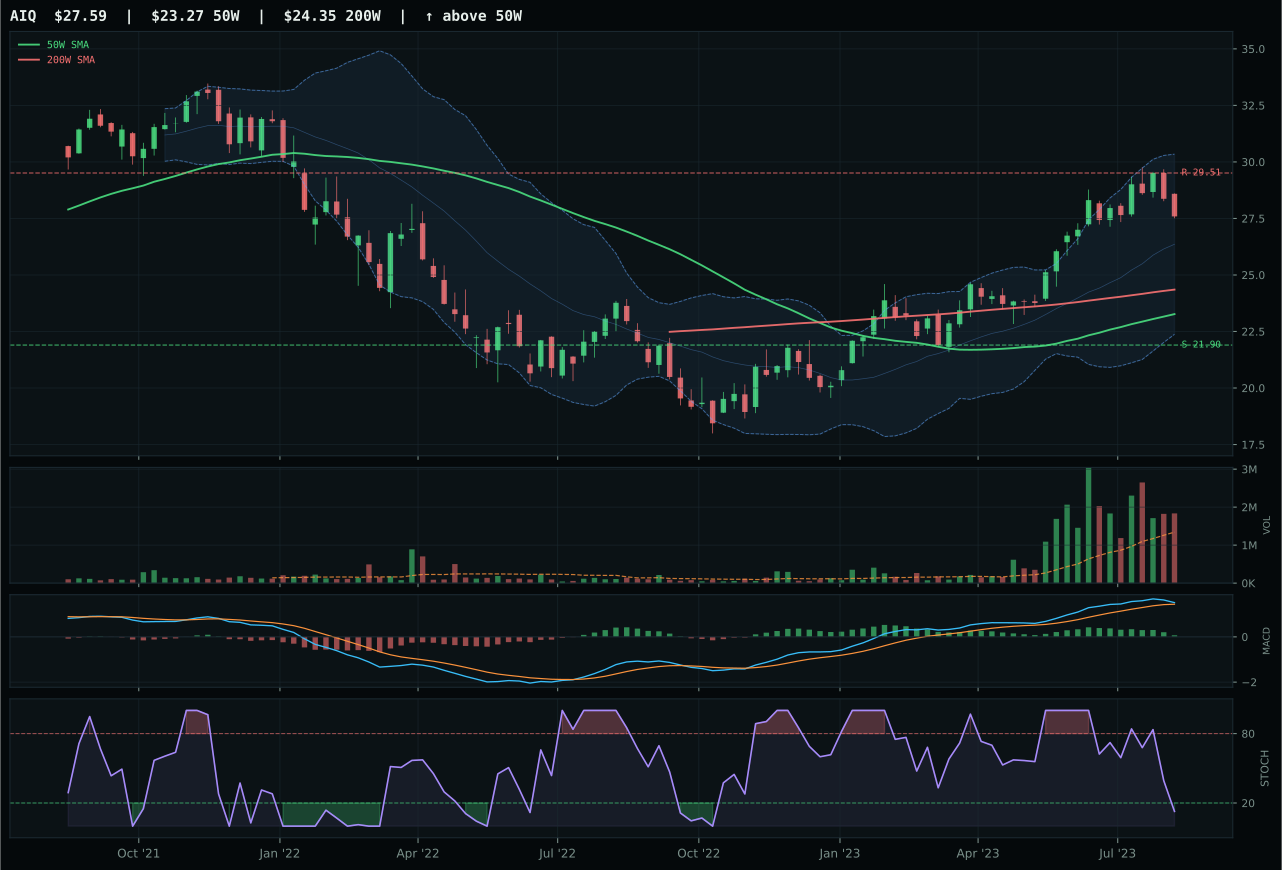
AIQ has a vertical extension profile with 7.8% 13-week relative strength versus SPY.
A failed hold above support would weaken the setup.
Actionable but governed by invalidation levels.
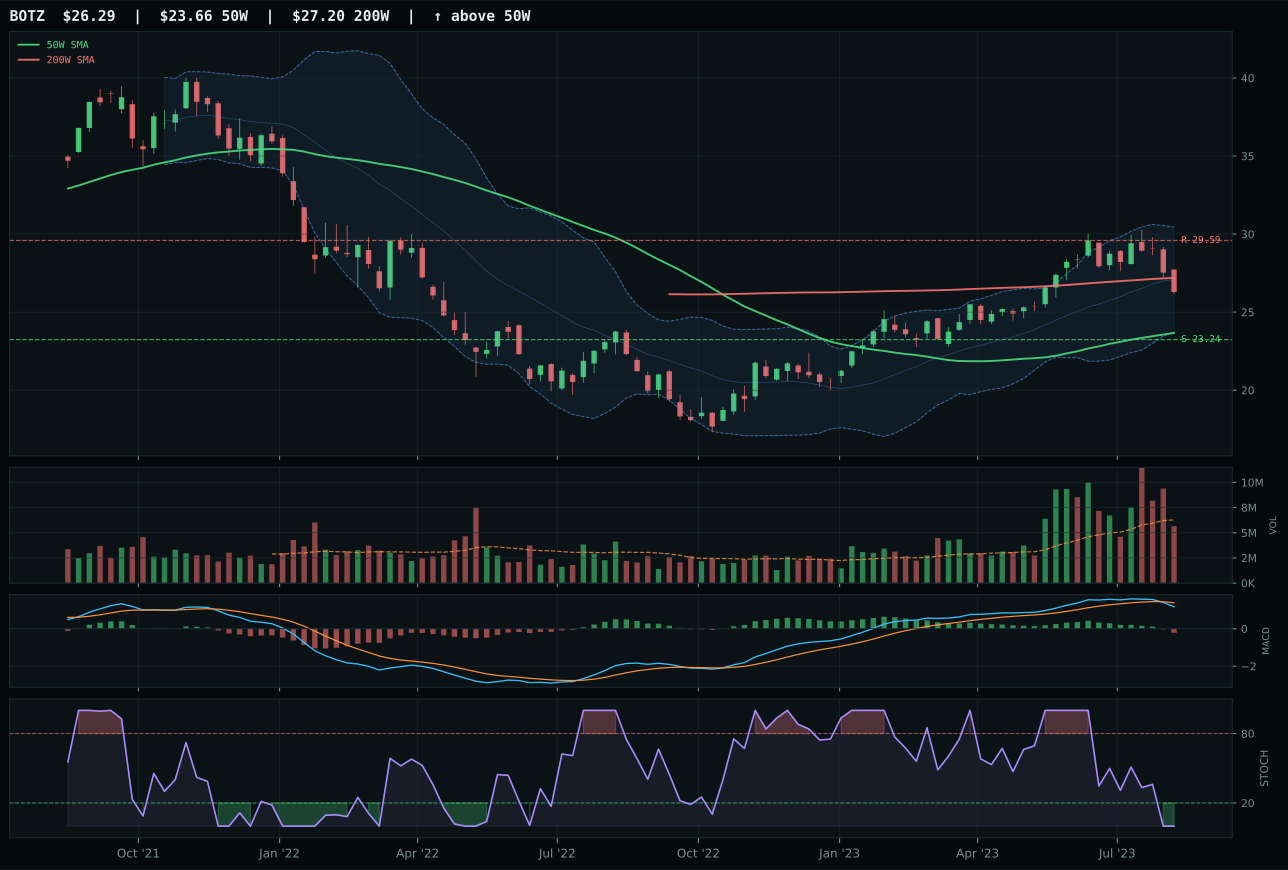
BOTZ has a neutral structure profile with -4.6% 13-week relative strength versus SPY.
A failed hold above support would weaken the setup.
Actionable but governed by invalidation levels.
AIQ wins despite being marginally behind SMH in technical composite score because structure quality separates the two. AIQ's 76.5 structure score versus SMH's 71.9 reflects cleaner consolidation mechanics—vertical extension setups carry entry risk, but AIQ's 58.3 cleanliness is superior to what SMH offers. Both trade at 18.6% and 14.4% above their respective 50-week averages, both carry oversold stochastic RSI readings, and both have bullish-but-flattening MACD signatures, but AIQ's above-average volume participation (1.37x the 20-week average) suggests accumulation into resistance rather than exhaustion. SMH's 10.7% category-relative strength advantage over AIQ would normally dominate, but timing risk and structural cleanliness matter more when price is this far extended from trend support.
AI earns 5% allocation as a tier-2 category, outside the top-2 despite macro conditions that appear favorable. AI growth sponsorship is active at +14 points, risk appetite is positive at +10, yet liquidity stress and credit stress subtract -12 and -8 respectively, producing a 54.0 macro fit that lags the two chosen overweights. The category's 55.4 final score places it third overall, and while the technical evidence from URNM and XOP both scored higher, this represents rational discipline: the regime is Late-Cycle Reflation, which prioritizes real assets, energy scarcity, and uranium supply dynamics over software applications. AI's setup is undeniably strong—13-week returns of 16.1%, above-average volume, bullish momentum—but momentum strength in late-cycle doesn't automatically justify overweight when commodities and energy are the regime's primary drivers. Allocation could shift to top-2 if credit stress intensity eases or if risk appetite becomes the dominant macro descriptor.
Industrial Metals — COPX
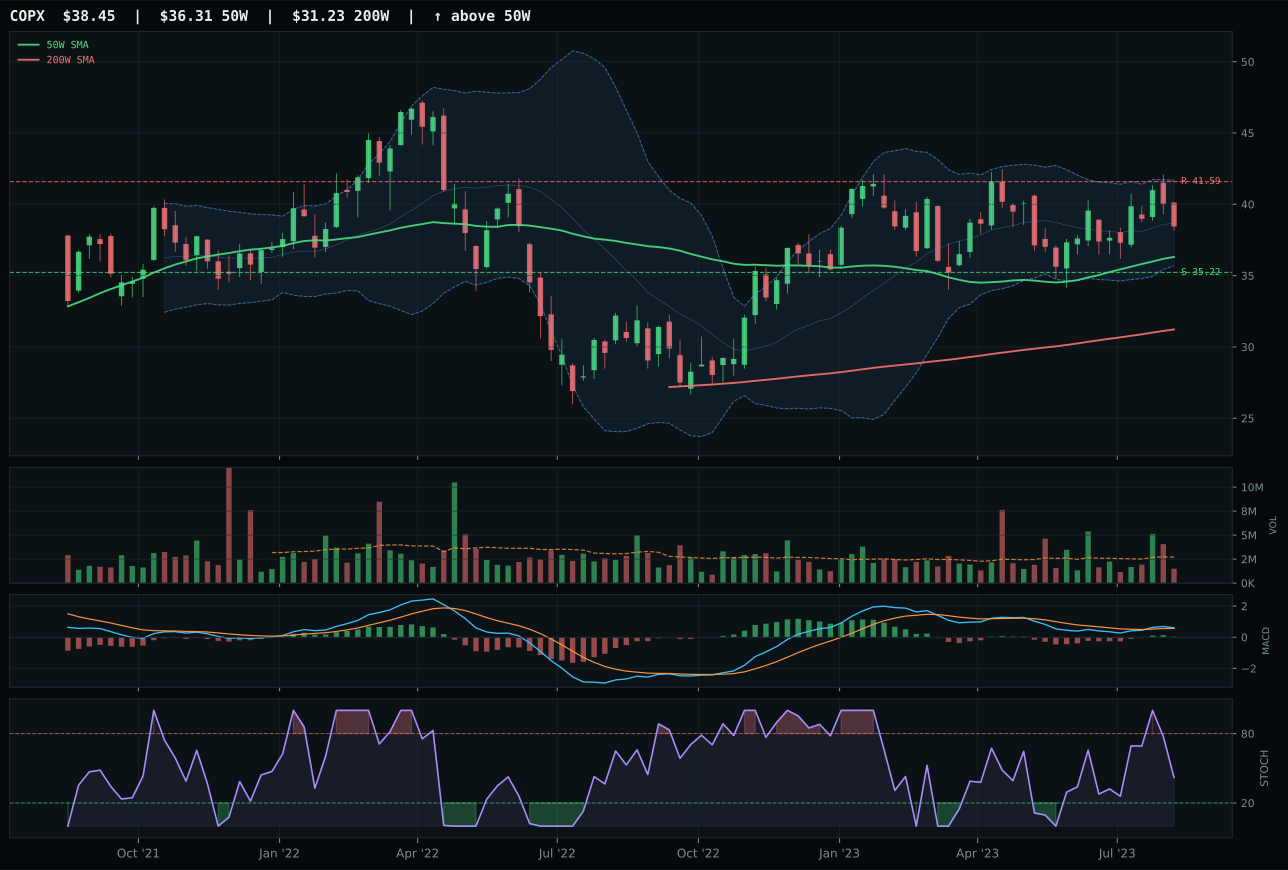
COPX has a neutral structure profile with -4.7% 13-week relative strength versus SPY.
A failed hold above support would weaken the setup.
Actionable but governed by invalidation levels.
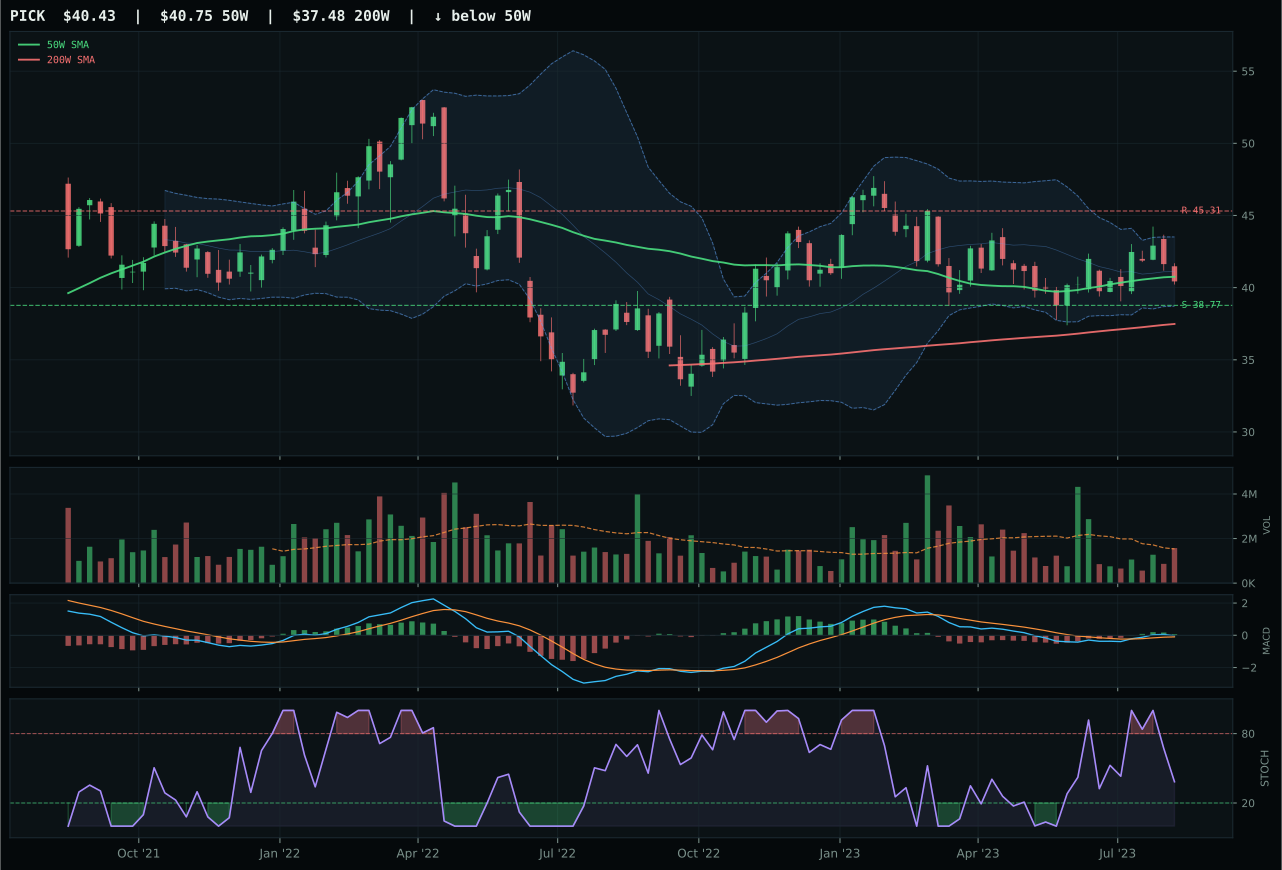
PICK has a pullback into support profile with -6.7% 13-week relative strength versus SPY.
A failed hold above support would weaken the setup.
Actionable but governed by invalidation levels.
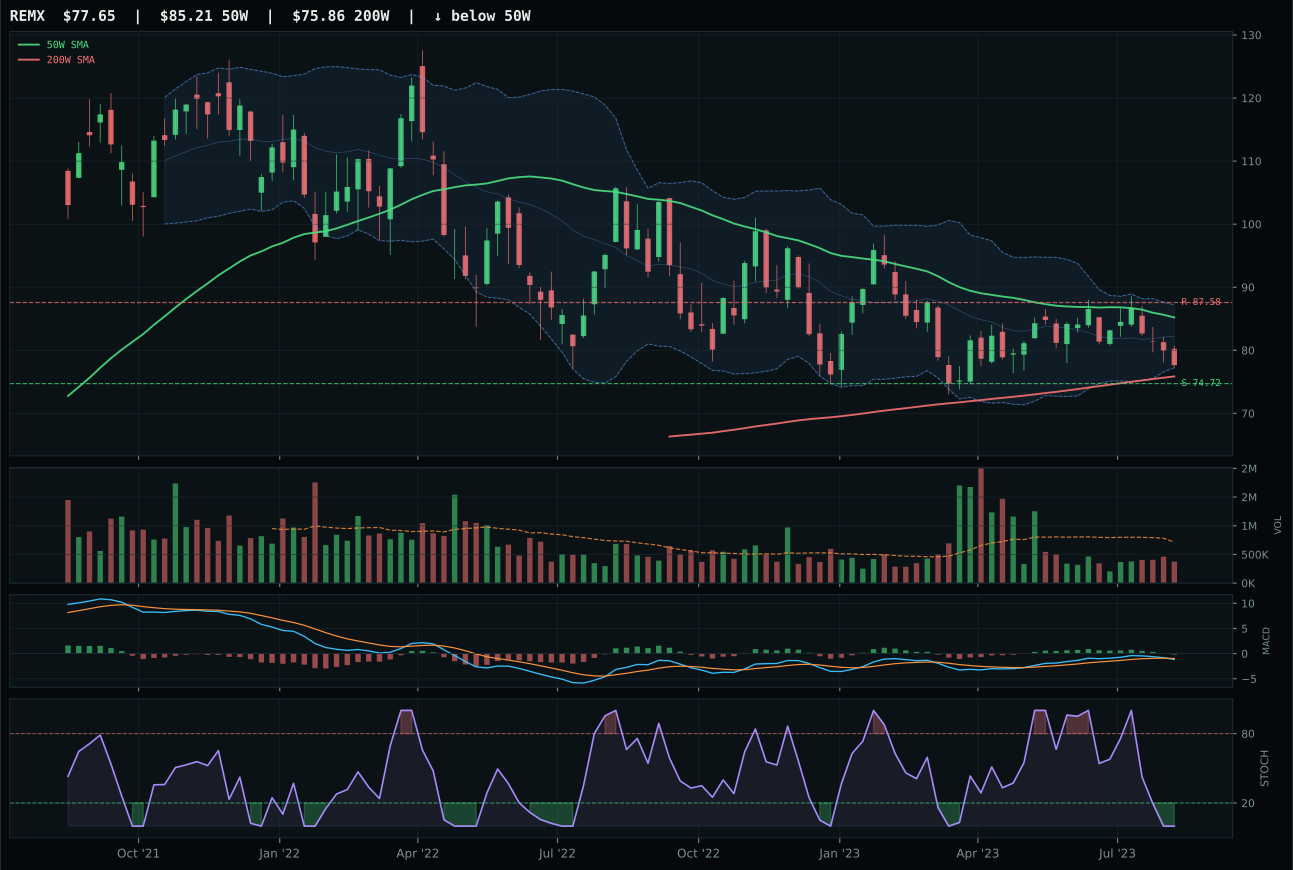
REMX has a pullback into support profile with -16.2% 13-week relative strength versus SPY.
A failed hold above support would weaken the setup.
Actionable but governed by invalidation levels.
COPX wins industrial metals through superior category-relative strength and improving momentum mechanics. Both COPX and PICK sit above their respective 50-week and 200-week averages with bullish improving MACD, but COPX's +2.0% category-relative strength edges PICK's 0.0%, and that delta proves decisive in a tight race where composite scores are separated by only 6 points. COPX's stochastic RSI is falling/neutral at 0.42 (not yet overbought), while timing is 75.0 across both names, creating an environment where COPX has more room to run before momentum exhaustion. The setup is neutral structure for both, and 13-week returns are muted (3.6% and 1.6%), but COPX's 5.9% extension above the 50W combined with improving momentum creates a cleaner entry signal than PICK's pullback-into-support configuration.
Industrial Metals earns 5% allocation as a tier-2 category, capturing strong macro support that does not yet translate to top-2 rank. Metals scarcity is active at +14, commodity breadth positive at +10, real asset sponsorship at +6, and Late-Cycle Reflation regime helps by +10, producing a 75.0 macro fit score that is the strongest outside the two chosen overweights. Yet COPX's 70.0 technical evidence score is held back by thin volume participation (0.55x the 20-week average) and thin category structure (cleanliness only 50.0), preventing the category from reaching the 69.2 or 90.7 threshold needed for top-2 consideration. The 53.6 final score ranks fourth among the eight allocated categories, a respectable middle tier. Allocate 5% to benefit from scarcity sponsorship and real asset inflation hedging, but capital deployment is conservative here because execution risk remains high due to thin participation; if volume confirmation improves and structure becomes cleaner, COPX and the category as a whole would justify promotion to 10%.
Technology — CIBR
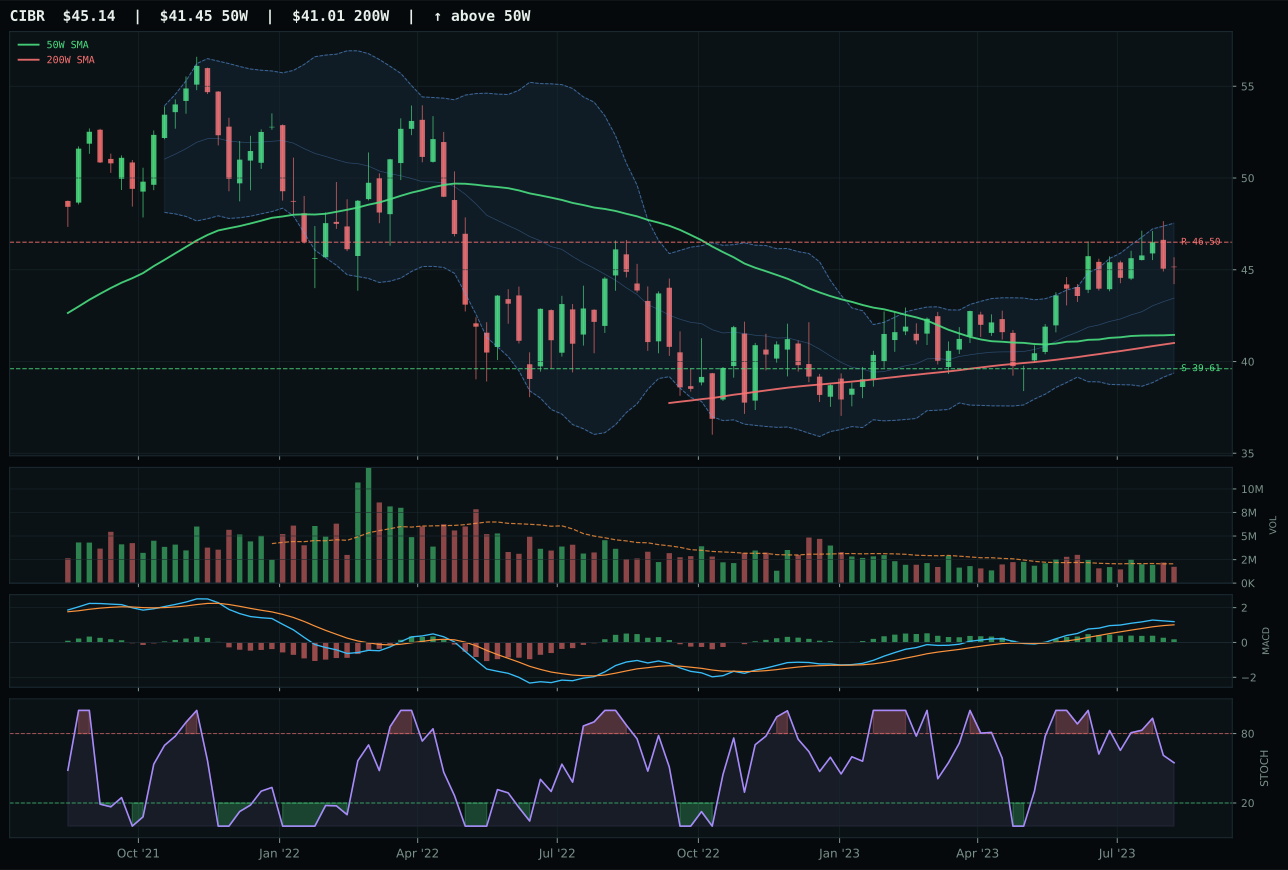
CIBR has a neutral structure profile with 3.3% 13-week relative strength versus SPY.
A failed hold above support would weaken the setup.
Actionable but governed by invalidation levels.
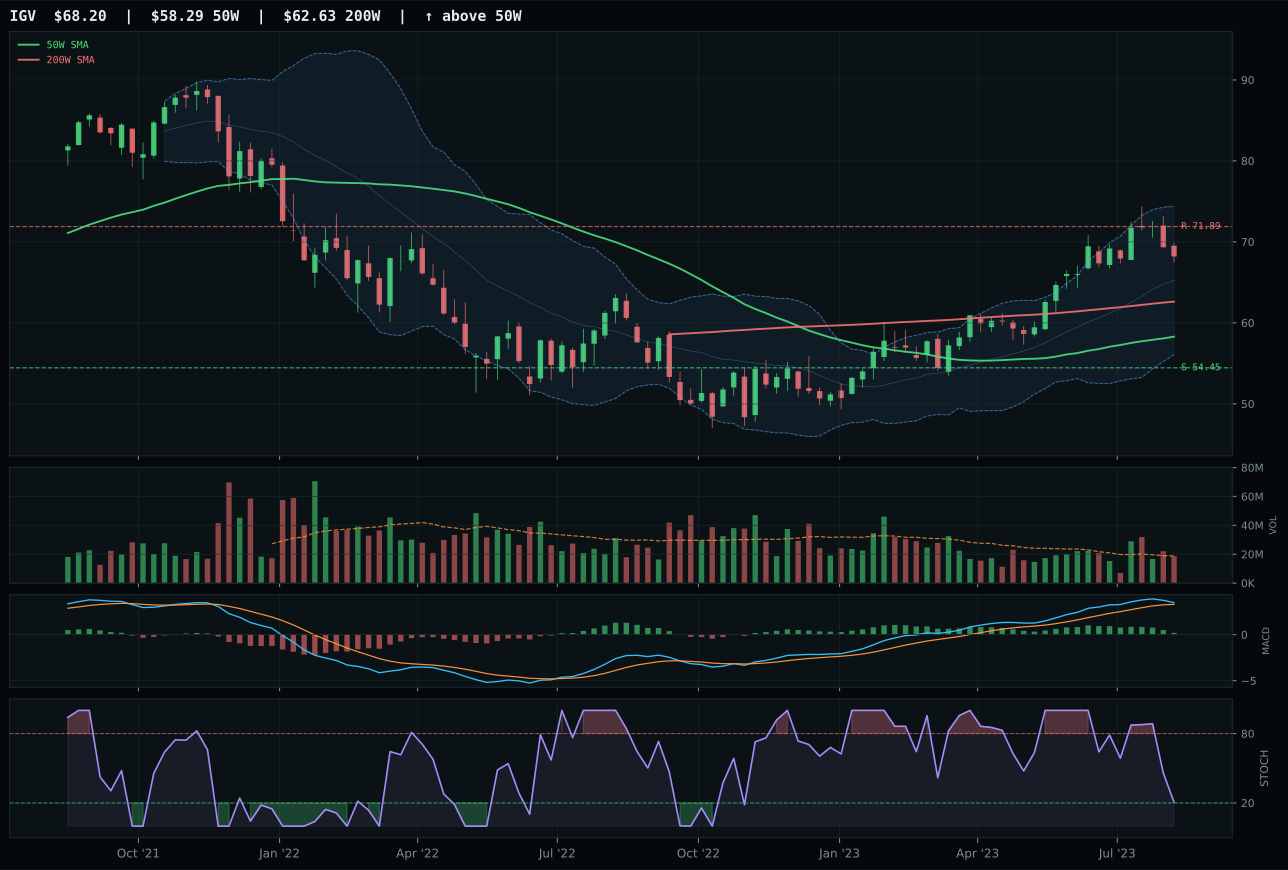
IGV has a vertical extension profile with 6.4% 13-week relative strength versus SPY.
A failed hold above support would weaken the setup.
Actionable but governed by invalidation levels.
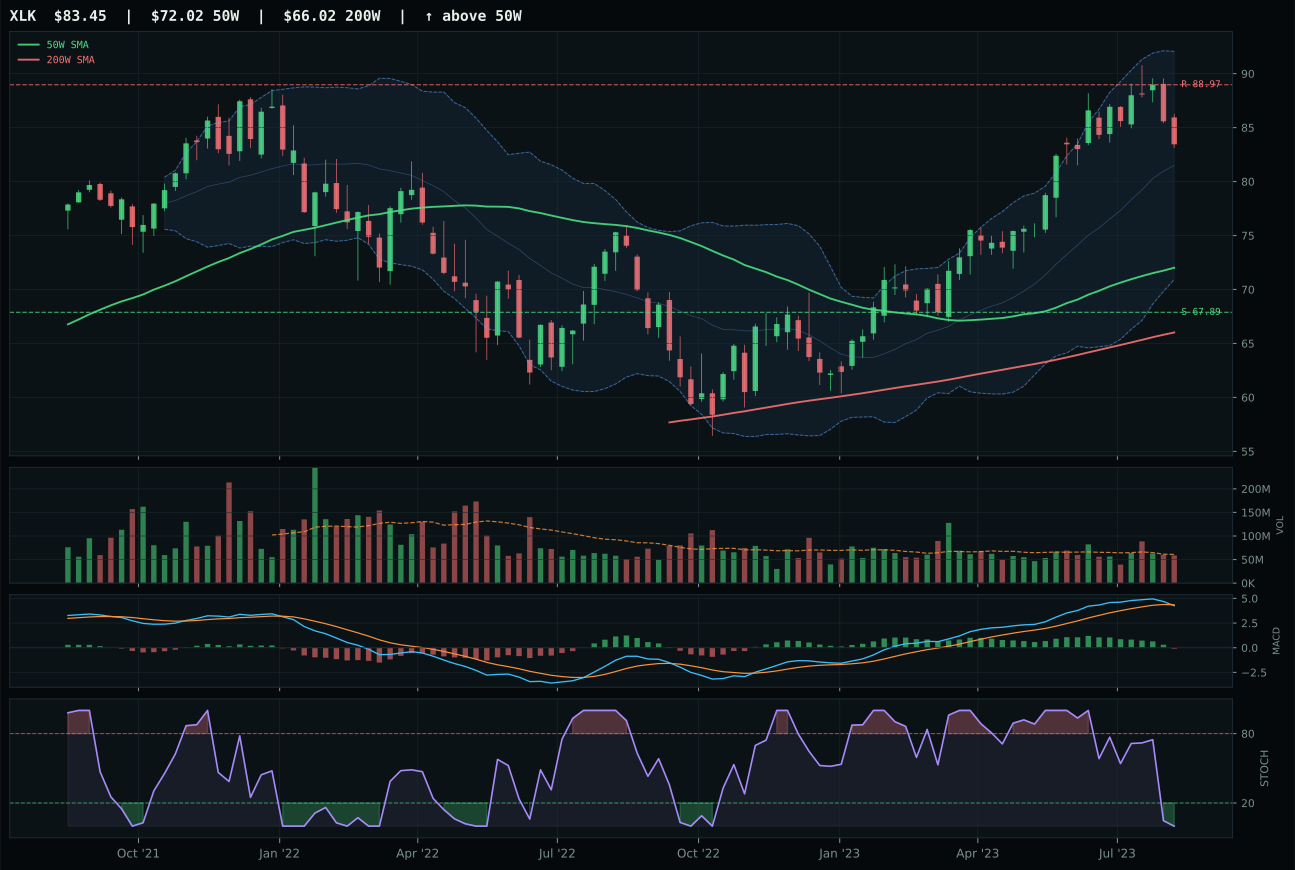
XLK has a vertical extension profile with 2.3% 13-week relative strength versus SPY.
A failed hold above support would weaken the setup.
Actionable but governed by invalidation levels.
CIBR wins the category by combining price stability with controlled momentum. The cybersecurity ETF sits just 8.9% above its 50-week moving average—close enough to the trend line that new entries aren't fighting an extended setup—while its 13-week return of 11.6% and 3.3% relative strength versus SPY prove participation is real but not speculative. MACD is bullish but flattening, and stochastic RSI is neutral at 0.55, signaling that momentum confirmation remains intact without excessive overbought conditions. IGV, the runner-up, traded away timing score by sitting 17.0% above the 50W, forcing later buyers into a vertical extension where the risk asymmetry has shifted sharply against new longs; its 14.7% 13-week return only magnifies the problem that the setup itself is tired rather than fresh.
Technology earns 5% allocation as a tier-2 category, holding ground despite two higher-scoring peers claiming the top-2 overweight slots. The 44.0 macro fit score reflects genuine tension: AI growth sponsorship and risk appetite are active tailwinds, but liquidity stress and credit stress drag the category down by nine and seven points respectively. Late-Cycle Reflation typically favors real assets and cyclicals over software and duration-sensitive growth, so this allocation is defensive positioning—acknowledging that CIBR's cybersecurity niche has structural demand resilience even if the broader tech complex faces headwinds. If credit stress reverses or if AI sponsorship becomes the dominant regime signal, this category would quickly justify promotion to top-2, but for now 5% captures value without overcommitting to a regime that hasn't yet shifted.
Defense & Aerospace — ITA
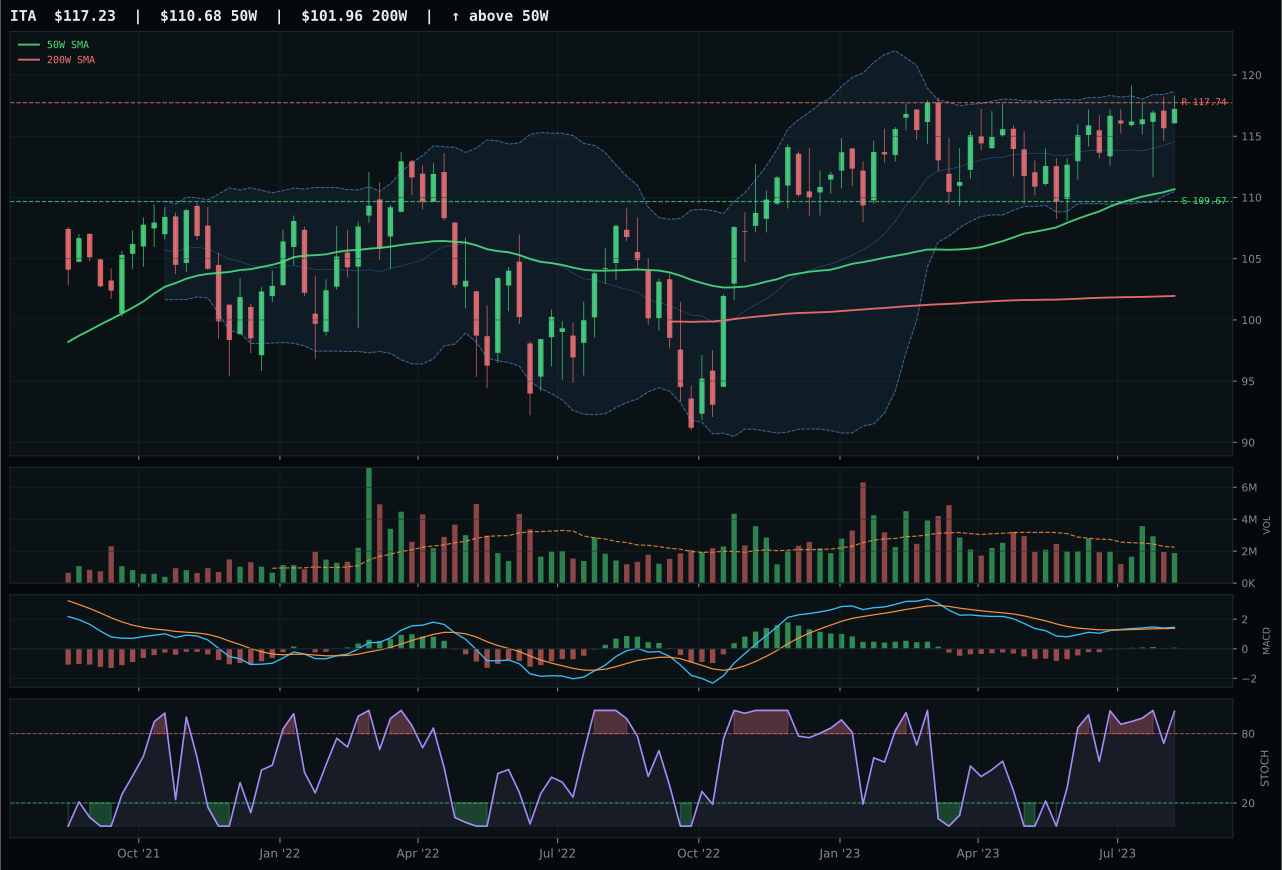
ITA has a neutral structure profile with -2.6% 13-week relative strength versus SPY.
A failed hold above support would weaken the setup.
Actionable but governed by invalidation levels.
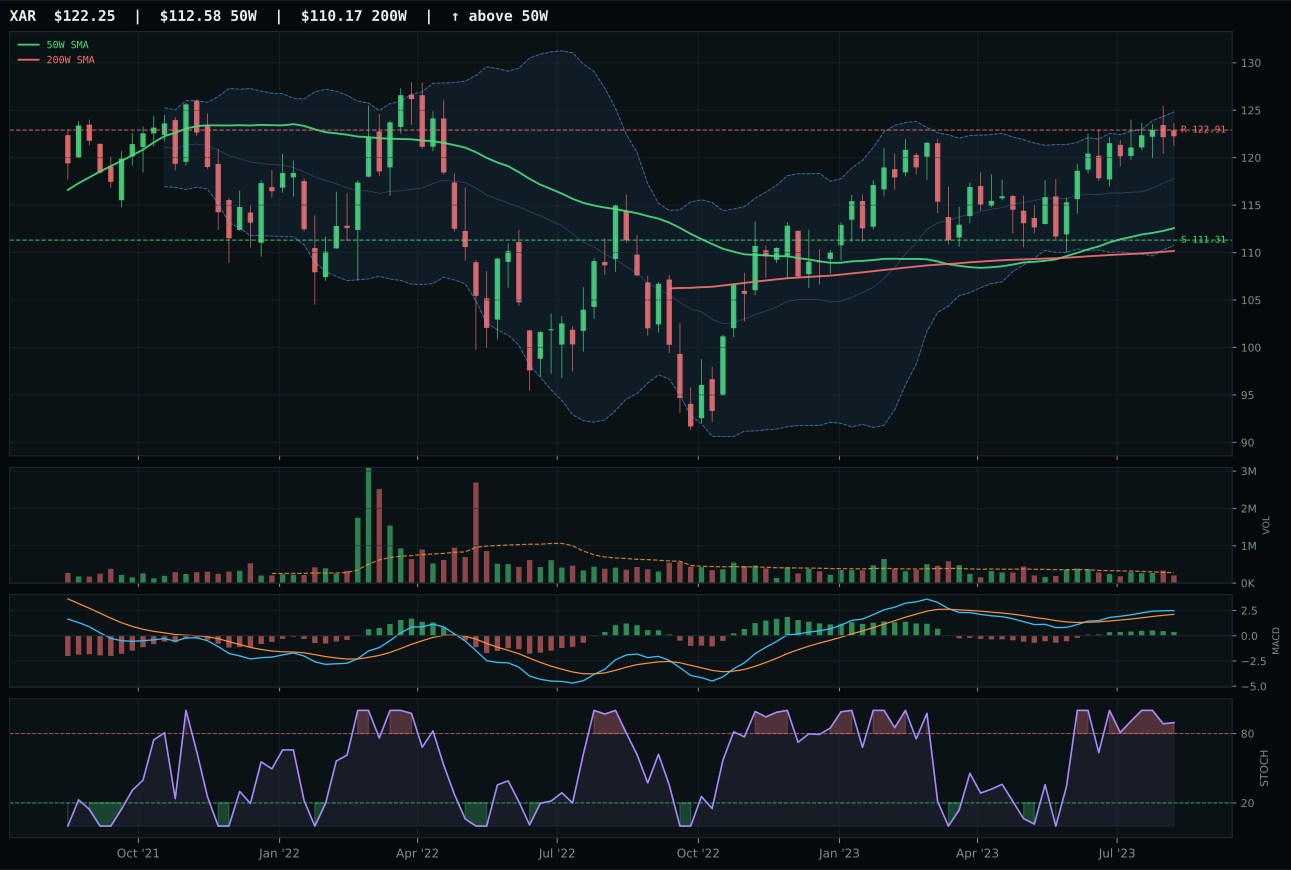
XAR has a neutral structure profile with 0.2% 13-week relative strength versus SPY.
A failed hold above support would weaken the setup.
Actionable but governed by invalidation levels.
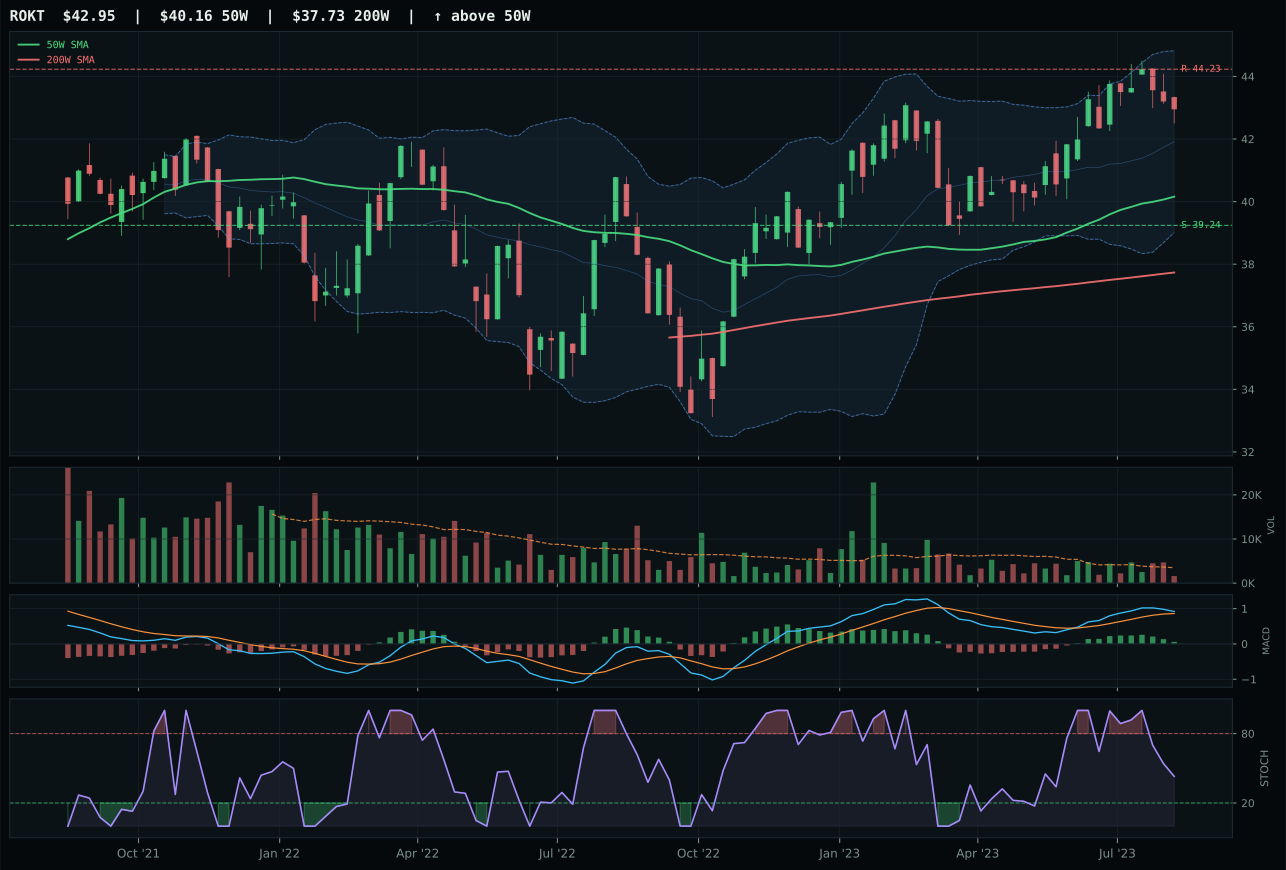
ROKT has a neutral structure profile with -1.2% 13-week relative strength versus SPY.
A failed hold above support would weaken the setup.
Tracked, but not top-2 eligible because: .
ITA wins through MACD and volume confirmation, a mechanical edge that separates it cleanly from XAR. ITA's MACD is bullish and improving—a stronger signal than XAR's bullish-but-flattening profile—and that distinction drives timing to 75.0 versus XAR's 52.0. Volume is neutral at 0.84x the 20-week average, which is acceptable, whereas XAR's thin participation (below benchmark) adds friction to the setup. Both are near 52-week highs with stochastic RSI overbought, but ITA's 5.7% 13-week return and improving momentum indicator suggest recent accumulation into the move, not late-stage exhaustion. The risk/reward trade is nearly identical at 38.1 versus 38.0, and both sit 6% above support, so the category decision hinges on momentum confirmation quality—ITA wins that battle decisively.
Defense & Aerospace earns 5% allocation as a tier-2 category, positioned between momentum leaders and excluded names. The 57.0 macro fit reflects modest tailwinds: Late-Cycle Reflation helps at +6, but credit stress subtracts -4 and liquidity stress costs -4, resulting in a mixed macro picture. ITA's -2.6% relative strength versus SPY indicates the entire category is lagging equities broadly, suggesting that while the technical setup is sound, macro conditions are not particularly favorable to defense durability or prime contractor strength. The category's 45.4 final score is 9.3 points below XOP and 24.2 points below URNM, which is the primary reason it sits at 5% rather than 10%. Hold this position if geopolitical risk escalates or if credit stress intensifies—both would accelerate ITA's case for promotion—but absent those catalysts, capital is better deployed toward energy and nuclear, where macro and technicals align.
Agriculture & Livestock — MOO
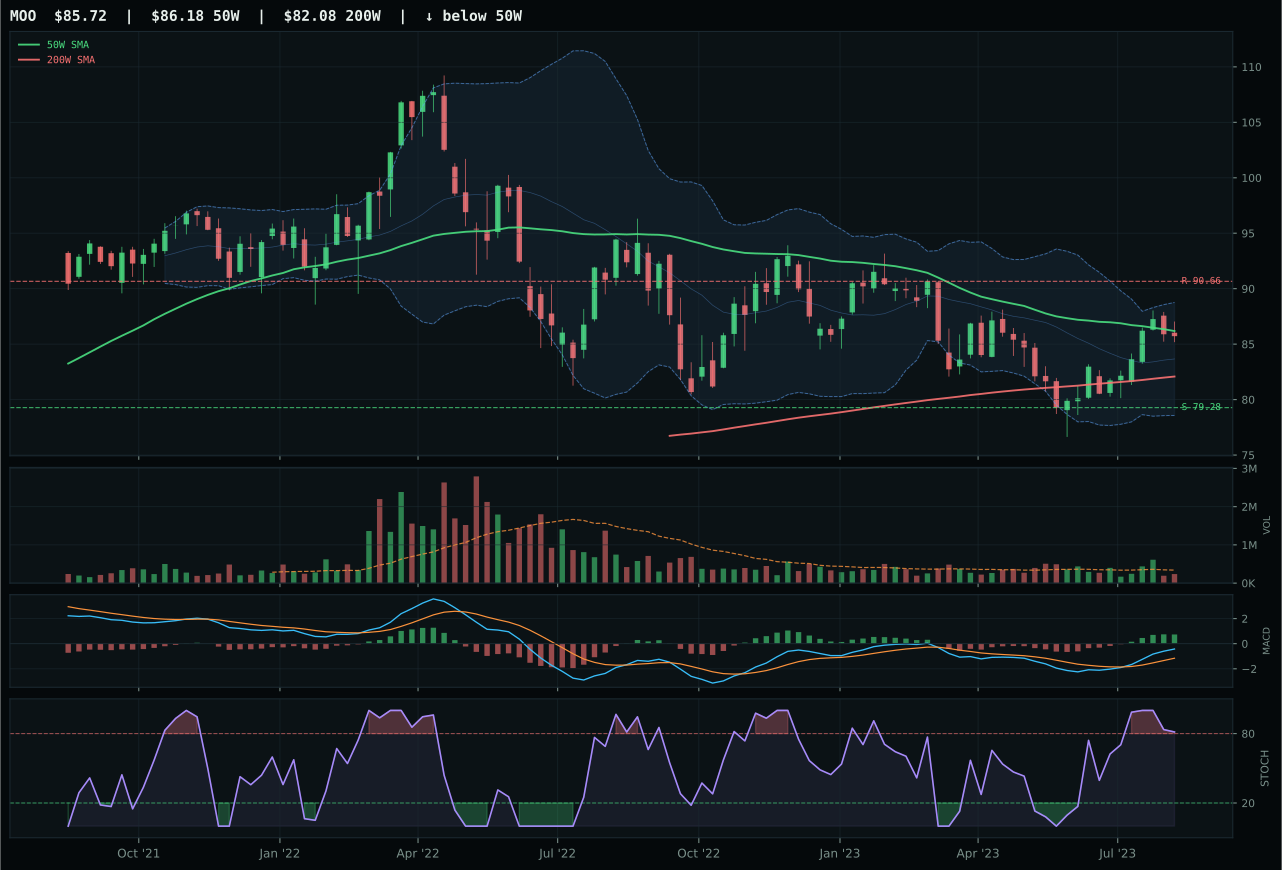
MOO has a compression near 50W profile with -3.9% 13-week relative strength versus SPY.
A failed hold above support would weaken the setup.
Actionable but governed by invalidation levels.
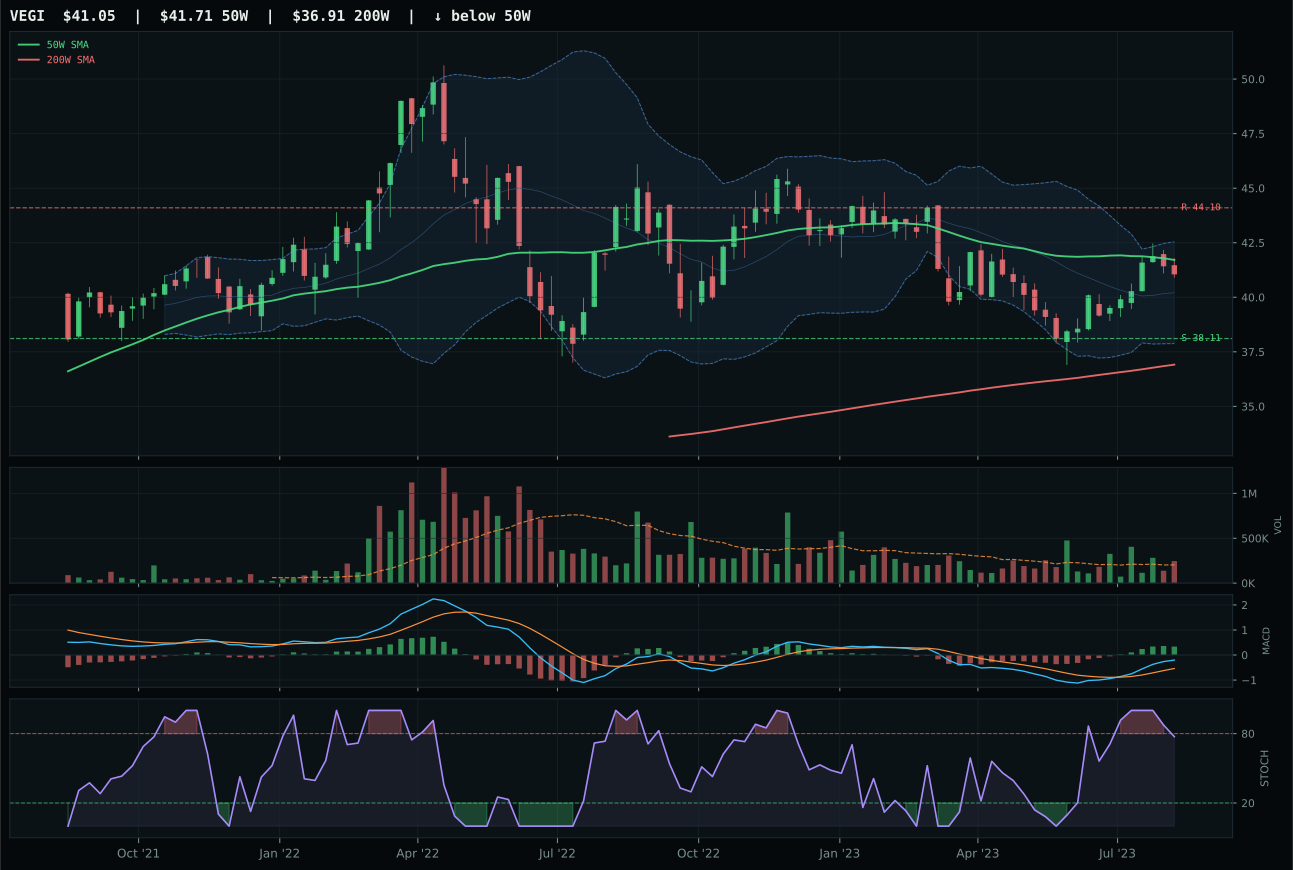
VEGI has a compression near 50W profile with -4.1% 13-week relative strength versus SPY.
A failed hold above support would weaken the setup.
Tracked, but not top-2 eligible because: .
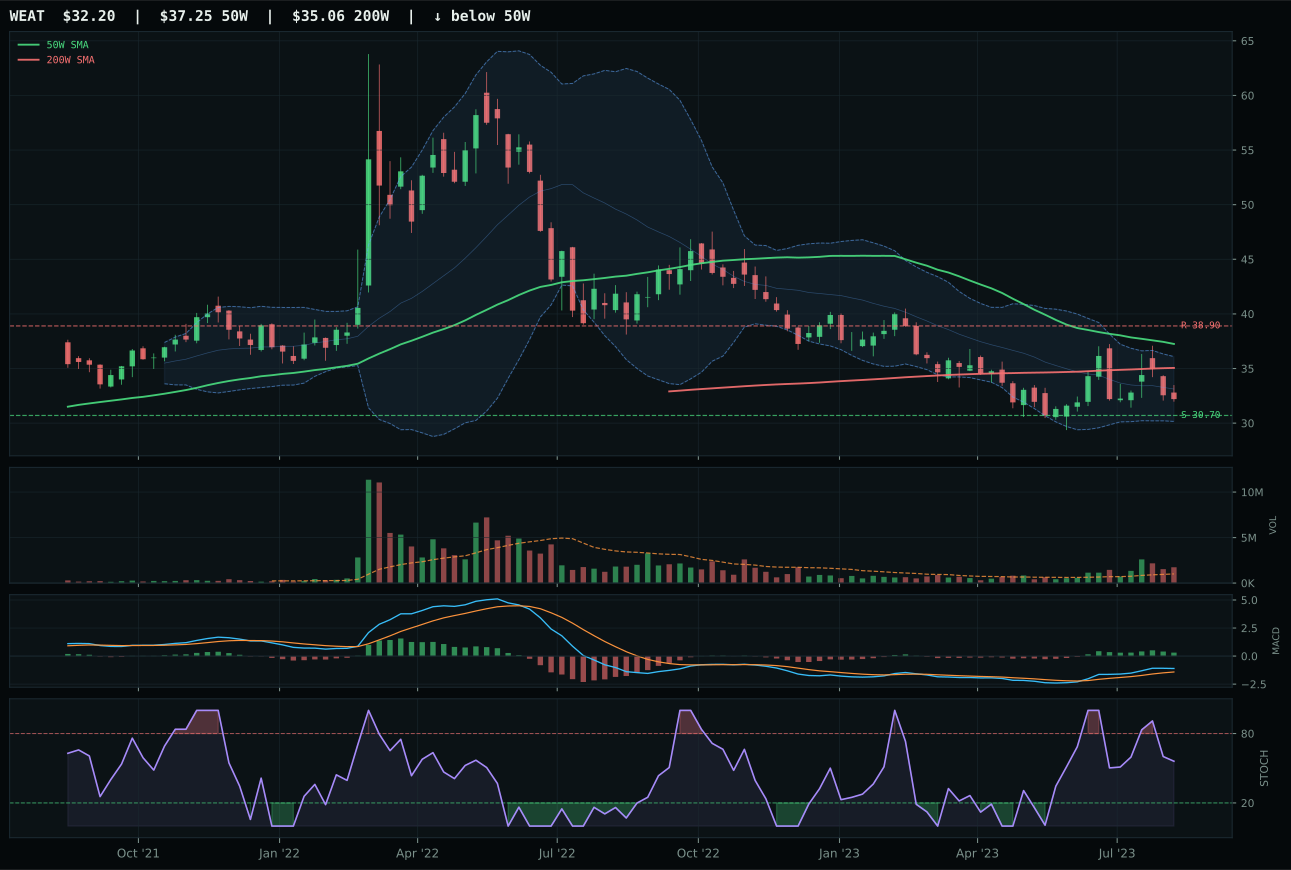
WEAT has a pullback into support profile with -7.5% 13-week relative strength versus SPY.
A failed hold above support would weaken the setup.
Actionable but governed by invalidation levels.
MOO wins the agriculture category by being positioned at the inflection point where pullback meets support. Price sits just 0.5% below the 50-week moving average, placing the chart in compression rather than downtrend, while timing scores a dominant 89.0—the best in the basket—because stochastic RSI is overbought rolling over and MACD is bullish and improving, creating a setup where mean reversion has mechanical credibility. The 8.1% downside to support at 79.28 versus only 5.4% upside to resistance at 90.66 produces a 65.1 risk/reward score, far superior to VEGI's weaker positioning. VEGI carries better volume (above-average participation) and superior technical evidence at 45.0 versus MOO's 59.0 overall, but loses the category decision because category-relative strength is marginally negative at 0.0% versus MOO's +0.2%—a small delta in an otherwise tight race.
Agriculture & Livestock earns 5% allocation as a tier-2 category despite a standout 90.0 macro fit score. Supply shortage is active at +13, inflation pressure at +10, real asset sponsorship at +8, and commodity breadth positive at +5, making this the second-most macro-favorable category after traditional energy. Yet the 45.2 final score ranks fifth overall, outside the top-2, because technical evidence from MOO, VEGI, and WEAT is materially weaker than what XOP and URNM deliver. MOO's trend score of 59.2 reflects price below the 50-week average despite being above the 200-week, and momentum confirmation is only 51.2—genuine headwinds that no amount of macro tailwind can fully offset in a quantitative framework. Allocate 5% to capture real asset inflation protection and supply-side sponsorship, but the category's technical setup argues for underweight relative to its macro quality. If price strength and volume confirmation improve materially, this category has room to jump to 10%.
Utilities & Infrastructure — XLU
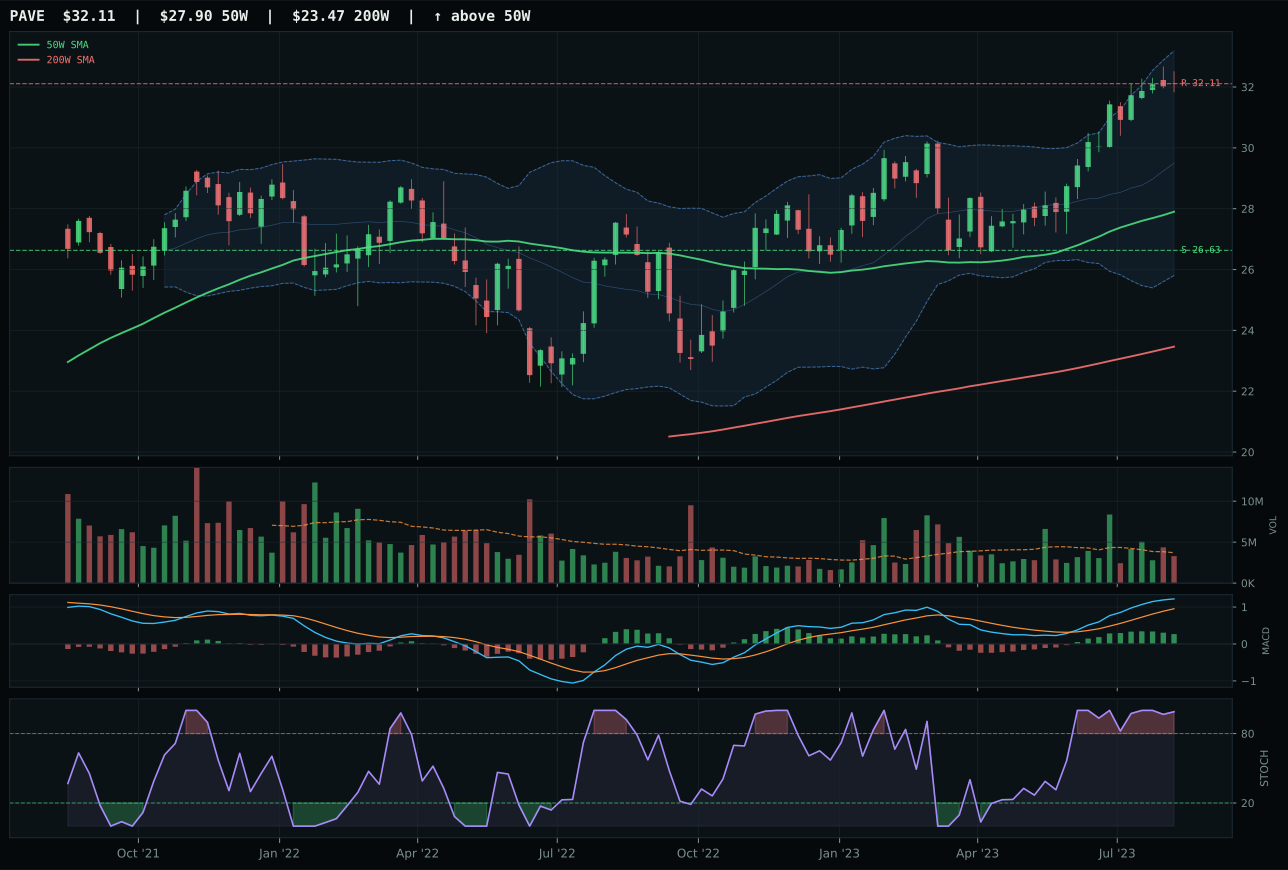
PAVE has a vertical extension profile with 7.6% 13-week relative strength versus SPY.
A failed hold above support would weaken the setup.
Actionable but governed by invalidation levels.
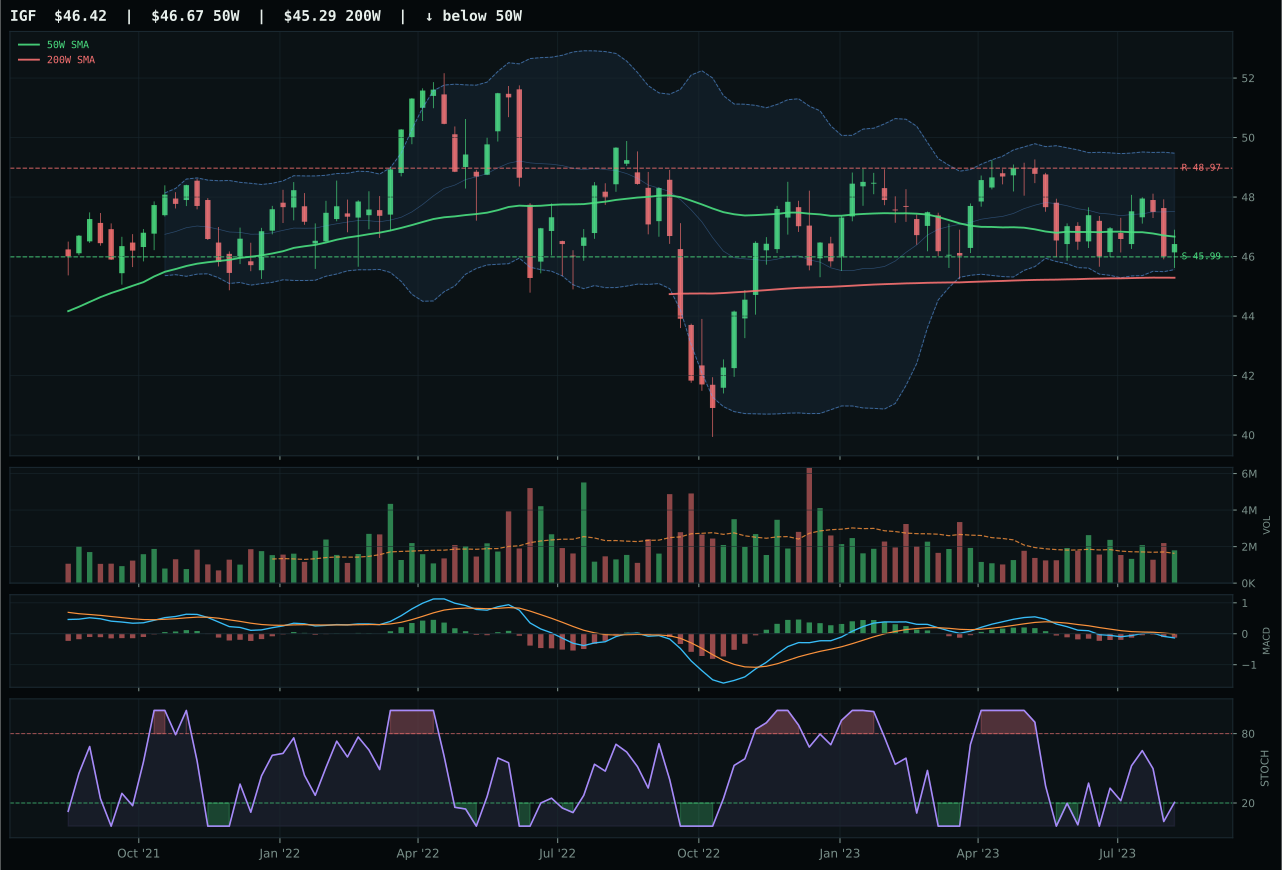
IGF has a pullback into support profile with -13.1% 13-week relative strength versus SPY.
A failed hold above support would weaken the setup.
Actionable but governed by invalidation levels.
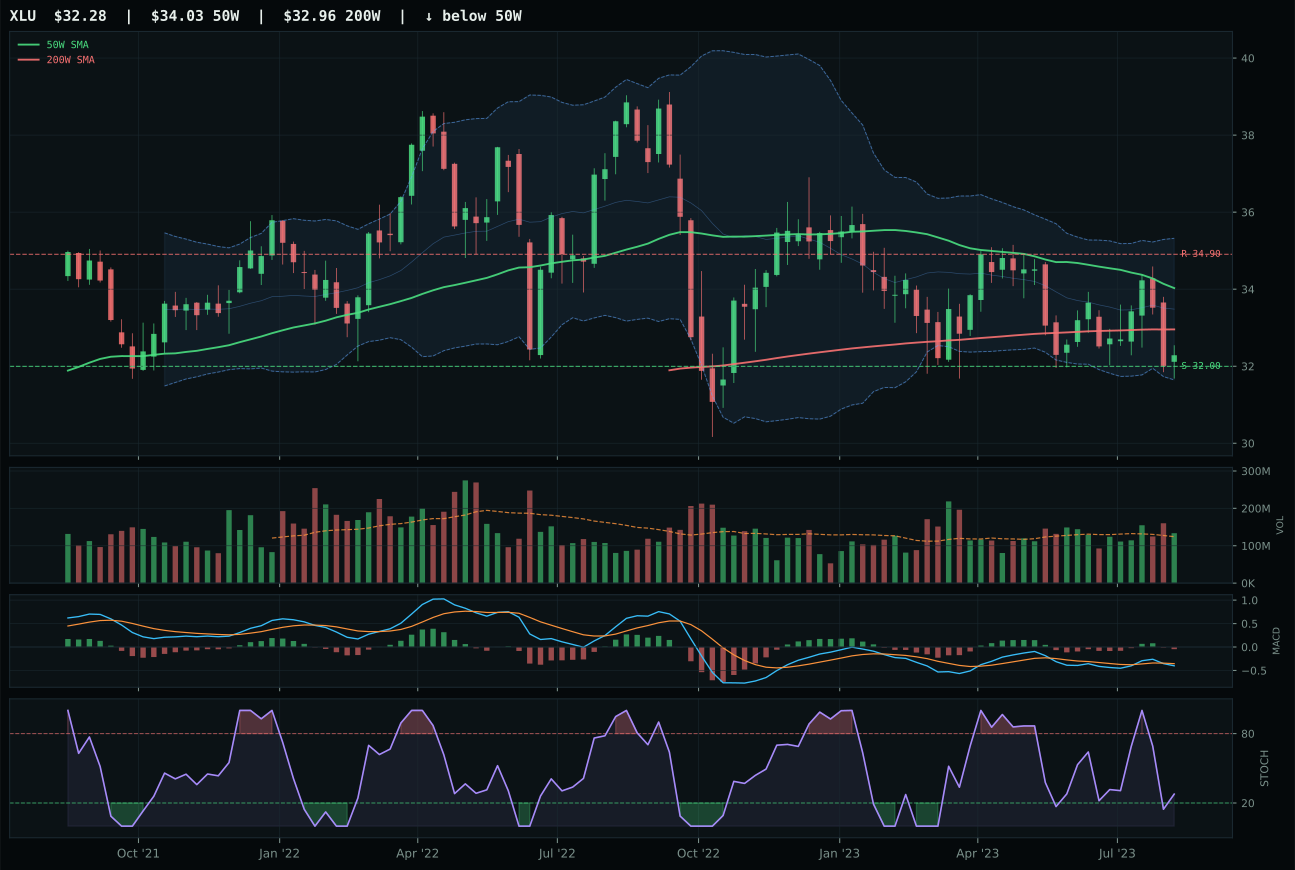
XLU has a pullback into support profile with -14.7% 13-week relative strength versus SPY.
A failed hold above support would weaken the setup.
Actionable but governed by invalidation levels.
XLU wins utilities and infrastructure through superior risk/reward structure and timing, despite being the weakest name in the category. XLU is in pullback-into-support mode at -5.1% from the 50-week average, with stochastic RSI falling/neutral at 0.28 and MACD bearish but flattening, setting up a potential reversal if support at 32.00 holds. Risk/reward is 98.0—dramatically superior to PAVE's 44.0—because there is only 0.9% downside to support versus -7.5% upside to resistance, creating an inverted risk-reward that makes sense only in a defensive context. PAVE is extended 15.1% above the 50-week with overbought stochastic RSI rolling over, a vertical extension setup that offers poor entry timing despite bullish momentum. Timing is 80.0 for XLU (pullback in reach of support) versus 22.0 for PAVE (far extended), and that timing differential drives XLU to victory despite both names being down hard on 13-week returns.
Utilities & Infrastructure earns 5% allocation as a tier-2 category, positioned as a defensive holding in a late-cycle regime dominated by real assets. The 43.0 macro fit is weak because inflation pressure is active at -6 (hurting regulated utilities) and risk appetite is active at -2, and Late-Cycle Reflation provides only +4 of support. XLU's -6.5% 13-week return and -14.7% relative weakness versus SPY illustrate why this category ranks 8th overall at 35.0—technicals are weak, momentum is absent, and macro conditions are not favorable. Allocate 5% only because risk/reward is asymmetric: XLU sits near support with defensive characteristics, and if credit stress escalates or if risk appetite genuinely reverses, utilities become the portfolio's shock absorber. This is insurance allocation, not conviction. The category's 35.0 score is 10.7 points below the tier-2 median, reflecting genuine weakness; it earns inclusion only because it is marginally better than excluded names. Monitor for regime shifts toward crisis conditions or recession signals; if those emerge, XLU's downside-protected setup would justify rapid promotion to 10%.
Precious Metals — GLD
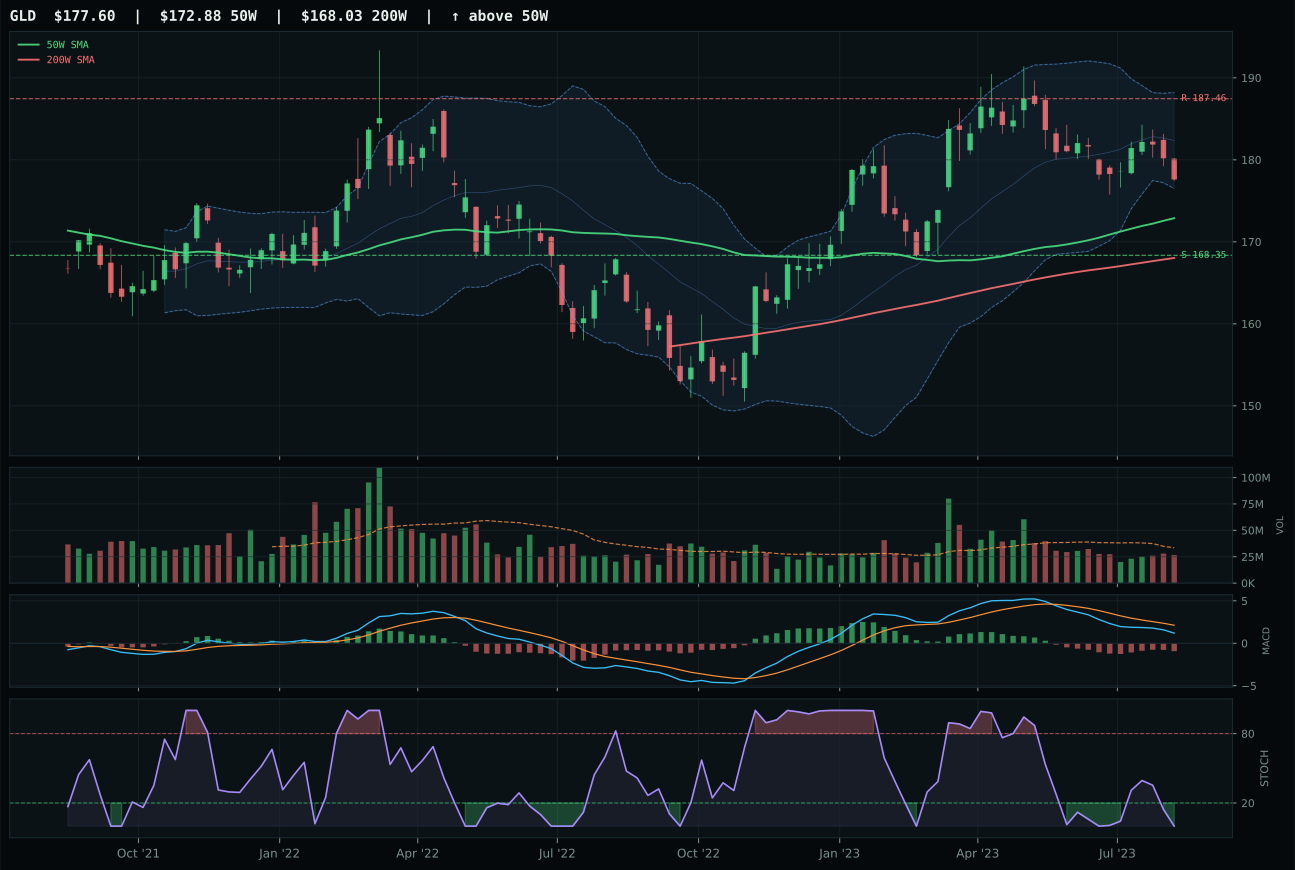
GLD has a compression near 50W profile with -13.2% 13-week relative strength versus SPY.
A failed hold above support would weaken the setup.
Actionable but governed by invalidation levels.
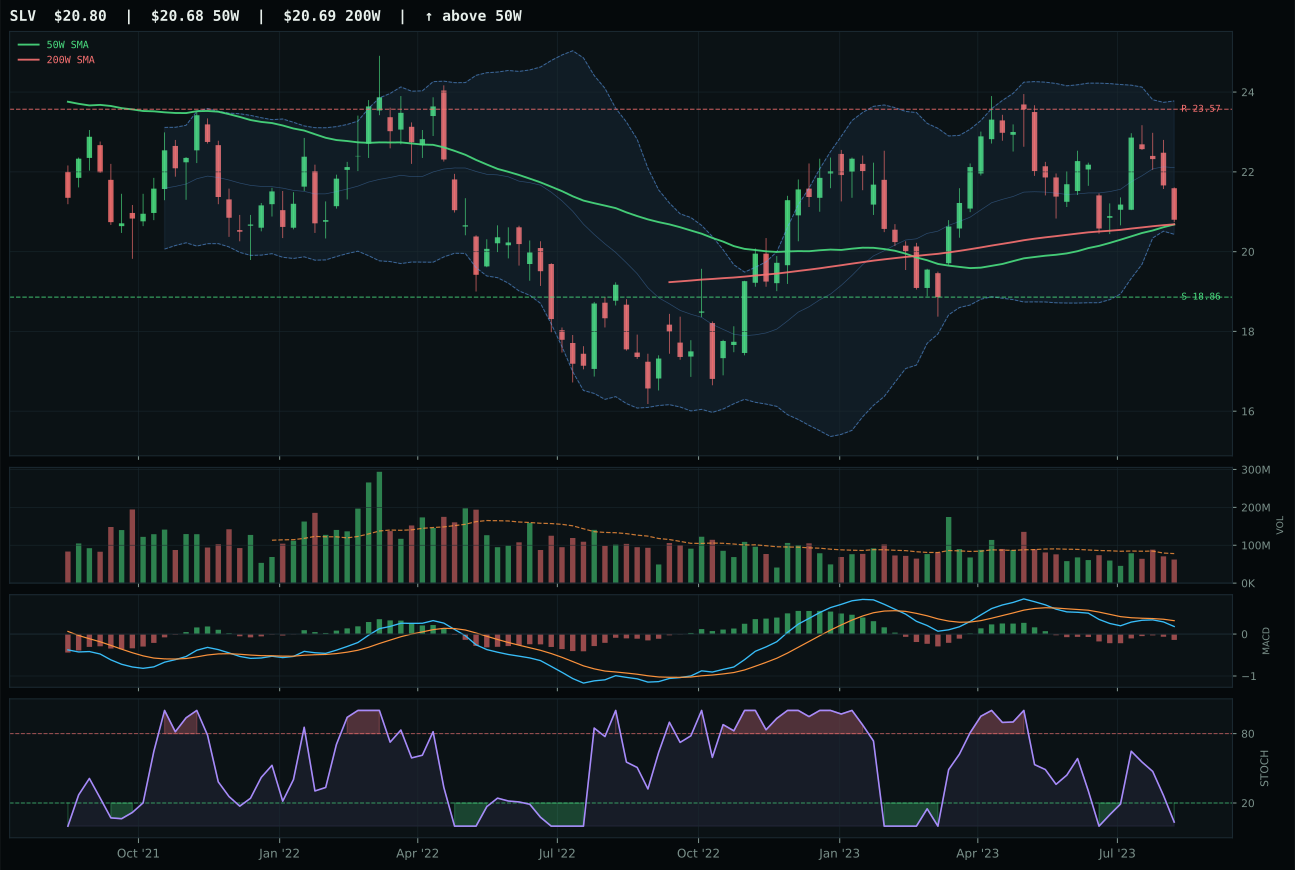
SLV has a compression near 50W profile with -13.8% 13-week relative strength versus SPY.
A failed hold above support would weaken the setup.
Actionable but governed by invalidation levels.
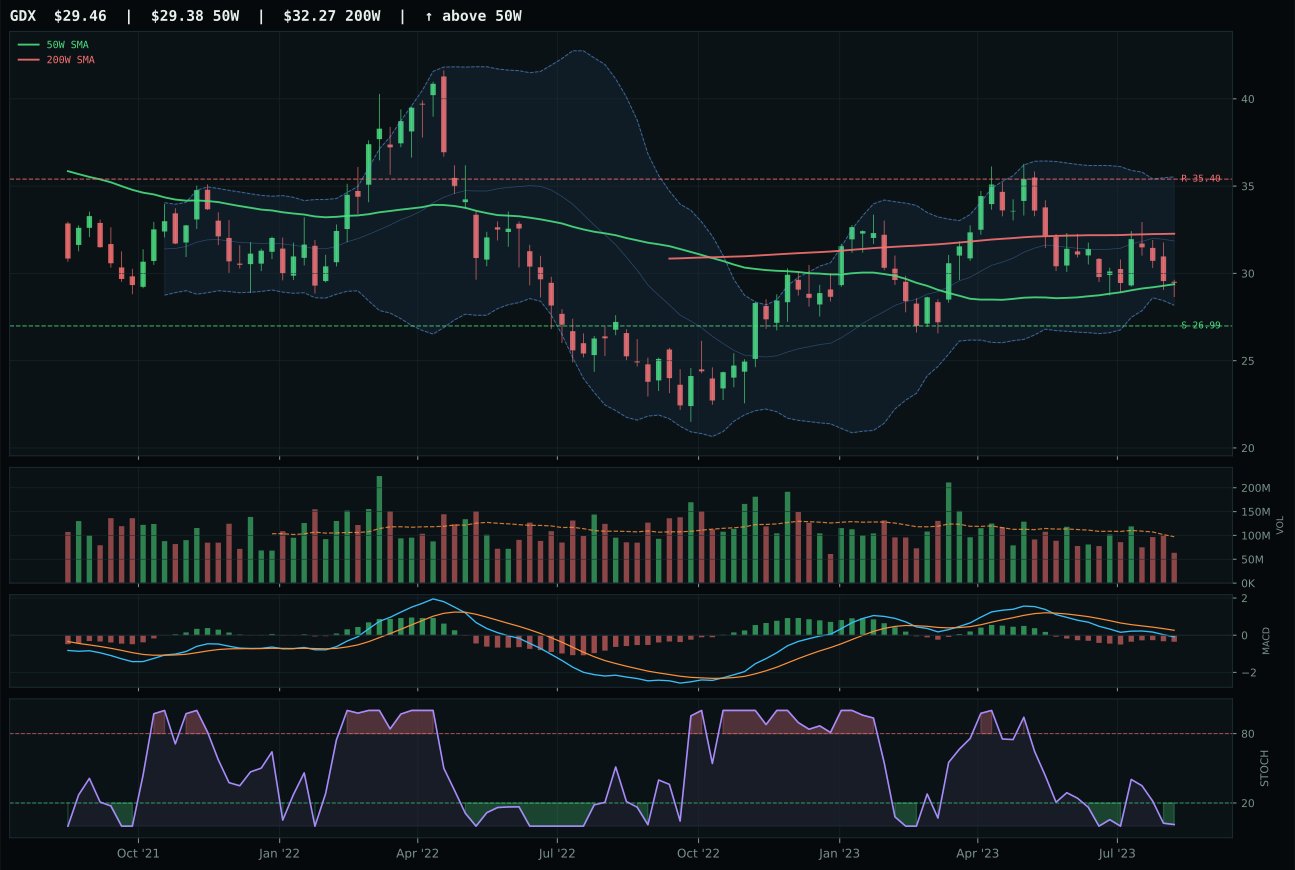
GDX has a compression near 50W profile with -20.6% 13-week relative strength versus SPY.
A failed hold above support would weaken the setup.
Actionable but governed by invalidation levels.
GLD wins the precious metals category despite weak absolute momentum because it preserves the cleaner setup and avoids further technical deterioration. Price sits 2.7% above the 50-week average—compressed near the trend line—while stochastic RSI is oversold at 0.00 and MACD is bearish but improving, setting up a potential bounce if support holds. The timing score of 100.0 is the highest in the basket because this configuration signals value rather than extension, and risk/reward of 62.2 reflects only 5.5% downside to support. SLV loses because MACD is bearish and weakening (not improving), structure is less clean at 67.9 versus 73.8, and stochastic RSI lacks the evidence of oversold potential washout. Both face headwind from -13% relative weakness versus SPY, but GLD's improving momentum signature and better Fibonacci positioning make it the lesser of two defensively positioned names.
Precious Metals receives 0% allocation this week, ranked outside the top-8 and excluded entirely from the portfolio. The 46.0 macro fit is weak because risk appetite is active at -4, providing no tailwind to a category struggling with -13% relative weakness and -4.9% 13-week returns. Late-Cycle Reflation regime typically favors inflation-hedging through commodities (energy, agriculture, industrial metals) rather than monetary hedges like gold, and that regime bias is embedded in the macro scoring. GLD's 33.6 final category score ranks 9th overall, behind all tier-2 allocations and losing to Utilities & Infrastructure by 1.4 points in a close call for the final 5% slot. Gold would justify allocation if credit stress escalates sharply, real rates collapse, or risk appetite reverses into risk-off—scenarios where monetary hedges outperform real assets—but none are dominant descriptors in the current late-cycle reflation regime. Monitor for regime shifts that reactivate the credit stress and liquidity stress flags; at that point, GLD's clean setup and oversold technical condition would make a strong case for rapid inclusion.
Emerging Markets — ILF
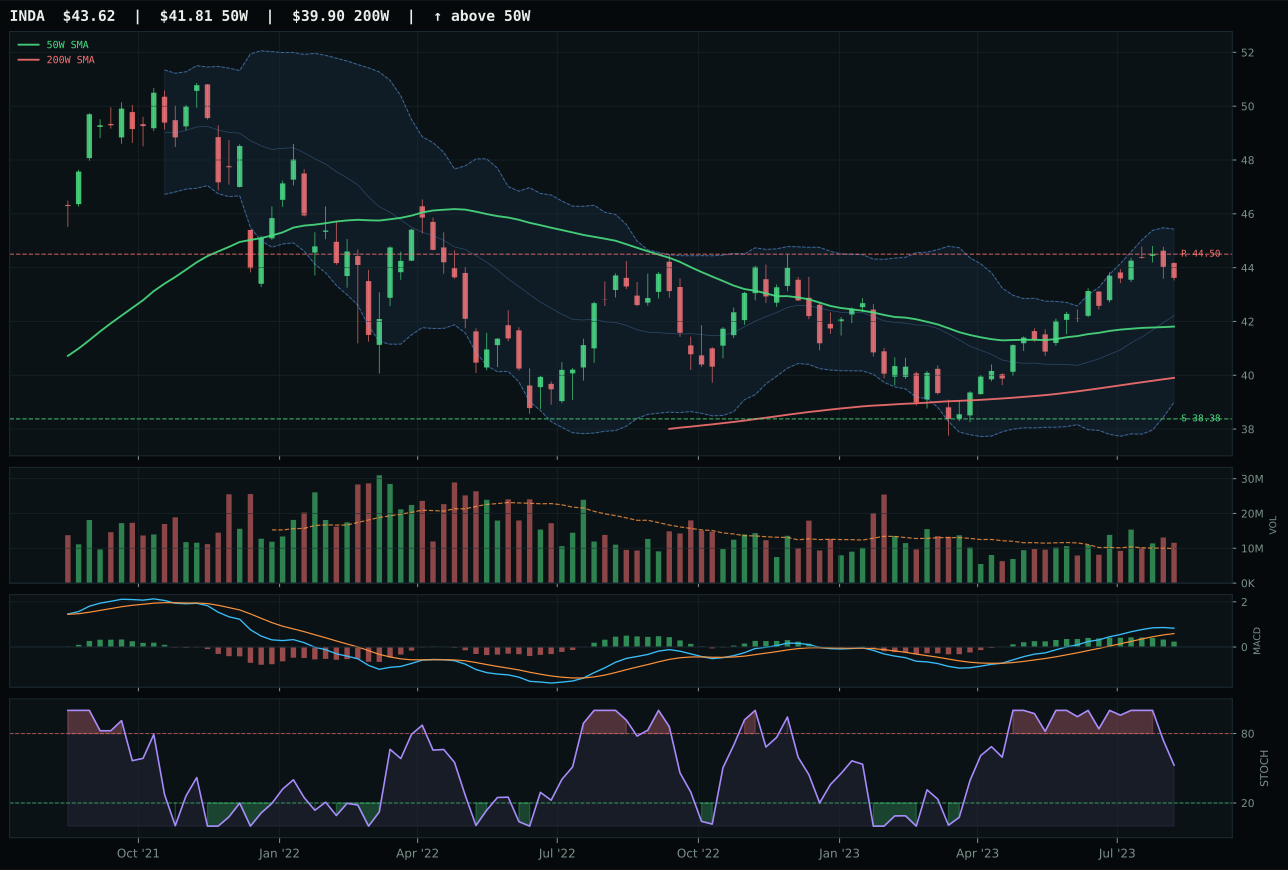
INDA has a neutral structure profile with -2.7% 13-week relative strength versus SPY.
A failed hold above support would weaken the setup.
Actionable but governed by invalidation levels.
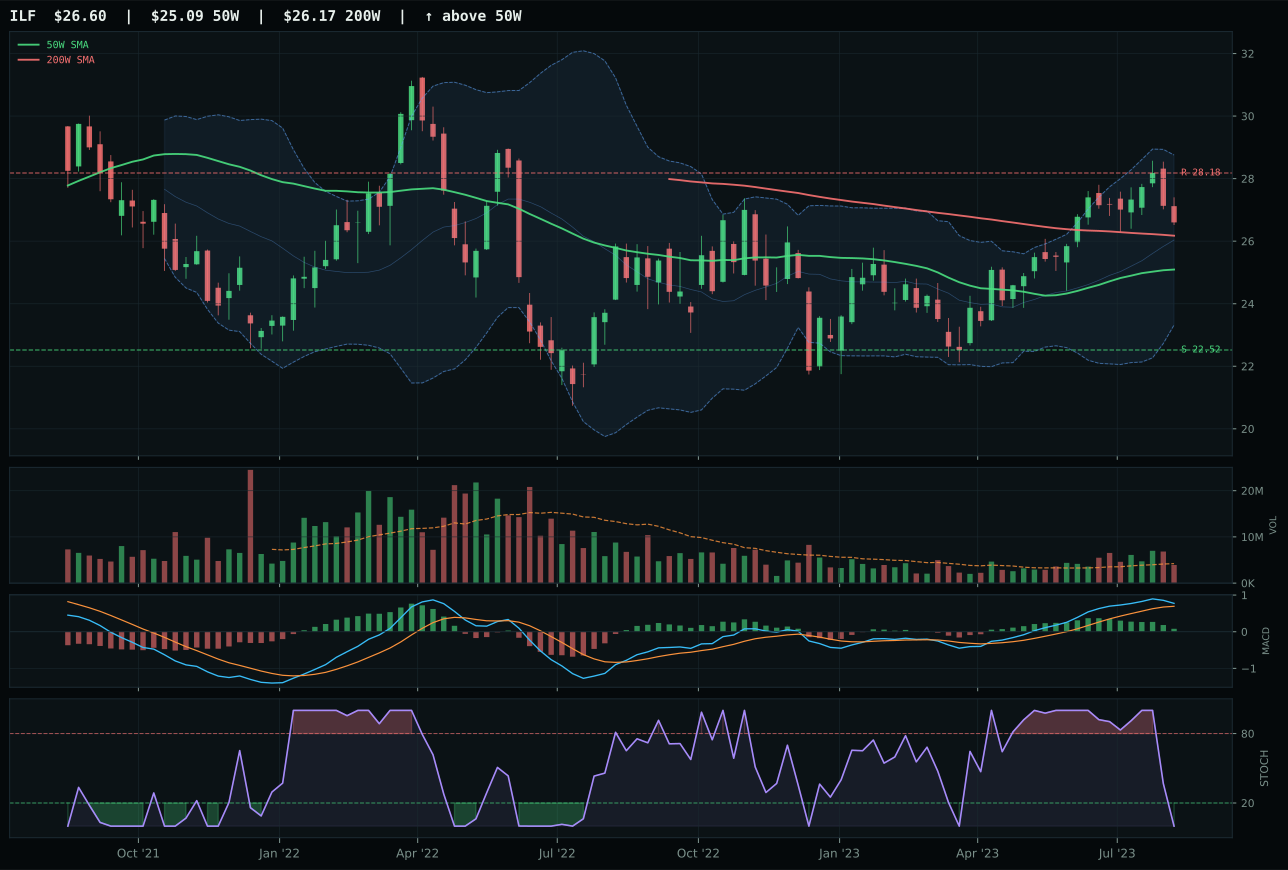
ILF has a neutral structure profile with -3.9% 13-week relative strength versus SPY.
A failed hold above support would weaken the setup.
Actionable but governed by invalidation levels.
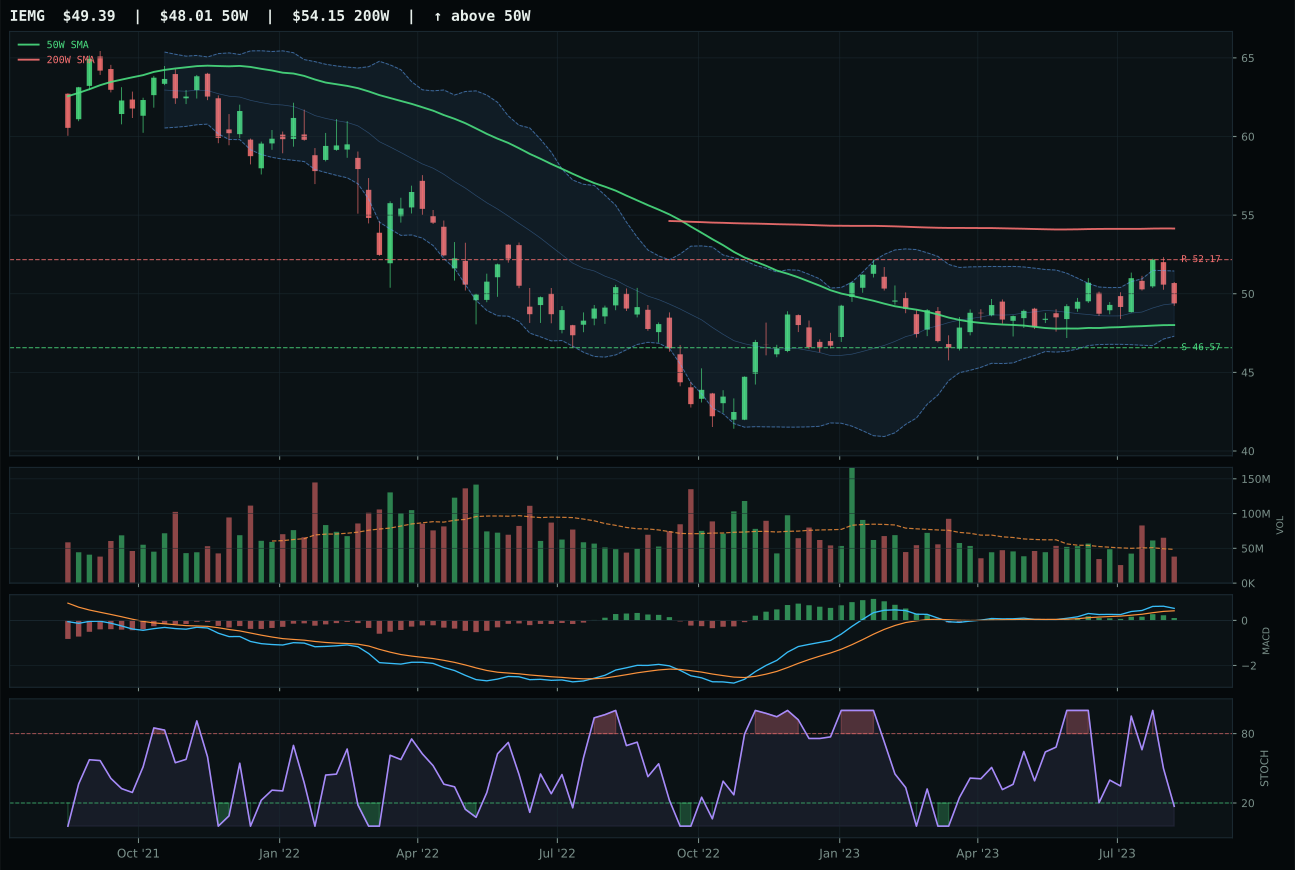
IEMG has a compression near 50W profile with -5.1% 13-week relative strength versus SPY.
A failed hold above support would weaken the setup.
Actionable but governed by invalidation levels.
ILF wins the emerging markets category by avoiding further deterioration, though this is a relative victory in a weak field. ILF's 4.4% 13-week return and -3.9% relative strength are marginally better than IEMG's lower returns, and ILF's oversold stochastic RSI at 0.00 suggests washout potential that INDA's falling/neutral reading does not offer. Both ILF and INDA sit above their 50-week moving averages with bullish-but-flattening MACD, but ILF's timing of 70.0 outscores INDA's 85.0 on category-relative strength: ILF carries 0.0% relative to peers versus INDA's +1.2%, making ILF the cleaner representative. Risk/reward is 50.6 for ILF versus 47.6 for INDA, a marginal edge. This is not a category where technicals are compelling—all three ETFs are weak on momentum and volume—so the winner is simply the name that has preserved the setup best while others deteriorate.
Emerging Markets receives 0% allocation this week, ranked outside the top-8 and excluded entirely from the portfolio. The 38.0 macro fit is the weakest in the entire portfolio because credit stress and liquidity stress are both active at -10 each, and risk appetite at +8 is insufficient to overcome those headwinds. Emerging markets benefit from risk appetite and commodity breadth (which are active), but suffer acutely when credit stress and liquidity stress are prominent concerns—exactly the macro regime in play. The 30.0 final category score ranks 10th overall, dead last, and ILF's 61.1 technical evidence is mediocre at best. The entire category is underwater on momentum: ILF's 4.4% 13-week return and INDA's 5.6% are weak, and all three carry negative or near-neutral relative strength versus SPY. In a Late-Cycle Reflation regime where real assets and energy dominate, and where credit stress is constraining emerging market access, this category has zero allocation urgency. Reactivate if credit stress reverses, if liquidity stress clears, or if emerging market-specific commodity breadth (metals, agriculture) becomes a dominant sponsorship signal; until then, capital stays in developed-market equivalents.