
2023-08-04
Informational purposes only. The content in this report, including allocations, analysis, and commentary, is provided solely for informational and educational purposes. It does not constitute financial advice, investment advice, trading advice, or any other type of advice. Past performance does not guarantee future results. Always conduct your own research and consult a qualified financial professional before making investment decisions.
Weekly Allocation
| Ticker | Category | Weight | Role |
|---|---|---|---|
| FBTC | 50% | Overlay | |
| XOP | Traditional Energy | 10% | Top-2 (10%) |
| URA | Nuclear Energy | 10% | Top-2 (10%) |
| COPX | Industrial Metals | 5% | Tier-2 (5%) |
| IGV | Technology | 5% | Tier-2 (5%) |
| SMH | AI | 5% | Tier-2 (5%) |
| XAR | Defense & Aerospace | 5% | Tier-2 (5%) |
| MOO | Agriculture & Livestock | 5% | Tier-2 (5%) |
| INDA | Emerging Markets | 5% | Tier-2 (5%) |
Trade Instructions — Monday Open
Sell the tranche from 2023-07-07 (completing its 4-week hold). Buy the new tranche. Instructions show net portfolio changes — same-asset positions cancel, weight changes show the delta.
| Action | Ticker | Instruction |
|---|---|---|
| SELL | AIQ | Sell 40% of AIQ position (reduce 6.25% → 3.75%) |
| SELL | XLK | Sell entire XLK position (2.50% of portfolio) |
| SELL | PAVE | Sell 25% of PAVE position (reduce 5.00% → 3.75%) |
| SELL | ILF | Sell 33% of ILF position (reduce 3.75% → 2.50%) |
| SELL | GLD | Sell 50% of GLD position (reduce 2.50% → 1.25%) |
| BUY | URA | Buy URA — 14.29% of freed cash (adds 1.25% to portfolio) |
| BUY | IGV | Buy IGV — 14.29% of freed cash (adds 1.25% to portfolio) |
| BUY | INDA | Buy INDA — 14.29% of freed cash (adds 1.25% to portfolio) |
| BUY | SMH | Buy SMH — 14.29% of freed cash (adds 1.25% to portfolio) |
| BUY | MOO | Buy MOO — 14.29% of freed cash (adds 1.25% to portfolio) |
| BUY | XOP | Buy XOP — 28.57% of freed cash (adds 2.50% to portfolio) |
Current Portfolio After Trade
Combined holdings across all 4 active tranches. Each tranche is 25% of the portfolio.
| Ticker | % of Portfolio | Weight Bar |
|---|---|---|
| FBTC | 50.00% | |
| IGV | 7.50% | |
| COPX | 6.25% | |
| URA | 6.25% | |
| XAR | 3.75% | |
| PAVE | 3.75% | |
| AIQ | 3.75% | |
| ILF | 2.50% | |
| INDA | 2.50% | |
| SMH | 2.50% | |
| FCG | 2.50% | |
| MOO | 2.50% | |
| XOP | 2.50% | |
| GLD | 1.25% | |
| SLV | 1.25% | |
| XLU | 1.25% |
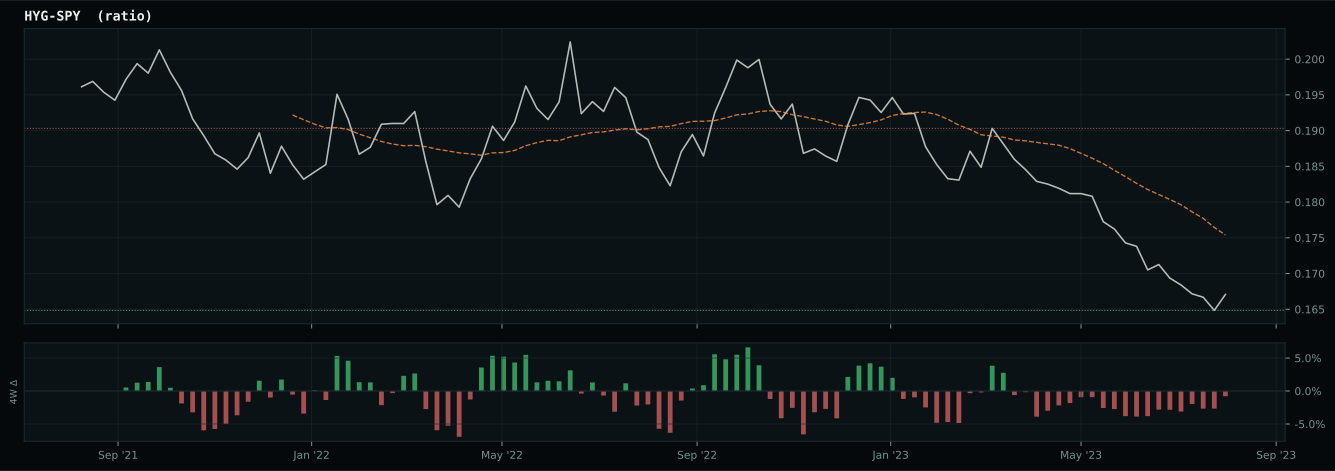
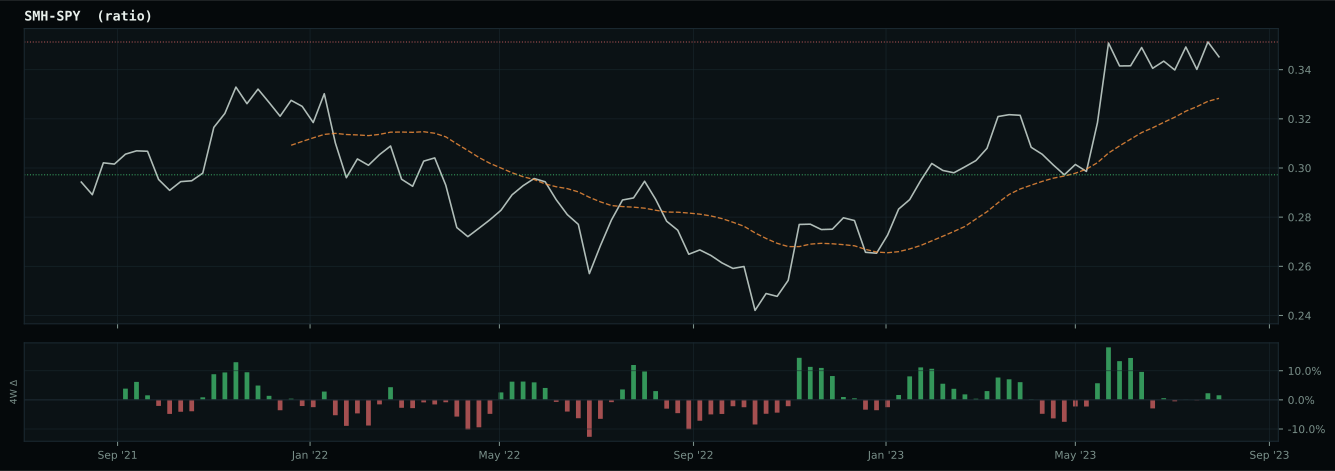
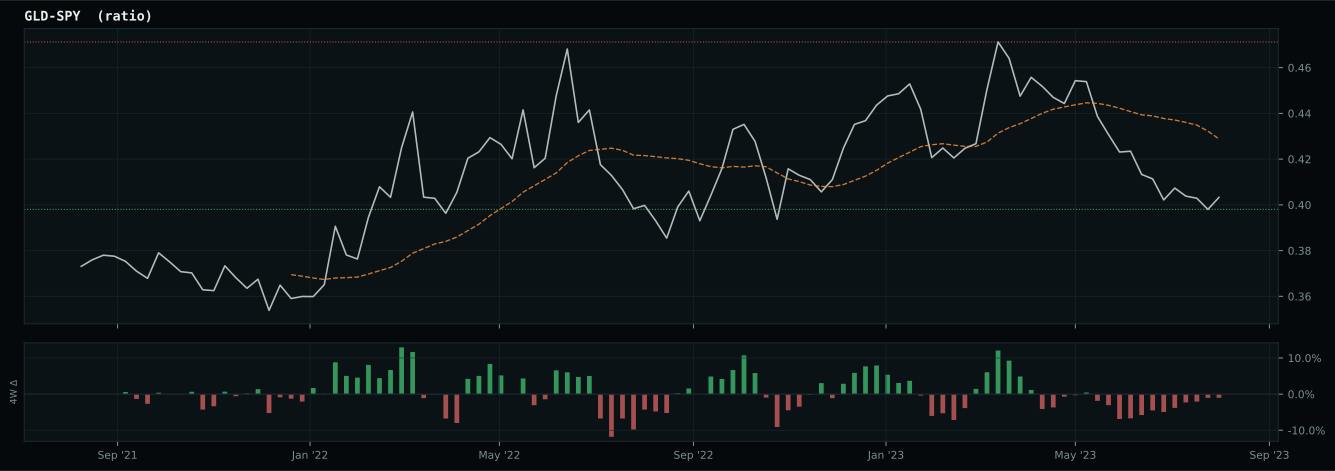
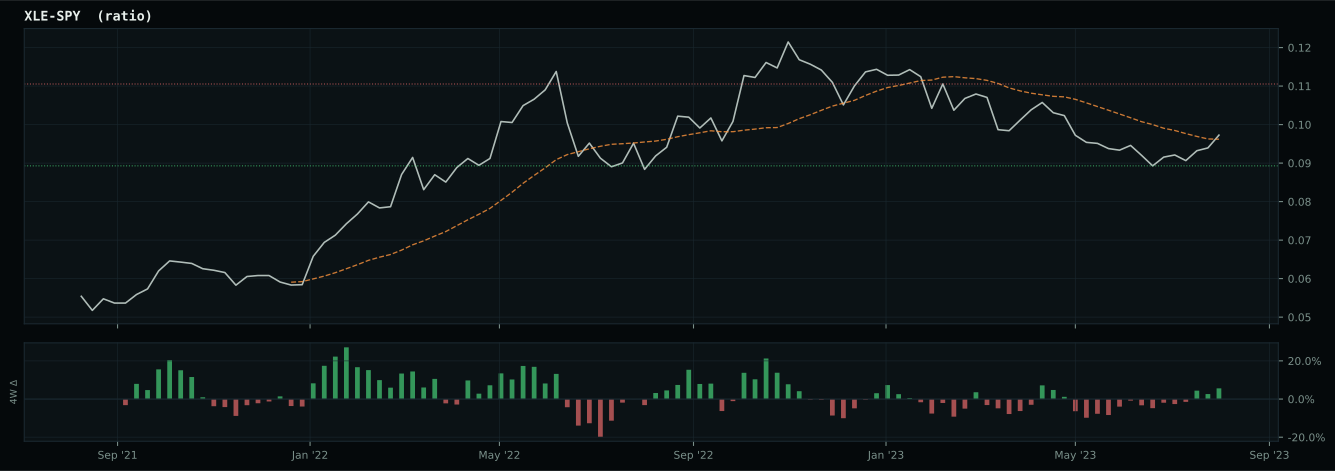
Macro Regime — Late-Cycle Reflation
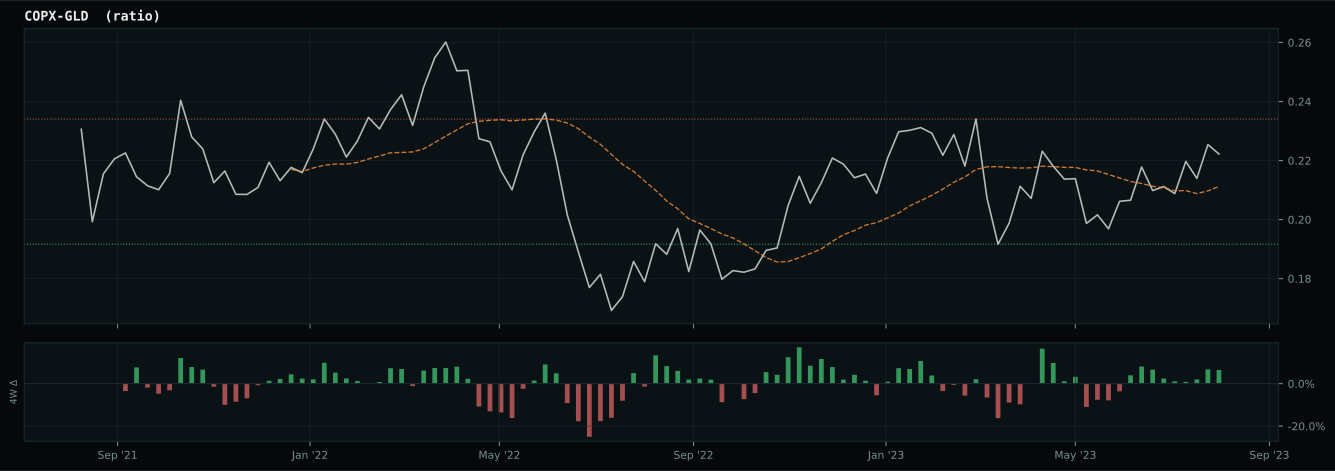
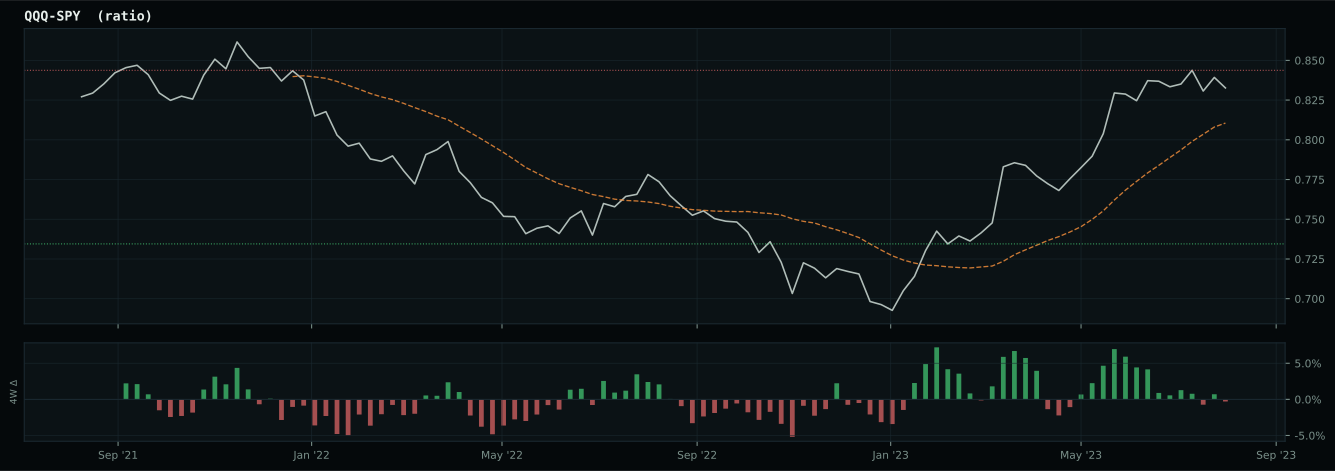
Macro Evidence Charts
Market-implied signals behind the macro regime scores. Each ratio compares two assets; the direction and slope of the ratio is what the macro engine reads.
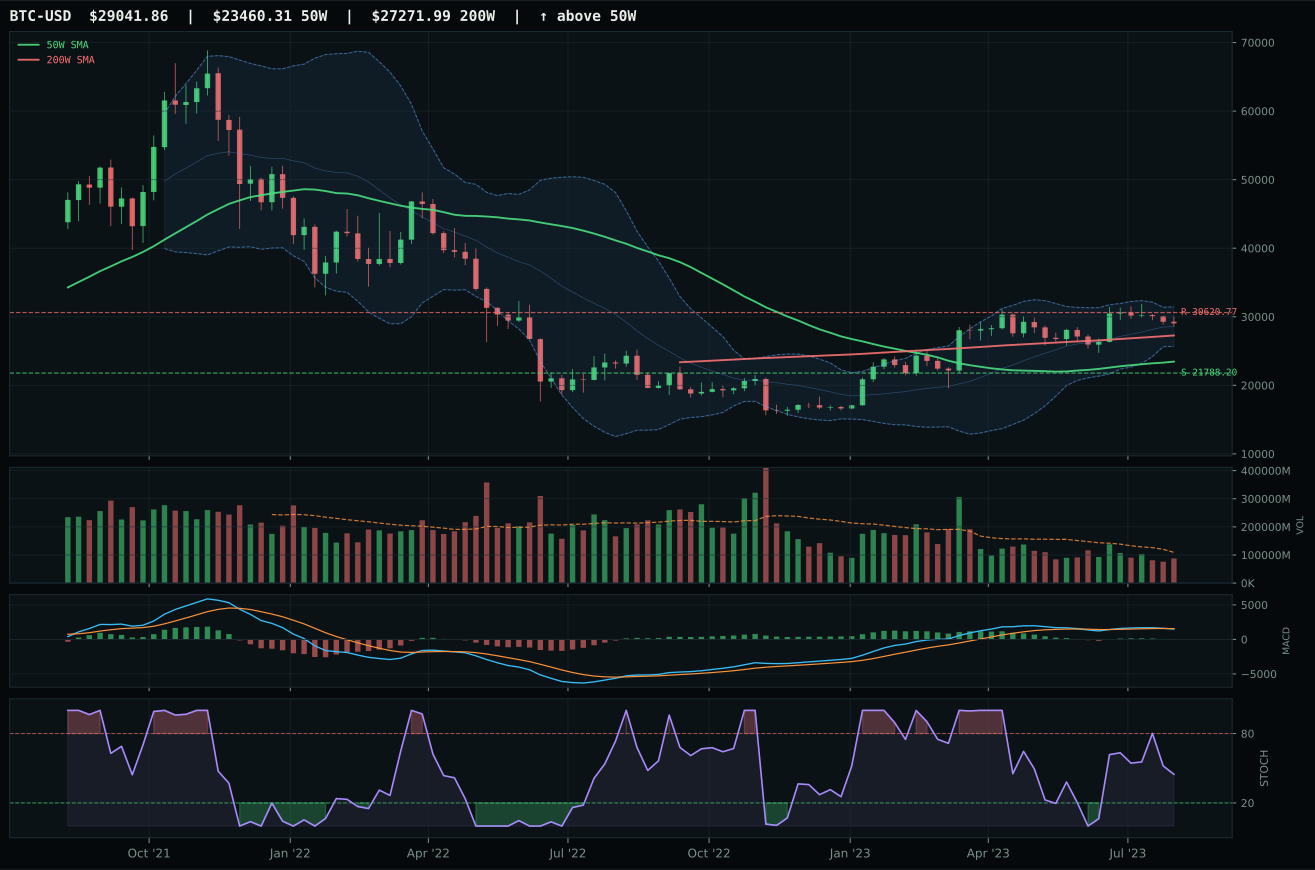
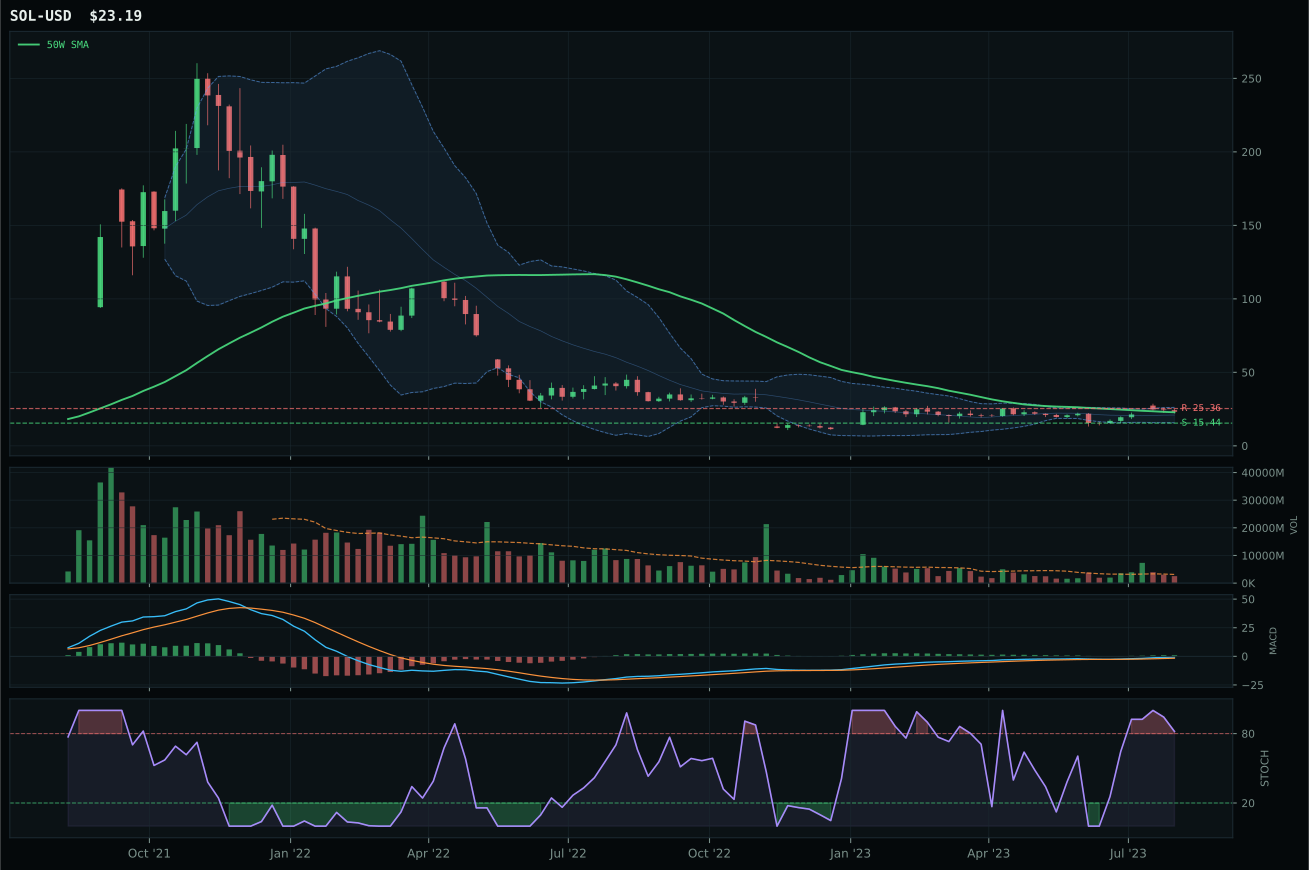
Crypto Regime — TrendBTC
post-touch structure is too wide to count as a range; max/min close ratio is 1.88
TrendBTC confirmed: 2 consecutive closes above rising/flat 50W SMA
one or more available conditions failed
Category Rankings
| Rank | Category | Winner | Score | Alloc | 4W Ret | Peers (4W) |
|---|---|---|---|---|---|---|
| 1 | Traditional Energy | XOP | 82.9 | 20% | +5.80% | FCG +4.5% · XLE +4.4% |
| 2 | Nuclear Energy | URA | 66.3 | 20% | +8.74% | URNM +13.6% · NLR +6.9% |
| 3 | Industrial Metals | COPX | 59.2 | 10% | -4.36% | PICK -1.1% · REMX -10.1% |
| 4 | Technology | IGV | 57.9 | 10% | +3.61% | CIBR +4.3% · XLK +2.3% |
| 5 | AI | SMH | 54.9 | 10% | +0.08% | AIQ +0.4% · BOTZ -3.7% |
| 6 | Defense & Aerospace | XAR | 53.5 | 10% | -0.63% | ITA +0.1% · ROKT -1.1% |
| 7 | Agriculture & Livestock | MOO | 43.5 | 10% | -2.01% | VEGI -2.6% · WEAT -8.7% |
| 8 | Emerging Markets | INDA | 41.3 | 10% | +0.63% | IEMG -2.5% · ILF -3.5% |
| 9 | Precious Metals | GLD | 38.6 | 0% | -0.46% | SLV +1.1% · GDX -2.4% |
| 10 | Utilities & Infrastructure | XLU | 35.5 | 0% | -2.54% | PAVE +1.2% · IGF -1.8% |
Traditional Energy — XOP
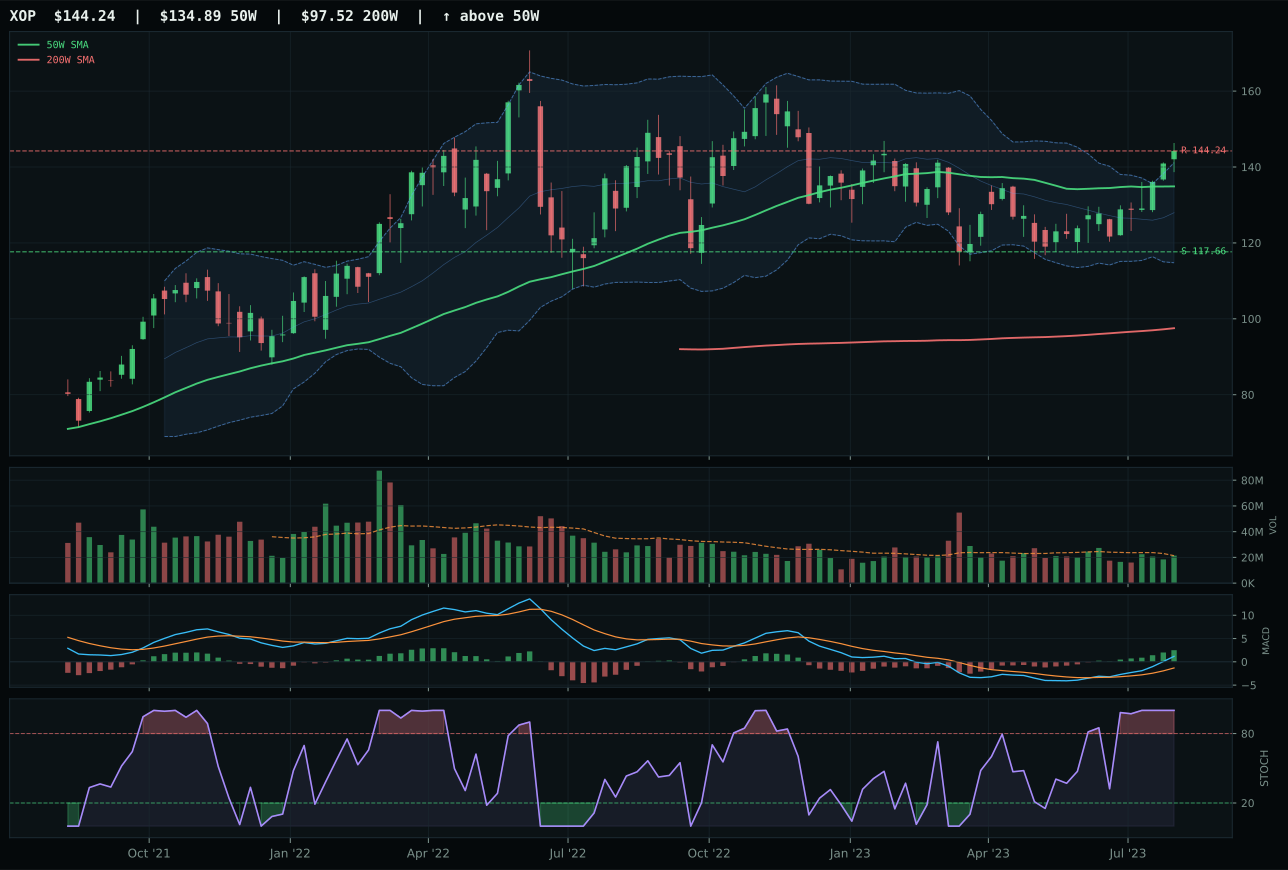
XOP has a neutral structure profile with 11.6% 13-week relative strength versus SPY.
A failed hold above support would weaken the setup.
Actionable but governed by invalidation levels.
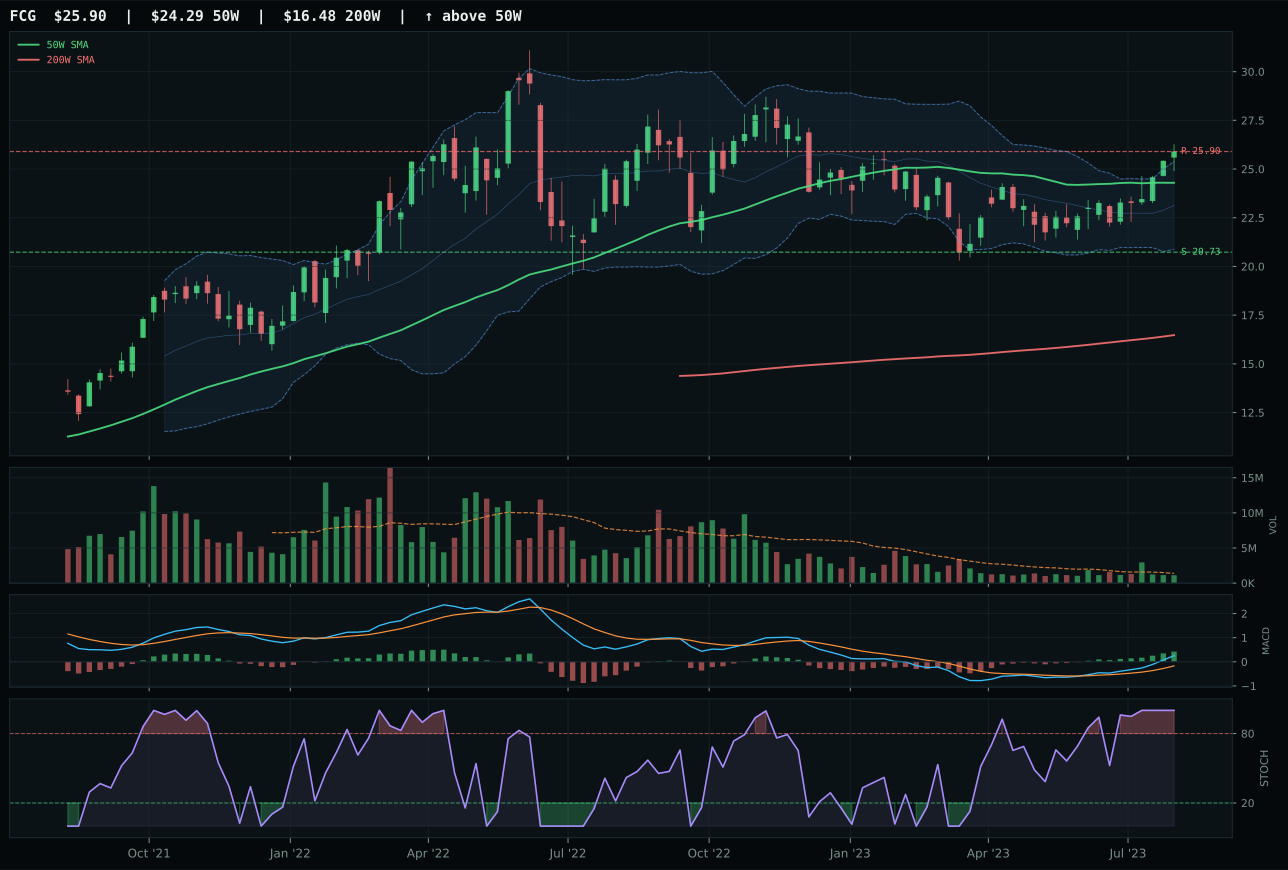
FCG has a neutral structure profile with 8.7% 13-week relative strength versus SPY.
A failed hold above support would weaken the setup.
Actionable but governed by invalidation levels.
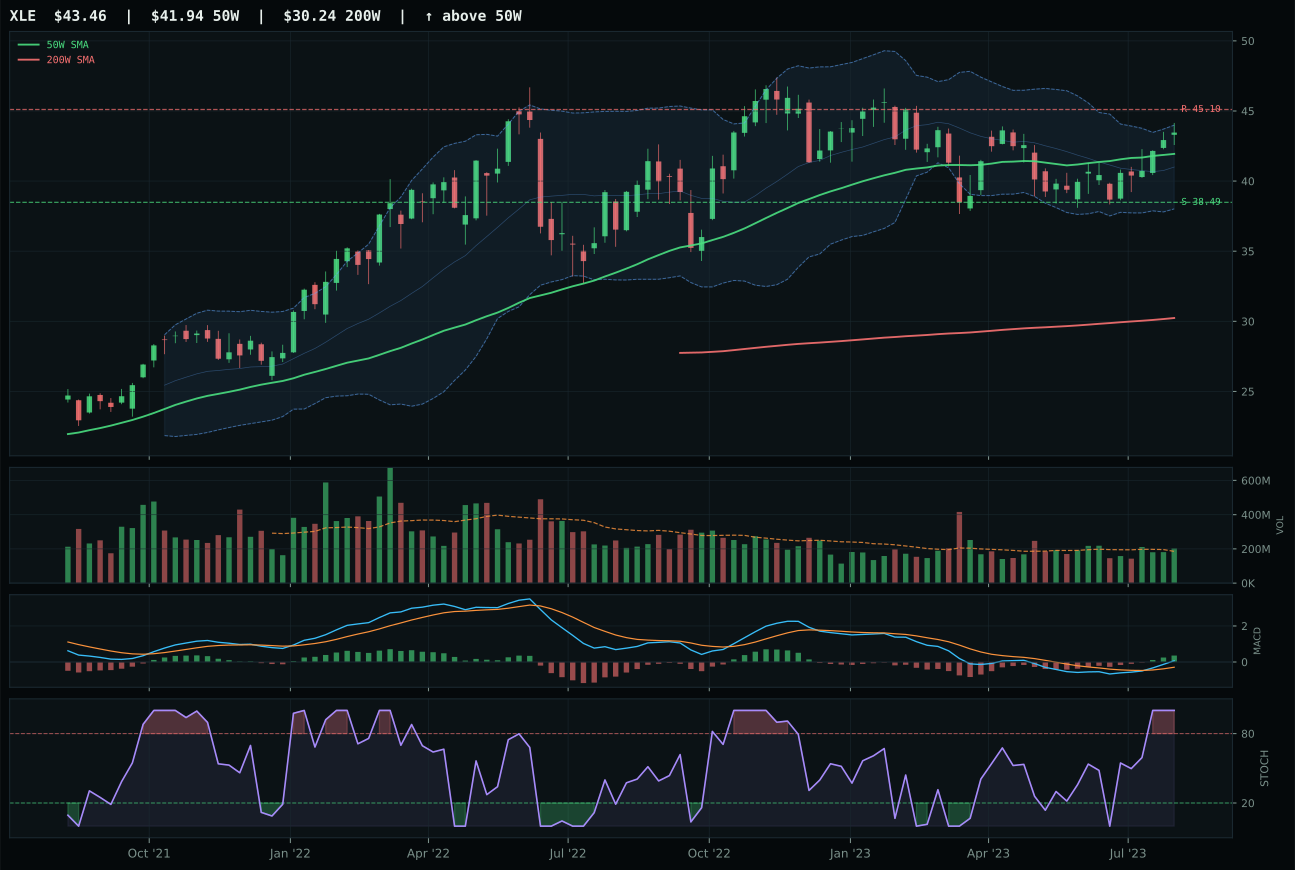
XLE has a neutral structure profile with 0.1% 13-week relative strength versus SPY.
A failed hold above support would weaken the setup.
Actionable but governed by invalidation levels.
XOP earned top-2 overweight at 10% allocation by delivering the highest category score (82.9) and posting a setup that combines perfect technical conditions with strong macro sponsorship. Price is 6.9% above the 50W with perfect trend (100/100) from price position, slope, and 11.6% SPY outperformance. The thirteen-week return of 19.9% and category-relative strength of 2.9% prove this is category leadership, not mere participation, and stochastic RSI at overbought momentum (1.00) signals extended strength rather than early-stage accumulation—a rare setup in late-cycle reflation where stretches tend to hold. MACD is bullish and improving, volume-price confirmation reaches 81.7/100, and persistence at 77.6/100 shows the move is persistent. FCG lost a close decision (score gap: 3.2 points) because category-relative strength lagged (0.0% vs 2.9%), meaning XOP's peer leadership inside the three-ETF basket was decisive. Structure and timing are nearly identical; the tiebreaker was that institutional flows favored exploration beta (XOP) over natural gas forwards (FCG) in the current energy narrative.
Traditional Energy ranks as the top-tier category with 10% allocation because it scored 82.9 and benefits from a Late-Cycle Reflation regime where energy scarcity is the dominant active macro descriptor (+16). Risk appetite positive is +7, inflation pressure +10, supply shortage +9, and real asset sponsorship +7—a perfect alignment for energy producers. XOP's perfect trend score (100/100), overbought momentum confirmation (100/100), and 19.9% thirteen-week return represent the strongest technical case in the entire portfolio. The only friction is that stochastic RSI at overbought (1.00) means the move is extended and timing risk is real: the risk-reward at 51.4/100 shows zero upside to resistance but 22.6% downside to support, making this a position that only works if energy scarcity narratives intensify or geopolitical supply shocks materialize. This allocation is not a timing trade; it is a macro bet that energy will remain the best performer in a reflation regime where cost-push inflation drives portfolio rotation into real assets. If crude oil spot prices fall below support levels or energy scarcity flips to oversupply in the descriptor set, XOP's allocation will compress immediately.
Nuclear Energy — URA
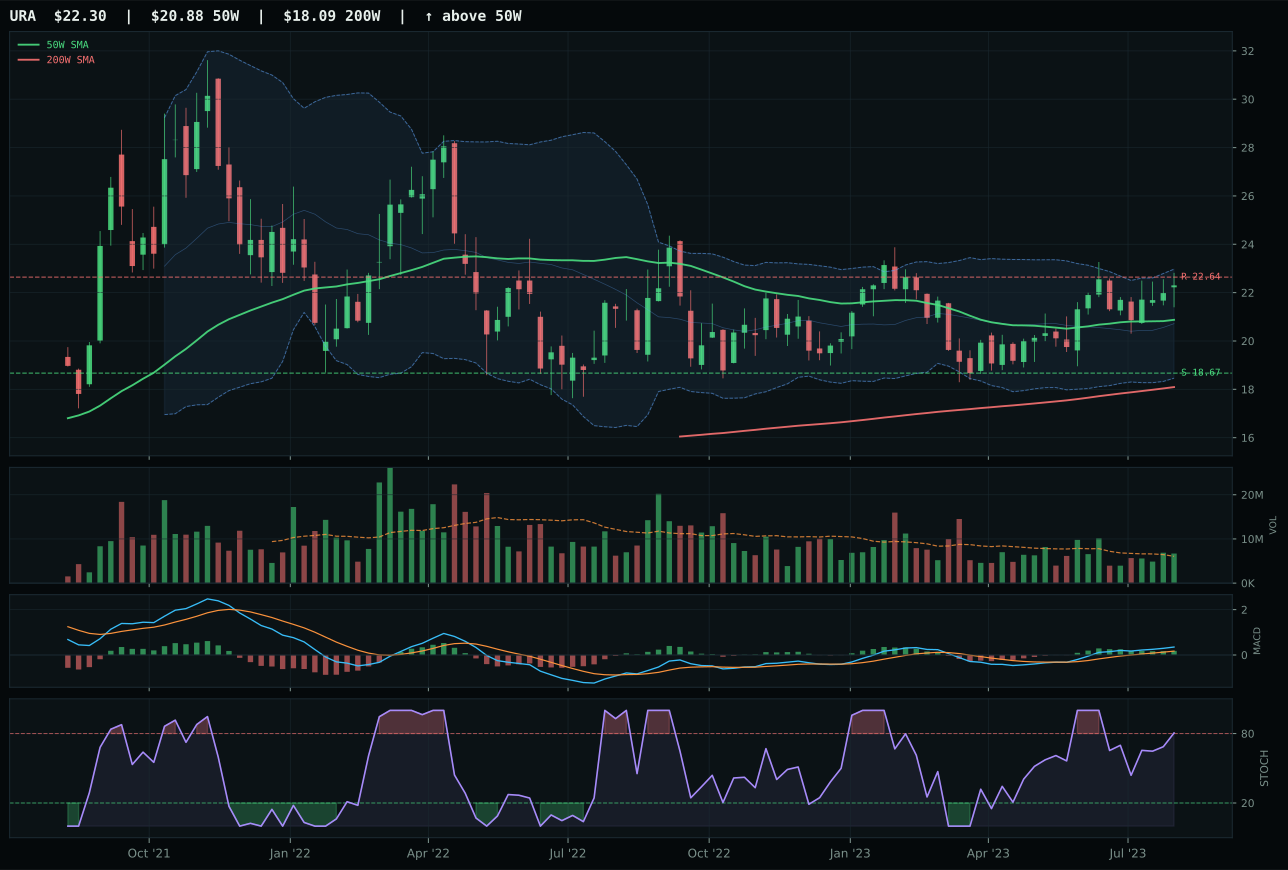
URA has a neutral structure profile with 2.5% 13-week relative strength versus SPY.
A failed hold above support would weaken the setup.
Actionable but governed by invalidation levels.
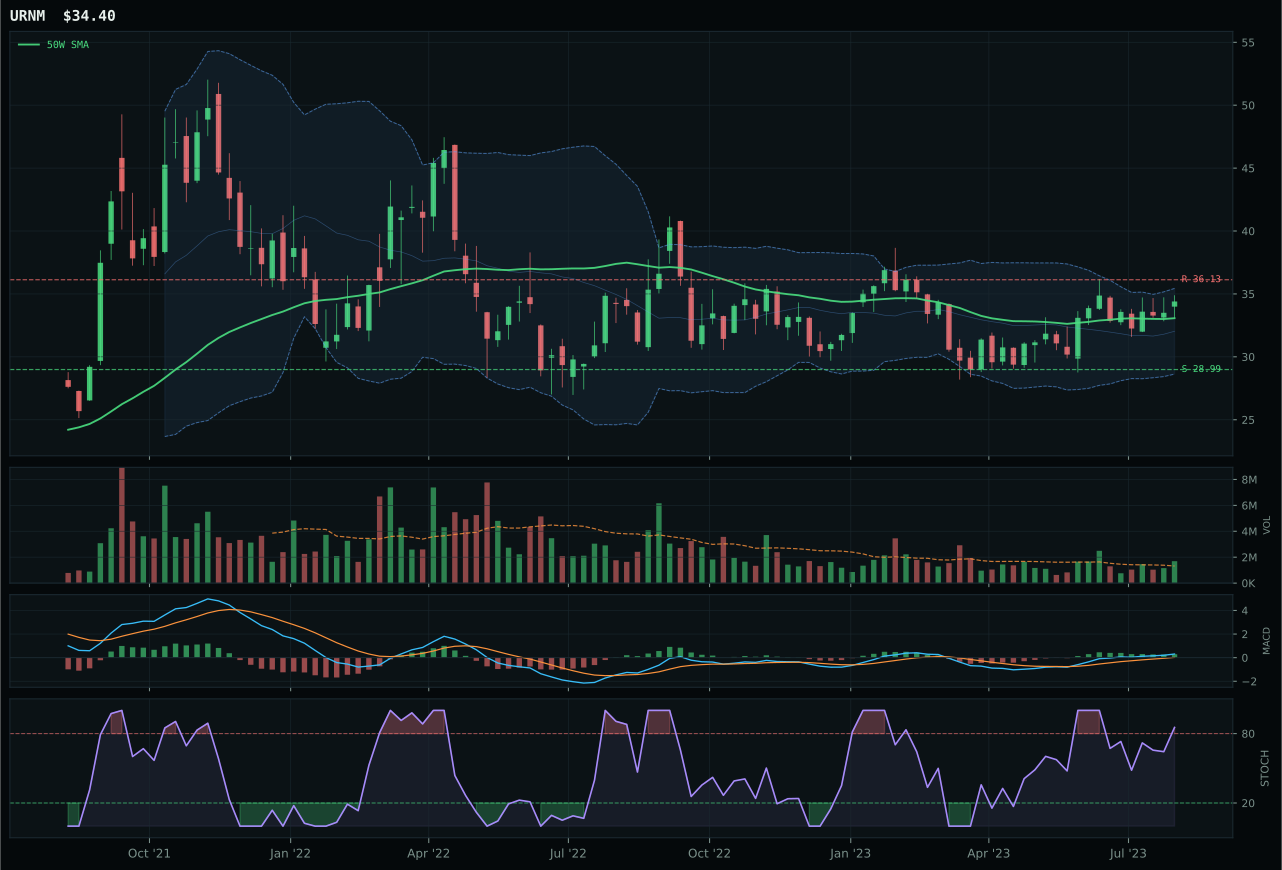
URNM has a neutral structure profile with 2.1% 13-week relative strength versus SPY.
A failed hold above support would weaken the setup.
Actionable but governed by invalidation levels.
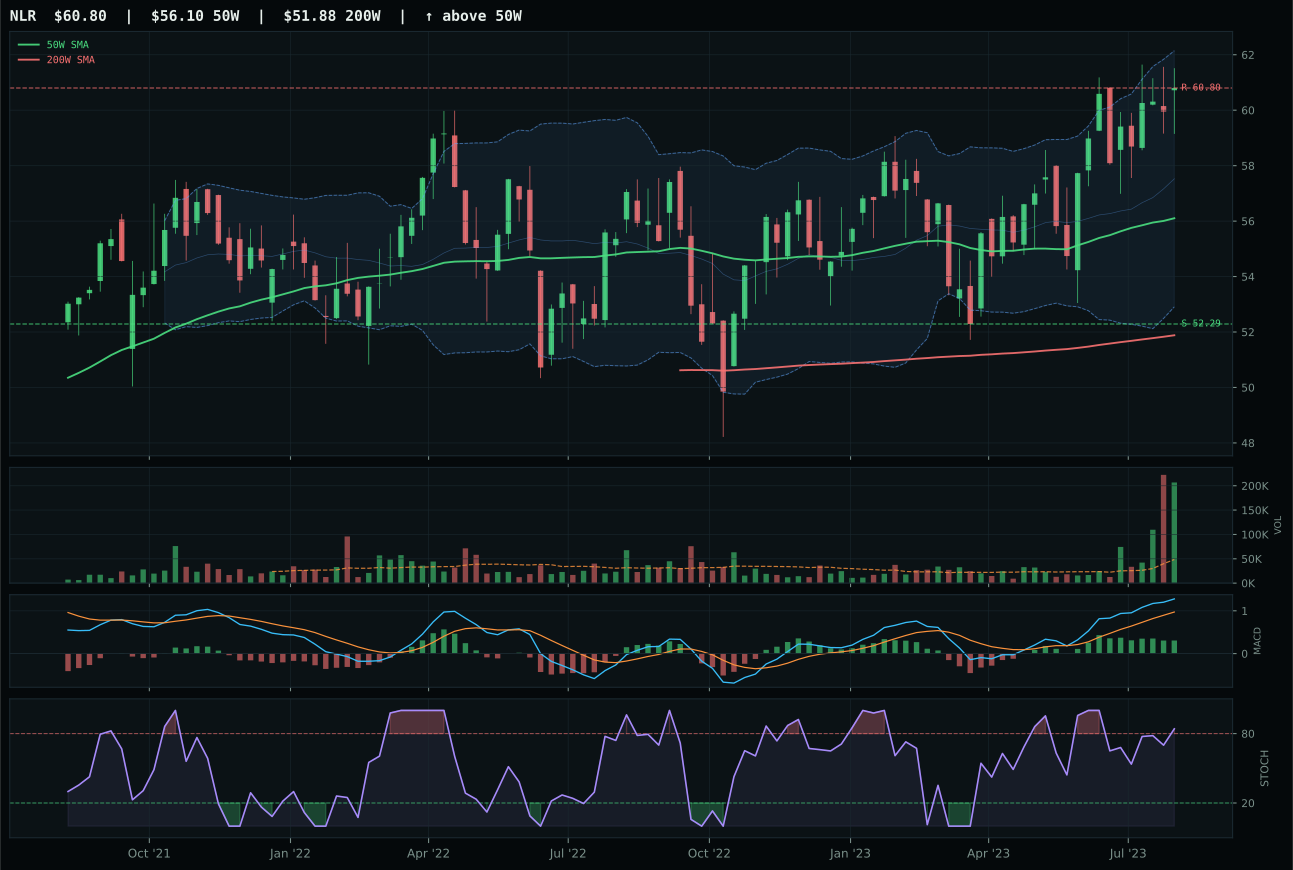
NLR has a neutral structure profile with -1.6% 13-week relative strength versus SPY.
A failed hold above support would weaken the setup.
Tracked, but not top-2 eligible because: .
URA earned top-2 overweight at 10% allocation by combining perfect trend (100/100) with the strongest macro sponsorship story in the portfolio. Price is 6.8% above the 50W, thirteen-week return is solid at 10.8%, and category-relative strength at 0.3% is tight (suggesting a consolidated leadership position). Momentum confirmation reached 92.9/100—among the highest in the portfolio—driven by 6.9% four-week return, 10.8% thirteen-week return, MACD bullish and improving, and above-average volume at 1.11x the twenty-week average. Structure is neutral at 74.9/100, timing is strong at 75/100, and the setup has room to run with -1.5% upside to resistance and 19.4% downside support buffer. URNM lost despite competitive momentum (86/100) and better risk-reward (58 vs 46) because MACD was bullish but flattening rather than improving, structure was slightly weaker (74.4 vs 74.9), and category-relative strength was zero versus URA's 0.3%—a small edge that mattered in a category where ETF differentiation is minimal.
Nuclear Energy earned 10% allocation as the second top-2 overweight based on a strong 66.3 category score and robust macro sponsorship of 69.0/100. Energy scarcity is active (+9), real asset sponsorship +7, Late-Cycle Reflation +7, AI growth sponsorship +5, and inflation pressure +3—a constellation that makes uranium relevant as both an energy solution and an AI infrastructure play. URA's momentum confirmation of 92.9/100 and trend of 100/100 anchor the case. The macro fit of 50.0/100 at the ETF level is neutral because no category-specific descriptor profile was available, but the category-level macro fit of 69.0 tells the real story: energy transition and AI infrastructure buildout are structural tailwinds. The risk is that stochastic RSI at overbought momentum and the -1.5% upside to resistance suggest limited near-term stretch room, meaning this position works only if uranium demand accelerates or geopolitical nuclear demand commentary intensifies. For now, 10% is justified by the macro setup and URA's clean momentum confirmation, but this allocation is sensitive to overbought unwind: a break below 22.00 support with distribution volume would flag a fade candidate.
Industrial Metals — COPX
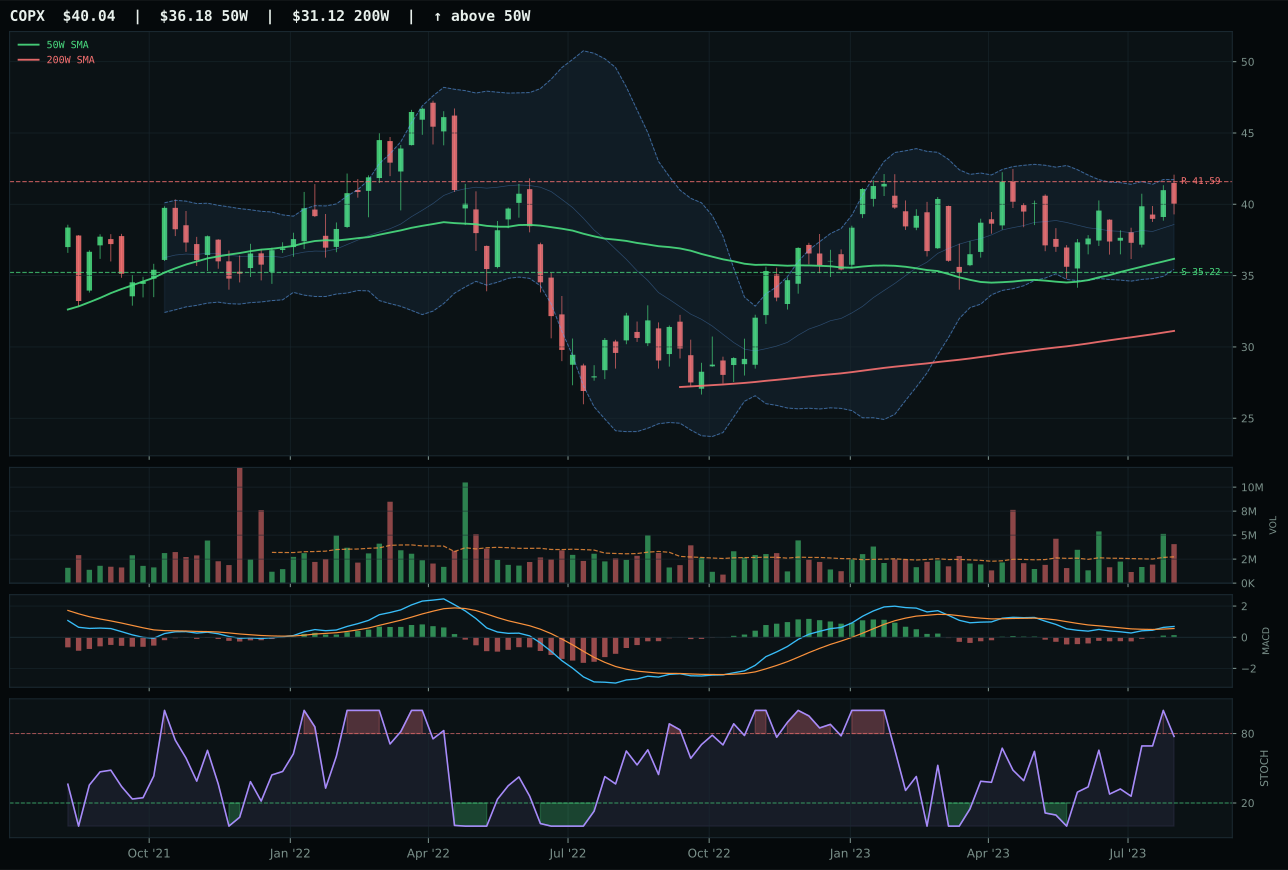
COPX has a neutral structure profile with -8.4% 13-week relative strength versus SPY.
A failed hold above support would weaken the setup.
Actionable but governed by invalidation levels.
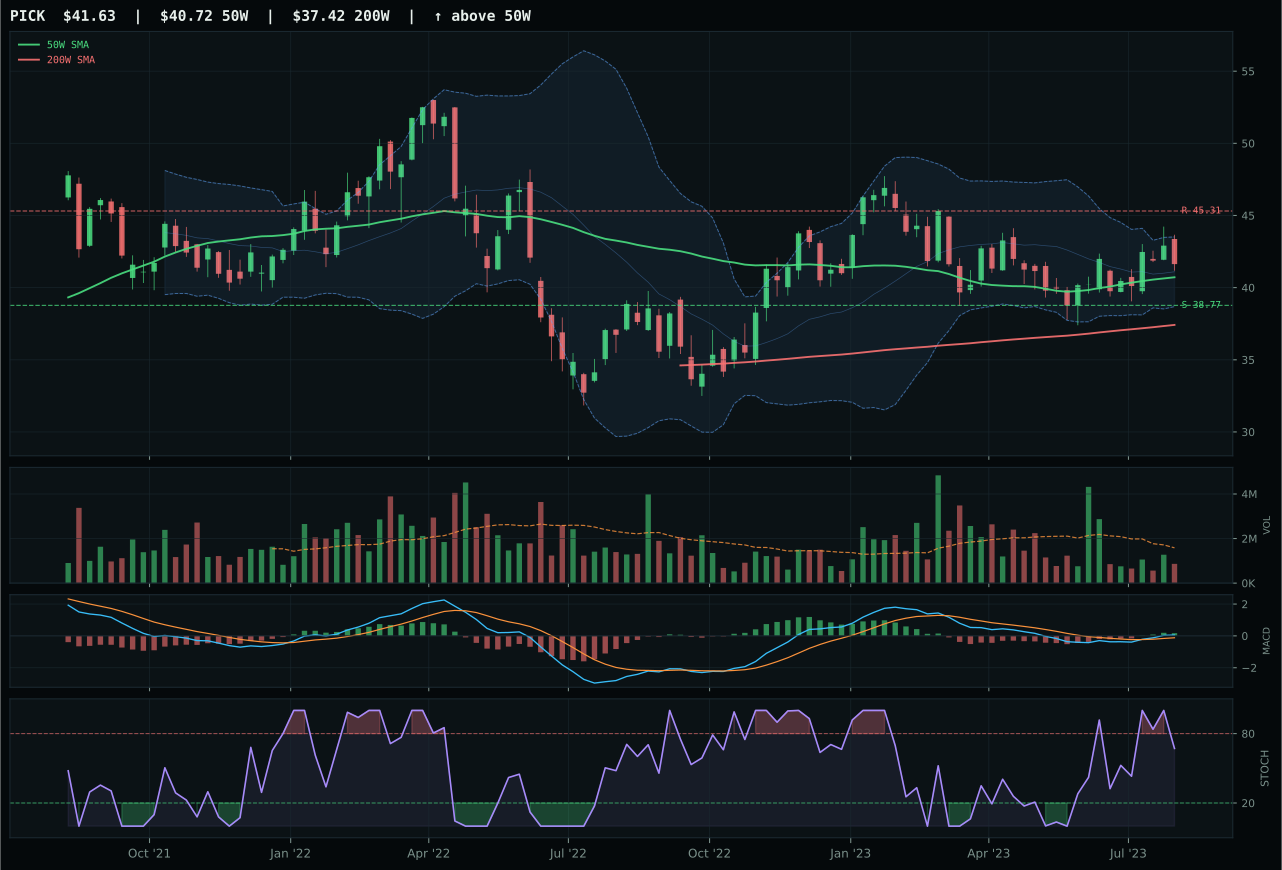
PICK has a compression near 50W profile with -7.1% 13-week relative strength versus SPY.
A failed hold above support would weaken the setup.
Actionable but governed by invalidation levels.
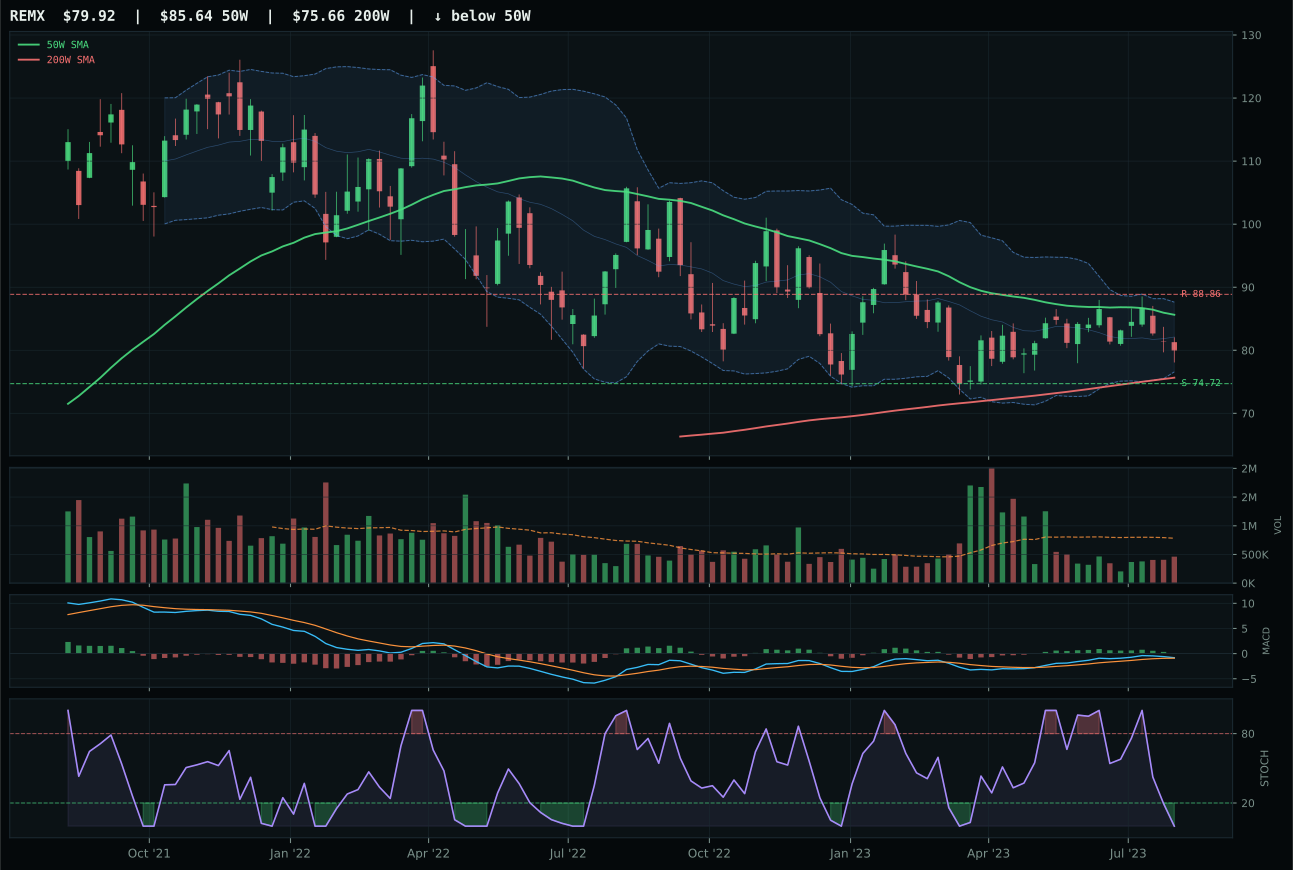
REMX has a neutral structure profile with -9.8% 13-week relative strength versus SPY.
A failed hold above support would weaken the setup.
Actionable but governed by invalidation levels.
COPX won because it paired the highest trend score (87.4/100) with above-average volume participation (1.48x the twenty-week average) and rising mid-zone stochastic RSI at 0.78, signaling sponsorship in the accumulation phase. Price is 10.7% above the 50W in a neutral structure, and the four-week return of 7.3% proves recent buyers are committed despite -0.1% thirteen-week return and -8.4% SPY relative strength. MACD is bullish and improving, timing scores 83/100, and the risk-reward at 49.9/100 shows asymmetry (-3.7% upside to resistance but 13.7% downside support buffer) that works in compression. PICK lost despite a higher composite score (80 vs 73) because structure was slightly weaker (71.3 vs 72.0), stochastic RSI was falling/neutral instead of rising mid-zone, and volume was thin participation rather than above-average. COPX's category-relative strength of 0.0% tied with PICK at 1.3%, but the rising momentum tone gave COPX the edge in a category where continuation signal matters more than absolute outperformance.
Industrial Metals earned 5% allocation as a tier-2 position based on a strong 59.2 category score and an exceptional macro fit of 75.0/100. Metals scarcity is actively +14, commodity breadth positive +10, Late-Cycle Reflation +10, and real asset sponsorship +6—a powerful reflationary backdrop. COPX's trend of 87.4/100 and above-average volume confirm that institutional buyers recognize the scarcity narrative. The constraint is timing and risk-reward: at 10.7% above the 50W with only -3.7% upside to resistance, COPX is stretched but not dangerously so, and the rising stochastic RSI at 0.78 shows momentum is still climbing. For this category to move to 10%, COPX needs to break resistance at 41.59 with follow-through volume and hold above 39.00 support without distribution pressure. The 5% slot reflects conviction in the macro case (scarcity, inflation, Late-Cycle demand) but appropriate caution about entry timing. If copper spot prices break lower or credit stress activates more strongly in the descriptor set, this category reverts to 0% immediately because the thesis depends on continuous reflation sponsorship.
Technology — IGV
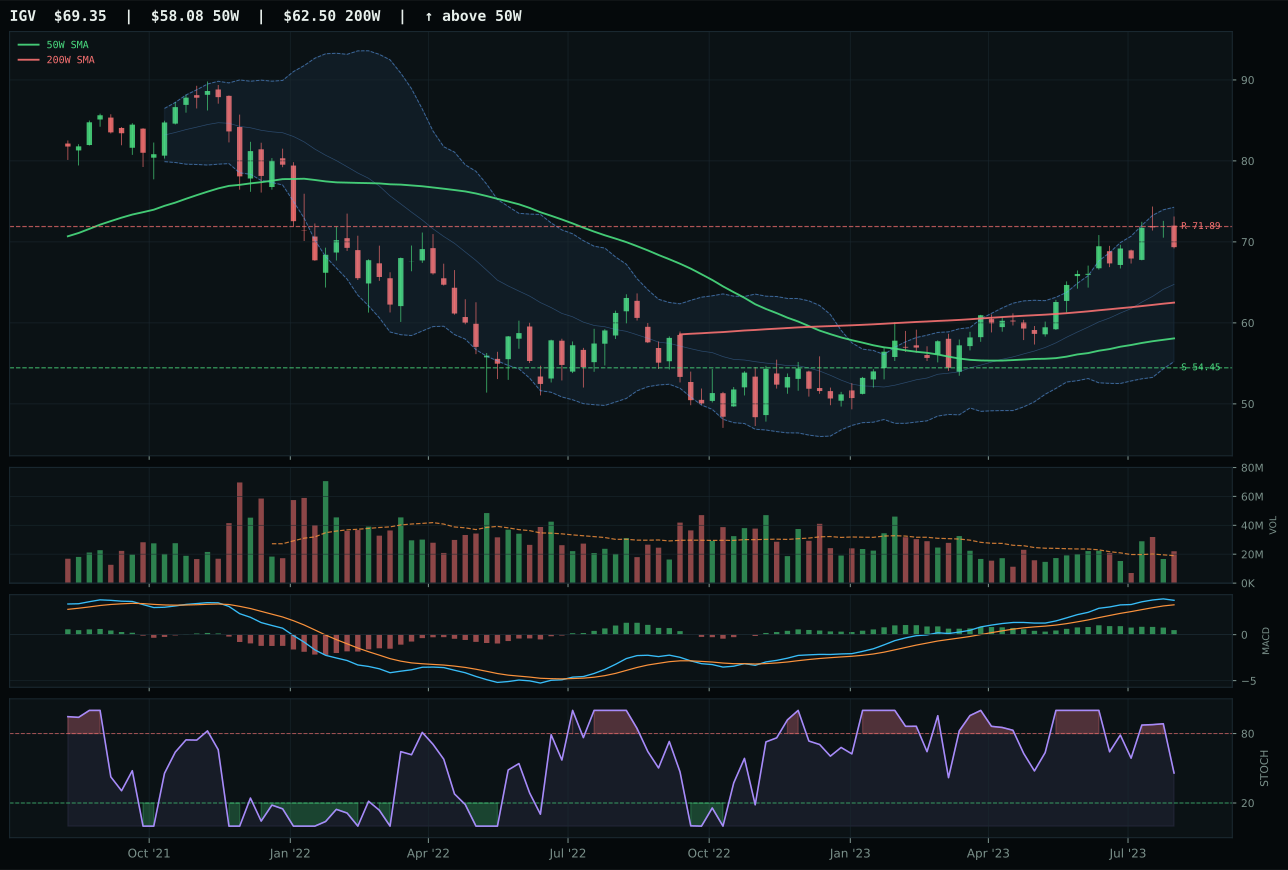
IGV has a vertical extension profile with 10.0% 13-week relative strength versus SPY.
A failed hold above support would weaken the setup.
Actionable but governed by invalidation levels.
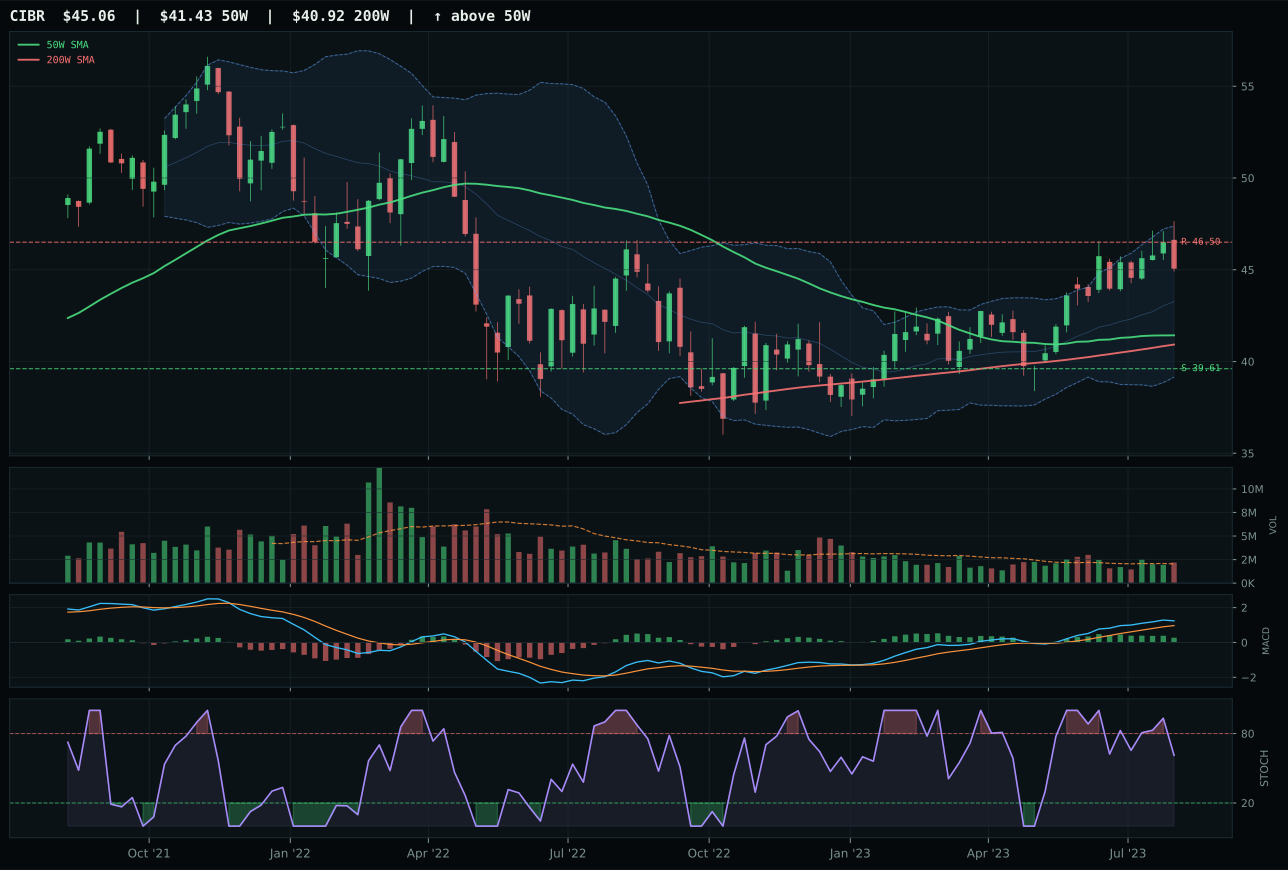
CIBR has a neutral structure profile with 5.5% 13-week relative strength versus SPY.
A failed hold above support would weaken the setup.
Actionable but governed by invalidation levels.
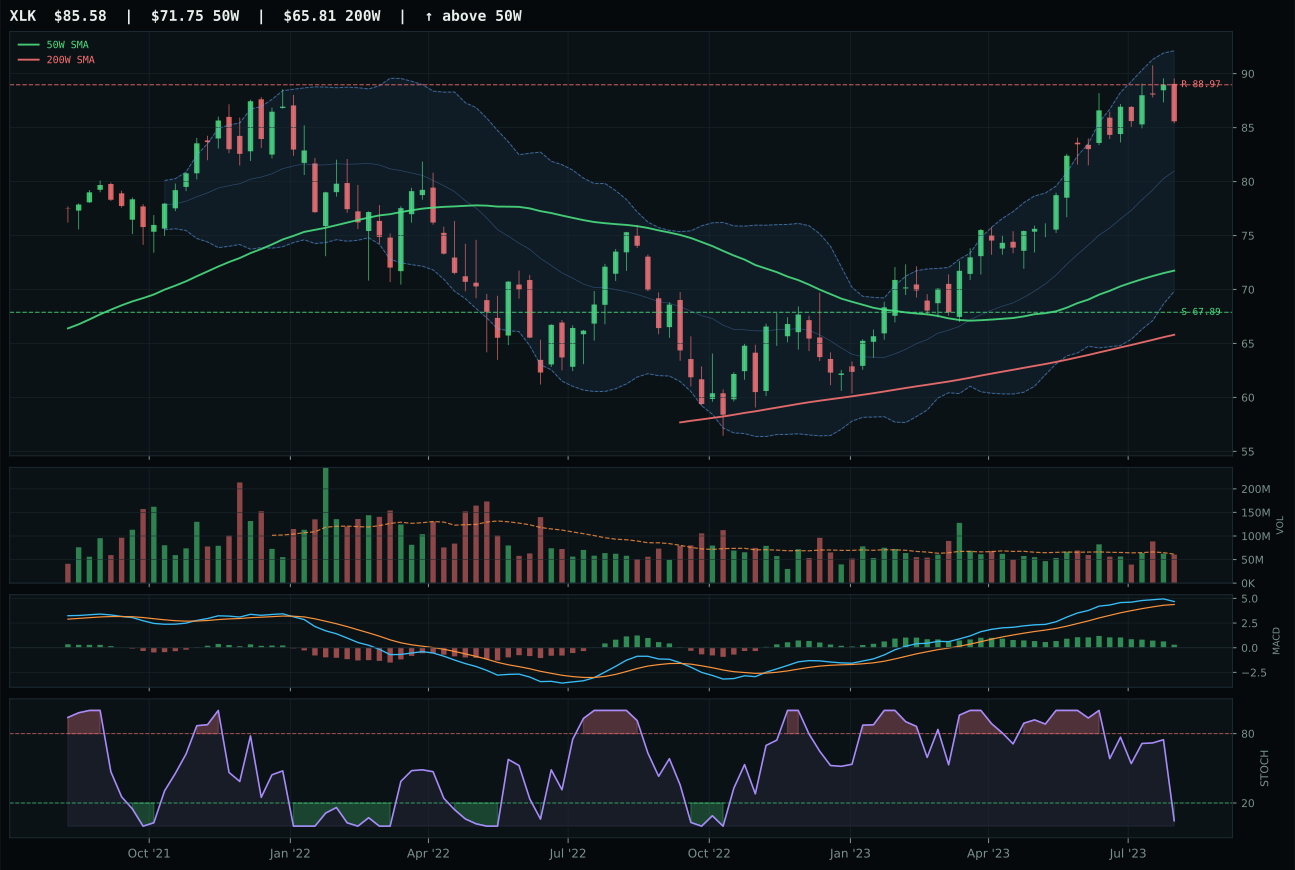
XLK has a vertical extension profile with 4.9% 13-week relative strength versus SPY.
A failed hold above support would weaken the setup.
Actionable but governed by invalidation levels.
IGV won the category by delivering the sharpest relative strength inside the basket: a 4.5% edge versus the category median paired with 10.0% SPY outperformance and a clean 18.3% thirteen-week return. The setup is a vertical extension with price 19.4% above the 50-week moving average, which normally penalizes entry timing, but above-average volume at 1.16x the twenty-week average and bullish momentum confirmation at 100/100 signal accumulation rather than distribution rejection. CIBR lost because its structure was softer (76.8 vs 81.5), its volume was neutral rather than above-average, and it carried zero category-relative strength—a meaningful gap in a basket where leadership matters. The risk asymmetry has shifted: every new buyer is now late to the party with only 3.5% upside to resistance against 27.4% downside to support, which is why the momentum confirmation score alone cannot override the timing penalty.
Technology earned 5% allocation as a tier-2 category, ranked below the two highest-scoring groups but ahead of the excluded names. The macro regime of Late-Cycle Reflation supports growth capex and AI sponsorship (both actively positive), but liquidity stress (-10) and credit stress (-7) create meaningful headwinds that the 44.0 category-level macro fit reflects. IGV's trend score of 100/100 and persistence of 81.1/100 anchor the case for holding it, yet the 19.4% extension above the 50W limits upside potential and leaves the portfolio exposed to mean reversion if risk appetite deteriorates. The real tension is between strong technicals and poor timing: if the setup pulls back toward the 50W with volume confirmation, this category could easily move to 5% allocation. For now it holds at 5% because the macro fit is weak enough to justify tier-2 placement despite clean momentum confirmation.
AI — SMH
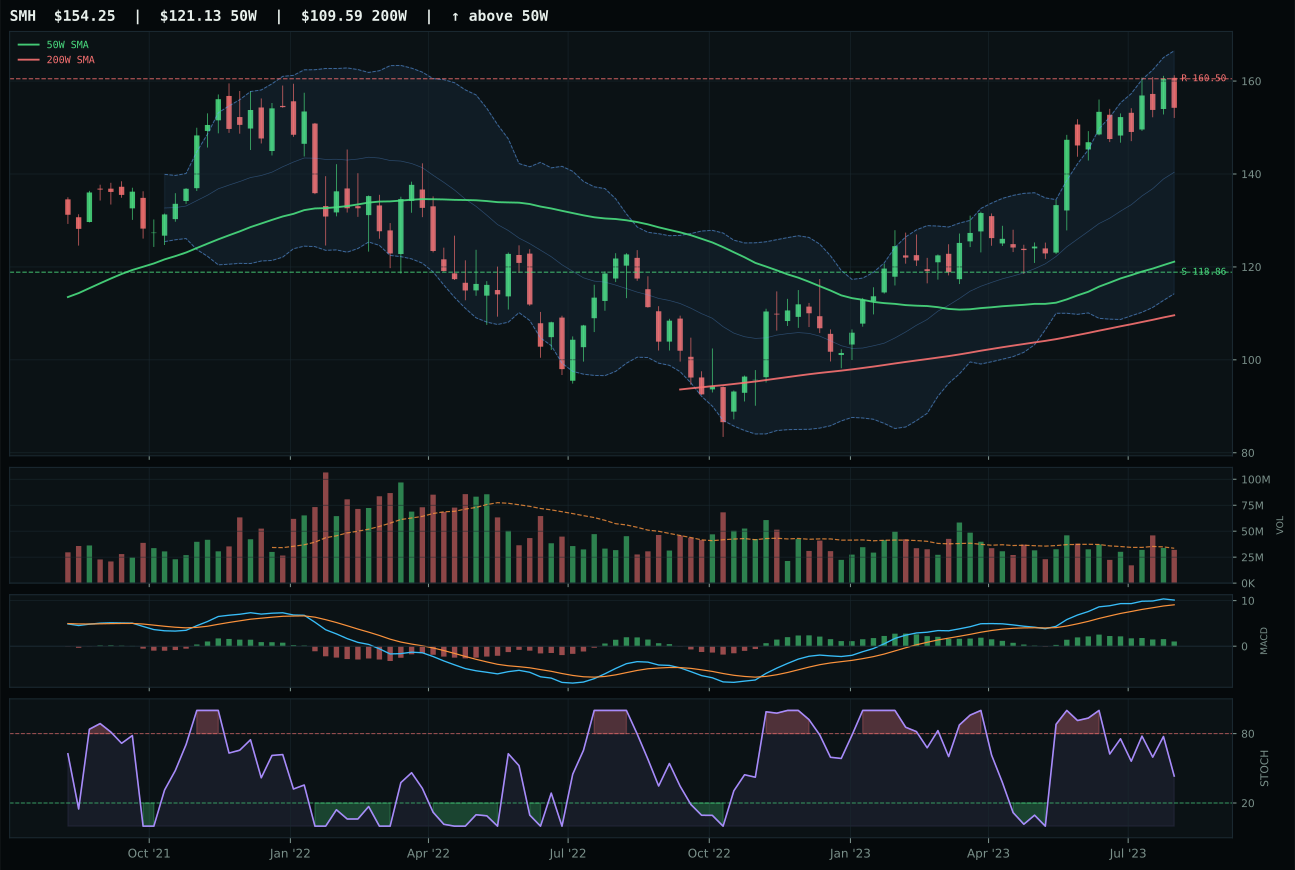
SMH has a vertical extension profile with 15.7% 13-week relative strength versus SPY.
A failed hold above support would weaken the setup.
Actionable but governed by invalidation levels.
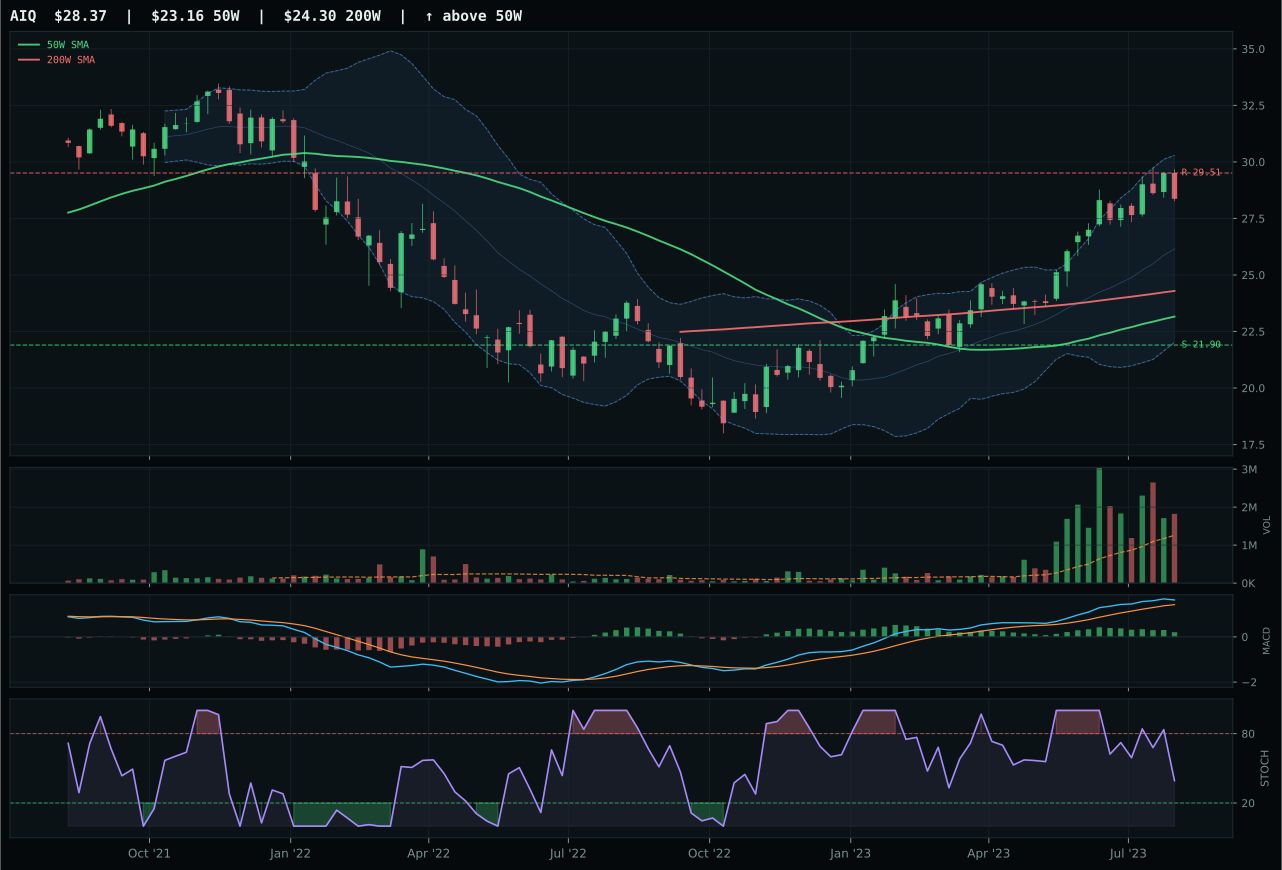
AIQ has a vertical extension profile with 10.8% 13-week relative strength versus SPY.
A failed hold above support would weaken the setup.
Actionable but governed by invalidation levels.
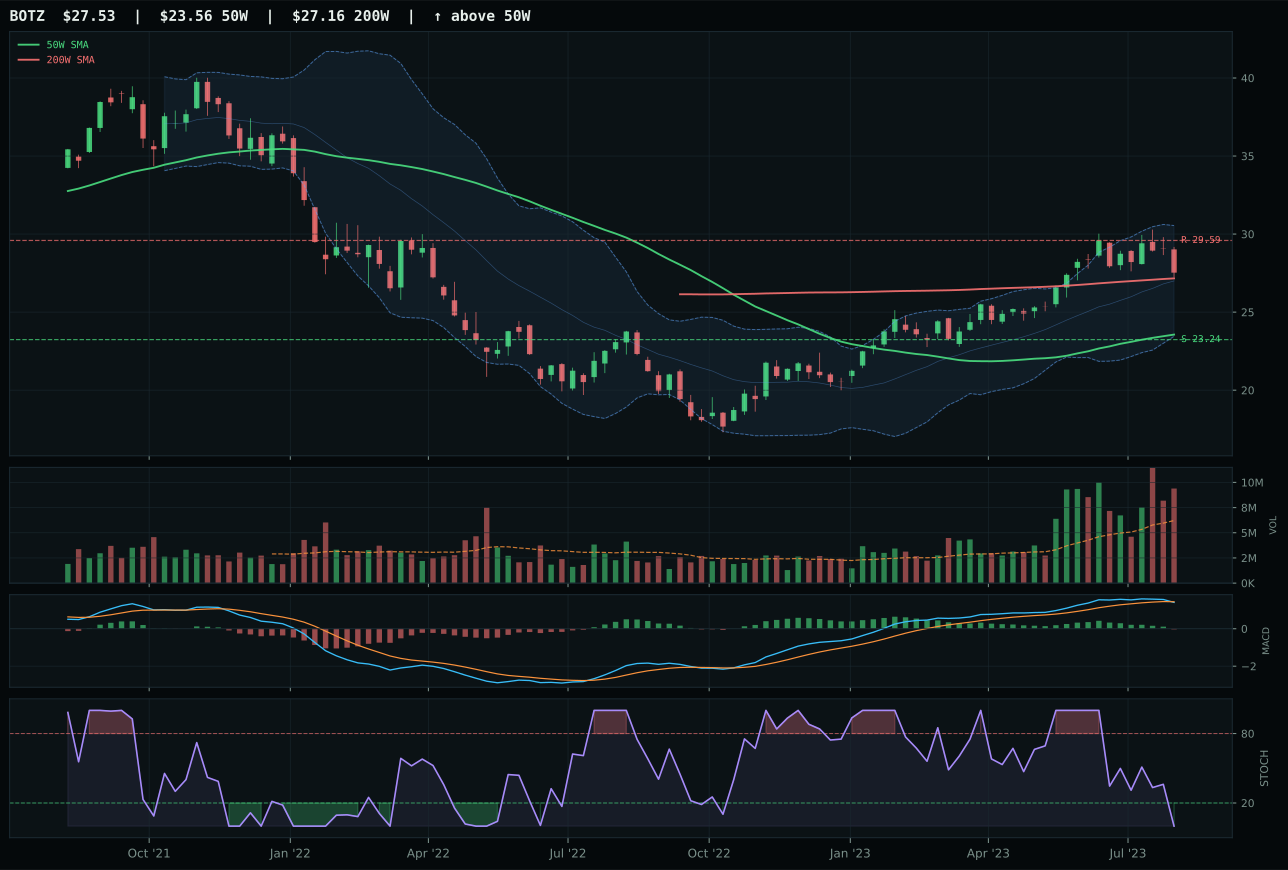
BOTZ has a vertical extension profile with 0.5% 13-week relative strength versus SPY.
A failed hold above support would weaken the setup.
Actionable but governed by invalidation levels.
SMH won by capturing the biggest SPY outperformance in its basket at 15.7%, which translates to maximum recognition of AI compute leadership at a time when semiconductor supply constraints are driving allocation flows. The thirteen-week return of 24.0% and category-relative strength of 4.9% are hard to ignore, even though price sits 27.3% above the 50W in a setup that would normally flag as extended. Neutral volume at 0.95x the twenty-week average is the structural weakness that depressed timing to 40/100, yet momentum confirmation stayed at 100/100 because the four-week return (3.5%) and relative strength ratio still reflect fresh accumulation. AIQ lost despite superior composite score (73 vs 63) and better volume confirmation (above-average participation) because it carried zero category-relative strength—a decisive factor when the reasoned ETF proof order ranked AIQ first at 71.6 but the category representative selection flipped to SMH based on breadth and persistence metrics that reward insider buying behavior over breadth statistics.
AI received 5% allocation as a tier-2 position despite scoring 54.9, which ranks it among the lower-scoring categories this week. The macro fit of 54.0 is neutral-to-positive (AI growth sponsorship is actively +14, risk appetite positive +10) but liquidity stress (-12) and credit stress (-8) create real friction. SMH's extreme 27.3% extension above the 50W is the allocator's main concern: momentum is undeniable, but the risk-reward calculation (39.4/100) shows -3.9% upside to resistance against 29.8% downside to support, a profile that only works if the macro regime stays supportive and fear volume stays absent. The 5% slot reflects confidence in the AI narrative but wariness about entry timing. If SMH pulls back to the 50W with sustained volume, this moves to 10%. If stochastic RSI at 0.43 rolls over into the 20–40 zone without support materialism, the category risks exclusion entirely.
Defense & Aerospace — XAR
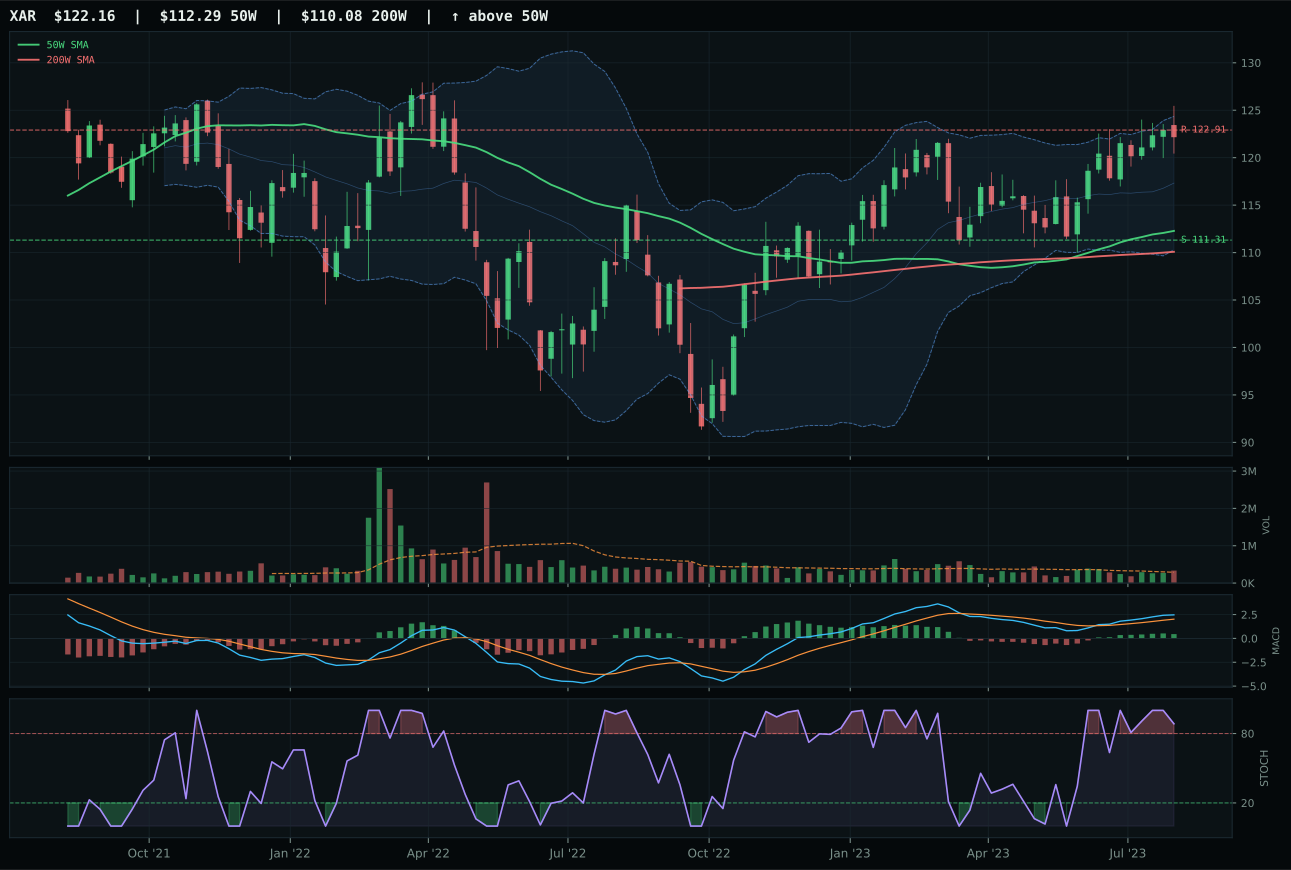
XAR has a neutral structure profile with -0.3% 13-week relative strength versus SPY.
A failed hold above support would weaken the setup.
Actionable but governed by invalidation levels.
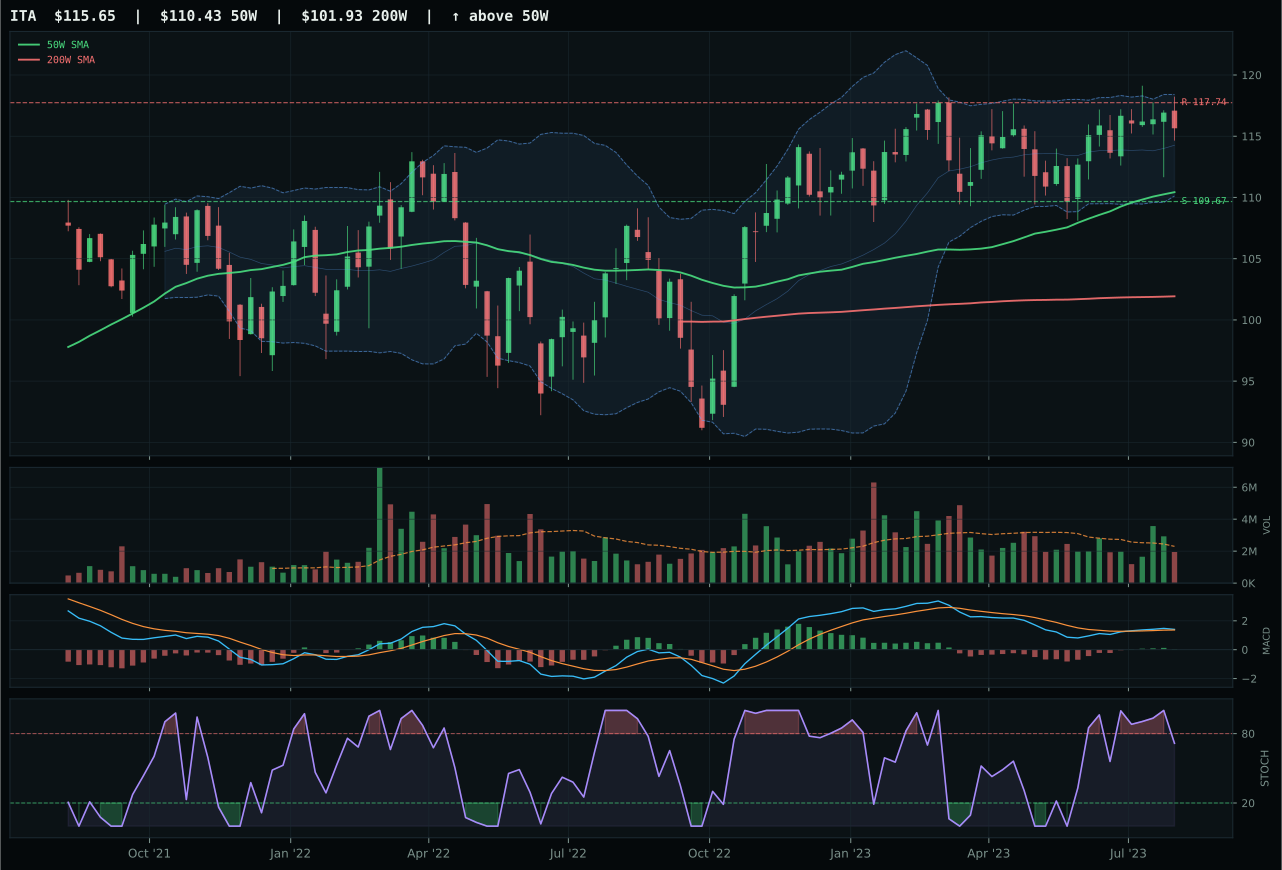
ITA has a neutral structure profile with -4.8% 13-week relative strength versus SPY.
A failed hold above support would weaken the setup.
Actionable but governed by invalidation levels.
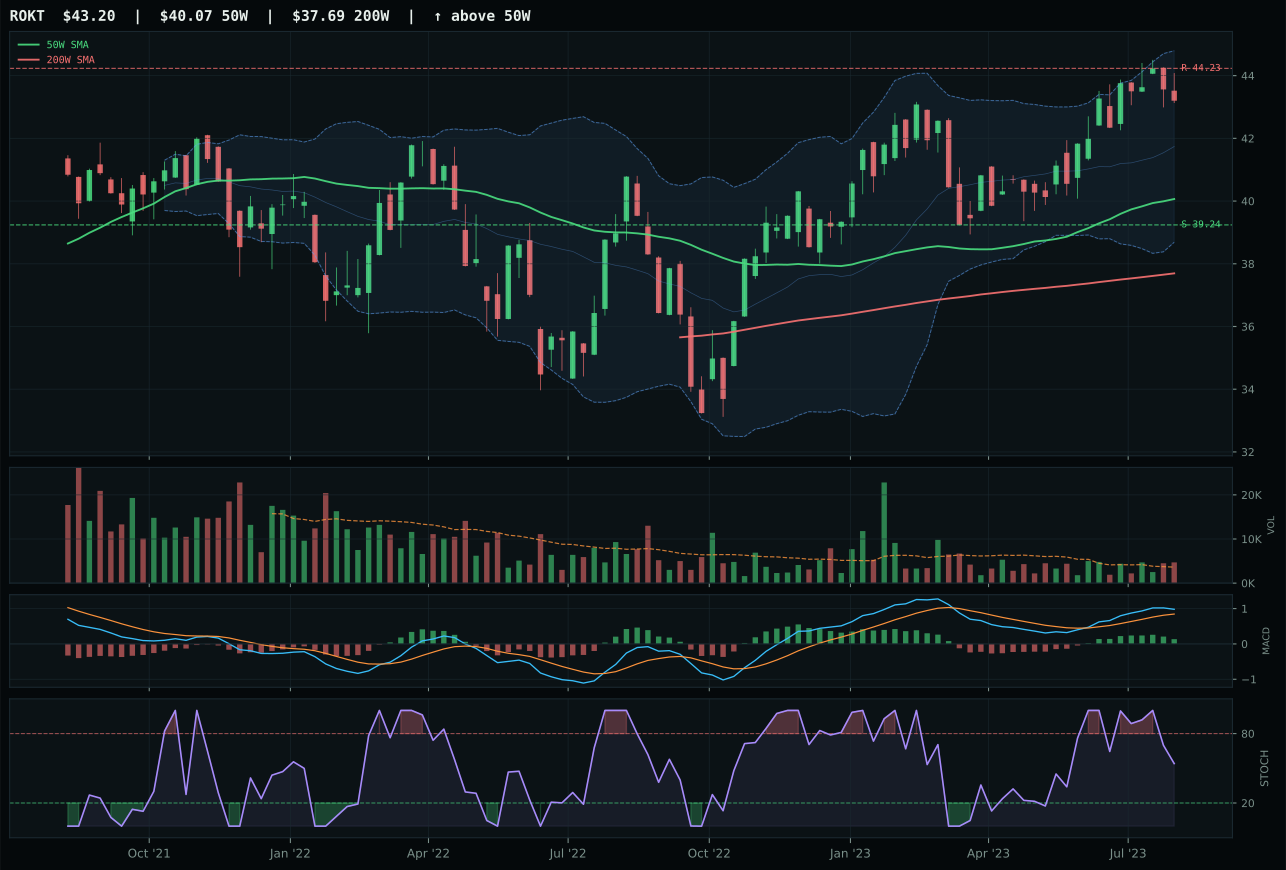
ROKT has a neutral structure profile with -1.0% 13-week relative strength versus SPY.
A failed hold above support would weaken the setup.
Tracked, but not top-2 eligible because: .
XAR won a close decision over ITA (score gap: -1.5 points) by delivering superior volume confirmation and slightly better relative strength inside the category, not through dominant momentum. Price is 8.8% above the 50W in a neutral structure with MACD bullish and improving, which provides mid-cycle accumulation context rather than breakout electricity. The thirteen-week return of 8.0% and category-relative strength of 0.7% are modest, but above-average volume at 1.16x the twenty-week average gave XAR the edge in proving that the move is being funded rather than just coasting. ITA's -4.8% SPY relative strength was a structural handicap: while ITA posted a higher composite score (75 vs 74), it came with neutral volume and a structure ranked 77.3 vs 79.7, leaving no room for error in a category where breadth and volume sponsorship matter as tiebreakers. The timing score at 57/100 reflects the setup's mediocrity: stochastic RSI is overbought rolling over, telling the allocator this is not a fresh continuation but a potential consolidation.
Defense & Aerospace holds 5% allocation as a tier-2 holding despite a respectable 53.5 category score. Late-Cycle Reflation helps this exposure (+6) and credit stress is actually mildly positive (+2), which supports the allocation logic, but liquidity stress (-4) and the broader macro fit of 57.0 leave it below the tier-1 threshold. XAR's trend score of 99.6/100 is exceptional, yet momentum confirmation at 68.9/100 is well below the 80+ range that typically unlocks overweight positions. The real constraint is risk-reward at 38.1/100: only 0.6% upside to resistance means the category is trading in a range, not trending. The 5% slot is defensive positioning—a hedge against inflation and geopolitical risk escalation—rather than an offensive bet. For this category to earn 10%, XAR needs to break through resistance at 122.91 with volume expansion, or the macro regime needs to shift hard toward conflict risk or supply disruption narratives.
Agriculture & Livestock — MOO
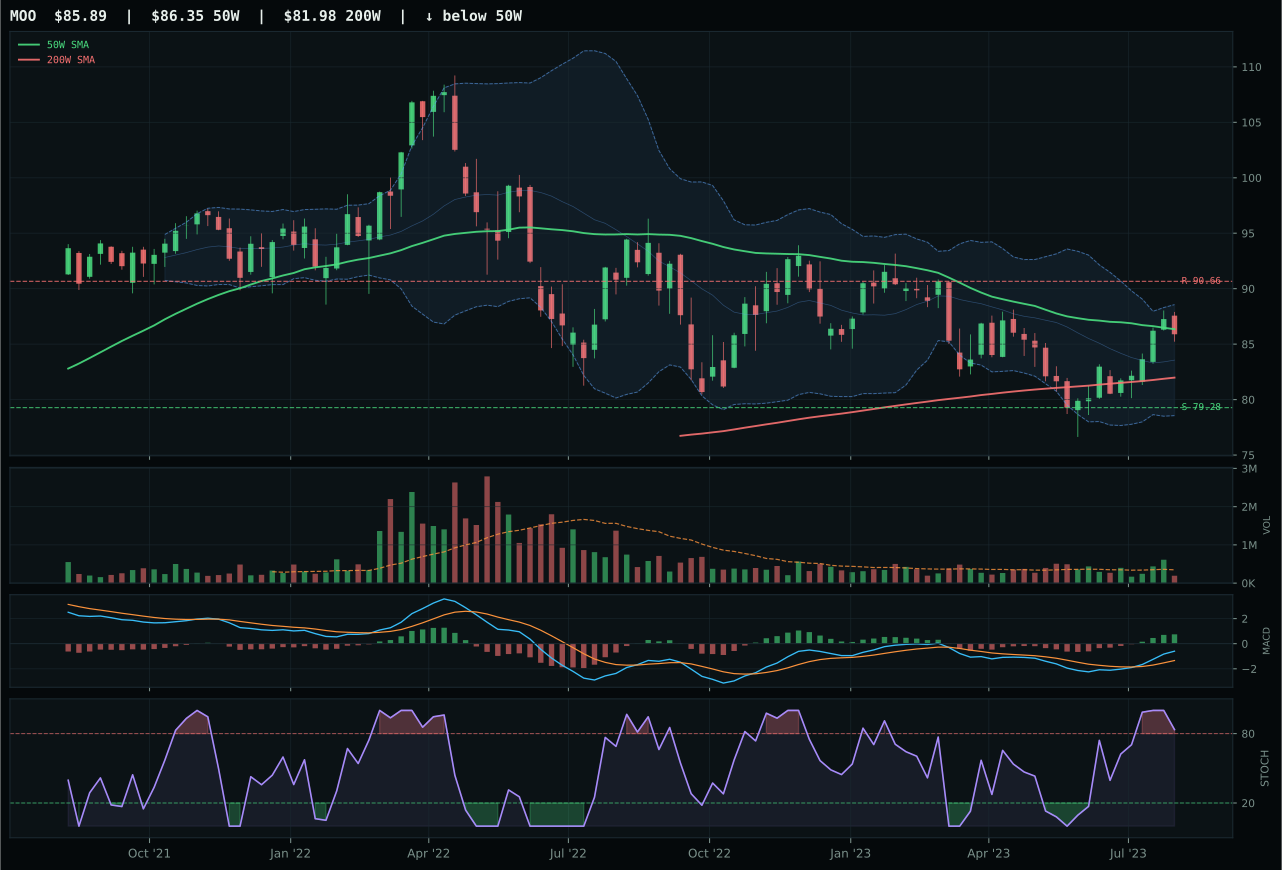
MOO has a compression near 50W profile with -6.9% 13-week relative strength versus SPY.
A failed hold above support would weaken the setup.
Actionable but governed by invalidation levels.
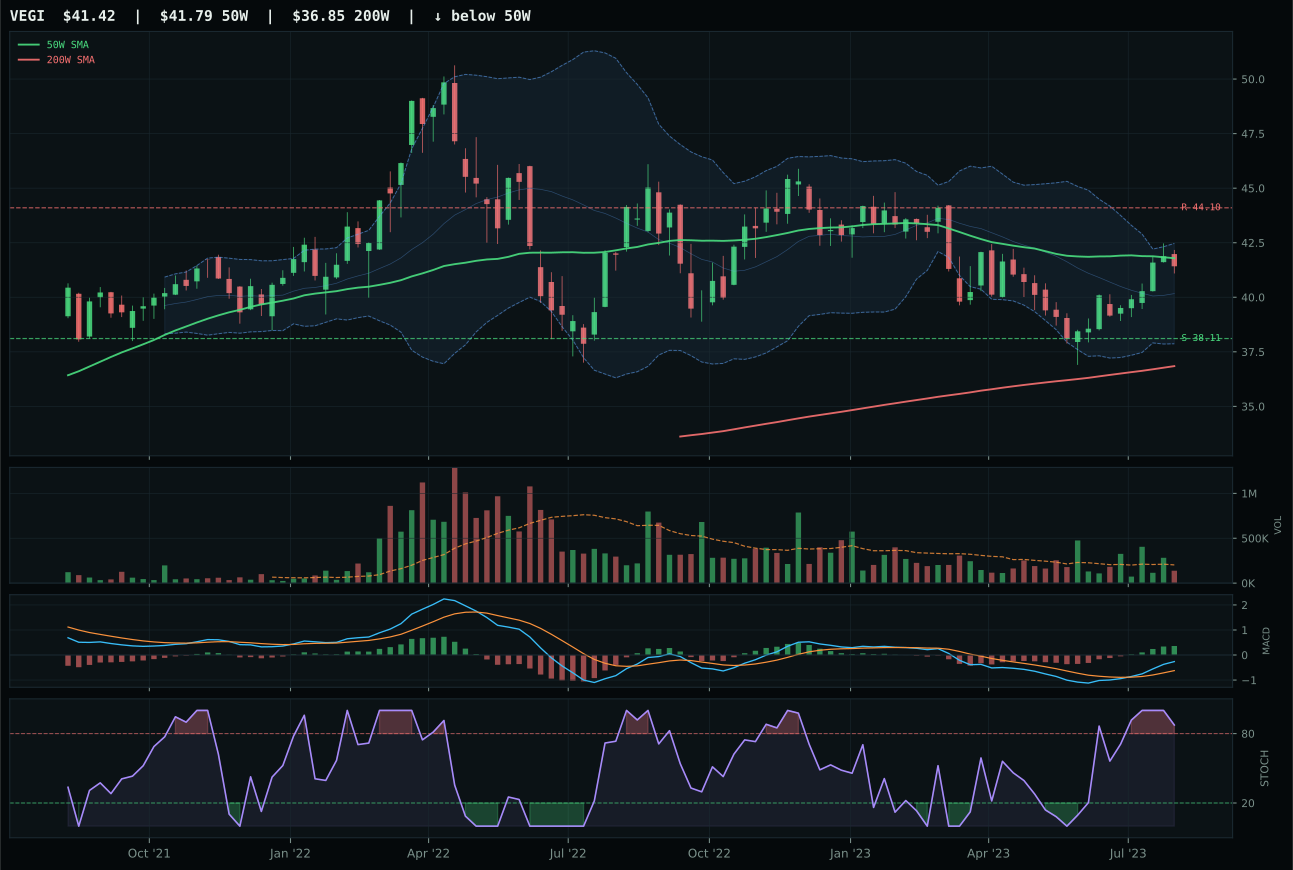
VEGI has a compression near 50W profile with -5.0% 13-week relative strength versus SPY.
A failed hold above support would weaken the setup.
Tracked, but not top-2 eligible because: .
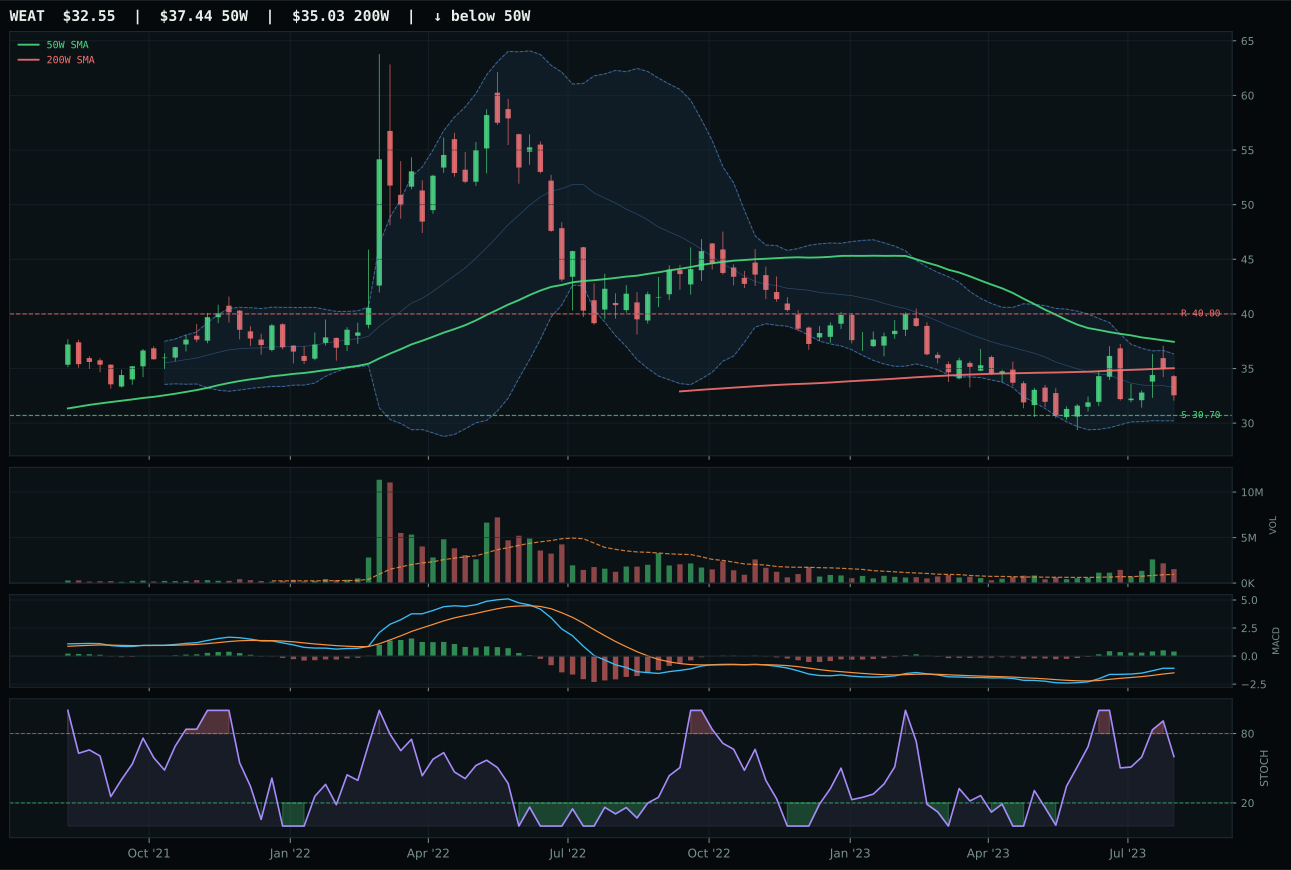
WEAT has a neutral structure profile with -9.8% 13-week relative strength versus SPY.
A failed hold above support would weaken the setup.
Actionable but governed by invalidation levels.
MOO won against VEGI (score gap: +17.9 points) despite a setup that looks weak on the surface: price is -0.5% from the 50W, not above it, and the thirteen-week return is just 1.4% with SPY relative strength of -6.9%. The victory belongs to timing and structure, not momentum. MOO sits in compression near the 50W with MACD bullish and improving and stochastic RSI overbought rolling over, creating the exact setup where a failed breakdown becomes an accumulation ladder. The timing score of 89.0/100 reflects this: the risk-reward at 64.4/100 shows -5.3% upside resistance but 8.3% downside support buffer, meaning the setup is defined and testable. Volume is thin at 0.56x the twenty-week average, which suppresses the confirmation score to 40.3/100, but thin volume into compression often precedes expansion once support holds. VEGI was essentially identical on structure and timing but lacked MOO's composite conviction: MOO's superior trend score (54.7 vs 57) and structure cleanliness gave it the edge when category breadth was thin.
Agriculture & Livestock earned 5% allocation despite the lowest category score (43.5) because the macro fit is exceptional at 90.0/100. Supply shortage is actively +13, inflation pressure +10, and real asset sponsorship +8—a powerful backdrop for reflation trades. Late-Cycle Reflation itself adds +8 support. This overrides the weak technical setup: MOO is a defensive real-asset play on commodity beta, not a momentum chase. The thin volume and compression setup are actually features, not bugs, in a portfolio hedging against stagflation escalation. Risk appetite positive is mildly active in the macro descriptor set, but the category's core job is to protect real purchasing power when credit stress and liquidity stress linger. MOO's timing score of 89/100 is the lockpick: it shows support at 79.28 is a defined test case. If support breaks with distribution volume, the category moves to 0% immediately because the macro thesis was predicated on price holding near the 50W. If support holds, MOO becomes a quiet accumulation point ahead of Q4 seasonal strength.
Emerging Markets — INDA
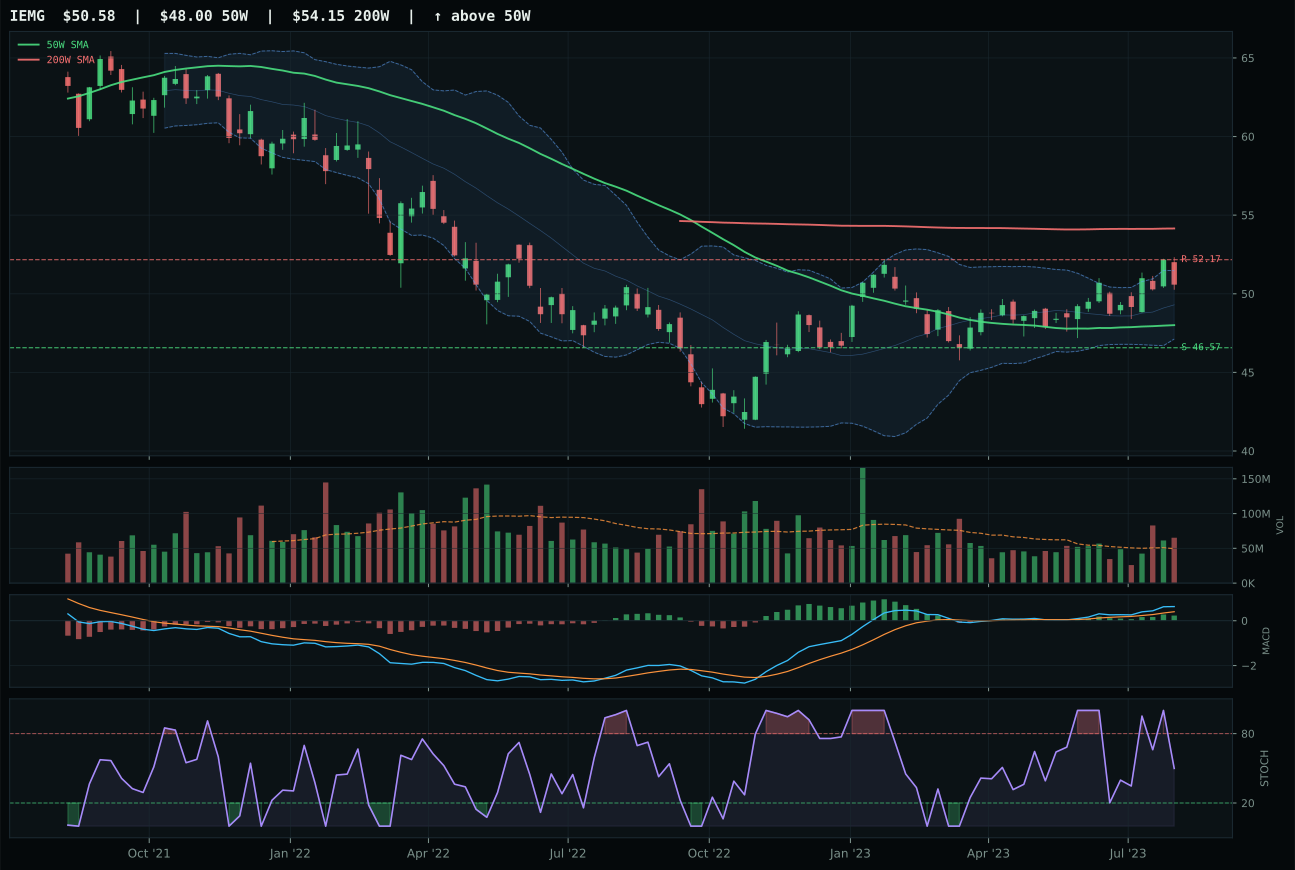
IEMG has a neutral structure profile with -4.9% 13-week relative strength versus SPY.
A failed hold above support would weaken the setup.
Actionable but governed by invalidation levels.
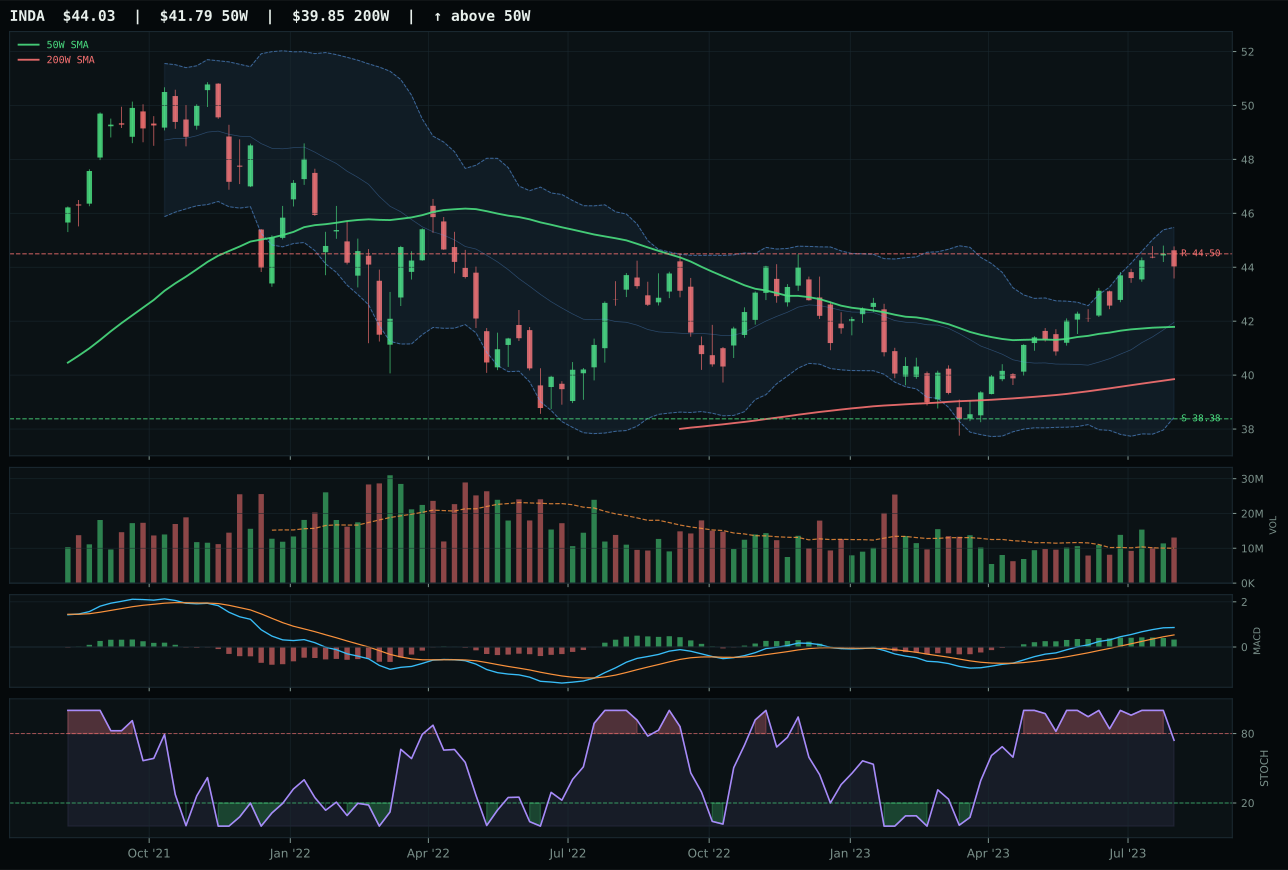
INDA has a neutral structure profile with -1.9% 13-week relative strength versus SPY.
A failed hold above support would weaken the setup.
Actionable but governed by invalidation levels.
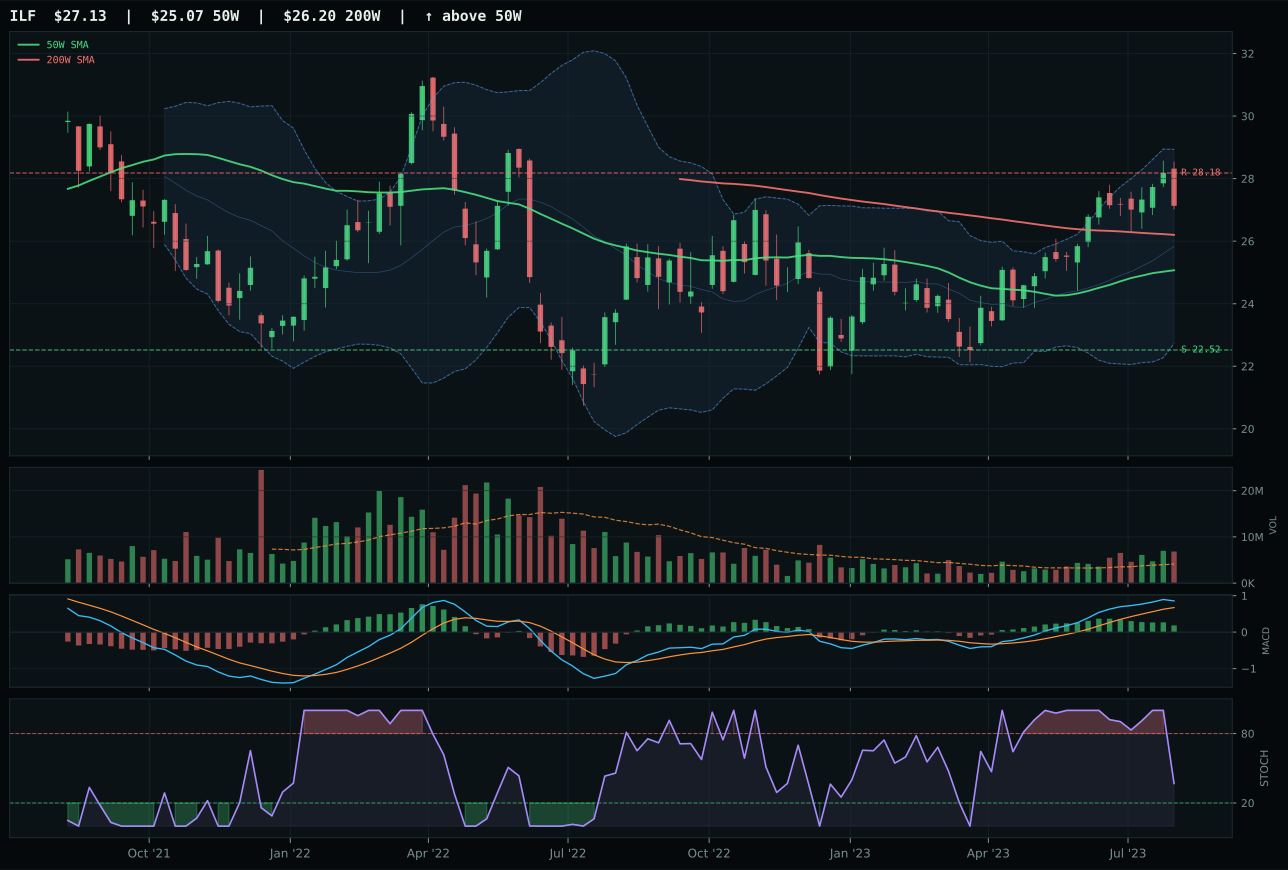
ILF has a neutral structure profile with 0.8% 13-week relative strength versus SPY.
A failed hold above support would weaken the setup.
Actionable but governed by invalidation levels.
INDA won the category by narrow margin (score gap: 5.3 points) despite IEMG posting superior technical evidence (72.1 vs 67.8) because INDA's MACD momentum was still bullish but flattening rather than IEMG's bullish and improving—a subtle distinction that favored the candidate with category-relative strength. Price is 5.4% above the 50W in a neutral structure with above-average volume at 1.30x the twenty-week average, thirteen-week return of 6.4%, and RS versus SPY at -1.9%. IEMG delivered broader emerging-market beta with -4.9% SPY relative strength, which is a larger technical handicap than INDA's -1.9%, and it carried -2.9% category-relative strength (losing to INDA's 0.0%). The timing score at 70/100 reflects caution: stochastic RSI is falling/neutral, not overbought, and with only -1.1% upside to resistance versus 14.7% downside to support, the risk-reward profile (46.3/100) is mediocre. Category representation hinged on India quality-growth narrative outperforming broad EM beta in a late-cycle regime where selectivity beats breadth.
Emerging Markets earned 5% allocation as a tier-2 position despite the lowest category score (41.3) because INDA's India-specific growth narrative provides a differentiated hedge within a portfolio otherwise concentrated on energy, metals, and AI. The category-level macro fit is 38.0/100—poor on an absolute basis—with credit stress (-10) and liquidity stress (-10) creating meaningful headwinds, offset only partially by risk appetite positive (+8). INDA's nine-week trend of 93.1/100 and structure of 79.2/100 are strong, but momentum confirmation at 65.2/100 is mediocre and risk-reward is constrained. The real allocation case is diversification: when energy and metals are concentrated overweights and AI is stretched, a small 5% position in India quality growth provides demographic and capex exposure uncorrelated with energy cycles. If credit stress or liquidity stress activate more forcefully, this moves to 0% immediately. If INDA breaks above 44.50 resistance and extends the 13W return momentum, this could earn 10% as a longer-duration growth satellite. For now, 5% reflects opportunistic exposure rather than conviction.
Precious Metals — GLD
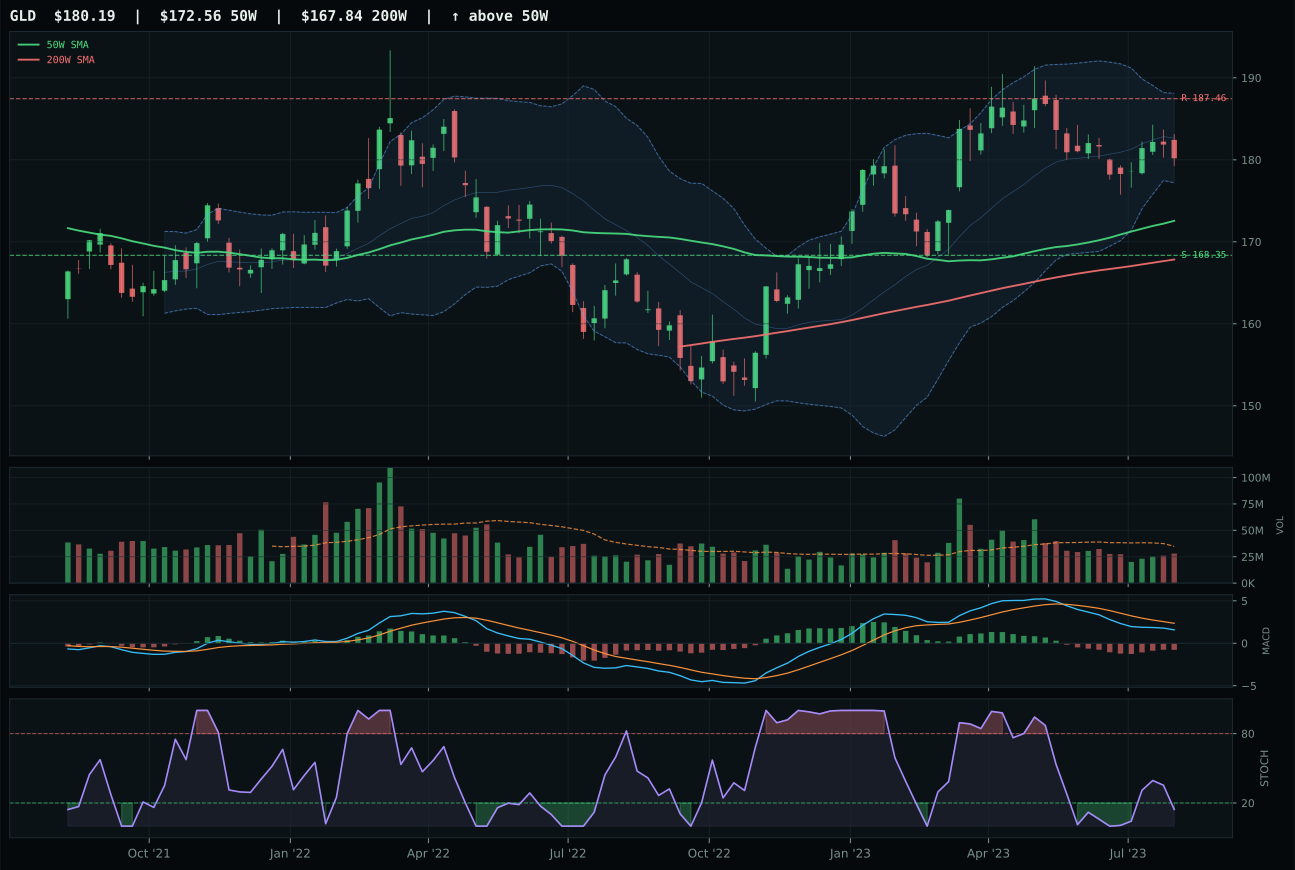
GLD has a neutral structure profile with -12.2% 13-week relative strength versus SPY.
A failed hold above support would weaken the setup.
Actionable but governed by invalidation levels.
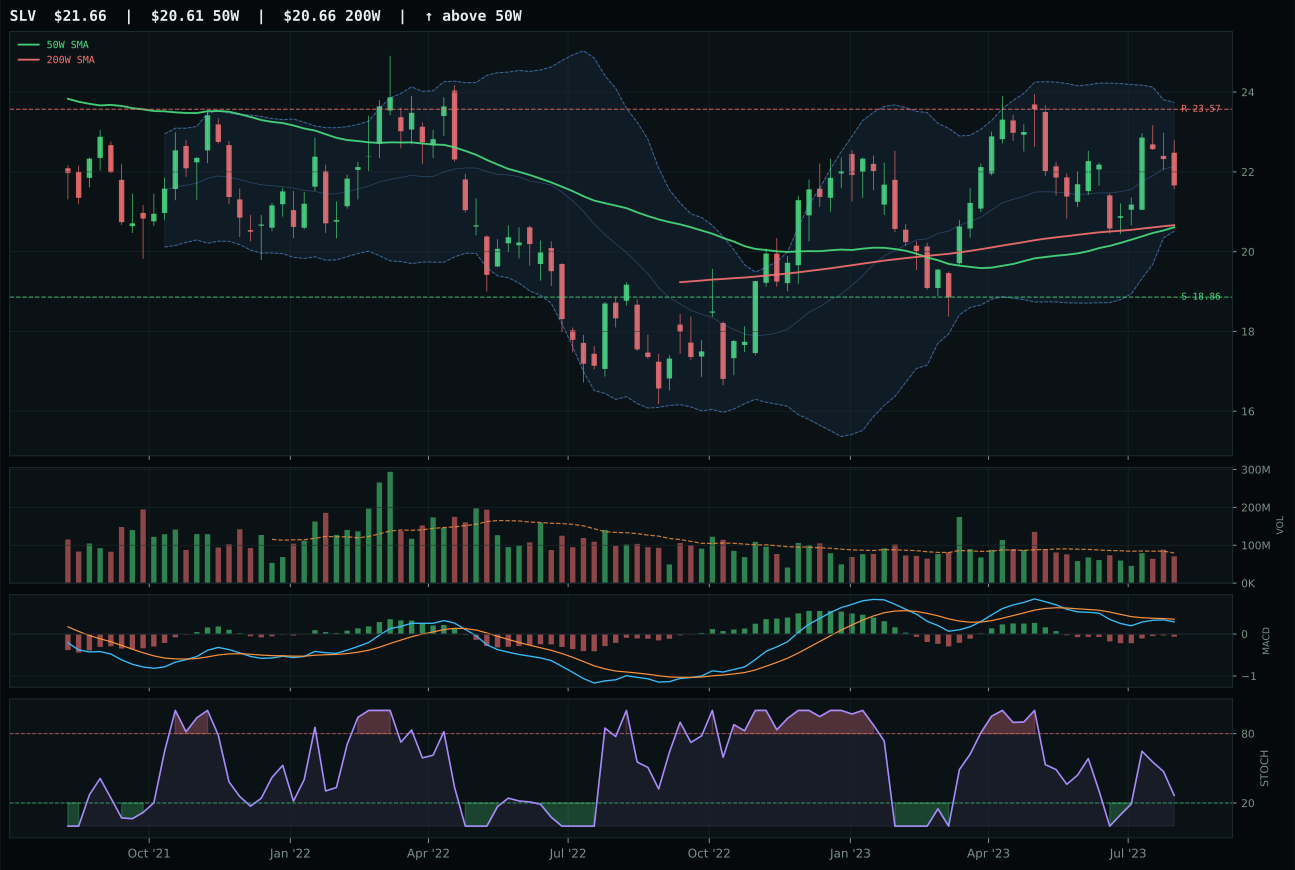
SLV has a neutral structure profile with -16.4% 13-week relative strength versus SPY.
A failed hold above support would weaken the setup.
Actionable but governed by invalidation levels.
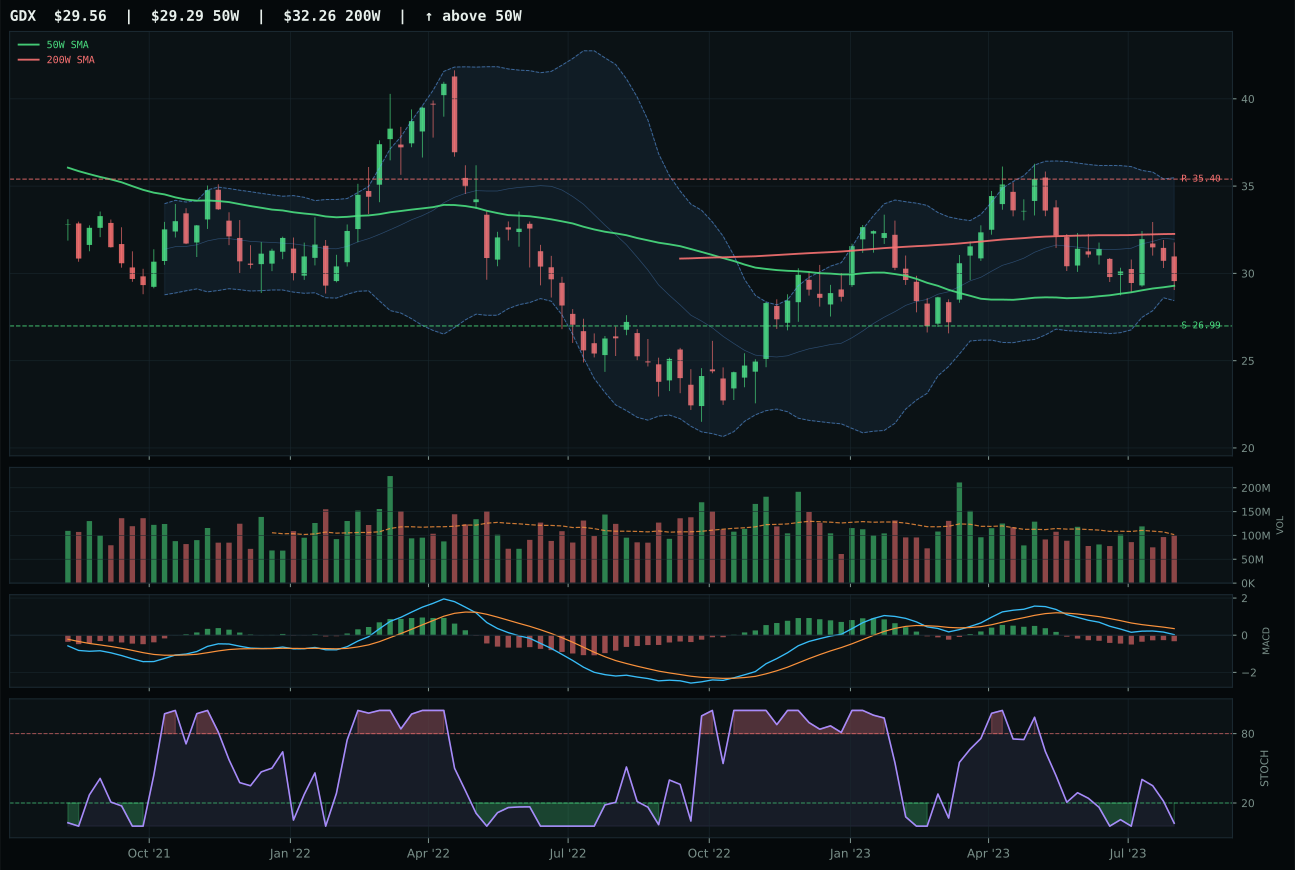
GDX has a compression near 50W profile with -24.8% 13-week relative strength versus SPY.
A failed hold above support would weaken the setup.
Actionable but governed by invalidation levels.
GLD won the category but earned zero allocation, a critical distinction that reflects the quality of the setup versus its fit with the current regime. GLD beat SLV with a 5.5-point margin by posting superior timing (90/100 vs 75/100), better structure (73.6 vs 67.9), and stronger category-relative strength (4.2% vs 0.0%). Price is 4.4% above the 50W in a neutral structure with MACD bearish but improving and stochastic RSI oversold at 0.14, creating a classic mean-reversion coil. The problem is what the setup means: oversold stochastic RSI is a bottom signal, but the thirteen-week return is -3.9% and SPY relative strength is -15.6%, telling the allocator that gold has been in structural underperformance during a period when risk appetite has been positive. The timing of 90/100 is technically clean, but it's improving from a depressed state, not building momentum. GLD's composite 68 and structure 73.6 are respectable, yet momentum confirmation collapsed to 35.7/100 because four-week return was 0.9% and thirteen-week was negative.
Precious Metals earned 0% allocation because the category score of 38.6 ranked outside the nine funded positions this week, and the macro fit of 46.0/100 offers no structural support. Risk appetite positive is actively -4 in the descriptor set, meaning the current regime penalizes defensive metals allocation. The Late-Cycle Reflation backdrop does not support safe-haven flows; rather, it supports real assets with inflation beta (energy, agriculture, industrial metals) over monetary hedges. GLD's oversold stochastic RSI and improving MACD create a technical bottom formation, but the category itself is broken in macro context: a -15.6% SPY relative strength over thirteen weeks is the market pricing out inflation protection and inflation pressure is not active enough (+0 in this week's regime) to justify defensive positioning. For Precious Metals to earn 5%, either deflation risk would need to activate in the descriptor set, or GLD would need to establish fresh uptrend above 187.46 with risk appetite positive flipping to -2 or better. Neither is true today, making this a prudent zero-allocation decision despite GLD's technical setup being reasonable in isolation.
Utilities & Infrastructure — XLU
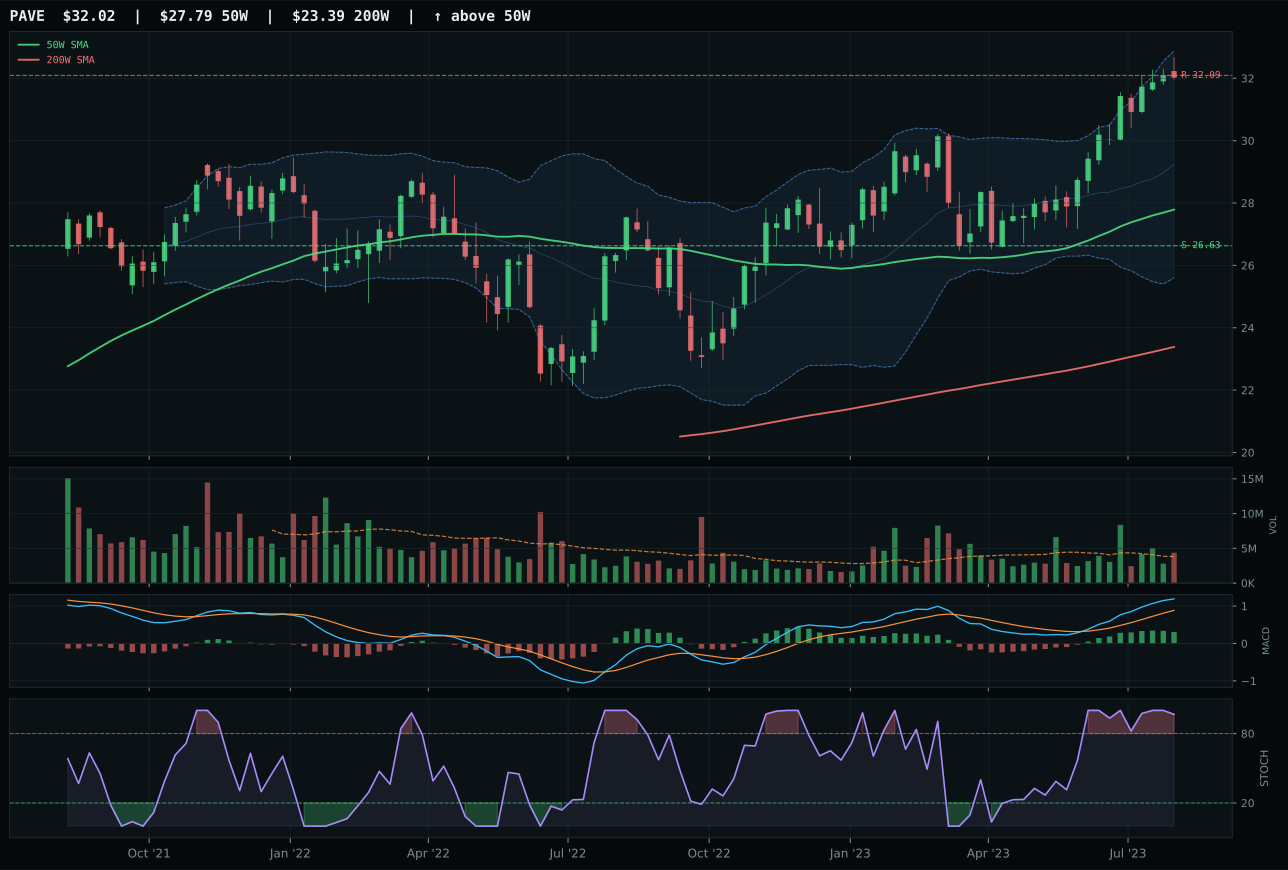
PAVE has a vertical extension profile with 6.2% 13-week relative strength versus SPY.
A failed hold above support would weaken the setup.
Actionable but governed by invalidation levels.
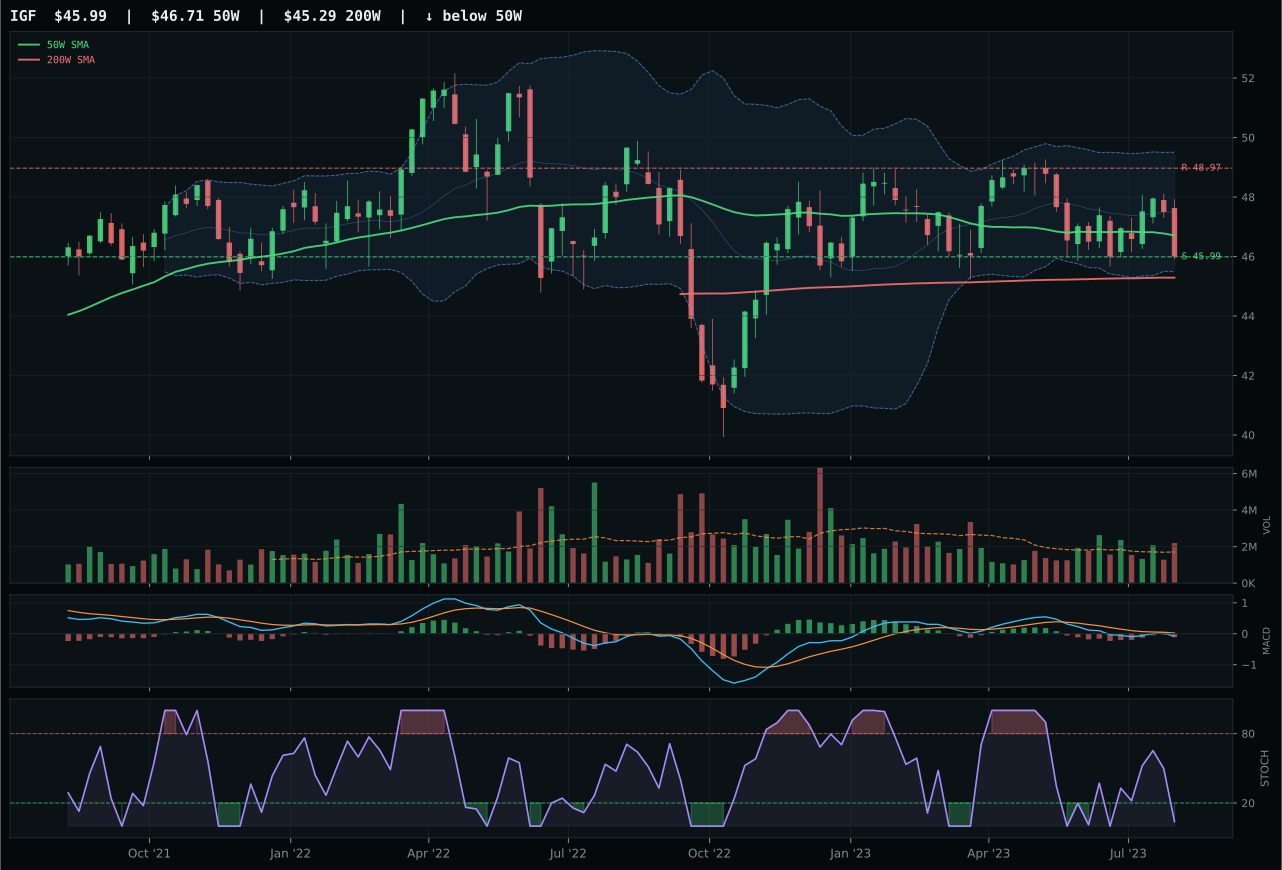
IGF has a pullback into support profile with -14.4% 13-week relative strength versus SPY.
A failed hold above support would weaken the setup.
Actionable but governed by invalidation levels.
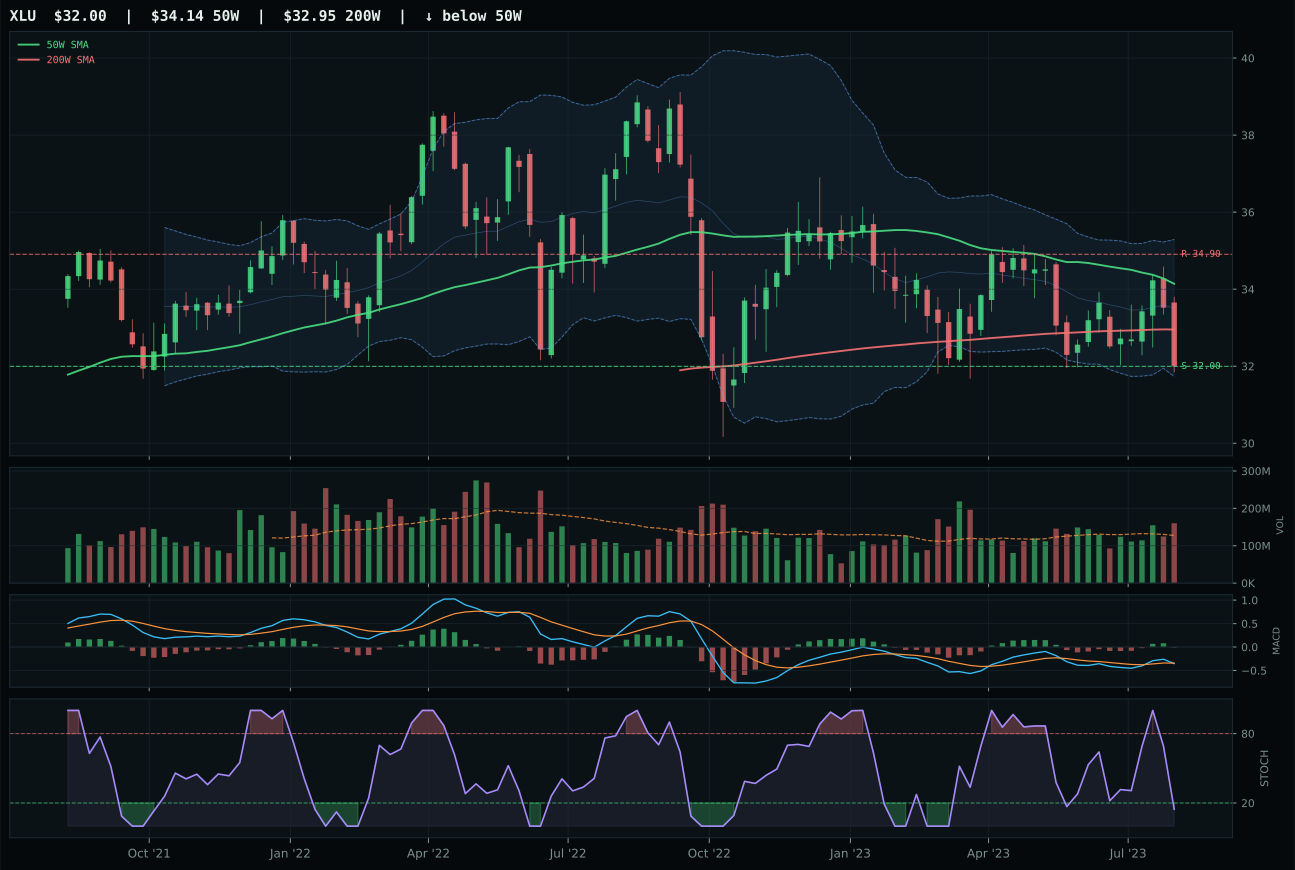
XLU has a pullback into support profile with -15.6% 13-week relative strength versus SPY.
A failed hold above support would weaken the setup.
Actionable but governed by invalidation levels.
XLU won a category where all three candidates were weak, but it earned 0% allocation because even the winner could not clear the exclusion threshold. XLU's thirteen-week return is -7.3% with -15.6% SPY relative strength, price is -6.3% below the 50W (below the 200W entirely), trend scores 23/100, and momentum confirmation is 17.3/100. The only reason it won the category was timing: at -6.3% from the 50W with MACD bearish but improving and stochastic RSI oversold at 0.15, the setup shows a mean-reversion bottom formation. Timing scores 85/100 because the Fibonacci level (near 52W low) aligns with support, creating a defined invalidation point. PAVE lost despite vastly superior trend (100 vs 23) and momentum (100 vs 17) because it is stretched 15.2% above the 50W with only -8.3% upside to resistance; when overshoots run out of room, they revert, and PAVE's vertical extension into resistance with overbought stochastic rolling over is the exact setup that leads to multi-week consolidations. XLU's defended support at 32.00 is a better technical asymmetry than PAVE's exhausted upside, making XLU the category leader by default.
Utilities & Infrastructure earned 0% allocation because the category score of 35.5 ranked 9th or 10th in the portfolio and the macro fit of 43.0/100 provides no support. Inflation pressure is actively -6, risk appetite positive is -2, and liquidity stress is -3, all working against defensive utility positioning. In a Late-Cycle Reflation regime, utilities underperform because rising rates and inflation expectations hurt duration-sensitive dividend stocks; this is structural, not tactical. XLU's oversold technical setup at the 52W low is technically interesting (timing 85/100) but it is a bottom formation in a category with negative macro tailwinds. PAVE's bullish and improving momentum is more aligned with the late-cycle regime, yet at 15.2% above the 50W with only 37.2 risk-reward, it is an expensive rally rather than an accumulation opportunity. For Utilities to earn 5% allocation, either inflation pressure would need to invert to positive (unlikely in reflationary conditions) or a credit stress event would need to activate, triggering flight-to-quality flows into regulated assets. Until then, capital is better deployed in energy, metals, and AI infrastructure plays that align with the reflation thesis.