
2023-07-28
Informational purposes only. The content in this report, including allocations, analysis, and commentary, is provided solely for informational and educational purposes. It does not constitute financial advice, investment advice, trading advice, or any other type of advice. Past performance does not guarantee future results. Always conduct your own research and consult a qualified financial professional before making investment decisions.
Weekly Allocation
| Ticker | Category | Weight | Role |
|---|---|---|---|
| FBTC | 50% | Overlay | |
| COPX | Industrial Metals | 10% | Top-2 (10%) |
| FCG | Traditional Energy | 10% | Top-2 (10%) |
| AIQ | AI | 5% | Tier-2 (5%) |
| MOO | Agriculture & Livestock | 5% | Tier-2 (5%) |
| IGV | Technology | 5% | Tier-2 (5%) |
| ILF | Emerging Markets | 5% | Tier-2 (5%) |
| XLU | Utilities & Infrastructure | 5% | Tier-2 (5%) |
| URA | Nuclear Energy | 5% | Tier-2 (5%) |
Trade Instructions — Monday Open
Sell the tranche from 2023-06-30 (completing its 4-week hold). Buy the new tranche. Instructions show net portfolio changes — same-asset positions cancel, weight changes show the delta.
| Action | Ticker | Instruction |
|---|---|---|
| SELL | AIQ | Sell 17% of AIQ position (reduce 7.50% → 6.25%) |
| SELL | IGV | Sell 17% of IGV position (reduce 7.50% → 6.25%) |
| SELL | XAR | Sell 25% of XAR position (reduce 5.00% → 3.75%) |
| SELL | PAVE | Sell 20% of PAVE position (reduce 6.25% → 5.00%) |
| SELL | GLD | Sell 33% of GLD position (reduce 3.75% → 2.50%) |
| BUY | COPX | Buy COPX — 20.00% of freed cash (adds 1.25% to portfolio) |
| BUY | FCG | Buy FCG — 40.00% of freed cash (adds 2.50% to portfolio) |
| BUY | MOO | Buy MOO — 20.00% of freed cash (adds 1.25% to portfolio) |
| BUY | XLU | Buy XLU — 20.00% of freed cash (adds 1.25% to portfolio) |
Current Portfolio After Trade
Combined holdings across all 4 active tranches. Each tranche is 25% of the portfolio.
| Ticker | % of Portfolio | Weight Bar |
|---|---|---|
| FBTC | 50.00% | |
| AIQ | 6.25% | |
| IGV | 6.25% | |
| COPX | 6.25% | |
| URA | 5.00% | |
| PAVE | 5.00% | |
| ILF | 3.75% | |
| XAR | 3.75% | |
| GLD | 2.50% | |
| XLK | 2.50% | |
| FCG | 2.50% | |
| INDA | 1.25% | |
| SLV | 1.25% | |
| SMH | 1.25% | |
| MOO | 1.25% | |
| XLU | 1.25% |
Macro Regime — Transition / Mixed
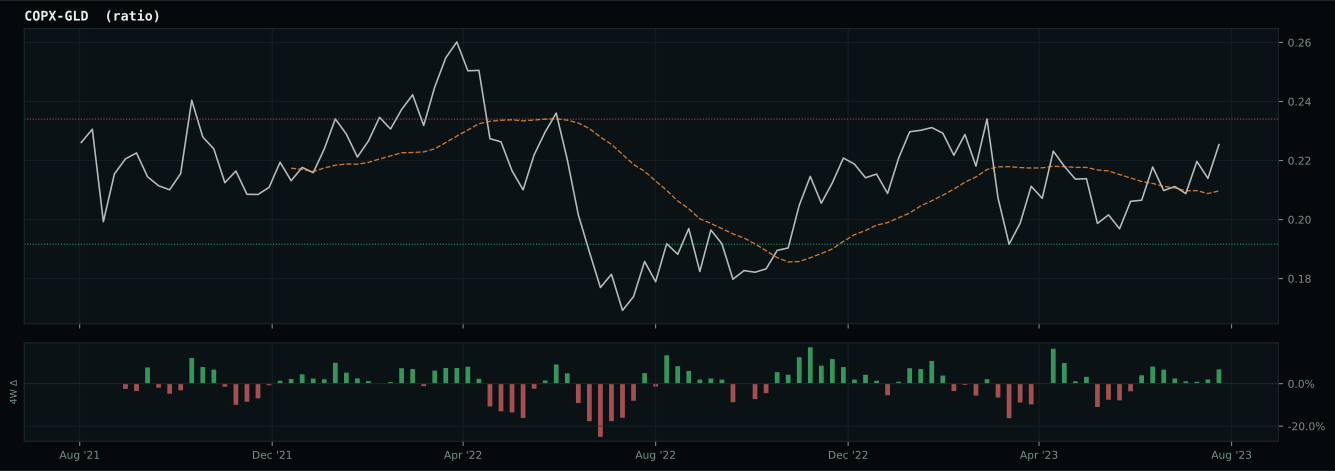
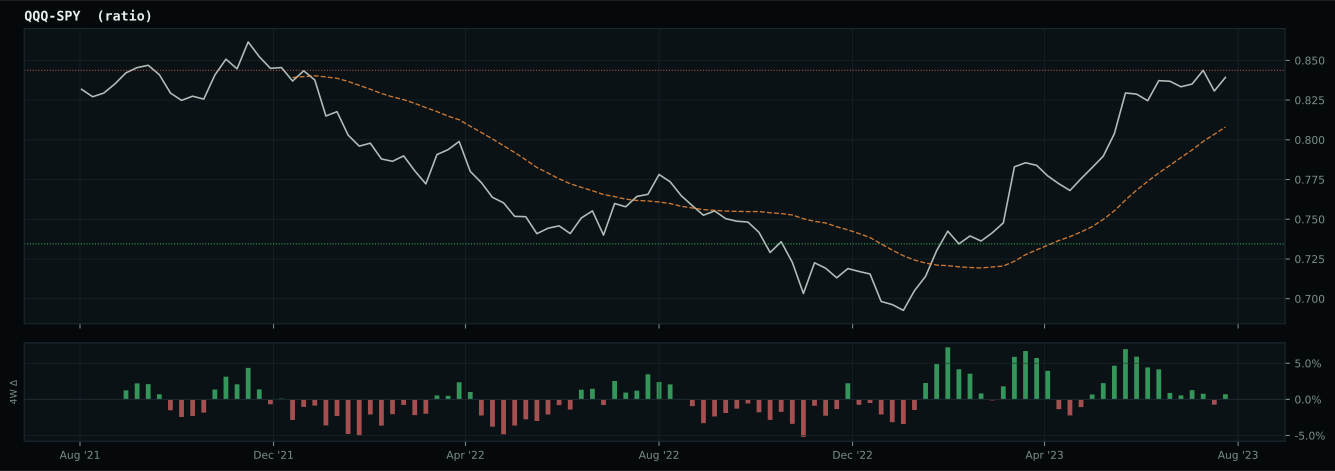
Macro Evidence Charts
Market-implied signals behind the macro regime scores. Each ratio compares two assets; the direction and slope of the ratio is what the macro engine reads.
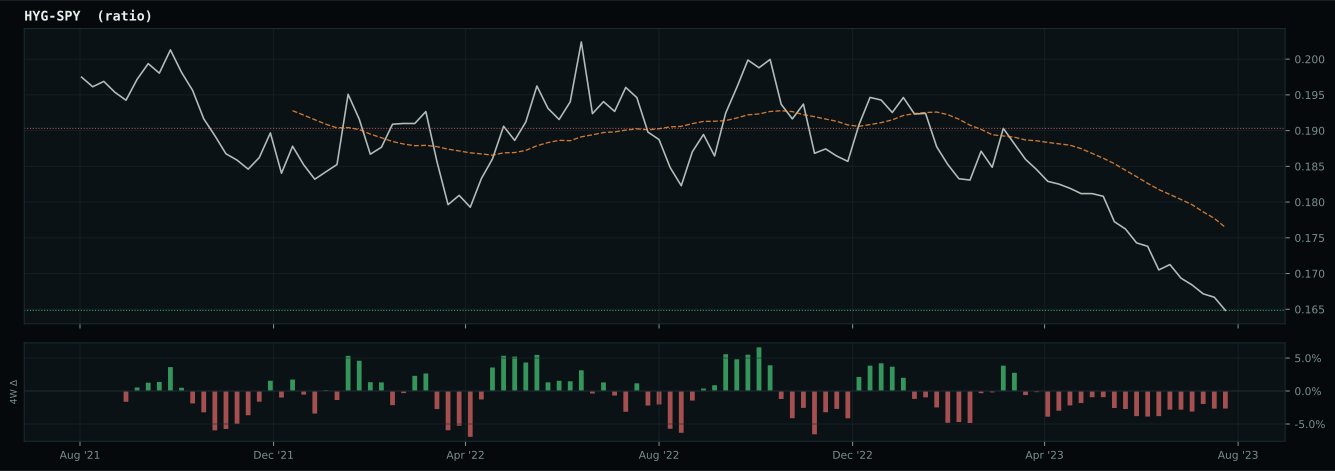
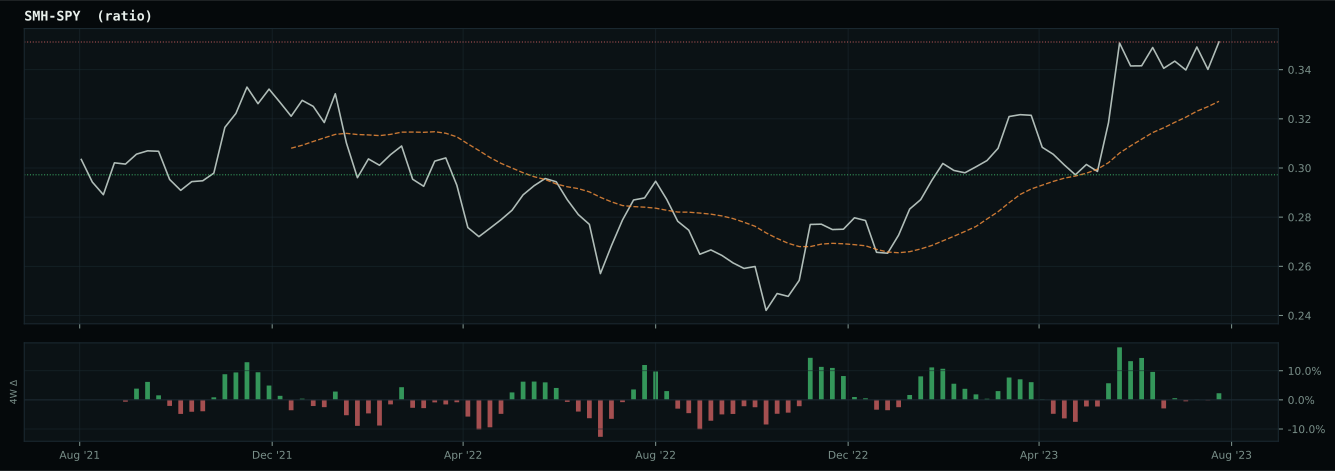
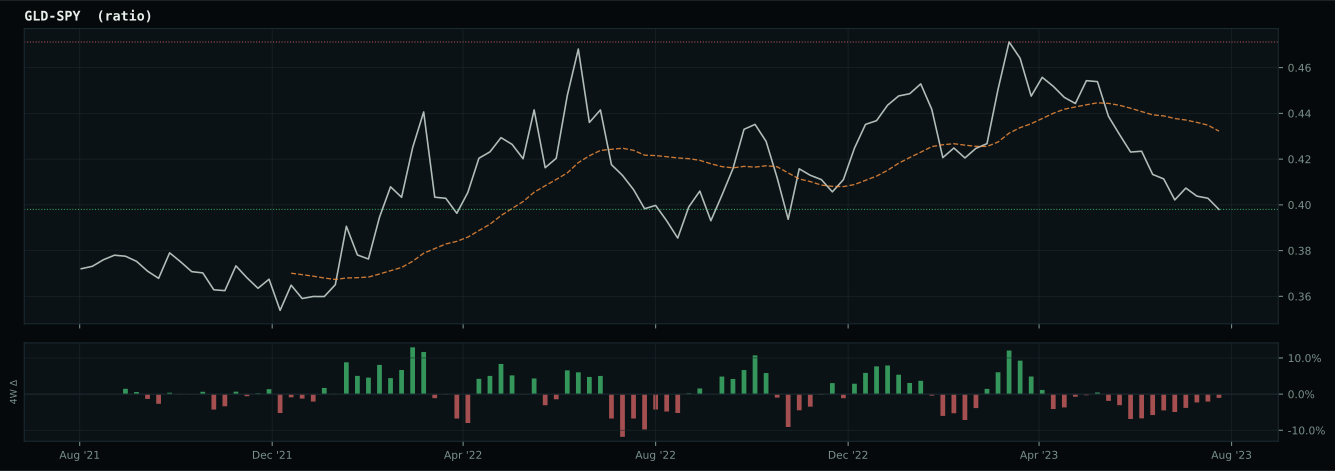
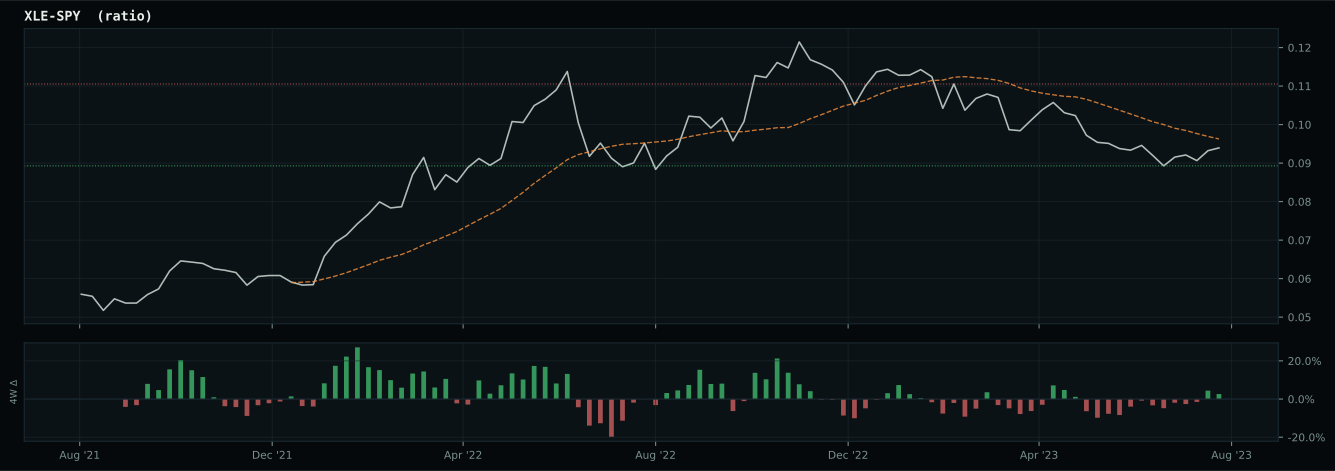
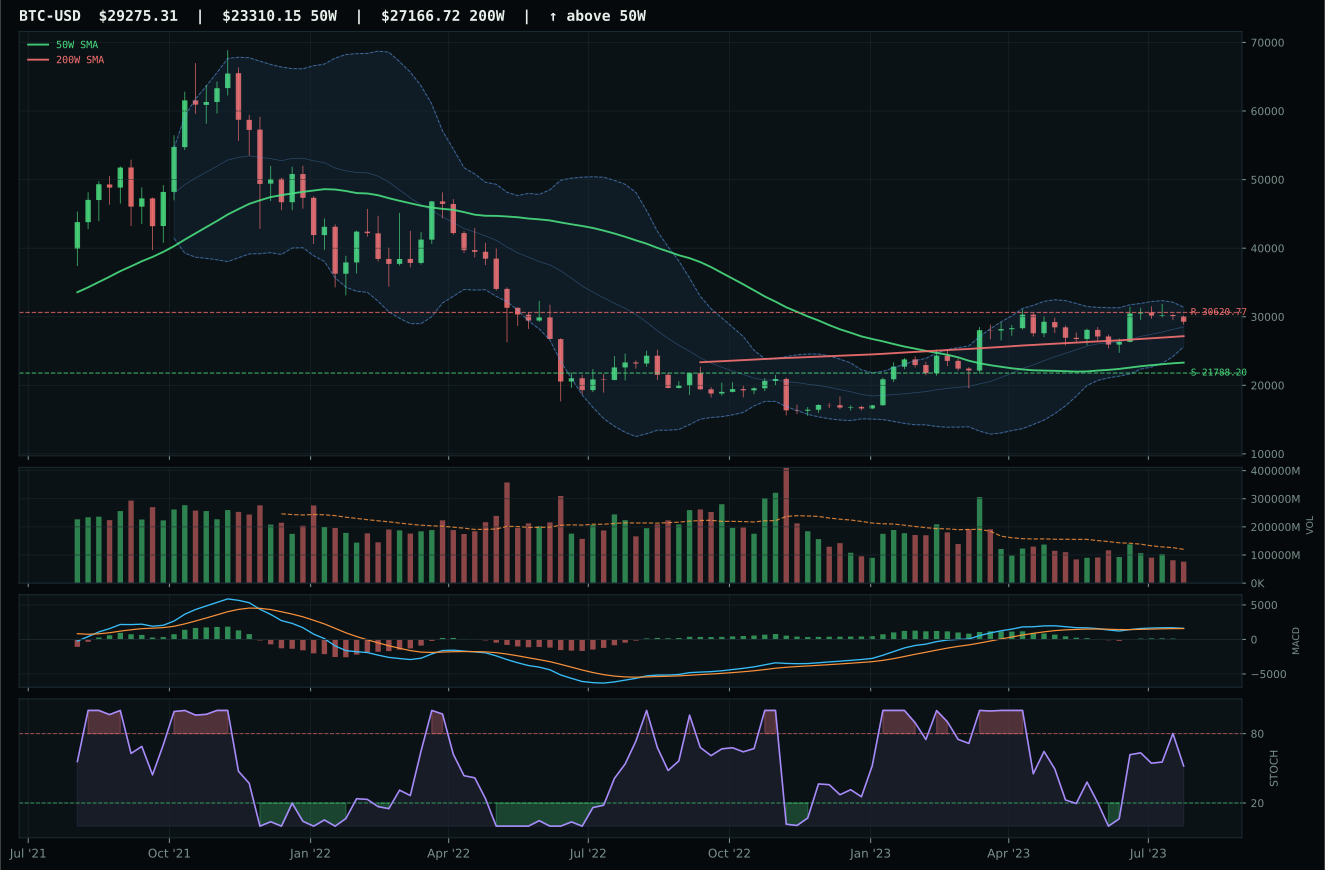
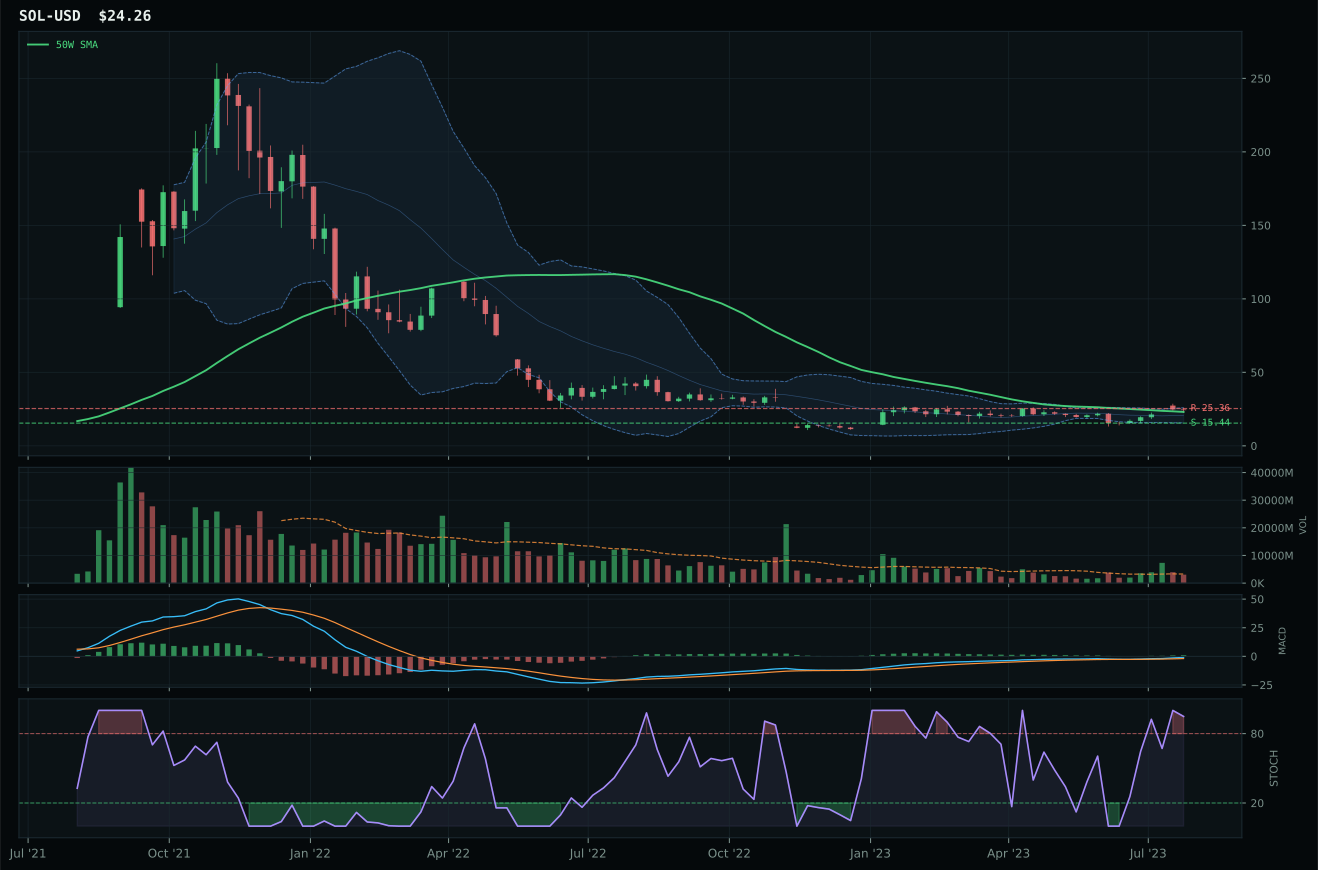
Crypto Regime — TrendBTC
post-touch structure is too wide to count as a range; max/min close ratio is 1.88
TrendBTC confirmed: 2 consecutive closes above rising/flat 50W SMA
one or more available conditions failed
Category Rankings
| Rank | Category | Winner | Score | Alloc | 4W Ret | Peers (4W) |
|---|---|---|---|---|---|---|
| 1 | Industrial Metals | COPX | 64.8 | 20% | -11.54% | PICK -9.9% · REMX -13.9% |
| 2 | Traditional Energy | FCG | 64.3 | 20% | +1.33% | XOP +3.6% · XLE +1.4% |
| 3 | AI | AIQ | 64.0 | 10% | -6.07% | SMH -6.4% · BOTZ -10.4% |
| 4 | Agriculture & Livestock | MOO | 62.1 | 10% | -6.59% | WEAT -10.8% · VEGI -6.9% |
| 5 | Technology | IGV | 59.7 | 10% | -3.34% | CIBR -2.1% · XLK -4.6% |
| 6 | Emerging Markets | ILF | 58.1 | 10% | -6.53% | IEMG -5.7% · INDA -1.6% |
| 7 | Utilities & Infrastructure | XLU | 55.0 | 10% | -5.30% | PAVE -2.0% · IGF -4.8% |
| 8 | Nuclear Energy | URA | 53.5 | 10% | +6.57% | URNM +11.9% · NLR +5.7% |
| 9 | Defense & Aerospace | XAR | 51.4 | 0% | -3.24% | ITA -2.6% · ROKT -3.8% |
| 10 | Precious Metals | GLD | 46.9 | 0% | -2.62% | SLV -1.8% · GDX -7.8% |
Industrial Metals — COPX
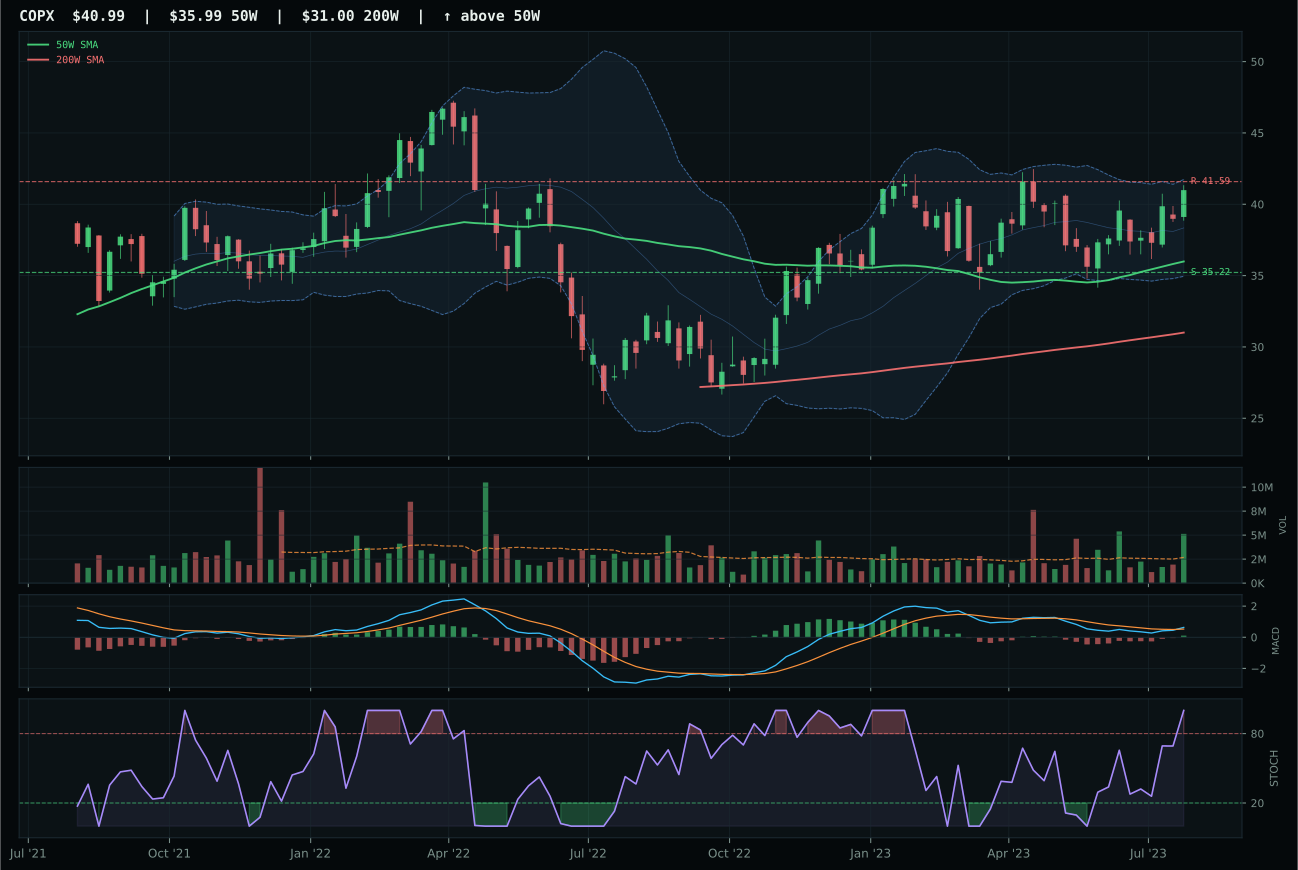
COPX has a neutral structure profile with -6.1% 13-week relative strength versus SPY.
A failed hold above support would weaken the setup.
Actionable but governed by invalidation levels.
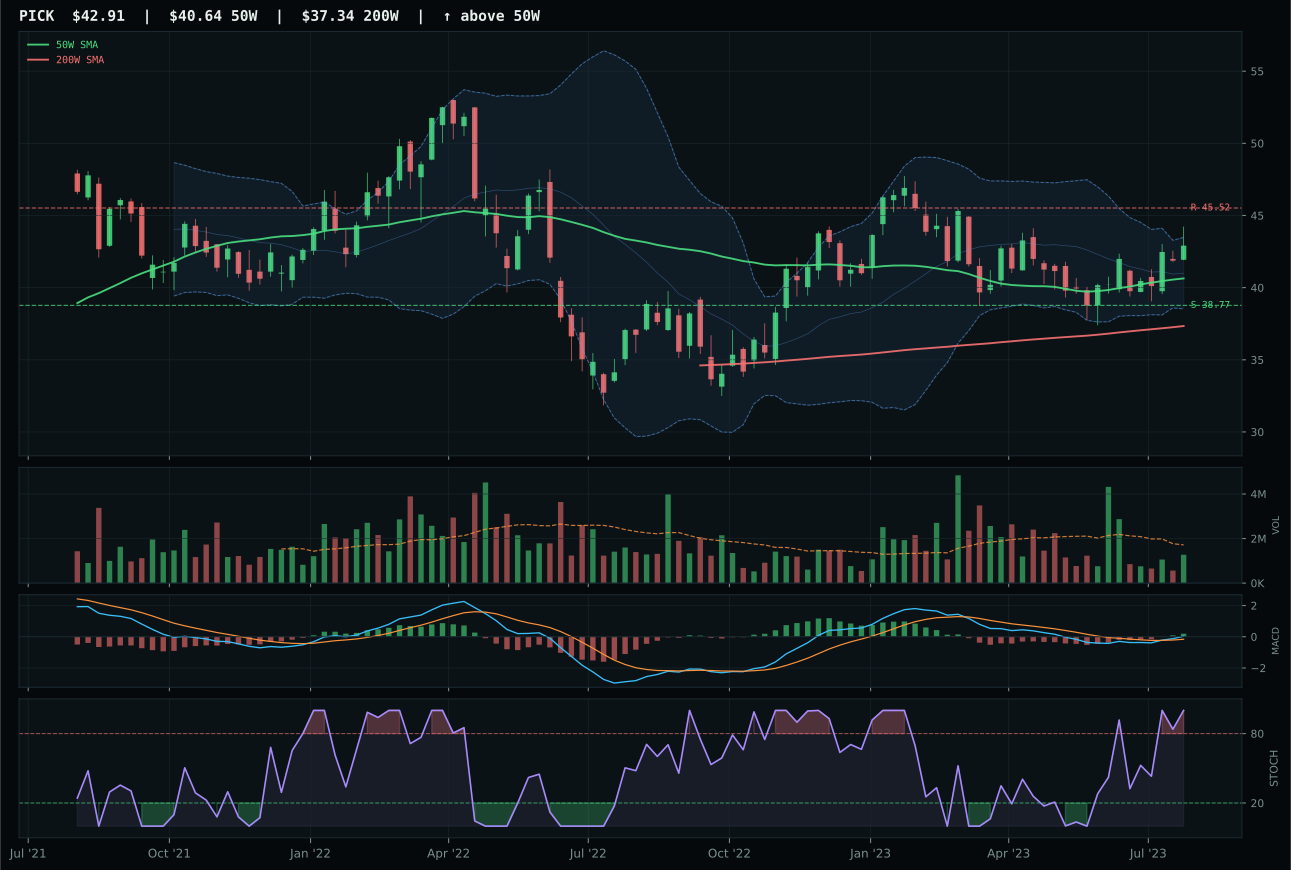
PICK has a neutral structure profile with -5.8% 13-week relative strength versus SPY.
A failed hold above support would weaken the setup.
Actionable but governed by invalidation levels.
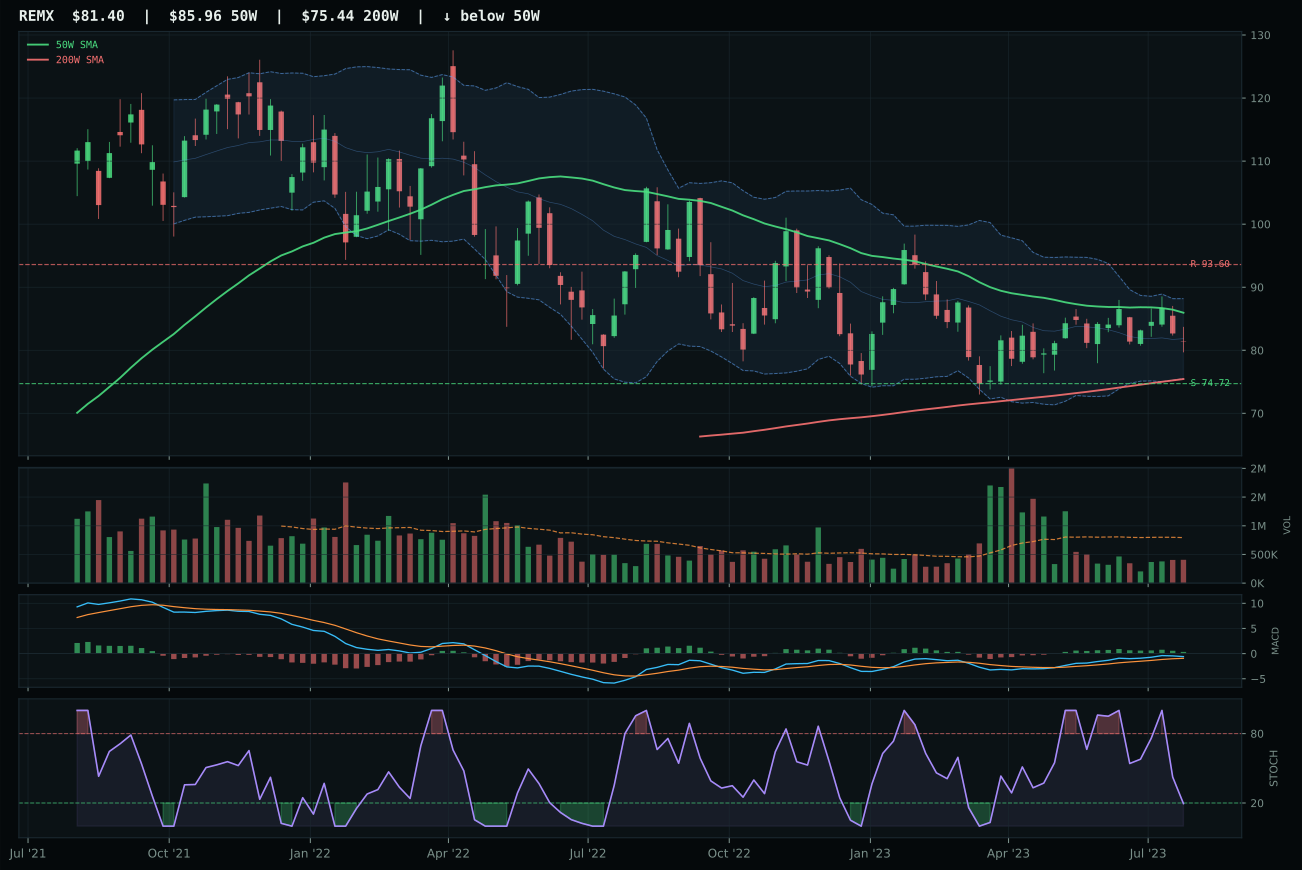
REMX has a neutral structure profile with -7.5% 13-week relative strength versus SPY.
A failed hold above support would weaken the setup.
Actionable but governed by invalidation levels.
COPX wins because its 90.9/100 trend score, driven by price above both major moving averages and a steady 0.5% 50-week slope, combines with 1.92x volume participation—genuine accumulation—to create a setup where buyers are committed despite a neutral structure and modest -6.1% SPY-relative weakness. The 13W return of 3.8% is unspectacular, but the category-relative strength of 0.0% and 4W return of 8.9% reveal that the move is fresh and institutional. PICK, the runner-up, offers superior risk-reward (55 vs 44) and timing (75 vs 59), but its volume is thin participation rather than accumulation, and its structure at 71.6 is notably weaker. Copper's industrial demand signal and the scarcity narrative are real, but they matter only if institutions are willing to frontrun the thesis—and COPX's above-average volume confirms they are. PICK's weak volume suggests they are not.
Industrial Metals earns 10% allocation as a top-2 overweight category with a 64.8 final score. The category-level macro fit of 65.0/100 is the strongest in the portfolio: metals scarcity is valued at +14, commodity breadth positive at +10, real asset sponsorship at +6. Liquidity stress (-8) and credit stress (-7) are present but subordinate. COPX's technical evidence of 86.6/100 is elite, and the macro/narrative fit of 62.0/100 reinforces the category reasoning—this is where real-asset demand, industrial cycle recovery, and scarcity premium converge. The 50% crypto overlay halves the allocation from a nominal 20% to 10%, which is still appropriate given that Industrial Metals' macro fit exceeded Traditional Energy's 59.0. The risk is that a sharp slowdown in manufacturing or a deflationary shock would reverse the entire metals thesis, but in a regime of commodity breadth and energy scarcity, copper's role as both industrial input and monetary proxy makes it an essential portfolio building block.
Traditional Energy — FCG
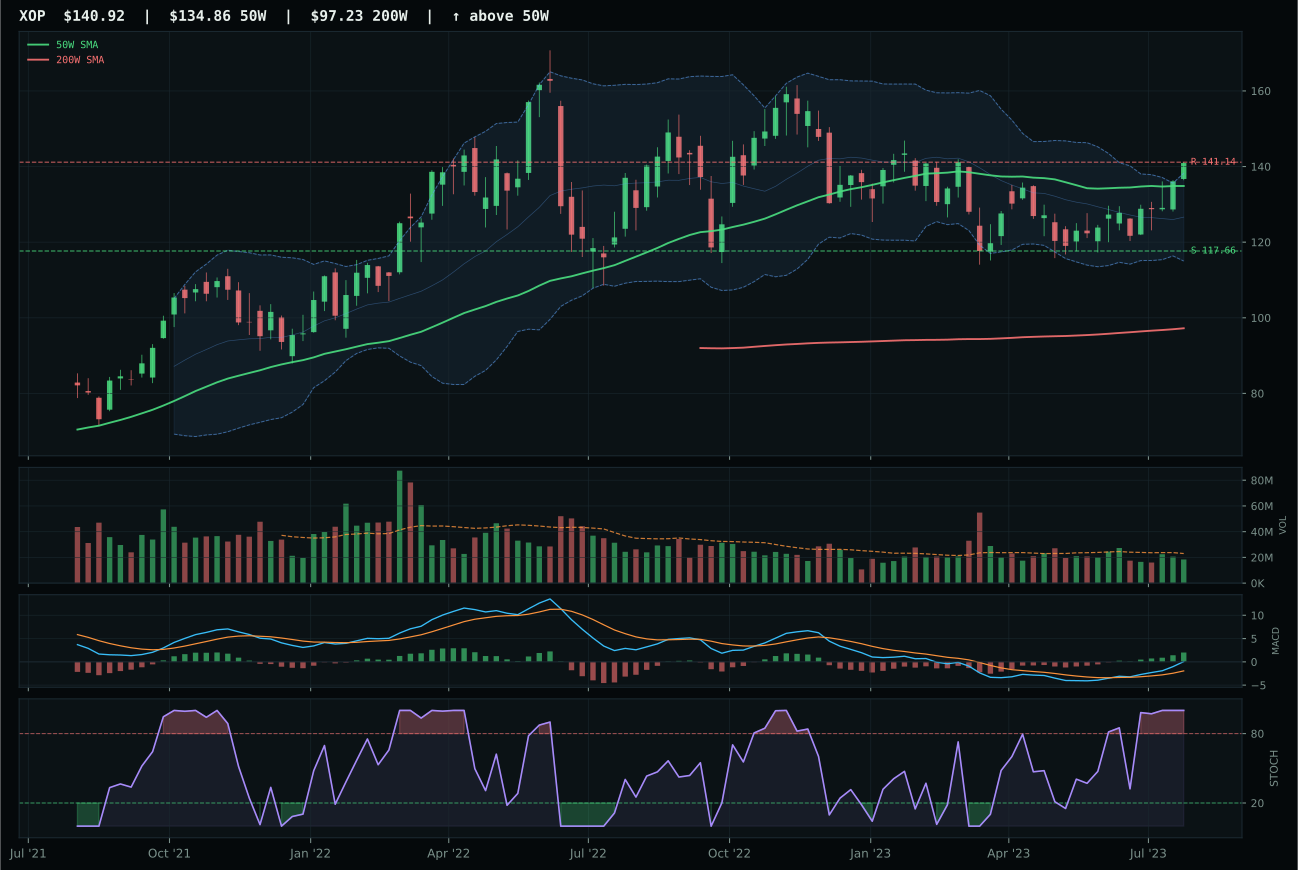
XOP has a neutral structure profile with 1.0% 13-week relative strength versus SPY.
A failed hold above support would weaken the setup.
Actionable but governed by invalidation levels.
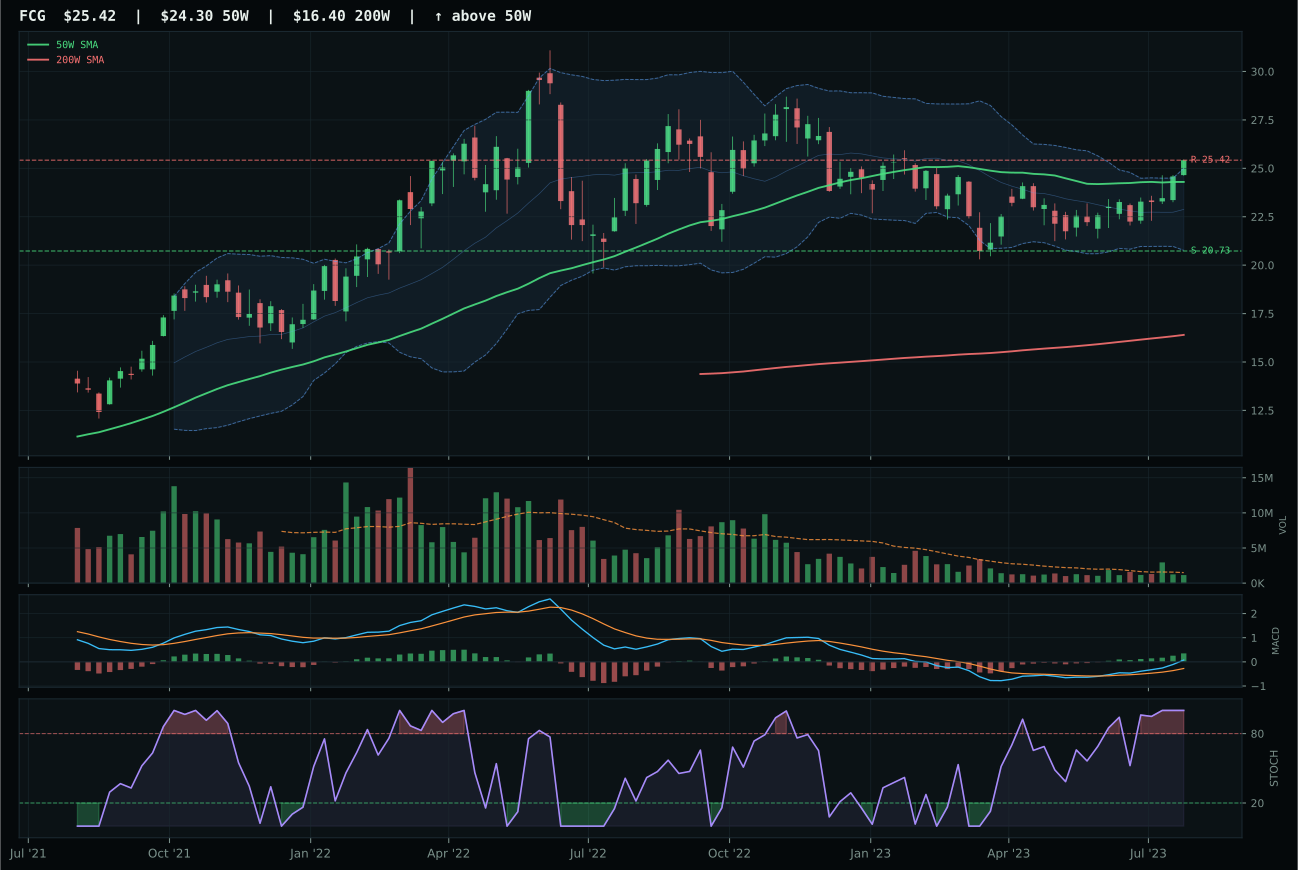
FCG has a neutral structure profile with 0.1% 13-week relative strength versus SPY.
A failed hold above support would weaken the setup.
Actionable but governed by invalidation levels.
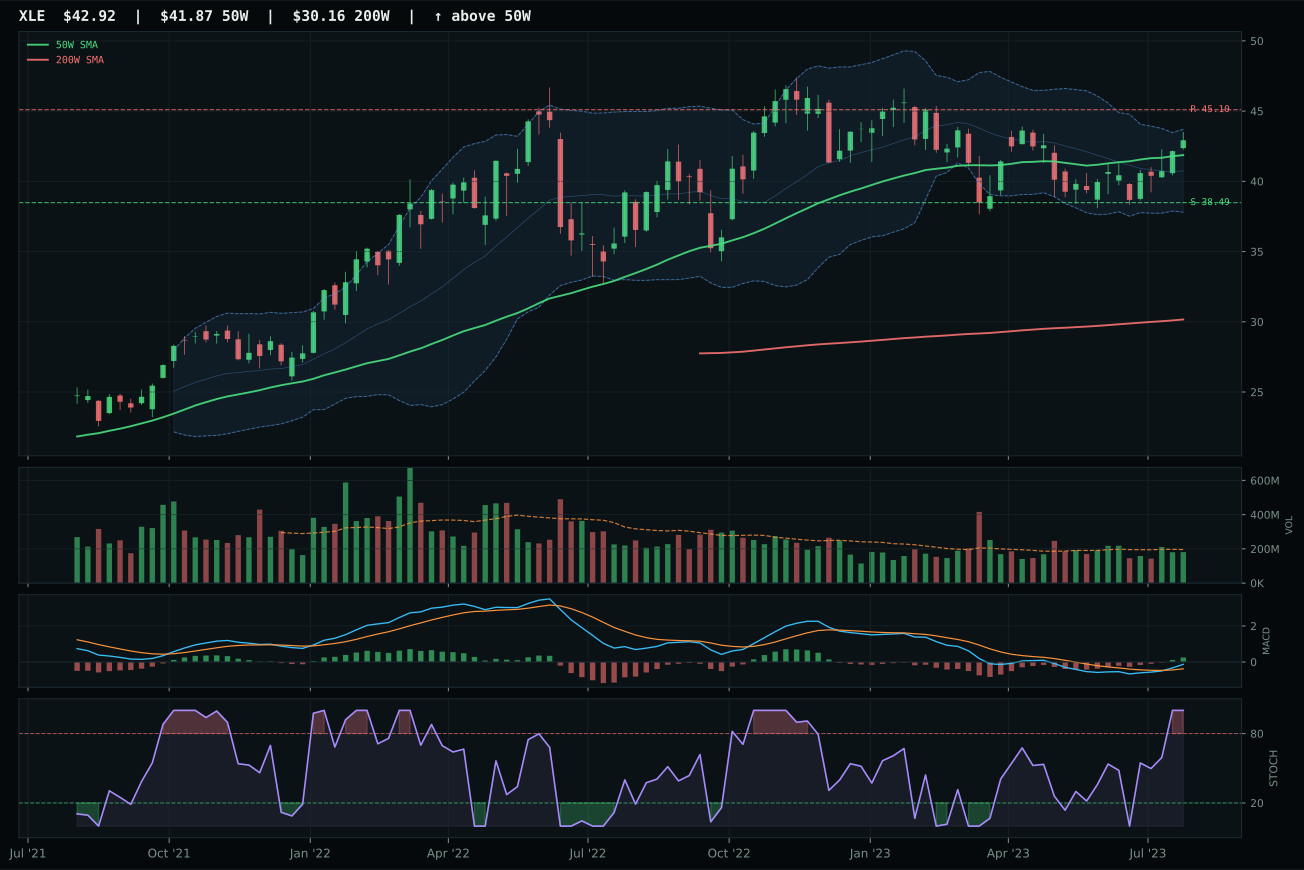
XLE has a compression near 50W profile with -9.0% 13-week relative strength versus SPY.
A failed hold above support would weaken the setup.
Actionable but governed by invalidation levels.
FCG wins a razor-thin contest over XOP, the runner-up, by virtue of superior risk-reward (59.4 vs 53.1) and structure cleanliness (75.4 vs 75.0). Both charts sit in the middle retracement / decision zone with MACD bullish and improving and stochastic RSI overbought, both posting positive 13W returns around 10%, and both posting virtually flat SPY-relative results (FCG +0.1%, XOP +1.0%). The deciding factor is that FCG's neutral volume (0.77x) avoids the distraction of XOP's neutral volume—a wash—while offering better asymmetry: upside to resistance is 0.0% for both, but FCG's downside to support is 22.6% versus XOP's less-defined breakout zone. FCG represents clean energy infrastructure (natural gas and liquefied natural gas), while XOP carries exploration beta; in a regime where energy scarcity is real but not speculative, the steadier thesis wins.
Traditional Energy earns 10% allocation as a top-2 overweight category with a 64.3 final score, tied with Industrial Metals at the tier-2 boundary. The category-level macro fit of 59.0/100 is driven by energy scarcity at +16, real asset sponsorship at +7, offset by credit stress (-7) and liquidity stress (-7). FCG's technical evidence of 82.7/100 and macro/narrative fit of 50.0/100 (neutral due to lack of category-specific descriptors) combine to support the top-2 decision. Energy is allocated identically to Industrial Metals at 10% because both categories offer the rare combination of positive macro momentum—scarcity and commodity breadth—paired with clean technical setups in a Transition / Mixed regime. The 50% overlay reduces both from a nominal 20% to 10%, proportionally. Energy's risk is geopolitical de-escalation or a surprise OPEC production increase; metals' risk is deflationary shocks to industrial demand. Diversifying across both scarcity trades reduces single-point-of-failure risk.
AI — AIQ
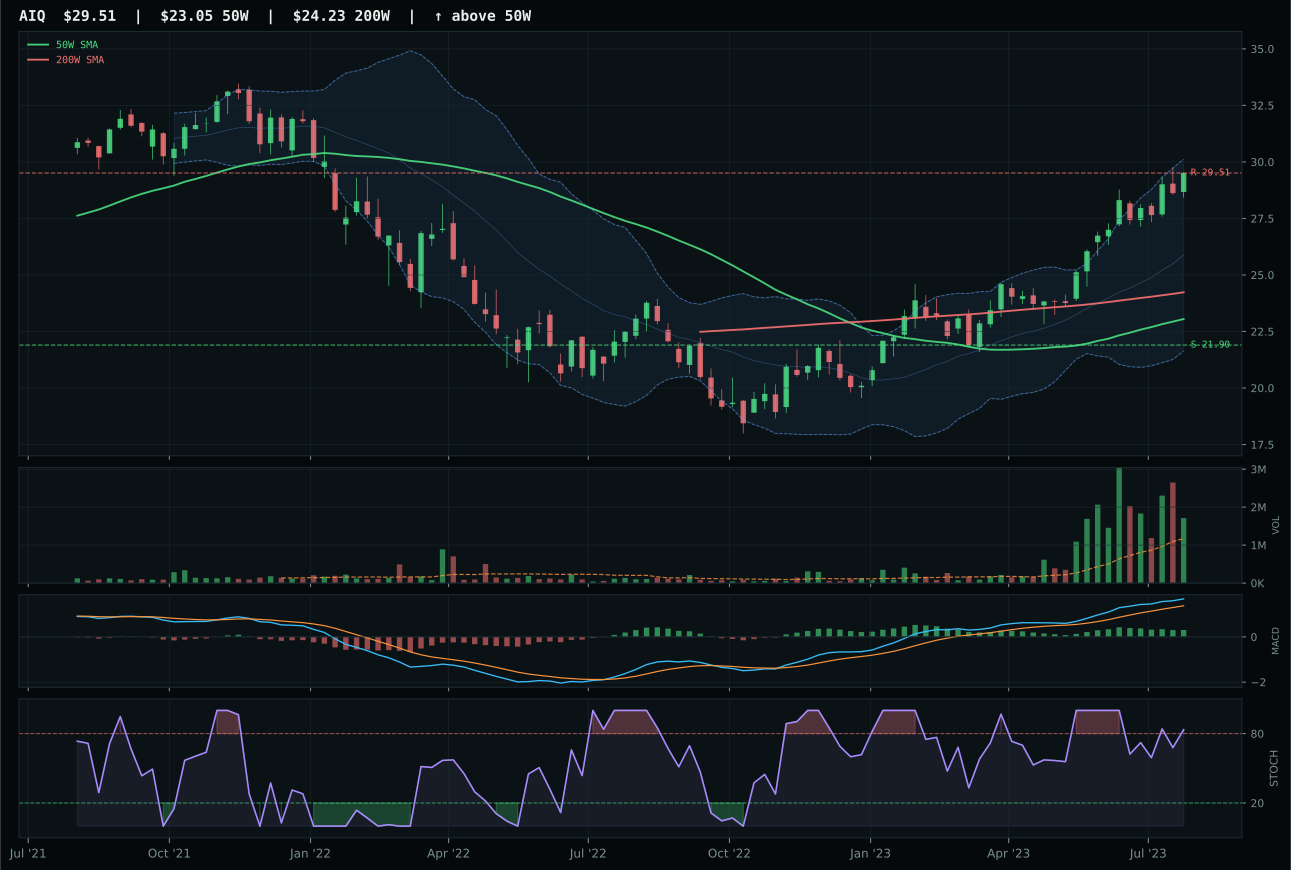
AIQ has a vertical extension profile with 14.0% 13-week relative strength versus SPY.
A failed hold above support would weaken the setup.
Actionable but governed by invalidation levels.
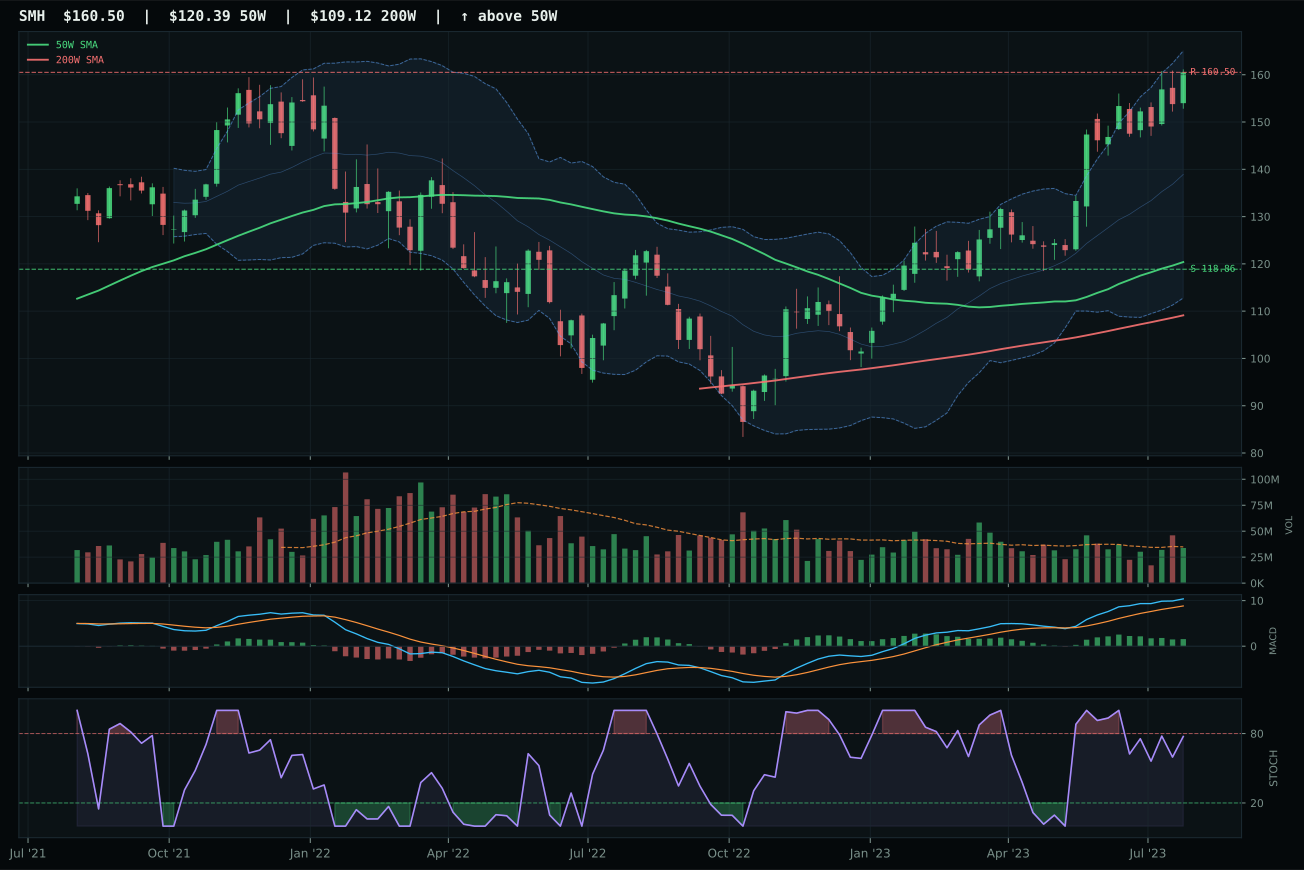
SMH has a vertical extension profile with 20.0% 13-week relative strength versus SPY.
A failed hold above support would weaken the setup.
Actionable but governed by invalidation levels.
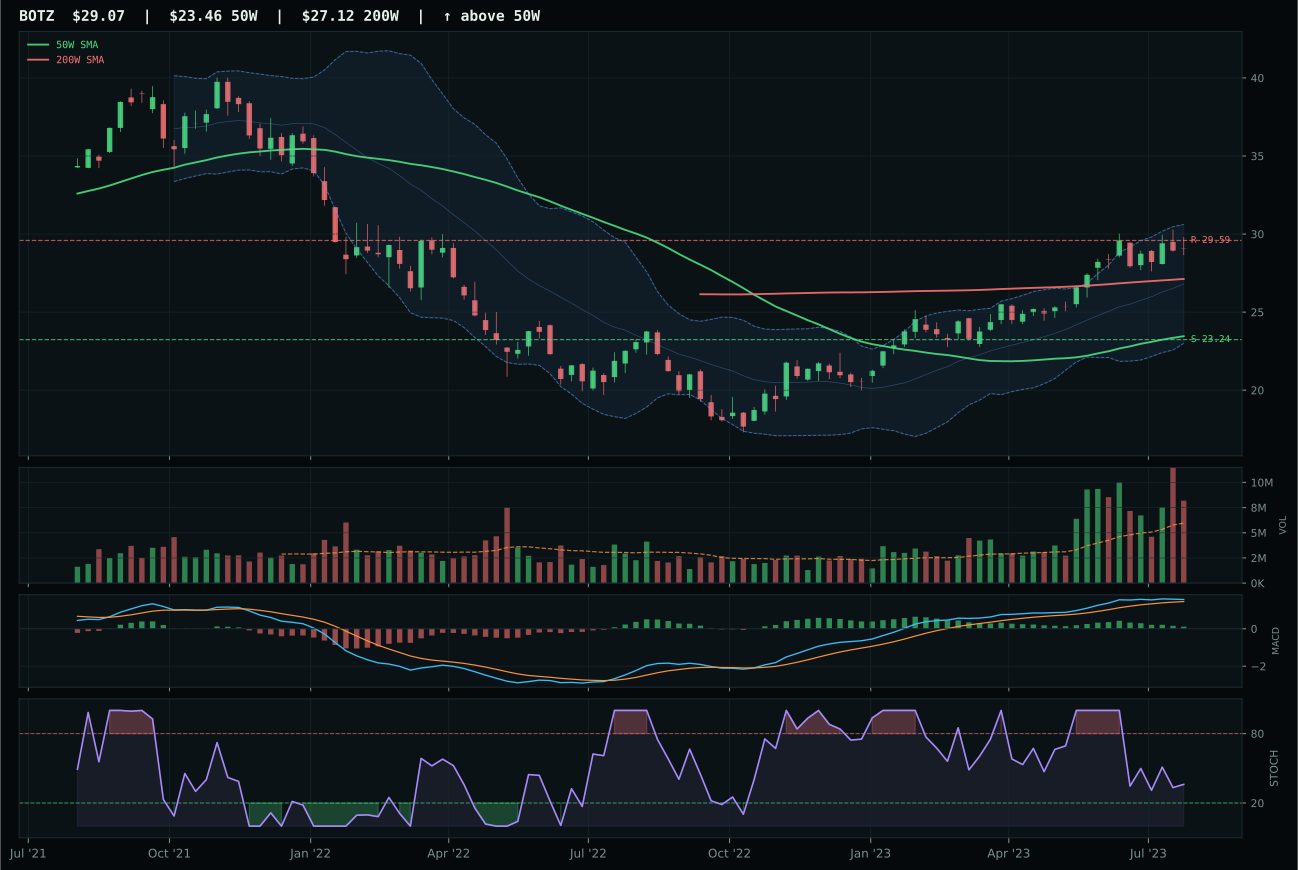
BOTZ has a vertical extension profile with 6.8% 13-week relative strength versus SPY.
A failed hold above support would weaken the setup.
Actionable but governed by invalidation levels.
AIQ wins because its 14.0% SPY-relative strength and 1.46x volume participation signal genuine accumulation rather than casual momentum chasing. The 23.8% 13-week return with a category-relative flat 0.0% result shows AIQ is moving in step with peer leadership—not leading the charge, but not lagging either. SMH, the runner-up, actually posted a stronger 20.0% SPY-relative return and 29.8% 13-week performance, yet lost the category decision because it trades 33.3% above its 50-week moving average versus AIQ's 28.0%, and its volume confirmation is neutral rather than above-average. That extension difference is critical: SMH's higher absolute momentum comes with higher absolute reentry risk, and the neutral volume behind it suggests institutions are not aggressively defending the higher levels.
AI earns 5% allocation as a tier-2 holding, rank 3 among the 10 categories, with a 64.0 final score. SMH ranked ahead in the category reasoning layer at 65.5, and BOTZ at 64.9, yet AIQ's 64.3 technical evidence combined with its superior structure (79.5 vs 72.8) and above-average volume confirmation pushed it to the representative slot. The macro/narrative fit of 54.0/100 reflects offsetting forces: +14 for AI growth sponsorship and +10 for risk appetite positive are powerful, but -12 for active liquidity stress and -8 for credit stress act as headwinds. The category itself ranks tier-2 because two higher-scoring categories (Industrial Metals at 64.8 and Traditional Energy at 64.3) edge it out by decimal margins; AIQ would need a decisive break to new highs on expanding volume or a fresh wave of macro risk-appetite confirmation to vault into the top-2 allocation tier.
Agriculture & Livestock — MOO
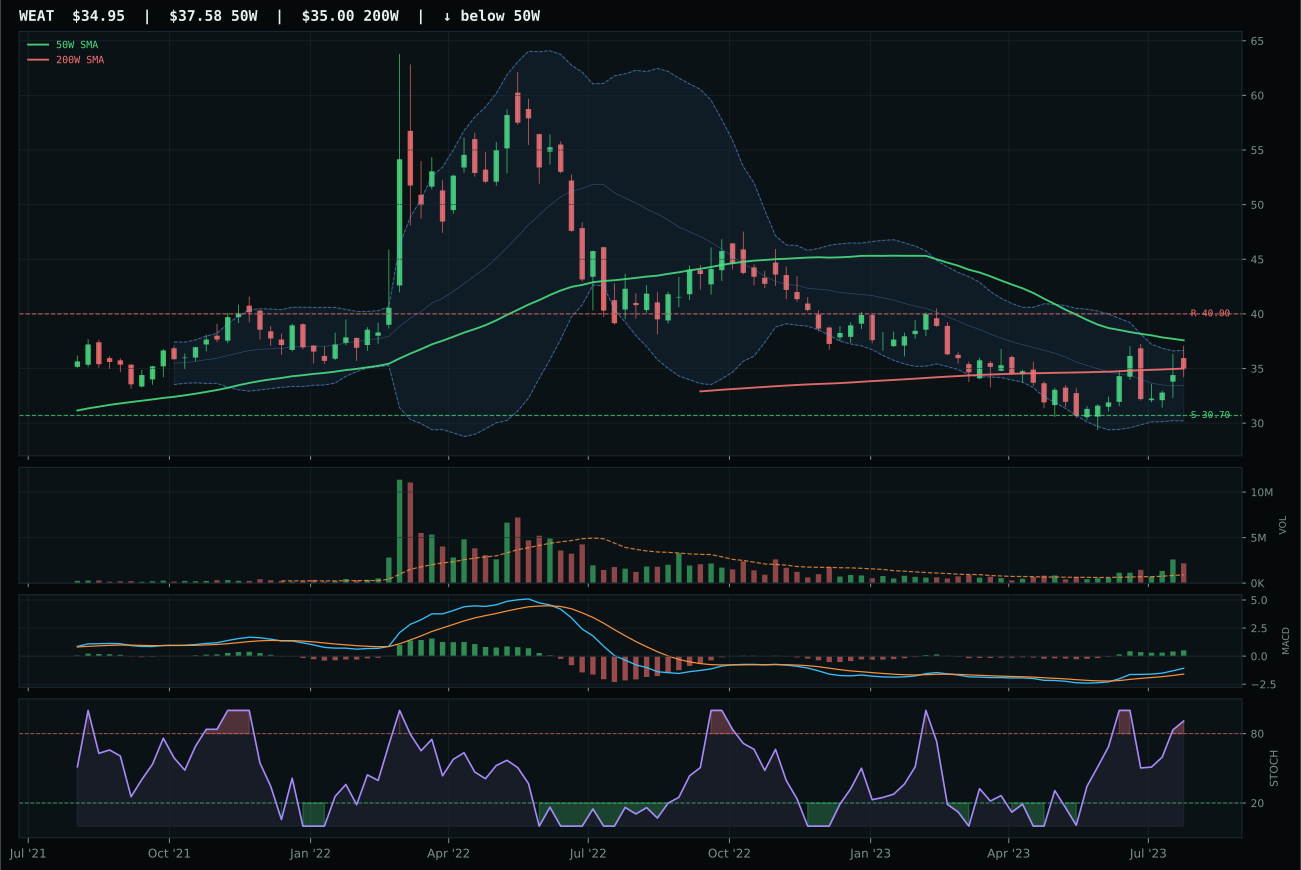
WEAT has a neutral structure profile with -0.3% 13-week relative strength versus SPY.
A failed hold above support would weaken the setup.
Actionable but governed by invalidation levels.
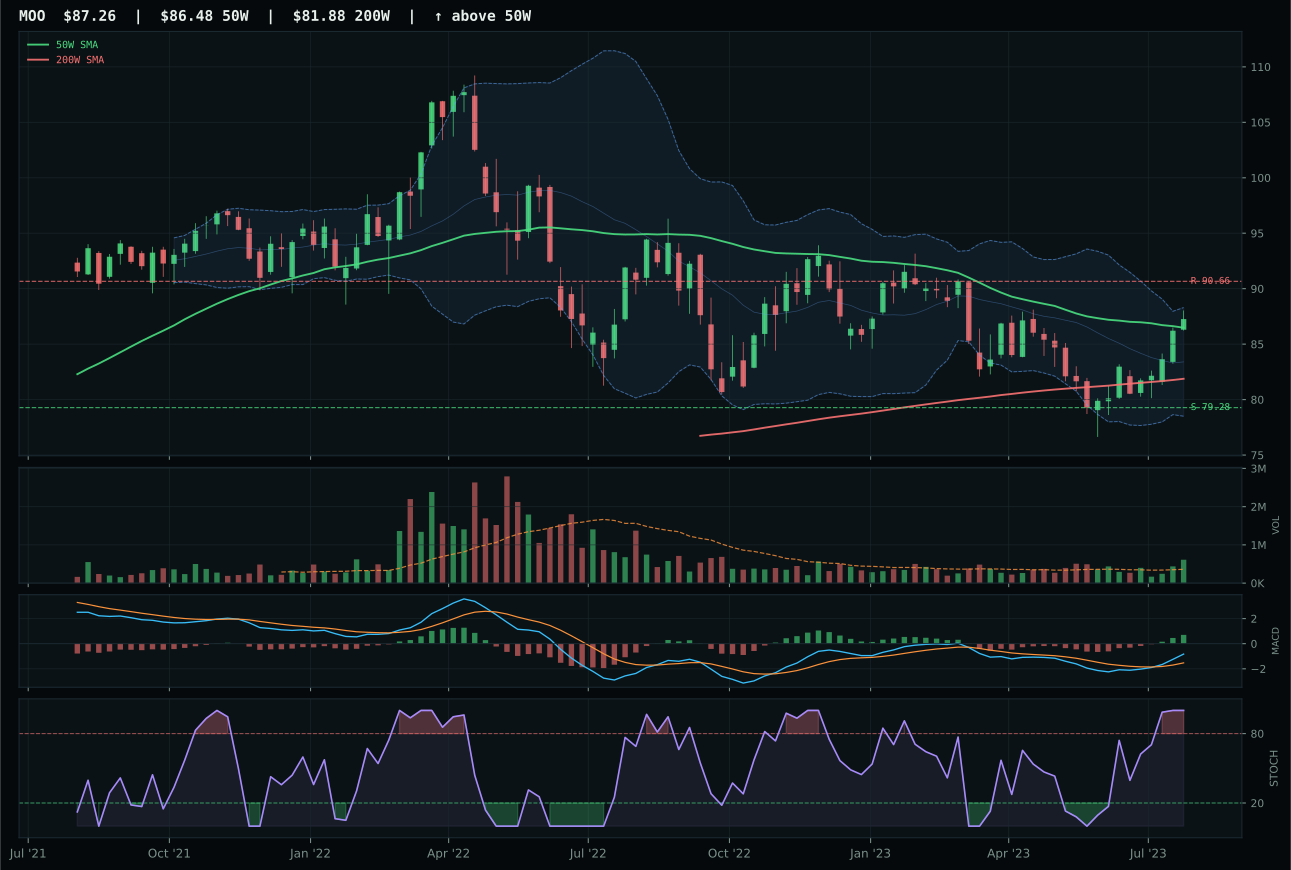
MOO has a compression near 50W profile with -7.7% 13-week relative strength versus SPY.
A failed hold above support would weaken the setup.
Actionable but governed by invalidation levels.
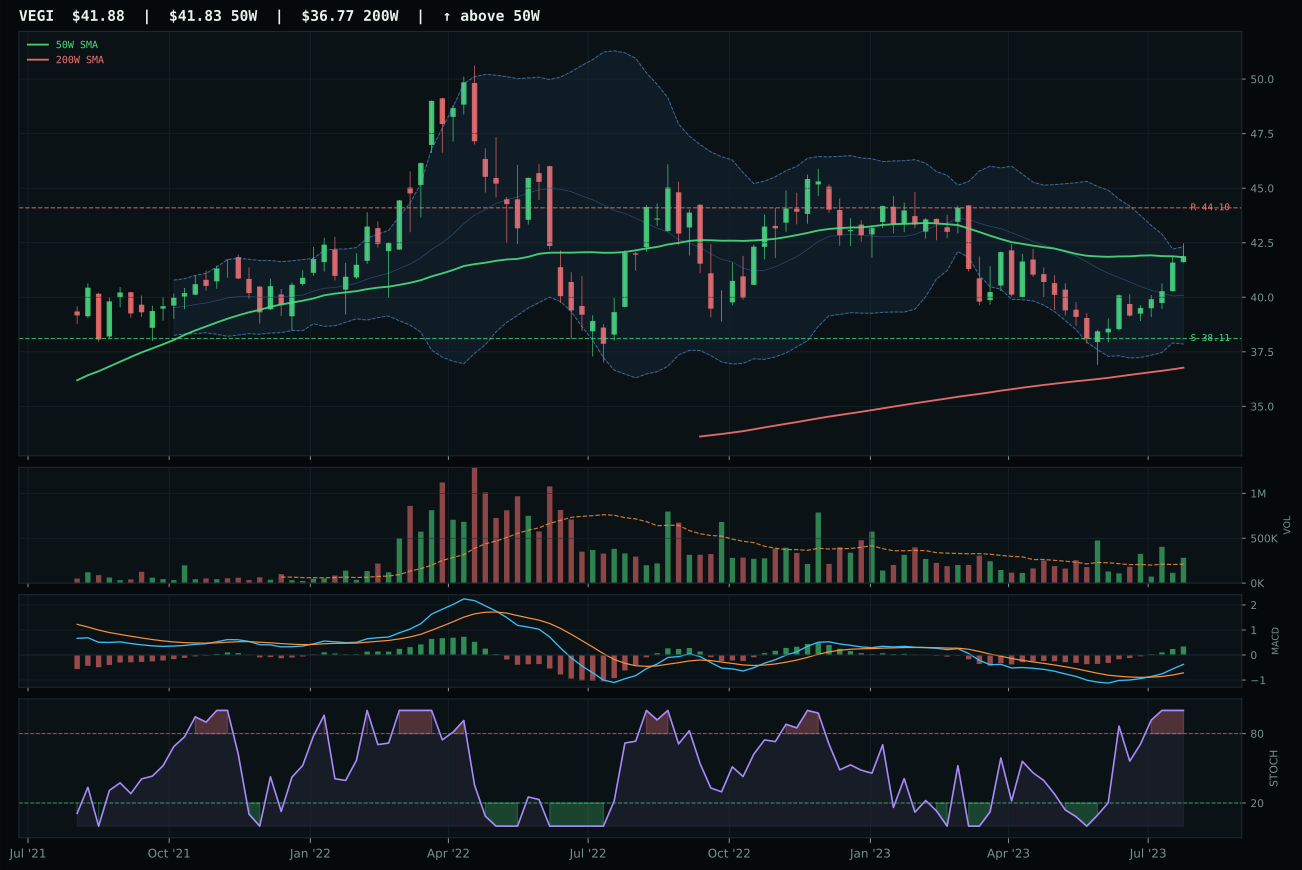
VEGI has a compression near 50W profile with -7.0% 13-week relative strength versus SPY.
A failed hold above support would weaken the setup.
Tracked, but not top-2 eligible because: .
MOO wins with a perfect 100.0/100 timing score because the chart is compressing near the 50-week moving average at just 0.9% distance, positioned in the middle retracement zone near Fib 0.500, with MACD bullish and improving and stochastic RSI overbought. This is not a chase; it is a coil that can expand in either direction. Volume at 1.69x confirmation levels suggests institutional positioning ahead of a potential move. WEAT, the runner-up, posts a superior 13W return of 9.6% and a neutral -0.3% SPY-relative result, but its timing score dropped to 75.0 because it sits in the deep retracement / value zone (Fib 0.618 at 36.70), meaning it is a value play rather than a setup with defined breakout potential. MOO's structure at 83.9/100 also edges WEAT's 81.8, driven by the compression setup near the 50W that reduces ambiguity about the next direction.
Agriculture & Livestock earns 5% allocation as a tier-2 holding, rank 3 among the 10 categories, with a 62.1 final score that trails Industrial Metals and Traditional Energy. The category-level macro fit of 59.0/100 benefits from real asset sponsorship (+8) and commodity breadth positive (+5), but liquidity stress (-4) remains a modest drag. MOO's technical evidence of 84.8/100 is the strongest in the portfolio, reflecting its clean compression setup and above-average volume confirmation, yet the category reasoning layer weighted that 62% technical evidence against 38% macro/narrative fit. The position size reflects the technical strength of the setup combined with a macro regime that rewards real assets, but not with conviction: risk appetite remains conditional, and if commodity flows reverse or agricultural supply surprises, the category's real-asset thesis becomes fragile. A shift to macro expansion or explicit energy scarcity would propel this into top-2 allocation.
Technology — IGV
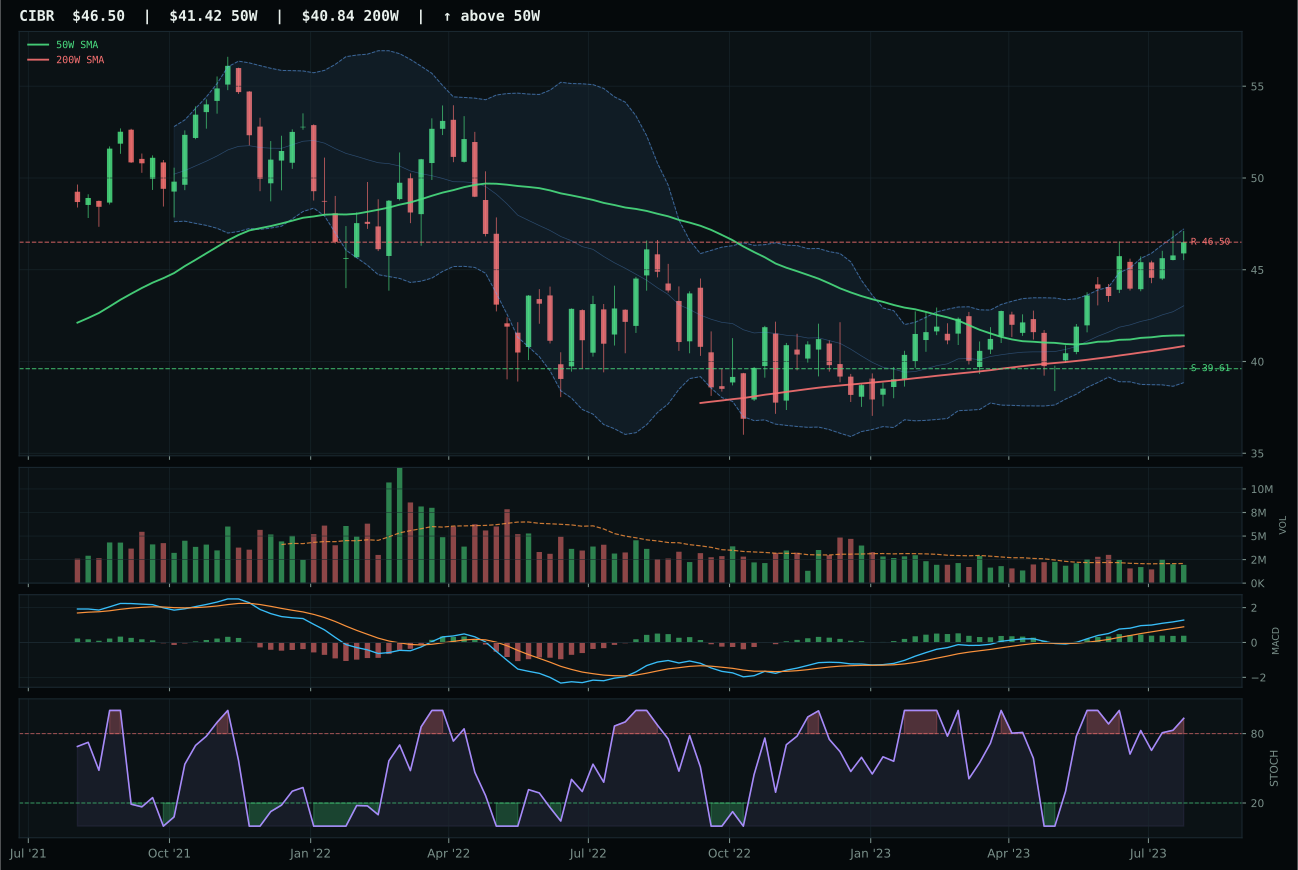
CIBR has a neutral structure profile with 7.1% 13-week relative strength versus SPY.
A failed hold above support would weaken the setup.
Actionable but governed by invalidation levels.
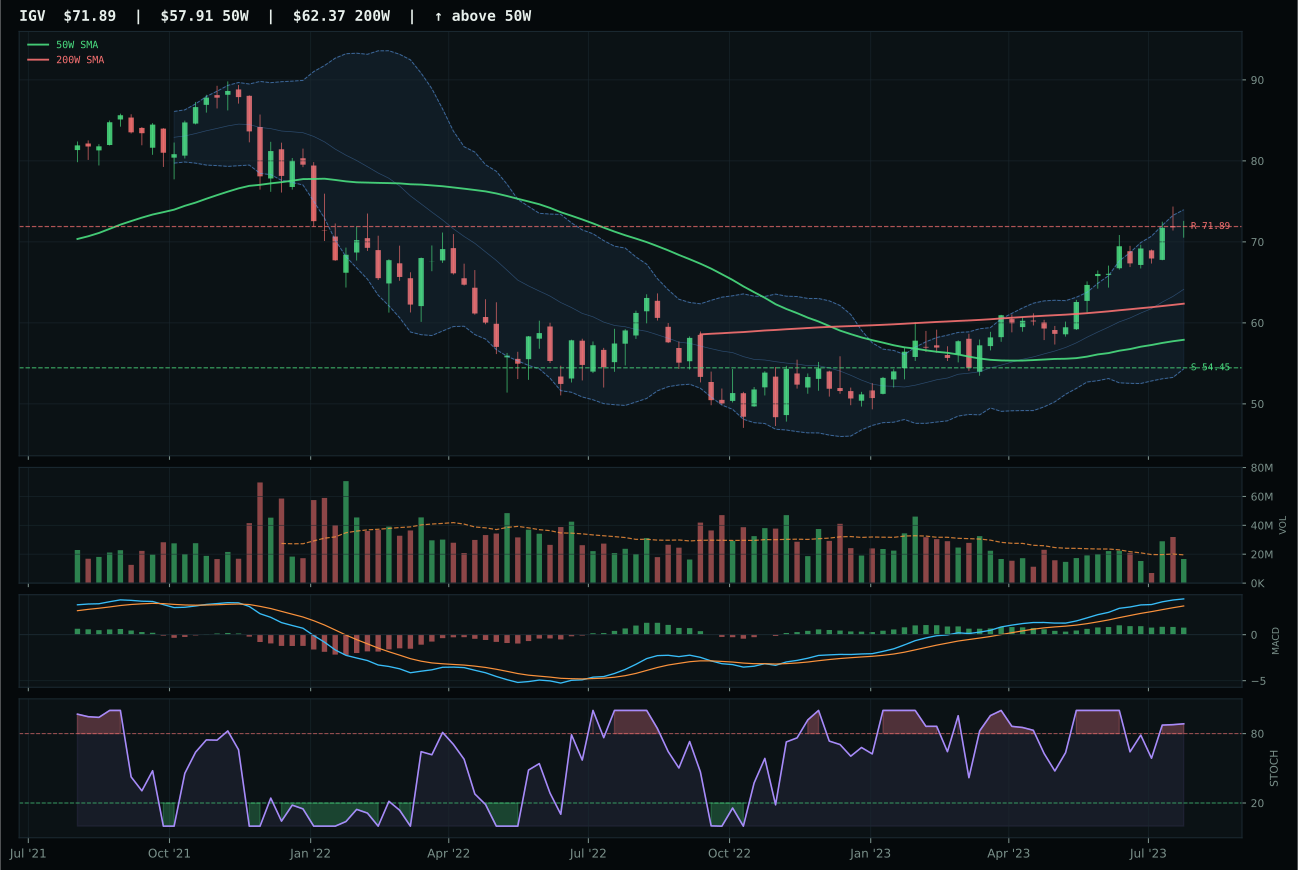
IGV has a vertical extension profile with 11.4% 13-week relative strength versus SPY.
A failed hold above support would weaken the setup.
Actionable but governed by invalidation levels.
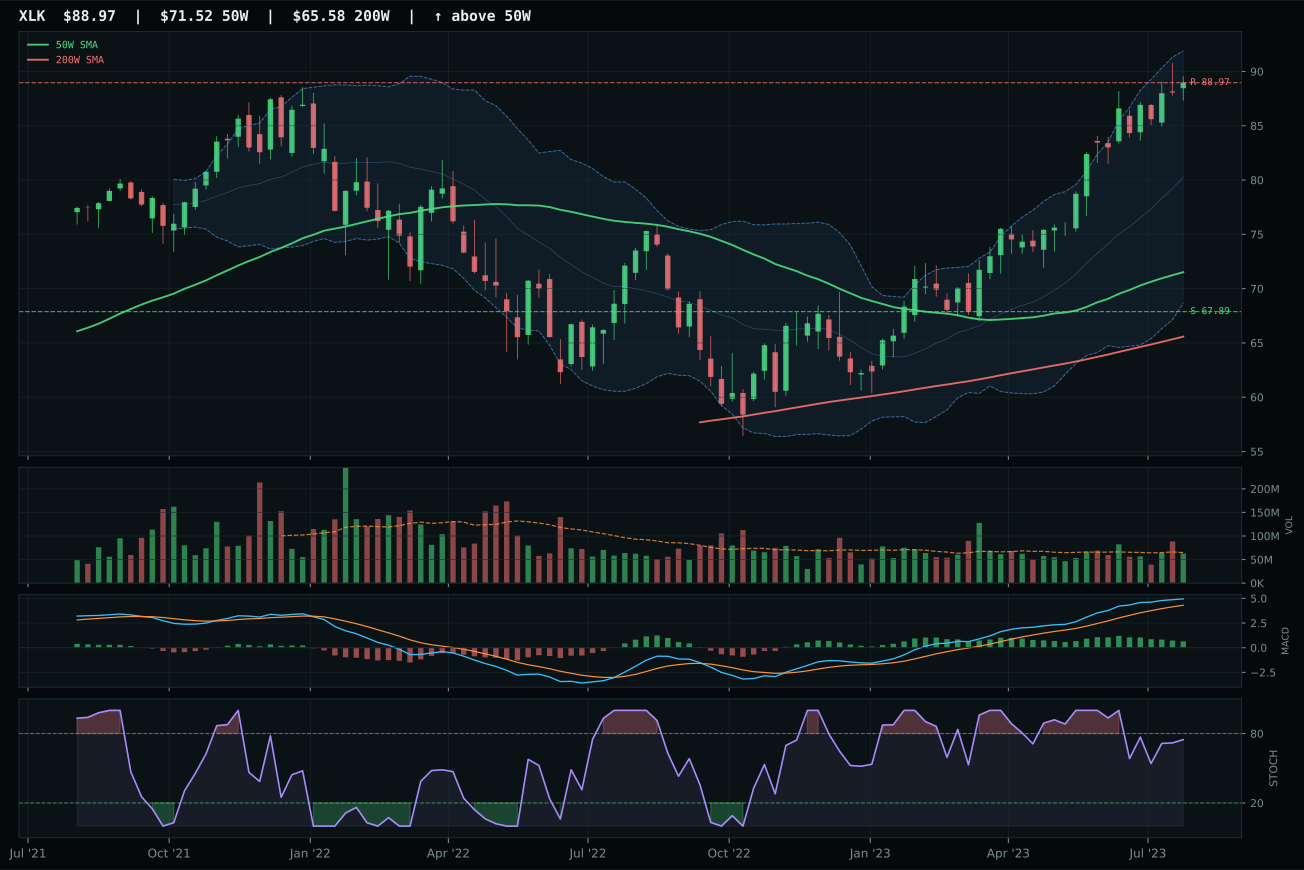
XLK has a vertical extension profile with 8.1% 13-week relative strength versus SPY.
A failed hold above support would weaken the setup.
Actionable but governed by invalidation levels.
IGV wins the category because its 11.4% relative strength versus SPY and 3.3% category-relative outperformance demonstrate genuine institutional sponsorship in a field of extended momentum plays. The chart sits 24.1% above the 50-week moving average with volume at neutral participation, meaning every new entry into enterprise software is arriving late to a move that has already captured its early-adopter premium. CIBR, the runner-up, posted only 7.1% SPY-relative strength and a negative 1.0% category-relative result, a meaningful gap that reflects weaker institutional appetite for cybersecurity as a subtheme. IGV's MACD is bullish but flattening and stochastic RSI sits at 0.88, confirming the momentum is real but decelerating—the kind of setup where fresh buyers are thin and mean-reversion risk is asymmetric to the downside.
Technology earns 5% allocation as a tier-2 holding, rank 3 among the 10 categories, because the 59.7 category score trails both Industrial Metals and Traditional Energy. The regime—Transition / Mixed—offers no tailwind to growth; credit stress and liquidity stress actively penalize duration-sensitive assets, offsetting the +6 boost from AI growth sponsorship. IGV's technical evidence of 67.1/100 is solid but its macro/narrative fit of only 39.0/100 reveals the tension: strong trend and relative strength collide with a macro environment where risk appetite remains conditional and credit conditions are tightening. For this category to move into top-2, either the macro regime would need to shift decisively into expansion mode, or an external shock would need to reset valuations and pull in fresh capital at lower entry points. Until then, the 5% position acknowledges the strength of the setup while respecting the hostile macro backdrop.
Emerging Markets — ILF
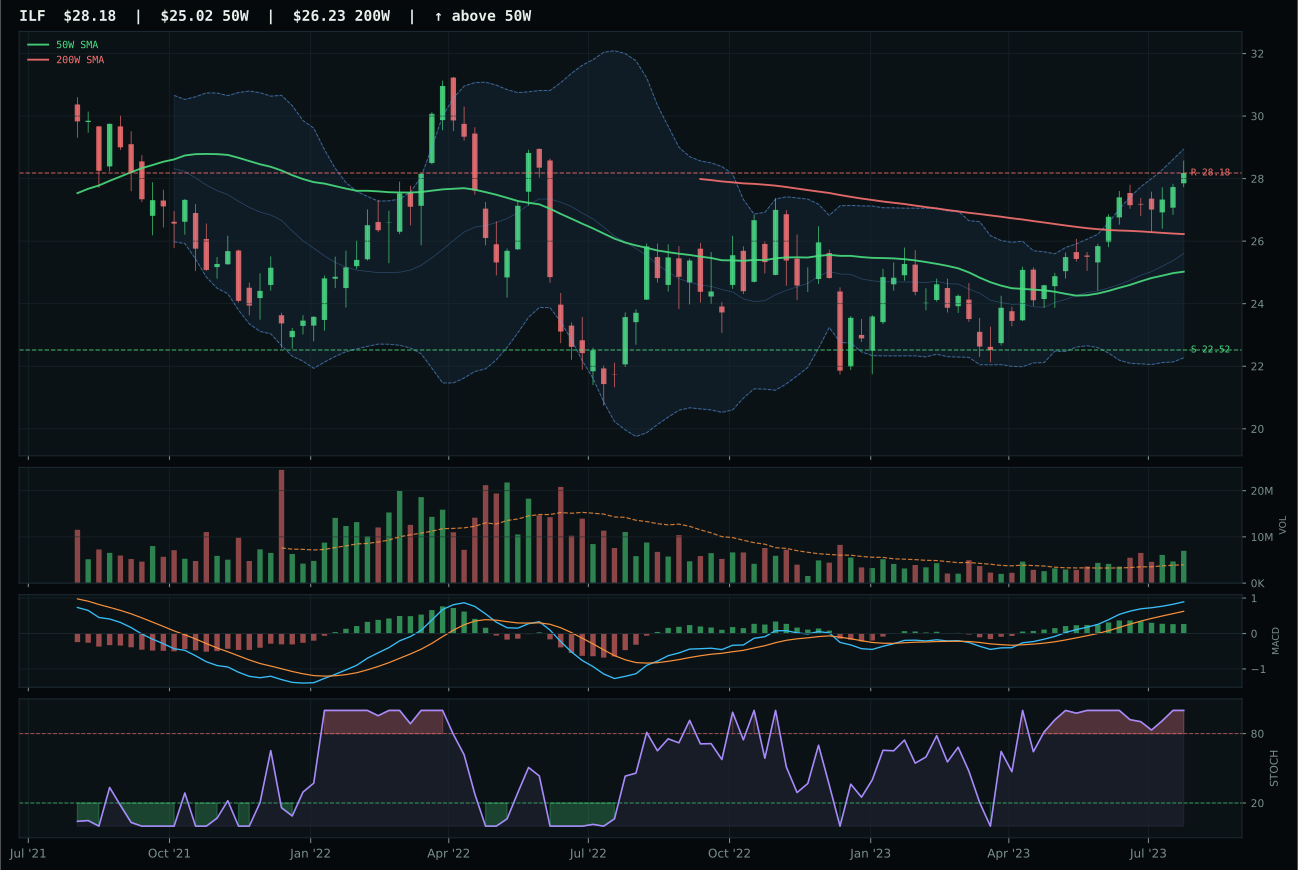
ILF has a neutral structure profile with 4.7% 13-week relative strength versus SPY.
A failed hold above support would weaken the setup.
Actionable but governed by invalidation levels.
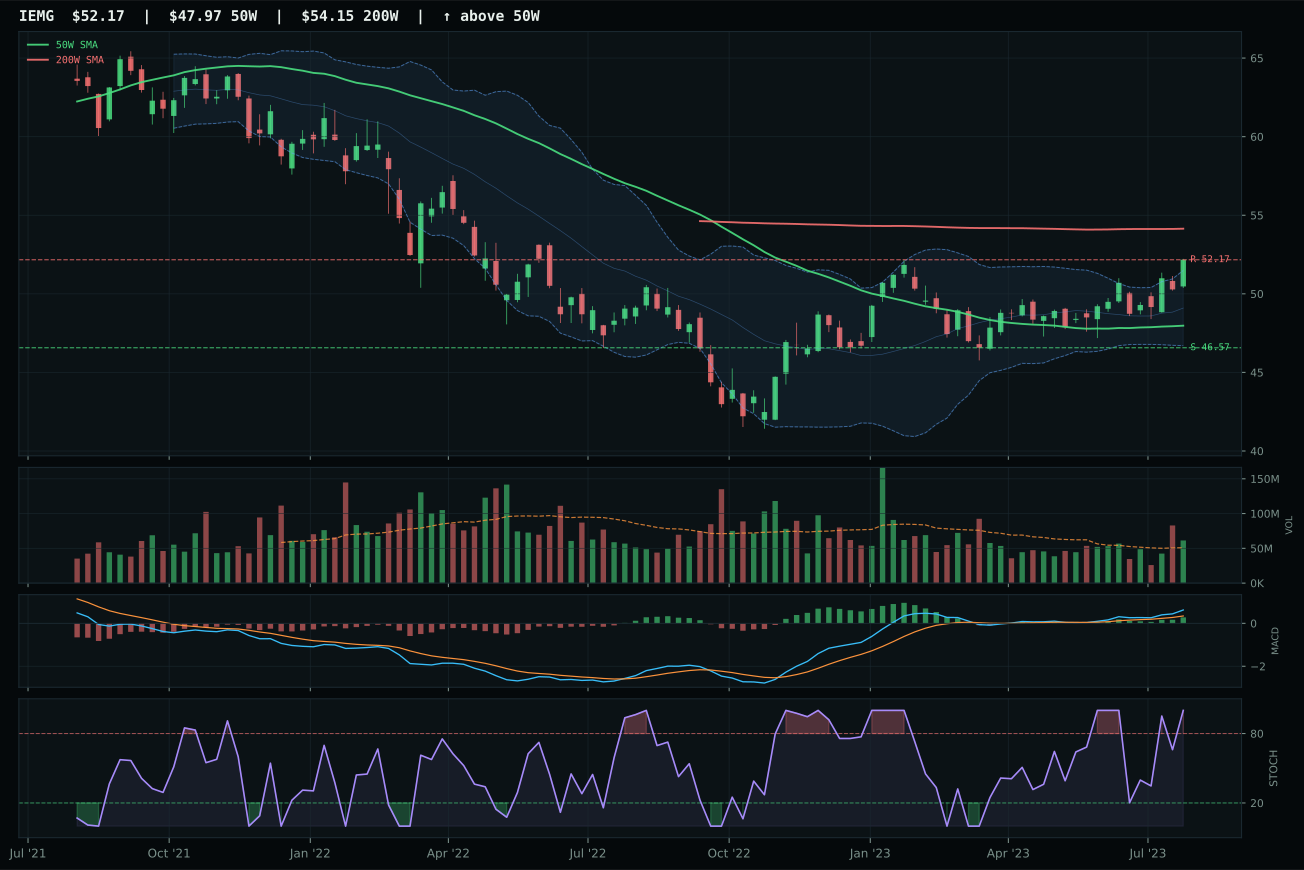
IEMG has a neutral structure profile with -2.5% 13-week relative strength versus SPY.
A failed hold above support would weaken the setup.
Actionable but governed by invalidation levels.
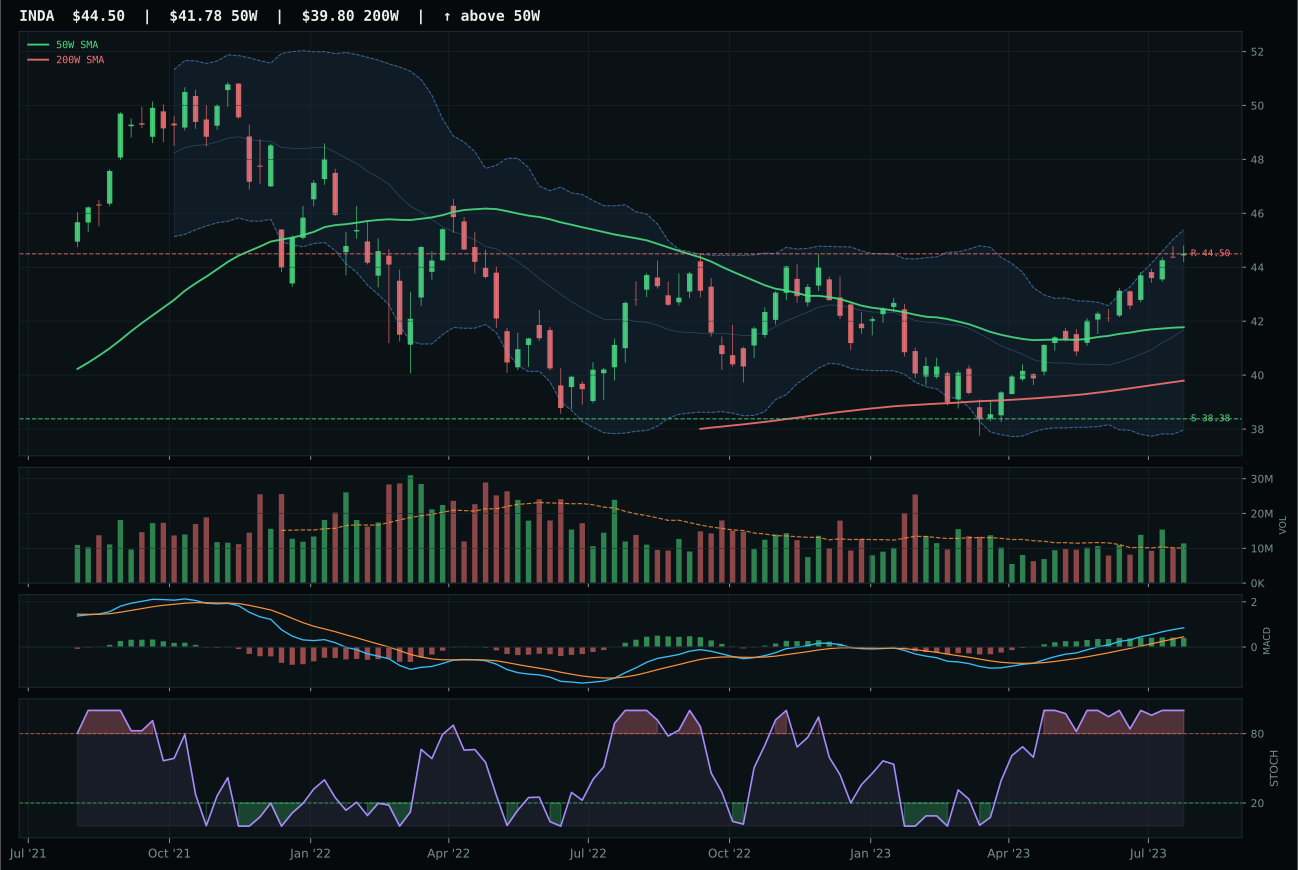
INDA has a neutral structure profile with -1.6% 13-week relative strength versus SPY.
A failed hold above support would weaken the setup.
Actionable but governed by invalidation levels.
ILF wins decisively over IEMG with a 6.4% category-relative outperformance and a 14.6% 13W return driven by 1.76x accumulation volume. The chart sits 12.6% above the 50W in the near 52W high / extension zone with MACD bullish but flattening and stochastic RSI overbought—momentum is real and recent. IEMG, the broader emerging-market exposure, posted a weaker 7.4% 13W return with only above-average participation volume, and its -2.5% SPY-relative result confirms that broad emerging-market beta is losing ground to direct commodity and value plays. ILF's Latin America tilt—copper, agriculture, energy—aligns with the scarcity and real-asset tailwinds; IEMG's breadth exposure lacks that specific conviction. The volume-price confirmation gap (93.8 for ILF vs 67.0 for IEMG) is the decisive technical edge.
Emerging Markets earns 5% allocation as a tier-2 holding, rank 3 among the 10 categories, with a 58.1 final score. The category-level macro fit of only 38.0/100 is the weakest in the portfolio, reflecting -10 for both credit stress and liquidity stress, offset partially by +8 for risk appetite positive. ILF's technical evidence of 94.0/100 is elite—among the highest in the entire portfolio—yet the macro/narrative fit of 54.0/100 (driven by commodity breadth positive at +8, metals scarcity at +5, real asset sponsorship at +6) cannot overcome the category's macro headwinds. The allocation reflects a bet that ILF's specific commodity and value tilt within emerging markets will outperform despite broader EM weakness. Credit and liquidity stress actively penalize currency risk and external debt, making broad emerging-market exposure dangerous; ILF's focused commodity beta avoids that trap. To move into top-2, Emerging Markets would need either an explicit shift in portfolio risk appetite toward currency diversification, or a macro pivot that relaxes credit and liquidity concerns.
Utilities & Infrastructure — XLU
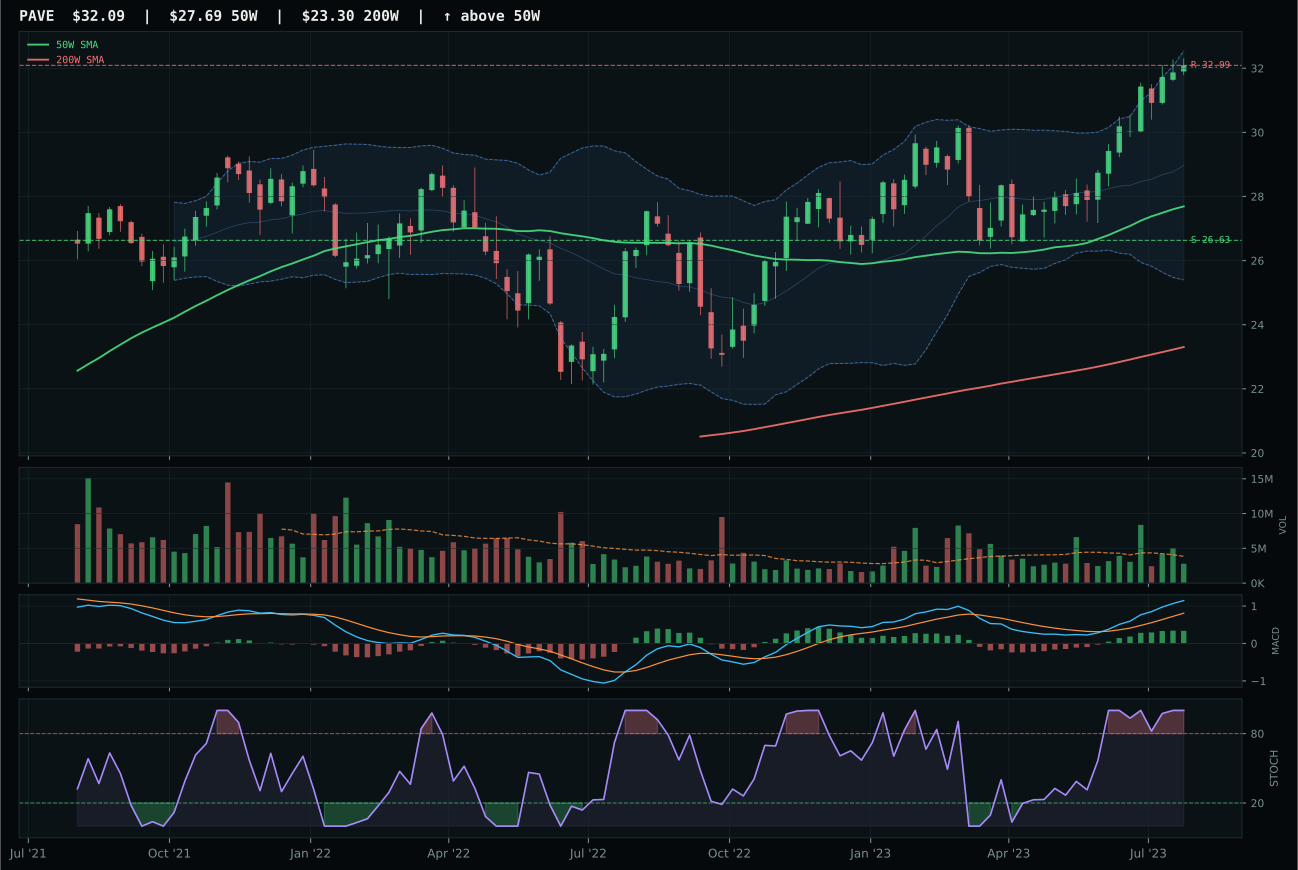
PAVE has a vertical extension profile with 6.5% 13-week relative strength versus SPY.
A failed hold above support would weaken the setup.
Actionable but governed by invalidation levels.
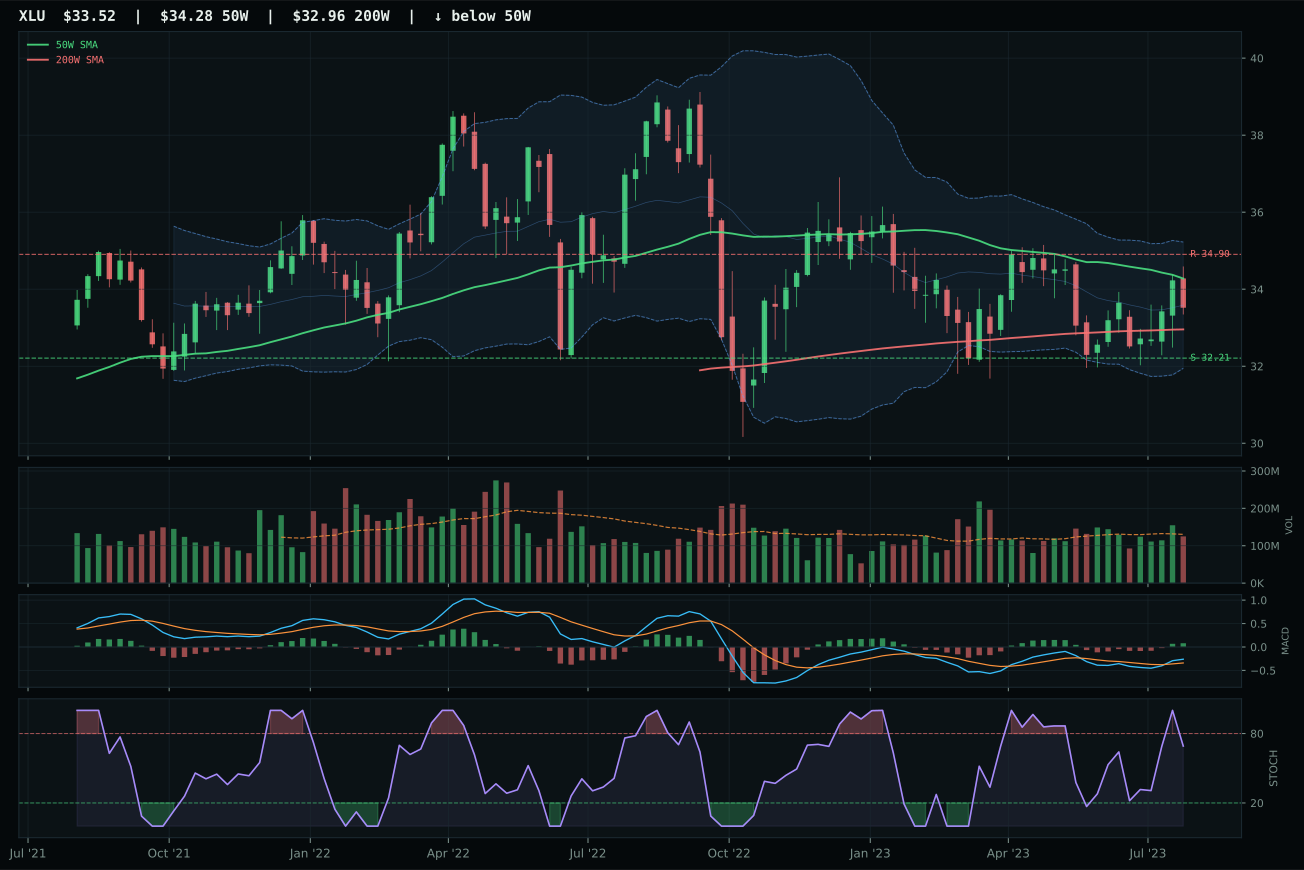
XLU has a pullback into support profile with -12.7% 13-week relative strength versus SPY.
A failed hold above support would weaken the setup.
Actionable but governed by invalidation levels.
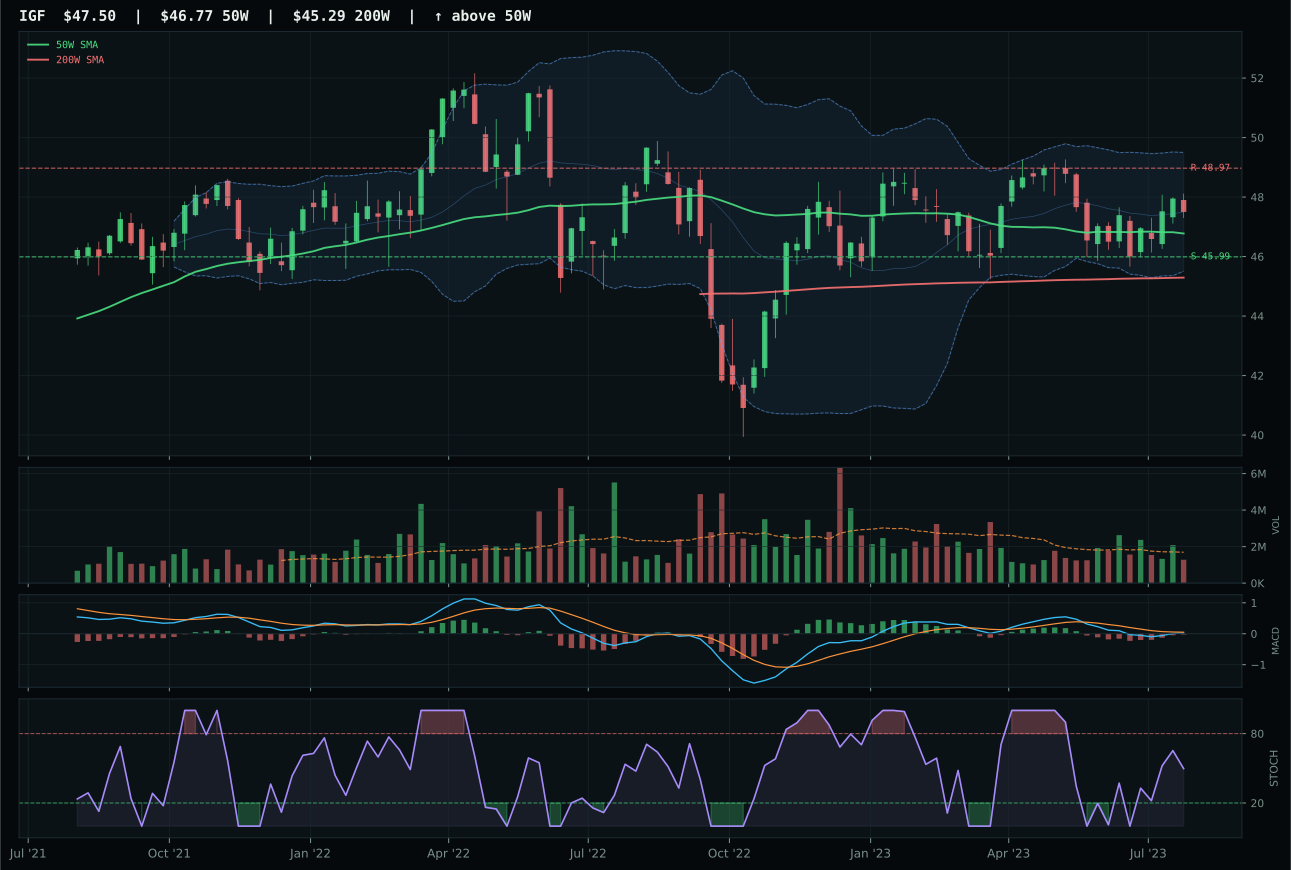
IGF has a pullback into support profile with -12.9% 13-week relative strength versus SPY.
A failed hold above support would weaken the setup.
Actionable but governed by invalidation levels.
XLU wins because its pullback setup offers the best timing and risk-reward asymmetry in the category. The chart trades 2.2% below the 50W—not broken, just pulling in—with support clearly defined at 32.21 and resistance at 34.90. MACD is bullish and improving with stochastic RSI at 0.69 (rising mid-zone, not overextended), positioning this as an accumulation opportunity in regulated utilities. PAVE, the runner-up, trades 15.9% above its 50W with overbought stochastic RSI and thin volume participation—a high-risk extension that appeals only to momentum chasers. XLU's 100.0/100 timing score reflects the value-zone positioning; PAVE's 37.0/100 reflects the overextension. Risk-reward favors XLU decisively: 70.6 versus 44.0, meaning a break below support would be a clear invalidation rather than a trap.
Utilities & Infrastructure earns 5% allocation as a tier-2 holding, rank 3 among the 10 categories, with a 55.0 final score. The category-level macro fit of 49.0/100 reflects minimal tailwinds: Transition / Mixed adds +4, but risk appetite positive is valued at -2 because utilities are defensive and underperform in risk-on environments. XLU's technical evidence of 65.2/100 is solid, and its pullback setup offers mean-reversion potential, yet the 47.0/100 macro/narrative fit signals that this is a crowded defensive trade in a regime that still favors real assets and scarcity. The 5% allocation acknowledges the setup quality while capping exposure to a category with unfavorable macro winds. For Utilities to move into top-2, either credit stress would need to escalate dramatically (forcing a flight to credit-sensitive defensive plays), or the macro regime would need to shift from Transition / Mixed into explicit recession. In the current setup, XLU functions as portfolio ballast—valuable insurance but not a conviction long.
Nuclear Energy — URA
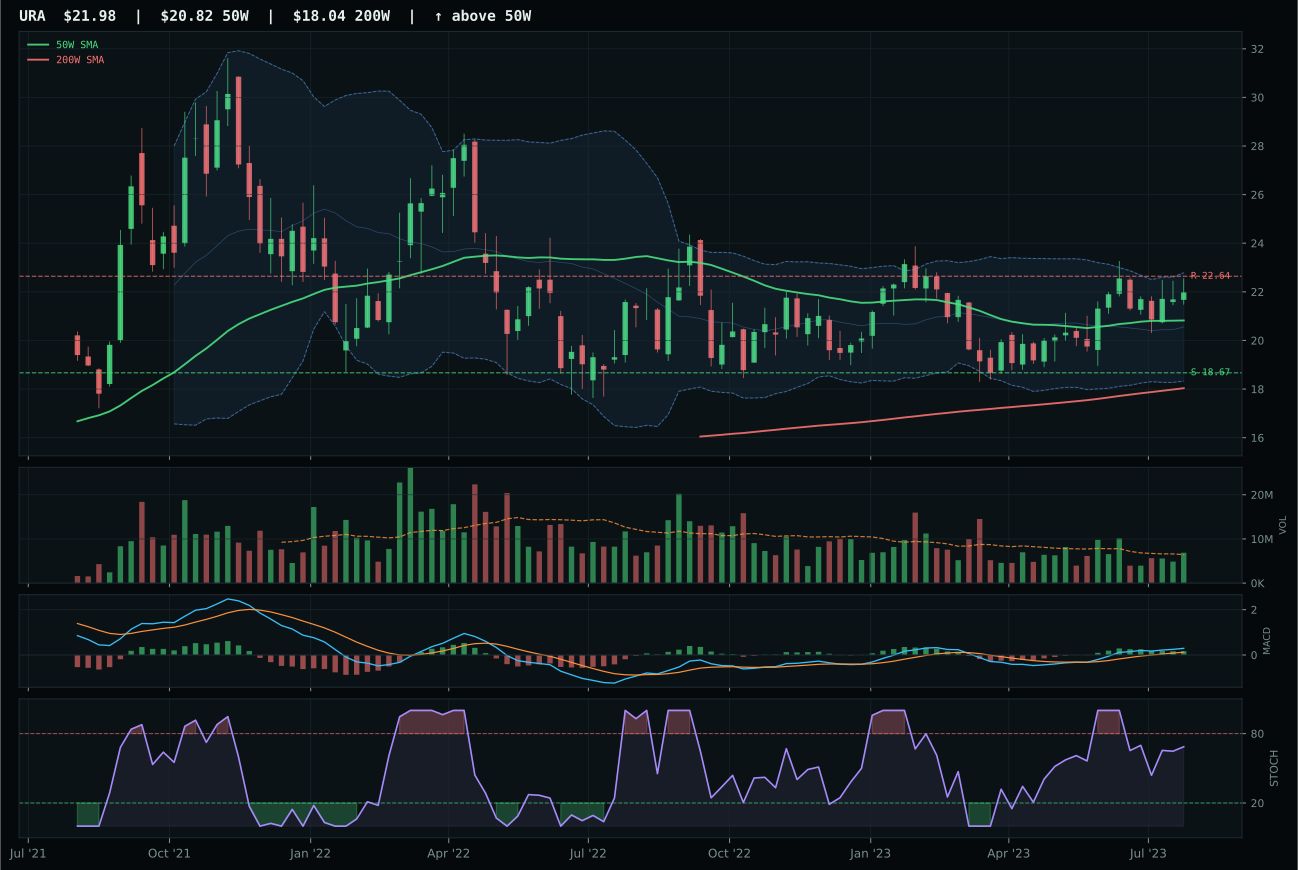
URA has a neutral structure profile with 0.0% 13-week relative strength versus SPY.
A failed hold above support would weaken the setup.
Actionable but governed by invalidation levels.
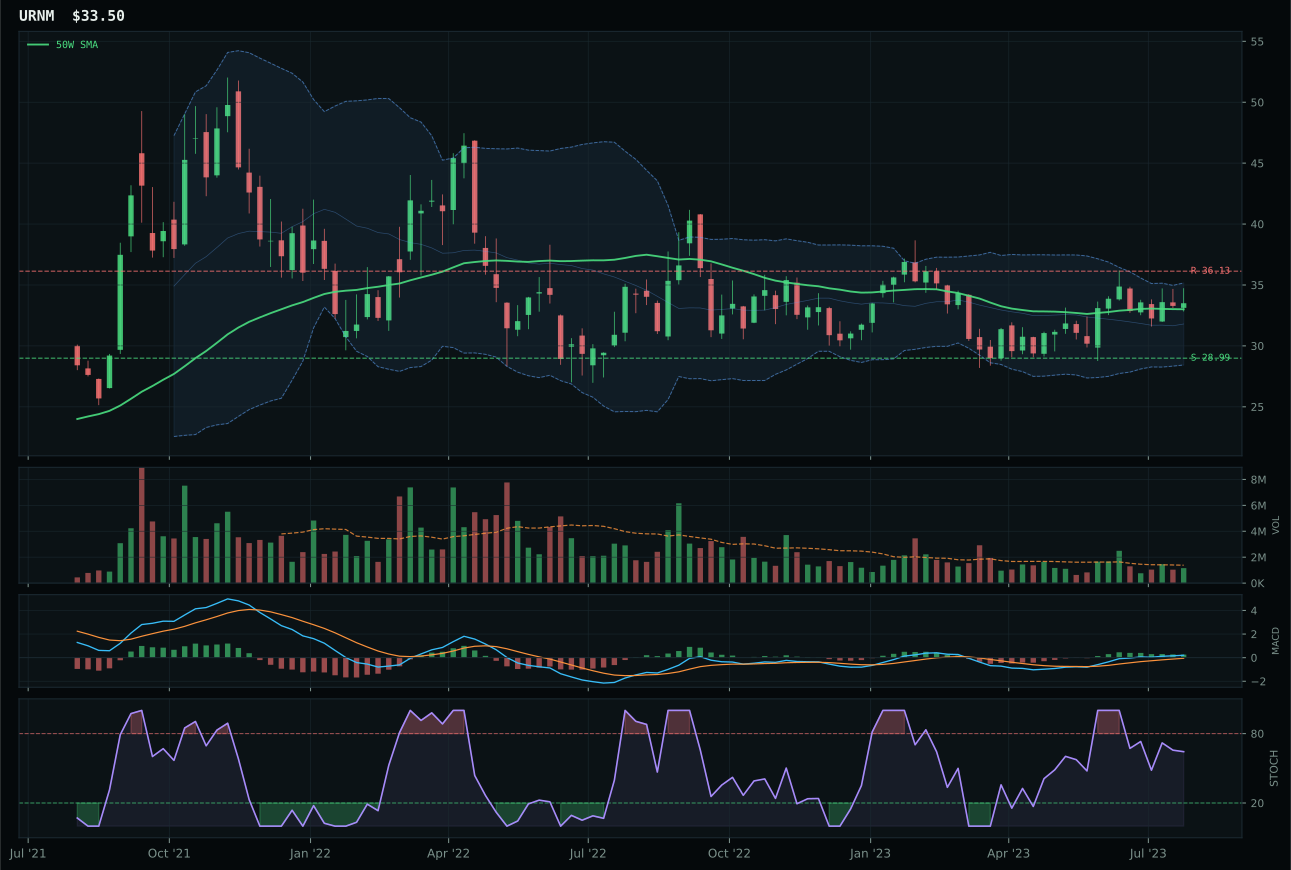
URNM has a compression near 50W profile with -2.0% 13-week relative strength versus SPY.
A failed hold above support would weaken the setup.
Actionable but governed by invalidation levels.
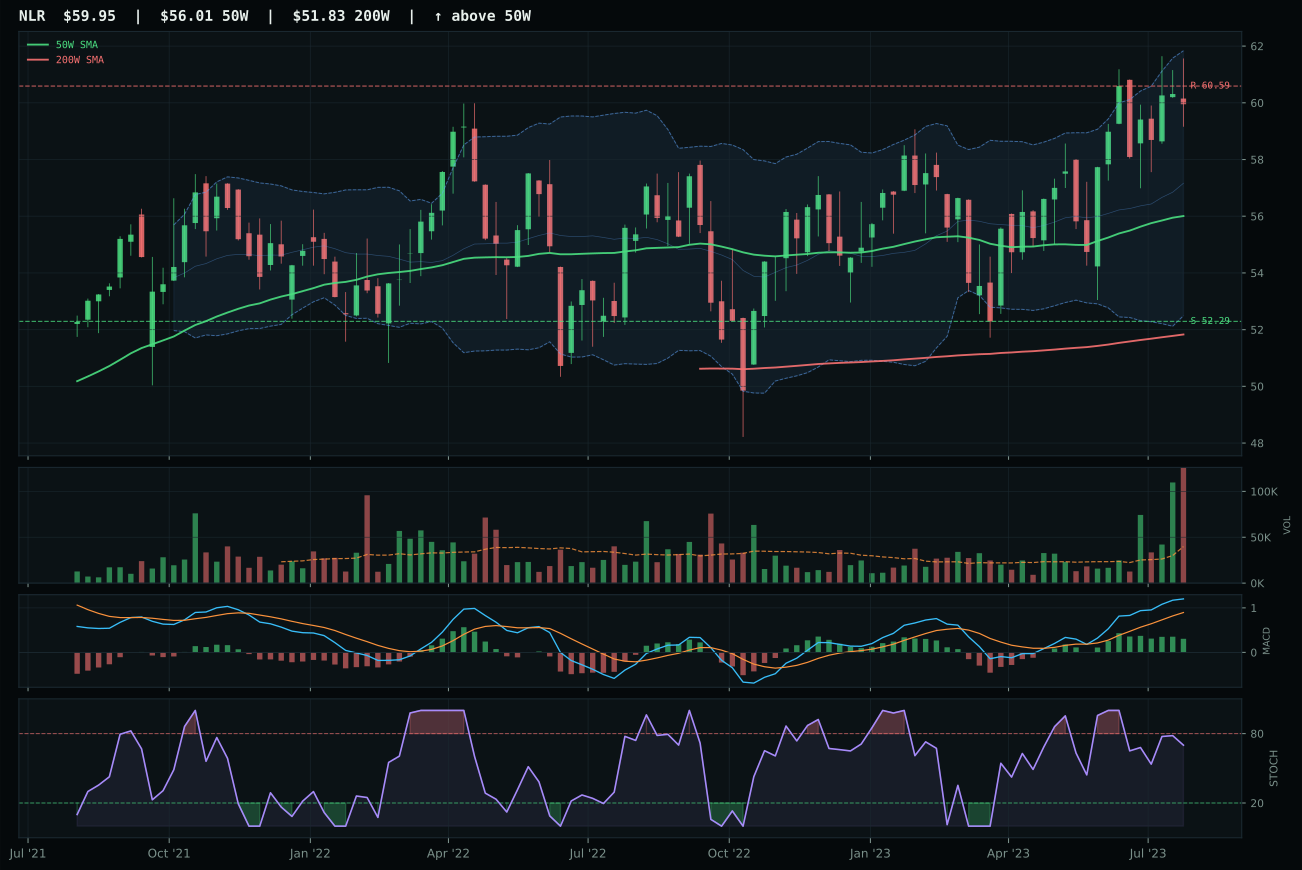
NLR has a neutral structure profile with -4.0% 13-week relative strength versus SPY.
A failed hold above support would weaken the setup.
Tracked, but not top-2 eligible because: .
URA wins because its 85.0/100 timing score reflects a setup with defined structure: the chart sits just 5.6% above the 50W in the middle retracement / decision zone (Fib 0.382), with MACD bullish but flattening and stochastic RSI rising mid-zone at 0.69. This is a chart waiting for confirmation, not chasing momentum. URNM, the runner-up, offers a superior 100.0/100 timing score by virtue of sitting in the compression near 50W, but its structure at 71.5 is weaker and its category-relative strength at 0.0% trails URA's 2.0%. URNM's compression setup would ordinarily be preferred, but its 53.0/100 composite score and deteriorating trend (53.0 vs 86.1) reveal that the mining-beta play is losing institutional sponsorship. URA's broad uranium exposure, even if less exciting than miner leverage, offers the stability necessary to hold through volatility.
Nuclear Energy earns 5% allocation as a tier-2 holding, rank 3 among the 10 categories, with a 53.5 final score. The category-level macro fit of 59.0/100 benefits from energy scarcity at +9, real asset sponsorship at +7, and AI growth sponsorship at +5 (AI chips require electricity), but liquidity stress (-7) and credit stress (-5) provide headwinds. URA's technical evidence of 73.1/100 is competitive, yet its 50.0/100 macro/narrative fit—neutral due to lack of nuclear-specific descriptors—limits conviction. The allocation reflects a nuclear energy thesis that is technically sound and macro-sensible but lacks the scarcity-driven tailwind of copper or natural gas. For Nuclear to move into top-2, either geopolitical risk would need to explicitly activate as a portfolio descriptor (shifting policy toward nuclear baseload), or AI data-center demand would need to manifest as a visible category spike in electricity load. Until then, the 5% position is a satellite bet on energy transition and capacity constraints.
Defense & Aerospace — XAR
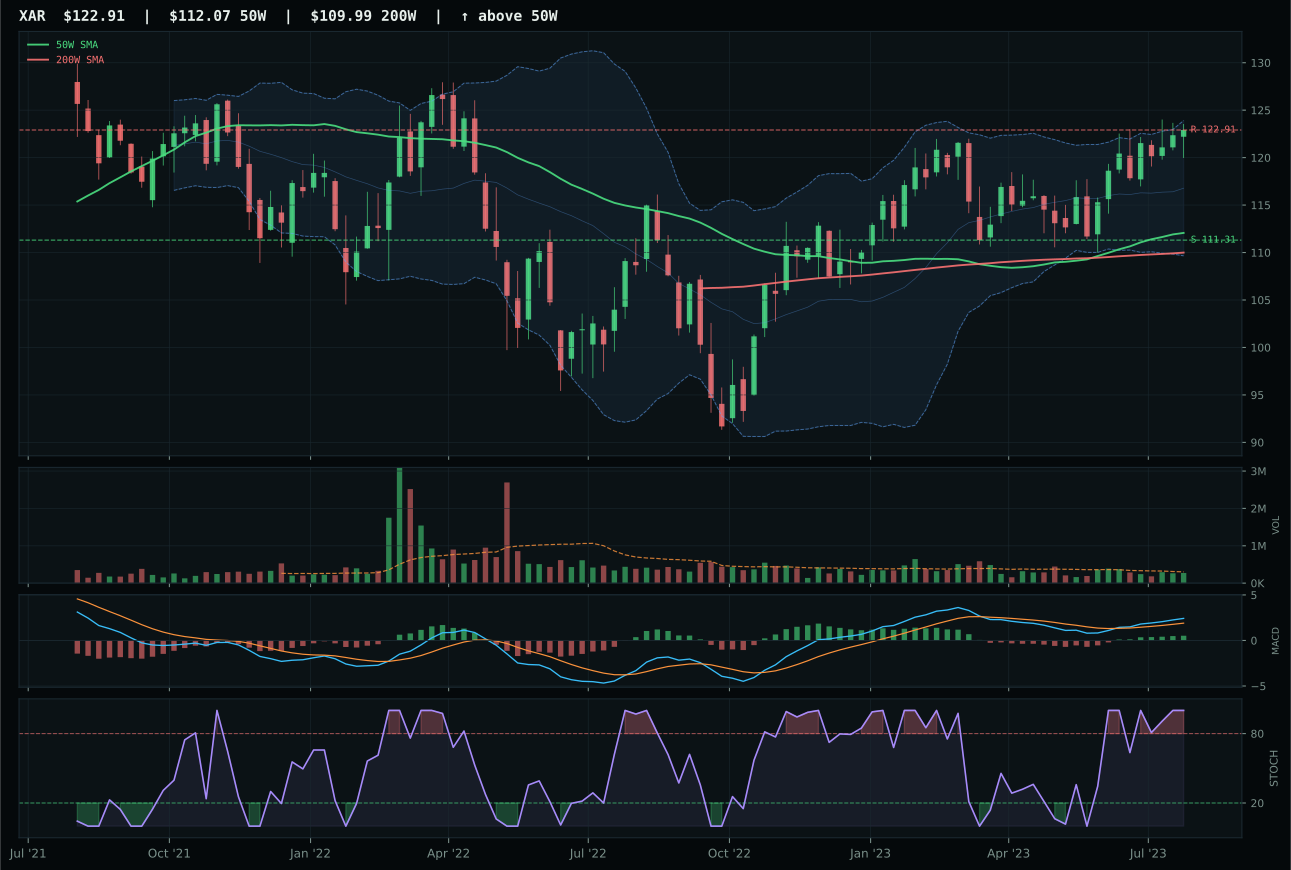
XAR has a neutral structure profile with -2.5% 13-week relative strength versus SPY.
A failed hold above support would weaken the setup.
Actionable but governed by invalidation levels.
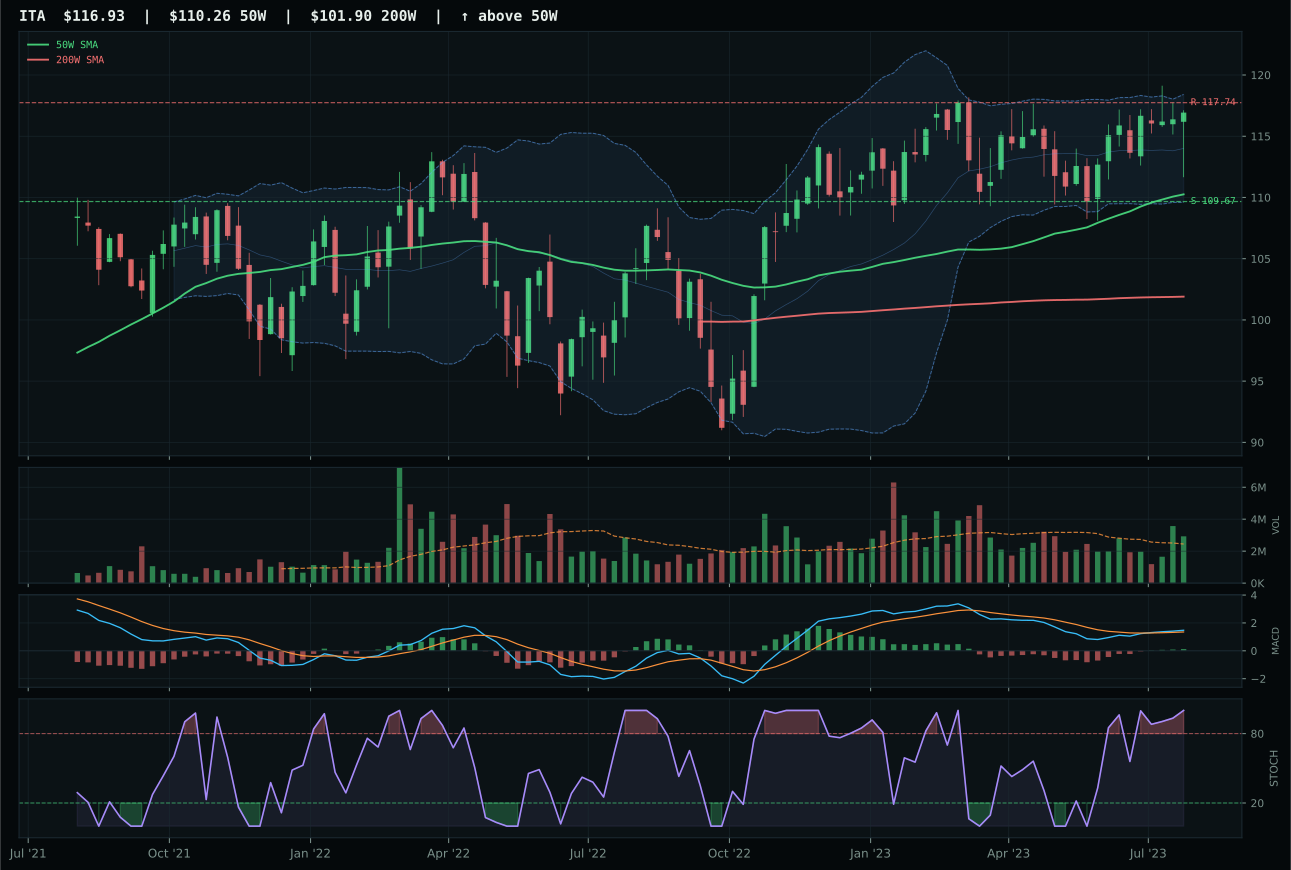
ITA has a neutral structure profile with -7.2% 13-week relative strength versus SPY.
A failed hold above support would weaken the setup.
Actionable but governed by invalidation levels.
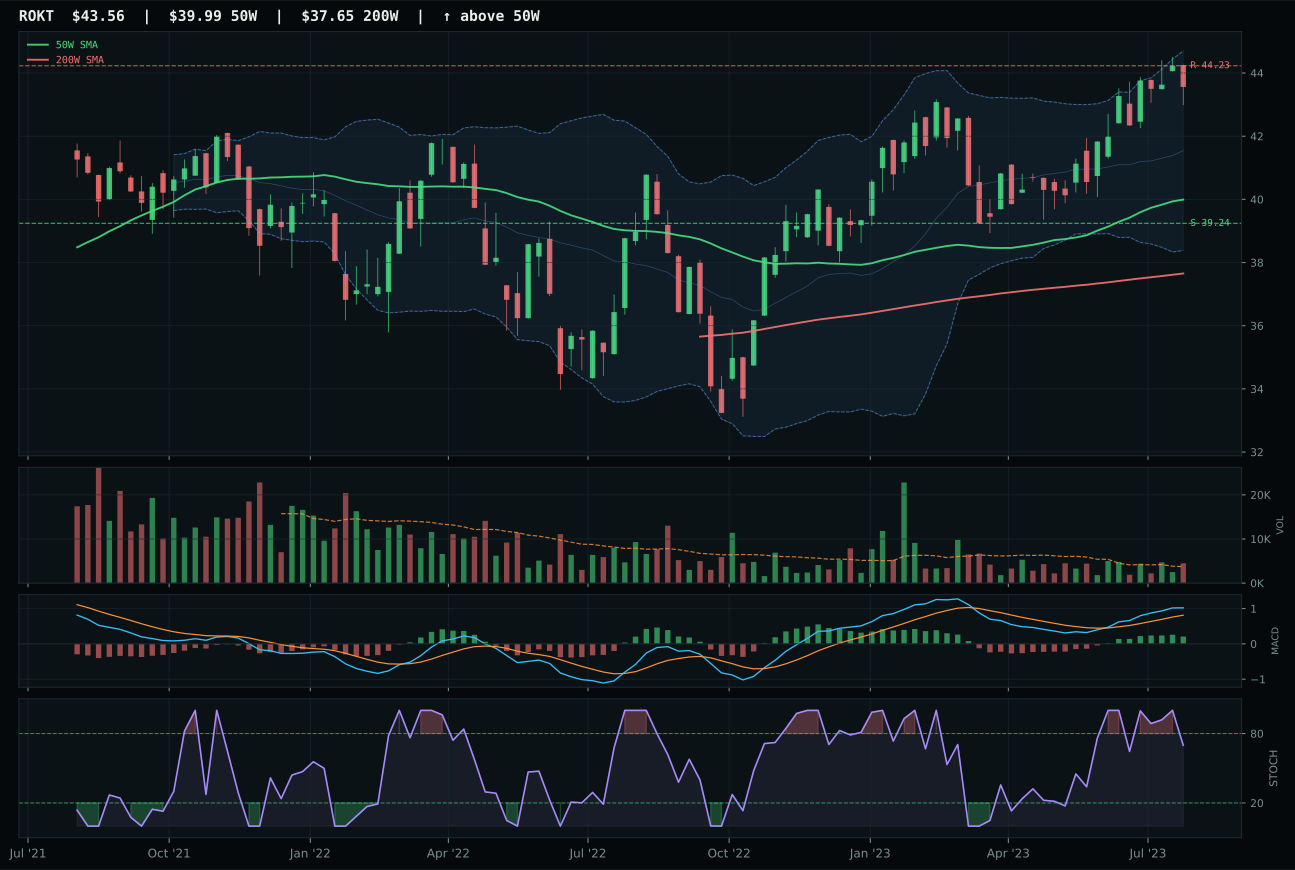
ROKT has a neutral structure profile with -1.8% 13-week relative strength versus SPY.
A failed hold above support would weaken the setup.
Tracked, but not top-2 eligible because: .
XAR wins the category despite a negative -2.5% SPY-relative return because its setup is the cleanest and most defensible in the peer set. The chart sits just 9.7% above the 50-week moving average in a neutral structure, and MACD is bullish and improving with stochastic RSI already overbought at 1.00—a combination that rewards patience over aggressive entry. ITA, the runner-up, suffers from a worse -7.2% SPY-relative deficit and a 38.9/100 risk-reward score that signals asymmetric downside if support breaks. XAR's 50.8/100 risk-reward, by contrast, offers 10.4% downside to support against minimal upside runway, defining a tight invalidation area for defensive traders. Importantly, XAR's 13W return of 7.3% is positive despite the negative SPY-relative number, meaning it has outperformed its own historical volatility even if it lags the broad index.
Defense & Aerospace receives 0% allocation this week, ranking 9th or 10th among the 10 categories with a 51.4 final score. The category-level macro fit of 51.0/100 is neutral; while Transition / Mixed adds a modest +3 benefit to defense positioning, active credit stress (+2) and especially liquidity stress (-4) do not provide a compelling macro rationale for committing capital. XAR's technical evidence of 75.3/100 would normally be competitive, but the 50.0/100 macro/narrative fit—absent any category-specific descriptor profile—means the category reasoning layer weighted technical evidence at 62% and macro/narrative at 38%, resulting in insufficient overall conviction. For Defense to earn allocation, energy scarcity would need to extend into arms manufacturing, or geopolitical risk would need to explicitly activate as a portfolio descriptor. As it stands, the category is outside the opportunity set.
Precious Metals — GLD
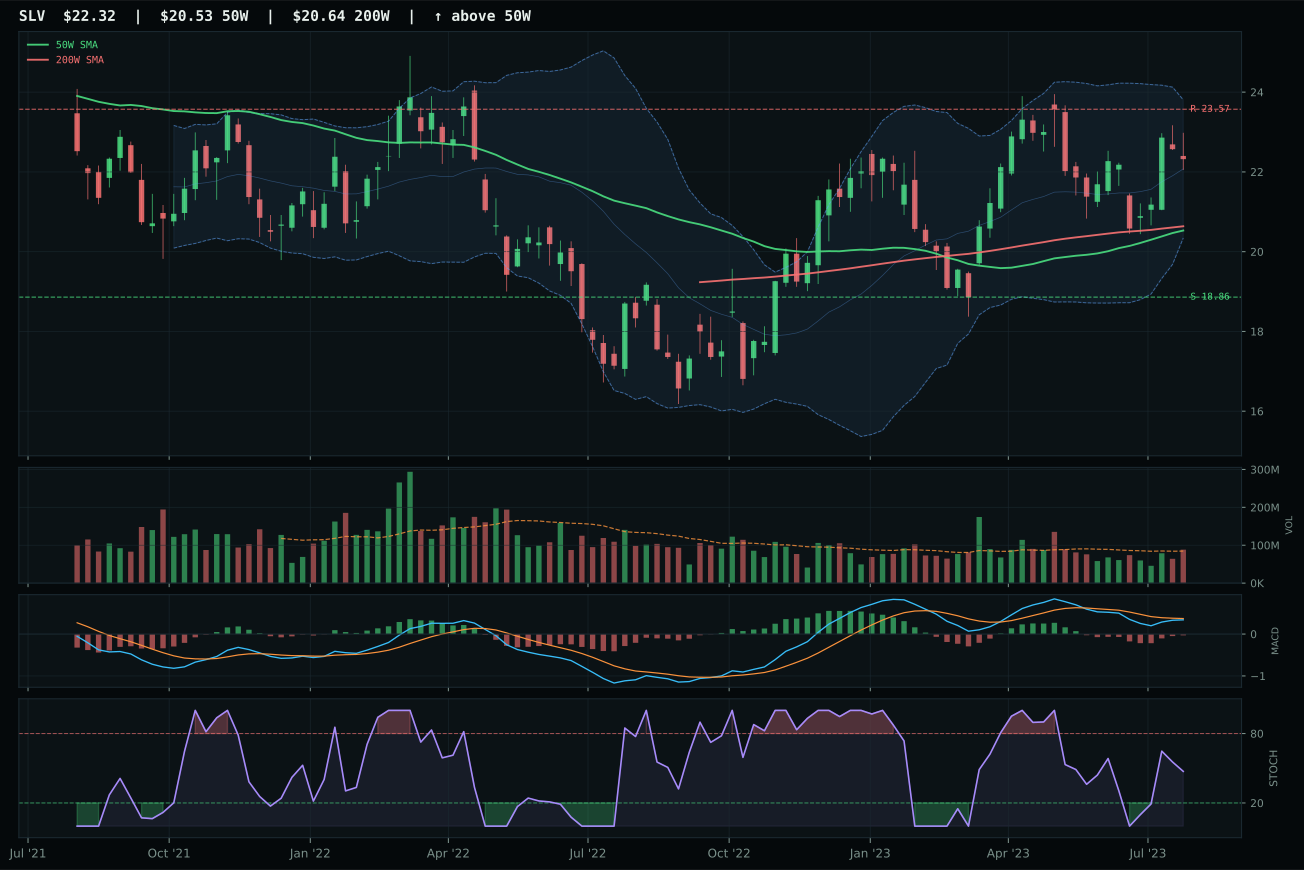
SLV has a neutral structure profile with -12.8% 13-week relative strength versus SPY.
A failed hold above support would weaken the setup.
Actionable but governed by invalidation levels.
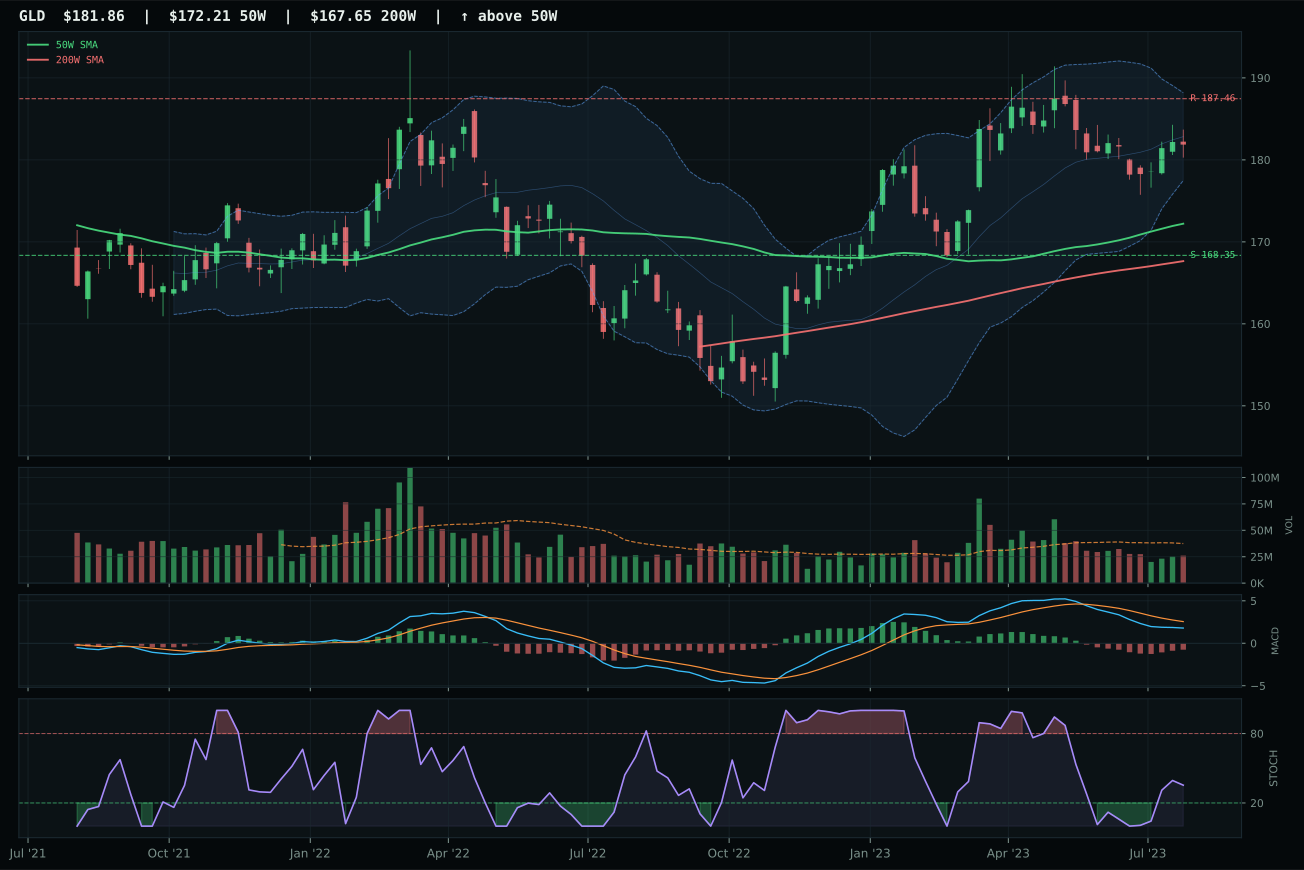
GLD has a neutral structure profile with -11.4% 13-week relative strength versus SPY.
A failed hold above support would weaken the setup.
Actionable but governed by invalidation levels.
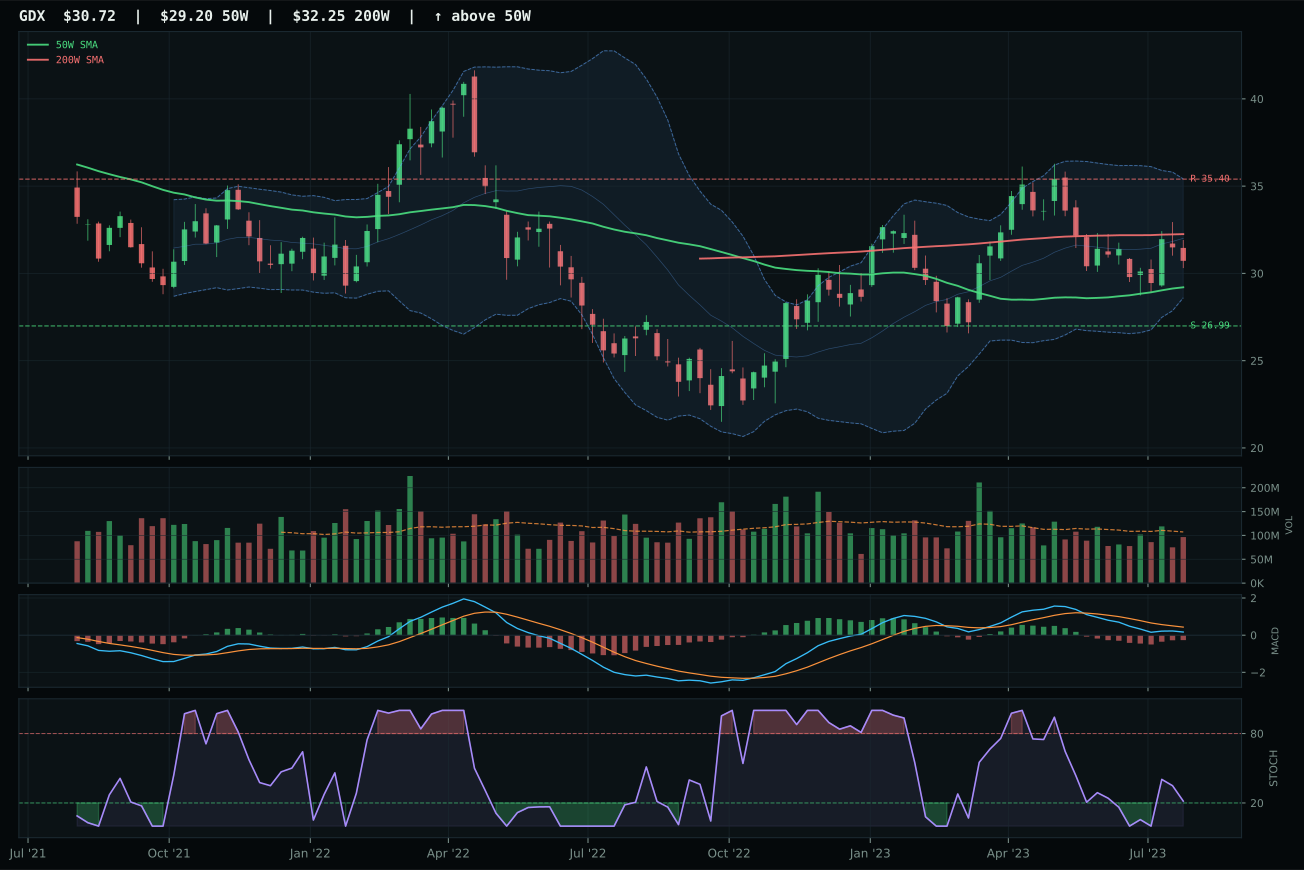
GDX has a neutral structure profile with -18.4% 13-week relative strength versus SPY.
A failed hold above support would weaken the setup.
Actionable but governed by invalidation levels.
GLD wins the category, but this is a battle of attrition among weak setups. The 5.6% proximity to the 50-week moving average and position in the upper retracement / momentum zone (Fib 0.236) offer better timing than SLV's wider spread, and the 1.4% category-relative strength—however small—provides a directional edge. GLD's MACD is bearish but improving and stochastic RSI is rising mid-zone at 0.35, suggesting early-stage recovery rather than momentum exhaustion. SLV trails on risk-reward (50.2 vs 51.7), structure cleanliness (68.3 vs 71.9), and the same -12.8% SPY-relative weakness. Both trade with thin volume—GLD at 0.70x and SLV at neutral—and both have failed to accumulate on upside moves, signaling institutional indifference to gold as either inflation hedge or safe-haven play in the current macro regime.
Precious Metals receives 0% allocation this week, ranking 9th or 10th among the 10 categories with a 46.9 final score. The category-level macro fit of 46.0/100 is actively hostile: risk appetite positive is valued at -4 because gold underperforms when equities rally on lower-for-longer rates. Metals scarcity (+6 from the mining-focused ETFs SLV and GDX) does not apply meaningfully to GLD, which is a pure monetary hedge. The regime of Transition / Mixed offers no explicit support to precious metals, and the institutional participation data—thin volume and deteriorating momentum confirmation—confirms that capital is not repositioning into the metals complex. GLD's technical evidence of 59.2/100 would normally be sufficient for a tier-2 spot, but its 46.0/100 macro/narrative fit drags the entire category below the allocation threshold. For Precious Metals to earn 5%, either inflation expectations would need to spike visibly or credit stress would need to escalate into a flight-to-quality scenario.