
2023-07-21
Informational purposes only. The content in this report, including allocations, analysis, and commentary, is provided solely for informational and educational purposes. It does not constitute financial advice, investment advice, trading advice, or any other type of advice. Past performance does not guarantee future results. Always conduct your own research and consult a qualified financial professional before making investment decisions.
Weekly Allocation
| Ticker | Category | Weight | Role |
|---|---|---|---|
| FBTC | 50% | Overlay | |
| IGV | Technology | 10% | Top-2 (10%) |
| PAVE | Utilities & Infrastructure | 10% | Top-2 (10%) |
| COPX | Industrial Metals | 5% | Tier-2 (5%) |
| URA | Nuclear Energy | 5% | Tier-2 (5%) |
| ILF | Emerging Markets | 5% | Tier-2 (5%) |
| XAR | Defense & Aerospace | 5% | Tier-2 (5%) |
| SLV | Precious Metals | 5% | Tier-2 (5%) |
| SMH | AI | 5% | Tier-2 (5%) |
Trade Instructions — Monday Open
Sell the tranche from 2023-06-23 (completing its 4-week hold). Buy the new tranche. Instructions show net portfolio changes — same-asset positions cancel, weight changes show the delta.
| Action | Ticker | Instruction |
|---|---|---|
| SELL | AIQ | Sell 25% of AIQ position (reduce 10.00% → 7.50%) |
| SELL | URNM | Sell entire URNM position (2.50% of portfolio) |
| SELL | XLE | Sell entire XLE position (1.25% of portfolio) |
| SELL | GLD | Sell 25% of GLD position (reduce 5.00% → 3.75%) |
| BUY | IGV | Buy IGV — 16.67% of freed cash (adds 1.25% to portfolio) |
| BUY | PAVE | Buy PAVE — 16.67% of freed cash (adds 1.25% to portfolio) |
| BUY | ILF | Buy ILF — 16.67% of freed cash (adds 1.25% to portfolio) |
| BUY | URA | Buy URA — 16.67% of freed cash (adds 1.25% to portfolio) |
| BUY | SLV | Buy SLV — 16.67% of freed cash (adds 1.25% to portfolio) |
| BUY | SMH | Buy SMH — 16.67% of freed cash (adds 1.25% to portfolio) |
Current Portfolio After Trade
Combined holdings across all 4 active tranches. Each tranche is 25% of the portfolio.
| Ticker | % of Portfolio | Weight Bar |
|---|---|---|
| FBTC | 50.00% | |
| AIQ | 7.50% | |
| IGV | 7.50% | |
| PAVE | 6.25% | |
| COPX | 5.00% | |
| XAR | 5.00% | |
| URA | 5.00% | |
| GLD | 3.75% | |
| ILF | 3.75% | |
| XLK | 2.50% | |
| INDA | 1.25% | |
| SLV | 1.25% | |
| SMH | 1.25% |
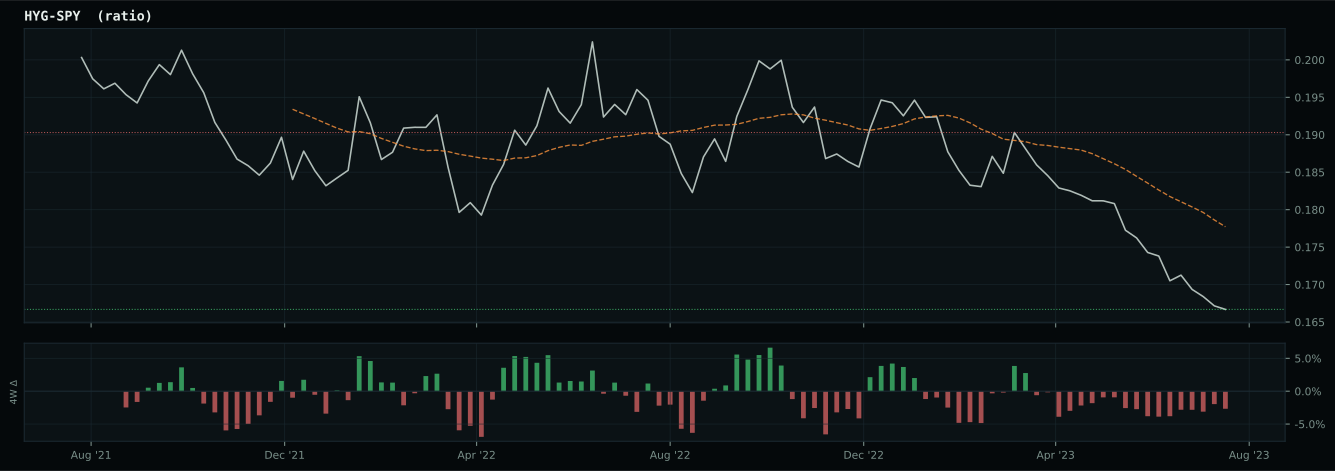
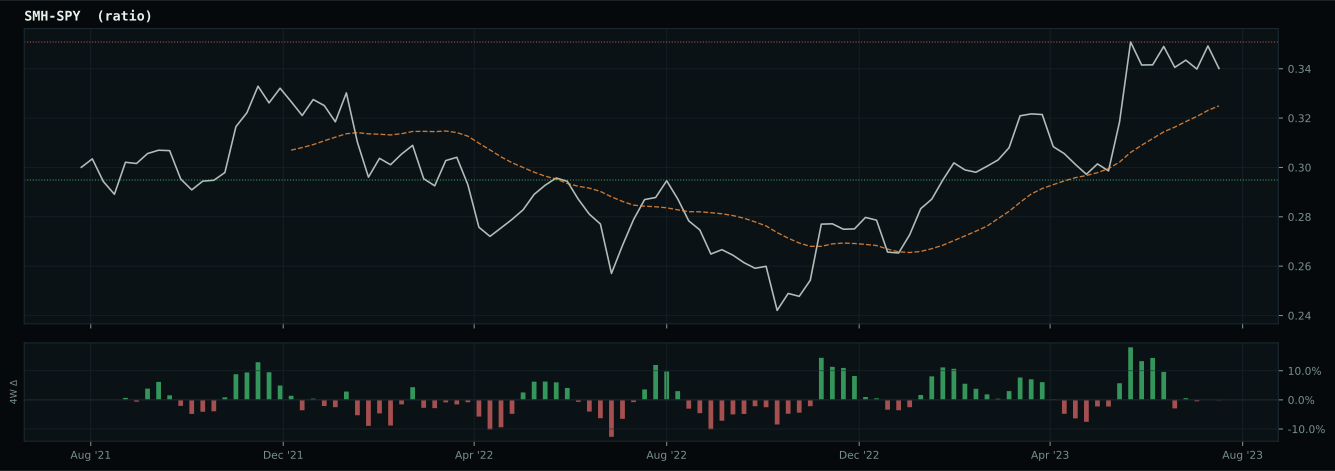
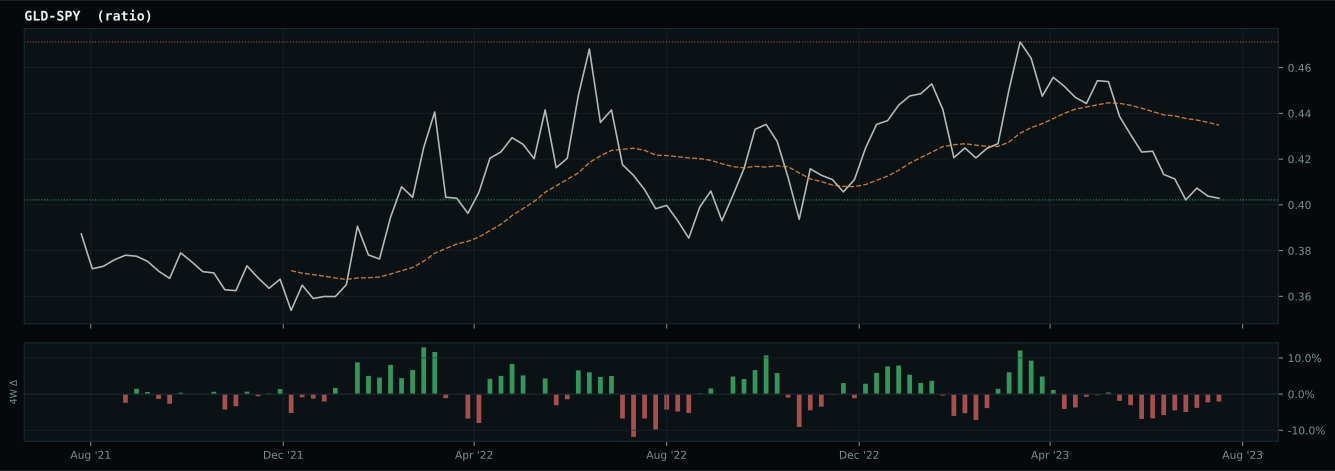
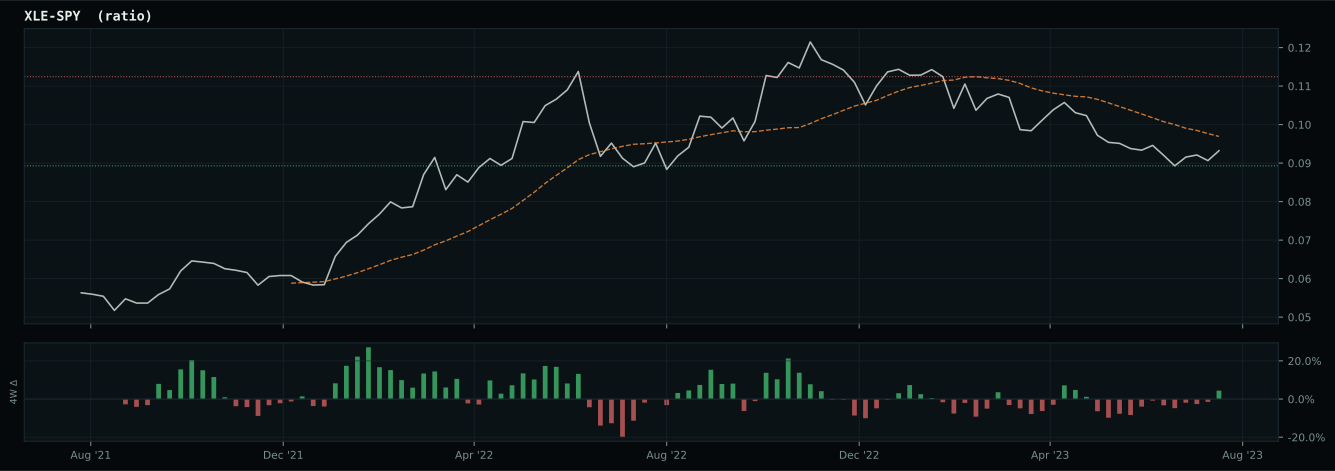
Macro Regime — Disinflation
Macro Evidence Charts
Market-implied signals behind the macro regime scores. Each ratio compares two assets; the direction and slope of the ratio is what the macro engine reads.
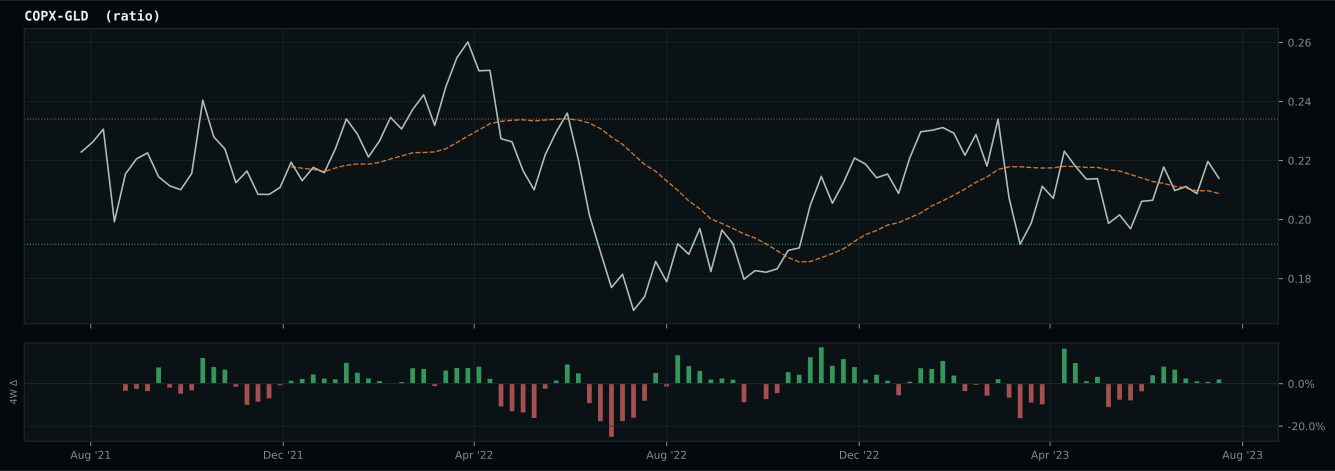
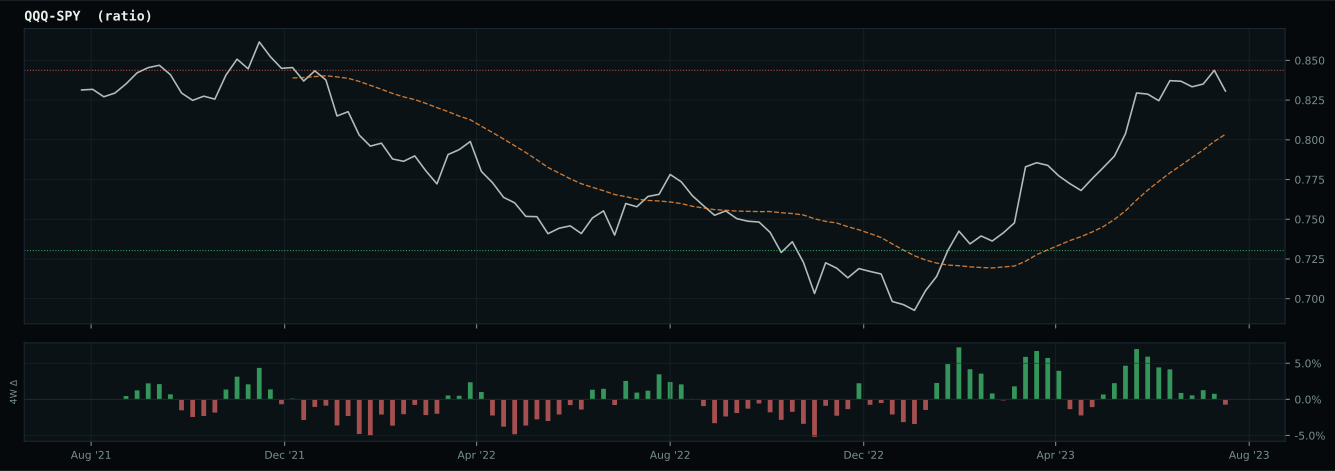
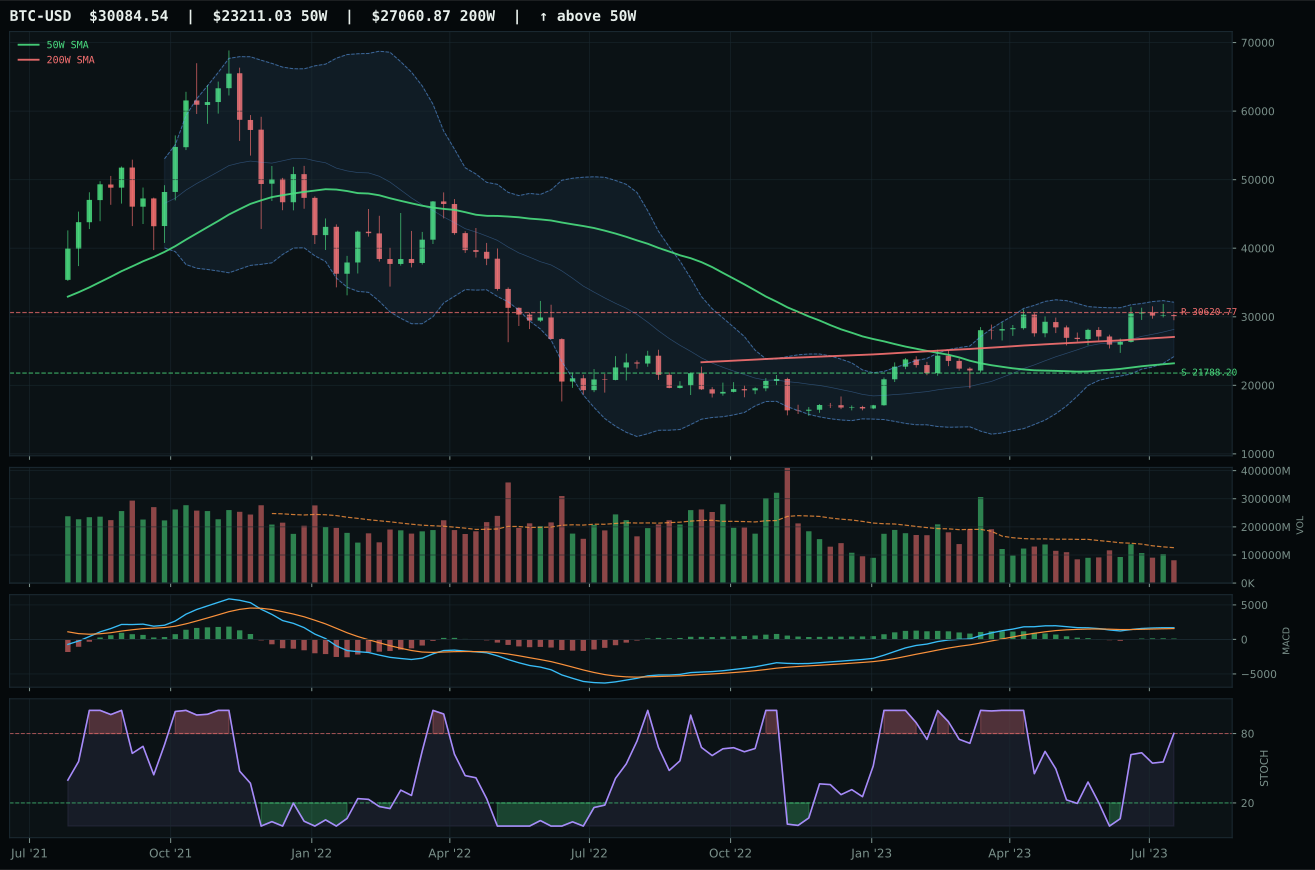
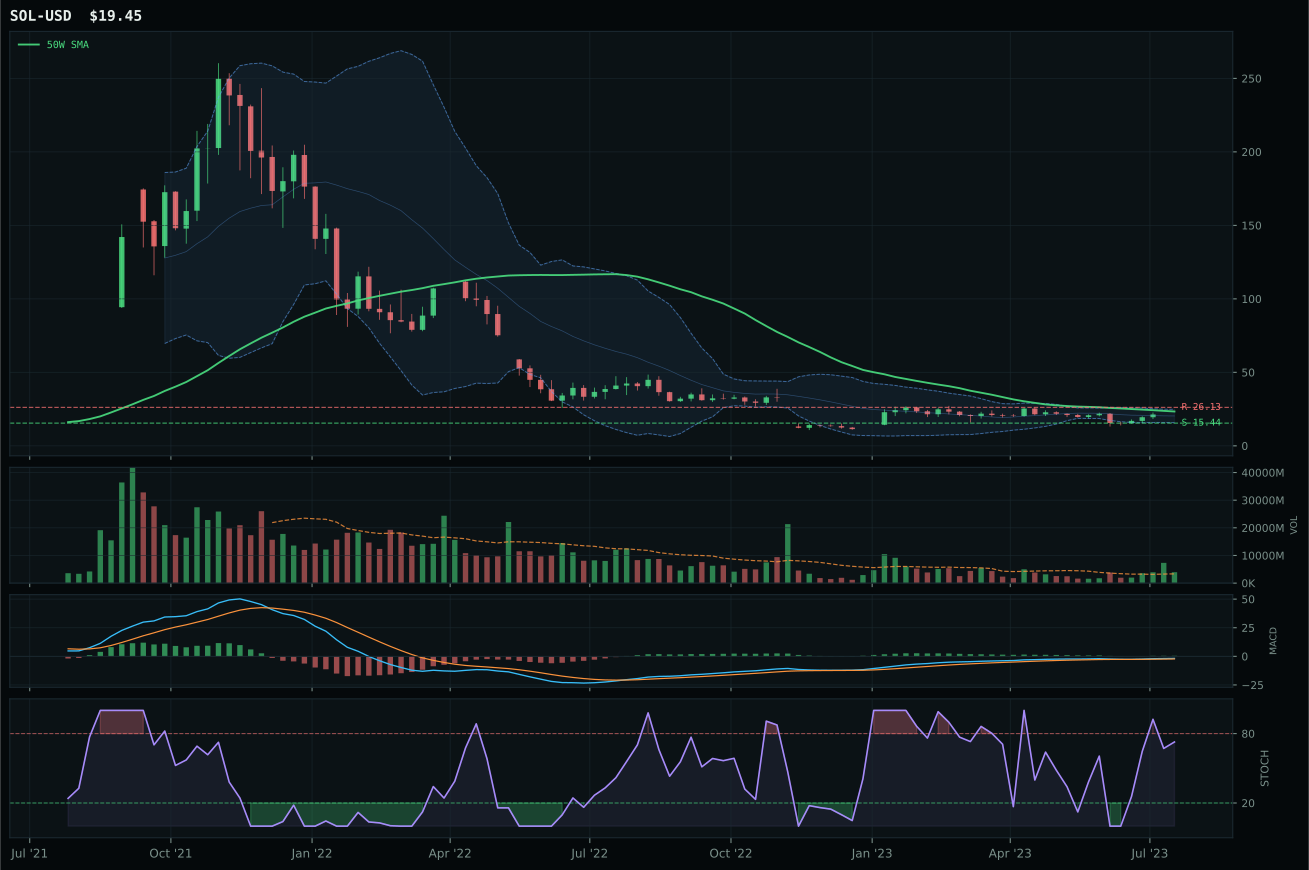
Crypto Regime — TrendBTC
post-touch structure is too wide to count as a range; max/min close ratio is 1.88
TrendBTC confirmed: 2 consecutive closes above rising/flat 50W SMA
one or more available conditions failed
Category Rankings
| Rank | Category | Winner | Score | Alloc | 4W Ret | Peers (4W) |
|---|---|---|---|---|---|---|
| 1 | Technology | IGV | 70.4 | 20% | -5.97% | XLK -6.3% · CIBR -2.8% |
| 2 | Utilities & Infrastructure | PAVE | 57.5 | 20% | -1.82% | XLU -7.7% · IGF -5.7% |
| 3 | Industrial Metals | COPX | 53.6 | 10% | -7.18% | PICK -7.6% · REMX -11.2% |
| 4 | Nuclear Energy | URA | 52.6 | 10% | +4.29% | URNM +8.5% · NLR +3.0% |
| 5 | Emerging Markets | ILF | 51.9 | 10% | -7.15% | INDA -2.0% · IEMG -4.9% |
| 6 | Defense & Aerospace | XAR | 49.1 | 10% | -2.18% | ITA -1.3% · ROKT -6.4% |
| 7 | Precious Metals | SLV | 48.4 | 10% | -4.87% | GLD -3.5% · GDX -12.2% |
| 8 | AI | SMH | 48.0 | 10% | -4.42% | AIQ -5.8% · BOTZ -12.5% |
| 9 | Traditional Energy | XLE | 47.0 | 0% | +5.24% | XOP +9.0% · FCG +6.7% |
| 10 | Agriculture & Livestock | MOO | 29.6 | 0% | -4.55% | WEAT -13.4% · VEGI -5.6% |
Technology — IGV
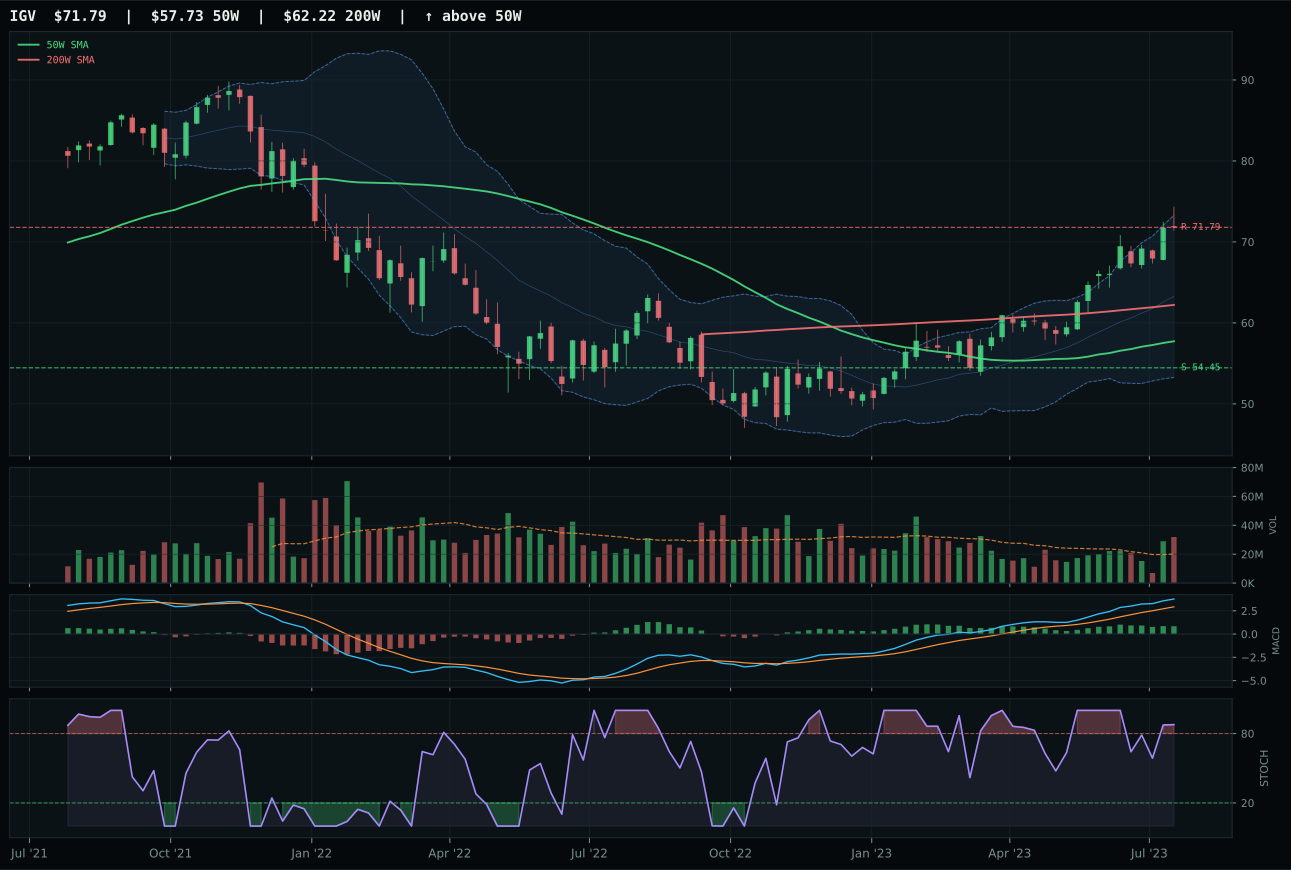
IGV has a vertical extension profile with 9.6% 13-week relative strength versus SPY.
A failed hold above support would weaken the setup.
Actionable but governed by invalidation levels.
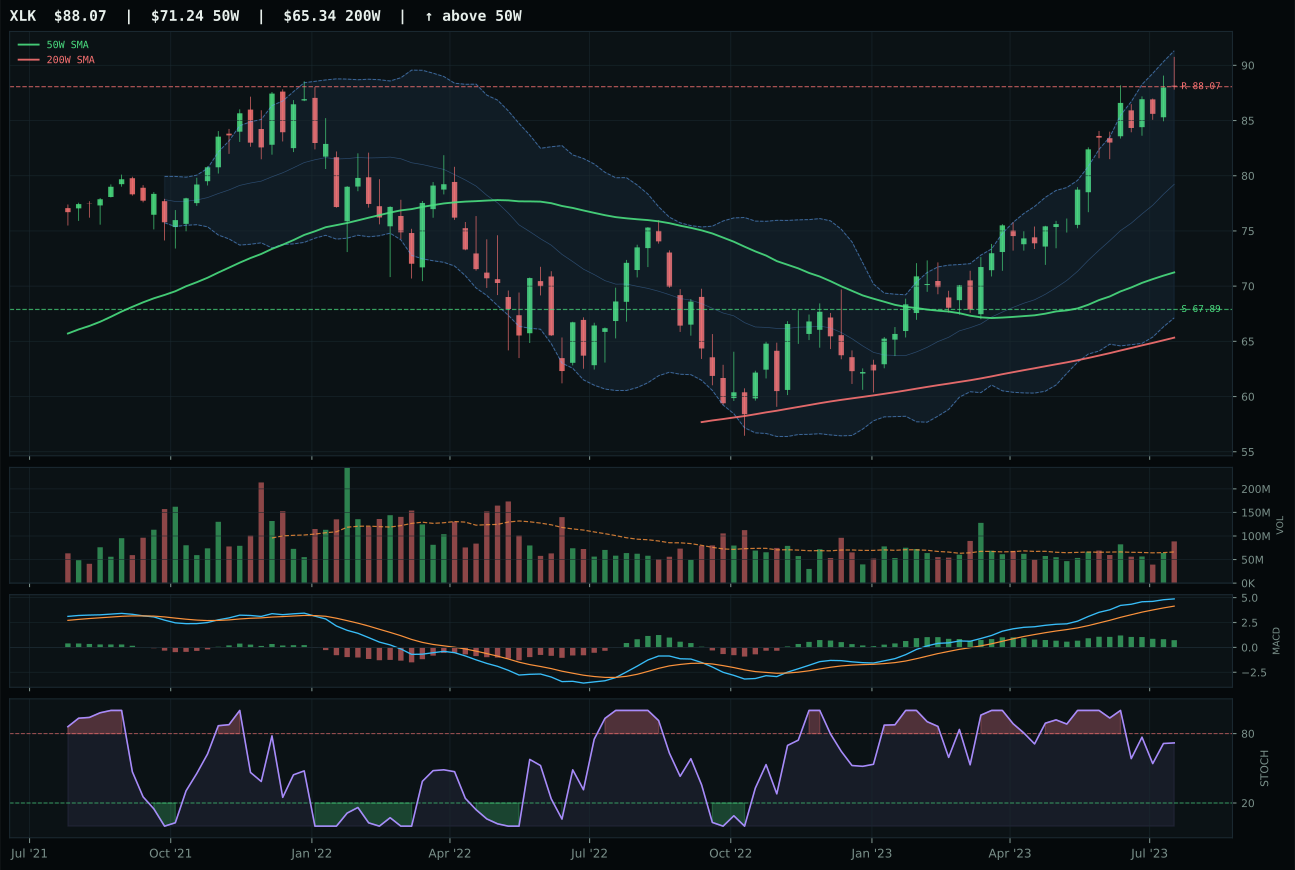
XLK has a vertical extension profile with 9.5% 13-week relative strength versus SPY.
A failed hold above support would weaken the setup.
Actionable but governed by invalidation levels.
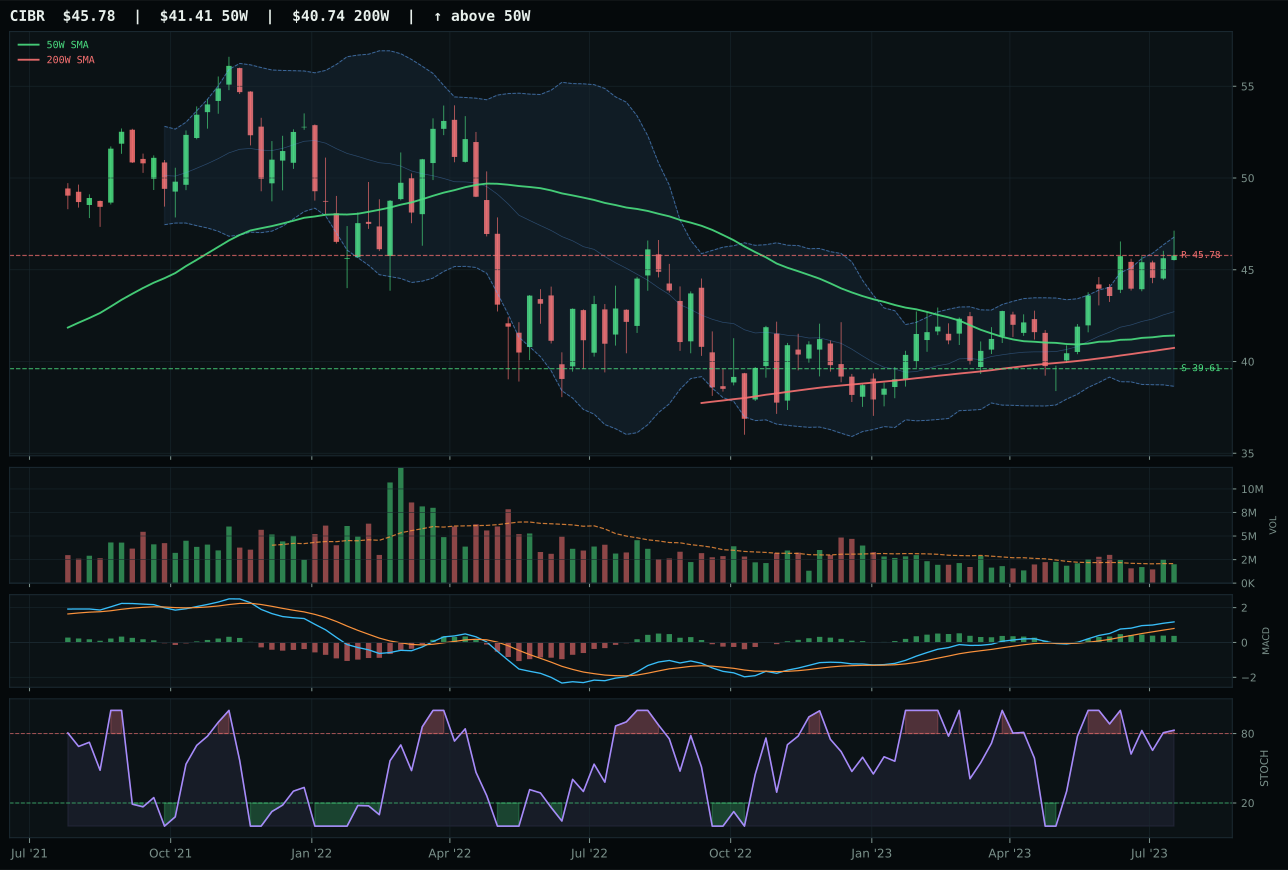
CIBR has a neutral structure profile with 0.3% 13-week relative strength versus SPY.
A failed hold above support would weaken the setup.
Actionable but governed by invalidation levels.
IGV claimed the Technology category by combining clean technical execution with the sharpest relative strength inside the basket. Price sits 24.4% above the 50-week moving average with volume accumulating at 1.59x average, signaling genuine institutional sponsorship rather than retail chase—the kind of confirmation that justifies holding an extended position. Its 13-week return of 19.3% and 9.6% outperformance versus SPY established clear dominance over XLK, which offered nearly identical trend strength but delivered weaker structure (79.8 vs 85.5), inferior volume quality (above-average participation rather than accumulation), and a -0.1% category-relative edge that evaporated under scrutiny. MACD remains bullish but flattening on both names, yet IGV's stochastic RSI sitting at overbought momentum (0.88) paired with its compression history suggests the move has legs if buyers defend support at 54.45.
Technology earned its 10% slot despite ranking third among the 10 categories because the macro regime supports it and the technical setup, while extended, remains intact. Disinflation pressure adds 7 basis points to the category's narrative, and risk appetite positive contributes 9, offsetting much of the liquidity stress headwind. IGV's trend score of 100 anchors a category-level macro fit of 60, which is respectable but not compelling—the allocator is betting that duration-sensitive growth can absorb a potential 31.8% correction to support without breaking. The score would need to climb above 75 to command a 10% allocation; currently, it sits at 70.4, making it a tactical 10% hold rather than a strategic core conviction. Credit stress at minus 9 points and liquidity stress at minus 8 remain the primary risks, and if either accelerates, this allocation shrinks immediately.
Utilities & Infrastructure — PAVE
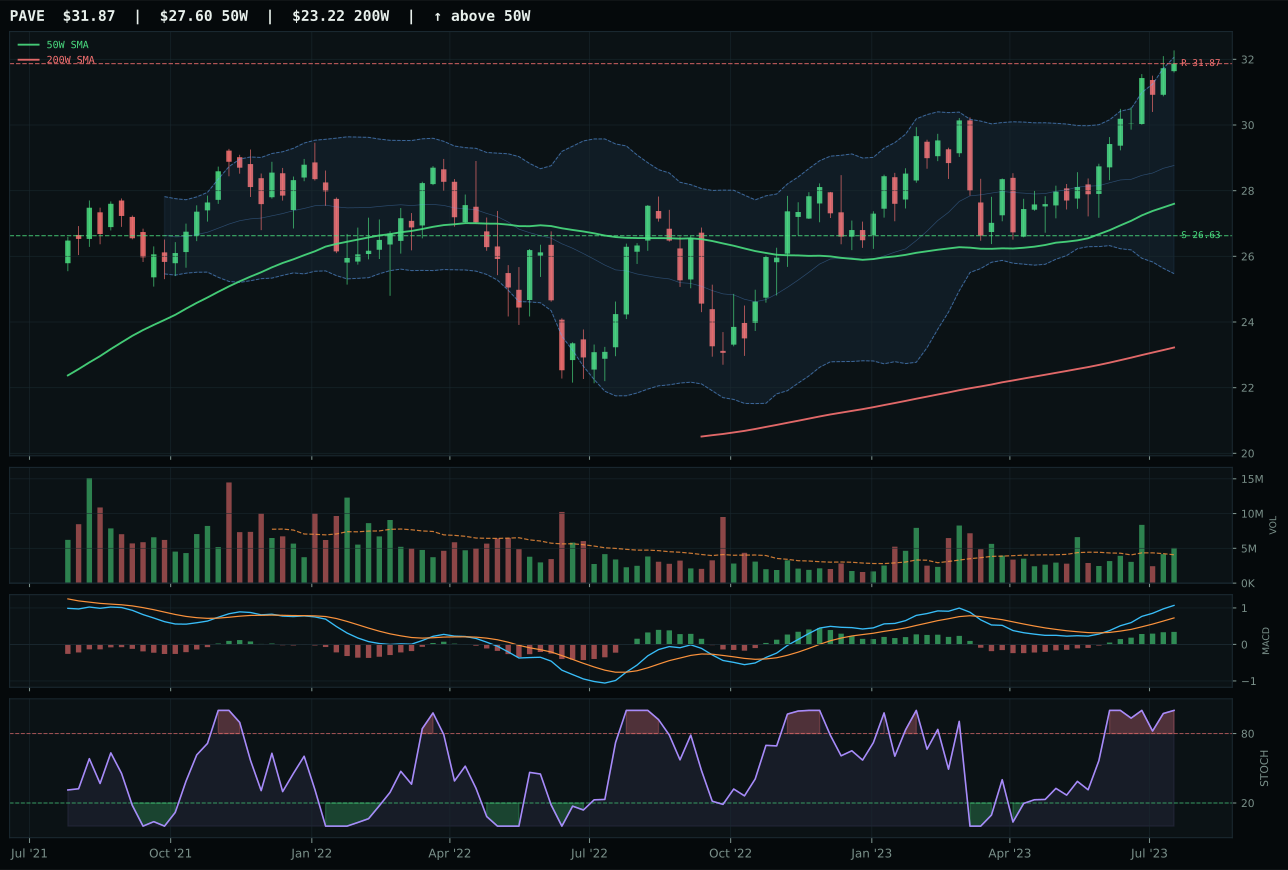
PAVE has a vertical extension profile with 5.9% 13-week relative strength versus SPY.
A failed hold above support would weaken the setup.
Actionable but governed by invalidation levels.
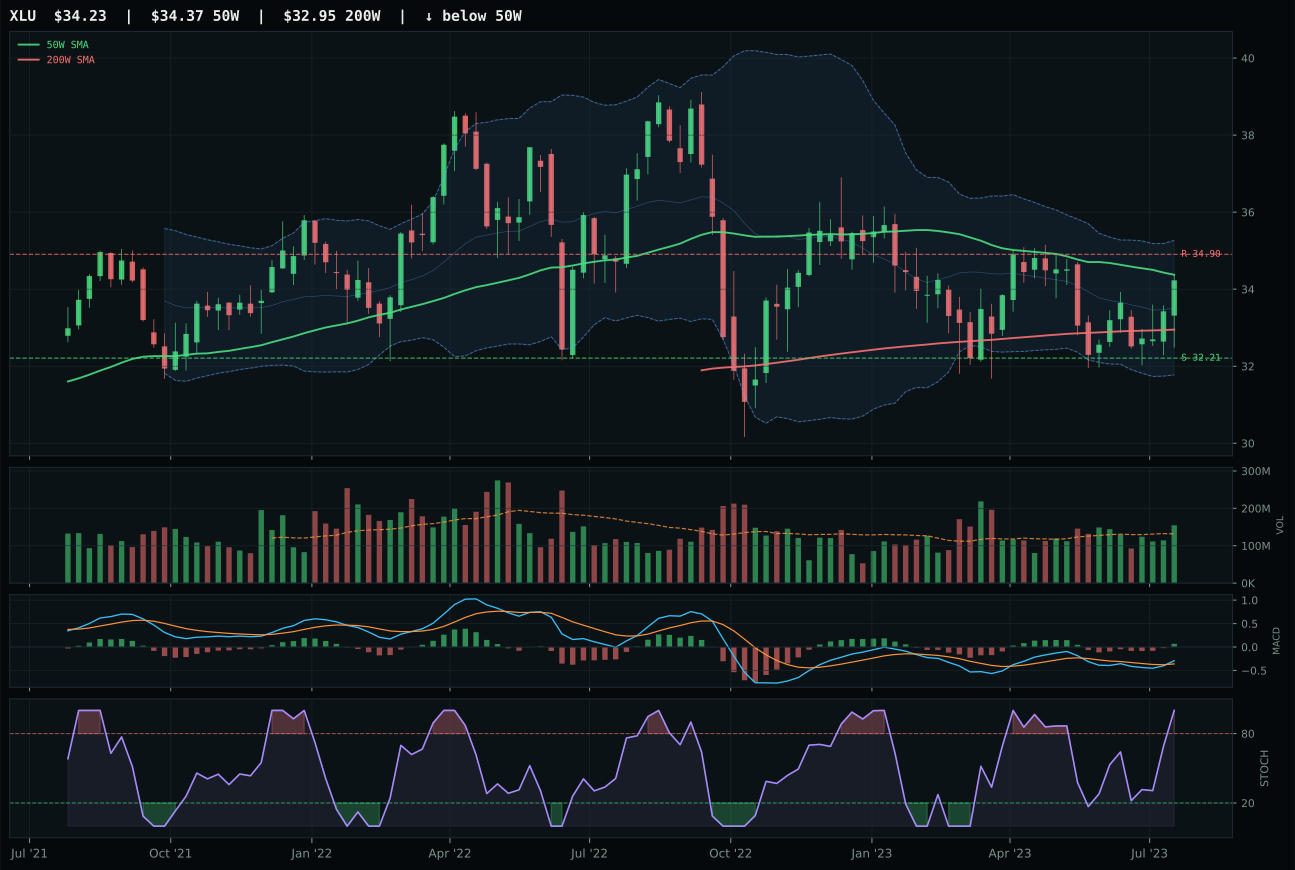
XLU has a compression near 50W profile with -11.4% 13-week relative strength versus SPY.
A failed hold above support would weaken the setup.
Actionable but governed by invalidation levels.
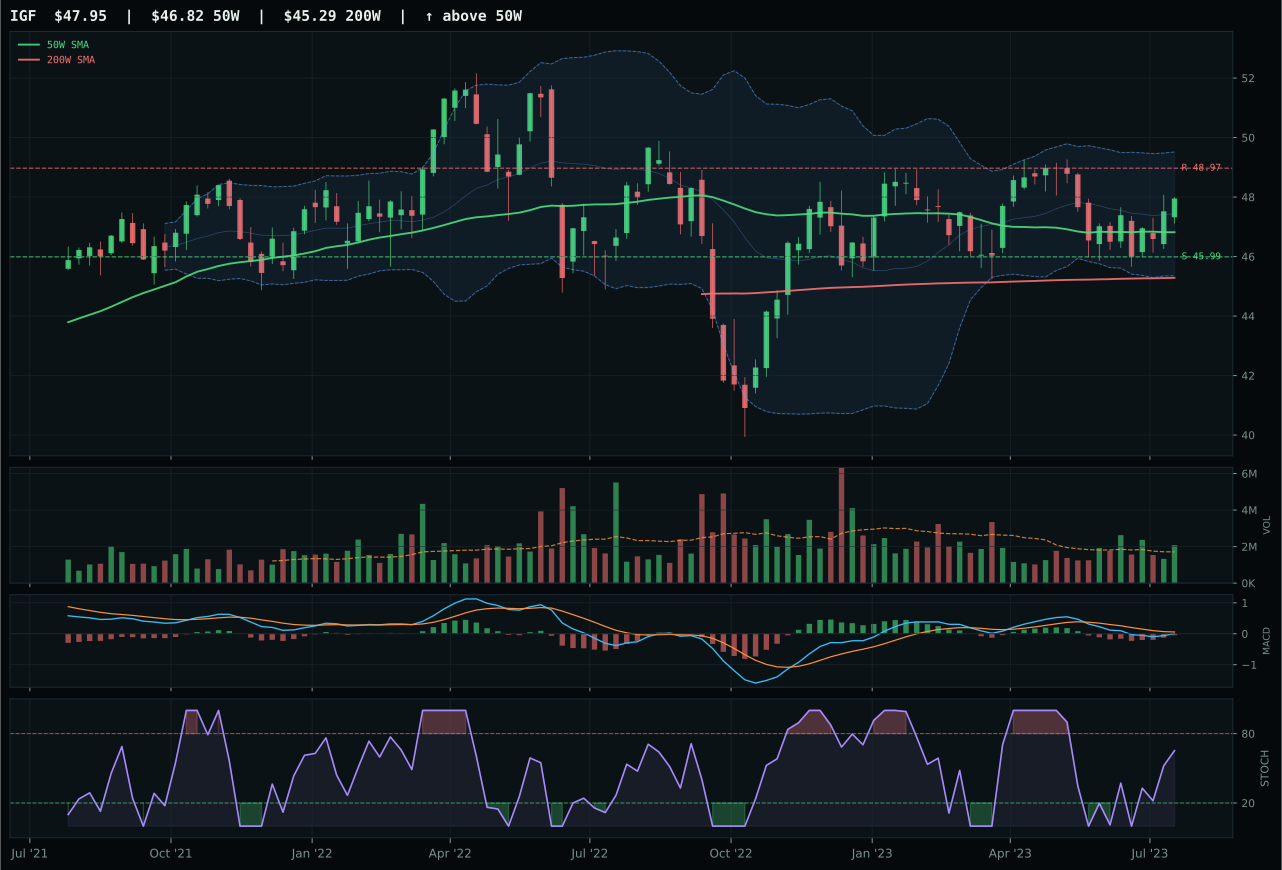
IGF has a pullback into support profile with -11.2% 13-week relative strength versus SPY.
A failed hold above support would weaken the setup.
Actionable but governed by invalidation levels.
PAVE dominated Utilities & Infrastructure with perfect 100.0/100 trend score and 100.0/100 momentum confirmation, creating a dual-axis setup that XLU and IGF could not replicate. Price sits 15.5% above the 50W with above-average volume (1.24x) and bullish-and-improving MACD—the hallmark of institutional accumulation rather than retail chase—while commanding a +17.1% category-relative strength edge that obliterated any competition. XLU's pullback into compression and -11.4% SPY underperformance made it a defensive default, not an active choice; PAVE's 6.1% 4-week return and improving MACD momentum confirm the infrastructure thesis is accelerating, not stalling. The 37.0/100 timing score reflects extension risk, but when momentum and relative strength this clean pair with volume this strong, timing becomes secondary to participation.
Utilities & Infrastructure earned 10% allocation and placed second in the category rankings because PAVE's technical dominance combines with a favorable macro setup. Category-level macro fit is 62.0, driven by disinflation helping this exposure at plus 7, transition/mixed at plus 4, and disinflation pressure active at plus 6. Liquidity stress at minus 3 and risk appetite positive at minus 2 are minimal headwinds. This is a genuinely constructive environment for domestic capex and infrastructure spending, where falling rates support bond-financed projects and disinflation removes inflation premiums from construction costs. PAVE's 93.1 technical evidence score anchors a conviction allocation. The setup is extended at 15.5% above the 50-week, which normally warrants caution, but the above-average participation proves this is accumulation, not exhaustion. This is a top-2 category because it combines strong technicals with strong macro tailwinds. The position holds as long as PAVE stays above the 26.63 support and MACD remains improving; if price breaks below support on distribution volume, this shrinks immediately to 5%.
Industrial Metals — COPX
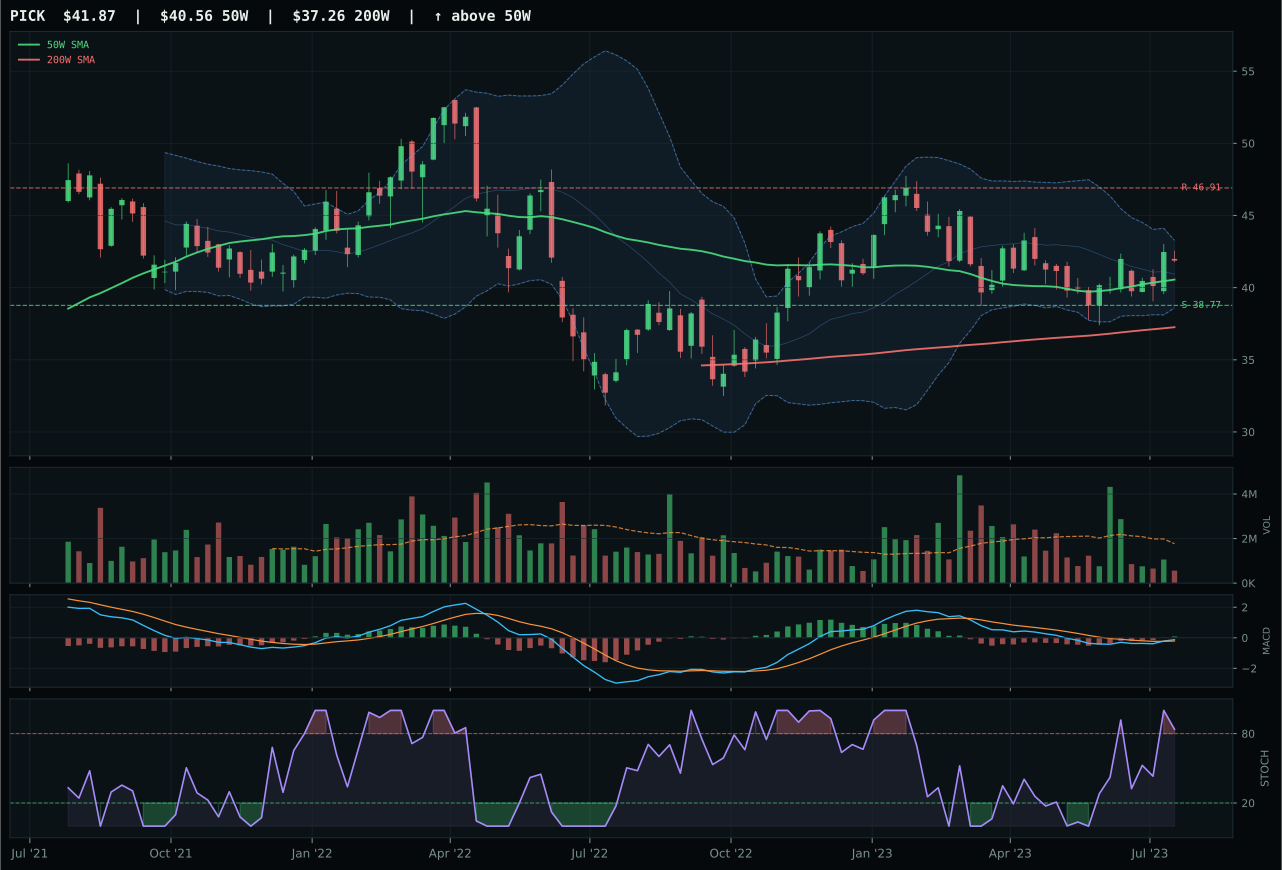
PICK has a neutral structure profile with -10.0% 13-week relative strength versus SPY.
A failed hold above support would weaken the setup.
Actionable but governed by invalidation levels.
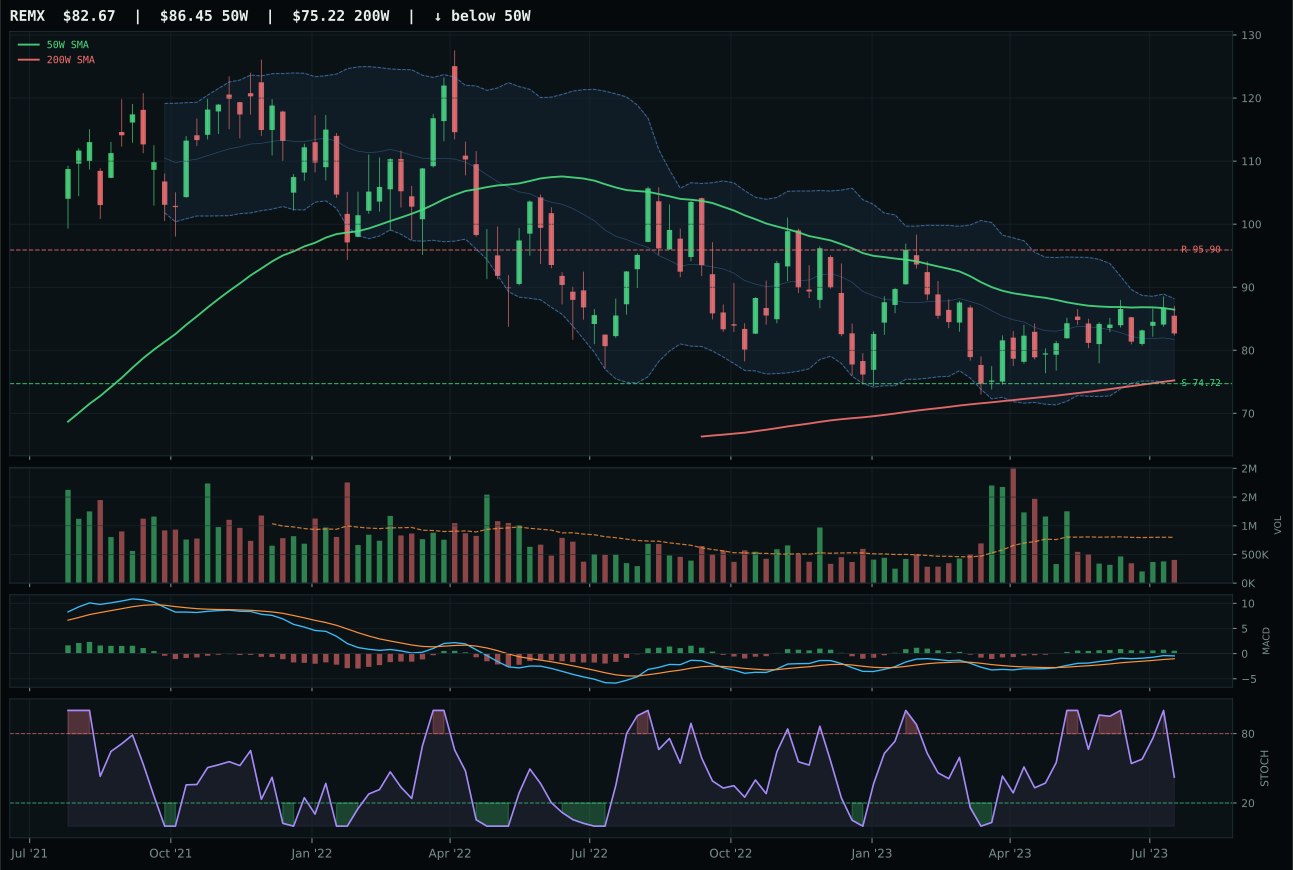
REMX has a neutral structure profile with -4.9% 13-week relative strength versus SPY.
A failed hold above support would weaken the setup.
Actionable but governed by invalidation levels.
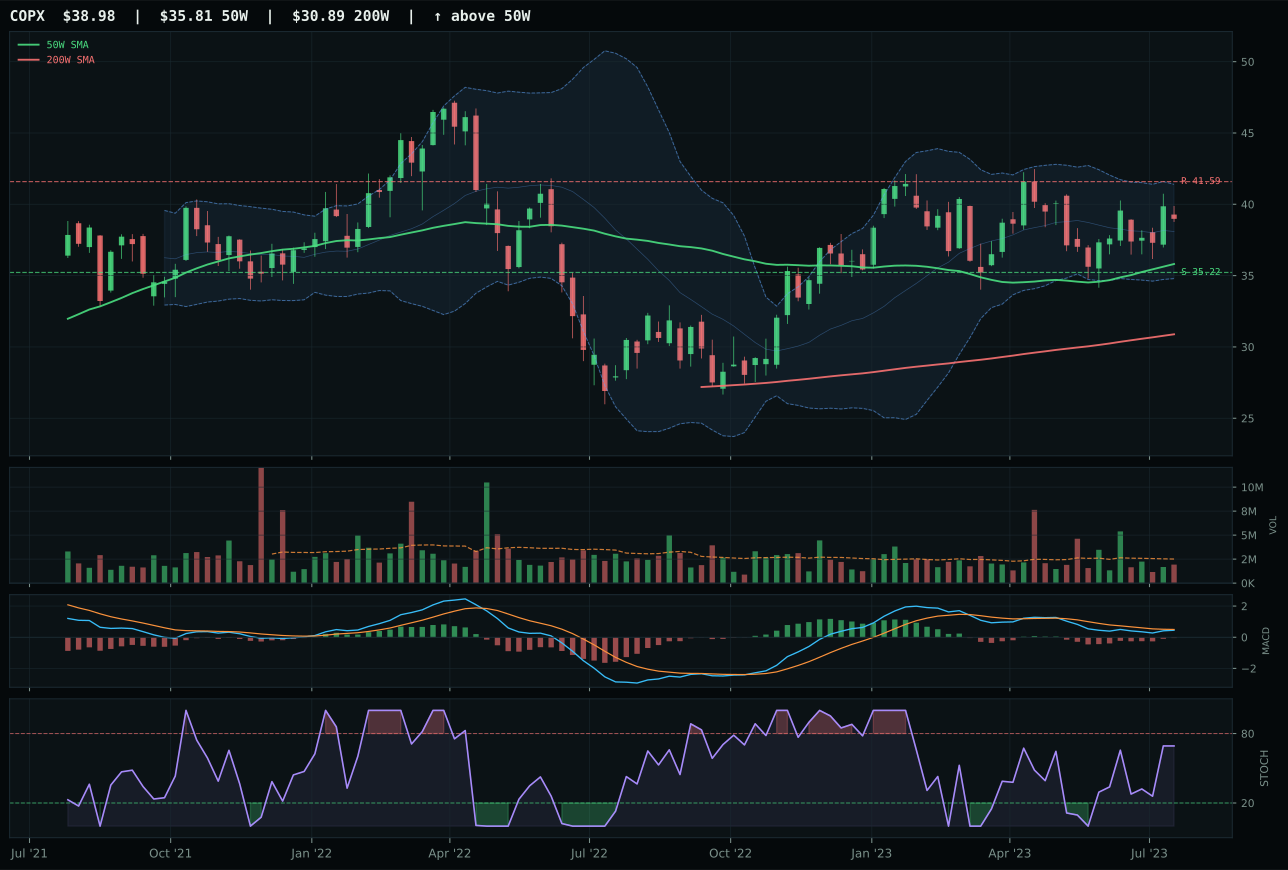
COPX has a neutral structure profile with -12.7% 13-week relative strength versus SPY.
A failed hold above support would weaken the setup.
Actionable but governed by invalidation levels.
COPX won Industrial Metals despite negative 13W momentum (-3.0%, the worst in its basket) by presenting the most honest setup: bearish-but-improving MACD and rising stochastic RSI (0.69) in the middle retracement zone rather than overbought, paired with neutral volume that allows for accumulation without false conviction. PICK's superior technical score (73 vs 66) and positive momentum (+0.0% 13W return) was undercut by its setup in overbought stochastic territory with thin volume participation—the profile of a bounce, not a reversal. COPX's -12.7% SPY relative return is brutal, yet in a metals category where every name is underwater against equities, the one showing internal MACD improvement while holding neutral volume gets the nod as the least bad technical case.
Industrial Metals earned 5% allocation because the category score of 53.6 sits comfortably in the upper half of the allocation spectrum, ranking fourth among ten. Category-level macro fit is 65.0—the highest among all categories reviewed—driven by metals scarcity at plus 14, commodity breadth positive at plus 10, and real asset sponsorship at plus 6. These positives are only partially offset by liquidity stress at minus 8 and credit stress at minus 7. The technical setup in COPX is modest at 57.3 due to weak momentum, but the macro narrative is compelling. Disinflation actually supports industrial metals pricing because scarcity becomes the binding constraint rather than demand destruction. This category would earn 10% if COPX's momentum confirmation climbed above 50 or if PICK's thin participation converted to accumulation participation. Until then, this is a tactical 5% hold that can scale up rapidly if the macro descriptors strengthen further or if price breaks above the 41.59 resistance with volume confirmation.
Nuclear Energy — URA
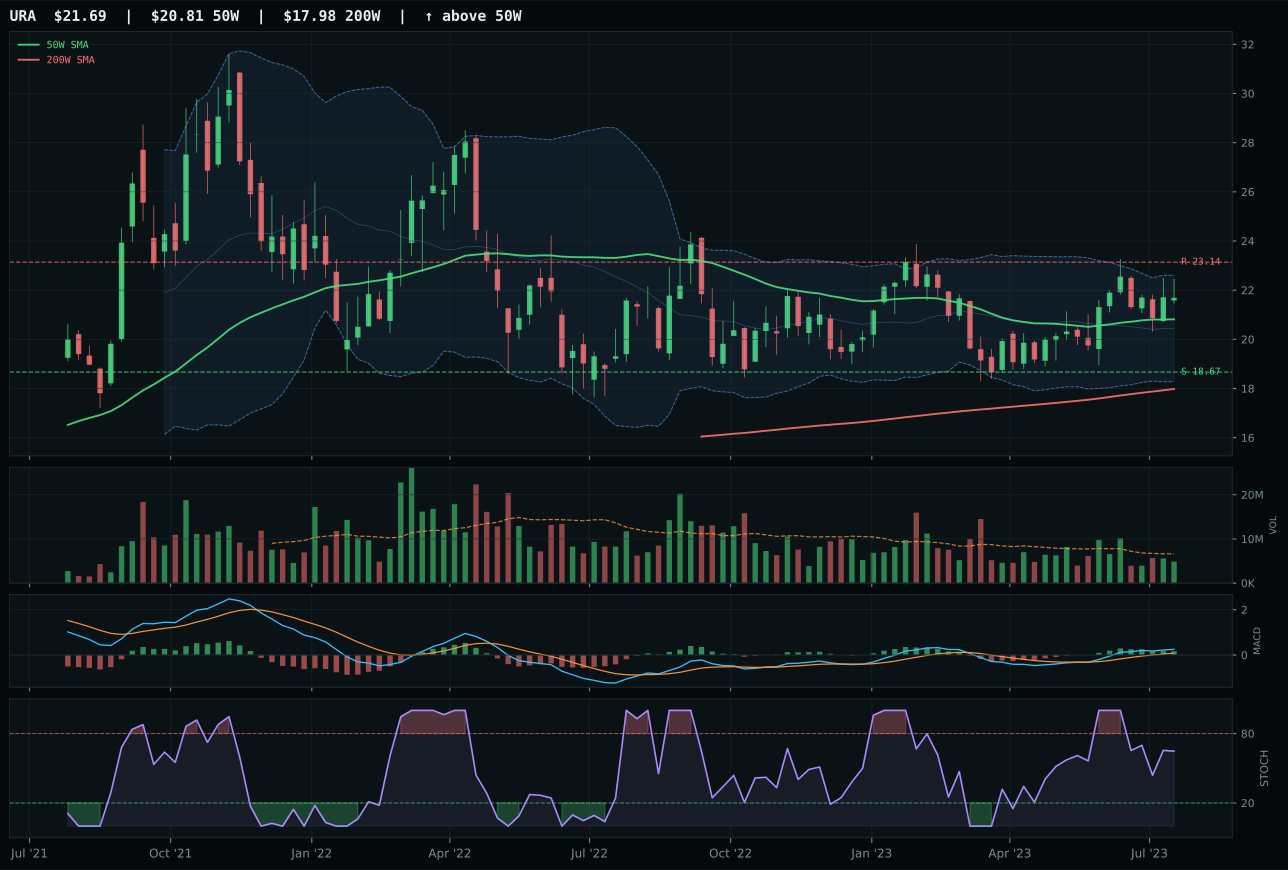
URA has a neutral structure profile with 3.4% 13-week relative strength versus SPY.
A failed hold above support would weaken the setup.
Actionable but governed by invalidation levels.
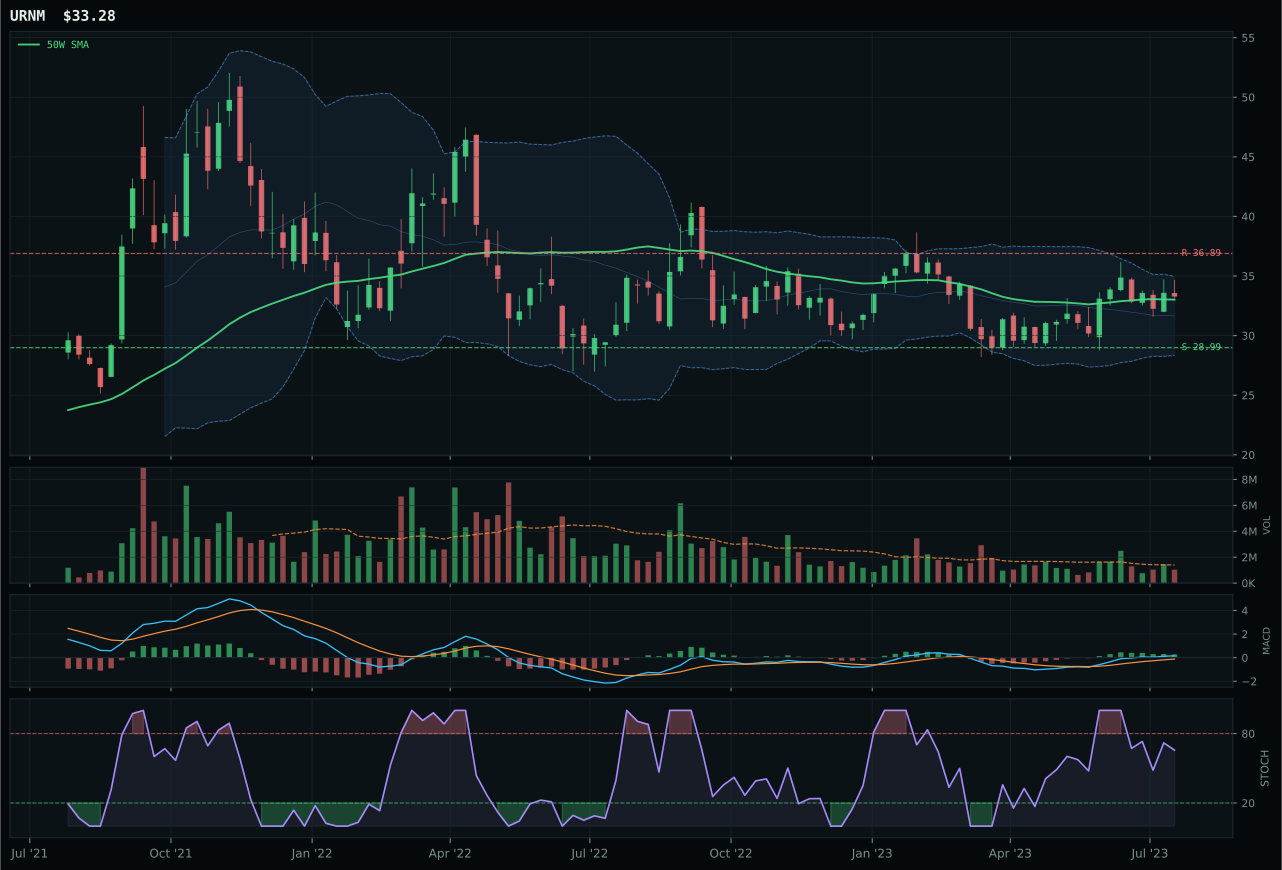
URNM has a compression near 50W profile with 3.6% 13-week relative strength versus SPY.
A failed hold above support would weaken the setup.
Actionable but governed by invalidation levels.
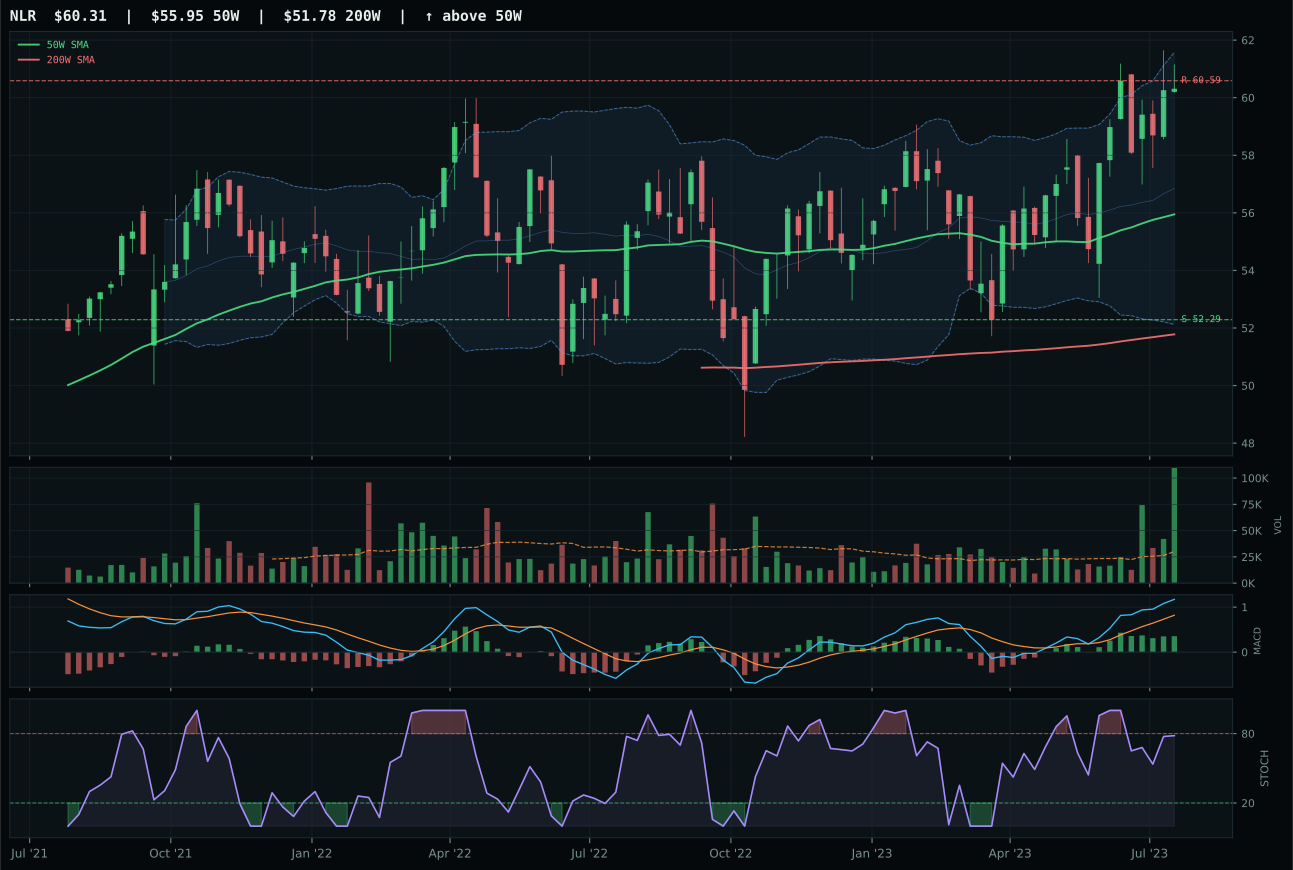
NLR has a neutral structure profile with -0.5% 13-week relative strength versus SPY.
A failed hold above support would weaken the setup.
Tracked, but not top-2 eligible because: .
URA won Nuclear Energy by presenting a clean technical profile with 91.1/100 trend score and neutral-structure setup that allows for measured accumulation rather than desperate chasing. Its 13.1% 13-week return and 3.4% SPY-relative edge create legitimacy, yet the real win versus URNM lies in structure cleanliness (70.3 vs 69.7) and persistence (65.1/100), which confirm that buying has been broad rather than concentrated in a single technical feature. Both names trade with MACD bullish-but-flattening and thin participation (0.74x for URA), but URA's neutral structure versus URNM's compression near the 50W means URA offers more flexibility to run higher without forcing a reset. The 4.2% distance to the 50W creates room to chase without catching a falling knife.
Nuclear Energy earned 5% allocation because the category score of 52.6 ranks fifth overall and the technical setup in URA is materially sound despite macro fit being only 50.0. Real asset sponsorship is active at plus 7, and AI growth sponsorship at plus 5 adds a dual-driver narrative—uranium for energy production and also the power demands of AI computing clusters. These positives are offset by liquidity stress at minus 7 and credit stress at minus 5, leaving macro net-neutral. URA's technical evidence of 70.8 anchors this allocation; the 91.1 trend score and 92.0 timing score are high-conviction signals. The thirteen-week return of 13.1% is solid, and momentum confirmation at 72.8 is respectable. This category would scale to 10% if momentum confirmation rose above 80 or if AI growth sponsorship descriptor climbed above plus 10. Downside risk is clear: if price closes below the 18.67 support or MACD rolls bearish while stochastic RSI continues falling, the setup breaks and this shrinks to 0%.
Emerging Markets — ILF
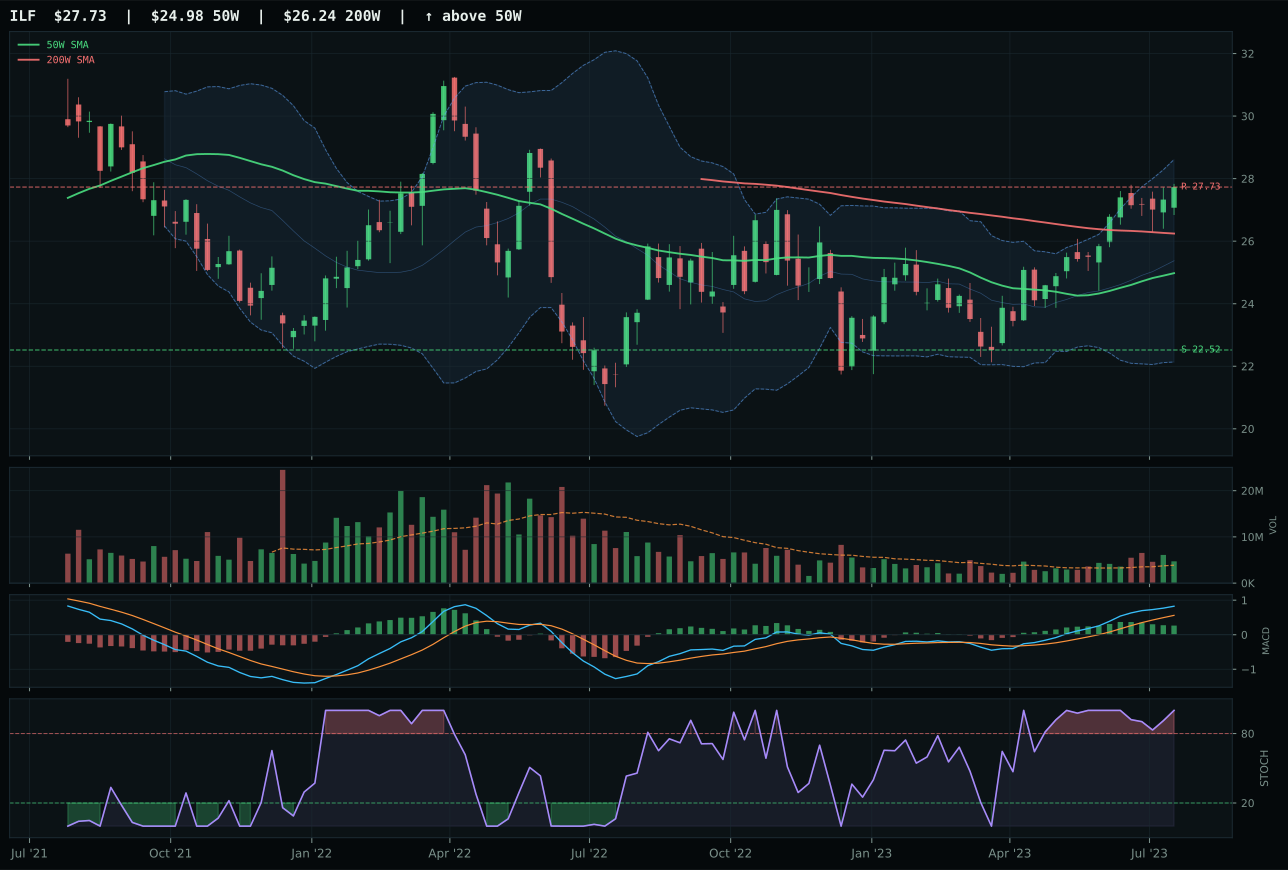
ILF has a neutral structure profile with 5.3% 13-week relative strength versus SPY.
A failed hold above support would weaken the setup.
Actionable but governed by invalidation levels.
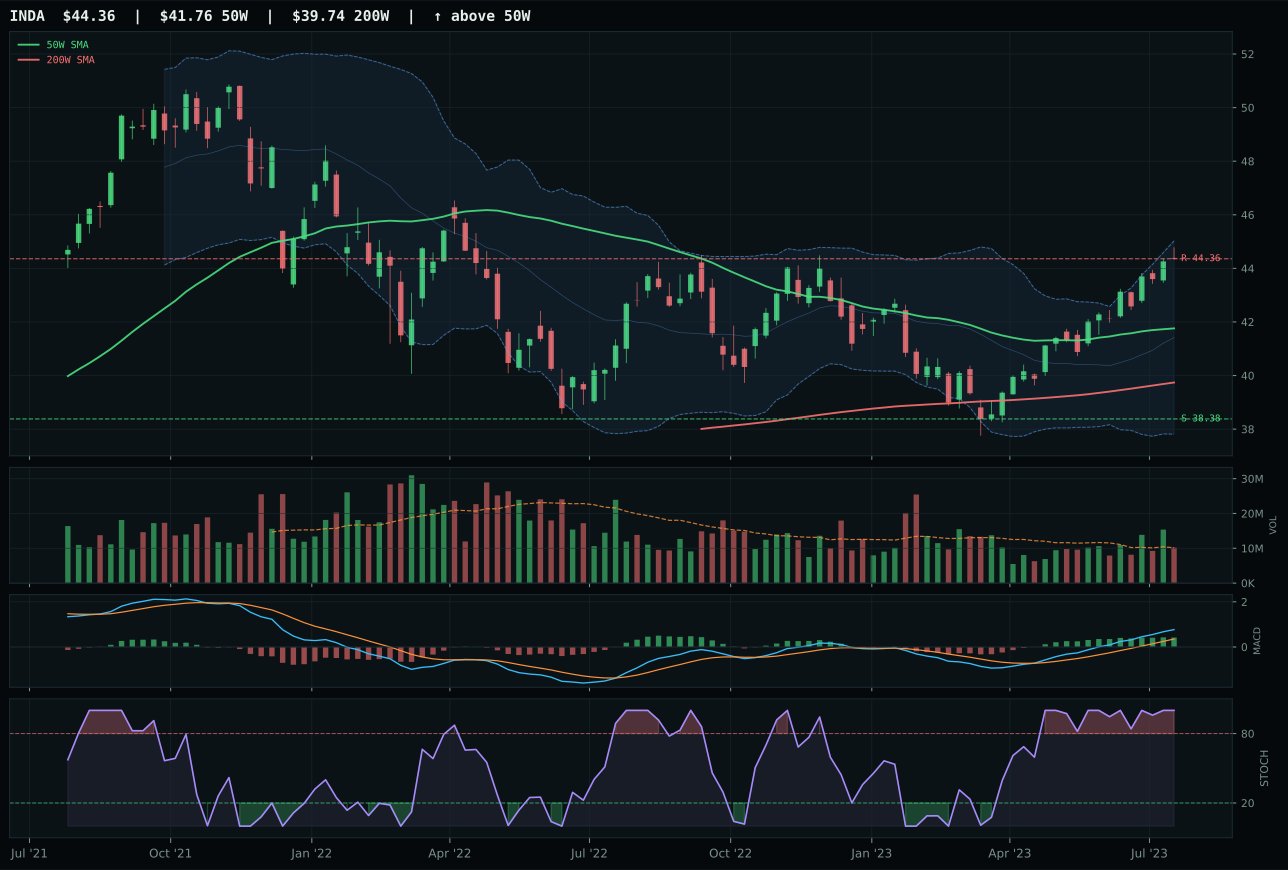
INDA has a neutral structure profile with 1.5% 13-week relative strength versus SPY.
A failed hold above support would weaken the setup.
Actionable but governed by invalidation levels.
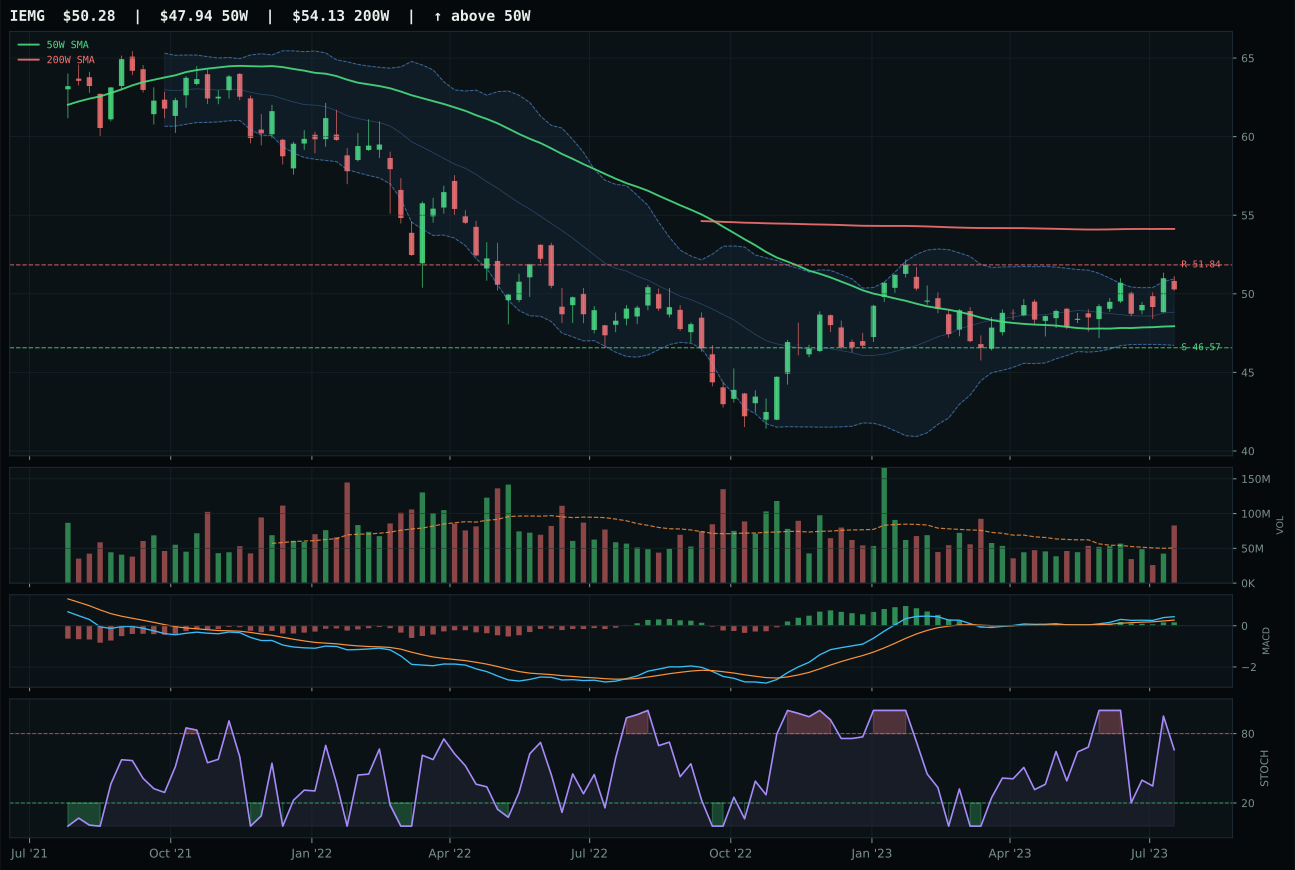
IEMG has a neutral structure profile with -5.7% 13-week relative strength versus SPY.
A failed hold above support would weaken the setup.
Actionable but governed by invalidation levels.
ILF won Emerging Markets by combining the strongest category-relative strength (3.8% versus the basket median) with superior structure cleanliness (82.4 vs INDA's 76.5), translating into volume-price confirmation at 78.8/100 that neither INDA nor IEMG could match. ILF's 15.0% 13-week return and 5.3% SPY outperformance establish conviction, yet the decisive edge is macro: ILF's commodity and value beta gains traction as disinflation pressure intensifies, whereas India-quality exposure (INDA) relies on growth-at-a-premium narratives that compress in falling-rate regimes. INDA's MACD bullish-and-improving is superior to ILF's bullish-but-flattening, yet it trades at 11.0% extension above the 50W versus ILF's 11.0%, so timing doesn't rescue INDA's setup.
Emerging Markets earned 5% allocation because the category score of 51.9 ranks sixth among ten and ILF's technical case is genuinely compelling despite macro headwinds. Category-level macro fit is only 38.0, dragged lower by credit stress at minus 10 and liquidity stress at minus 10 points. Risk appetite positive at plus 8 and commodity breadth positive at plus 8 provide some offset, but the macro regime is clearly headwind. ILF's 79.6 technical evidence score is strong enough to override the macro reservation—the thirteen-week return of 15.0%, category-relative strength of 3.8%, and volume confirmation at 1.22x average show that Latin America is accumulating despite broader EM pressure. This allocation holds at 5% as long as price stays above the 22.52 support and momentum confirmation remains above 85. The position would scale to 10% only if credit stress or liquidity stress descriptors reverse, or if commodity breadth positive jumps above plus 12. If price breaks below support or volume contracts to thin participation, this shrinks to 0%.
Defense & Aerospace — XAR
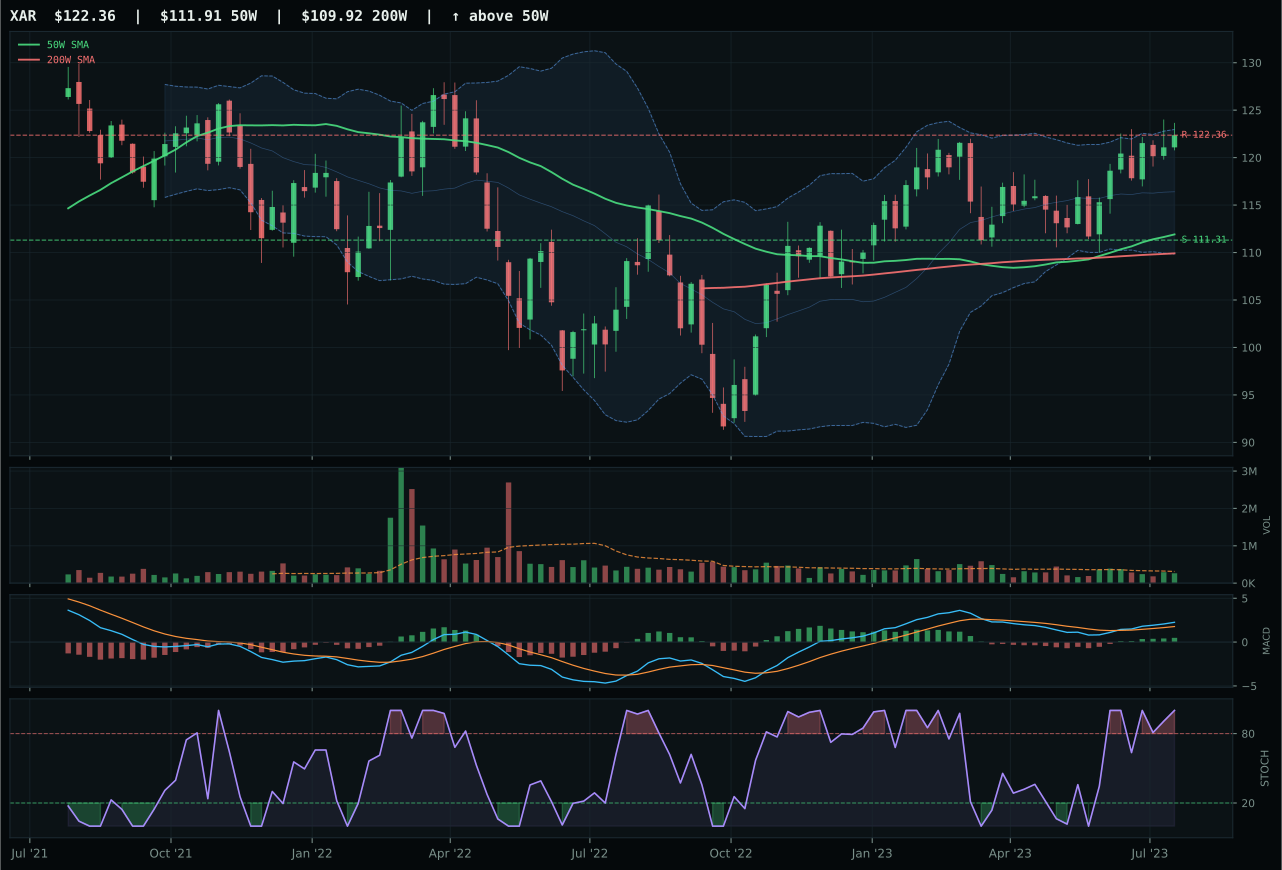
XAR has a neutral structure profile with -4.2% 13-week relative strength versus SPY.
A failed hold above support would weaken the setup.
Actionable but governed by invalidation levels.
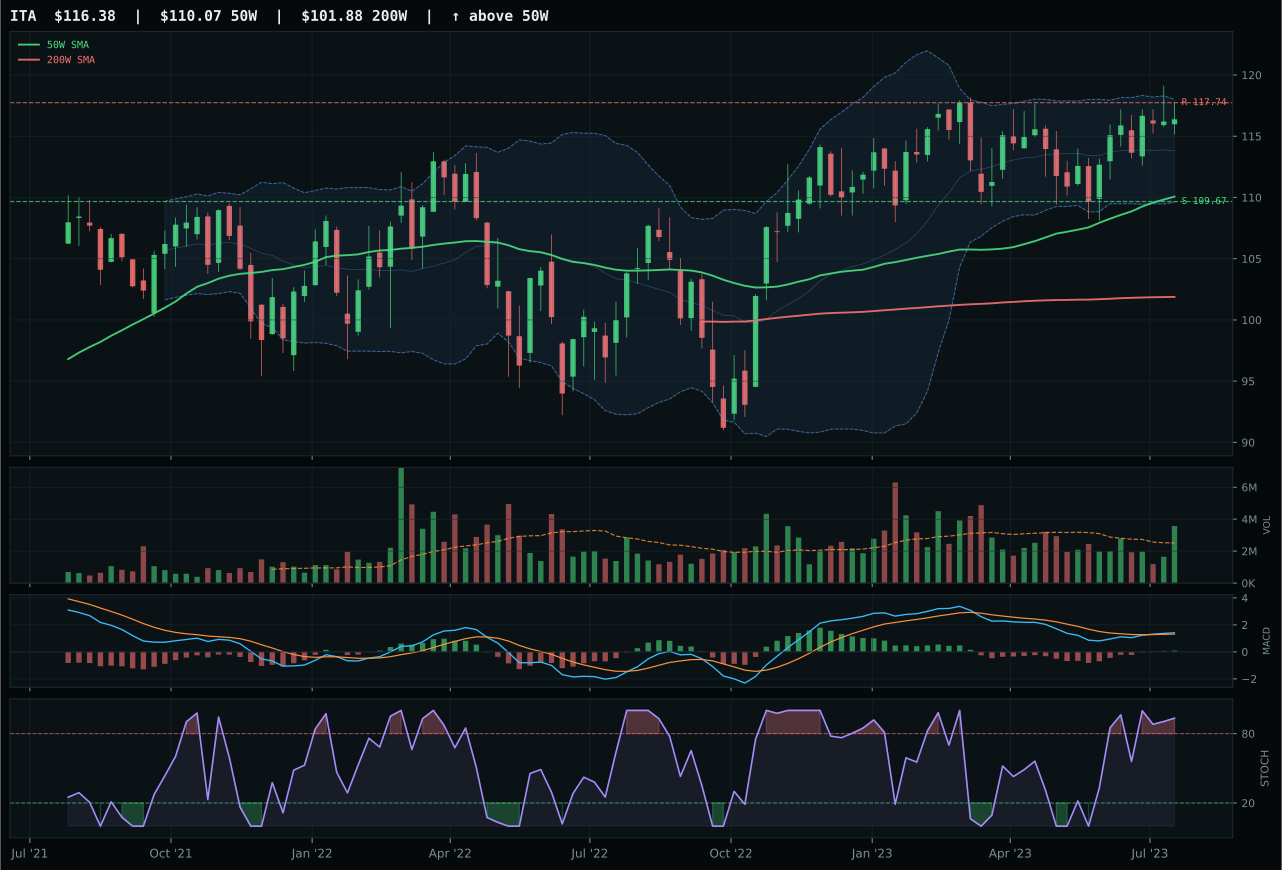
ITA has a neutral structure profile with -9.0% 13-week relative strength versus SPY.
A failed hold above support would weaken the setup.
Actionable but governed by invalidation levels.
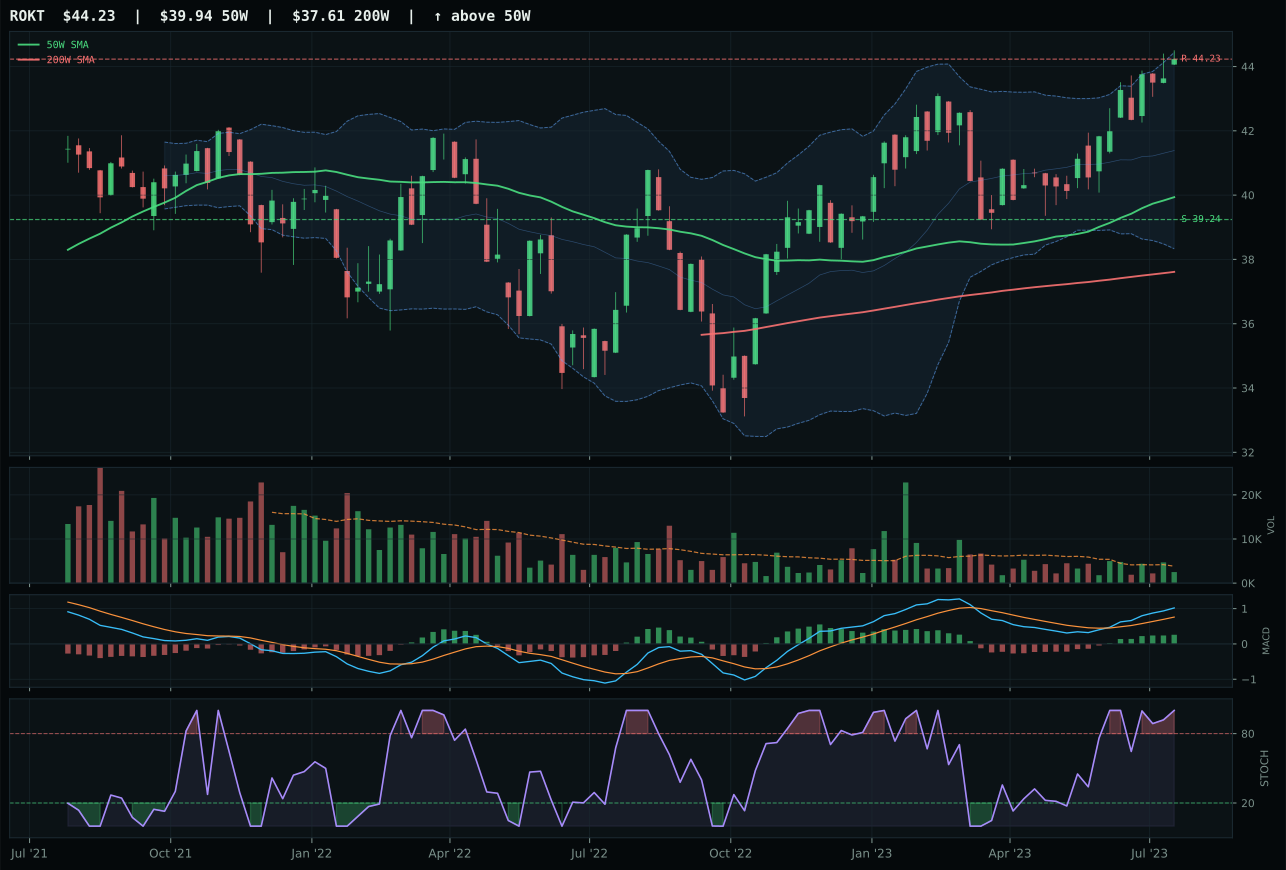
ROKT has a neutral structure profile with -1.0% 13-week relative strength versus SPY.
A failed hold above support would weaken the setup.
Tracked, but not top-2 eligible because: .
XAR won Defense & Aerospace despite a -4.2% SPY-relative return over 13 weeks by virtue of being the only name in the basket with improving MACD momentum and an entry point that doesn't require catching a falling knife. Price sits just 9.3% above the 50W with compression at 82.3/100, creating a tight risk-reward setup (51.5/100) that rewards patience more than price-chasing. ITA's 10.1-point score gap versus XAR tells the full story: ITA owns worse timing (57.0 vs 75.0), weaker risk-reward (40.4 vs 51.5), and MACD rolling over despite initial bullish momentum, indicating the move in defense stocks may be tiring. XAR's neutral volume and bullish-improving MACD create the profile of a name buyers are revisiting after pulling back, not one being abandoned.
Defense & Aerospace earned its 5% allocation because the category score of 49.1 sits comfortably above the zero-allocation threshold despite ranking eighth overall. Technical evidence is 74.3, which is respectable for a neutral-structure setup, but macro fit is only 50.0 because no category-specific descriptor profile exists in the active checklist. The category benefits modestly from transition/mixed (+3) and credit stress acting as a minor tailwind (+2), but these are weak signals compared to what liquidity stress drags away (minus 4). This is a hold-and-monitor position—XAR has shown no deterioration in the technical setup, MACD is improving, and stochastic momentum remains overbought with conviction. If the 50-week slope turns negative or volume contracts below 0.70x average, this allocation shrinks to 0% immediately. The upside case requires macro descriptors to activate; the downside is a slow bleed.
Precious Metals — SLV
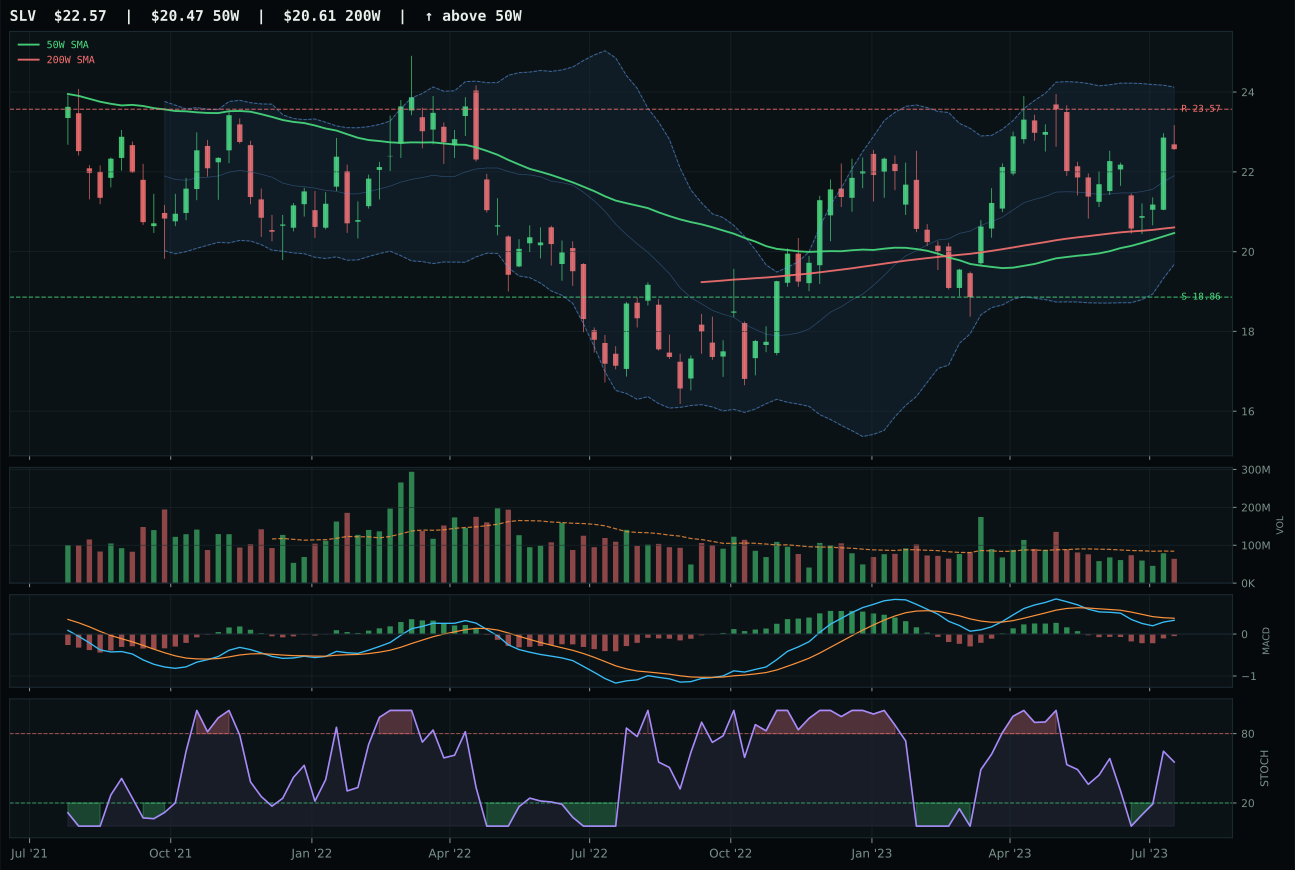
SLV has a neutral structure profile with -11.5% 13-week relative strength versus SPY.
A failed hold above support would weaken the setup.
Actionable but governed by invalidation levels.
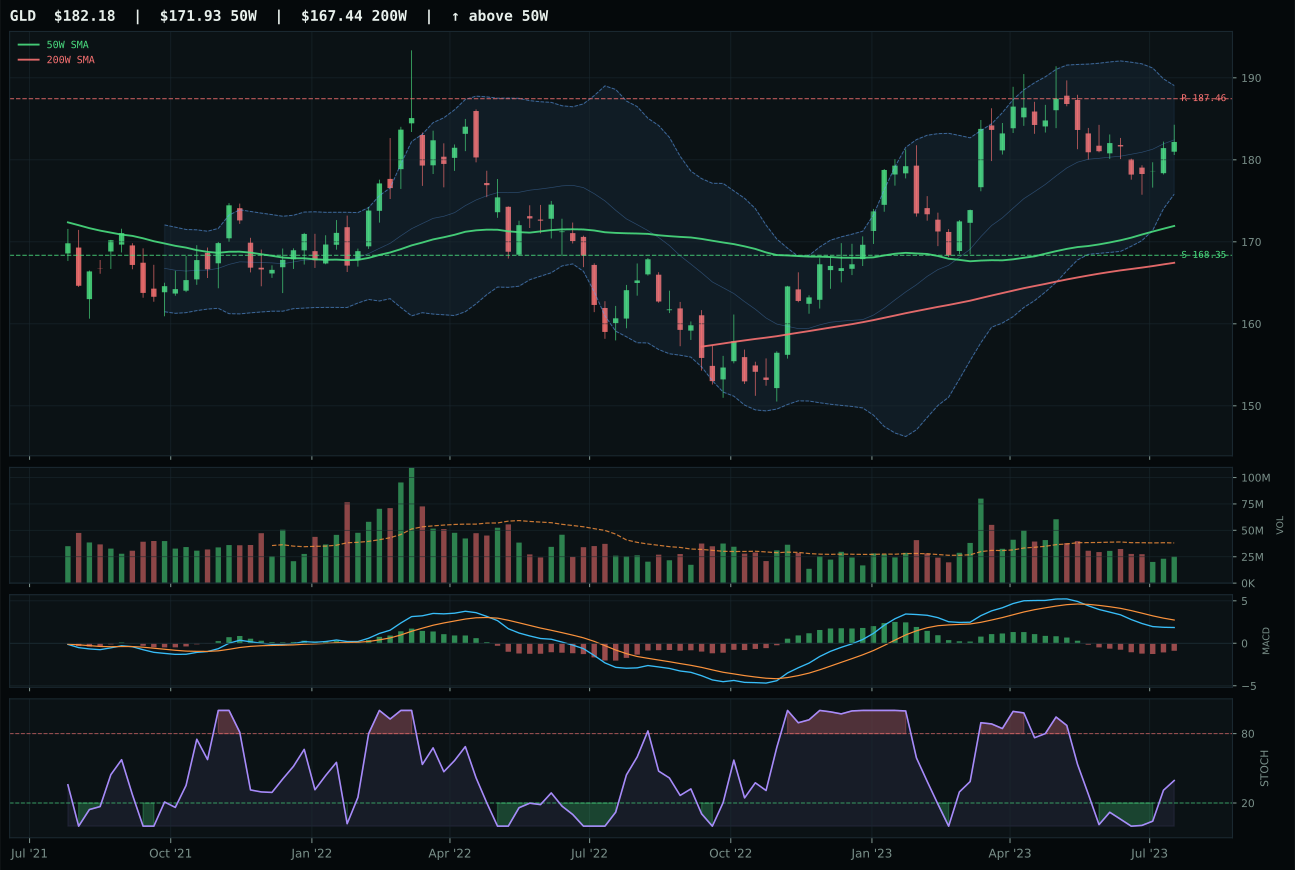
GLD has a neutral structure profile with -10.8% 13-week relative strength versus SPY.
A failed hold above support would weaken the setup.
Actionable but governed by invalidation levels.
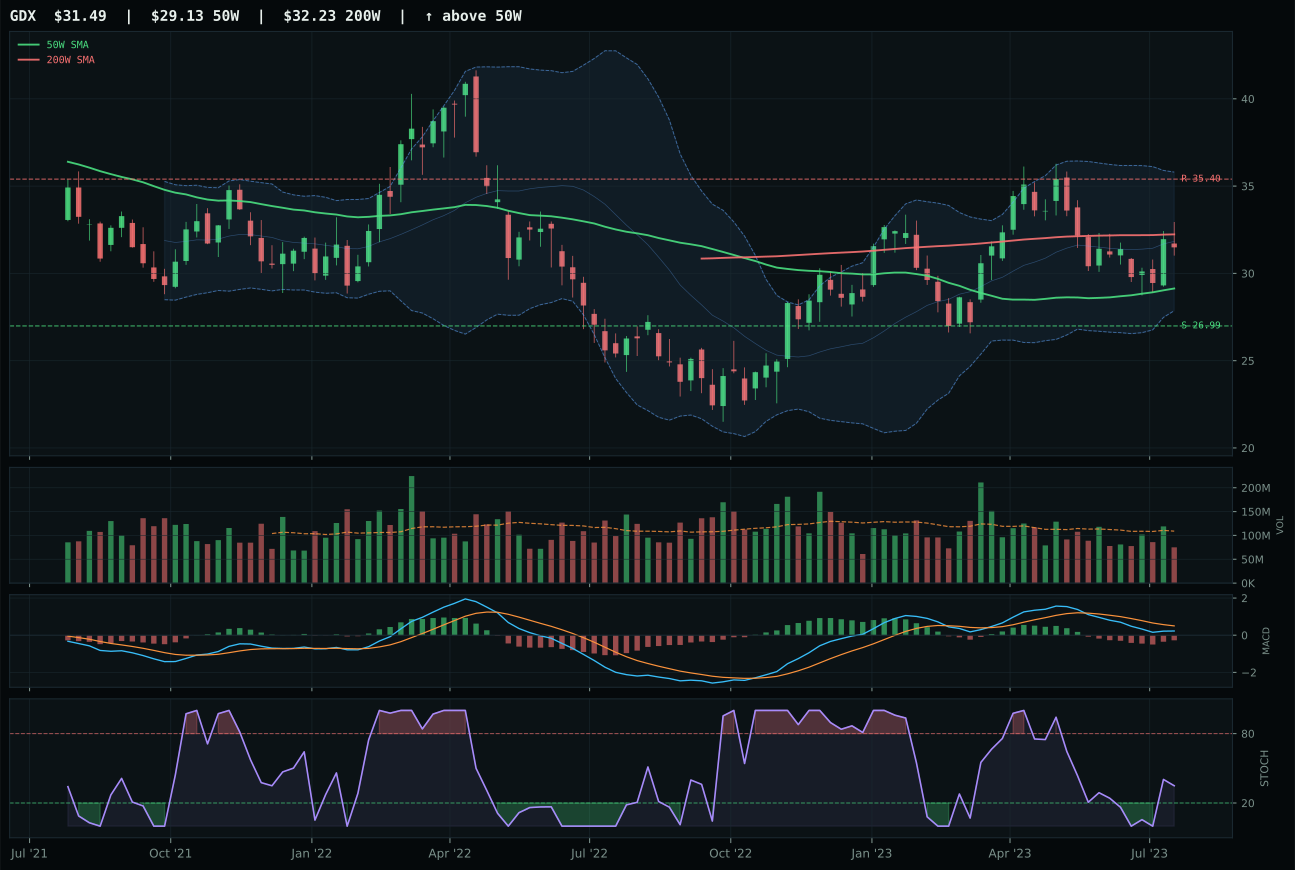
GDX has a neutral structure profile with -16.0% 13-week relative strength versus SPY.
A failed hold above support would weaken the setup.
Actionable but governed by invalidation levels.
SLV edged GLD by a single feature: neutral volume participation versus GLD's thin participation, a marginal but decisive difference in a category where MACD setup and Fibonacci alignment are nearly identical across both names. Both sit in the upper retracement zone with rising stochastic RSI (0.55) and bearish-but-improving MACD, which is the profile of a precious metals rally that has lost momentum but retained structure. SLV's -1.8% 13-week return and -11.5% SPY-relative performance are deeply negative, yet the 10.3% distance to the 50W and neutral volume create the foundation for a relief rally if risk appetite stabilizes. GLD's thin participation suggests weak buying, whereas SLV's neutral volume allows for accumulation without broadcasting aggressive sponsorship—in metals, quiet strength beats loud weakness every time.
Precious Metals earned 5% allocation because the category score of 48.4 sits squarely in the middle-of-the-pack allocation slot—not compelling enough for top-2, not weak enough for zero. Category-level macro fit is 60.0, driven by disinflation pressure at plus 8 and disinflation as a macro regime at plus 7; these support a goldilocks narrative where falling inflation makes real assets more attractive. Metals scarcity is active at plus 7, adding conviction. However, liquidity stress at minus 5 and the broader macro tension—that deflation benefits savers but pressures commodity demand—keeps the category from acceleration. SLV's technical evidence of 61.6 is adequate but not dominant, and the thirteen-week return of minus 1.8% is genuinely weak. This is a core hedge allocation, not a conviction trade. The position holds as long as MACD remains improving and stochastic RSI continues rising into the 0.70 zone; if either rolls over or price closes below the 18.86 support, this allocation becomes a 0%.
AI — SMH
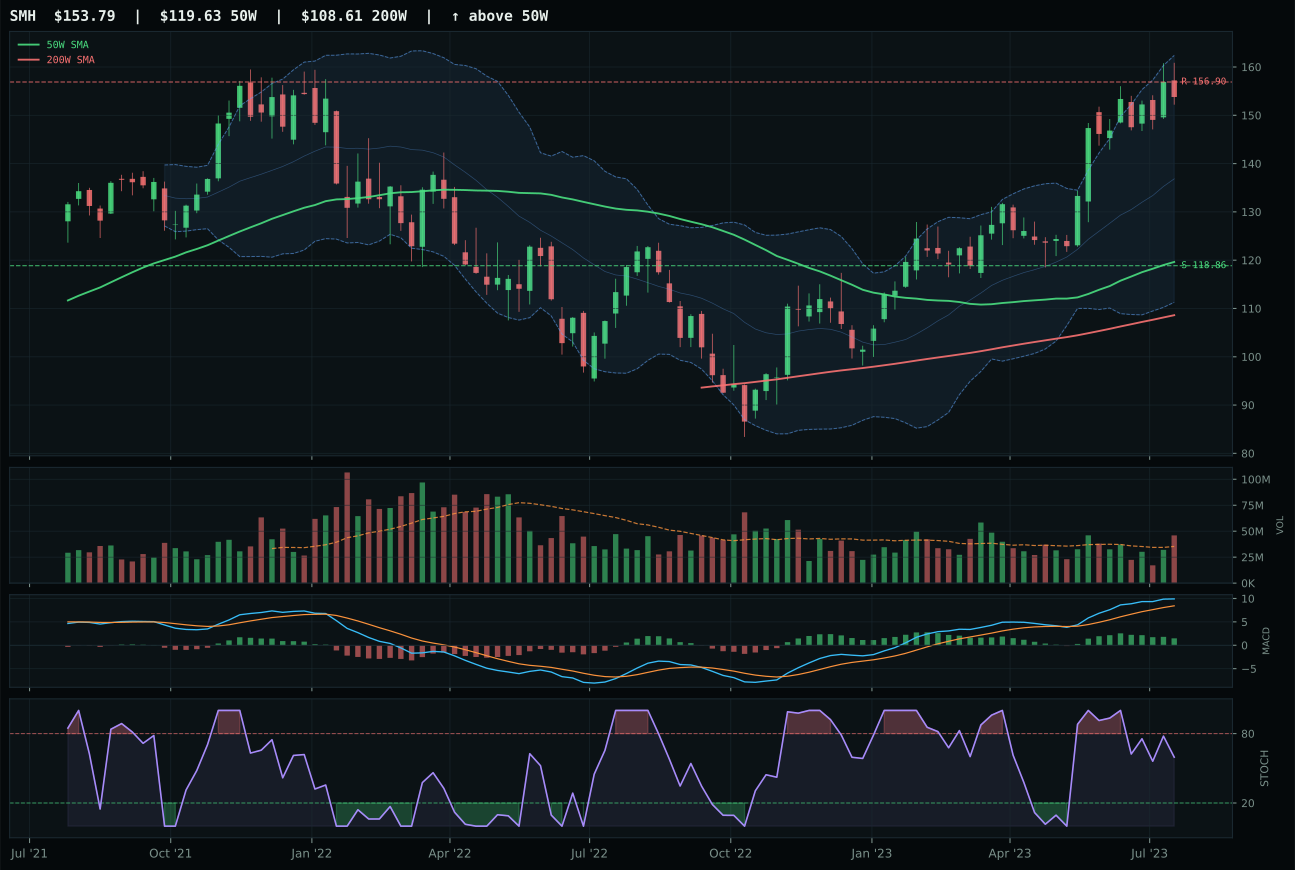
SMH has a vertical extension profile with 14.2% 13-week relative strength versus SPY.
A failed hold above support would weaken the setup.
Actionable but governed by invalidation levels.
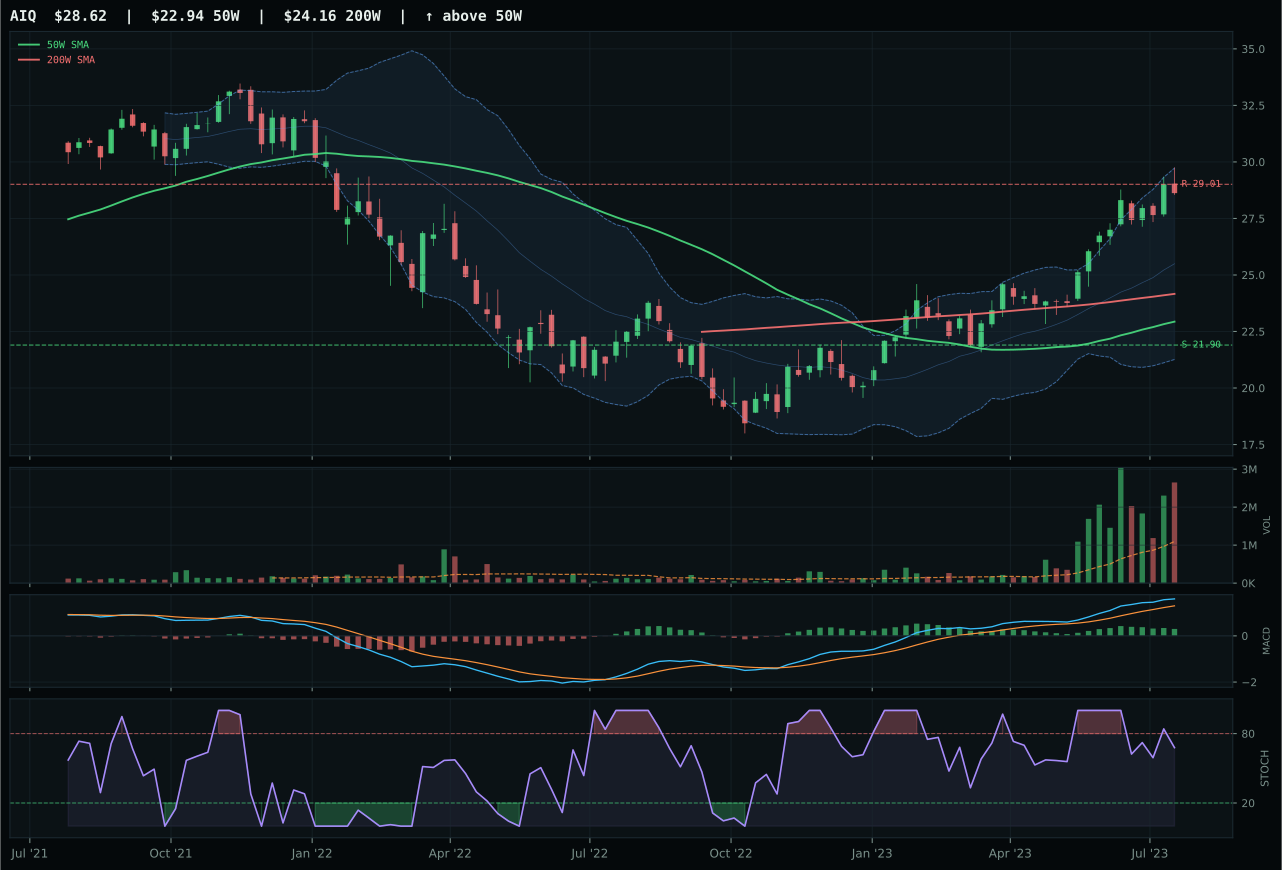
AIQ has a vertical extension profile with 11.0% 13-week relative strength versus SPY.
A failed hold above support would weaken the setup.
Actionable but governed by invalidation levels.
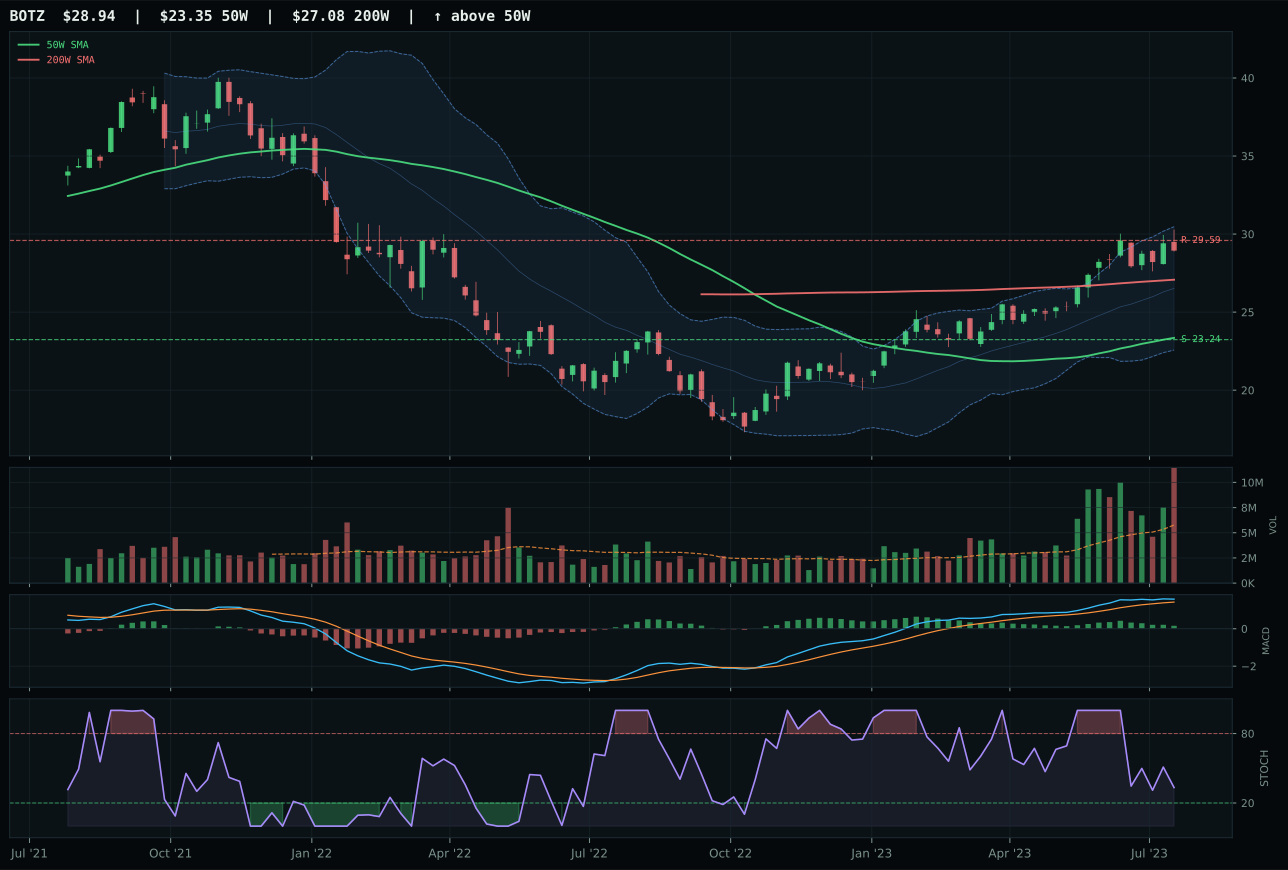
BOTZ has a vertical extension profile with 5.1% 13-week relative strength versus SPY.
A failed hold above support would weaken the setup.
Actionable but governed by invalidation levels.
SMH captured the AI category with the cleanest momentum profile despite being priced at 28.6% extension above the 50-week line, a gap that ordinarily would disqualify a candidate but here reflects the ruthlessness of AI compute demand. Volume at 1.30x average and a 14.2% SPY-relative return over 13 weeks created a gap AIQ simply could not close: AIQ's distribution pressure on volume and a 29.8 risk-reward score versus SMH's 38.2 marked the difference between a move being accumulated and one being distributed into. MACD bullish-but-flattening mirrors across both, yet SMH's 23.9% 13-week return and +3.2% category-relative edge made it the only viable representative. AIQ's 35.3/100 technical evidence score—dominated by weak volume-price sponsorship—confirmed that semiconductor supply-chain tightness is pricing semiconductor demand higher than software breadth can support right now.
AI earned its 5% allocation despite a category score of only 48.0 because nuclear energy and emerging markets both sit in single digits and need reinvestment elsewhere. The allocation ranks this category sixth among ten, which is defensible but not enthusiastic. SMH's technical evidence of 70.8 is solid, but the macro narrative fit of 58.0 reveals the tension: risk appetite is active at plus 10 and AI growth sponsorship drives plus 14, but liquidity stress drags minus 10 and credit stress minus 6. The category's final score would need to reach 62 or higher to justify a 10% position; at 48.0, it holds ground only because the SMH setup remains clean and momentum is real. If SMH breaks below 140 or closes the gap between MACD and price, this allocation exits immediately.
Traditional Energy — XLE
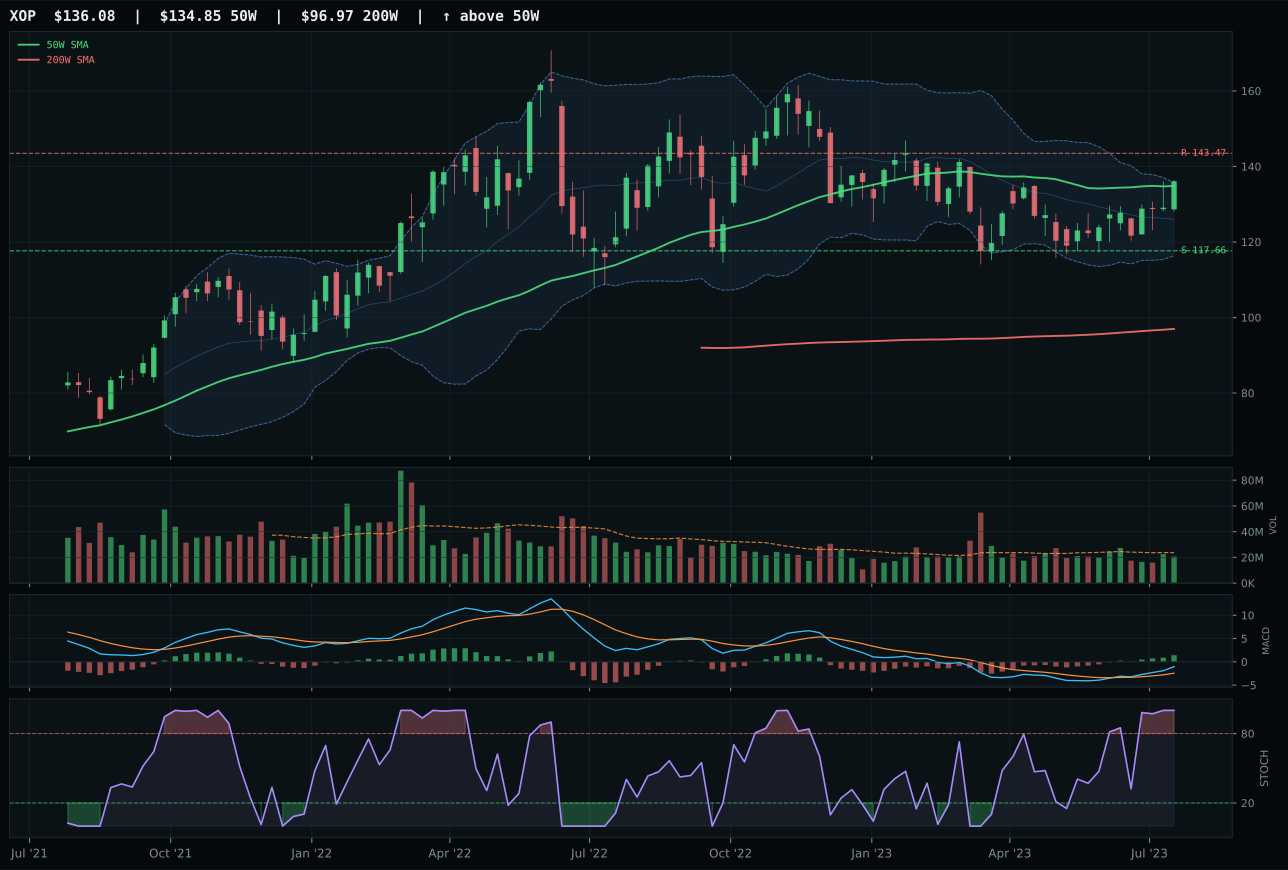
XOP has a compression near 50W profile with -2.5% 13-week relative strength versus SPY.
A failed hold above support would weaken the setup.
Actionable but governed by invalidation levels.
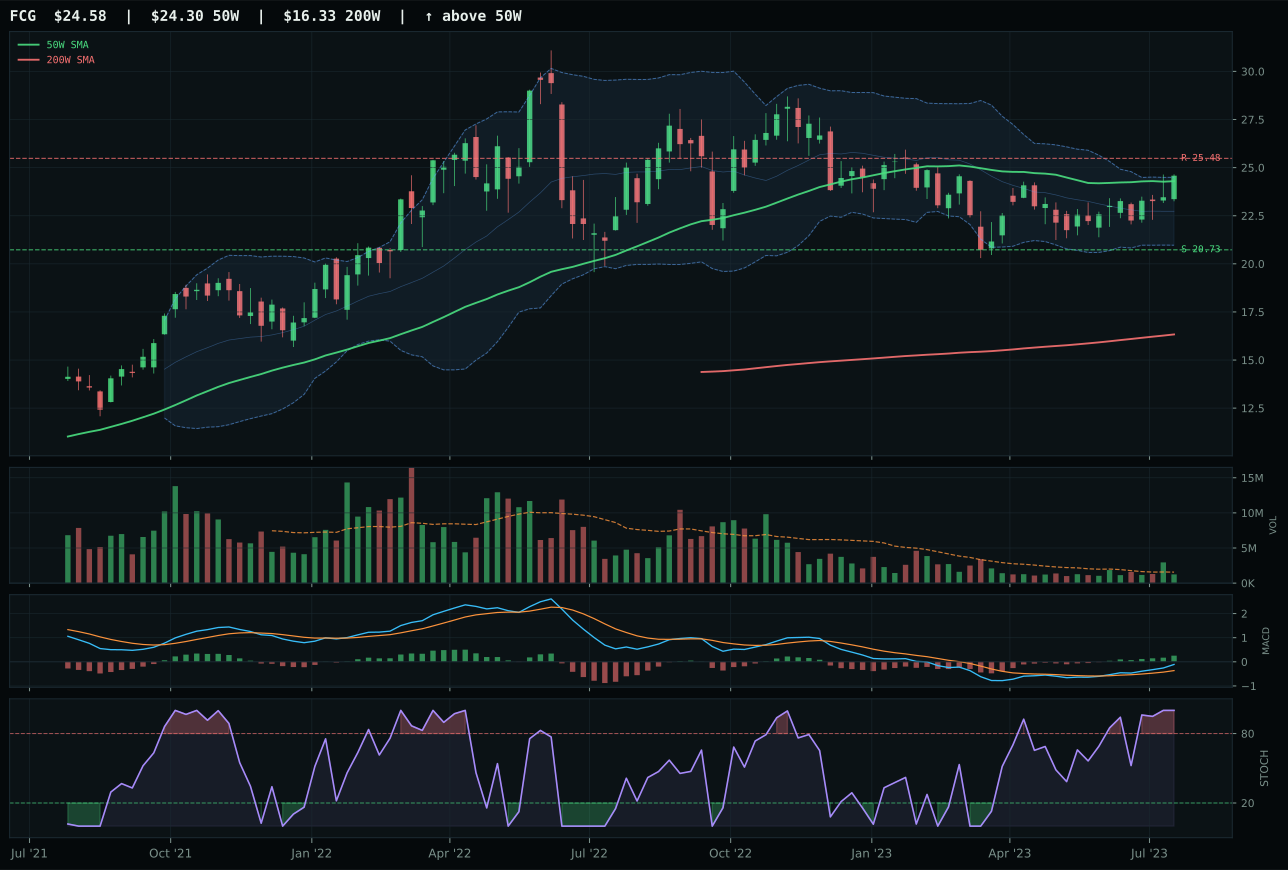
FCG has a compression near 50W profile with -2.8% 13-week relative strength versus SPY.
A failed hold above support would weaken the setup.
Actionable but governed by invalidation levels.
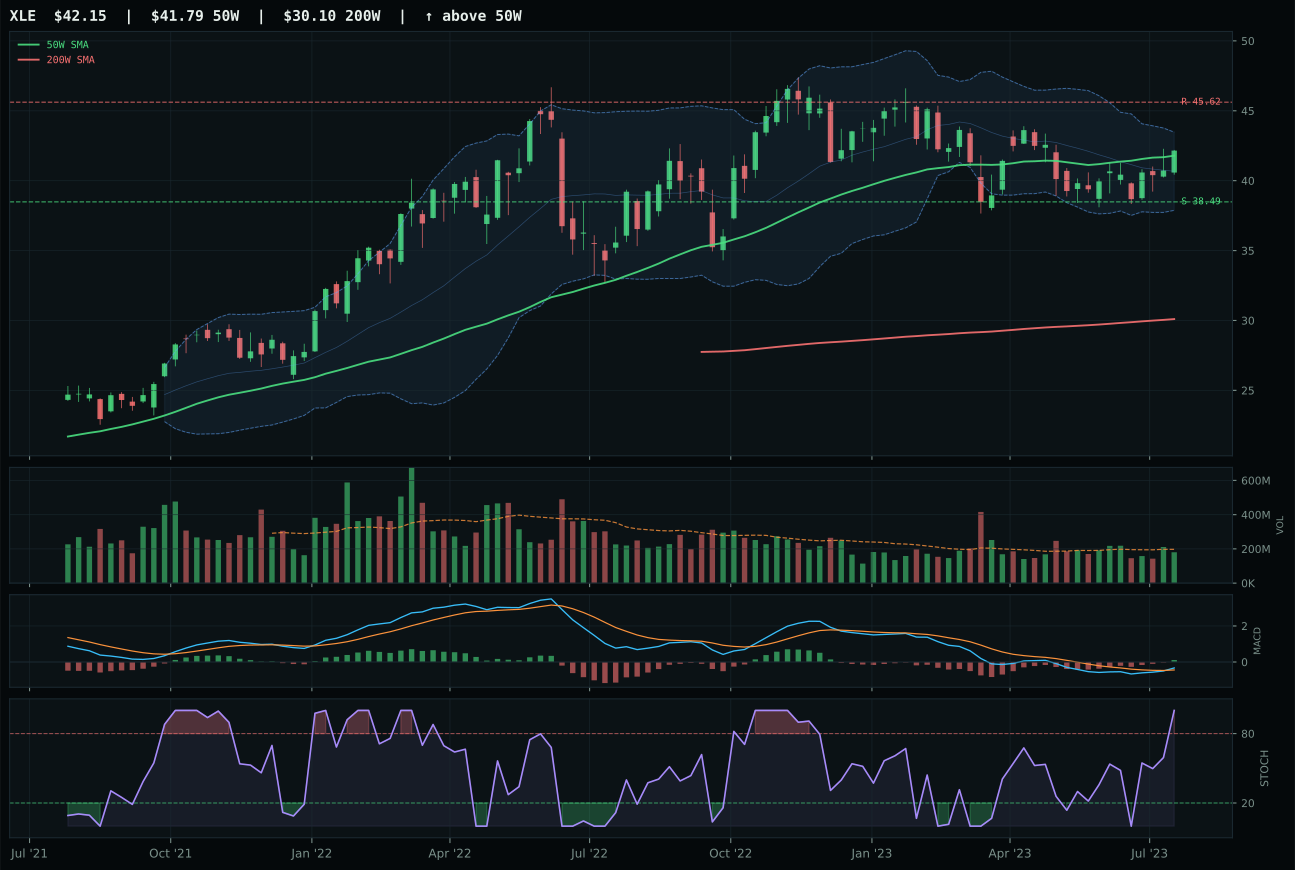
XLE has a compression near 50W profile with -10.5% 13-week relative strength versus SPY.
A failed hold above support would weaken the setup.
Actionable but governed by invalidation levels.
XLE claimed Traditional Energy by accepting its role as the defensive energy play rather than chasing XOP's superior 7.2% 13-week return. XOP's risk-reward of 58.9/100 and technical evidence of 85.8/100 were superior, but its 40.0/100 macro fit—driven by -9 liquidity stress and -8 credit stress—made it a macro trap despite technical strength. XLE's 1.0% distance to the 50W and perfect 100.0/100 timing score created the cleanest entry point in the category, with MACD bullish-and-improving and stochastic at overbought momentum. The -0.8% 13W return is indictment enough of energy's fundamental weakness, yet XLE's 67.4 risk-reward (versus XOP's 58.9) reflects integrated cash flows providing downside protection that pure exploration beta cannot match.
Traditional Energy earned zero allocation and ranks tenth among ten categories because its category score of 47.0 reflects the brutal macro regime. Category-level macro fit is only 23.0, dragged lower by disinflation hurting the exposure at minus 10 and disinflation pressure active at minus 10 points. Real asset sponsorship at plus 7 provides only minimal offset. Energy is the worst-positioned sector in a disinflation regime because falling inflation expectations reduce commodity demand and degrade the pricing power of energy producers. Even though XLE offers a timing setup near perfect (100 points) and both technical evidence at 66.2 and risk-reward at 67.4 are reasonable, the macro tailwind is absent. This allocation would return to 5% only if credit stress or liquidity stress descriptors reverse, or if disinflation pressure turns inactive. Until the macro regime shifts, even the cleanest technical setup in energy cannot overcome structural headwinds. XLE must hold above the 38.49 support level; any close below that level signals the timing setup has broken and zero allocation is justified.
Agriculture & Livestock — MOO
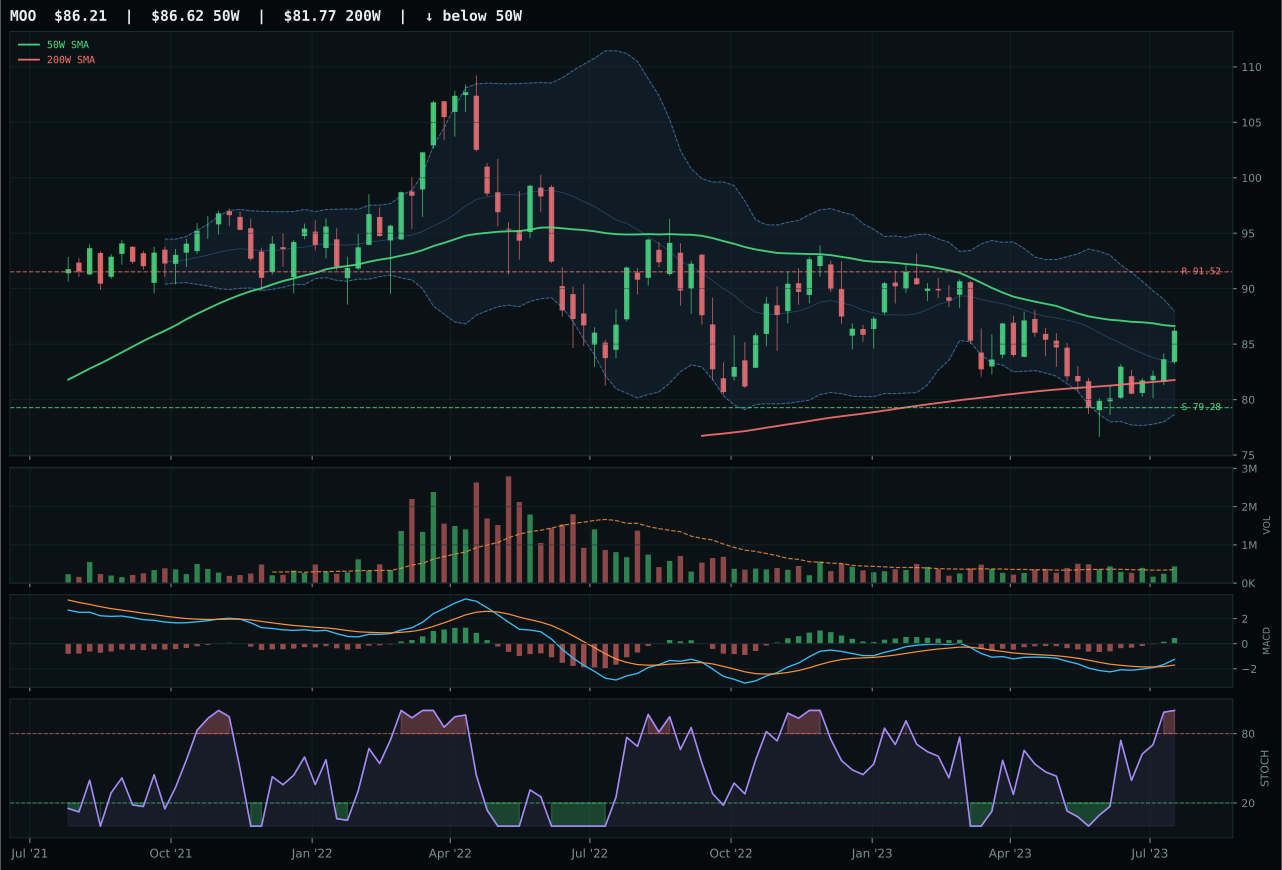
MOO has a compression near 50W profile with -9.5% 13-week relative strength versus SPY.
A failed hold above support would weaken the setup.
Actionable but governed by invalidation levels.
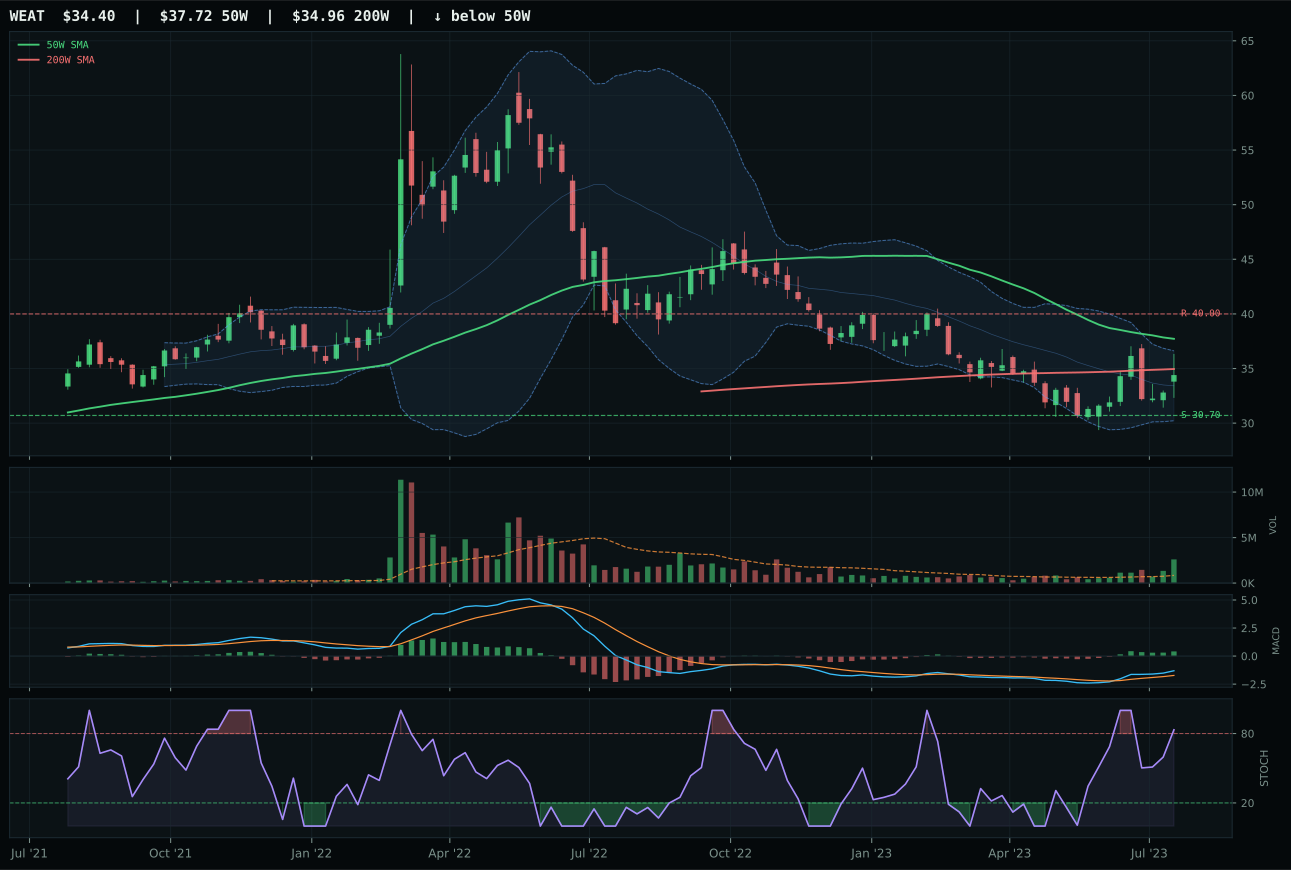
WEAT has a neutral structure profile with -7.6% 13-week relative strength versus SPY.
A failed hold above support would weaken the setup.
Actionable but governed by invalidation levels.
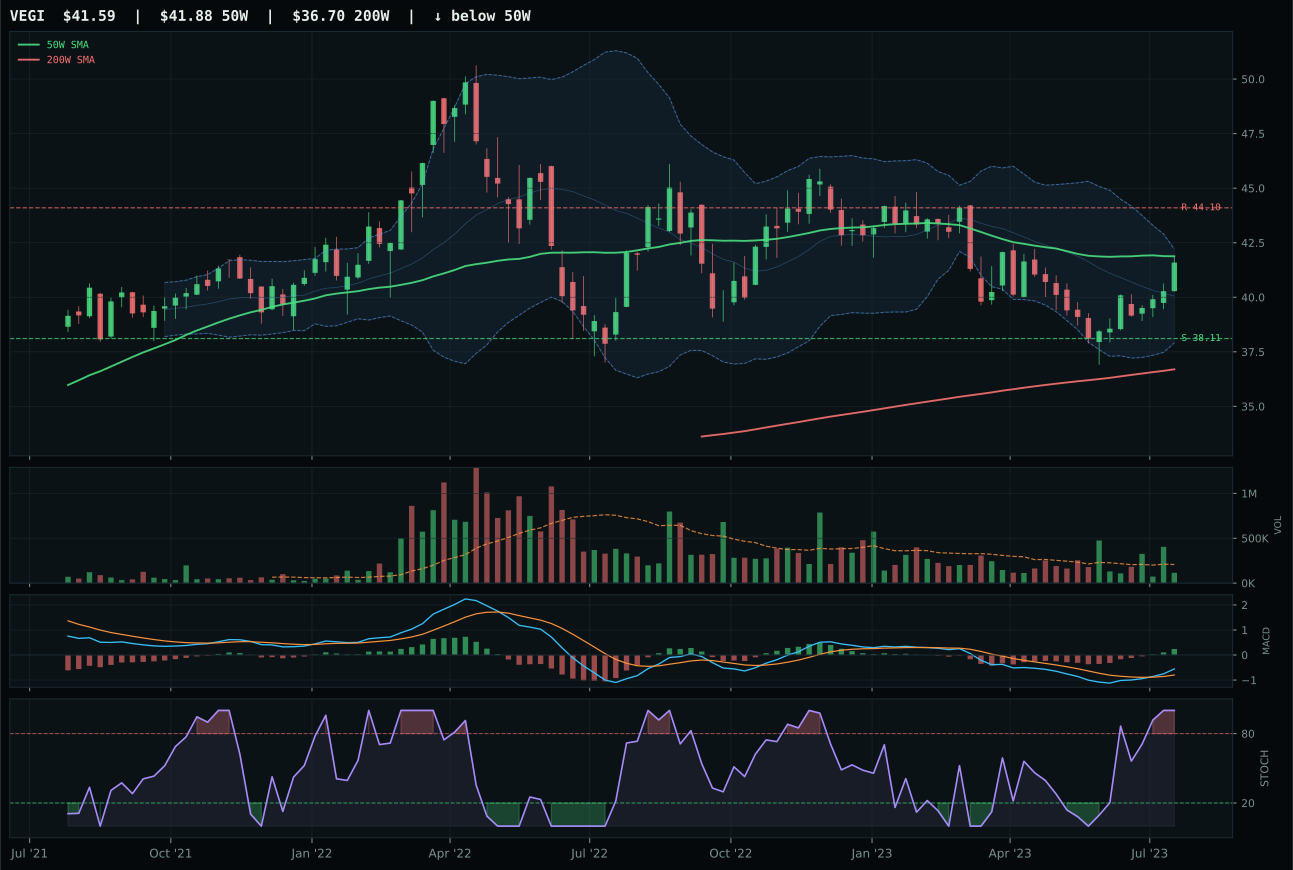
VEGI has a compression near 50W profile with -8.4% 13-week relative strength versus SPY.
A failed hold above support would weaken the setup.
Tracked, but not top-2 eligible because: .
MOO won the Agriculture category by offering the only legitimate mean-reversion setup in a basket of relative weaklings, trading -0.5% from its 50W with compression near the 50W and MACD bullish-and-improving—the technical profile of a reset rather than a collapse. Its 100.0/100 timing score is the highest in the entire portfolio, reflecting the symmetry between price and Fibonacci (0.500 zone), a rare alignment that suggests upside potential if the underlying commodity demand thesis survives. WEAT owned superior 13W momentum at 2.1% versus MOO's 0.2%, but MACD flattening instead of improving cost it the category: in a sector defined by macro headwinds (disinflation -8), picking the name with improving internal momentum over raw return magnitude is the right triage. MOO's above-average volume participation (1.25x) paired with improving MACD in a 0.2% 13W environment signals nibbling, not distribution.
Agriculture & Livestock earned zero allocation and ranks ninth among ten categories because its final score of 29.6 collapses under macro headwinds that disinflation pressure activates at minus 8 points. Category-level macro fit is only 45.0, pulled down by the tension between real asset sponsorship at plus 8 and disinflation pressure at minus 8 and liquidity stress at minus 4. MOO's technical setup is actually solid—trend is 50.8, timing is perfect at 100, and risk-reward is healthy at 65—but the macro regime is simply not constructive. Disinflation means agricultural inflation is being wrung out of the system, which pressures commodity prices and input costs simultaneously. This category would earn a 5% slot only if disinflation pressure turns inactive or if real asset sponsorship climbs above plus 15; neither is imminent. The allocation can revisit this only when agricultural deflation bottoms and technical support at the 79.28 level is held on expanded volume.