
2023-07-14
Informational purposes only. The content in this report, including allocations, analysis, and commentary, is provided solely for informational and educational purposes. It does not constitute financial advice, investment advice, trading advice, or any other type of advice. Past performance does not guarantee future results. Always conduct your own research and consult a qualified financial professional before making investment decisions.
Weekly Allocation
| Ticker | Category | Weight | Role |
|---|---|---|---|
| FBTC | 50% | Overlay | |
| AIQ | AI | 10% | Top-2 (10%) |
| IGV | Technology | 10% | Top-2 (10%) |
| COPX | Industrial Metals | 5% | Tier-2 (5%) |
| PAVE | Utilities & Infrastructure | 5% | Tier-2 (5%) |
| URA | Nuclear Energy | 5% | Tier-2 (5%) |
| XAR | Defense & Aerospace | 5% | Tier-2 (5%) |
| GLD | Precious Metals | 5% | Tier-2 (5%) |
| INDA | Emerging Markets | 5% | Tier-2 (5%) |
Trade Instructions — Monday Open
Sell the tranche from 2023-06-16 (completing its 4-week hold). Buy the new tranche. Instructions show net portfolio changes — same-asset positions cancel, weight changes show the delta.
| Action | Ticker | Instruction |
|---|---|---|
| SELL | COPX | Sell 20% of COPX position (reduce 6.25% → 5.00%) |
| SELL | XLE | Sell 67% of XLE position (reduce 3.75% → 1.25%) |
| SELL | URNM | Sell 33% of URNM position (reduce 3.75% → 2.50%) |
| SELL | SMH | Sell entire SMH position (1.25% of portfolio) |
| SELL | ILF | Sell 33% of ILF position (reduce 3.75% → 2.50%) |
| SELL | WEAT | Sell entire WEAT position (1.25% of portfolio) |
| BUY | IGV | Buy IGV — 14.29% of freed cash (adds 1.25% to portfolio) |
| BUY | AIQ | Buy AIQ — 28.57% of freed cash (adds 2.50% to portfolio) |
| BUY | PAVE | Buy PAVE — 14.29% of freed cash (adds 1.25% to portfolio) |
| BUY | GLD | Buy GLD — 14.29% of freed cash (adds 1.25% to portfolio) |
| BUY | URA | Buy URA — 14.29% of freed cash (adds 1.25% to portfolio) |
| BUY | INDA | Buy INDA — 14.29% of freed cash (adds 1.25% to portfolio) |
Current Portfolio After Trade
Combined holdings across all 4 active tranches. Each tranche is 25% of the portfolio.
| Ticker | % of Portfolio | Weight Bar |
|---|---|---|
| FBTC | 50.00% | |
| AIQ | 10.00% | |
| IGV | 6.25% | |
| COPX | 5.00% | |
| XAR | 5.00% | |
| PAVE | 5.00% | |
| GLD | 5.00% | |
| URA | 3.75% | |
| URNM | 2.50% | |
| ILF | 2.50% | |
| XLK | 2.50% | |
| XLE | 1.25% | |
| INDA | 1.25% |
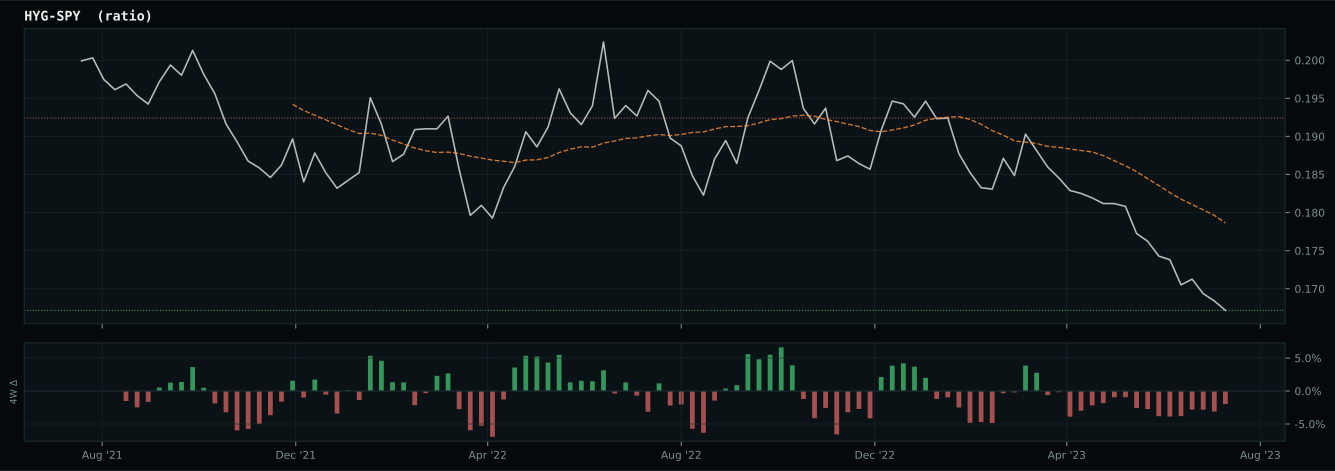
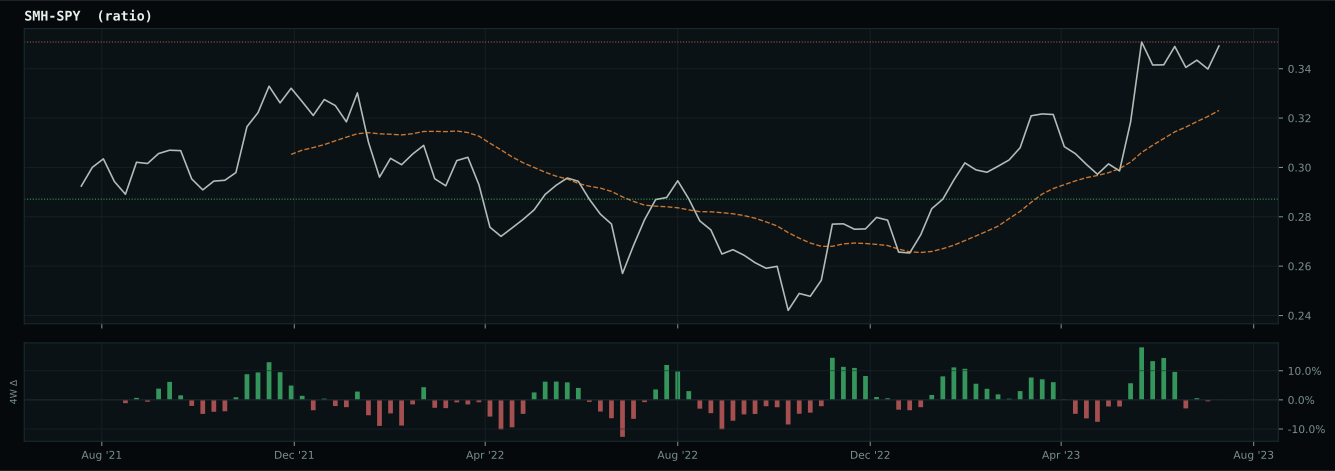
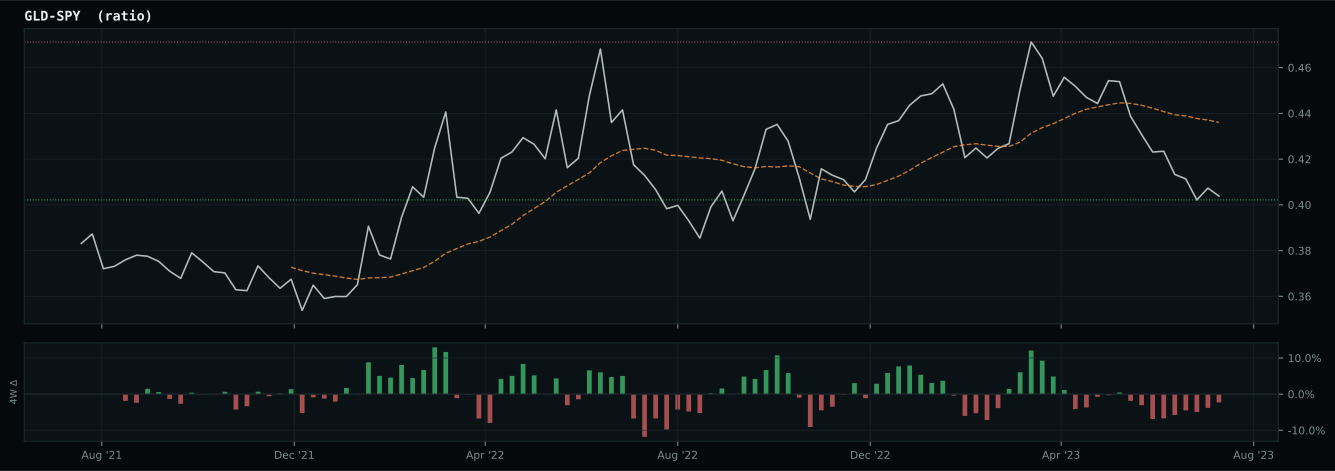
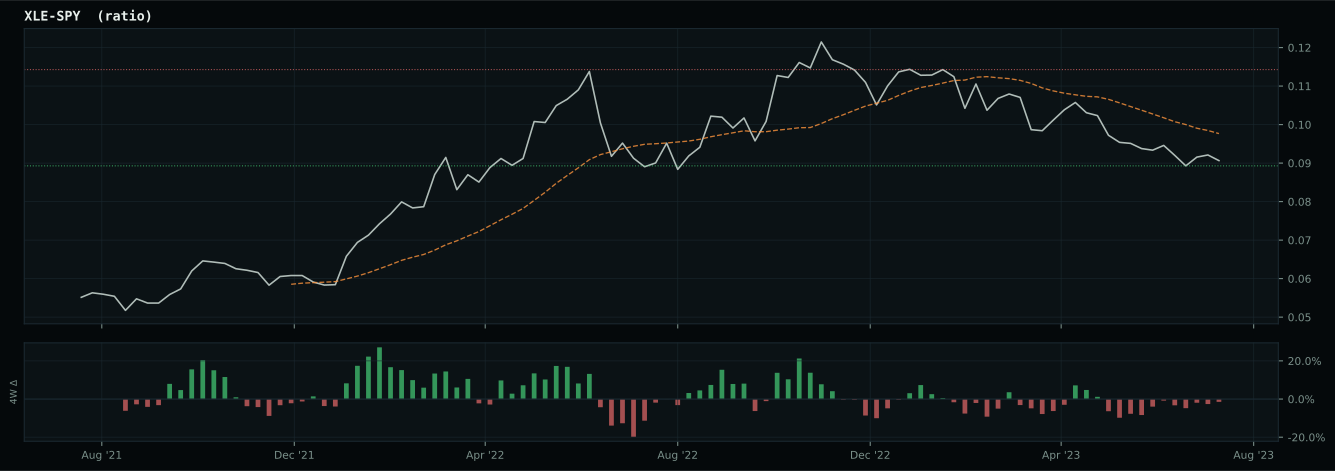
Macro Regime — Disinflation
Macro Evidence Charts
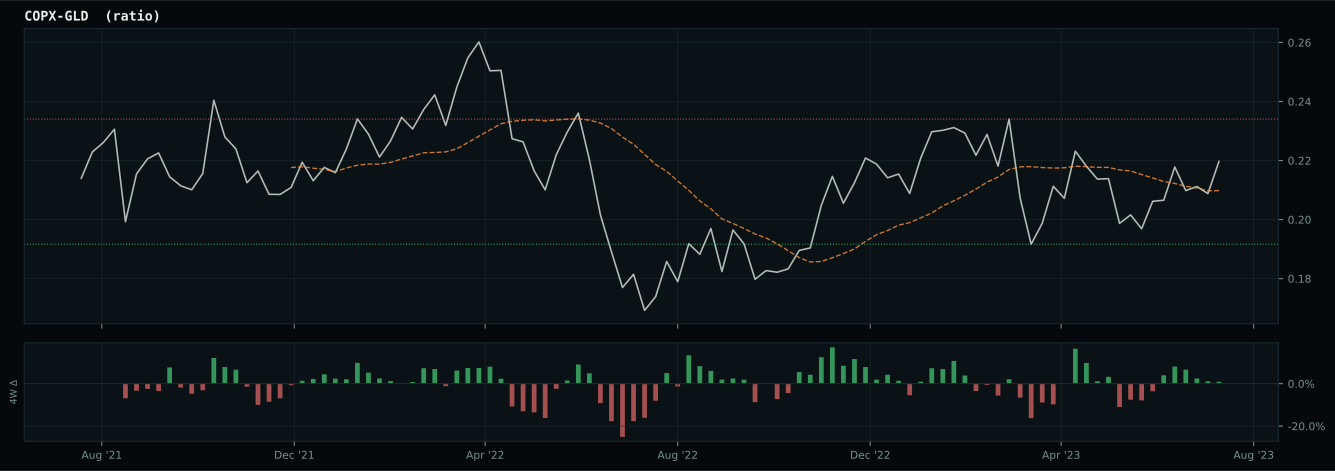
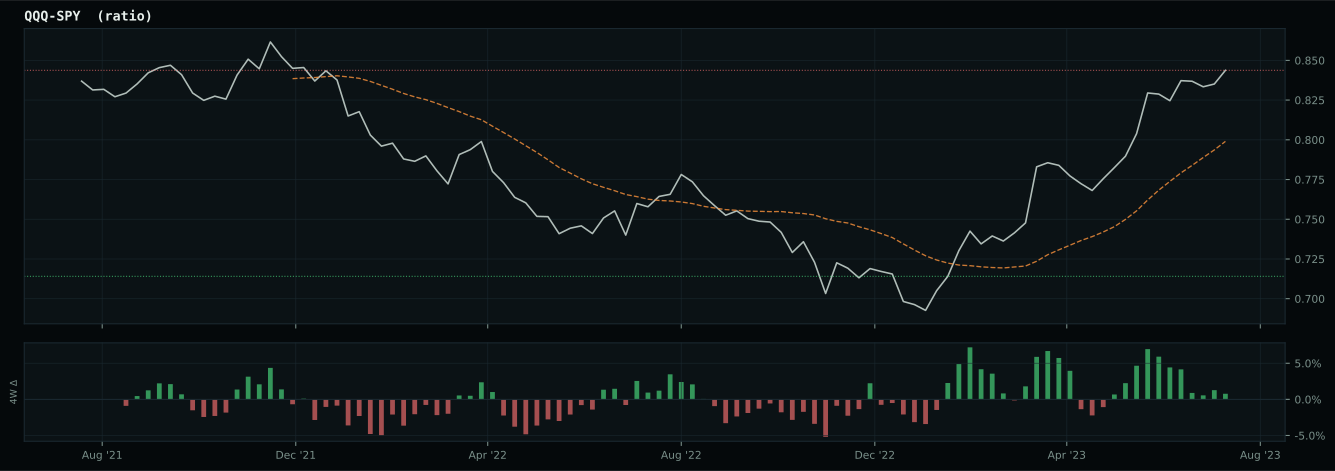
Market-implied signals behind the macro regime scores. Each ratio compares two assets; the direction and slope of the ratio is what the macro engine reads.
Crypto Regime — TrendBTC
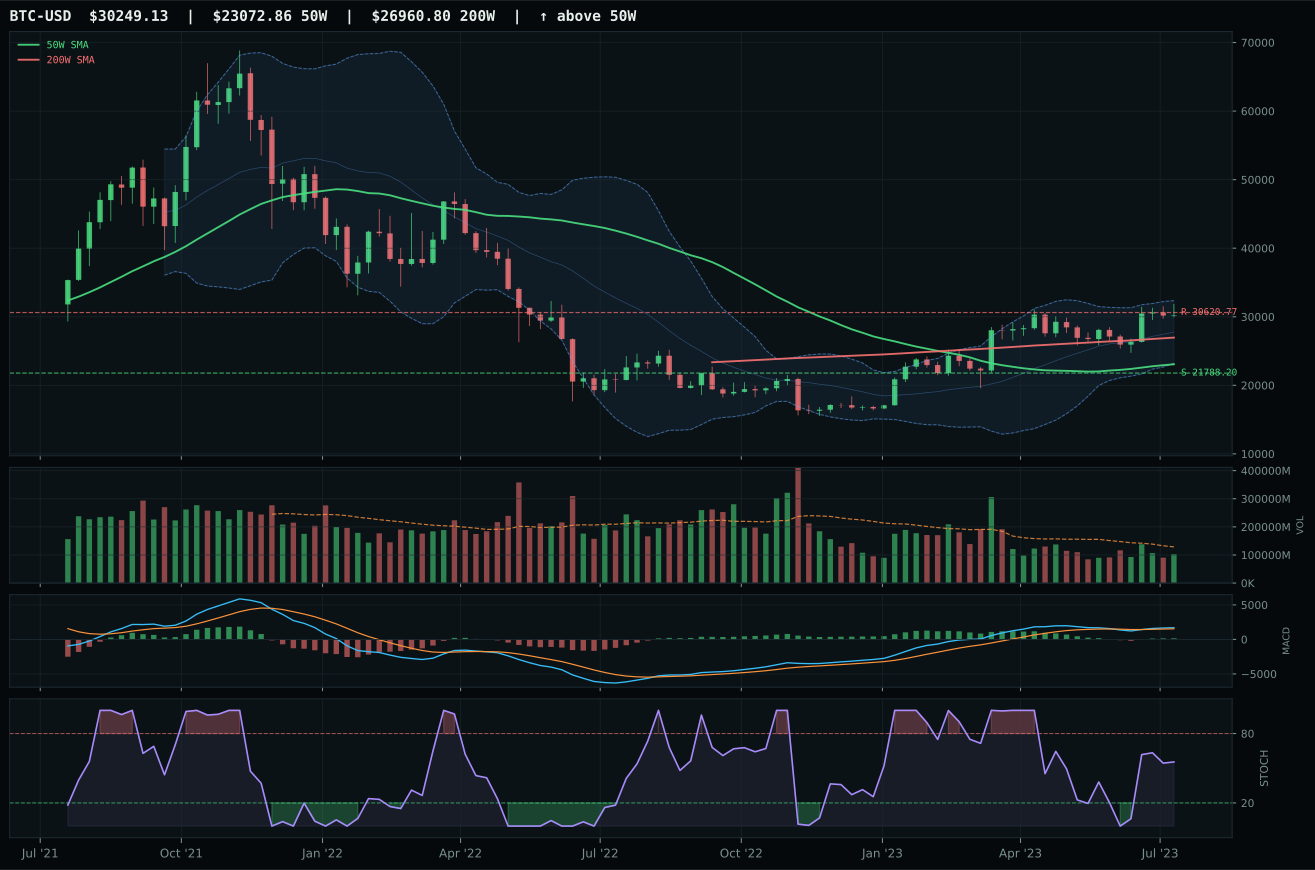
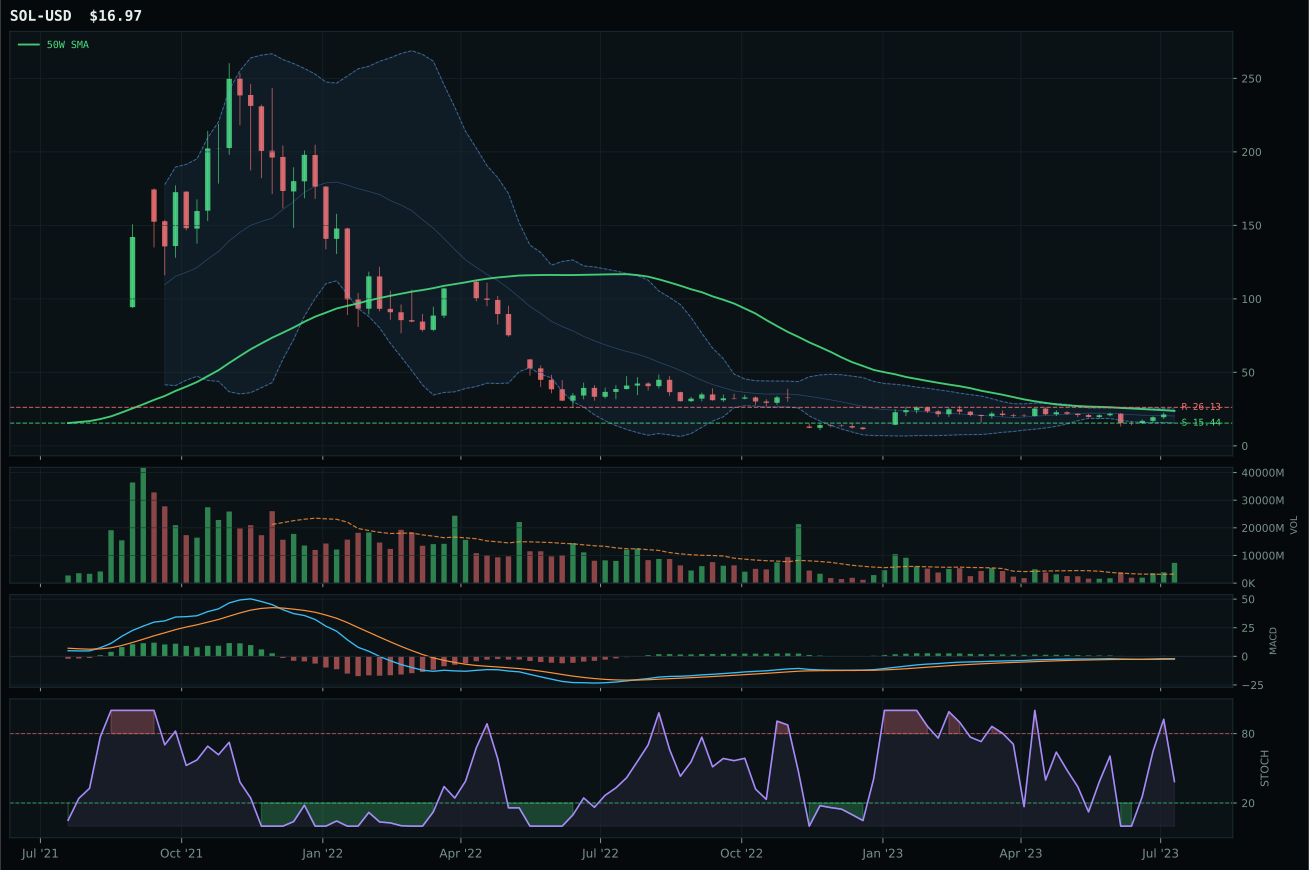
post-touch structure is too wide to count as a range; max/min close ratio is 1.88
TrendBTC confirmed: 2 consecutive closes above rising/flat 50W SMA
one or more available conditions failed
Category Rankings
| Rank | Category | Winner | Score | Alloc | 4W Ret | Peers (4W) |
|---|---|---|---|---|---|---|
| 1 | AI | AIQ | 69.2 | 20% | -5.23% | BOTZ -11.3% · SMH -7.5% |
| 2 | Technology | IGV | 66.7 | 20% | -5.70% | XLK -5.4% · CIBR -0.8% |
| 3 | Industrial Metals | COPX | 55.0 | 10% | -3.11% | REMX -10.1% · PICK -4.8% |
| 4 | Utilities & Infrastructure | PAVE | 53.1 | 10% | +1.39% | IGF -2.3% · XLU -3.2% |
| 5 | Nuclear Energy | URA | 51.0 | 10% | +5.47% | URNM +7.0% · NLR +3.8% |
| 6 | Defense & Aerospace | XAR | 50.2 | 10% | +0.65% | ITA +1.1% · ROKT -3.2% |
| 7 | Precious Metals | GLD | 40.7 | 10% | -2.28% | SLV -8.8% · GDX -8.2% |
| 8 | Emerging Markets | INDA | 32.3 | 10% | -2.37% | ILF -2.5% · IEMG -3.8% |
| 9 | Agriculture & Livestock | MOO | 25.2 | 0% | +1.89% | WEAT -6.4% · VEGI +1.4% |
| 10 | Traditional Energy | XLE | 12.0 | 0% | +10.46% | FCG +12.3% · XOP +15.0% |
AI — AIQ
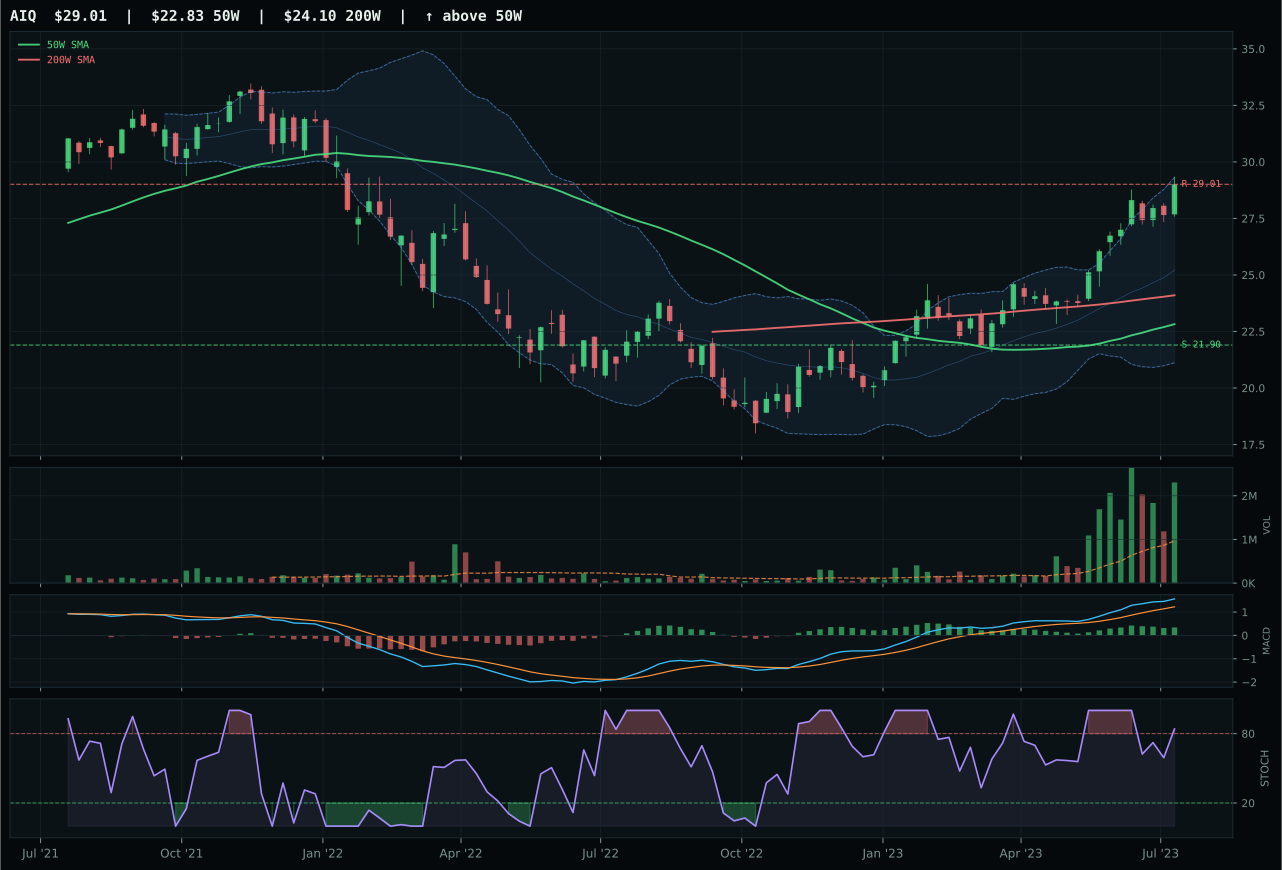
AIQ has a vertical extension profile with 11.6% 13-week relative strength versus SPY.
A failed hold above support would weaken the setup.
Actionable but governed by invalidation levels.
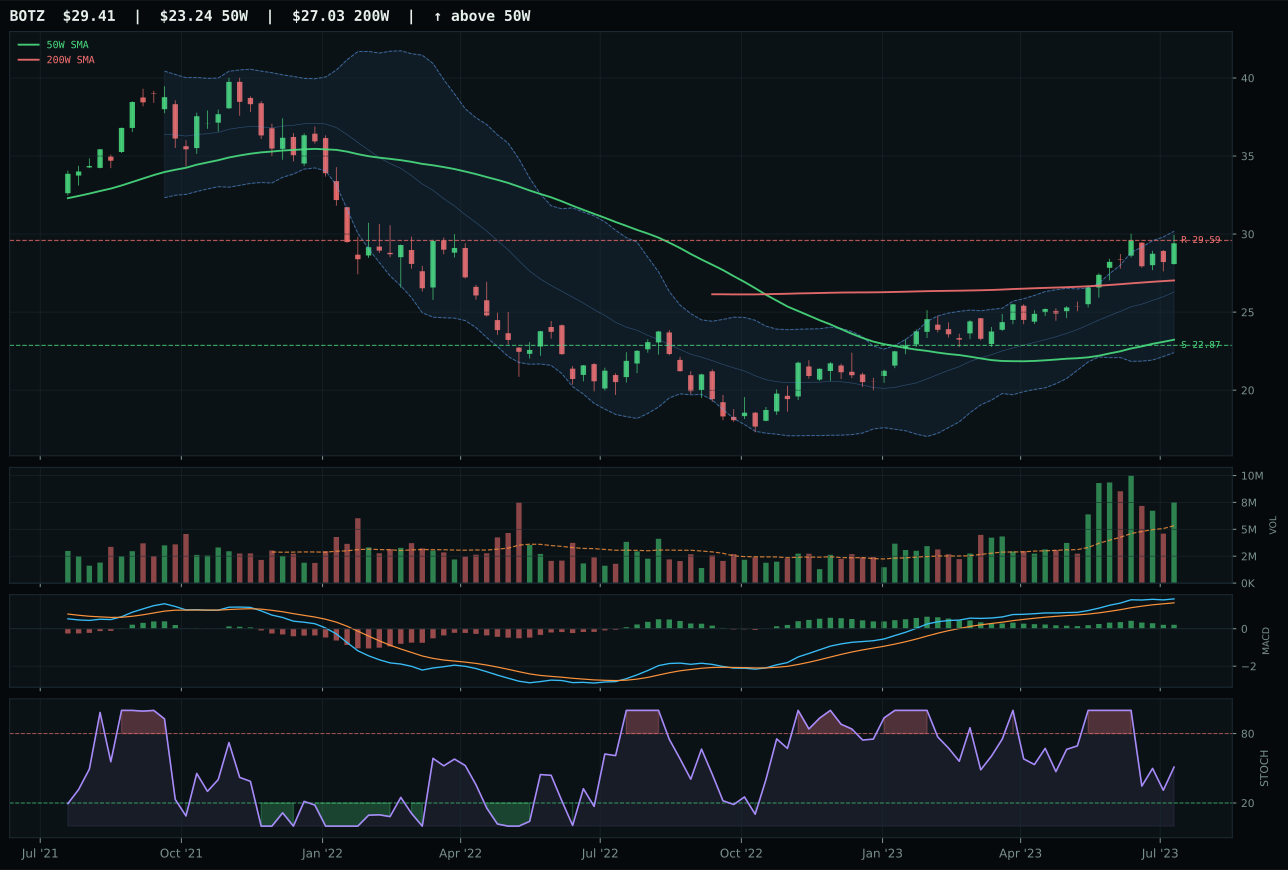
BOTZ has a vertical extension profile with 9.2% 13-week relative strength versus SPY.
A failed hold above support would weaken the setup.
Actionable but governed by invalidation levels.
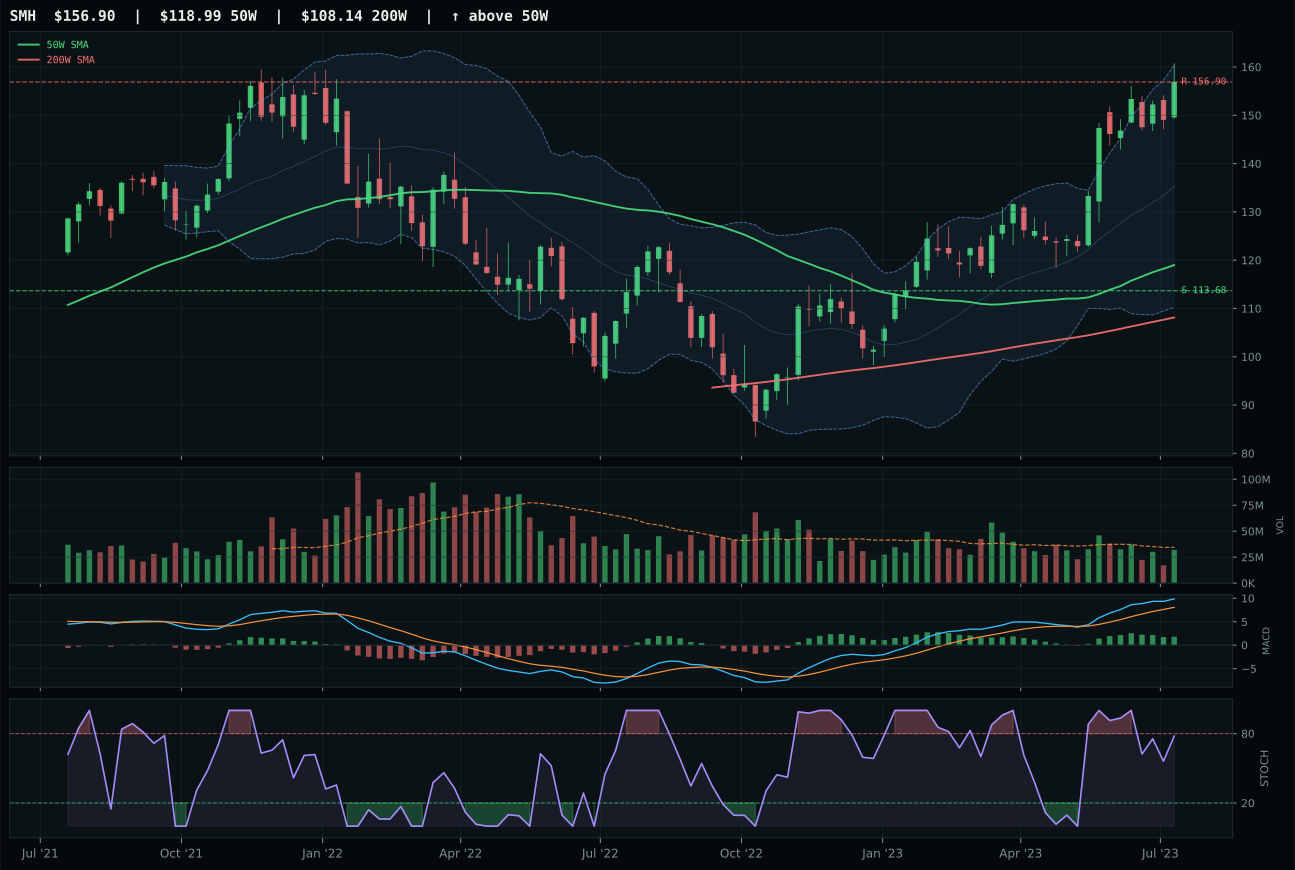
SMH has a vertical extension profile with 15.6% 13-week relative strength versus SPY.
A failed hold above support would weaken the setup.
Actionable but governed by invalidation levels.
AIQ won the AI category with 69.2 score and 71.3 reasoned evidence by demonstrating the highest volume-price confirmation in the basket: 2.38x 20W average volume paired with bullish and improving MACD creates the strongest accumulation signal across all three nominees. The 27.1% extension above the 50W is as steep as IGV's, but AIQ's volume signature is heavier, its MACD more concrete, and its category-relative strength neutral rather than lagging. BOTZ fell short despite 100.0 trend because its volume is merely above-average participation while AIQ's is outright accumulation; stochastic RSI rising mid-zone (vs overbought momentum) also suggests BOTZ lacks the final-stage capitulation buying that confirms true breakouts. The 20.6% 13W return and 11.6% SPY relative strength show leadership, but AIQ's volume-price persistence at 83.9/100 proves the move is being sponsored, not just announced.
AI earns top-2 positioning at 69.2 category score, the highest-ranked technical evidence of 77.8 and the portfolio's strongest macro fit at 53.0 for category-level narrative alignment. The active descriptor checklist is lopsided in AI's favor: +14 for AI growth sponsorship, +10 for risk appetite positive, offset only by -12 liquidity stress and -8 credit stress. At 10% allocation, AI represents explicit conviction that the disinflation regime is yielding to growth-sponsor dynamics, not competing with rate-sensitive sectors. BOTZ's robotics and physical cyclicality muddy the category signal, which is why the 3/2/1 proof order ranks AIQ first at 71.3 and relegates BOTZ to third at 61.0. The persistence score of 83.9 indicates this move is sticky, not a one-week spike. Relative to Defense & Aerospace at 50.2 or Precious Metals at 40.7, AI's combination of technical evidence, relative strength, and macro sponsorship justifies co-leadership with Technology as the portfolio's two highest-conviction vehicles.
Technology — IGV
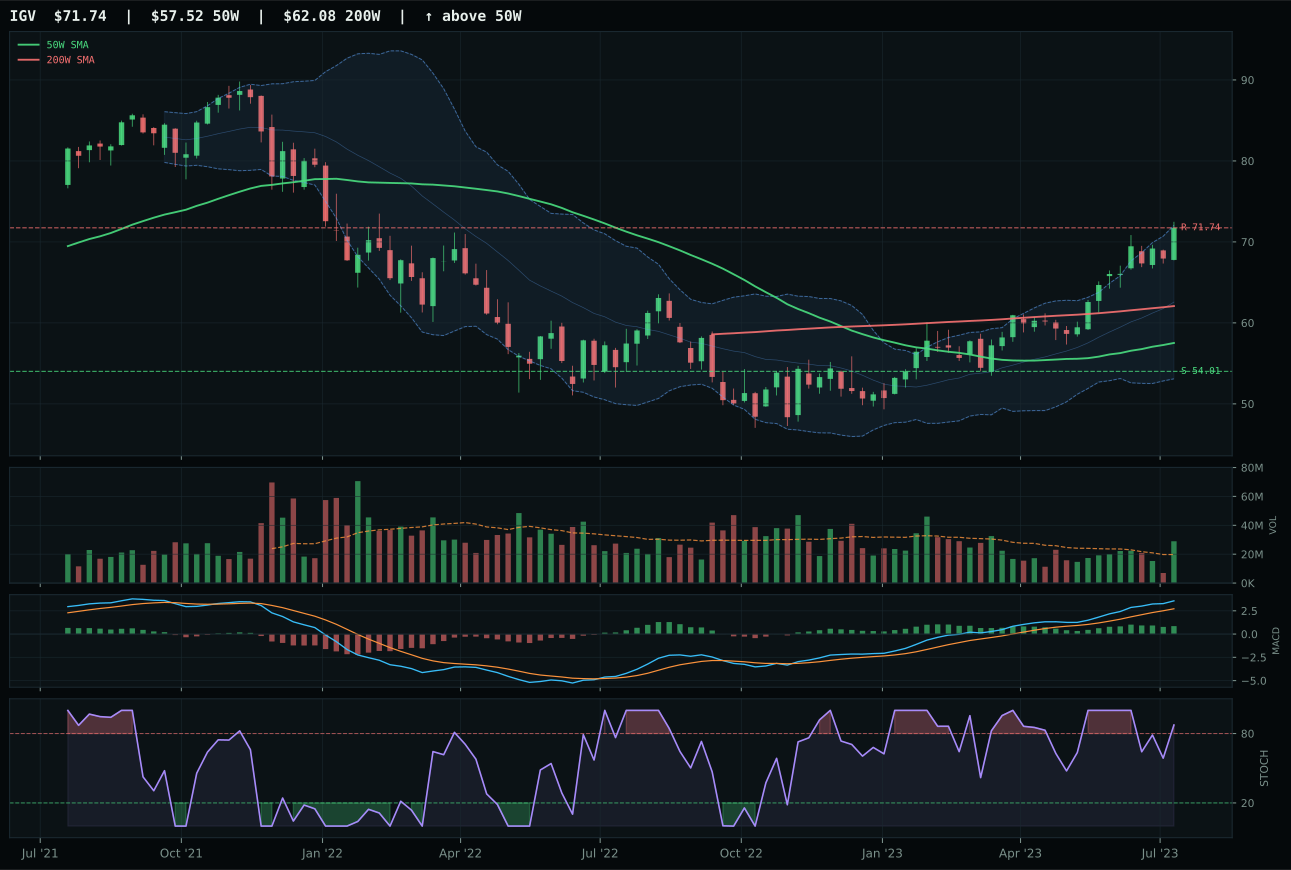
IGV has a vertical extension profile with 10.1% 13-week relative strength versus SPY.
A failed hold above support would weaken the setup.
Actionable but governed by invalidation levels.
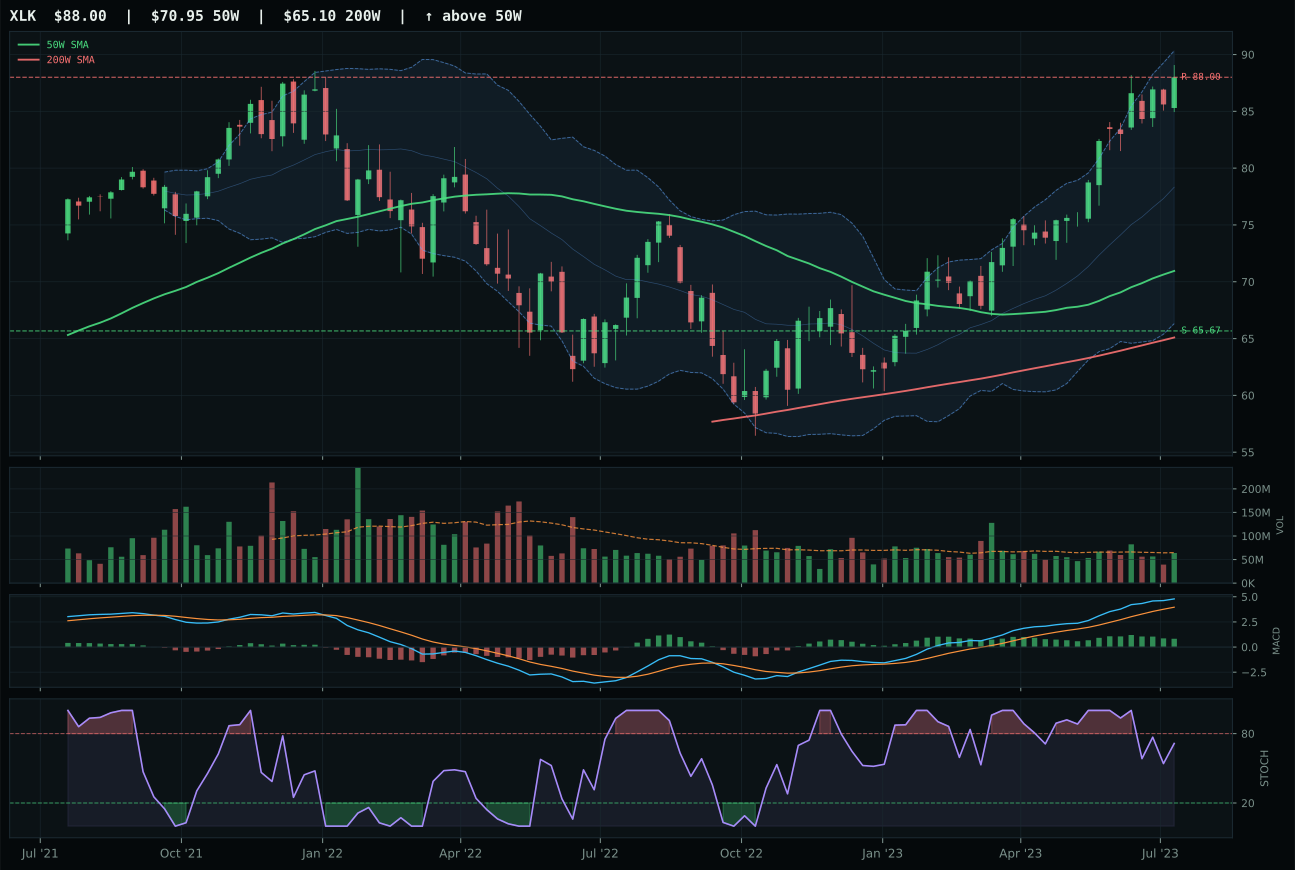
XLK has a vertical extension profile with 9.5% 13-week relative strength versus SPY.
A failed hold above support would weaken the setup.
Actionable but governed by invalidation levels.
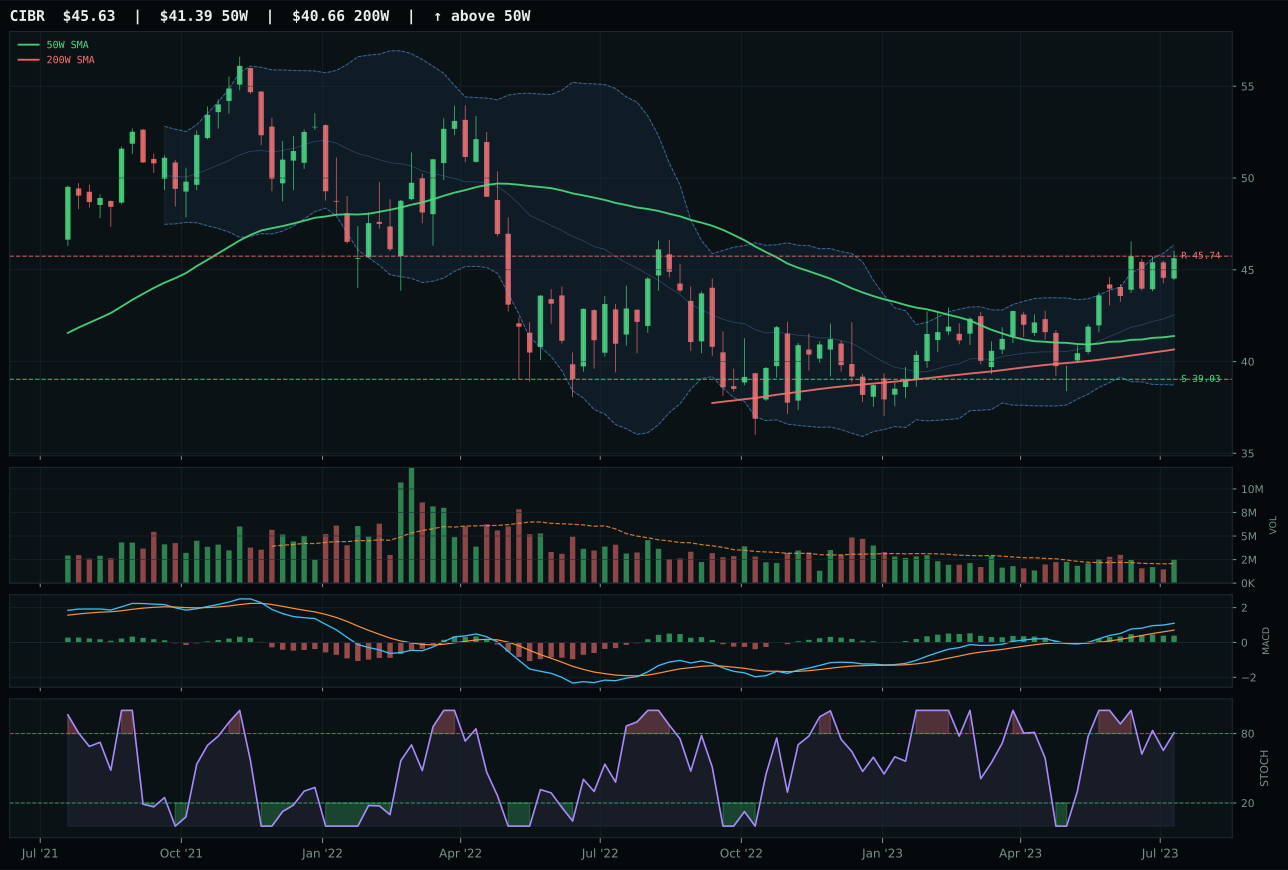
CIBR has a neutral structure profile with -0.6% 13-week relative strength versus SPY.
A failed hold above support would weaken the setup.
Actionable but governed by invalidation levels.
IGV captured the category by combining superior relative strength within the three-ETF basket (0.7% vs XLK's 0.0%) with cleaner structure and volume confirmation that separates winners from late chases. The 24.7% extension above the 50W is steep, but the accumulation signature—1.46x 20W average volume paired with bullish MACD—tells you institutional money is still defending the level despite the vertical move. XLK stumbled because it lacks that volume sponsorship; its neutral participation and rising mid-zone stochastic RSI suggest momentum without accumulation, a dangerous combination when price is already 24% extended. What matters here is that IGV's overbought reading (stoch 0.87) is being absorbed by real buying, not rejected by sellers—that's the difference between a setup worth chasing and one about to roll over.
Technology ranks among the top two categories at 66.7 and earns 10% allocation alongside AI, both positioned as the portfolio's core growth vehicles in a disinflation regime. The macro case is strong: risk appetite remains active at +9, AI growth sponsorship adds +6, and disinflation pressure itself supports duration-sensitive growth at +7, offsetting liquidity stress at -10. However, timing imposes a hard ceiling—IGV sits 32.0 points out of 100 on entry risk, meaning the allocator accepts late-stage extension in exchange for category-level leadership and macro alignment. The near-complete saturation of upside to resistance (0.0%) leaves no cushion for new buyers, making this a hold-on-strength positioning rather than a buy-the-dip scenario. Relative to AIQ's 69.2 category score and 46.4 risk-reward score, Technology's 41.4 risk-reward reflects the cost of momentum chase—but in a risk-appetite-positive environment with AI tailwinds, that cost is acceptable within a 10% sleeve.
Industrial Metals — COPX
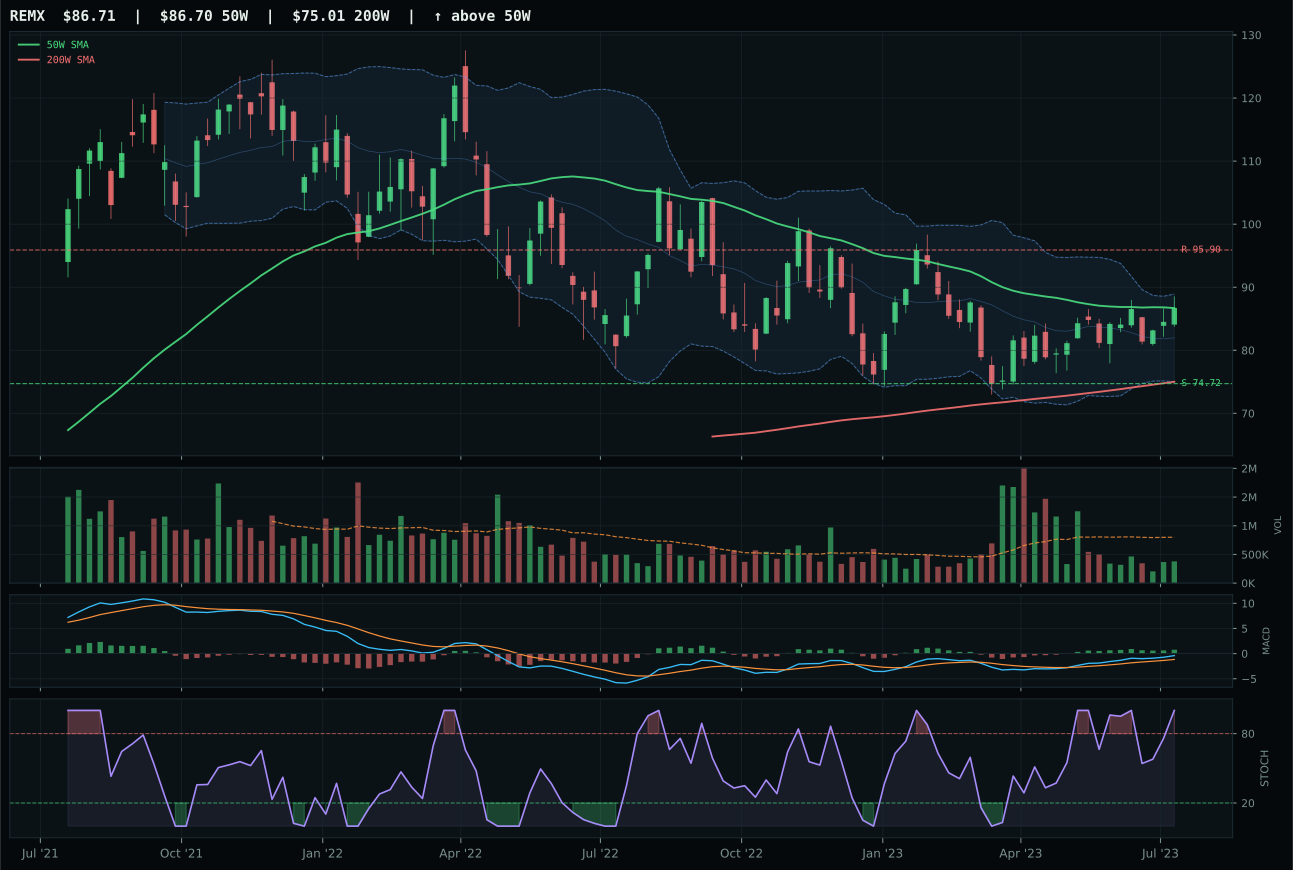
REMX has a compression near 50W profile with -3.6% 13-week relative strength versus SPY.
A failed hold above support would weaken the setup.
Actionable but governed by invalidation levels.
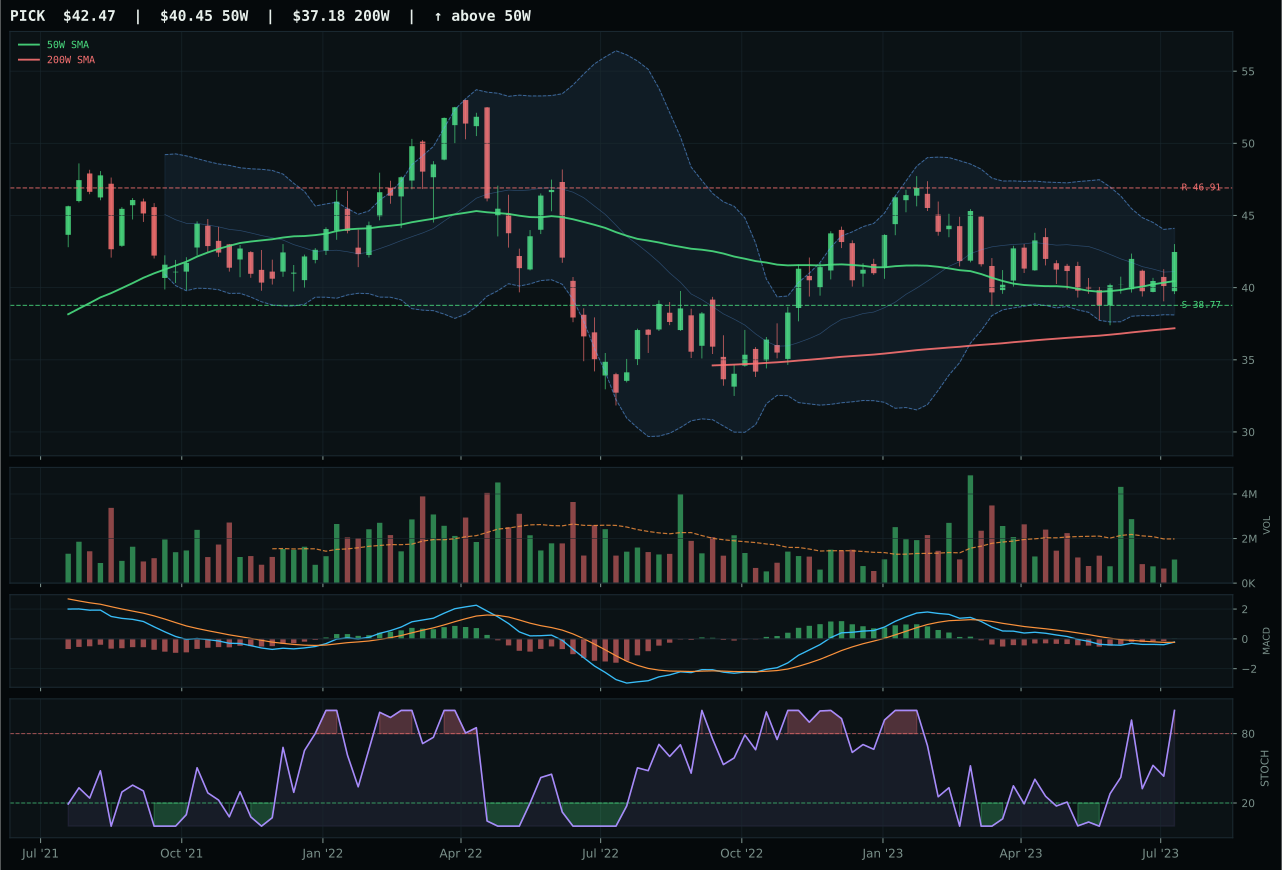
PICK has a neutral structure profile with -10.8% 13-week relative strength versus SPY.
A failed hold above support would weaken the setup.
Actionable but governed by invalidation levels.
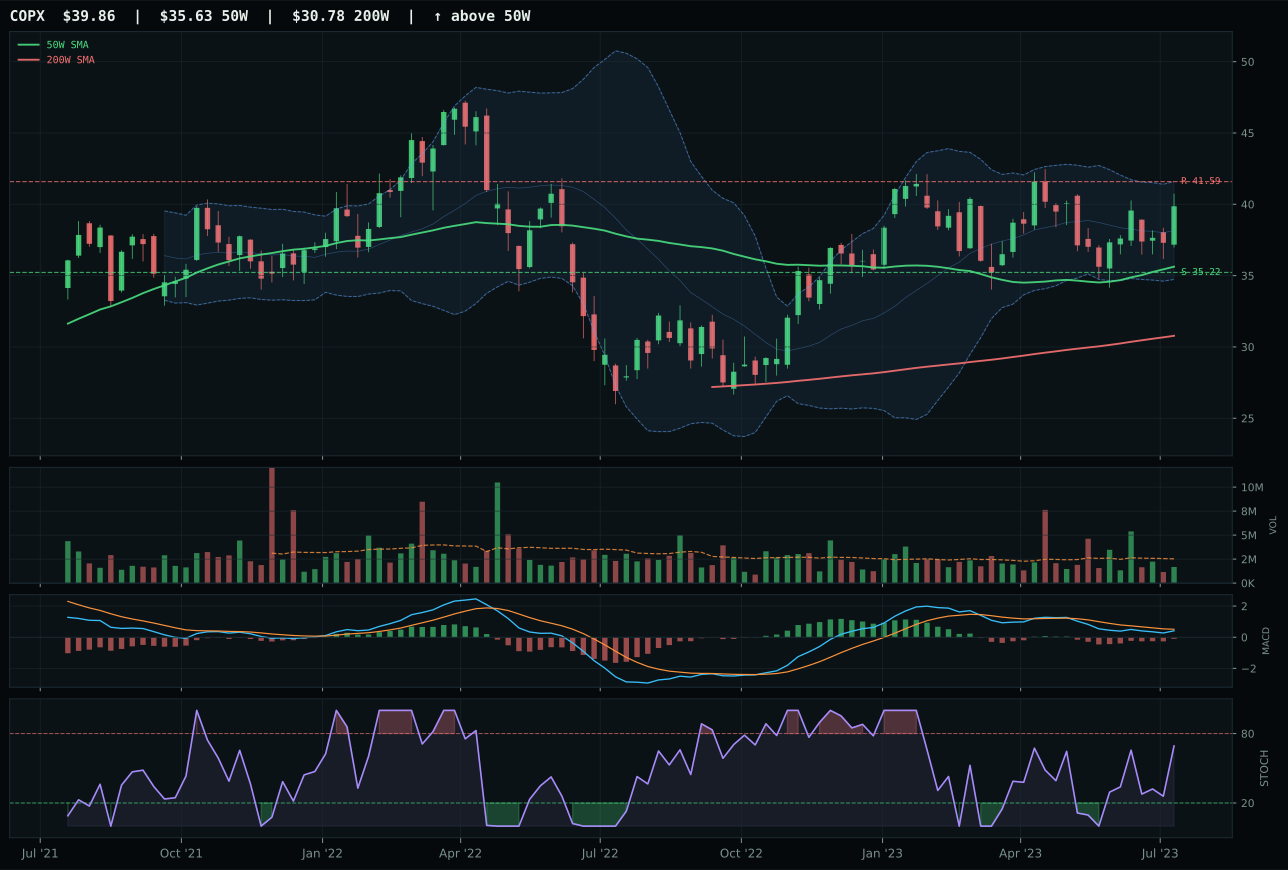
COPX has a neutral structure profile with -13.1% 13-week relative strength versus SPY.
A failed hold above support would weaken the setup.
Actionable but governed by invalidation levels.
COPX won Industrial Metals with 57.0 reasoned evidence despite being the weakest chart in the category, primarily because REMX's overbought stochastic RSI (0.91) and bullish-but-flattening MACD created timing risk that outweighed its superior technical score (72.1). COPX sits at Fib 0.236 with rising mid-zone stochastic RSI and bearish-but-improving MACD, a configuration that looks inferior in the short term but cleaner for entry when MACD eventually turns. The -4.2% 13W return and -13.1% SPY relative strength are genuine weaknesses, but 83.0 timing score from COPX's distance to 50W (11.9%) and improving MACD slope beat REMX's timing penalty for sitting in overbought territory at compression. Category-relative strength of -2.3% suggests copper is lagging rare earths, yet COPX's 67.1 structure (neutral) vs REMX's compression-near-50W means COPX offers better entry risk asymmetry: downside support is 13.2%, upside resistance is -4.2%, so the risk is defined. REMX's momentum at 62 and higher technical evidence cannot overcome the timing liability of being overbought without volume confirmation.
Industrial Metals scores 55.0 and earns 5% allocation, mid-tier positioning that reflects macro sponsorship in a growth-skeptical regime. Metals scarcity at +14 and commodity breadth positive at +10 are the portfolio's strongest real-asset descriptors outside of cryptocurrency exposure, making this a conviction hold despite weak technical evidence. At 65.0 category-level macro fit, Industrial Metals ranks third in macro alignment behind Technology (60.0) and Utilities (62.0) but ahead of Agriculture (-6.0 net) and Precious Metals (60.0 absolute, weaker conviction). COPX at 54.1 technical evidence is barely above the threshold for portfolio inclusion—the +62 macro narrative fit does the heavy lifting. Relative to top-2 categories (AI and Technology), this is a secondary conviction play: real assets benefit if disinflation stabilizes without credit collapse, but relative weakness of -13.1% SPY-relative signals that risk appetite remains the dominant market driver. The 5% allocation preserves optionality: if commodity breadth continues to score positive and metals scarcity persists, COPX can scale. For now, it is positioned as a diversifier, not a core growth engine.
Utilities & Infrastructure — PAVE
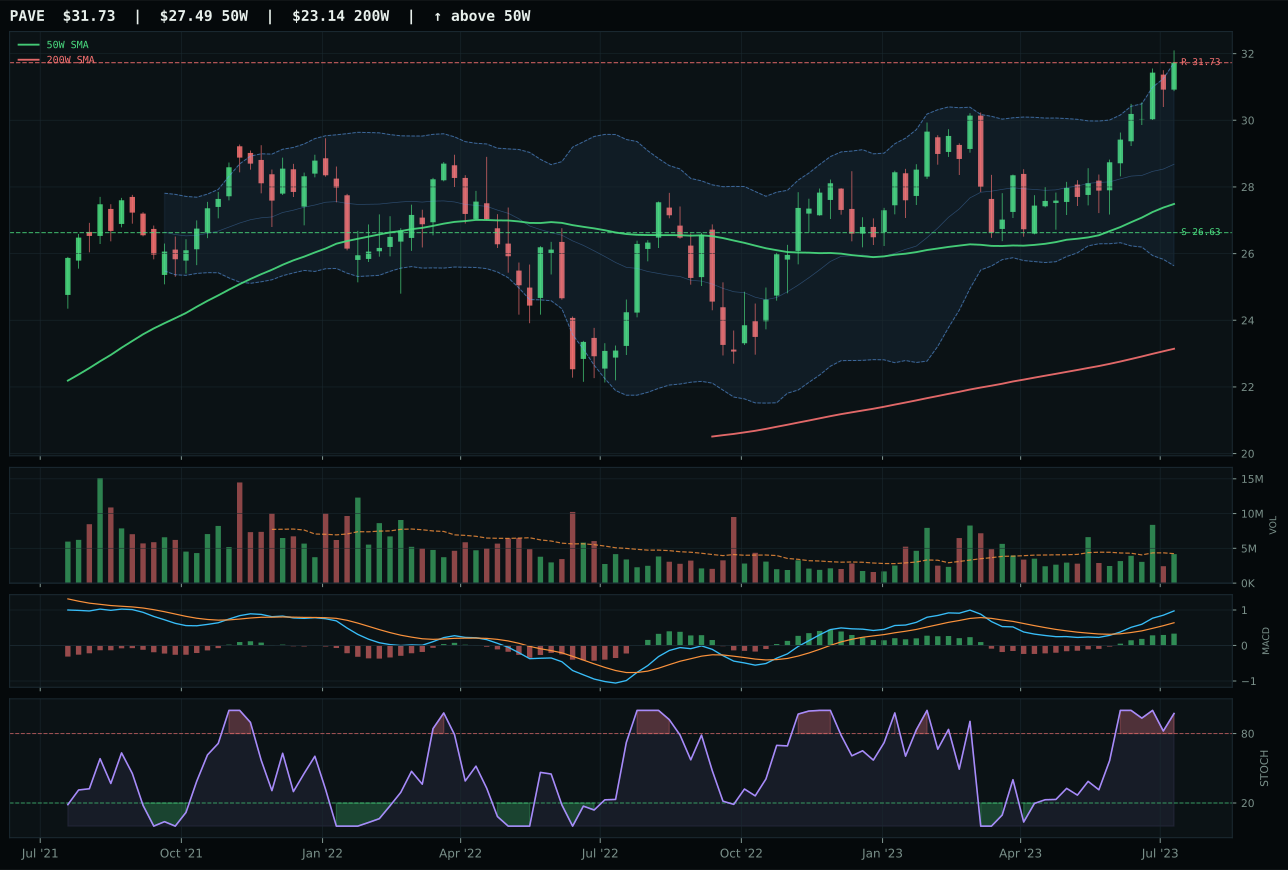
PAVE has a vertical extension profile with 6.7% 13-week relative strength versus SPY.
A failed hold above support would weaken the setup.
Actionable but governed by invalidation levels.
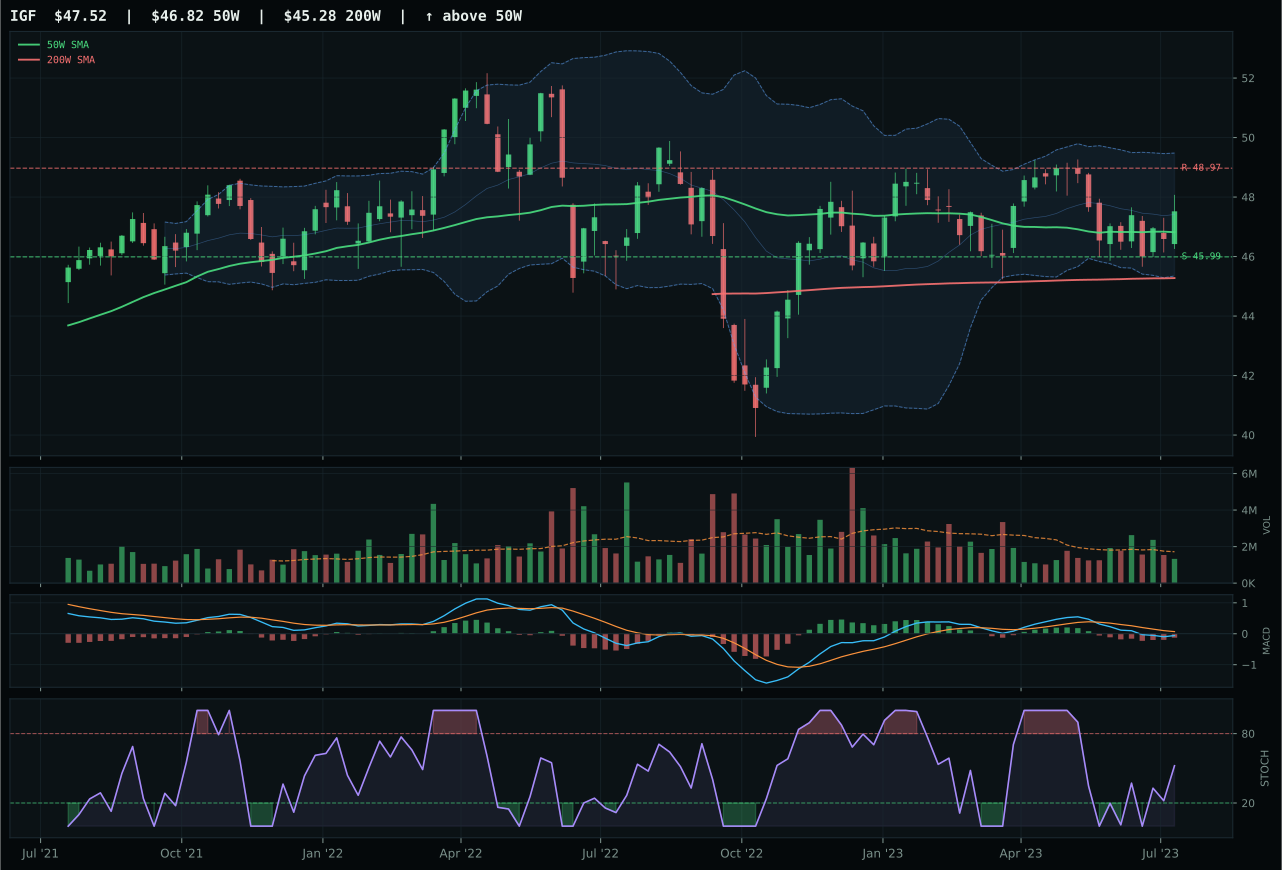
IGF has a pullback into support profile with -11.3% 13-week relative strength versus SPY.
A failed hold above support would weaken the setup.
Actionable but governed by invalidation levels.
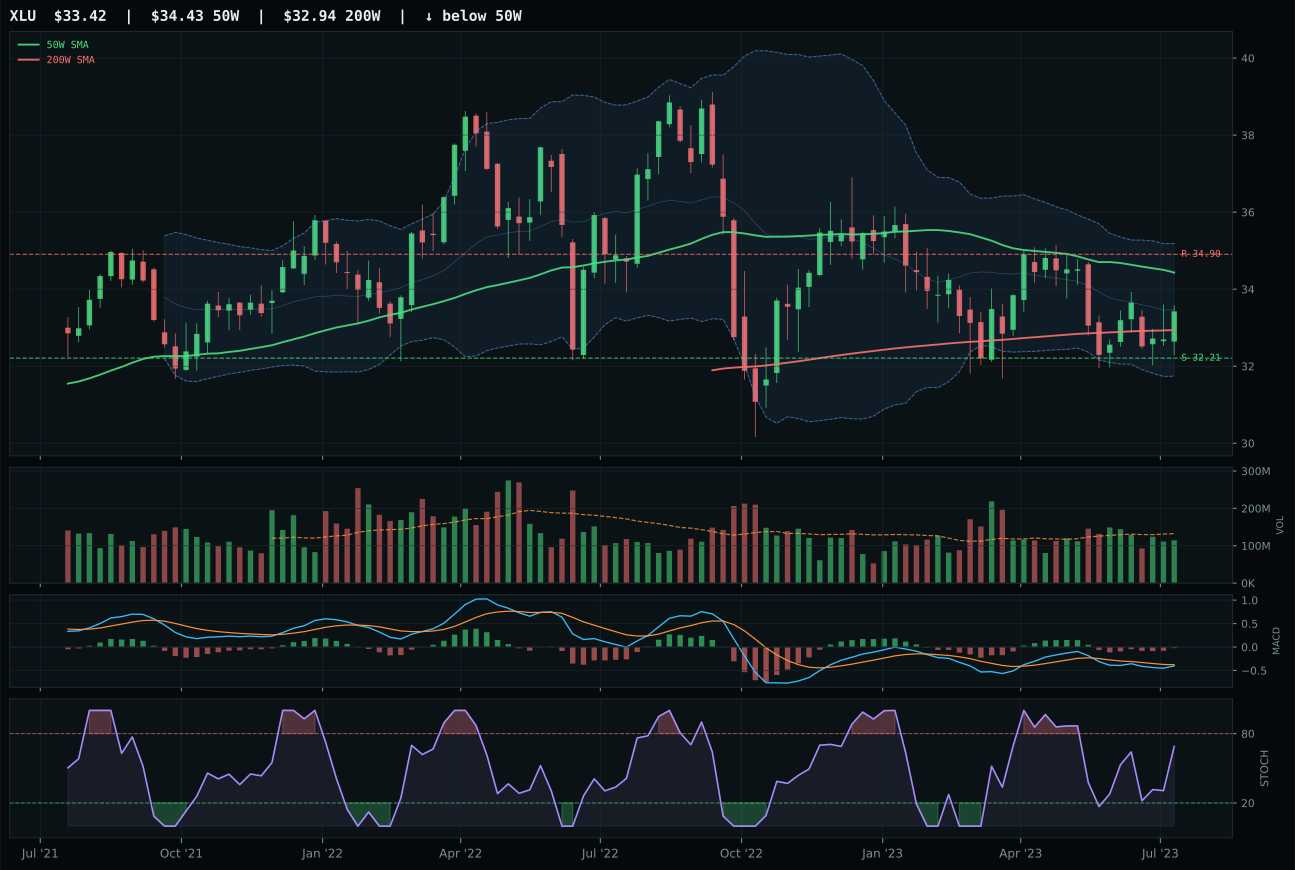
XLU has a pullback into support profile with -11.9% 13-week relative strength versus SPY.
A failed hold above support would weaken the setup.
Actionable but governed by invalidation levels.
PAVE captured Utilities & Infrastructure with 73.0 reasoned evidence by combining 100.0 trend (price above 50W and 200W with 0.4% slope), 100.0 momentum confirmation (5.1% 4W return, 15.6% 13W return, 18.0% category-relative strength), and 80.0 volume-price confirmation that together overcome its 37.0 timing liability from sitting 15.4% extended at Fib 0.236. The category-relative strength of 18.0% is the differentiator: PAVE is outperforming infrastructure peers, not just riding broad market momentum, which validates the technical setup as leadership rather than speculation. IGF lost by a fraction (0.3 points) due to bearish-but-improving MACD versus PAVE's bullish-and-improving signal, and -11.3% SPY relative strength versus PAVE's 6.7%, revealing that IGF is retreating while PAVE advances. Structure score favors PAVE (77.2 vs 73.3), and persistence is stronger at 85.2 versus IGF's implied lower persistence, showing PAVE's momentum is lasting while IGF's is opportunistic.
Utilities & Infrastructure scores 53.1 and earns 5% allocation, ranking above Defense (50.2) and Nuclear (51.0) but below the highest-conviction categories. Category macro fit at 62.0 reflects dual tailwinds: disinflation at +7 and transition/mixed at +4, together supporting duration-sensitive infrastructure and rate-beneficiary utilities. PAVE's 80.7 technical evidence combines perfect trend (100.0) with 100.0 momentum confirmation and 85.2 persistence, the profile of a sustained move not a one-week spike. Relative to AI (69.2) and Technology (66.7), Utilities at 53.1 ranks fourth overall, appropriately sized as a secondary conviction. The 5% allocation reflects portfolio recognition that infrastructure capex and regulated utility assets benefit from disinflation stabilization and AI data-center demand lift (power, cooling, connectivity). PAVE's vertical extension at 15.4% above the 50W imposes entry risk that caps upside to resistance at 0.0%, but the +6.7% SPY-relative strength and +18.0% category-relative dominance signal that marginal capital is arriving, not leaving. If PAVE breaks support at 26.63 or MACD rolls over, this downgrades immediately to 2.5%. Until then, this is a convex bet on infrastructure benefiting from both rate normalization and AI infrastructure spending.
Nuclear Energy — URA
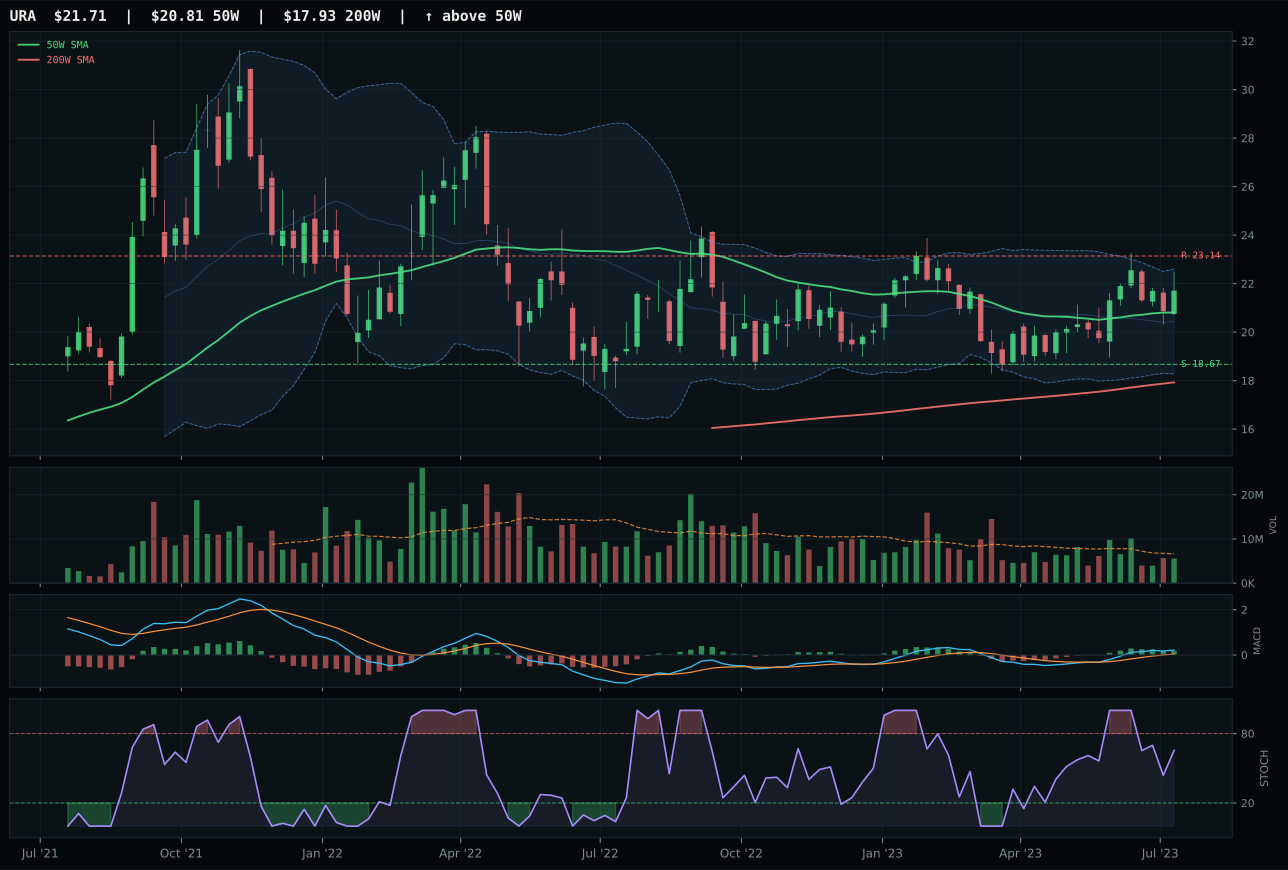
URA has a neutral structure profile with 0.4% 13-week relative strength versus SPY.
A failed hold above support would weaken the setup.
Actionable but governed by invalidation levels.
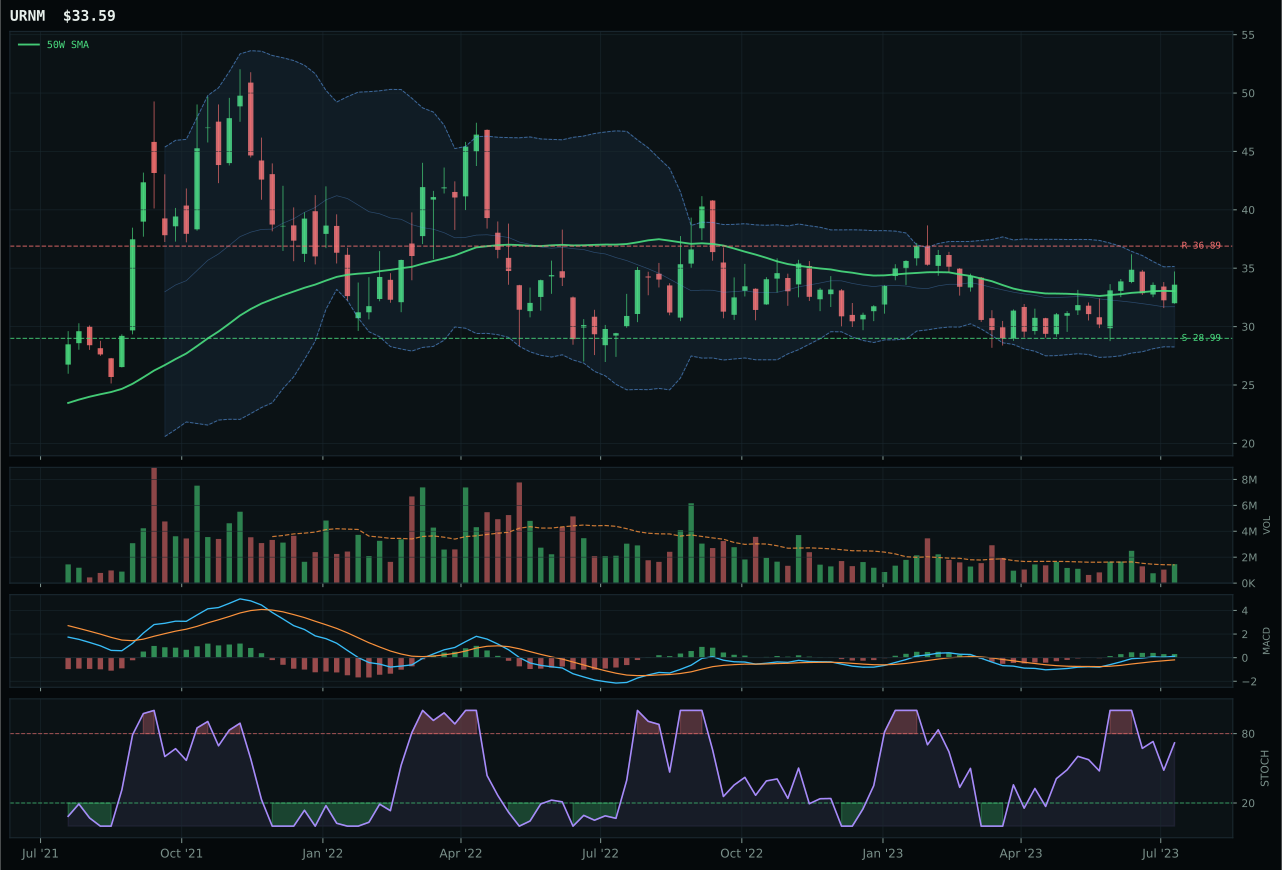
URNM has a compression near 50W profile with 0.3% 13-week relative strength versus SPY.
A failed hold above support would weaken the setup.
Actionable but governed by invalidation levels.
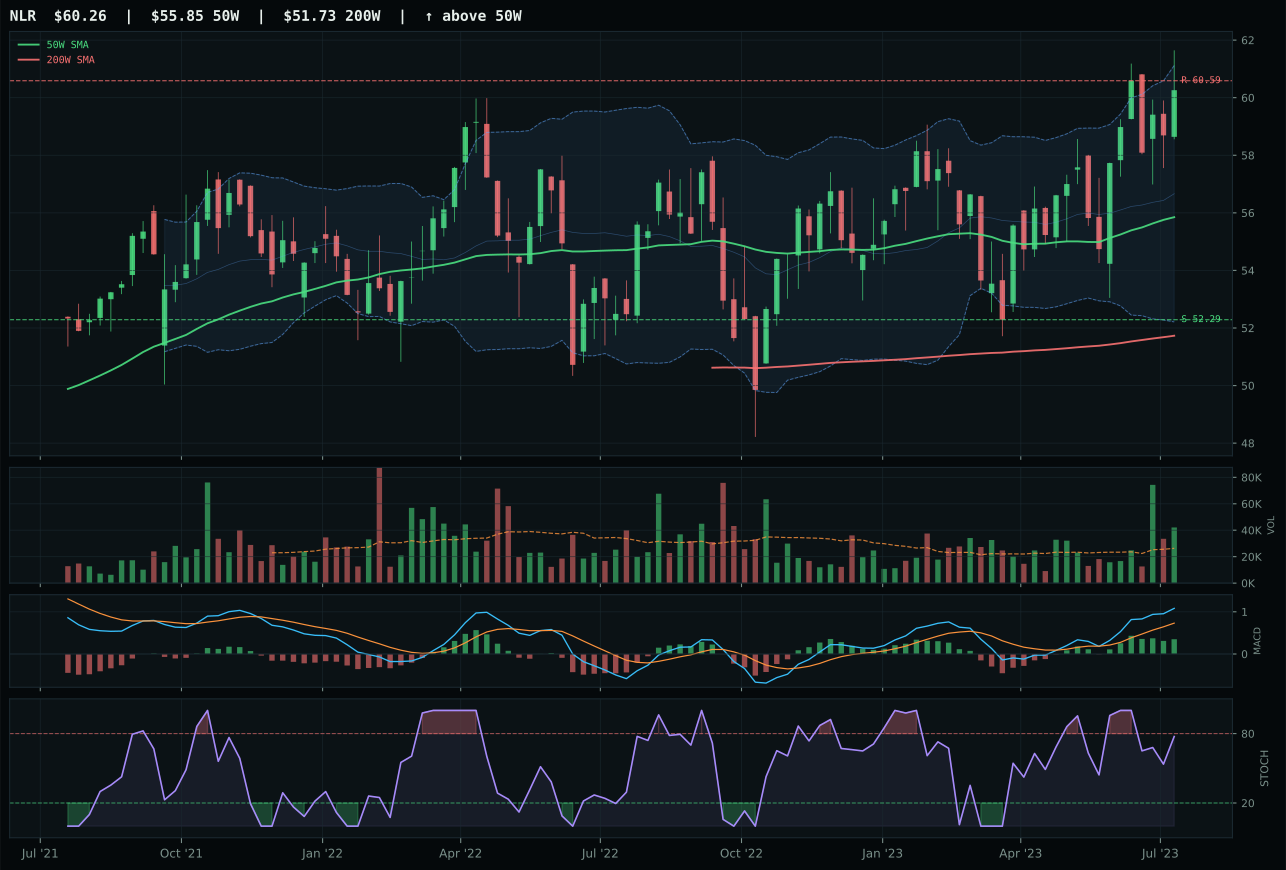
NLR has a neutral structure profile with -1.6% 13-week relative strength versus SPY.
A failed hold above support would weaken the setup.
Tracked, but not top-2 eligible because: .
URA captured Nuclear Energy with 64.8 reasoned evidence by posting 86.6 trend, 100.0 timing, and 59.8 risk/reward that together justify a 51.0 category score and the category representative slot. Price sits 4.3% above the 50W at Fib 0.382 (middle retracement/decision zone), a textbook position for accumulation if MACD continuation holds and stochastic RSI rising mid-zone confirms disciplined buying. URA's 9.3% 13W return is solid (0.4% SPY relative strength), and while absolute momentum is only 59.5, the fact that it's positive distinguishes URA from competitors facing headwinds. URNM lost by posting 73.9 structure (vs URA's 74.5) and 0.0% category-relative strength despite 9.2% 13W return, meaning URNM's gains are less uranium-specific and more broad-market lucky. The timing score for URNM (100.0) matches URA's, but URA's cleaner structure and category-relative strength advantage (0.1% vs 0.0%) edge it out in a close call. Both are mediocre setups on the momentum scale, but URA's composition proves it's gaining traction within uranium-specific narratives rather than riding coattails.
Nuclear Energy scores 51.0 and earns 5% allocation as a secondary real-asset conviction play alongside Industrial Metals and Precious Metals hedges. The macro fit is neutral at 50.0 because no category-specific descriptor profile registered; URA rises or falls on structural technicals and real-asset sponsorship (+7) plus AI growth sponsorship (+5), modest tailwinds. At 71.2 technical evidence, URA ranks solidly inside the portfolio's acceptance threshold, and the 100.0 timing score reflects optimal Fibonacci placement and MACD slope improvement. Relative to Technology (66.7) and AI (69.2), Nuclear Energy's 51.0 marks it as opportunistic rather than essential. The 5% allocation preserves leverage to uranium-scarcity narratives and AI data-center power demand without committing conviction capital. URA's 9.3% thirteen-week return is respectable but lacks the 15%+ acceleration that justifies larger positions. The setup is coiled, not broken; accumulation is neutral, not aggressive. Any deterioration—close below the 50W, volume collapse, MACD rollover—triggers downgrade to 2.5% or exclusion. For now, this is portfolio insurance alongside metals and infrastructure in case disinflation stabilizes and real-asset sponsorship reasserts.
Defense & Aerospace — XAR
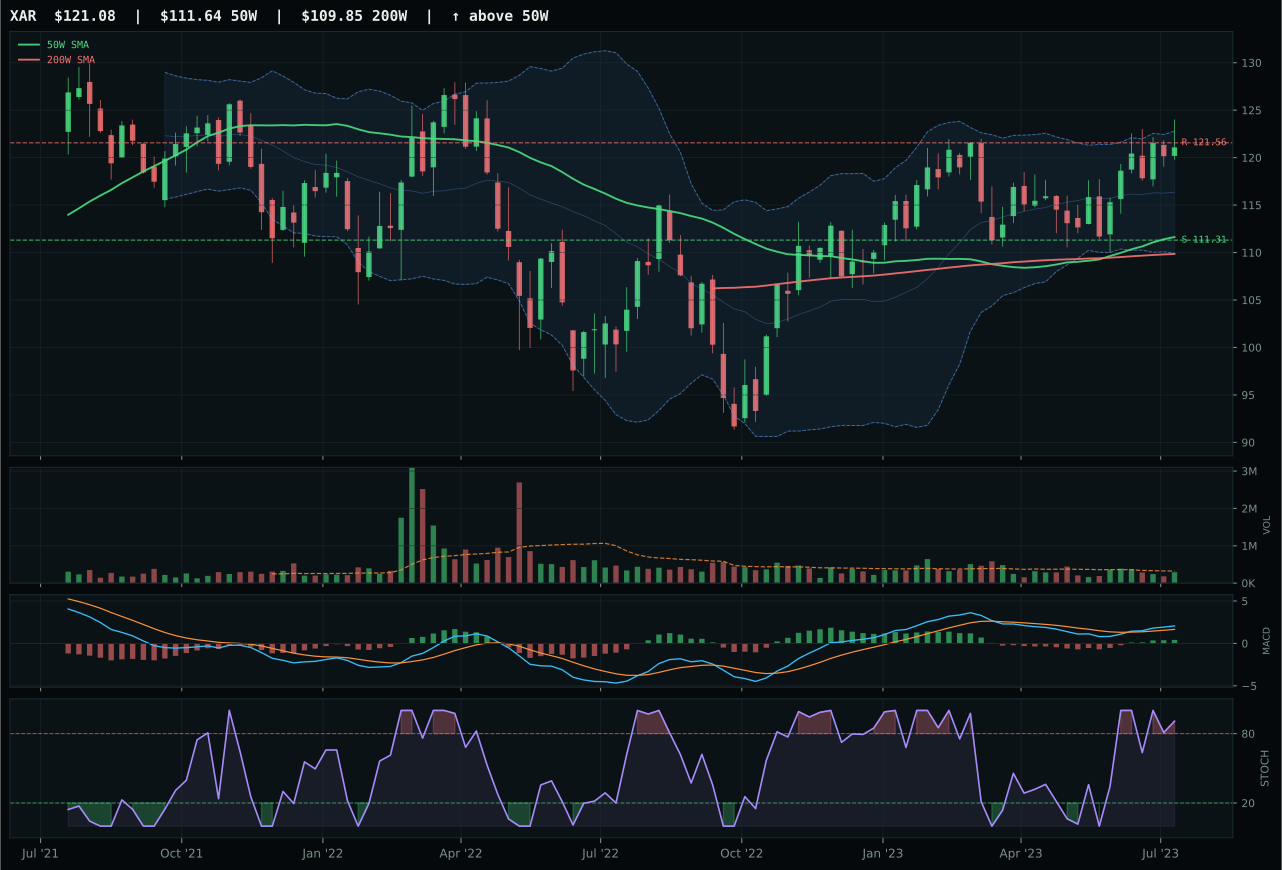
XAR has a neutral structure profile with -4.1% 13-week relative strength versus SPY.
A failed hold above support would weaken the setup.
Actionable but governed by invalidation levels.
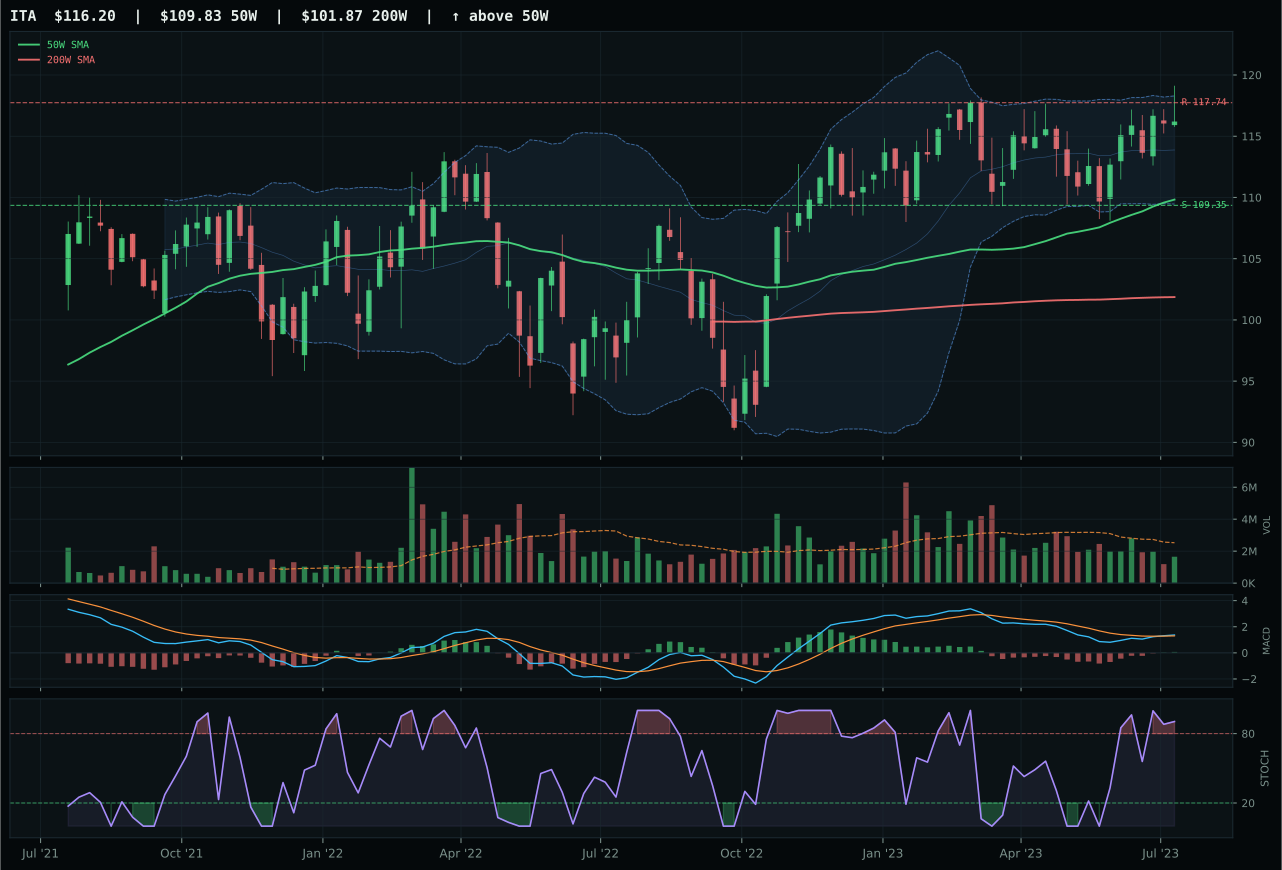
ITA has a neutral structure profile with -7.8% 13-week relative strength versus SPY.
A failed hold above support would weaken the setup.
Actionable but governed by invalidation levels.
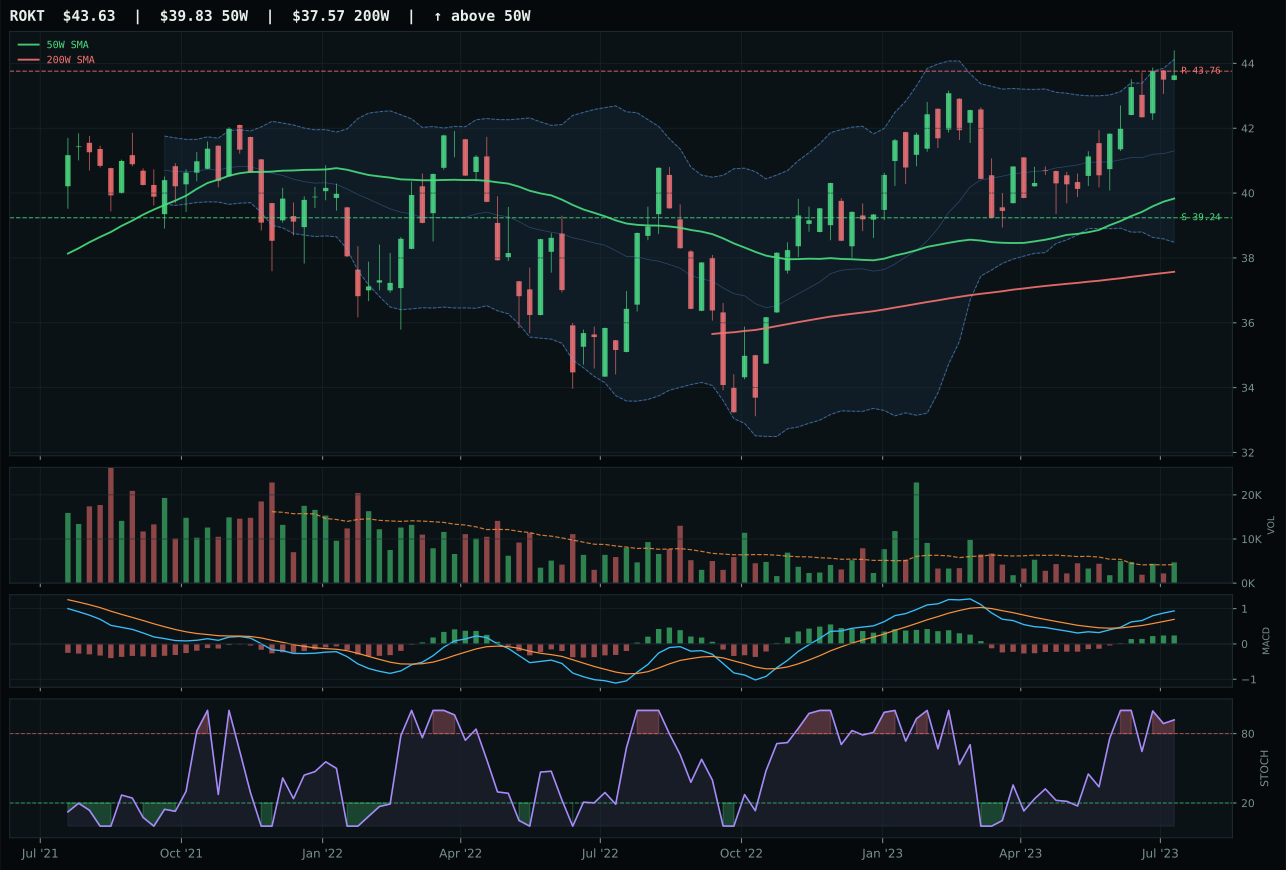
ROKT has a neutral structure profile with -0.7% 13-week relative strength versus SPY.
A failed hold above support would weaken the setup.
Tracked, but not top-2 eligible because: .
XAR won Defense & Aerospace with a 50.2 category score and 65.4 reasoned evidence by maintaining positive price structure (above 50W and 200W) while MACD bullish-and-improving and stochastic overbought momentum created a near-term timing advantage. The -4.1% SPY relative strength is a red flag, but XAR's neutral volume at 0.90x 20W and 72.0 structure score mean the category winner is not leading with conviction—it's winning because ITA's volume is even thinner and ROKT's macro fit is worse. At only 4.9% 13W return and neutral momentum confirmation, this category is expressing caution, not opportunity. ITA's -3.8% category-relative strength and thin participation confirm that buyers are not enthusiastic about defense names right now; XAR's 3.6-point lead is less a vote of confidence and more a relative ranking of three struggling setups.
Defense & Aerospace scores 50.2 and earns only 5% allocation, ranking below both growth categories and specialty metals. The category macro fit sits at neutral because no Defense-specific descriptor profile registered; the move is bottleneck-driven rather than signal-driven. Credit stress adds a modest +2, but liquidity stress subtracts -4, creating a macro headwind that technical trend alone cannot overcome. XAR's +4.9% thirteen-week return is the definition of going nowhere—positive but unsponsored—and relative to Technology at 66.7 or AI at 69.2, the 50.2 score reflects a category that is holding but not accelerating. At 5% allocation, this is portfolio ballast, a defensive sleeve rather than a conviction trade. The 71.8 technical evidence for XAR barely covers the 50.0 macro fit, meaning the position depends entirely on the absence of deterioration. Any deterioration—trendbreak, volume rollover, stochastic collapse—triggers immediate downgrade.
Precious Metals — GLD
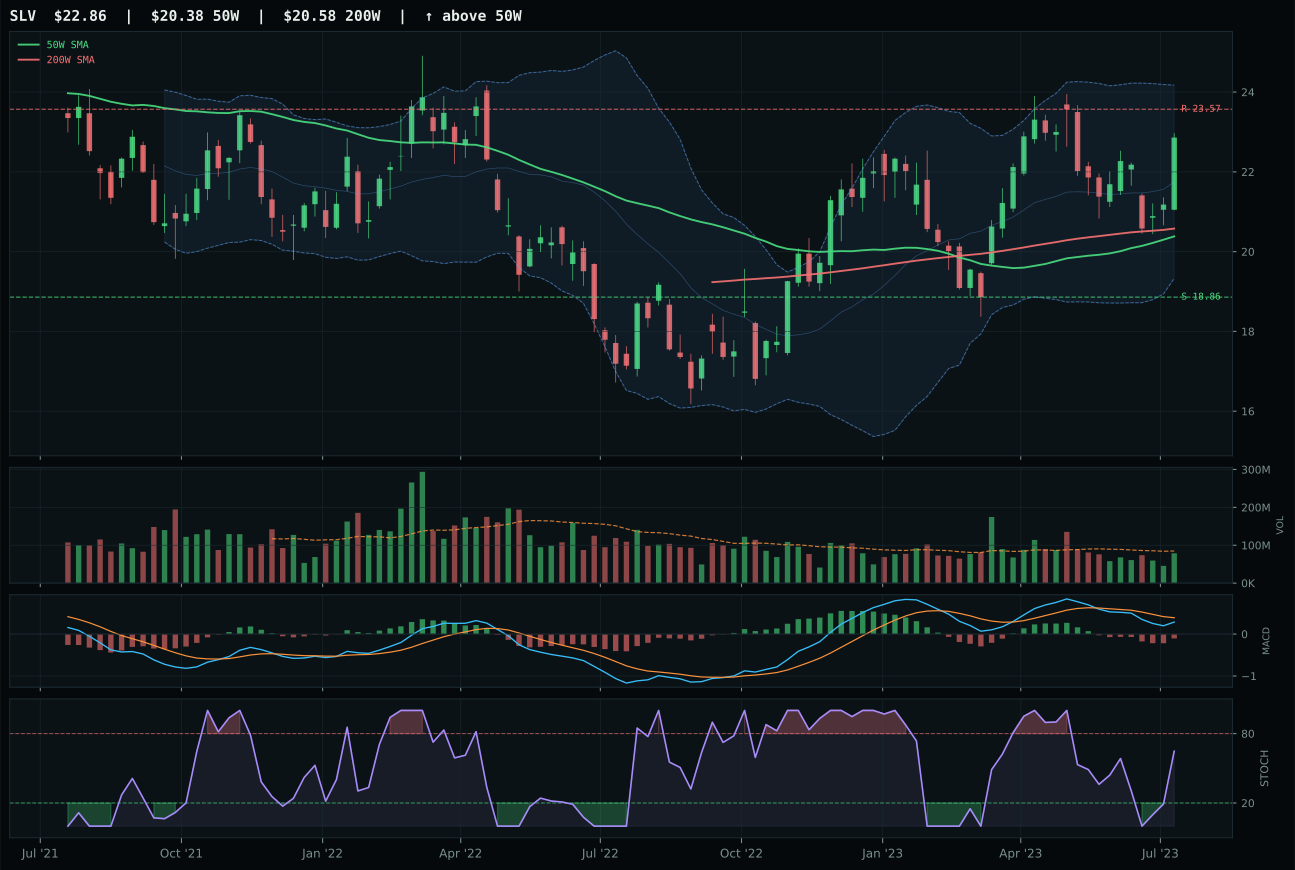
SLV has a neutral structure profile with -10.9% 13-week relative strength versus SPY.
A failed hold above support would weaken the setup.
Actionable but governed by invalidation levels.
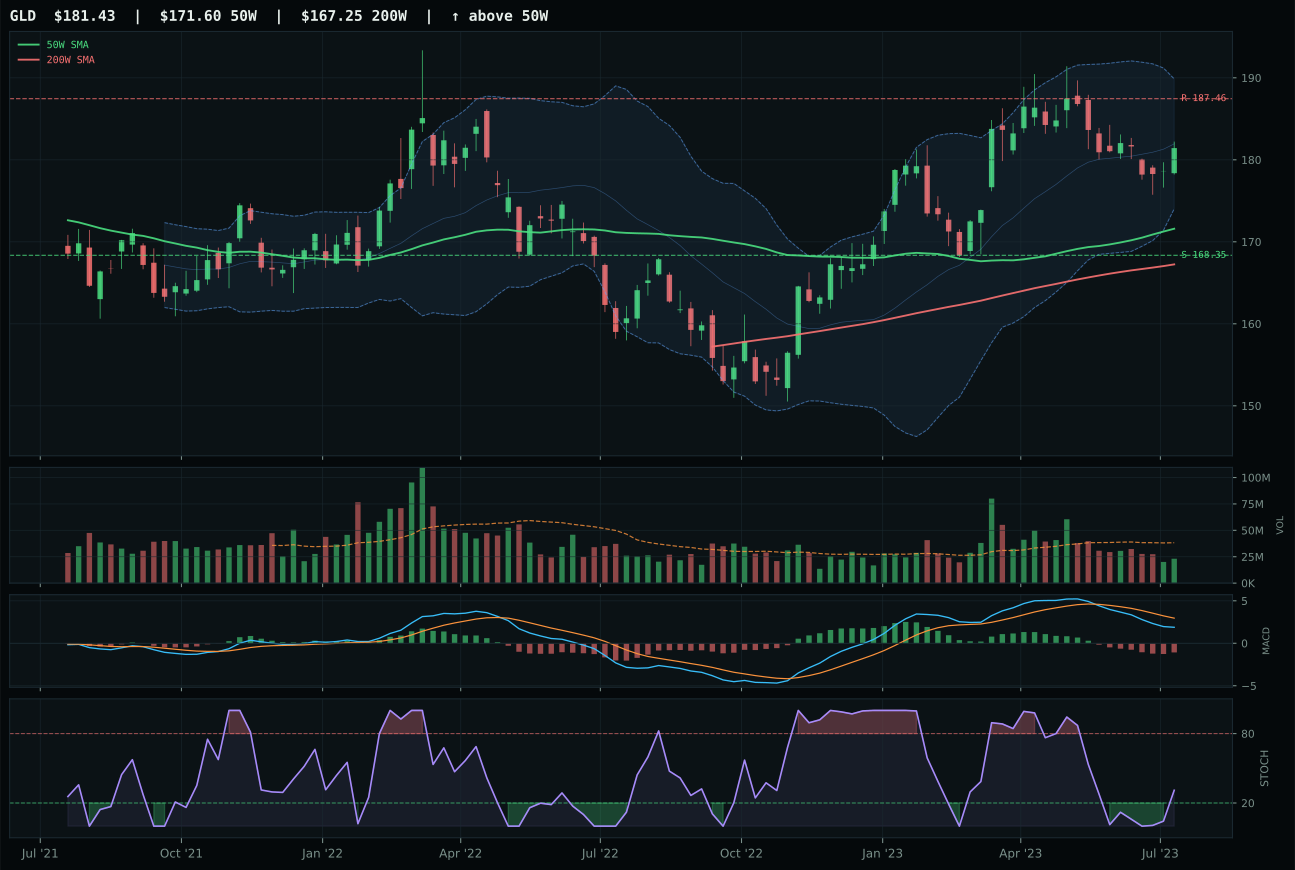
GLD has a neutral structure profile with -11.6% 13-week relative strength versus SPY.
A failed hold above support would weaken the setup.
Actionable but governed by invalidation levels.
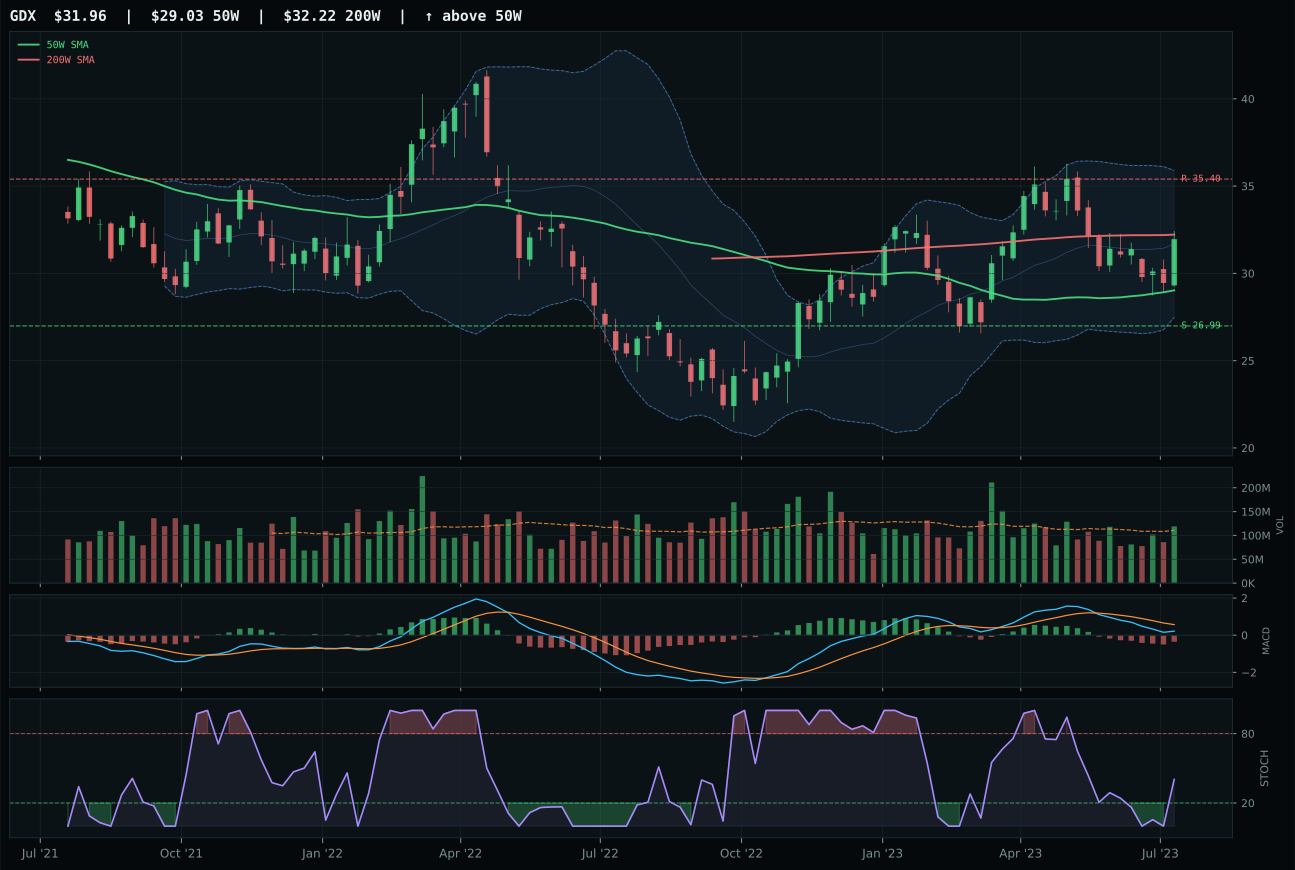
GDX has a neutral structure profile with -17.8% 13-week relative strength versus SPY.
A failed hold above support would weaken the setup.
Actionable but governed by invalidation levels.
GLD won Precious Metals over SLV by a slim 1.1-point margin because it sits closer to the 50W (5.7% vs SLV's 12.2%), offering better timing for entry despite both exhibiting bearish-weakening MACD and thin volume (0.60x and neutral respectively). Both gold and silver are in the upper retracement zone (Fib 0.236) with rising mid-zone stochastic RSI, a pattern that suggests potential repair buying but no conviction. GLD's 74.2 structure score beats SLV's 73.3 on cleanliness and compression mechanics, but the critical difference is that GLD's -2.6% 13W return and 8.8 momentum confirmation show less downside damage; SLV's -1.9% 13W is marginally better, but at 12.2% distance from 50W it's already extended into tired-money territory. The 52.5 versus 47.6 risk/reward edge for GLD is meaningful because downside to support is 7.8% versus a negligible upside to resistance, making GLD the better risk-asymmetry candidate when neither metal is showing real accumulation.
Precious Metals scores 40.7 and earns 5% allocation, ranking below nine other categories but ahead of completely excluded exposures. The macro fit of 60.0 for the category reflects disinflation as a +8 tailwind, yet the portfolio's 5% slot is defensive ballast, not conviction. GLD's 36.9 technical evidence is the weakness: negative momentum confirmation at 8.8 out of 100, volume-price confirmation at only 31.8, and persistence at 36.6 all signal that gold is held for macro insurance, not active accumulation. The -11.6% relative weakness versus SPY—shared across the basket—indicates that in a risk-appetite-positive regime (+9 active), even safe-haven metals cannot compete for marginal capital. At 5% allocation, this is the portfolio's insurance premium, justified by disinflation pressure and credit stress (+2) but constrained by the reality that actual buying is elsewhere. If liquidity stress were to spike from -5 to -15, this position would merit a doubling to 10%; as structured, it is a hedge that the portfolio hopes to eventually fade.
Emerging Markets — INDA
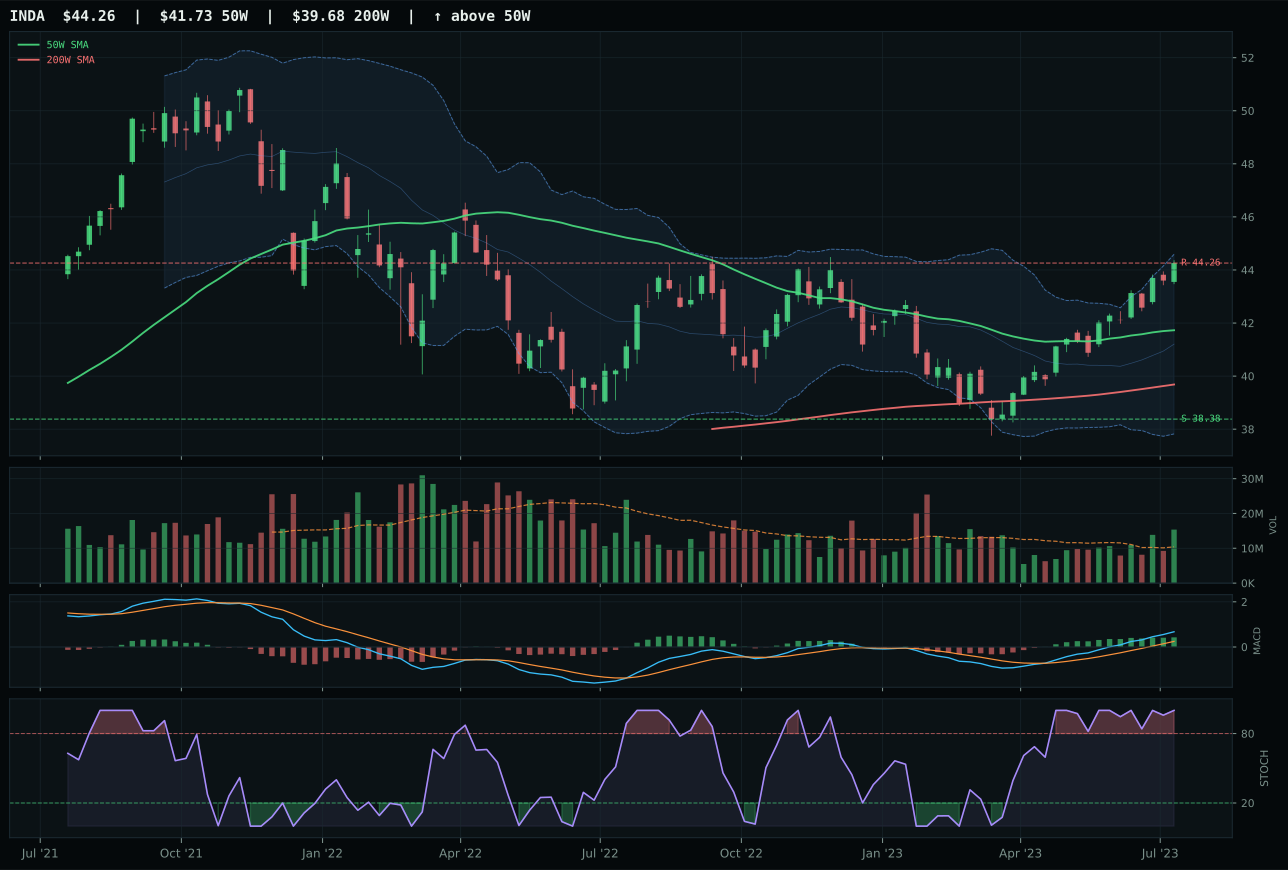
INDA has a neutral structure profile with 1.3% 13-week relative strength versus SPY.
A failed hold above support would weaken the setup.
Actionable but governed by invalidation levels.
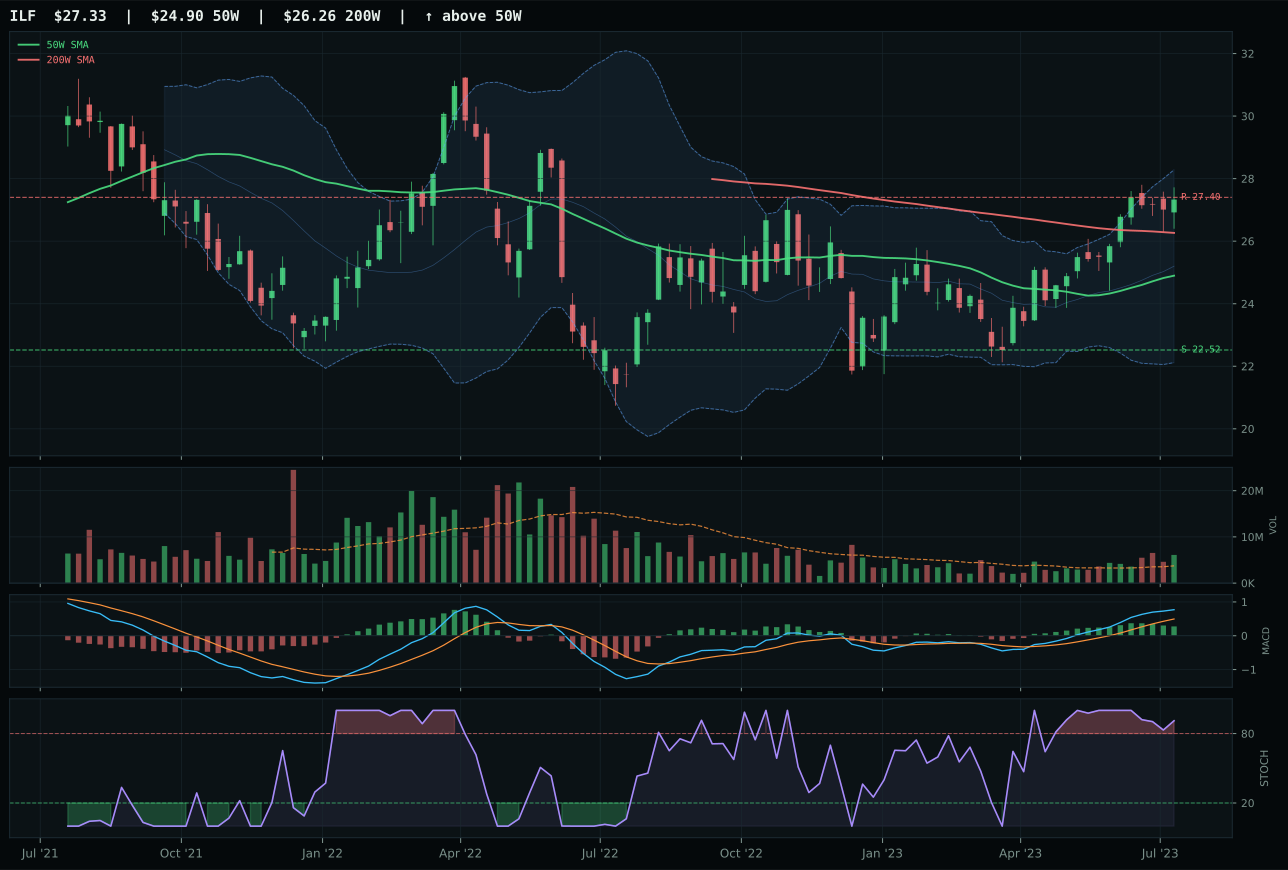
ILF has a neutral structure profile with 0.0% 13-week relative strength versus SPY.
A failed hold above support would weaken the setup.
Actionable but governed by invalidation levels.
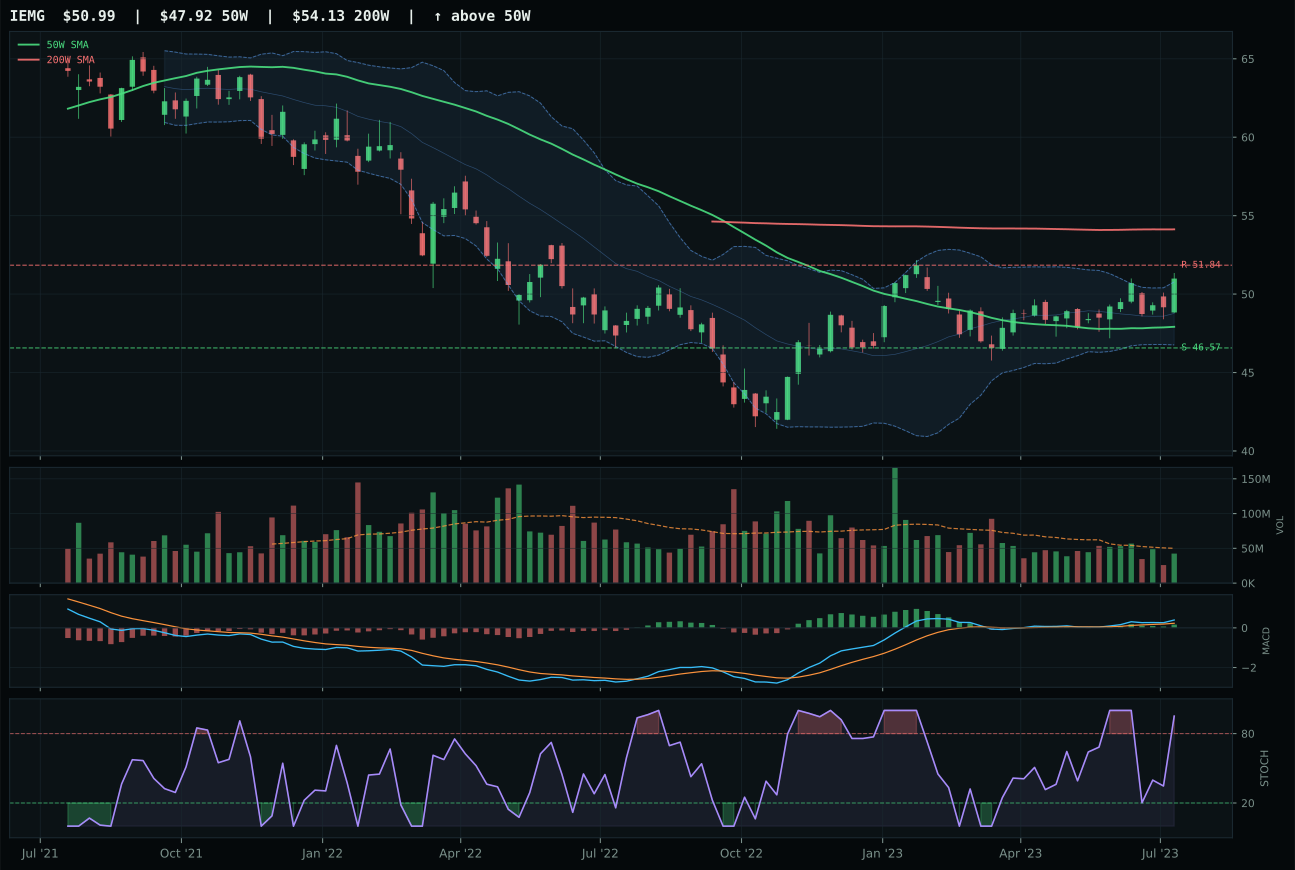
IEMG has a neutral structure profile with -5.5% 13-week relative strength versus SPY.
A failed hold above support would weaken the setup.
Actionable but governed by invalidation levels.
INDA dominated Emerging Markets with 72.5 reasoned evidence and 85.4 technical evidence by posting the only positive category-relative strength (1.2% vs ILF's 0.0%), the only improving MACD (bullish and improving vs bullish but flattening), and the highest momentum confirmation (83.9 vs ILF's 65). Price sits 6.1% above the 50W at Fib 0.236 near 52W highs, a classic momentum-extension setup that INDA executes with 100.0 trend, 1.48x 20W volume participation confirming accumulation, and stochastic overbought momentum that matters less when volume backs it. ILF's -2.3% 13W return and overbought-rolling-over stochastic RSI reveal a setup losing steam; INDA's 10.2% 13W and improving MACD show active buying. The 10.9-point score gap is substantial because INDA's relative strength within the category (1.2% vs 0.0% for ILF) proves India-specific capital flows, not just broad emerging-market rebound; this distinction matters when judging whether an emerging-market fund is truly participating in its region's momentum or just tracking SPY correlations.
Emerging Markets scores 32.3 and earns 5% allocation as the portfolio's smallest growth position, a secondary rather than primary emerging-market conviction. Macro fit is weak at 38.0: risk appetite positive adds +8, but credit stress (-10) and liquidity stress (-10) create a -12 net headwind despite commodity breadth positive (+8). INDA's 85.4 technical evidence is the strongest driver, carrying a portfolio that otherwise lacks macro tailwind. At 10.2% thirteen-week return and 1.3% SPY-relative strength, INDA outpaces the two top-2 categories on absolute thirteen-week return, yet scores only half of AI's category score (69.2). The gap reflects macro regime: emerging markets are secondary beneficiaries of growth, not primary. The 5% allocation is optionality, not conviction. Relative to Technology at 66.7 and AI at 69.2, Emerging Markets at 32.3 is justified by INDA's technical leadership and the reality that India-specific demographics and growth rates provide diversification if US tech momentum falters. If ILF were to improve on timing or category macro fit were to shift, this could scale to 7.5%. For now, this is portfolio insurance: a position that works if growth accelerates globally, but not required if US AI leadership persists.
Agriculture & Livestock — MOO
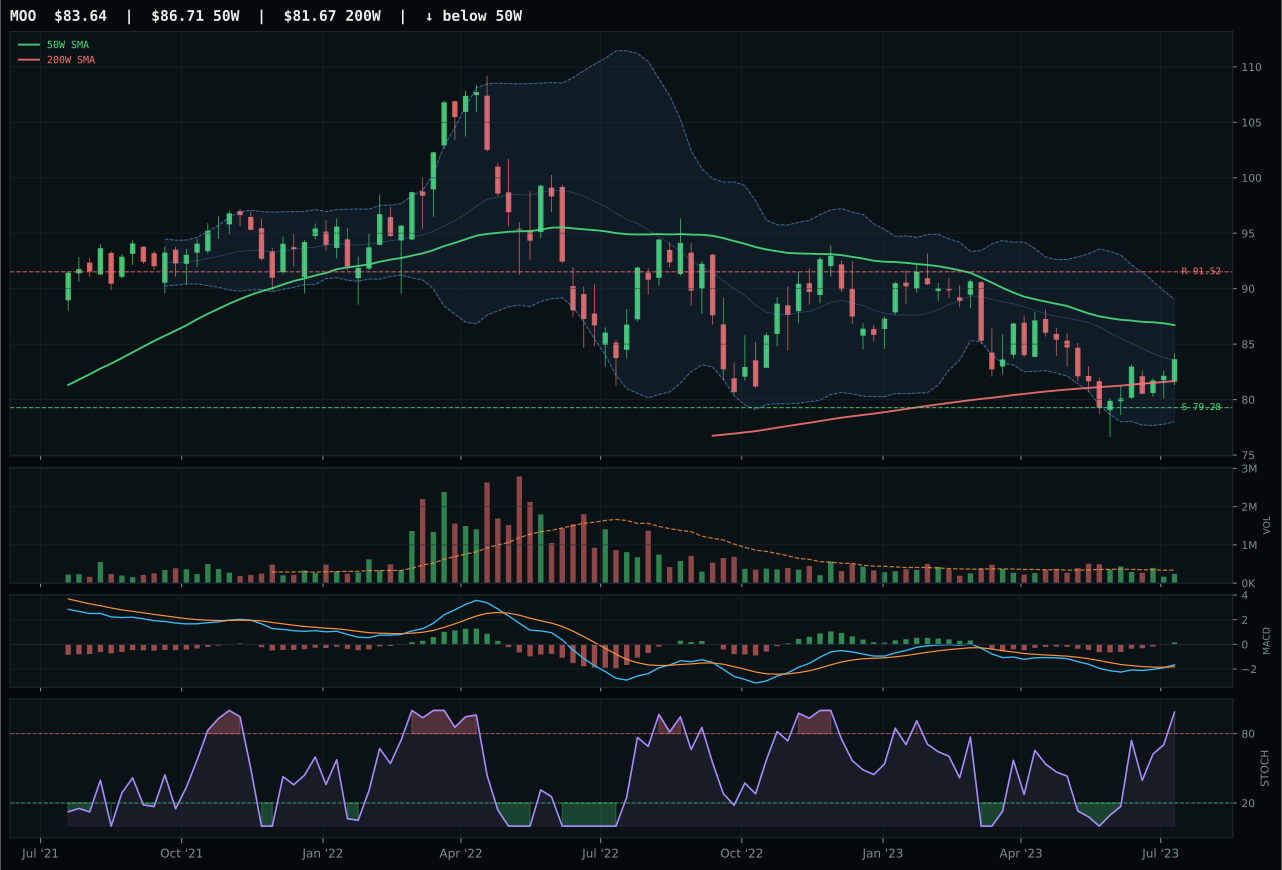
MOO has a neutral structure profile with -12.9% 13-week relative strength versus SPY.
A failed hold above support would weaken the setup.
Actionable but governed by invalidation levels.
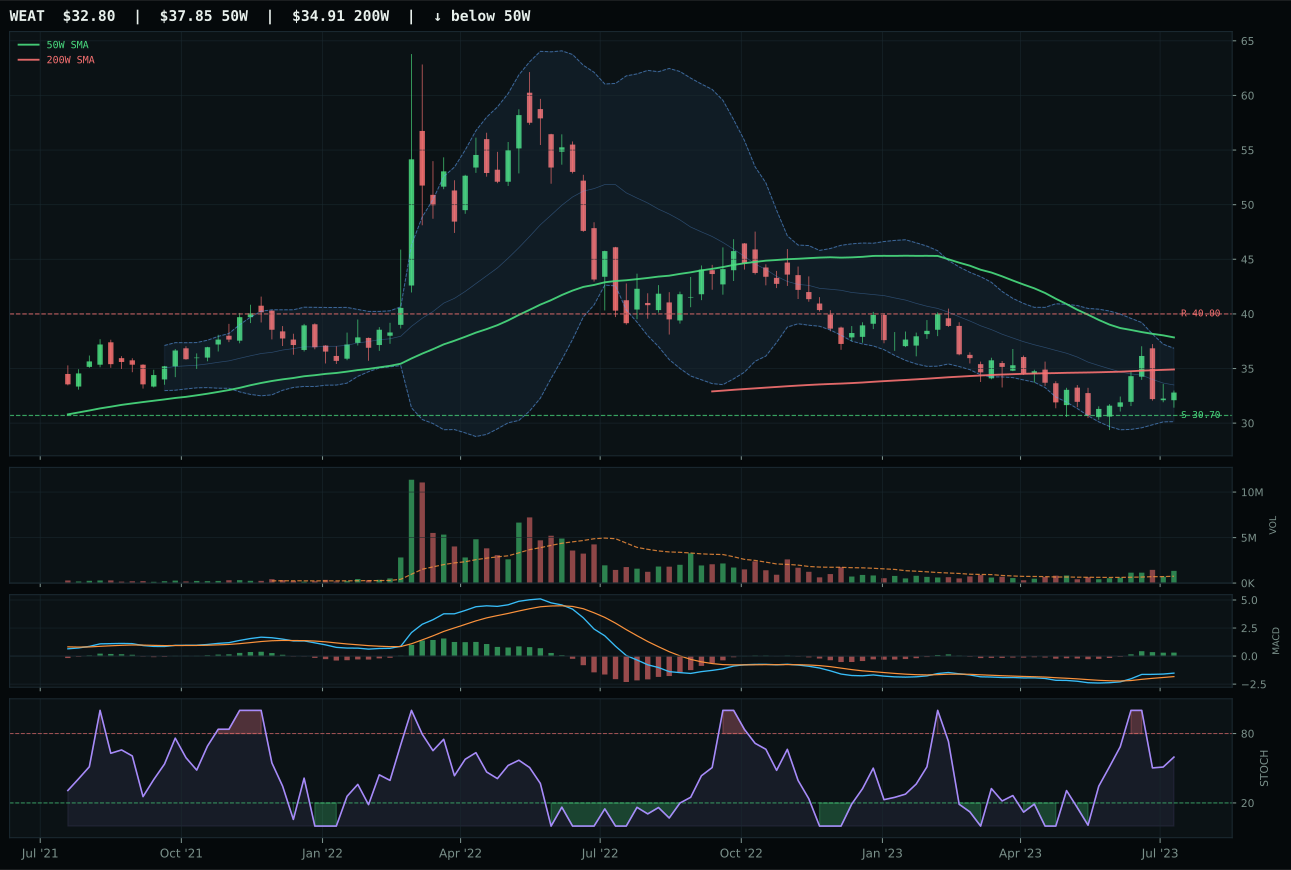
WEAT has a neutral structure profile with -14.5% 13-week relative strength versus SPY.
A failed hold above support would weaken the setup.
Actionable but governed by invalidation levels.
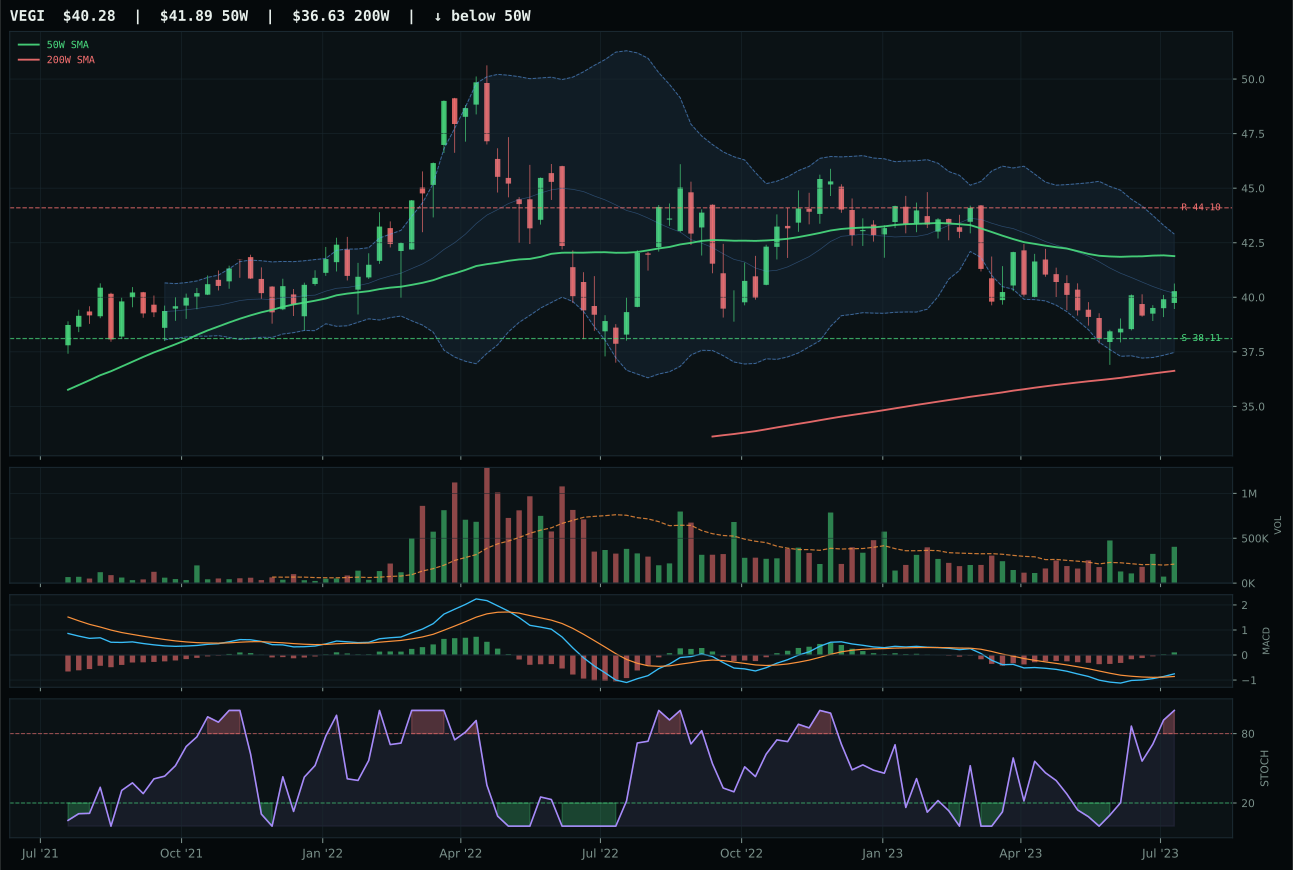
VEGI has a neutral structure profile with -12.2% 13-week relative strength versus SPY.
A failed hold above support would weaken the setup.
Tracked, but not top-2 eligible because: .
MOO wins Agriculture & Livestock with a 55.0 reasoned evidence score not because the setup is strong, but because it's the least damaged in a category where all three nominees are retreating. Price sits below the 50W but above the 200W—a reset configuration—and MOO's 97.0 timing score comes from sitting at Fib 0.618 (deep value zone), not from momentum. The -4.0% 13W return and -12.9% SPY relative strength reveal real weakness, but MOO's 81.2 risk/reward is exceptional because downside to support is only 5.5% while upside exists if buyers defend; MACD is bullish and improving, which is the only technical positive in this deteriorating category. WEAT lost by posting -5.6% 13W return and 55.0 timing (less attractive Fib location), making it look worse on paper despite having better volume confirmation. This is a category where the winner is simply the option that loses the least if commodities stay under pressure.
Agriculture & Livestock ranks 9th or 10th with a 25.2 category score and receives 0% allocation this week, completely excluded from the portfolio. The macro regime works actively against this exposure: disinflation pressure registers -8, and despite +8 for real asset sponsorship and +5 for commodity breadth positive, the net descriptor flow is -6 when weighted against a macro state that is explicitly disinflationary. MOO's -12.9% relative weakness versus SPY is not a timing discount; it is a category-wide signal that commodity agriculture is being systematically repriced lower in a disinflation environment. Thirteen-week return of -4.0% confirms the narrative—this is not a quiet accumulation but an active repricing. The 59.0 technical evidence for MOO is barely sufficient to keep the category eligible, and at 25.2 overall, it scores below even Traditional Energy at 12.0 in terms of portfolio relevance. For allocation to return, MOO would need either SPY-relative strength to turn positive, volume to surge above 1.0x the 20W average, or disinflation pressure to flip from -8 to neutral or positive—none of which has occurred.
Traditional Energy — XLE
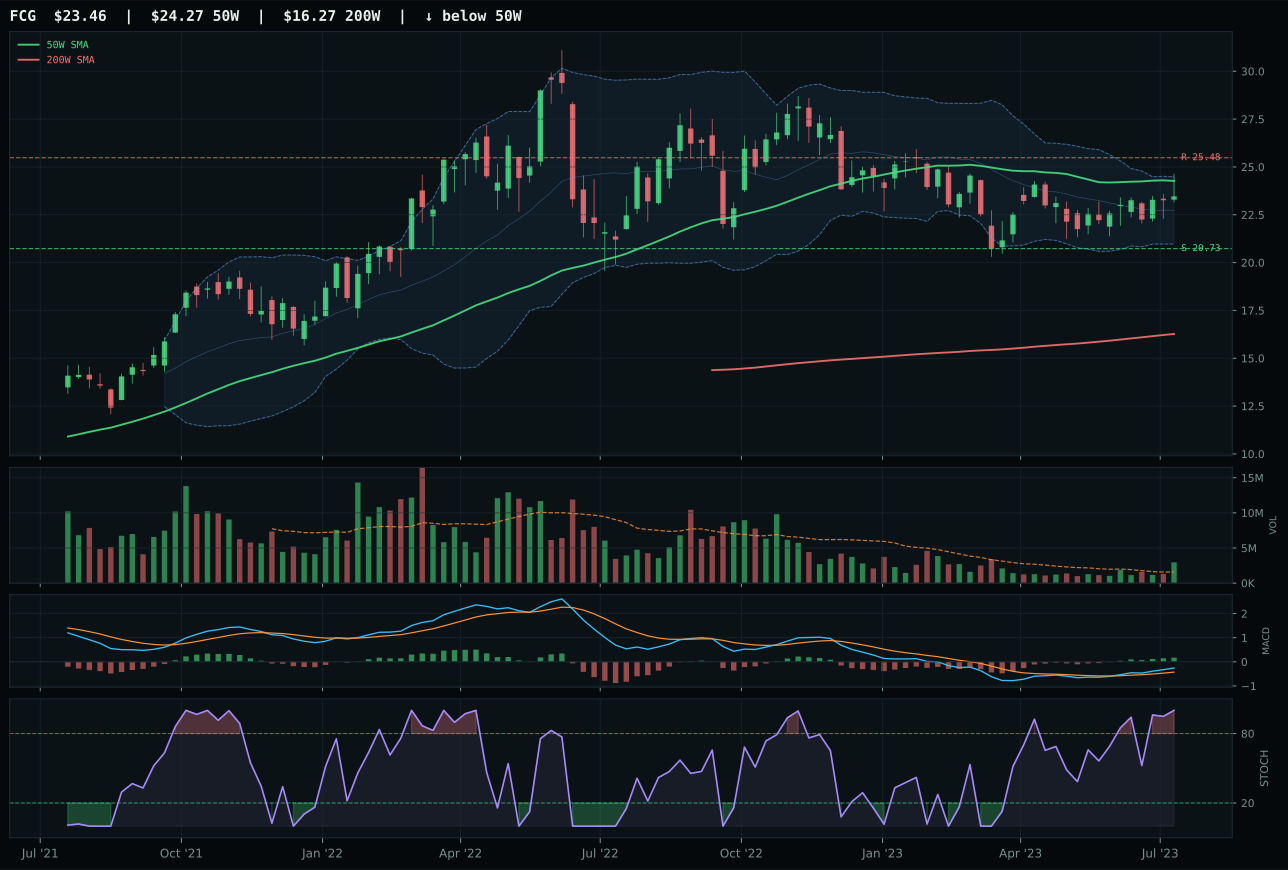
FCG has a neutral structure profile with -11.5% 13-week relative strength versus SPY.
A failed hold above support would weaken the setup.
Actionable but governed by invalidation levels.
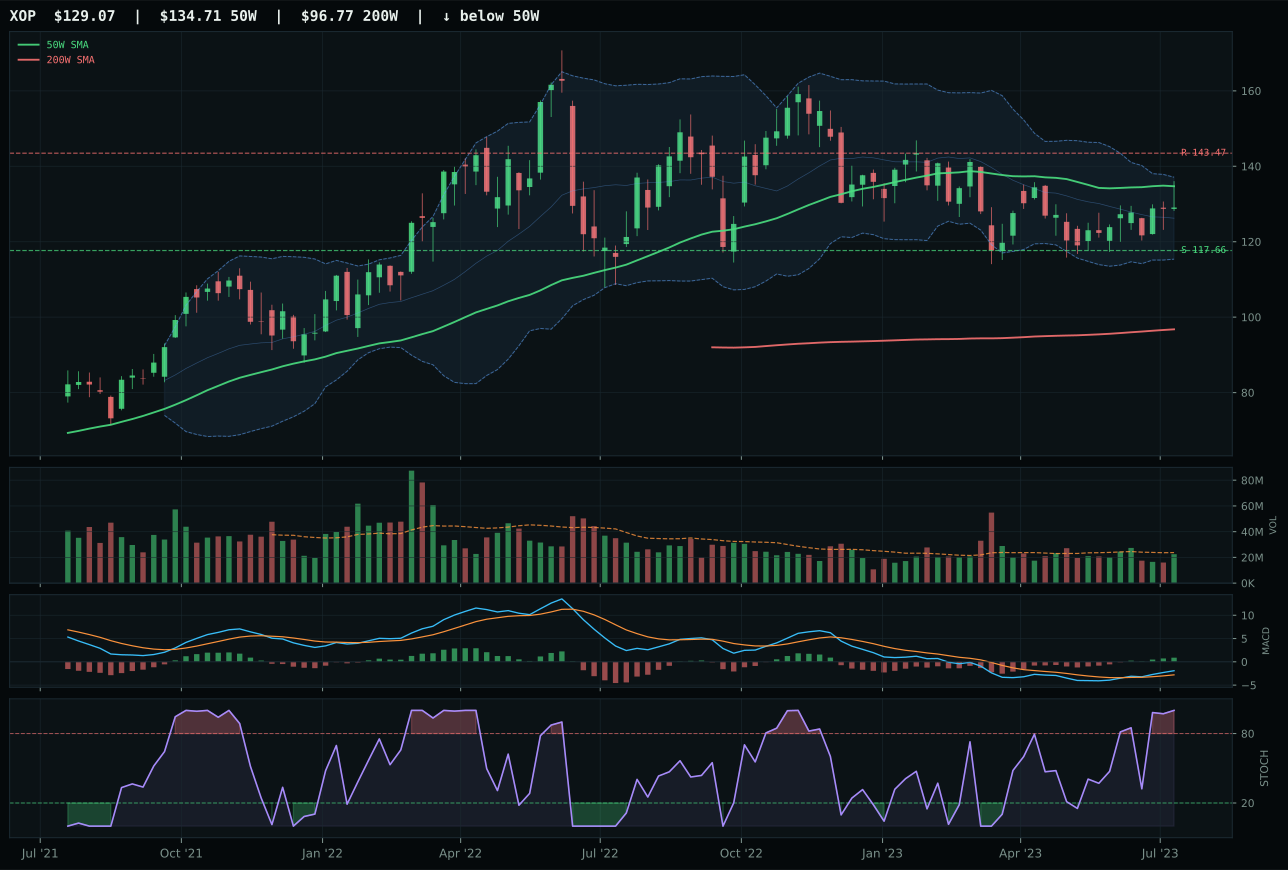
XOP has a neutral structure profile with -12.9% 13-week relative strength versus SPY.
A failed hold above support would weaken the setup.
Actionable but governed by invalidation levels.
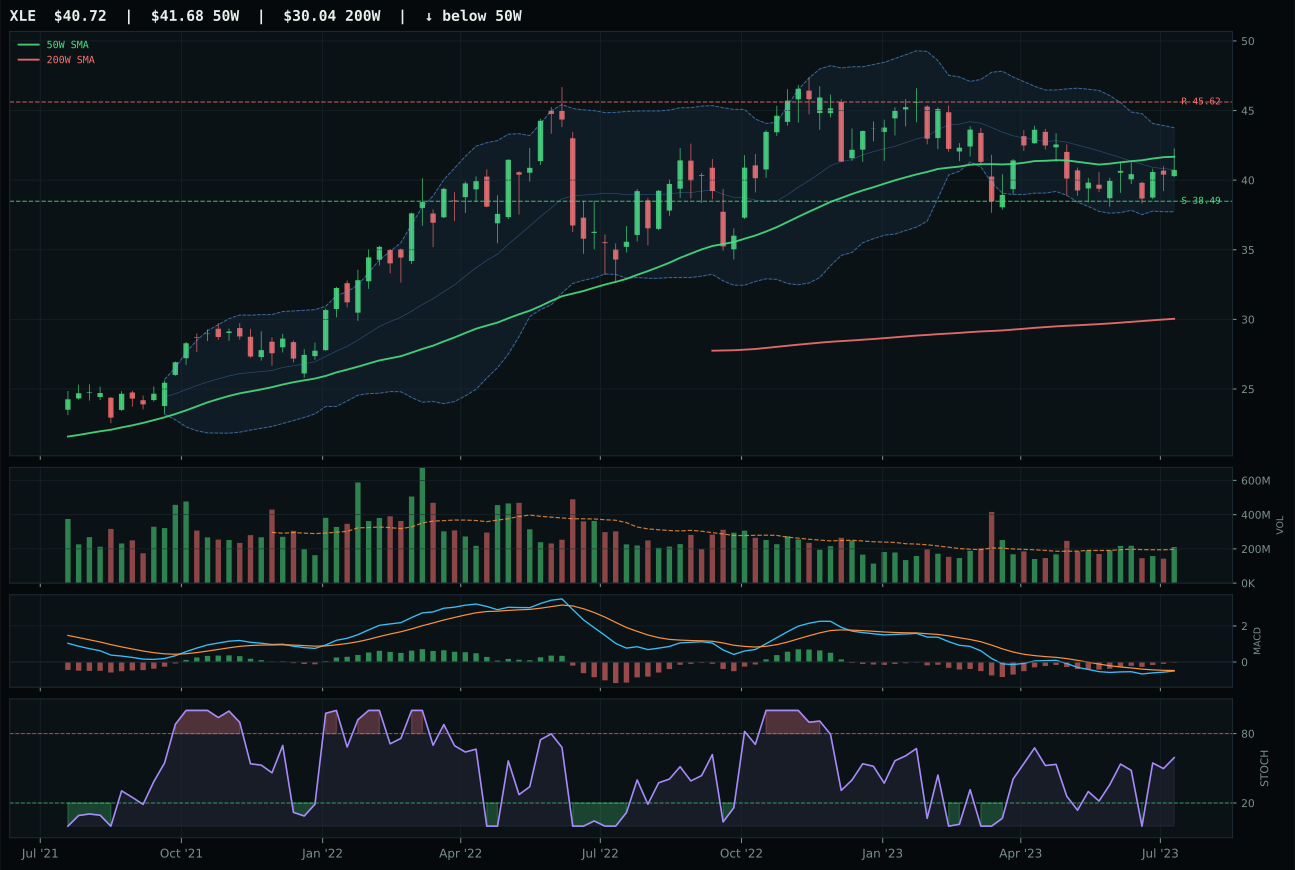
XLE has a compression near 50W profile with -15.6% 13-week relative strength versus SPY.
A failed hold above support would weaken the setup.
Actionable but governed by invalidation levels.
XLE won Traditional Energy by default rather than by dominance, earning the representative position with 34.4 reasoned evidence (the lowest winning score across all categories) because it posted the best timing (100.0) and risk/reward (86.2) despite worst-in-class momentum (16.9). XLE sits at Fib 0.500 (middle retracement/decision zone) just -2.3% from the 50W with compression near 50W and bearish-but-improving MACD, a setup that screams "bounce candidate" rather than "trend follower." FCG and XOP both show superior relative strength (-11.5% and -12.9% vs -15.6%), yet FCG stumbled on timing (97.0 vs 100.0) and risk/reward (68.8 vs 86.2) because stochastic RSI overbought momentum created entry risk. XLE's rising mid-zone (0.59) is less stretched than FCG's overbought reading, and compression near 50W is tighter than neutral structure, giving XLE the better price level for a mean-reversion trade if buyers step in. The -6.6% 13W return and -15.6% SPY underperformance confirm this category is broken; XLE wins only because its setup is the least overextended.
Traditional Energy scores 12.0 and receives 0% allocation, ranking as the weakest category in the portfolio. Disinflation pressure registers -10, the single-largest negative weighting; combined with credit stress (-7) and liquidity stress (-7), the macro regime is actively hostile to energy economics. Real asset sponsorship adds +7, insufficient to offset the structural headwind. XLE's 34.6 technical evidence barely qualifies for category inclusion; 34.4 proof score emphasizes that this is a macro-forced category, not a technician's choice. The 16.9 momentum confirmation (4W return 0.7%, 13W return -6.6%) confirms that energy is not accumulating—it is grinding lower. At 12.0 category score, Traditional Energy ranks below Agriculture (25.2), Precious Metals (40.7), and Defense (50.2), marking it as the portfolio's highest-conviction exclusion. For energy to re-enter the allocation, disinflation pressure would need to flip from -10 to positive (requiring inflation reacceleration), and XLE would need positive relative strength and above-average volume participation. Neither is remotely evident. This is not a value play deferred; it is a sector outside the current macro regime.