
2023-07-07
Informational purposes only. The content in this report, including allocations, analysis, and commentary, is provided solely for informational and educational purposes. It does not constitute financial advice, investment advice, trading advice, or any other type of advice. Past performance does not guarantee future results. Always conduct your own research and consult a qualified financial professional before making investment decisions.
Weekly Allocation
| Ticker | Category | Weight | Role |
|---|---|---|---|
| FBTC | 50% | Overlay | |
| AIQ | AI | 10% | Top-2 (10%) |
| XLK | Technology | 10% | Top-2 (10%) |
| COPX | Industrial Metals | 5% | Tier-2 (5%) |
| URA | Nuclear Energy | 5% | Tier-2 (5%) |
| XAR | Defense & Aerospace | 5% | Tier-2 (5%) |
| PAVE | Utilities & Infrastructure | 5% | Tier-2 (5%) |
| ILF | Emerging Markets | 5% | Tier-2 (5%) |
| GLD | Precious Metals | 5% | Tier-2 (5%) |
Trade Instructions — Monday Open
Sell the tranche from 2023-06-09 (completing its 4-week hold). Buy the new tranche. Instructions show net portfolio changes — same-asset positions cancel, weight changes show the delta.
| Action | Ticker | Instruction |
|---|---|---|
| SELL | SMH | Sell 67% of SMH position (reduce 3.75% → 1.25%) |
| SELL | IGV | Sell 33% of IGV position (reduce 7.50% → 5.00%) |
| BUY | AIQ | Buy AIQ — 50.00% of freed cash (adds 2.50% to portfolio) |
| BUY | XLK | Buy XLK — 50.00% of freed cash (adds 2.50% to portfolio) |
Current Portfolio After Trade
Combined holdings across all 4 active tranches. Each tranche is 25% of the portfolio.
| Ticker | % of Portfolio | Weight Bar |
|---|---|---|
| FBTC | 50.00% | |
| AIQ | 7.50% | |
| COPX | 6.25% | |
| IGV | 5.00% | |
| XAR | 5.00% | |
| ILF | 3.75% | |
| GLD | 3.75% | |
| PAVE | 3.75% | |
| XLE | 3.75% | |
| URNM | 3.75% | |
| URA | 2.50% | |
| XLK | 2.50% | |
| SMH | 1.25% | |
| WEAT | 1.25% |
Macro Regime — Disinflation
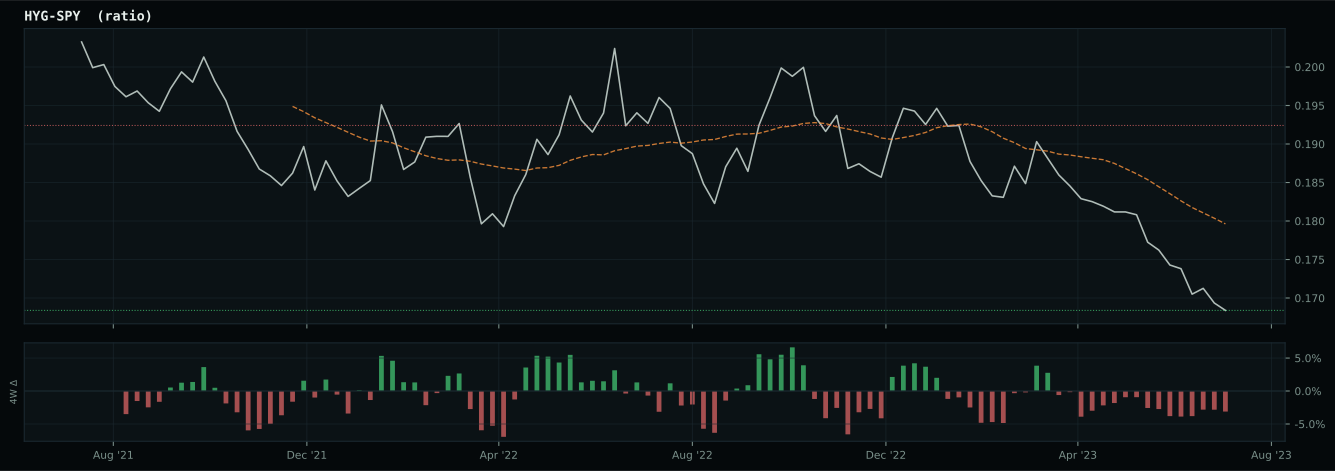
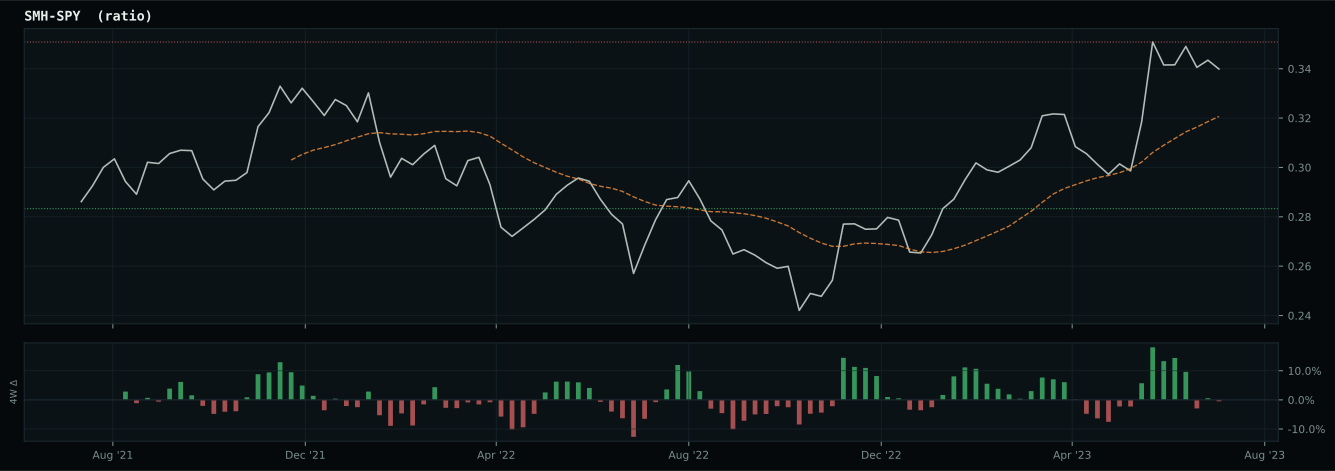
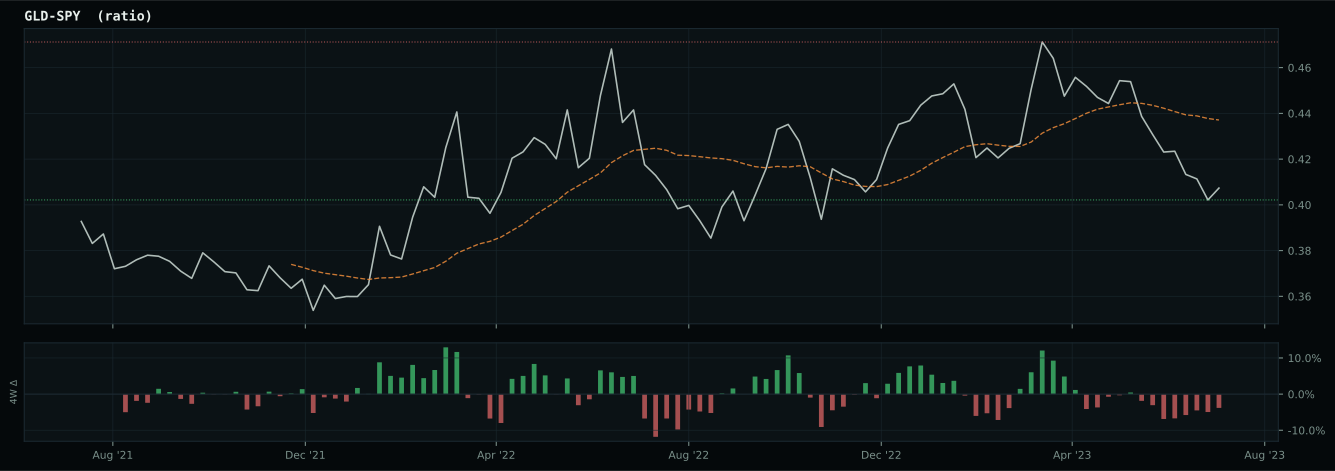
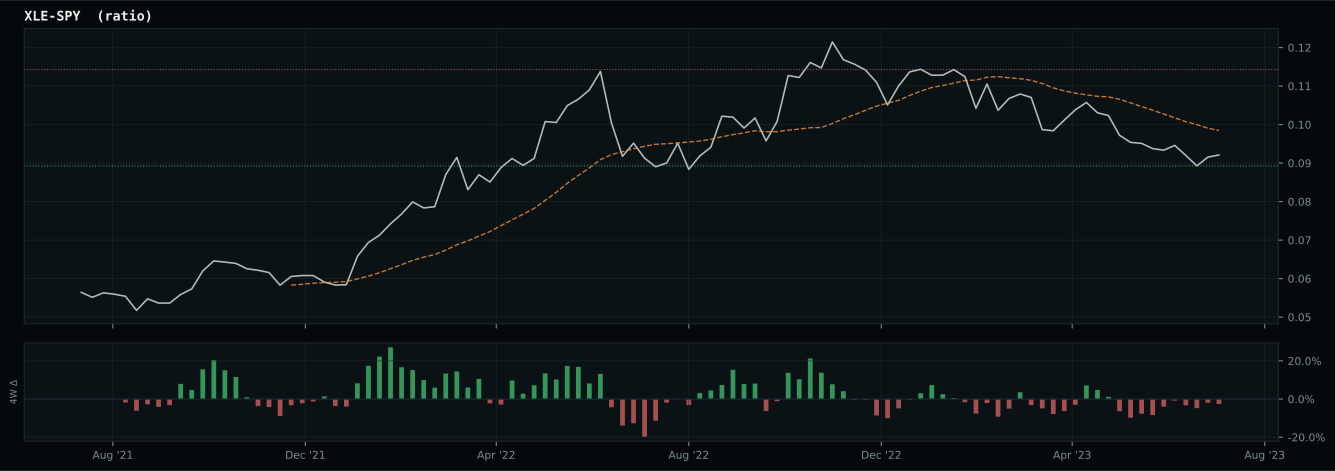
Macro Evidence Charts
Market-implied signals behind the macro regime scores. Each ratio compares two assets; the direction and slope of the ratio is what the macro engine reads.
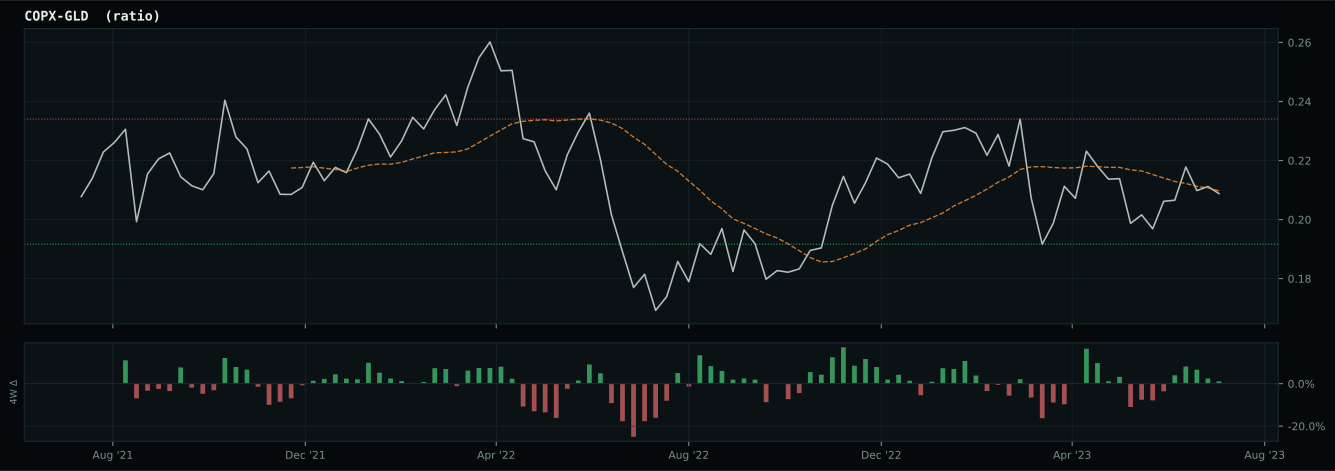
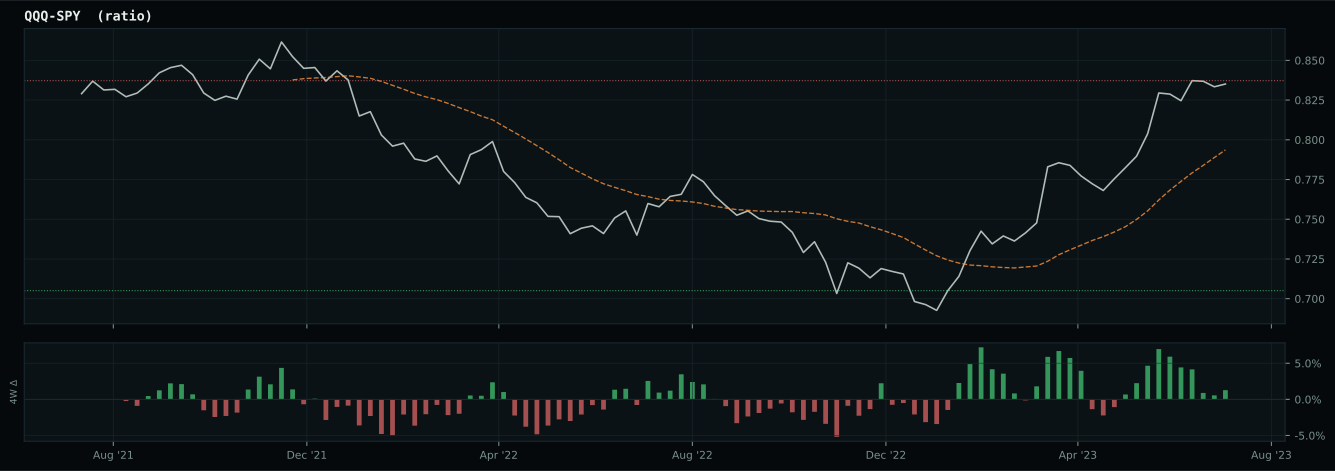
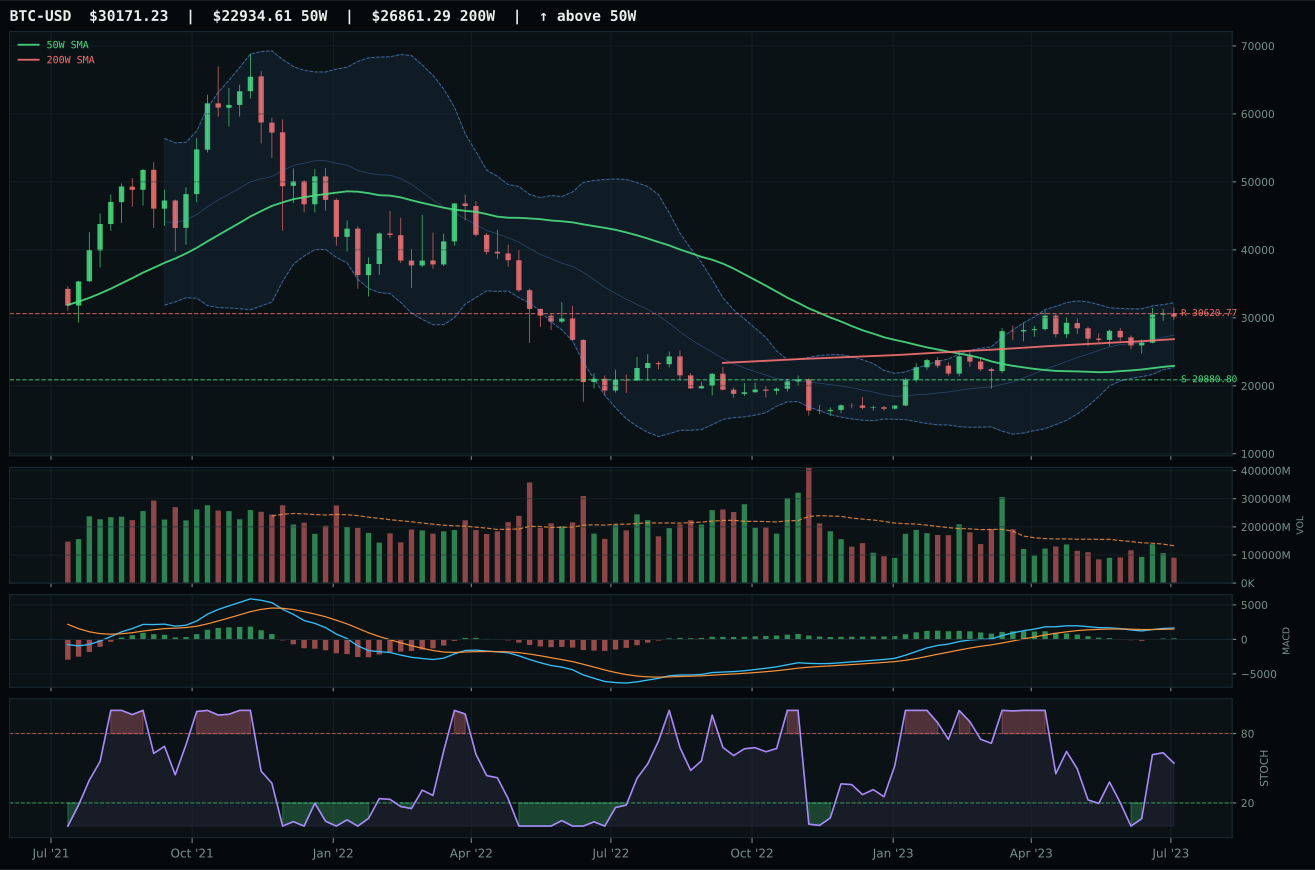
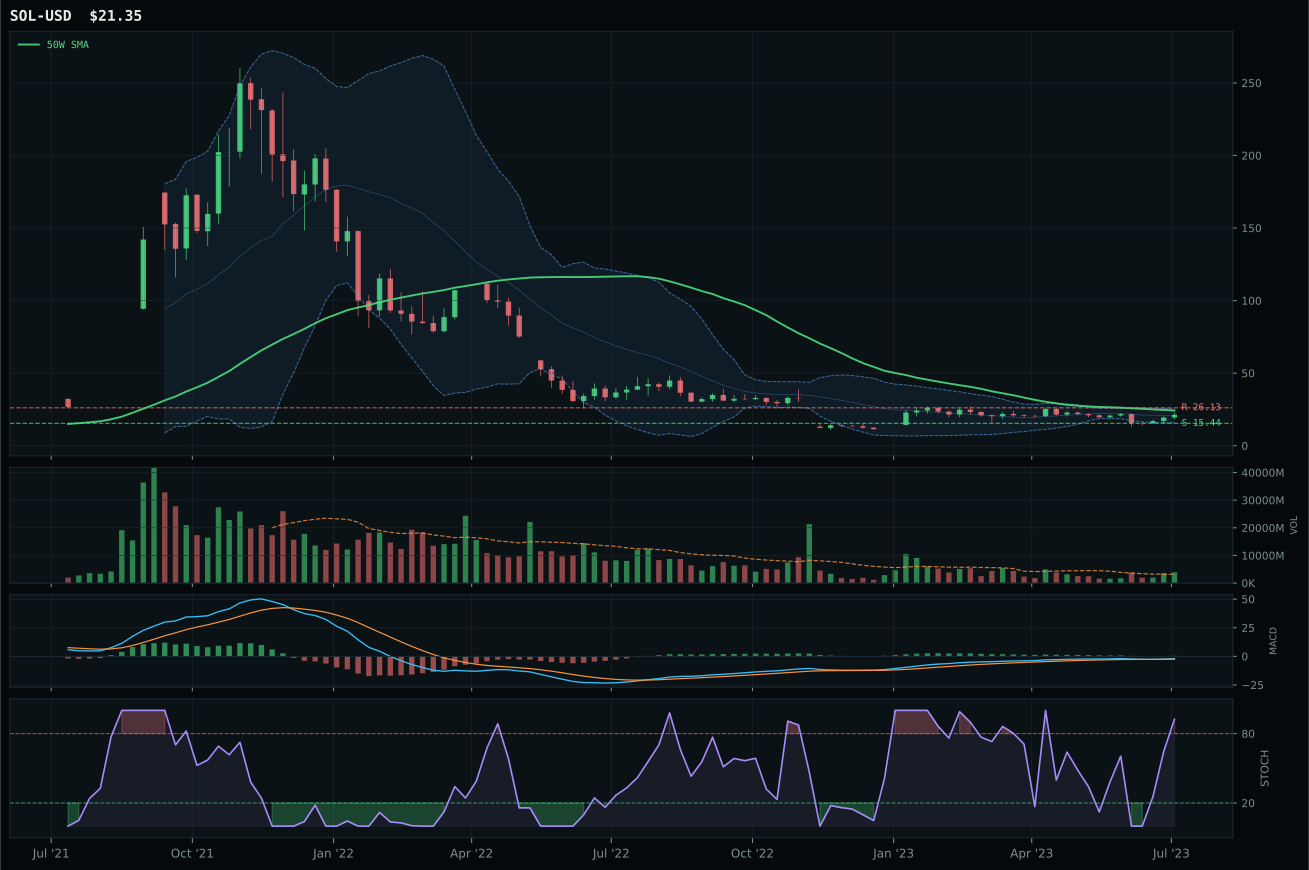
Crypto Regime — TrendBTC
post-touch structure is too wide to count as a range; max/min close ratio is 1.88
TrendBTC confirmed: 2 consecutive closes above rising/flat 50W SMA
one or more available conditions failed
Category Rankings
| Rank | Category | Winner | Score | Alloc | 4W Ret | Peers (4W) |
|---|---|---|---|---|---|---|
| 1 | AI | AIQ | 66.7 | 20% | +3.29% | SMH +4.0% · BOTZ -1.2% |
| 2 | Technology | XLK | 61.5 | 20% | +0.76% | CIBR +1.5% · IGV +2.6% |
| 3 | Industrial Metals | COPX | 53.8 | 10% | +7.94% | REMX -4.6% · PICK +4.4% |
| 4 | Nuclear Energy | URA | 49.9 | 10% | +8.58% | URNM +9.3% · NLR +4.8% |
| 5 | Defense & Aerospace | XAR | 46.5 | 10% | +2.25% | ITA +0.1% · ROKT -0.3% |
| 6 | Utilities & Infrastructure | PAVE | 43.0 | 10% | +3.88% | IGF -0.6% · XLU -1.6% |
| 7 | Emerging Markets | ILF | 41.7 | 10% | +0.74% | INDA +1.4% · IEMG +3.8% |
| 8 | Precious Metals | GLD | 38.2 | 10% | +1.00% | SLV +2.6% · GDX +0.7% |
| 9 | Agriculture & Livestock | MOO | 23.8 | 0% | +5.40% | WEAT +2.2% · VEGI +4.4% |
| 10 | Traditional Energy | XOP | 13.2 | 0% | +12.45% | FCG +11.8% · XLE +8.5% |
AI — AIQ
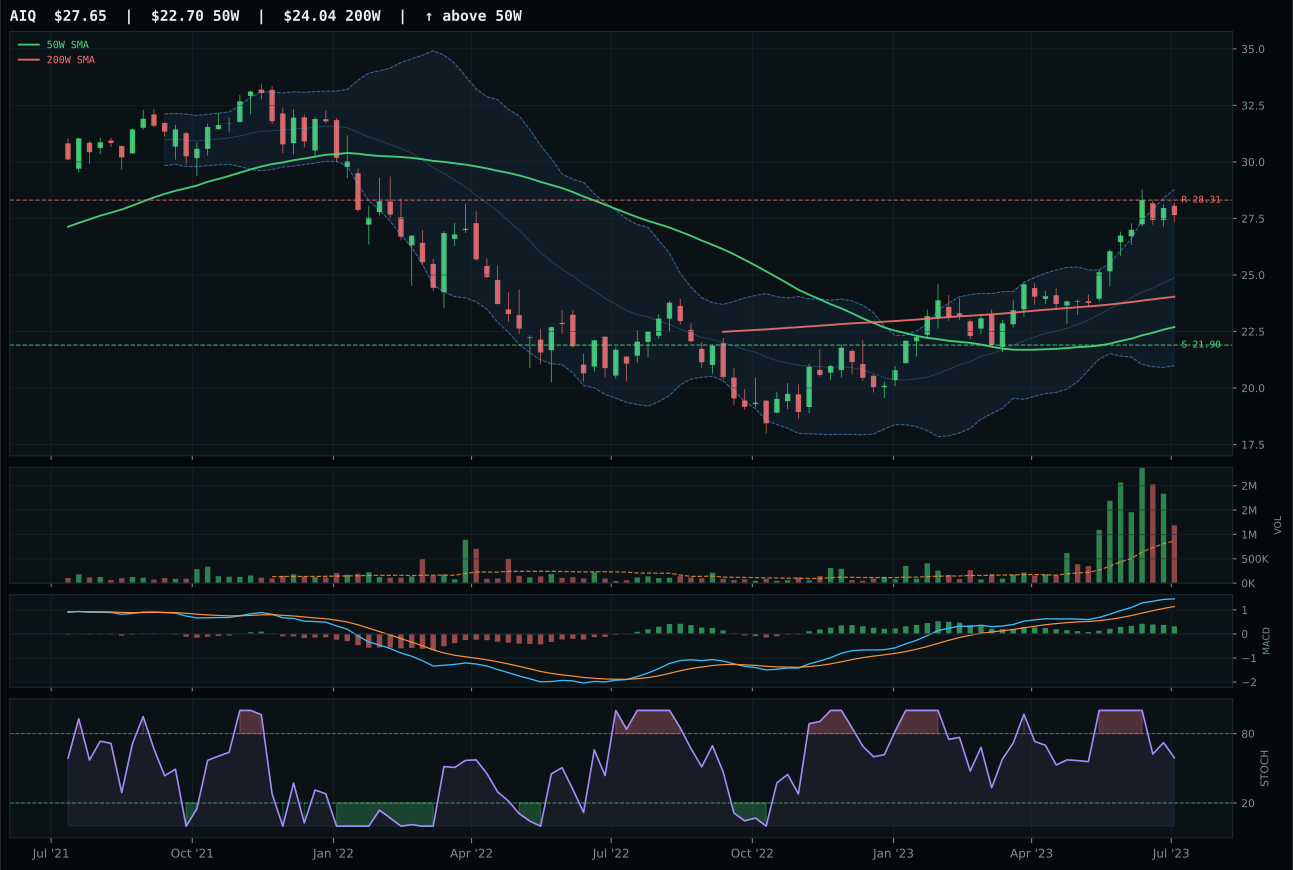
AIQ has a vertical extension profile with 7.8% 13-week relative strength versus SPY.
A failed hold above support would weaken the setup.
Actionable but governed by invalidation levels.
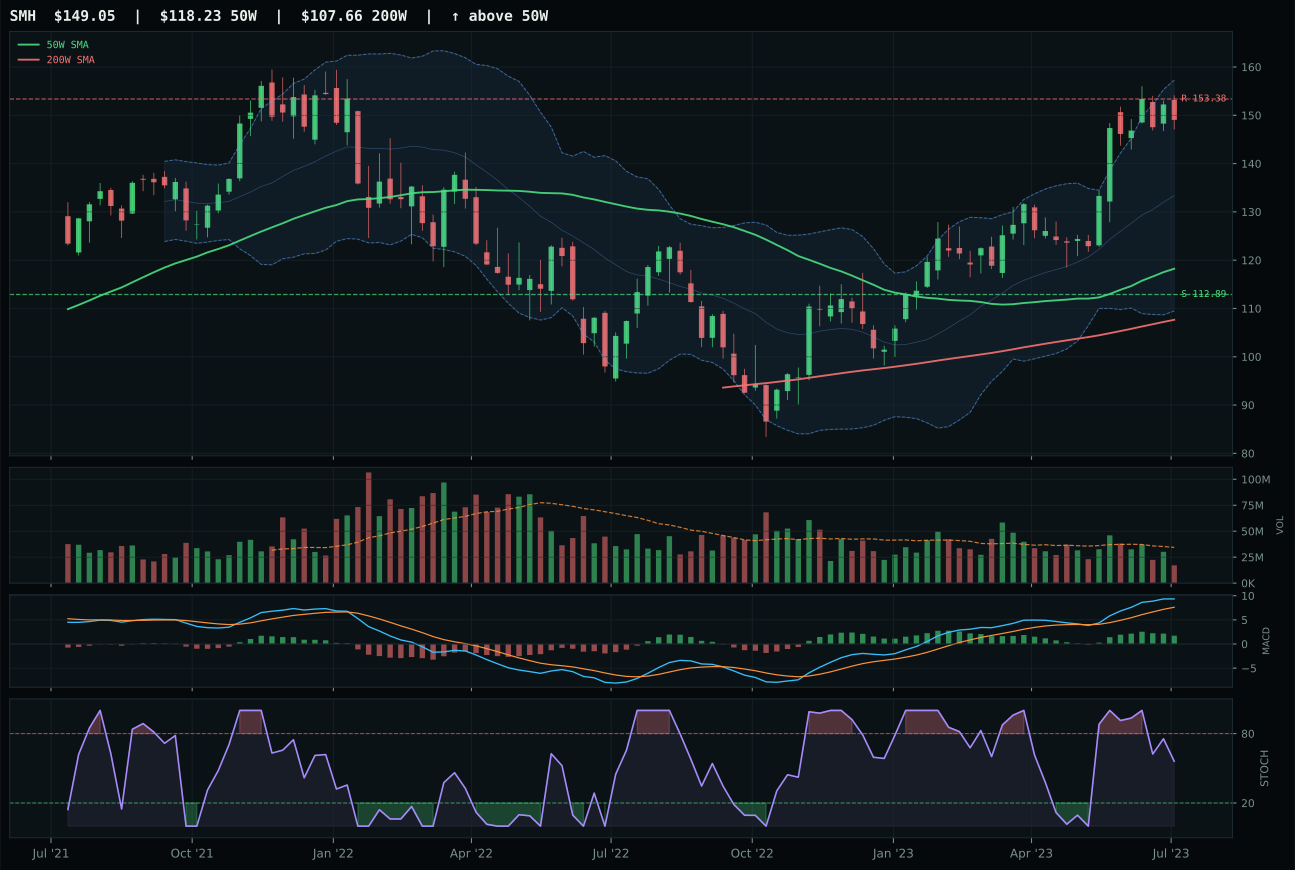
SMH has a vertical extension profile with 10.9% 13-week relative strength versus SPY.
A failed hold above support would weaken the setup.
Actionable but governed by invalidation levels.
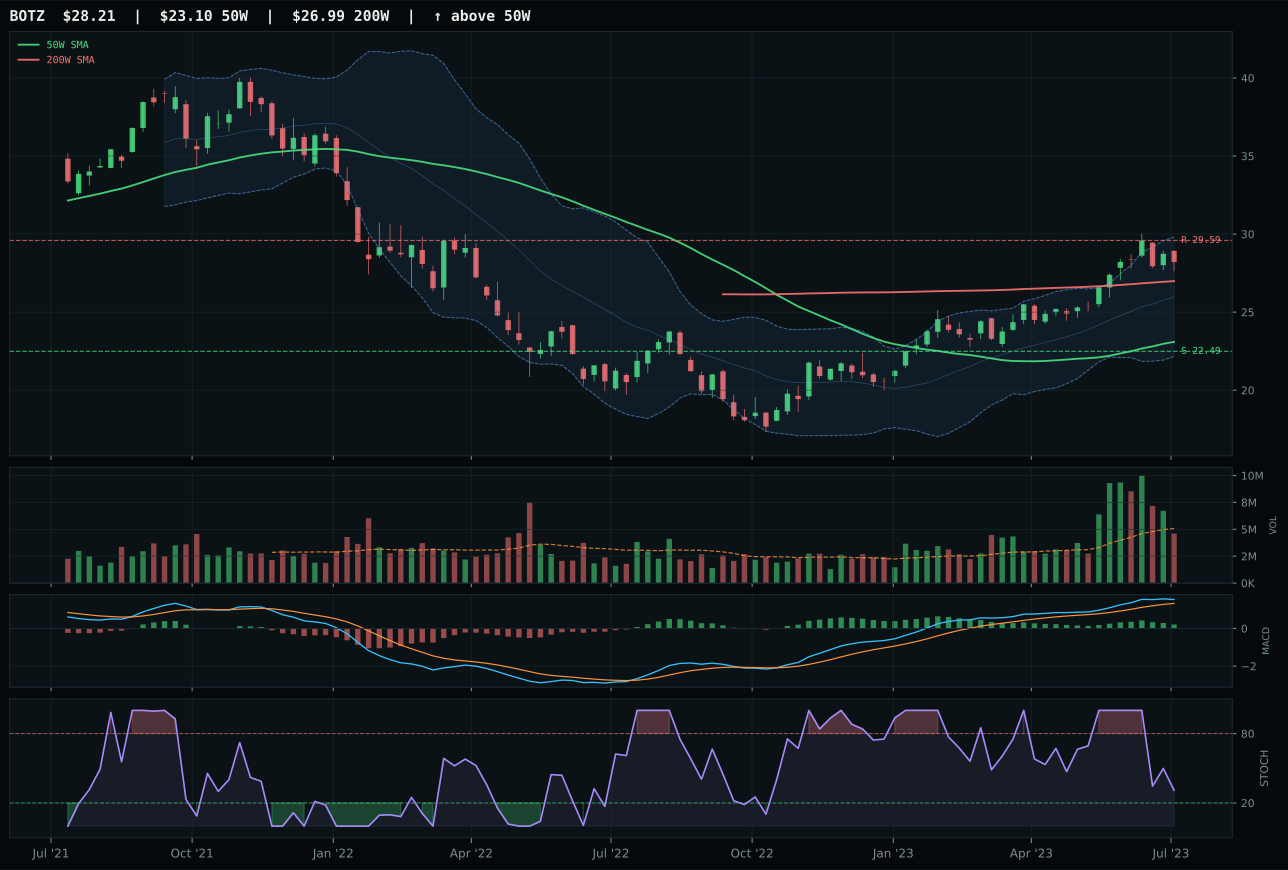
BOTZ has a vertical extension profile with 8.0% 13-week relative strength versus SPY.
A failed hold above support would weaken the setup.
Actionable but governed by invalidation levels.
AIQ won the AI category with the clearest execution and volume confirmation among its peers, setting it decisively apart from semiconductor-heavy SMH despite SMH's stronger 13-week returns. AIQ's price sits 21.8% above the 50W with trend fully bullish and the critical differentiator: volume runs at 1.37x the 20-week average, meaning above-average participation is actively accumulating, not just riding momentum. Structure scores 77.2/100 versus SMH's 68.7, reflecting AIQ's compression and cleanliness. SMH's 10.9% SPY-relative return looks powerful until volume context arrives—thin participation at 0.61x confirms that gains came with thin follow-through. Momentum confirmation for AIQ reaches 92.0/100 versus SMH's 94.0, a reversal driven entirely by volume sponsorship, not by price action. The 10.6-point gap between AIQ and SMH is clean and wide.
AI earned its top-2 allocation at 10% based on the highest final category score at 66.7, buoyed by strong technical evidence (77.1/100) and a 59.0/100 macro fit that benefits from active AI growth sponsorship and positive risk appetite. This allocation makes tactical sense in a disinflation regime where growth narratives thrive, but it carries execution risk. AIQ sits extended, and the 48.0/100 timing score reflects that reality: entry risk is real, with upside to resistance showing negative 2.3%. The category can hold 10% only if followers view disinflation as a multi-week tailwind that justifies buying extended trends, and if volume confirms accumulation rather than distribution at resistance. Any break in risk appetite or fading in AI sponsorship scores would quickly make this 10% look expensive.
Technology — XLK
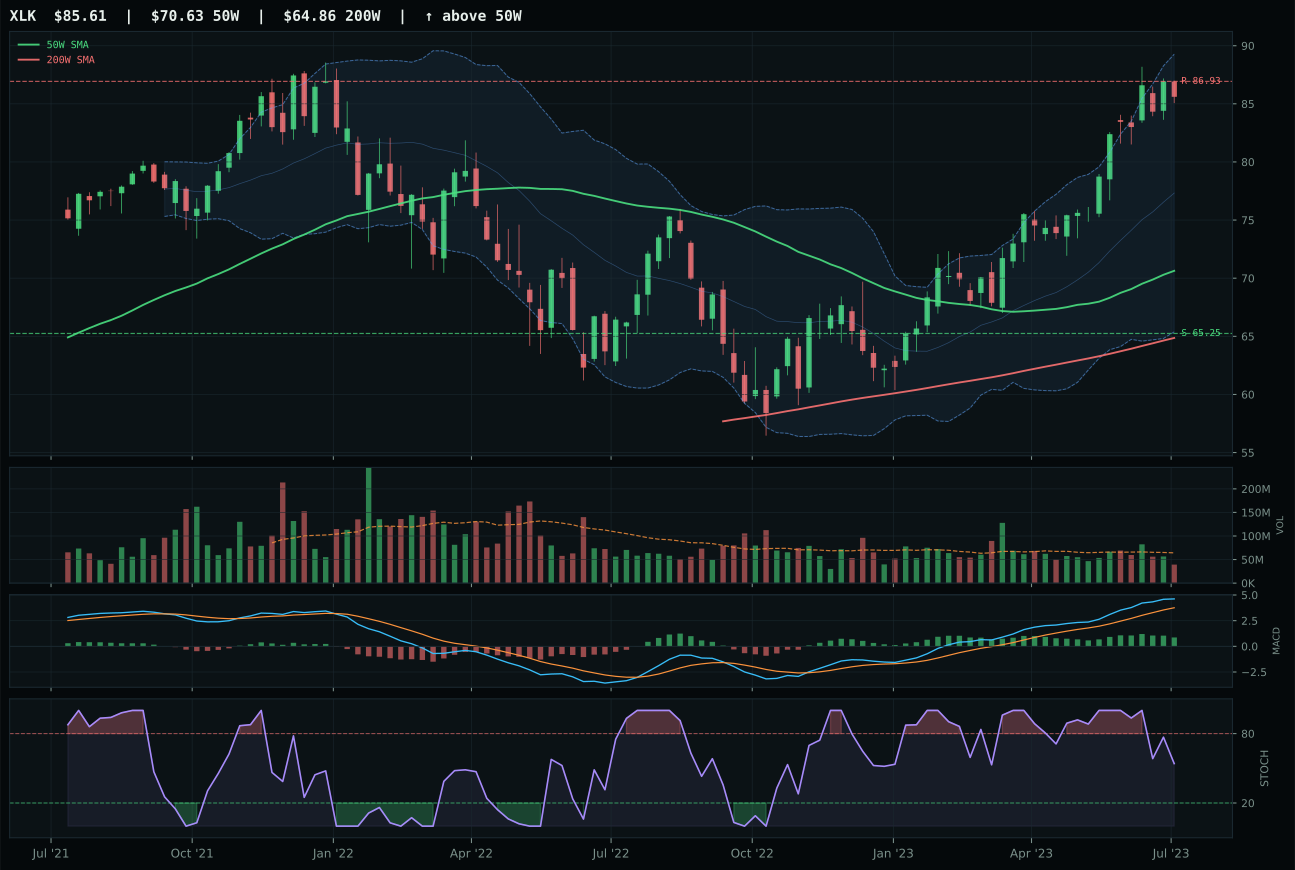
XLK has a vertical extension profile with 7.7% 13-week relative strength versus SPY.
A failed hold above support would weaken the setup.
Actionable but governed by invalidation levels.
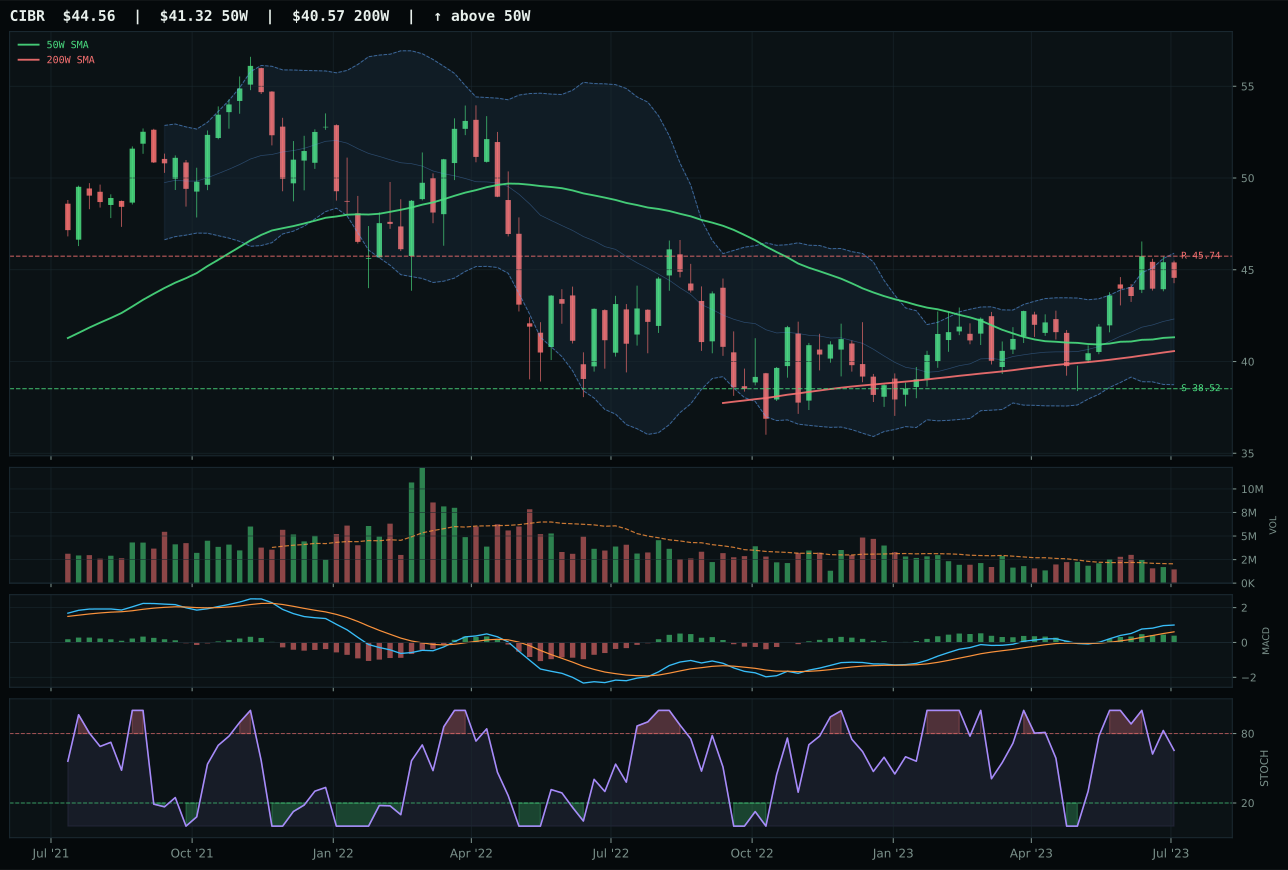
CIBR has a neutral structure profile with -1.1% 13-week relative strength versus SPY.
A failed hold above support would weaken the setup.
Actionable but governed by invalidation levels.
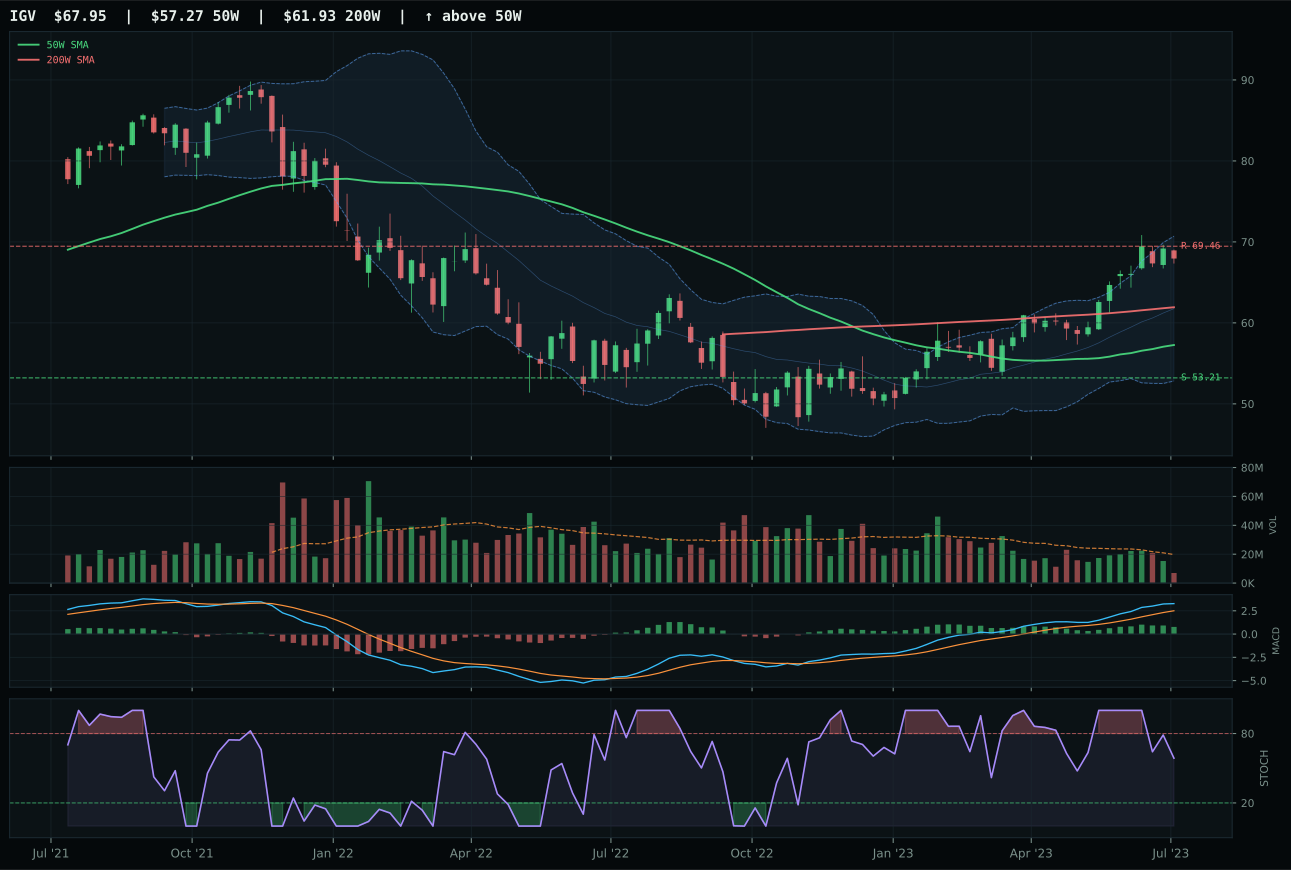
IGV has a vertical extension profile with 6.2% 13-week relative strength versus SPY.
A failed hold above support would weaken the setup.
Actionable but governed by invalidation levels.
XLK won the technology category by combining price strength with clean relative momentum, defeating CIBR's steadier but slower cybersecurity thesis. The chart sits 21.2% above the 50-week moving average with price above both the 50W and 200W, but that extension comes with a critical cost: MACD is bullish yet flattening while stochastic RSI rolls over from neutral, signaling that the fuel for continued upside has begun to cool. Volume of 0.61x the 20-week average confirms thin participation, meaning the move lacks the sponsorship needed to absorb new buyers at these levels. XLK's 7.7% relative strength versus SPY and 1.5% dominance within its peer basket justify the selection, but the category-relative strength advantage over CIBR (which posted negative 1.1% SPY-relative returns) represents a fine line—not a commanding technical edge.
Technology earned its top-2 allocation at 10% on the strength of a 61.5 composite score that ranked among the two highest categories this week. The disinflation macro regime actively supports this exposure through two mechanisms: technology benefits from lower discount rates and rising risk appetite, both active descriptors this week. However, the allocation masks a real tension. The category's two highest technical scores (XLK at 67 and CIBR at 70 on composite) reflect strength, yet macro fit for the category sits at only 48.0/100 due to liquidity stress and credit concerns offsetting the positive growth narratives. The decision to hold technology at 10% rests on the bet that AI growth sponsorship and risk-appetite tailwinds outweigh the structural headwinds; this works only if buyers continue to defend these extended charts into any pullback.
Industrial Metals — COPX
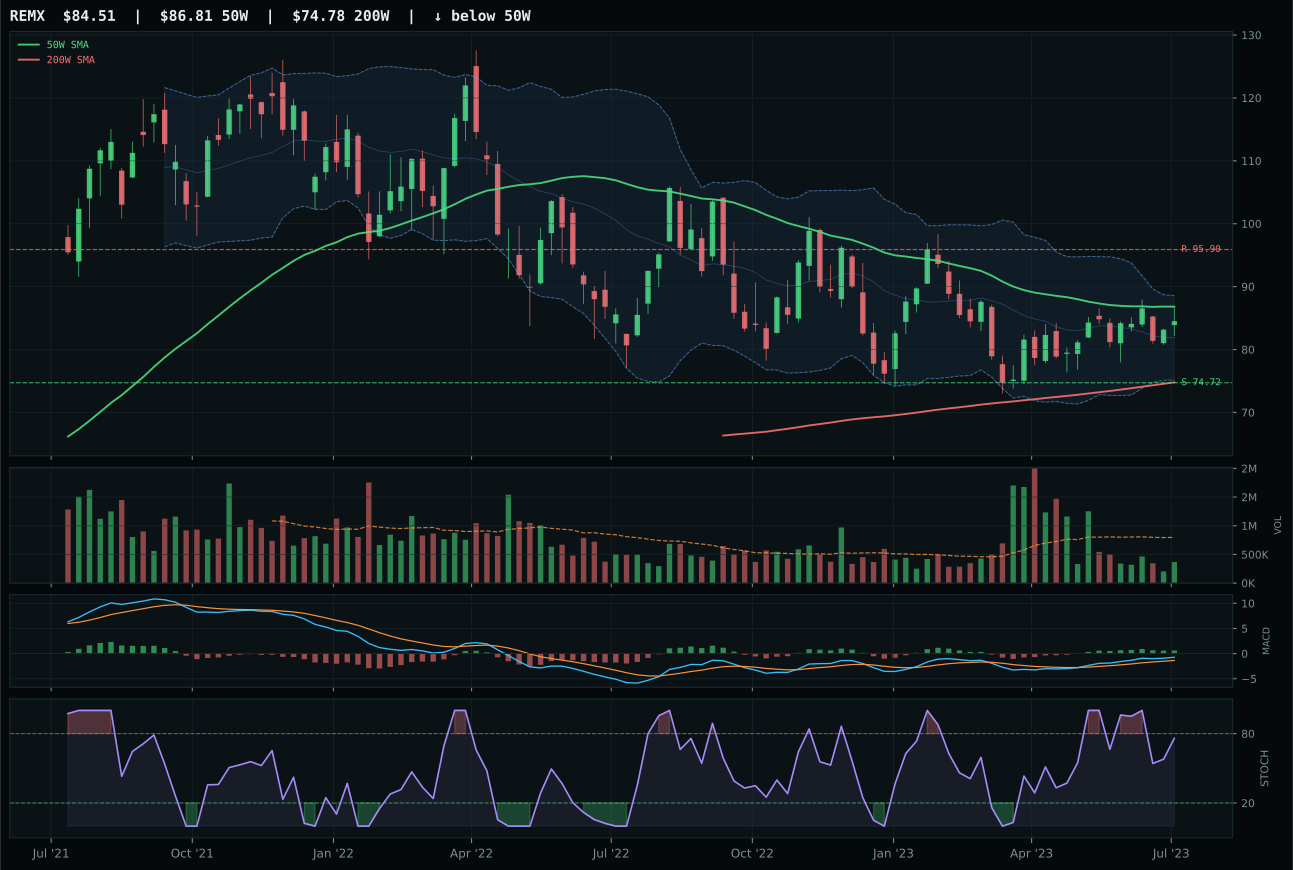
REMX has a compression near 50W profile with 0.3% 13-week relative strength versus SPY.
A failed hold above support would weaken the setup.
Actionable but governed by invalidation levels.
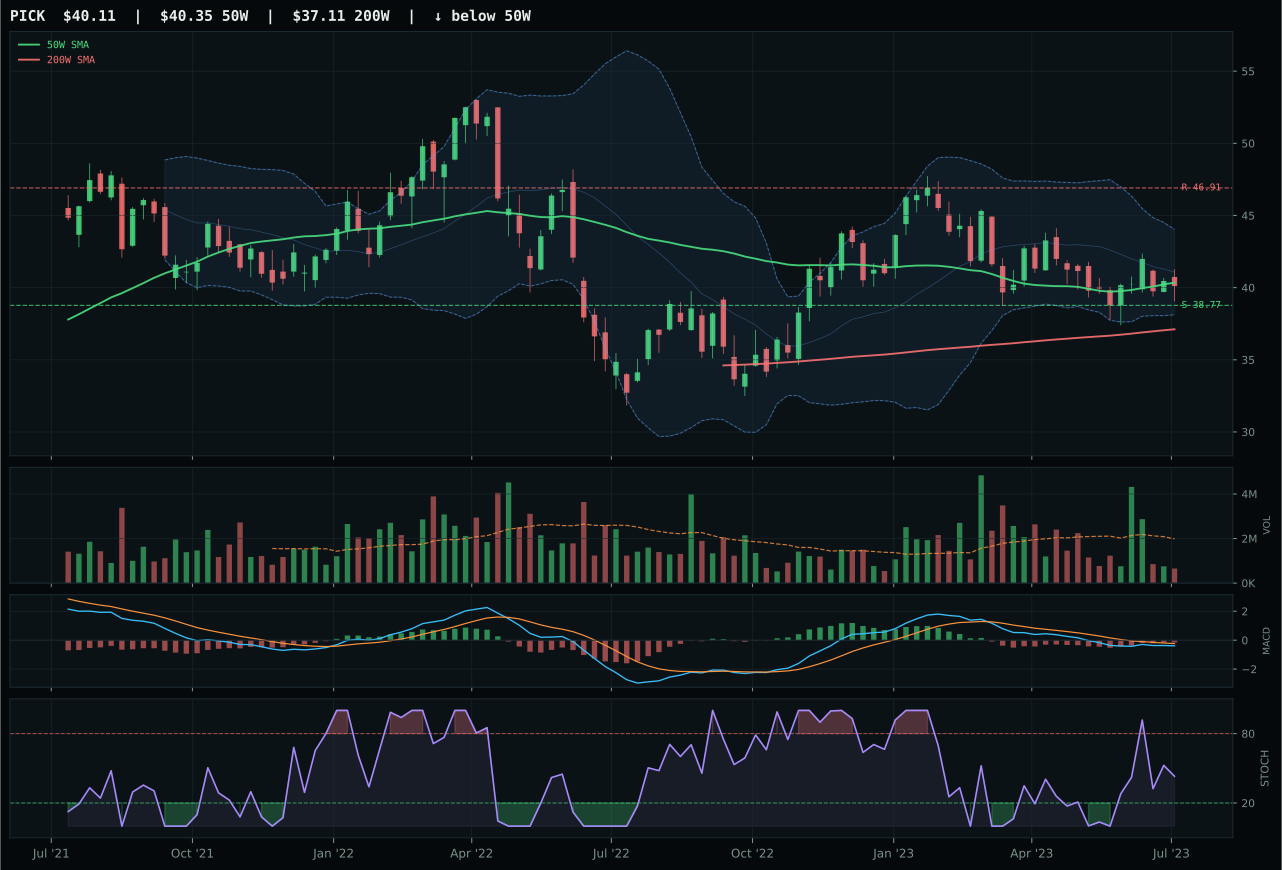
PICK has a pullback into support profile with -10.1% 13-week relative strength versus SPY.
A failed hold above support would weaken the setup.
Actionable but governed by invalidation levels.
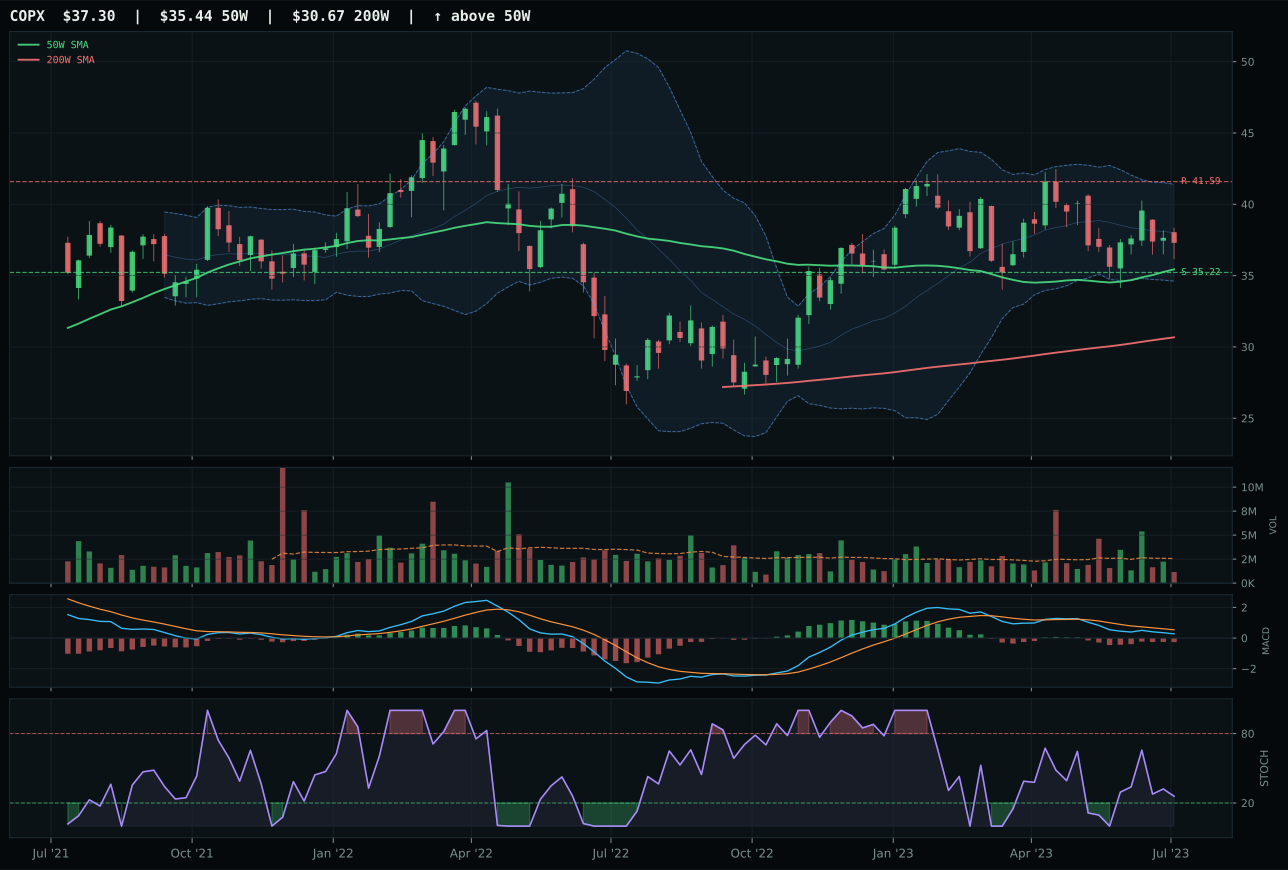
COPX has a neutral structure profile with -10.6% 13-week relative strength versus SPY.
A failed hold above support would weaken the setup.
Actionable but governed by invalidation levels.
COPX won the industrial metals category despite REMX's superior technical evidence, a decision that reveals how risk-reward architecture can override momentum. REMX's composite score of 77 crushes COPX's 66, with trend at 61 versus COPX's 78, momentum at 76 versus 24, and timing perfection at 100 versus COPX's 75. Yet REMX's risk-reward scores only 69.3 versus COPX's 76.4—that 7.1-point gap in downside protection to support offset REMX's momentum edge. COPX sits 5.3% from the 50W with defined risk at 5.9% to support and 10.3% to resistance. REMX's compression-near-50W setup projects greater upside but also greater width to resistance. In a choppy week, the allocator chose defined structure over extended momentum.
Industrial Metals earned a 5% tier-2 allocation on the basis of a 53.8 composite score, positioned above Precious Metals (38.2) but below the tier-1 candidates. Macro fit at 65.0/100 is the category's true engine: metals scarcity is active at positive 14.0, commodity breadth positive adds 10.0, and real asset sponsorship contributes 6.0. These three descriptors alone generate 30 points of macro fuel. Technical evidence, however, scores only 53.5/100 for COPX, meaning the category survives on macro narrative, not price structure. REMX's higher technical score (75.2) should theoretically warrant selection, yet COPX's better risk-reward prevailed in the representative decision. This 5% should be monitored closely: macro scarcity themes are working, but price action is not confirming accumulation. If commodity breadth or metals scarcity descriptors turn inactive, this allocation will suffer immediately.
Nuclear Energy — URA
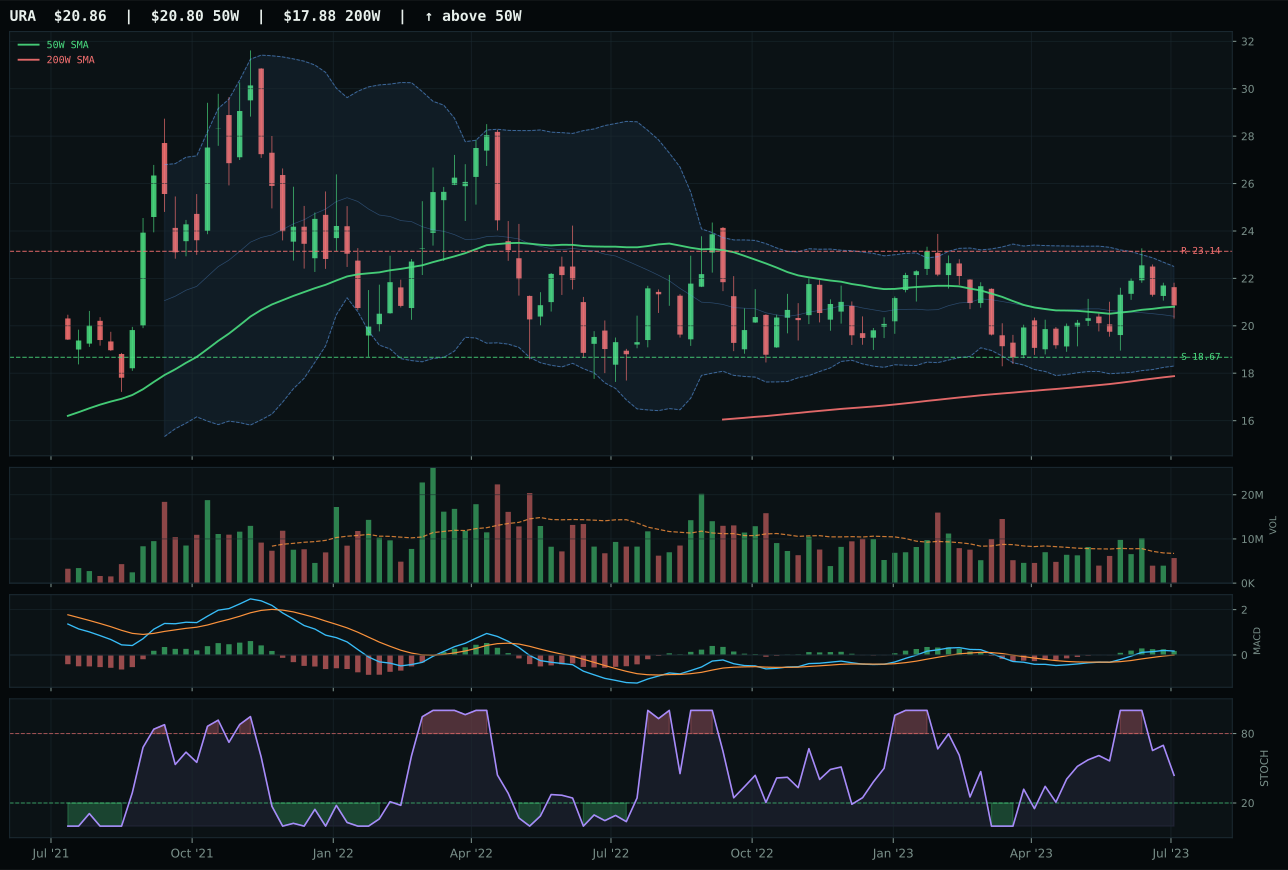
URA has a compression near 50W profile with 2.2% 13-week relative strength versus SPY.
A failed hold above support would weaken the setup.
Actionable but governed by invalidation levels.
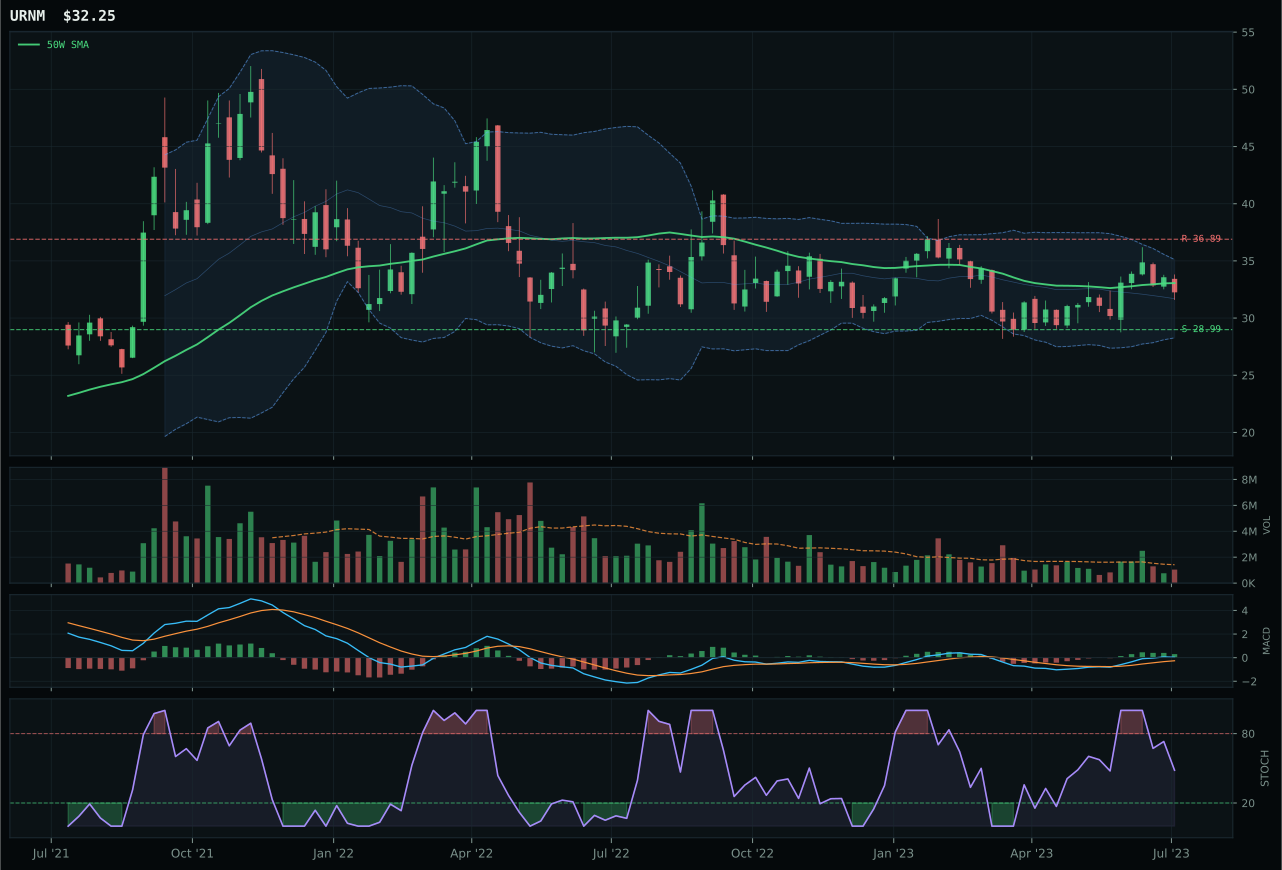
URNM has a compression near 50W profile with 1.9% 13-week relative strength versus SPY.
A failed hold above support would weaken the setup.
Actionable but governed by invalidation levels.
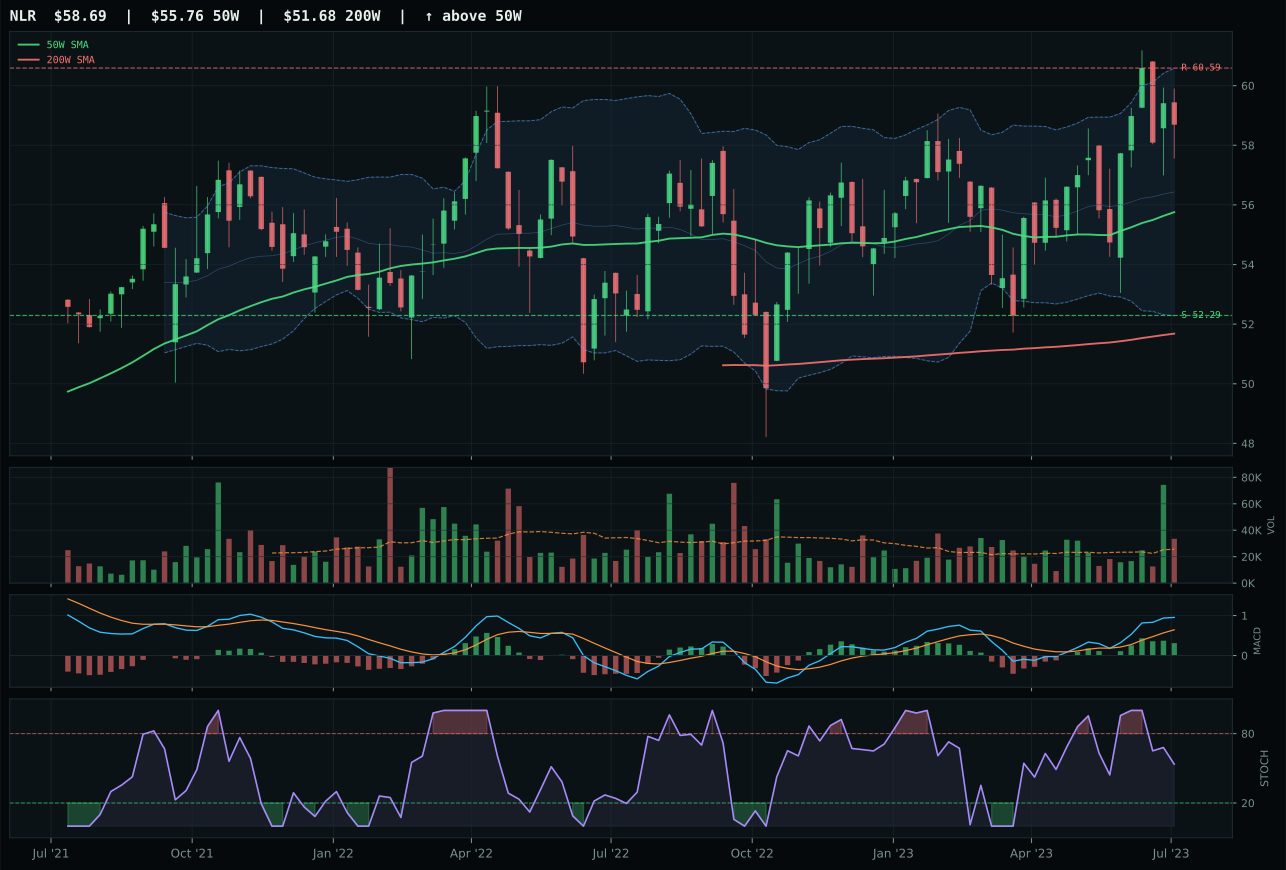
NLR has a neutral structure profile with 0.1% 13-week relative strength versus SPY.
A failed hold above support would weaken the setup.
Tracked, but not top-2 eligible because: .
URA won the nuclear category with a compression-near-50W setup that scores perfectly on timing (100.0/100) while maintaining balanced trend strength at 89.3/100. The chart sits just 0.3% from the 50W, the tightest alignment among peers, with MACD bullish but flattening and stochastic RSI neutral at 0.44—a definition of equilibrium. Distance to support is 11.7% and to resistance is 9.9%, providing balanced risk. Volume stands at neutral 0.84x, neither thin nor heavy participation. This setup has minimal entry risk and maximum definition for both an expansion move and a flush. URNM's technical superiority (59.1 versus URA's 74.0) is reversed by timing: URNM's compression sits deeper with support at 28.99 versus URA's 18.67, creating more execution friction. URA's 0.3% advantage in category-relative strength confirms its selection.
Nuclear Energy earned a 5% tier-2 allocation on a 49.9 composite score that sits above both Precious Metals (38.2) and Defense (46.5), ranking it 6th in the allocation hierarchy. Macro fit stands at 50.0/100, neutral, because the category lacks specific sponsor descriptors; no active macro checkbox applies directly to nuclear energy beyond generic real asset sponsorship at positive 7.0 and AI growth at positive 5.0. The allocation rests entirely on URA's superior technical setup and the view that compression-near-50W with perfect timing merit a 5% position. This is justified: URA offers balanced risk without macro tailwind, making it a technical position rather than a macro bet. However, 5% should be treated as conditional—it holds only if URA breaks above resistance at 23.14; any failure to expand would signal that the equilibrium setup failed to generate follow-through, warranting exit.
Defense & Aerospace — XAR
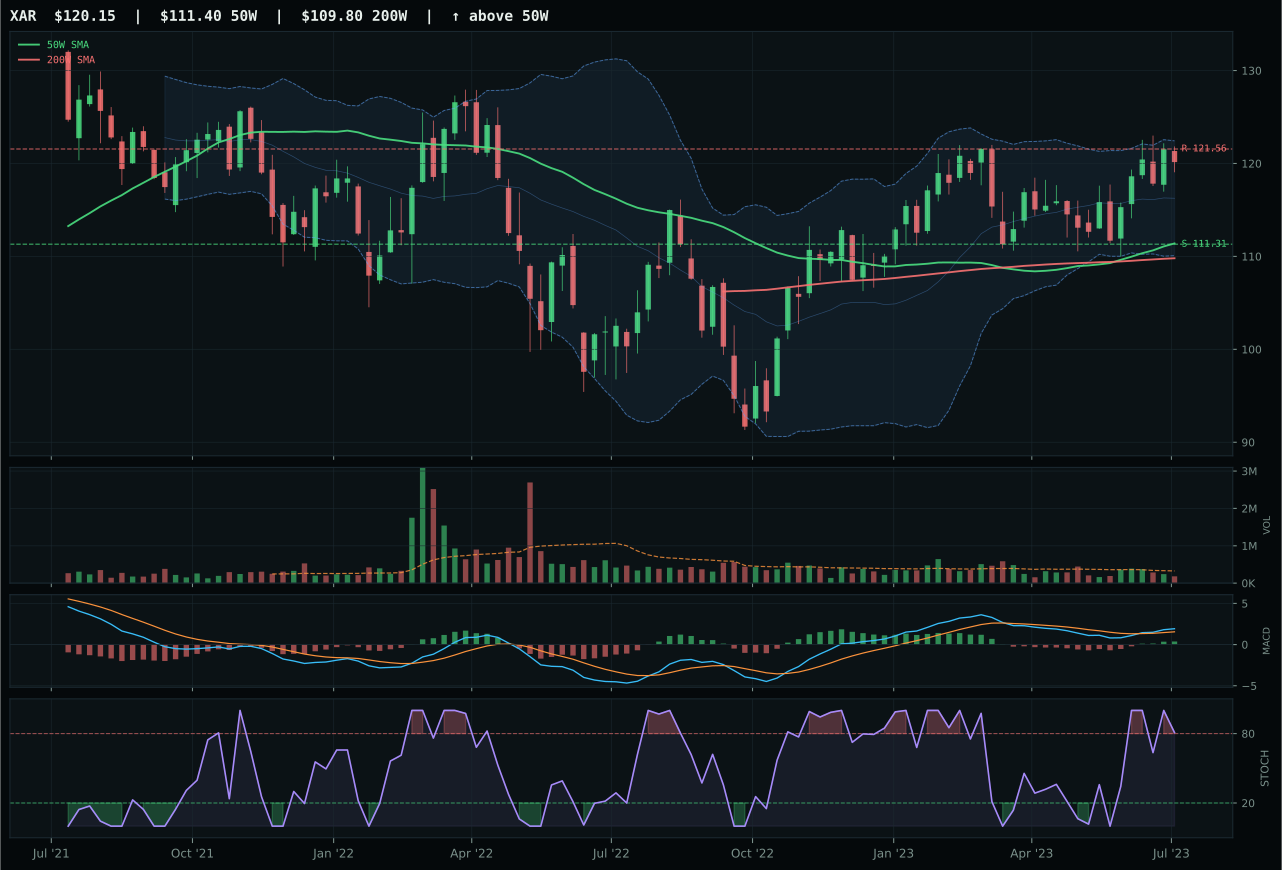
XAR has a neutral structure profile with -2.7% 13-week relative strength versus SPY.
A failed hold above support would weaken the setup.
Actionable but governed by invalidation levels.
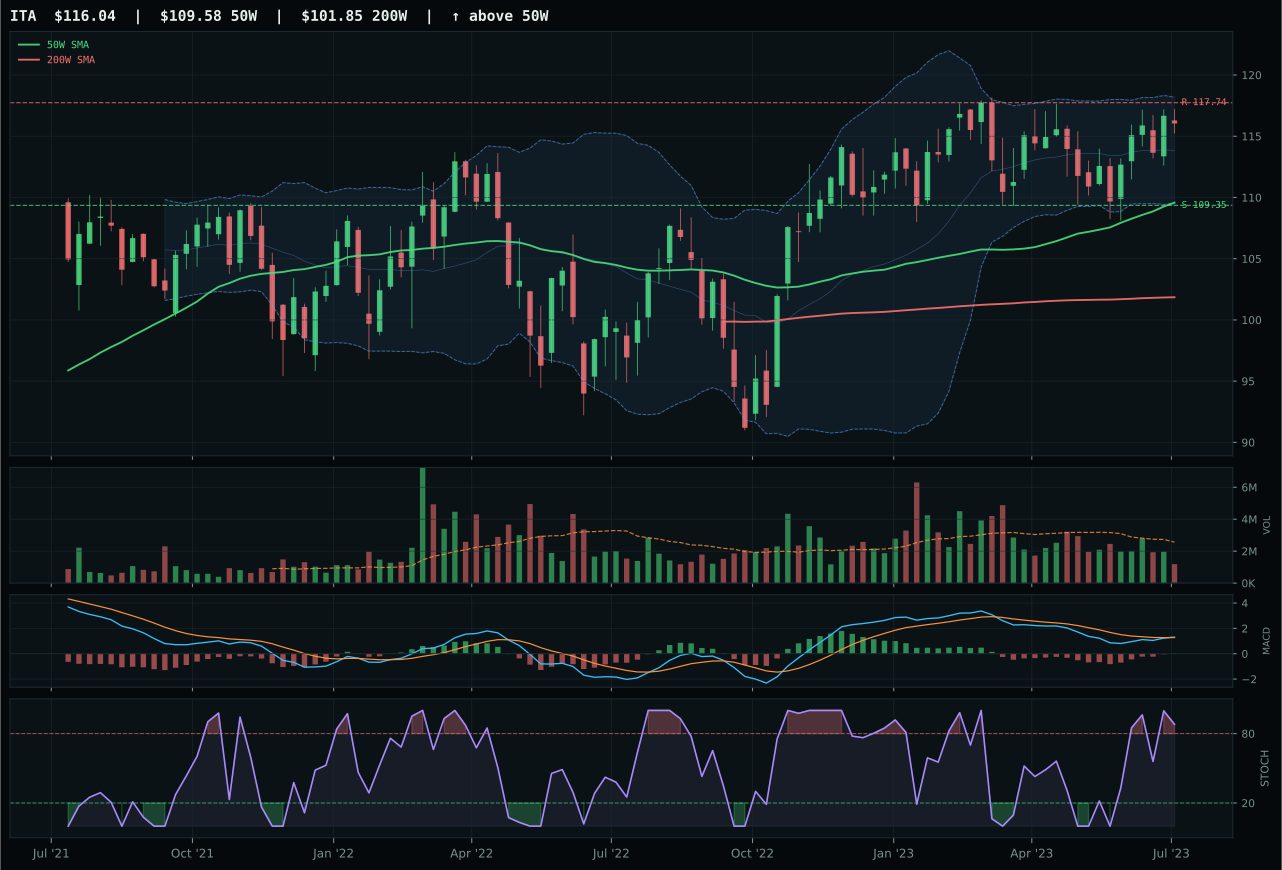
ITA has a neutral structure profile with -5.8% 13-week relative strength versus SPY.
A failed hold above support would weaken the setup.
Actionable but governed by invalidation levels.
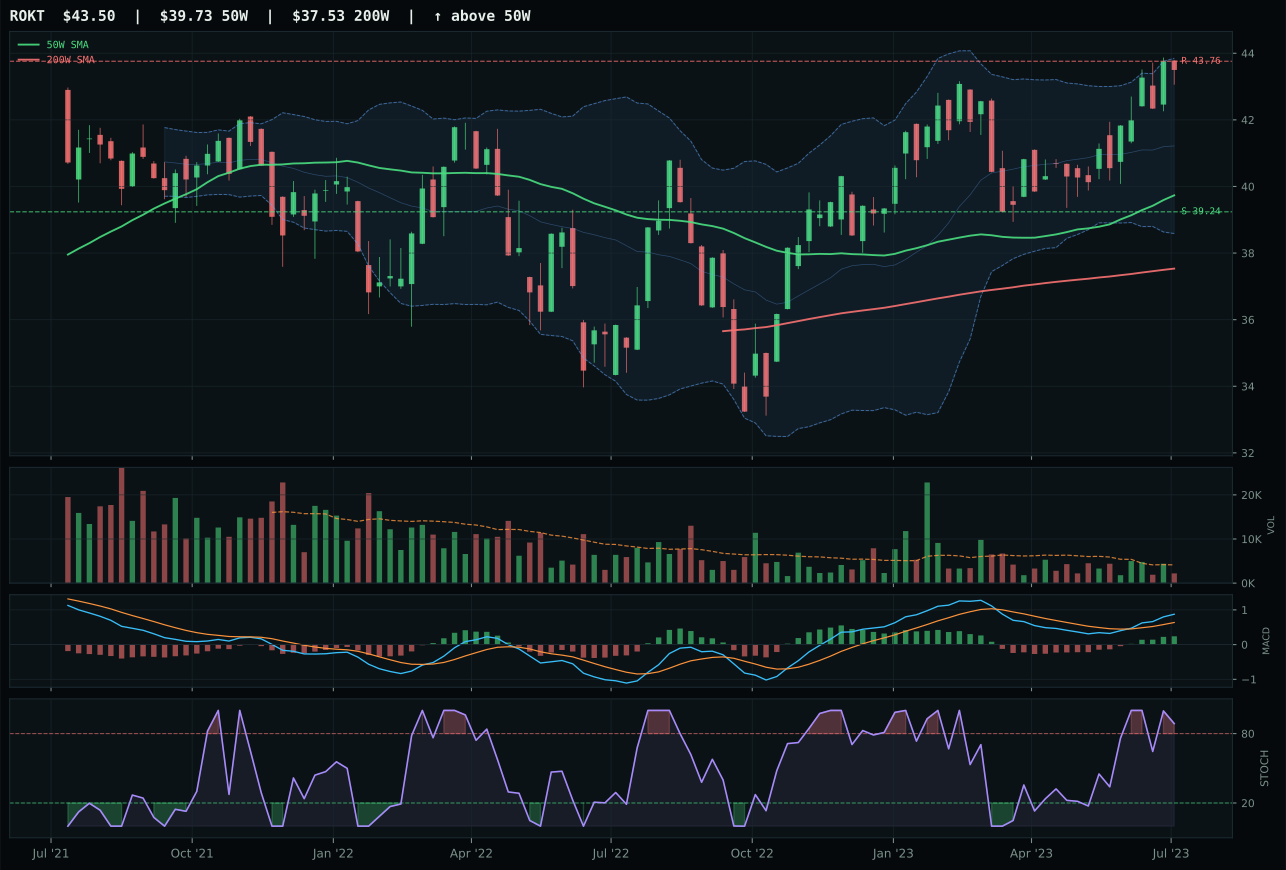
ROKT has a neutral structure profile with 2.0% 13-week relative strength versus SPY.
A failed hold above support would weaken the setup.
Tracked, but not top-2 eligible because: .
XAR won the defense category with a neutral structure setup that rewarded category-relative strength and trend stability over absolute momentum. Price sits just 7.9% above the 50W in what amounts to a near-term equilibrium, supported by a 95.9/100 trend score that comes not from extension but from consistency. MACD is bullish and improving while stochastic RSI has rolled over from overbought levels, signaling a healthy flush before the next leg. Volume at 0.56x the 20-week average remains thin, but the tight distance to support and resistance (111.31 to 121.56) means risk is defined. XAR's category-relative strength of 0.0% versus ITA's negative 3.0% proved decisive; the category is not exhibiting broad strength, so the winner is the one that does not lag its peers, not the one that leads them.
Defense & Aerospace received a 5% tier-2 allocation despite a final score of only 46.5, making it a position held on macro principle rather than technical momentum. The category ranked outside the top-2, but earned its 5% slot because the reasoner determined it eligible and ranked above Agriculture and Traditional Energy. Macro fit sits at 51.0/100, neutral due to mixed signals: credit stress is active at a positive 2.0, yet liquidity stress drags at negative 4.0. In a disinflation regime, defense typically trades on two stories—government spending and a hedge against systemic stress. Neither narrative is compelling this week. The 5% allocation should be treated as a placeholder position that awaits either technical momentum or a macro catalyst; without one or both, it remains a fill rather than a conviction.
Utilities & Infrastructure — PAVE
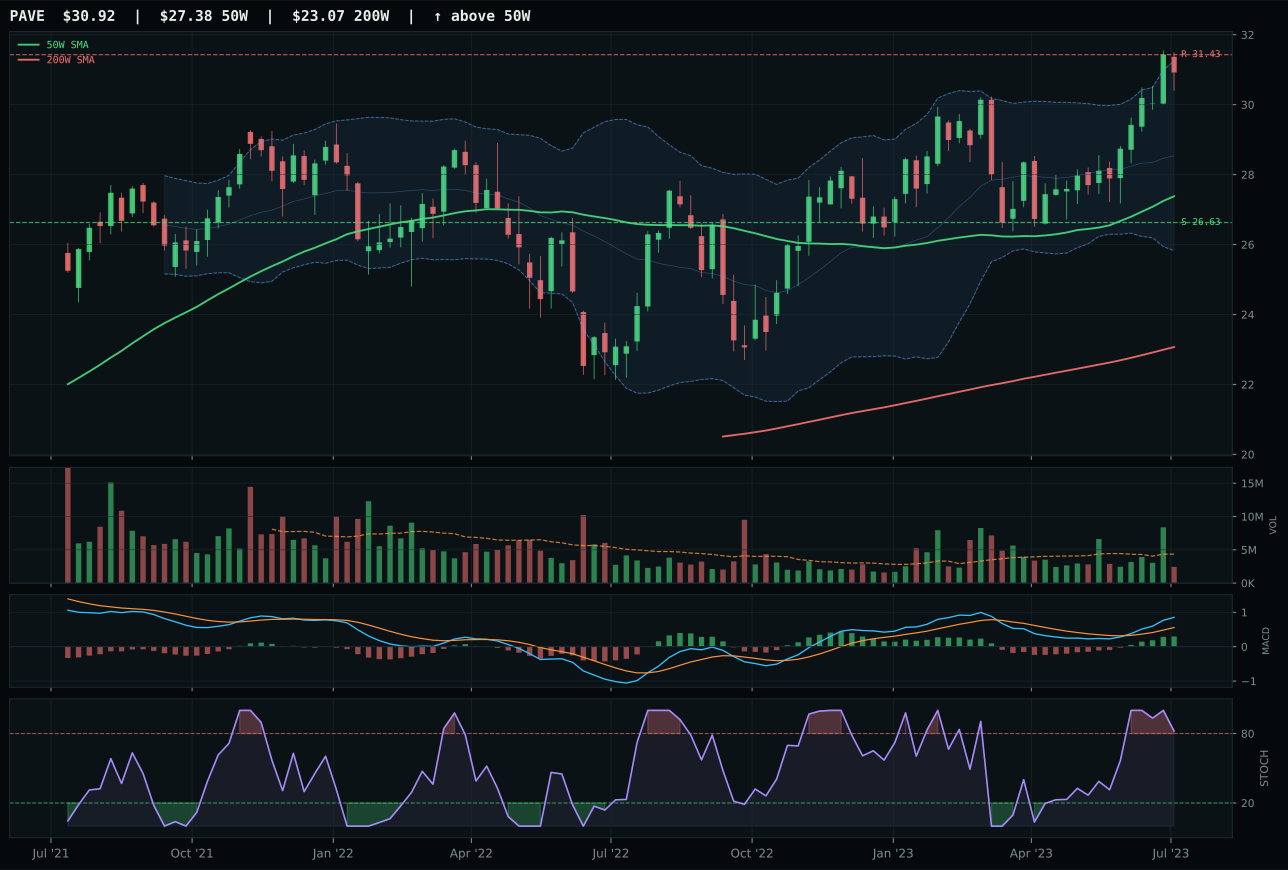
PAVE has a neutral structure profile with 8.5% 13-week relative strength versus SPY.
A failed hold above support would weaken the setup.
Actionable but governed by invalidation levels.
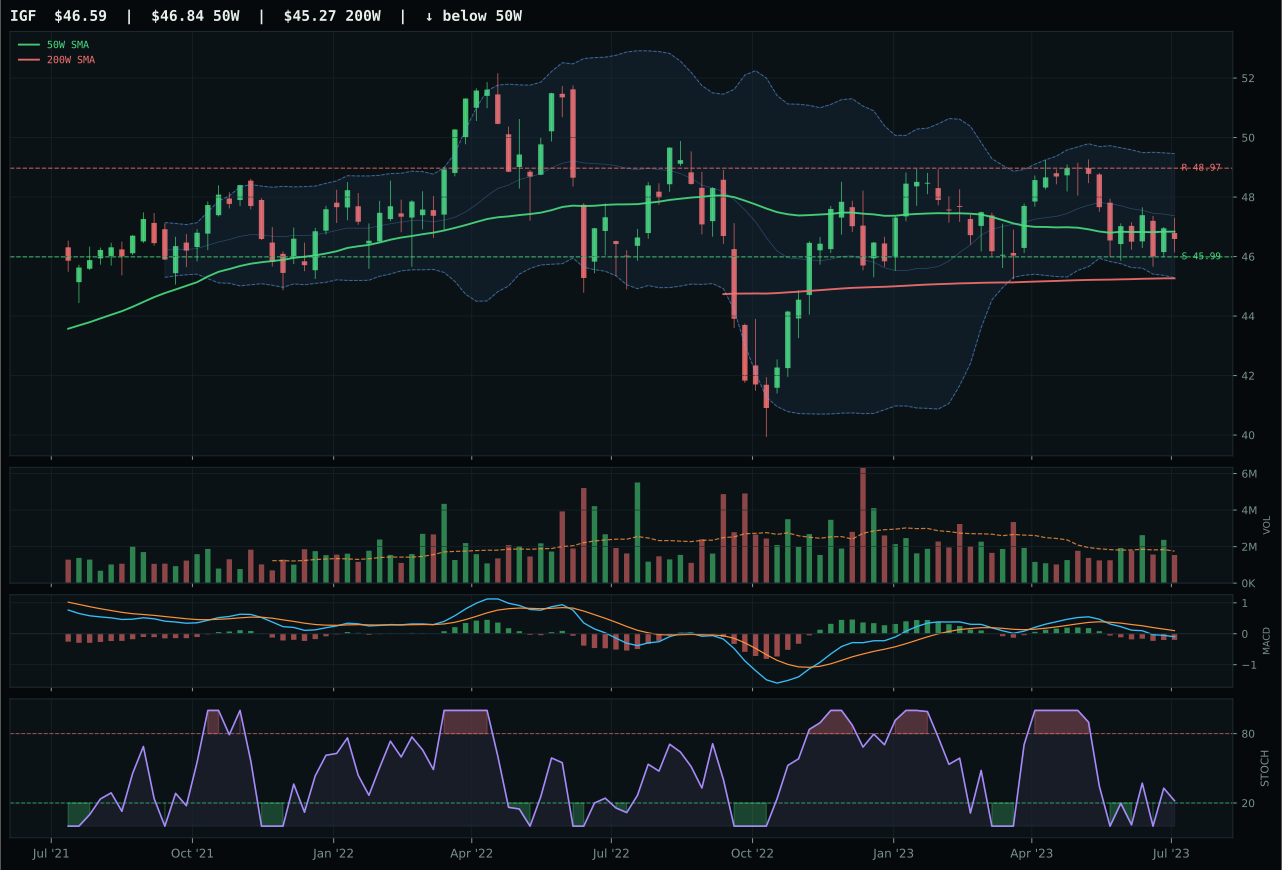
IGF has a pullback into support profile with -11.3% 13-week relative strength versus SPY.
A failed hold above support would weaken the setup.
Actionable but governed by invalidation levels.
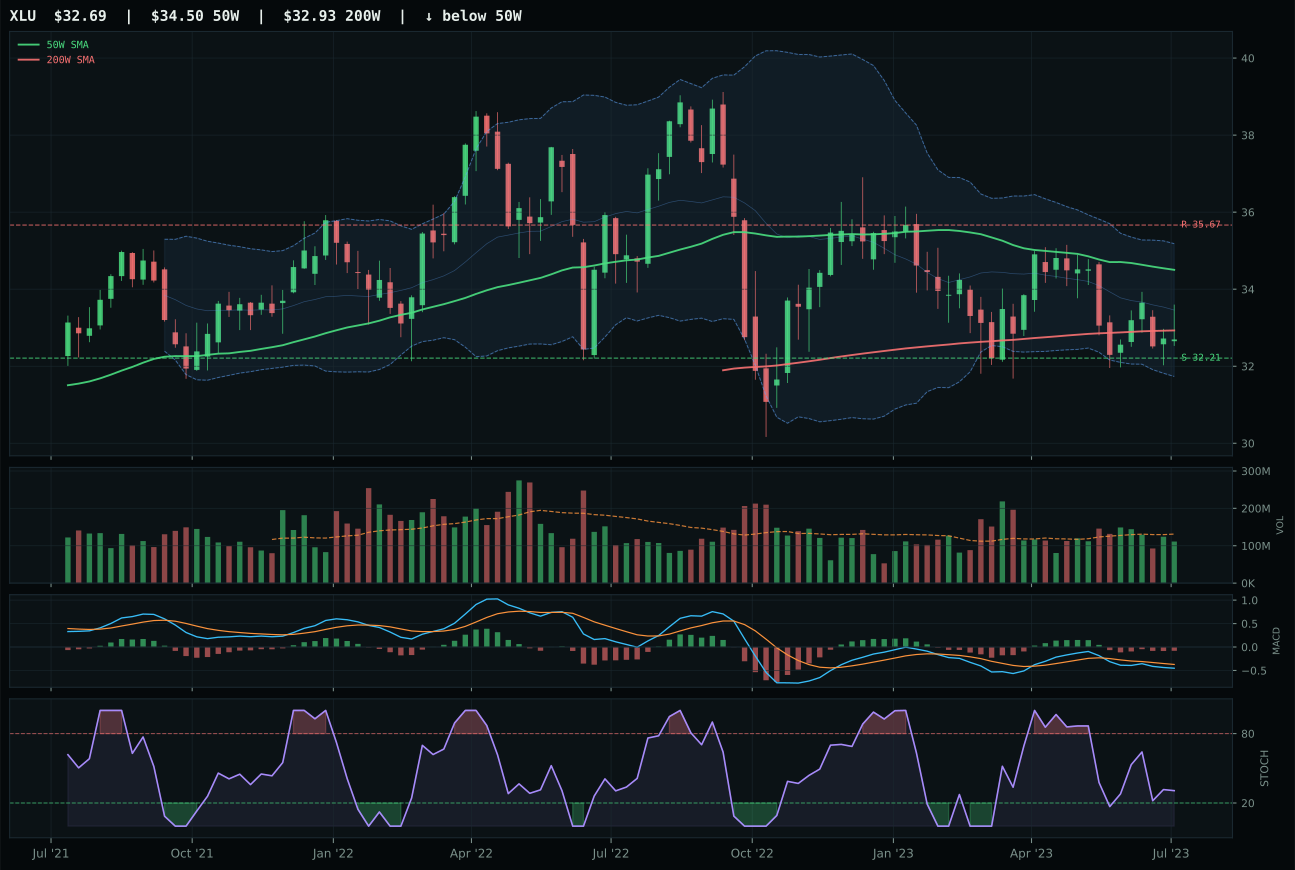
XLU has a pullback into support profile with -13.5% 13-week relative strength versus SPY.
A failed hold above support would weaken the setup.
Actionable but governed by invalidation levels.
PAVE won the utilities and infrastructure category with absolute dominance in momentum confirmation and category-relative strength, overwhelming a pair of bearish peer charts. PAVE's momentum confirmation reaches an exceptional 100.0/100, driven by 5.1% four-week returns, 15.7% 13-week returns, and remarkable 19.8% category-relative strength—the highest category-relative advantage in the entire portfolio. Trend scores 100.0/100, matching the strongest technical expressions in other categories. Volume sits thin at 0.56x the 20-week average, yet persistence at 86.2/100 shows the move is holding despite light participation. Price extends 12.9% above the 50W near the 52-week high, creating entry risk scored at 49.0/100 timing, but the gap versus IGF (29.7 points) is decisive. PAVE's category dominance is clean.
Utilities & Infrastructure earned a 5% tier-2 allocation on a 43.0 composite score that ranks 8th, securing it a position by eligibility and relative merit despite modest technical evidence. Macro fit at 62.0/100 provides genuine support: disinflation actively helps at positive 7.0, disinflation pressure contributes positive 6.0, and positive transitions support infrastructure capex narratives. These 13 points of macro tailwind make this category defensible in a disinflationary environment. However, PAVE's price extension at 12.9% above the 50W and risk-reward of only 38.8/100 (upside to resistance at just negative 1.6%) leave minimal room for execution. This 5% is allocated based on macro permission for infrastructure spending in a low-rate environment, not because of technical attractiveness. New money should wait for pullbacks; existing holders should respect the near-term resistance at 31.43 as a logical exit level if macro conditions deteriorate.
Emerging Markets — ILF
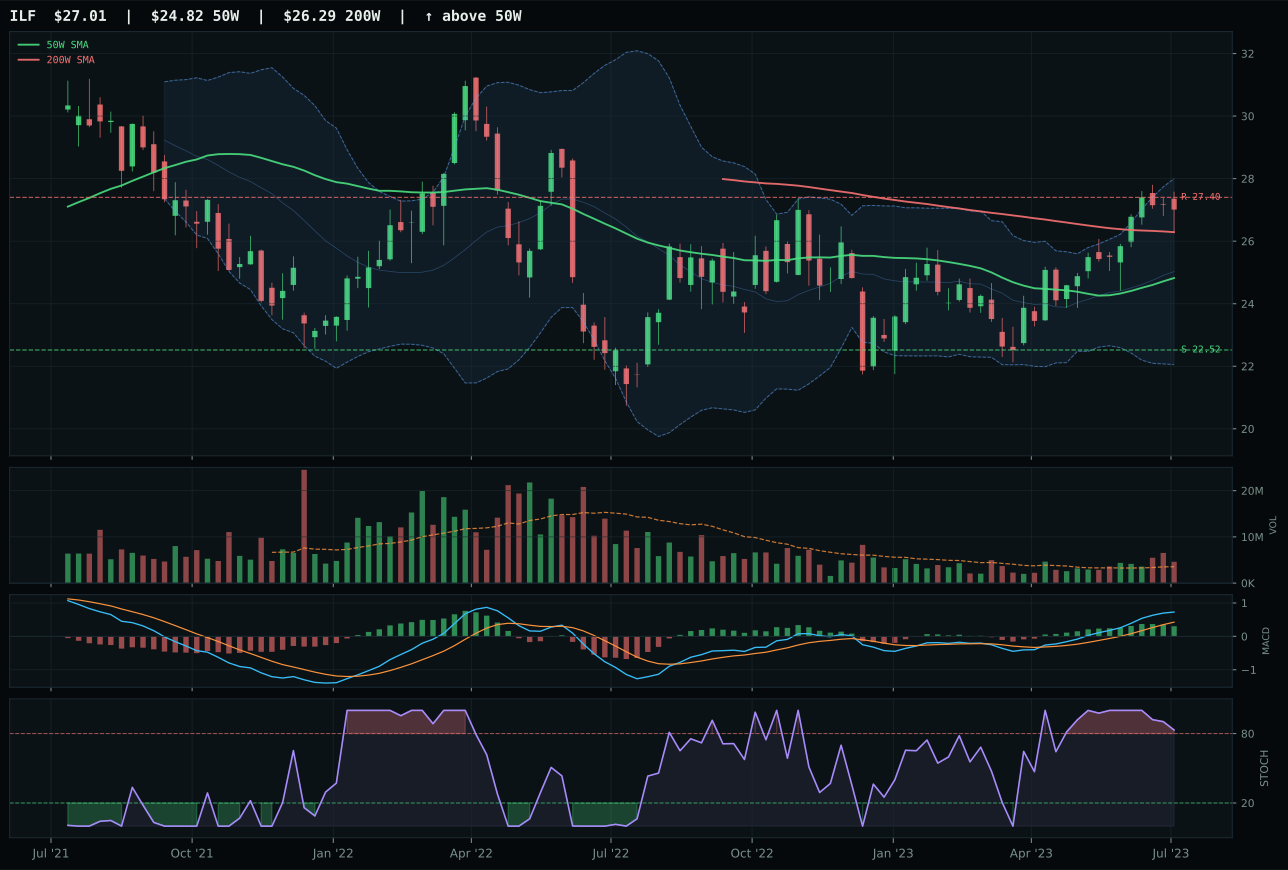
ILF has a neutral structure profile with 8.0% 13-week relative strength versus SPY.
A failed hold above support would weaken the setup.
Actionable but governed by invalidation levels.
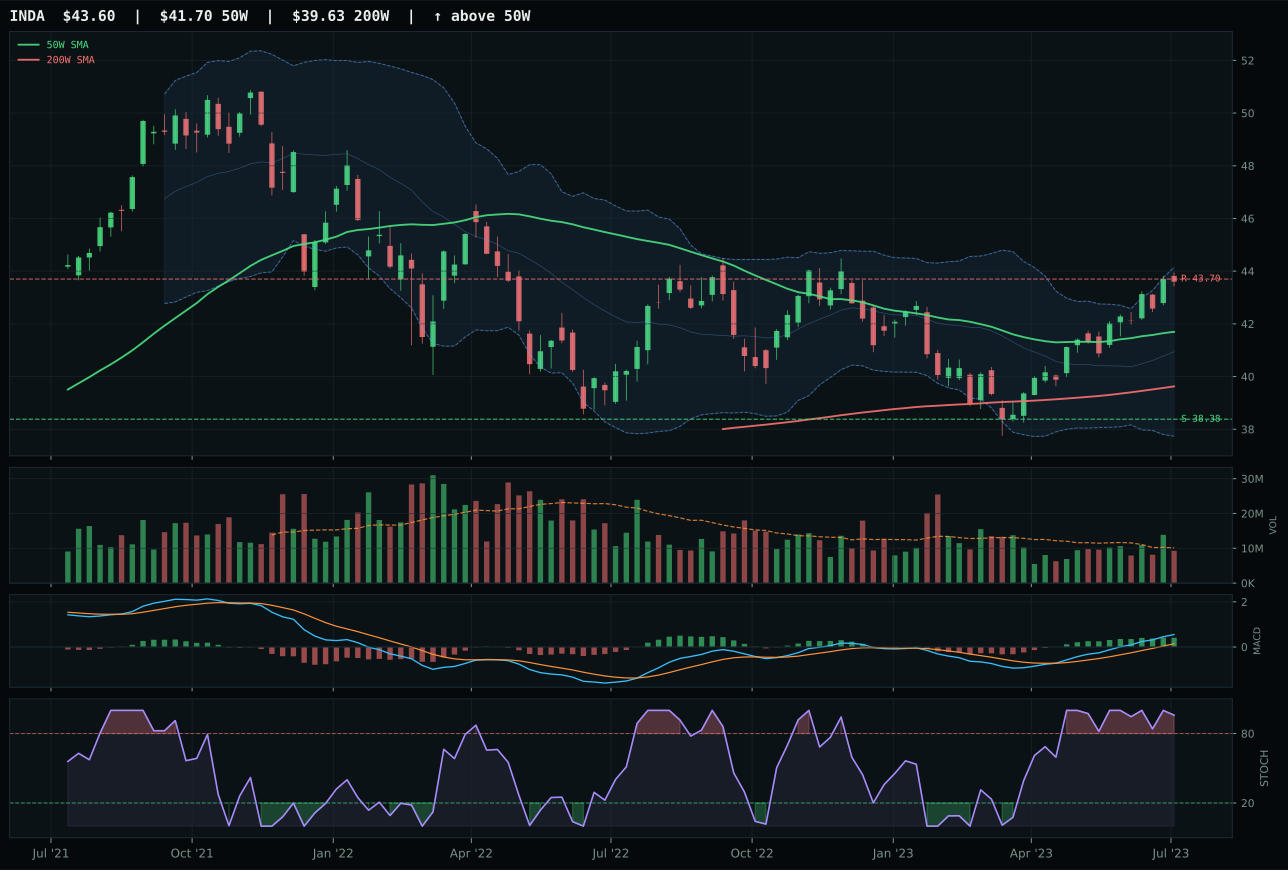
INDA has a neutral structure profile with 2.0% 13-week relative strength versus SPY.
A failed hold above support would weaken the setup.
Actionable but governed by invalidation levels.
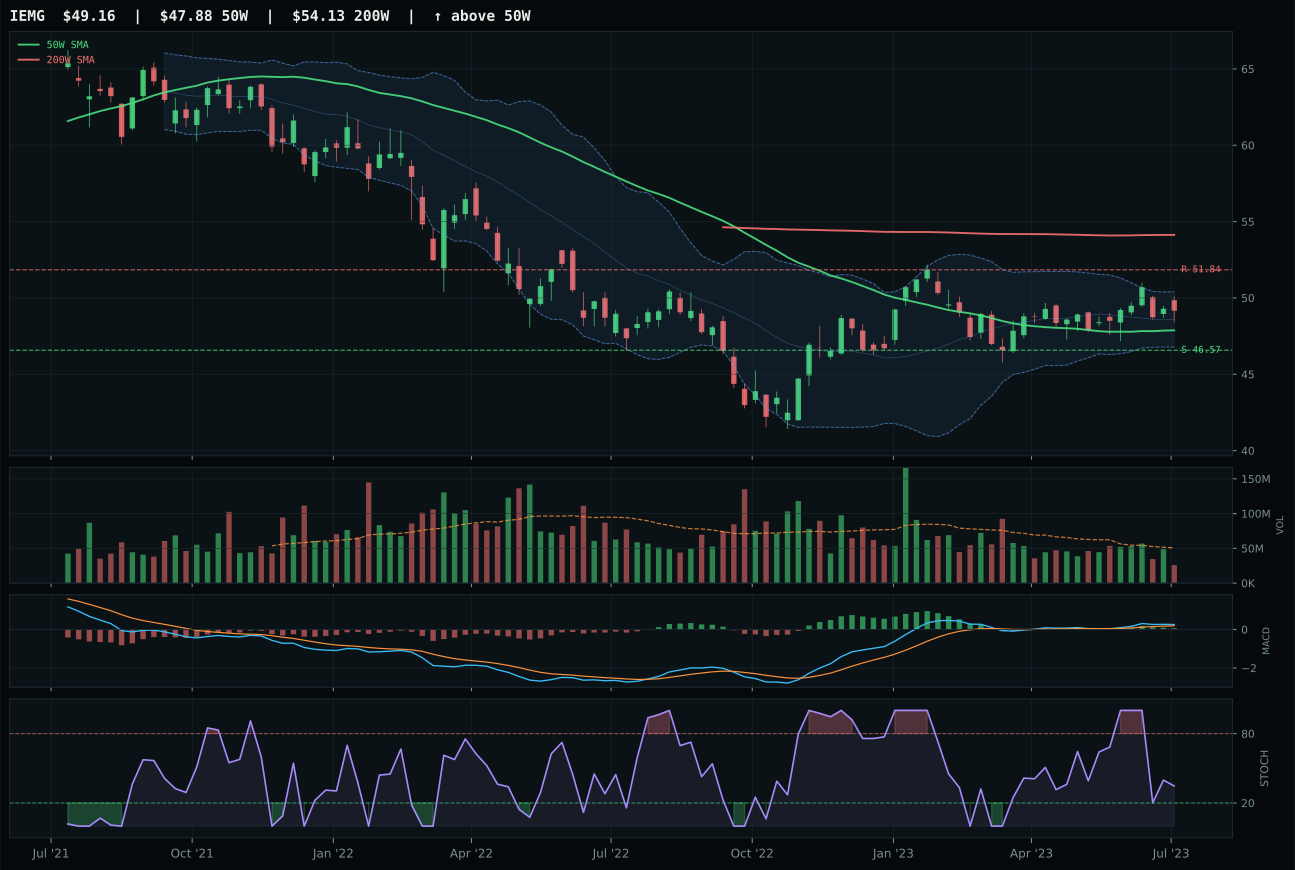
IEMG has a compression near 50W profile with -6.4% 13-week relative strength versus SPY.
A failed hold above support would weaken the setup.
Actionable but governed by invalidation levels.
ILF won the emerging markets category by combining superior momentum sponsorship with stronger category-relative strength, defeating INDA despite INDA's higher composite score. INDA scores 77 versus ILF's 76, yet ILF's category-relative strength reaches 6.0% while INDA's is flat at 0.0%, and volume confirmation for ILF reaches 71.8/100 versus INDA's lower participation at neutral volume. ILF's 13-week return of 15.2% matches superior momentum confirmation at 90.9/100, driven by above-average participation at 1.30x the 20-week average. INDA's MACD is bullish and improving while ILF's is bullish but flattening, yet ILF's volume participation compensates. At 8.8% from the 50W, ILF is extended, but persistence at 77.9/100 shows the move is holding. The 1.2-point gap is tight, but volume persistence proved decisive.
Emerging Markets earned a 5% tier-2 allocation on a 41.7 composite score that ranks 7th among the 10 categories, holding its position on the strength of ILF's momentum rather than macro wind. Category-level macro fit sits at only 38.0/100, reflecting the damage from active liquidity stress and credit stress, both at negative 10.0, offsetting positive risk appetite at 8.0. The macro regime of disinflation does not inherently favor emerging markets; the tailwind comes from risk appetite acceleration and commodity breadth, not from the base regime itself. This 5% is a tactical momentum position, not a strategic macro allocation. ILF's 15.2% 13-week return and 8.0% SPY-relative strength are real, but they exist in a macro environment where emerging markets face structural headwinds. Hold this position only if risk appetite remains active; any deterioration in credit stress or liquidity conditions would warrant quick reduction.
Precious Metals — GLD
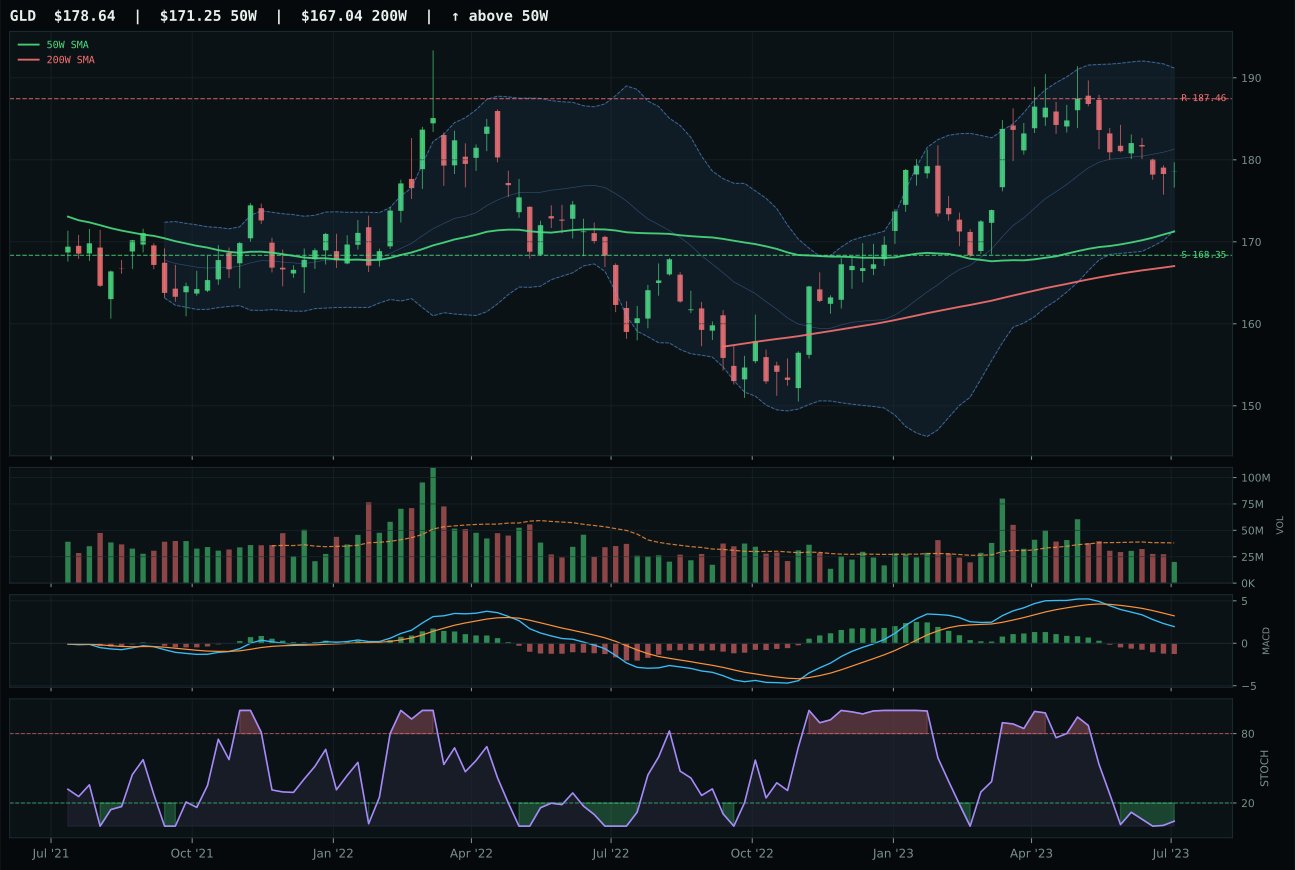
GLD has a neutral structure profile with -11.4% 13-week relative strength versus SPY.
A failed hold above support would weaken the setup.
Actionable but governed by invalidation levels.
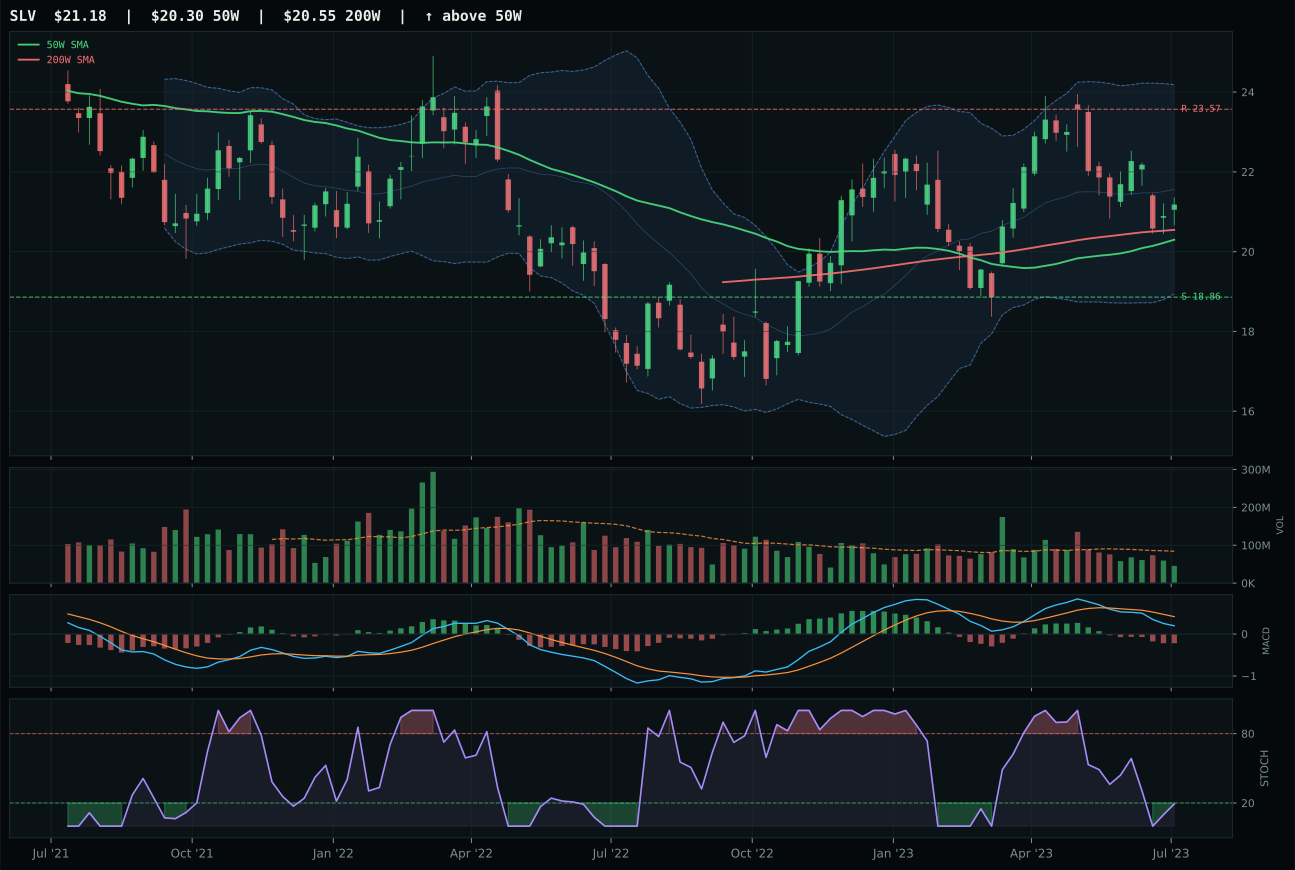
SLV has a neutral structure profile with -14.6% 13-week relative strength versus SPY.
A failed hold above support would weaken the setup.
Actionable but governed by invalidation levels.
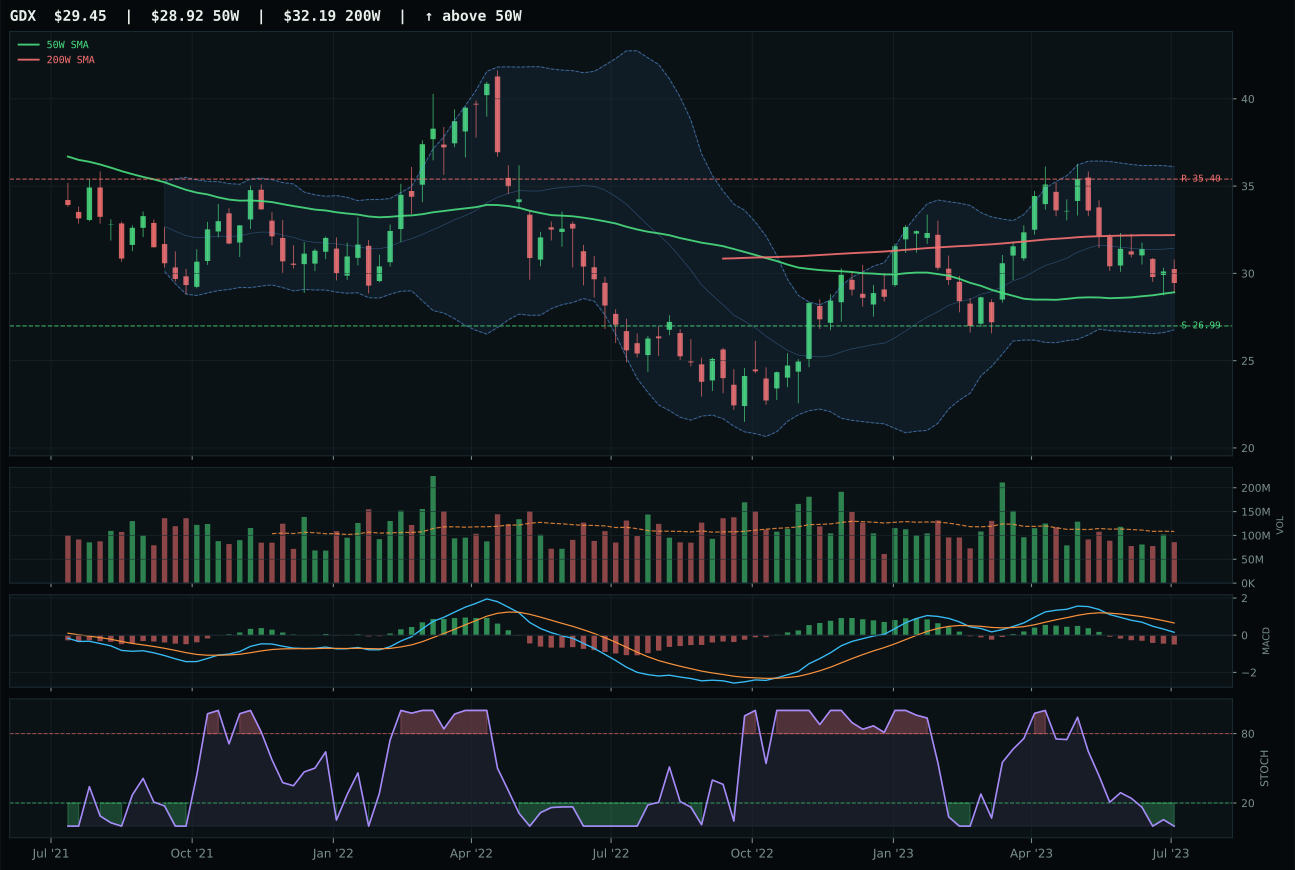
GDX has a compression near 50W profile with -21.6% 13-week relative strength versus SPY.
A failed hold above support would weaken the setup.
Actionable but governed by invalidation levels.
GLD won the precious metals category by having the cleanest relative structure and the least-damaged chart among a technically challenged peer set. Price sits just 4.3% above the 50W with structure scoring 71.6/100 versus SLV's 68.9, a narrow win driven by slightly better compression and cleanliness. The real story is negative: 13-week returns sit at negative 4.2%, category-relative strength at 3.3% is the only thing keeping GLD ahead of its peers, and MACD has turned bearish/weakening while stochastic RSI sits deep oversold at 0.04. Volume of 0.53x the 20-week average confirms thin participation. The timing score of 85.0/100 is a product of oversold conditions and proximity to the 50W, which creates a rebound bias, not momentum bias. GLD won by default in a weak field.
Precious Metals earned a 5% tier-2 allocation on the back of a 38.2 composite score that benefits primarily from macro positioning rather than technical merit. Category-level macro fit scores 60.0/100, the highest support in the week, driven by disinflation pressure at positive 8.0 offsetting risk-appetite drag. The 35.3/100 technical evidence for GLD reflects deep weakness: momentum confirmation scores just 9.4/100, volume-price confirmation is only 33.2/100, and persistence stands at 38.4/100. This allocation is a disinflation hedge, not a trend position. Metals are priced for recession-like dynamics even though the macro regime is disinflationary stability, creating a structural disconnect. Hold the 5% only if disinflation remains the operative regime; any shift toward risk-on repricing would immediately expose this position as defensive overshooting.
Agriculture & Livestock — MOO
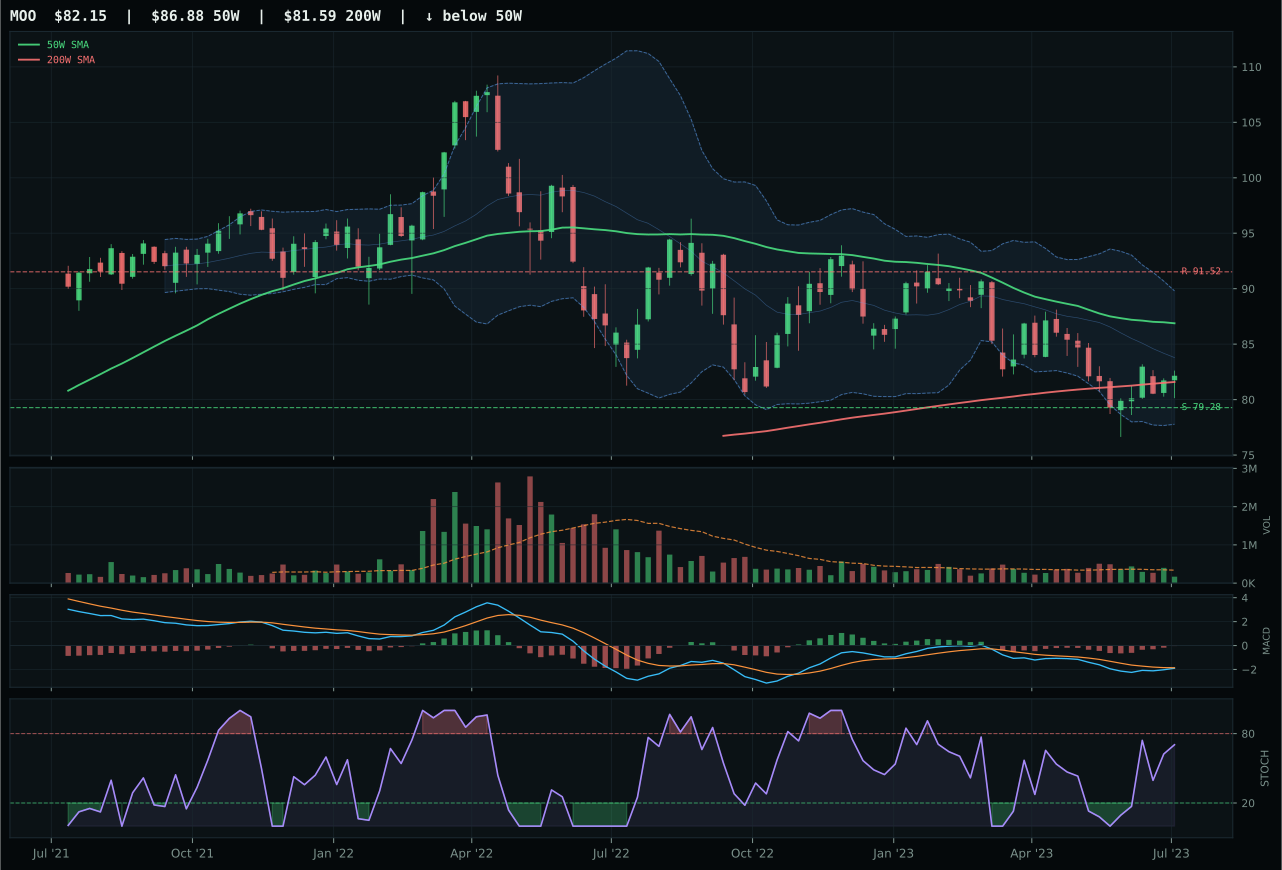
MOO has a pullback into support profile with -9.4% 13-week relative strength versus SPY.
A failed hold above support would weaken the setup.
Actionable but governed by invalidation levels.
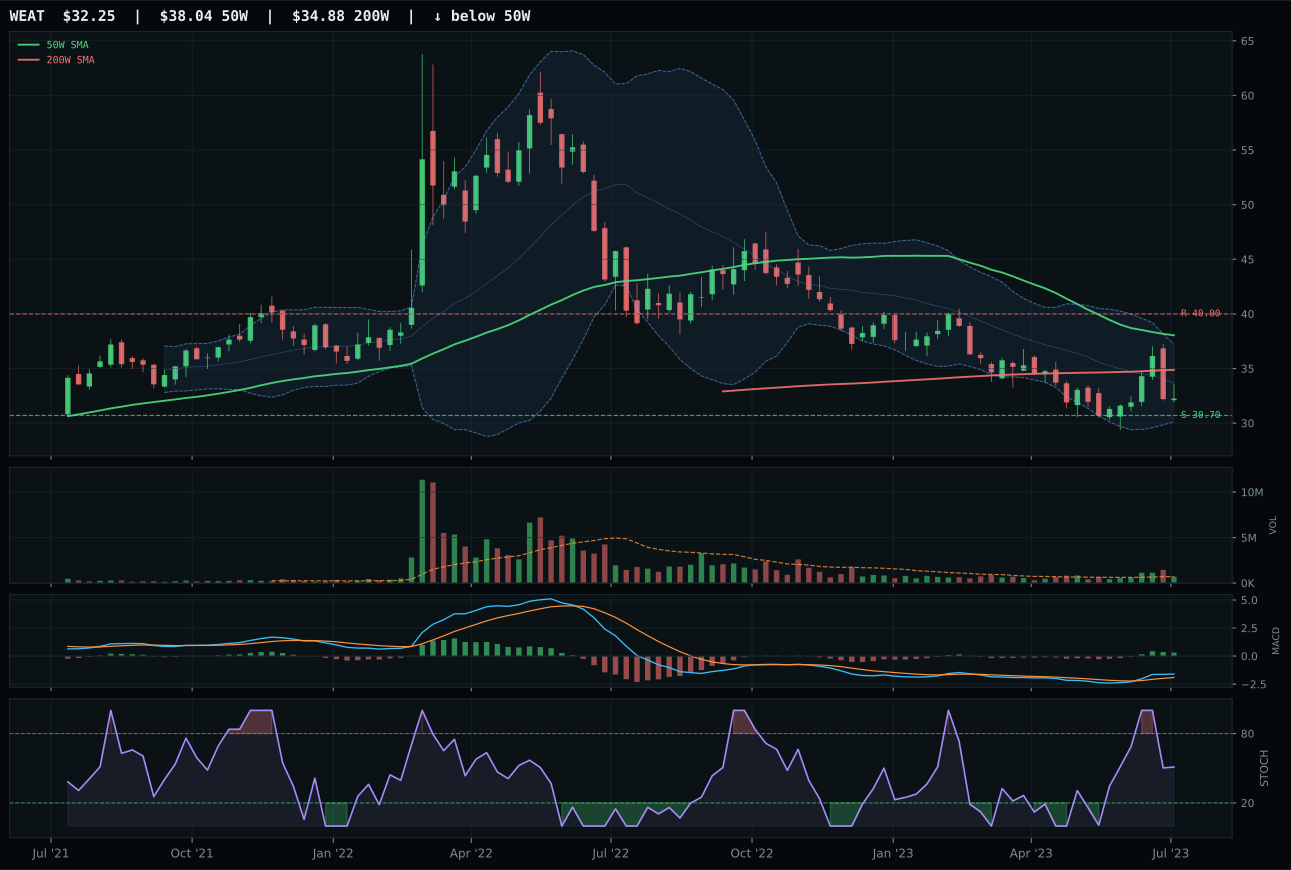
WEAT has a neutral structure profile with -13.8% 13-week relative strength versus SPY.
A failed hold above support would weaken the setup.
Actionable but governed by invalidation levels.
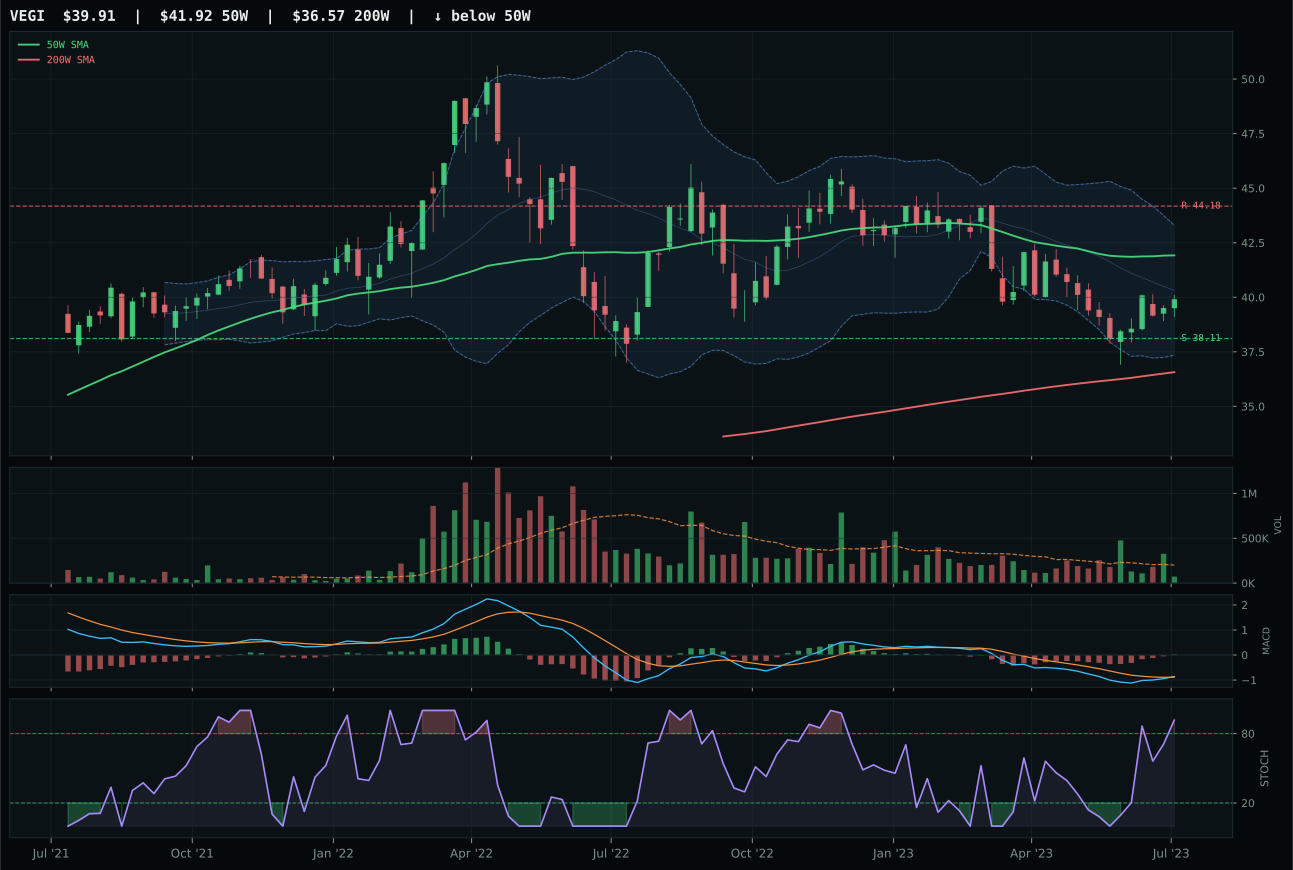
VEGI has a pullback into support profile with -7.7% 13-week relative strength versus SPY.
A failed hold above support would weaken the setup.
Tracked, but not top-2 eligible because: .
MOO won the agriculture category with the strongest risk-reward structure on offer, but that victory masks a category in structural decay. Price sits 5.4% below the 50W while remaining above the 200W, a pullback that generates a pristine 92.0/100 timing score and an exceptional 98.0/100 risk-reward (upside to resistance at negative 10.2%, downside to support at just 3.6%). The chart is approaching support at 79.28 with Fibonacci placement in the deep retracement zone, creating a defined risk entry. However, the trend score of 43.9/100 tells the real story: momentum has broken, 13-week returns stand at negative 2.2%, and category-relative strength is flat at 0.0%. MACD is bearish but improving, and stochastic RSI is neutral—the setup is a bounce setup, not an accumulation setup.
Agriculture & Livestock received 0% allocation and ranks outside the portfolio entirely at 9th or 10th, a correct decision driven by a 23.8 composite score that collapsed after the category reasoner stress-tested the basket. The 3/2/1 weighted ETF basket scored 46.2, but the final 23.8 reflects catastrophic deterioration when mapped against persistence and volume-price sponsorship metrics. Macro fit at 45.0/100 shows why: disinflation pressure hits commodities hard at negative 8.0, while real asset sponsorship and positive commodity breadth cannot overcome the secular headwind. MOO's exceptional risk-reward setup (98.0/100) should not be confused with macro permission. Commodity-driven agriculture faces structural pressure in a disinflation regime, and even perfect pullback setups cannot overcome that truth. Exclusion is correct.
Traditional Energy — XOP
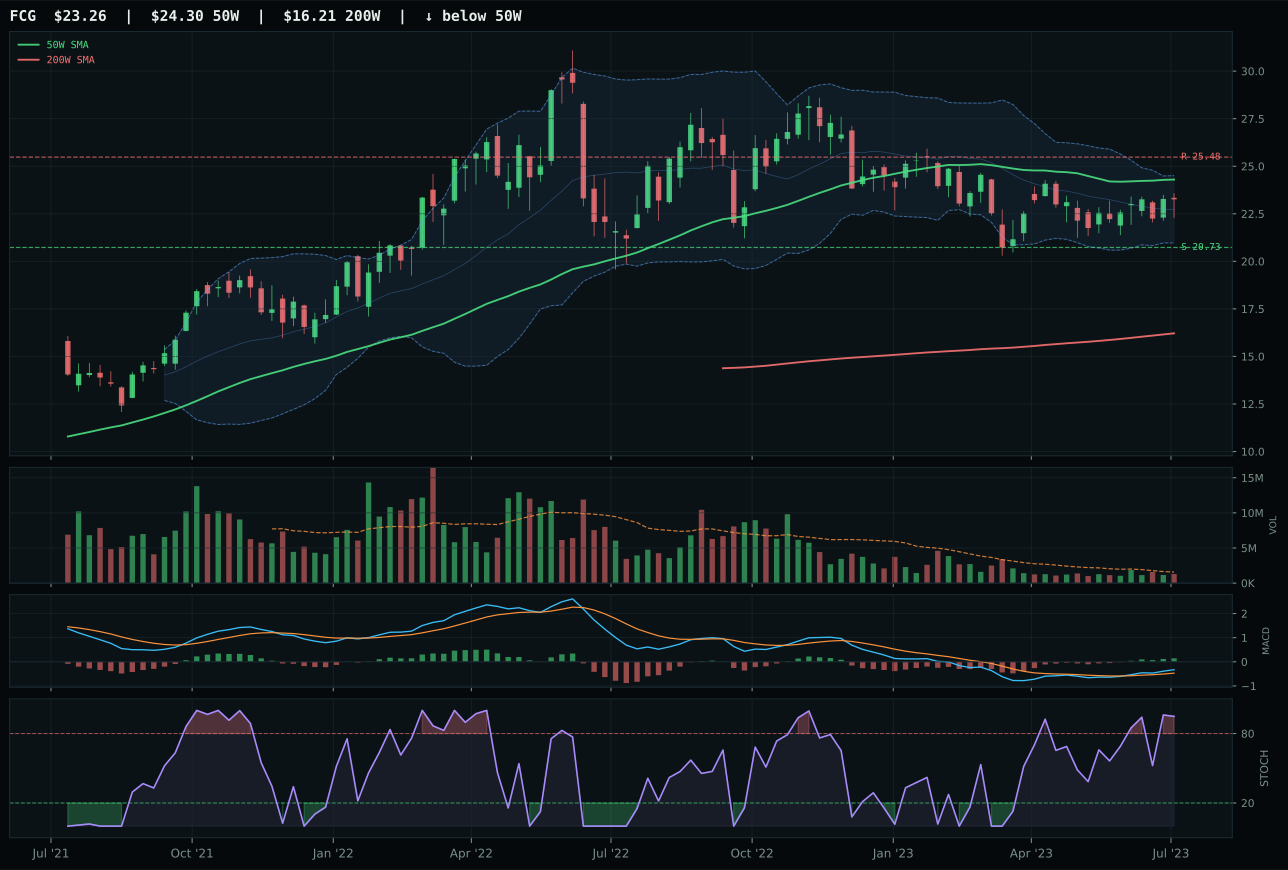
FCG has a neutral structure profile with -7.0% 13-week relative strength versus SPY.
A failed hold above support would weaken the setup.
Actionable but governed by invalidation levels.
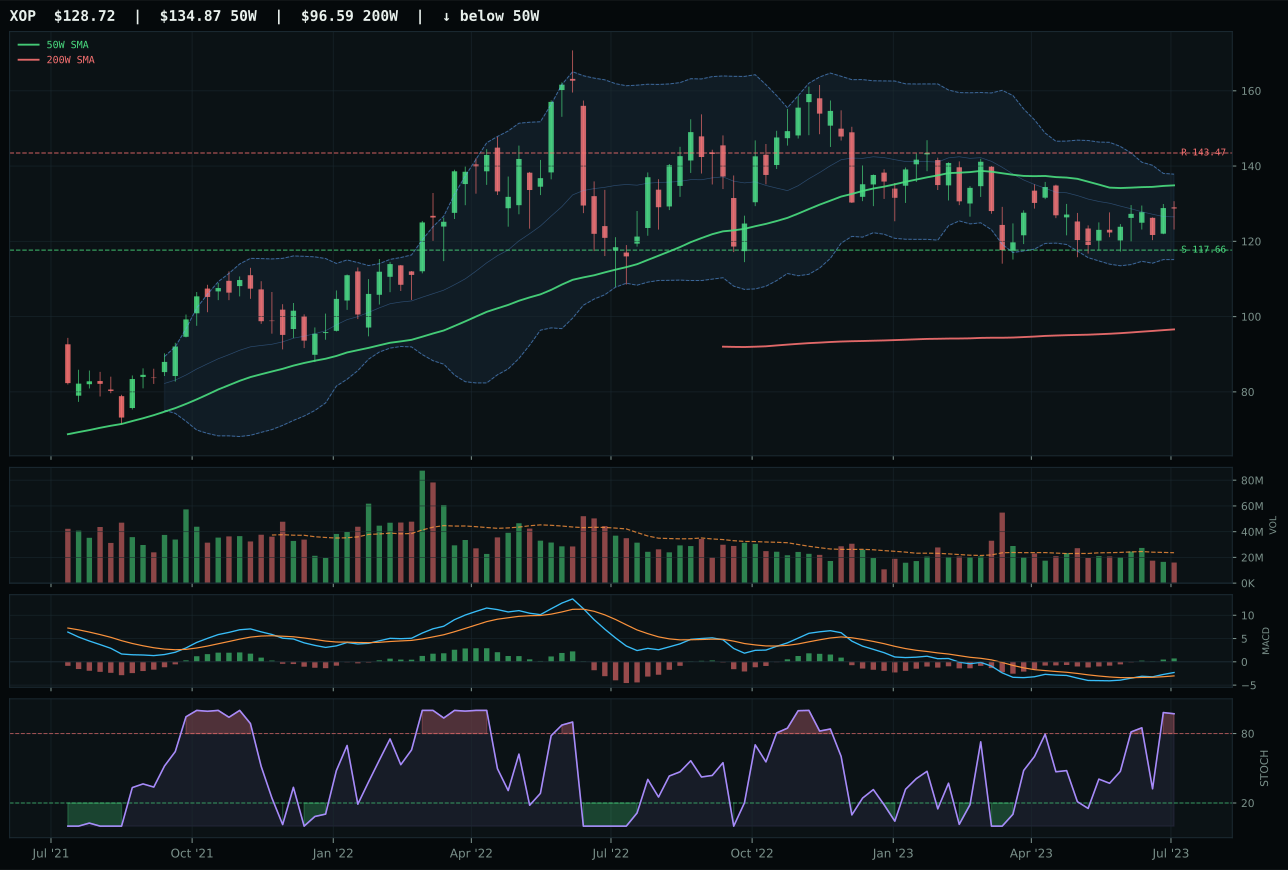
XOP has a neutral structure profile with -8.3% 13-week relative strength versus SPY.
A failed hold above support would weaken the setup.
Actionable but governed by invalidation levels.
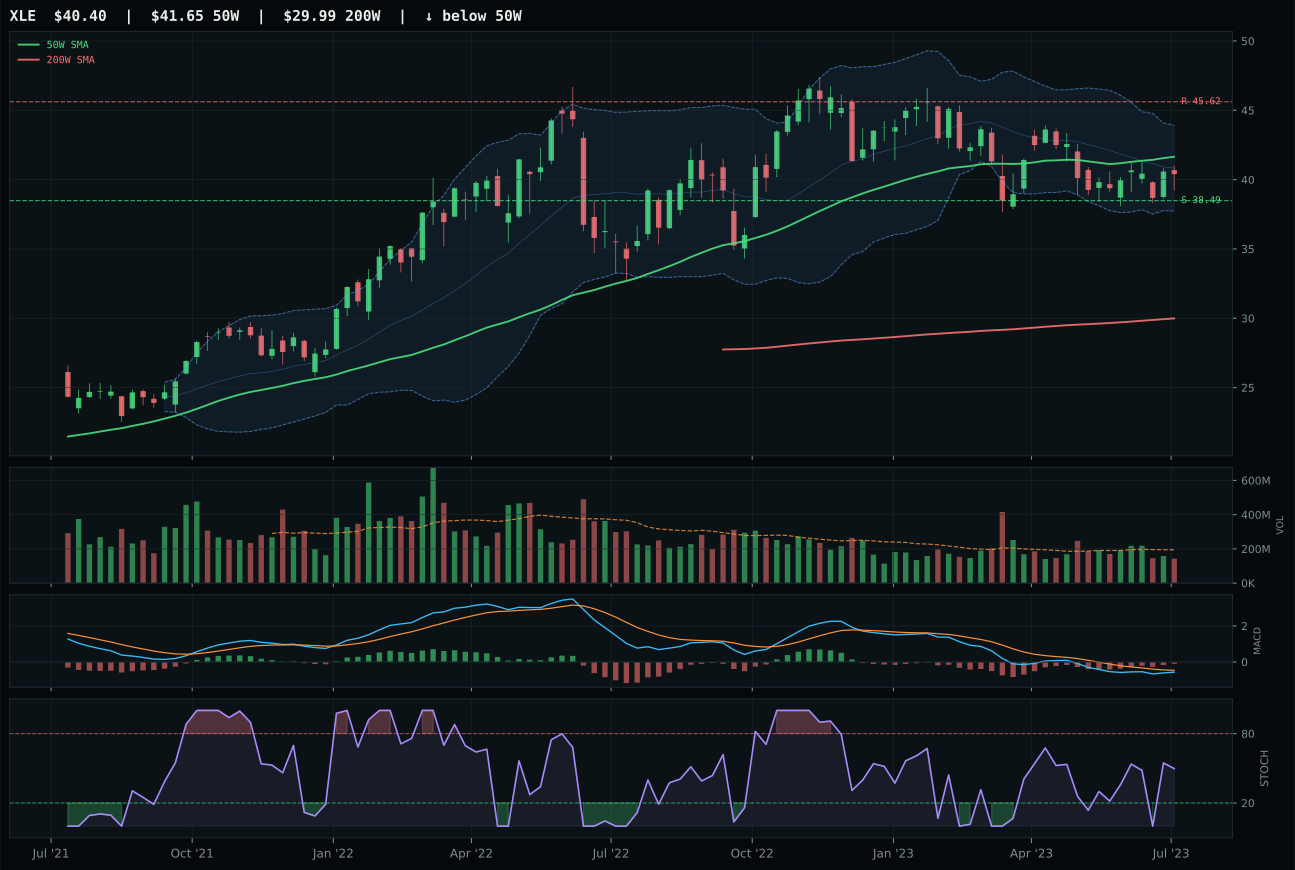
XLE has a pullback into support profile with -12.1% 13-week relative strength versus SPY.
A failed hold above support would weaken the setup.
Actionable but governed by invalidation levels.
XOP won the energy category in a field that barely qualified for inclusion, relying on the most defined pullback setup available rather than any momentum case. Price sits 4.6% below the 50W while remaining above the 200W, with stochastic RSI at extreme overbought levels (0.97) in a deep retracement Fibonacci zone. That setup generates an exceptional 97.0/100 timing score and a 72.7/100 risk-reward favorable. However, the illusion of strength dissolves upon inspection: 13-week returns are negative 1.1%, RS versus SPY is negative 8.3%, and momentum confirmation scores only 43.9/100. Volume sits at 0.68x the 20-week average. The category-relative strength of 0.0% shows no peer has gained traction. FCG posted a negative 1.5-point gap, too close to provide confidence, indicating that the allocator is merely choosing the less-bad energy option.
Traditional Energy received 0% allocation and ranks outside the portfolio entirely at 9th or 10th, a decision reflecting macro regime clarity. The category scored only 13.2, the second-lowest composite after Agriculture, because disinflation pressure hit energy hard at negative 10.0 while the macro state itself drags at negative 10.0. Real asset sponsorship of positive 7.0 cannot offset a 20-point headwind. Even the finest technical setup (XOP's pullback structure) cannot overcome a 23.0/100 category-level macro fit score. In a disinflation regime, energy lacks both the yield argument (rates are not rising) and the scarcity argument (commodity breadth is positive but not commanding). The 66.3/100 technical evidence for XOP is respectable, but macro permission is absent. Exclusion is correct and should persist until either credit stress eases to raise systemic risk concerns, or commodity breadth turns negative to create supply scarcity premium.