
2023-06-30
Informational purposes only. The content in this report, including allocations, analysis, and commentary, is provided solely for informational and educational purposes. It does not constitute financial advice, investment advice, trading advice, or any other type of advice. Past performance does not guarantee future results. Always conduct your own research and consult a qualified financial professional before making investment decisions.
Weekly Allocation
| Ticker | Category | Weight | Role |
|---|---|---|---|
| FBTC | 50% | Overlay | |
| AIQ | AI | 10% | Top-2 (10%) |
| IGV | Technology | 10% | Top-2 (10%) |
| ILF | Emerging Markets | 5% | Tier-2 (5%) |
| URA | Nuclear Energy | 5% | Tier-2 (5%) |
| COPX | Industrial Metals | 5% | Tier-2 (5%) |
| XAR | Defense & Aerospace | 5% | Tier-2 (5%) |
| PAVE | Utilities & Infrastructure | 5% | Tier-2 (5%) |
| GLD | Precious Metals | 5% | Tier-2 (5%) |
Trade Instructions — Monday Open
Sell the tranche from 2023-06-02 (completing its 4-week hold). Buy the new tranche. Instructions show net portfolio changes — same-asset positions cancel, weight changes show the delta.
| Action | Ticker | Instruction |
|---|---|---|
| SELL | SMH | Sell 40% of SMH position (reduce 6.25% → 3.75%) |
| SELL | URNM | Sell 25% of URNM position (reduce 5.00% → 3.75%) |
| SELL | INDA | Sell entire INDA position (1.25% of portfolio) |
| BUY | ILF | Buy ILF — 25.00% of freed cash (adds 1.25% to portfolio) |
| BUY | URA | Buy URA — 25.00% of freed cash (adds 1.25% to portfolio) |
| BUY | AIQ | Buy AIQ — 50.00% of freed cash (adds 2.50% to portfolio) |
Current Portfolio After Trade
Combined holdings across all 4 active tranches. Each tranche is 25% of the portfolio.
| Ticker | % of Portfolio | Weight Bar |
|---|---|---|
| FBTC | 50.00% | |
| IGV | 7.50% | |
| COPX | 6.25% | |
| XAR | 5.00% | |
| AIQ | 5.00% | |
| URNM | 3.75% | |
| GLD | 3.75% | |
| PAVE | 3.75% | |
| ILF | 3.75% | |
| XLE | 3.75% | |
| SMH | 3.75% | |
| URA | 2.50% | |
| WEAT | 1.25% |
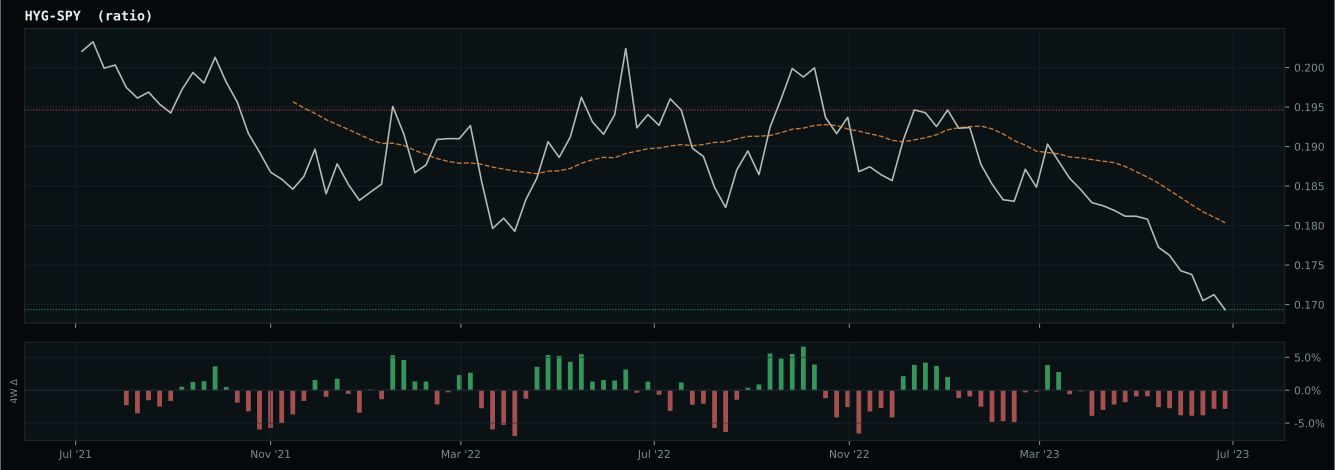
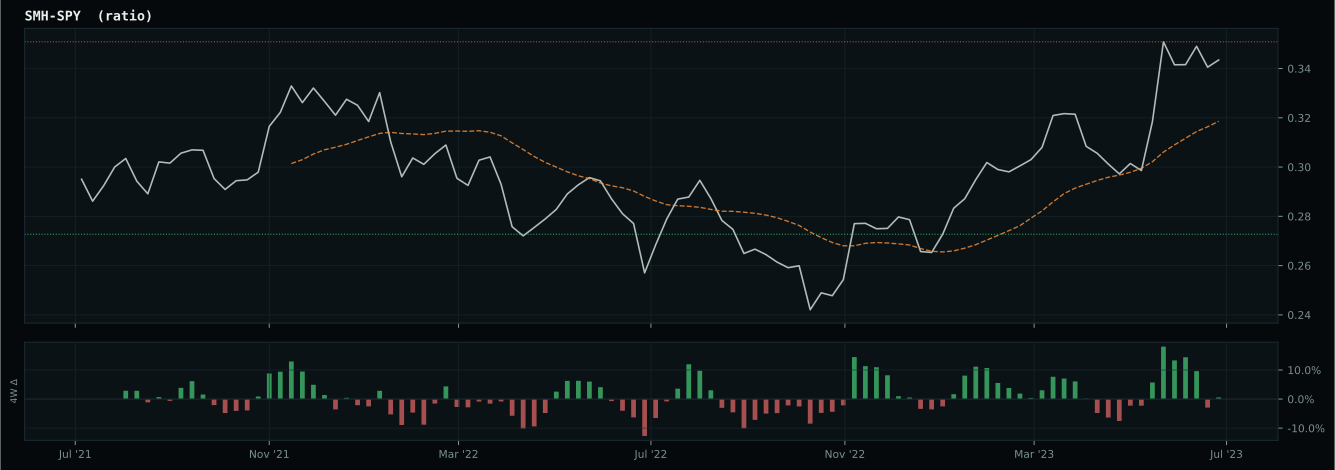
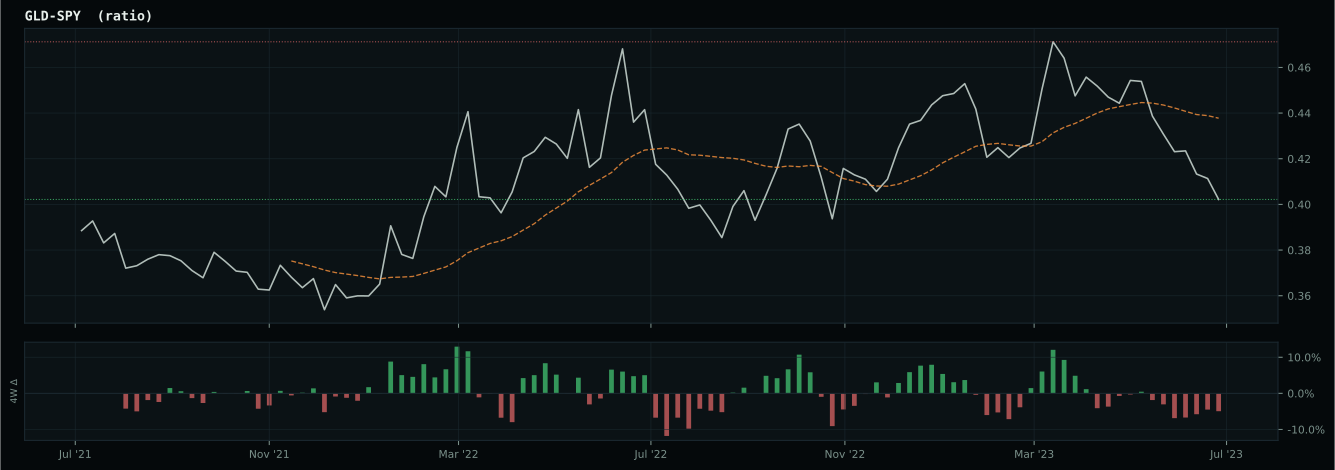
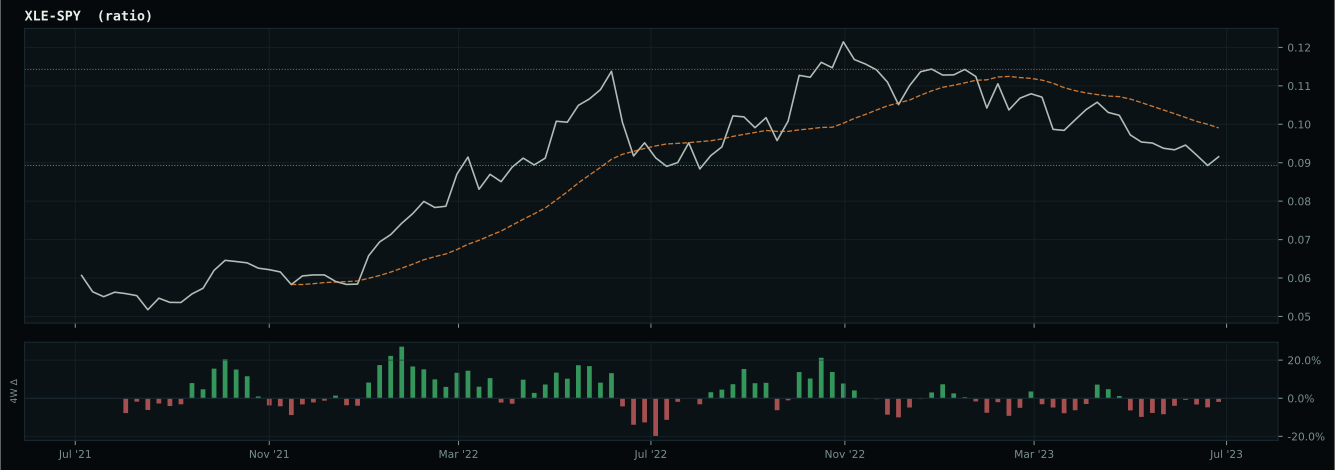
Macro Regime — Disinflation
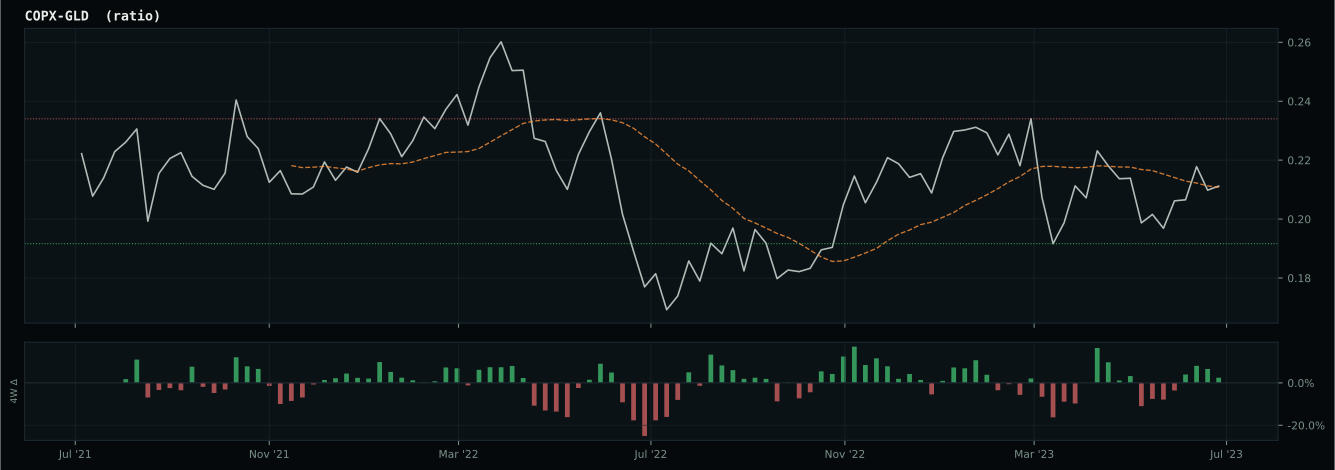
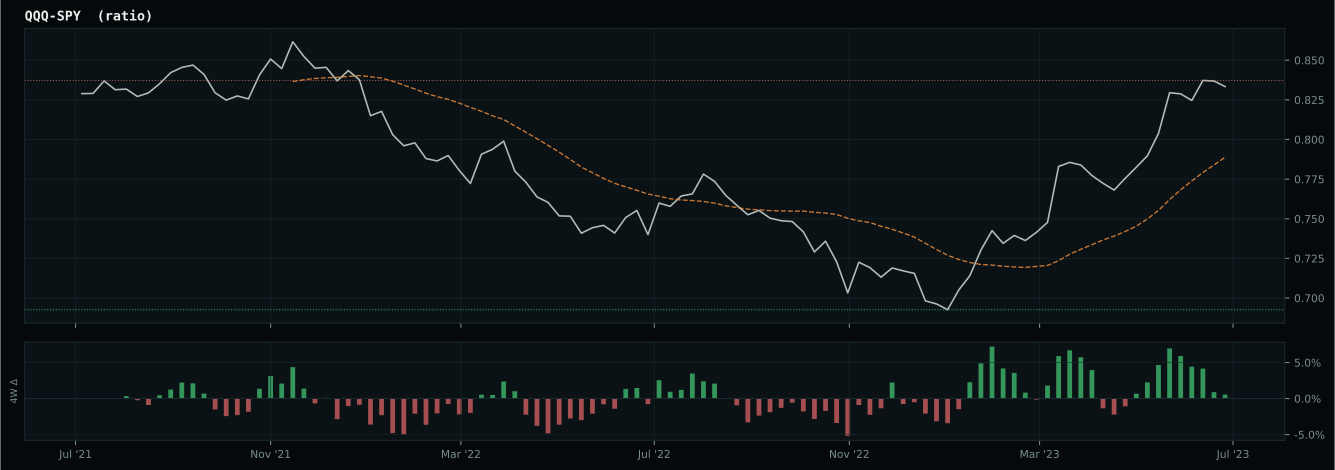
Macro Evidence Charts
Market-implied signals behind the macro regime scores. Each ratio compares two assets; the direction and slope of the ratio is what the macro engine reads.
Crypto Regime — TrendBTC
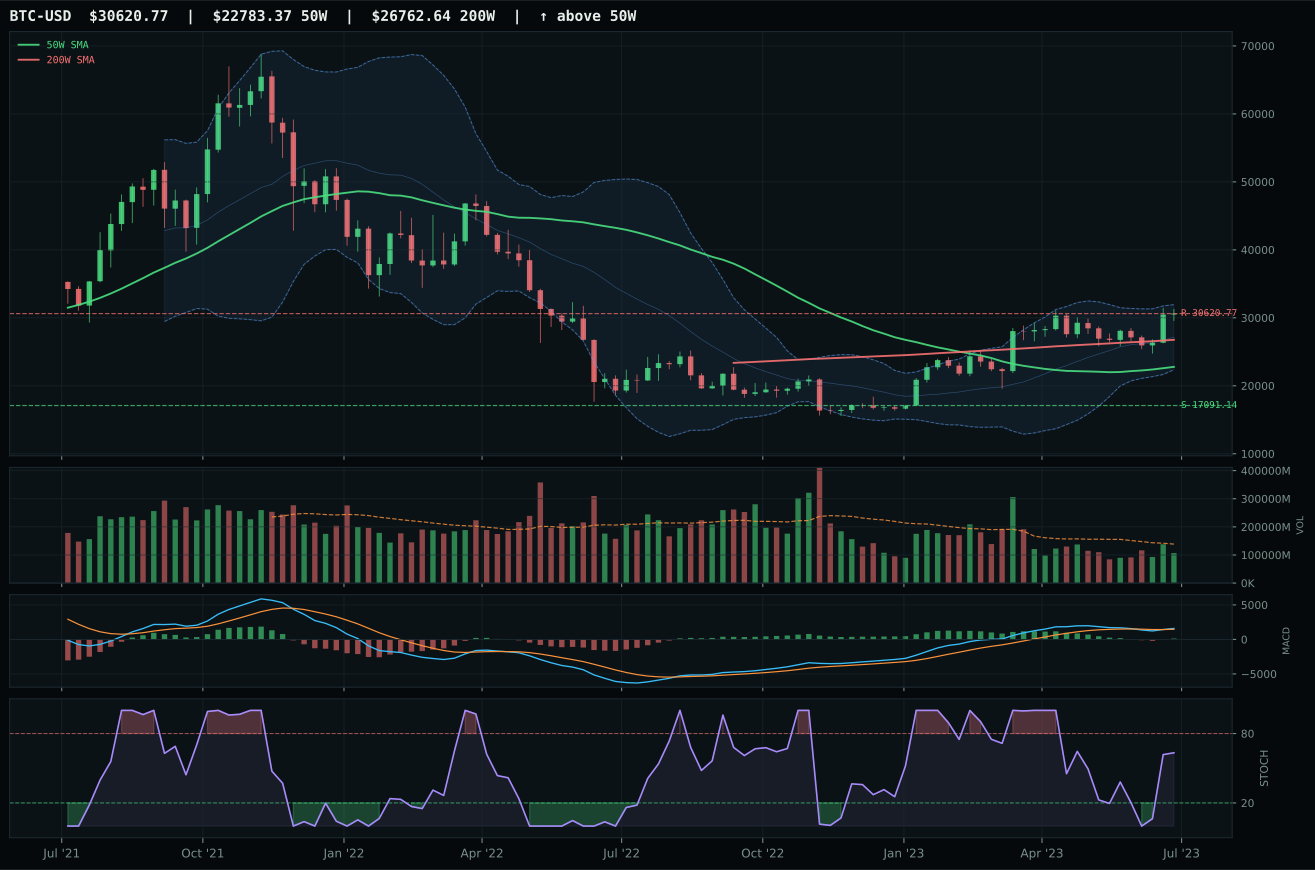
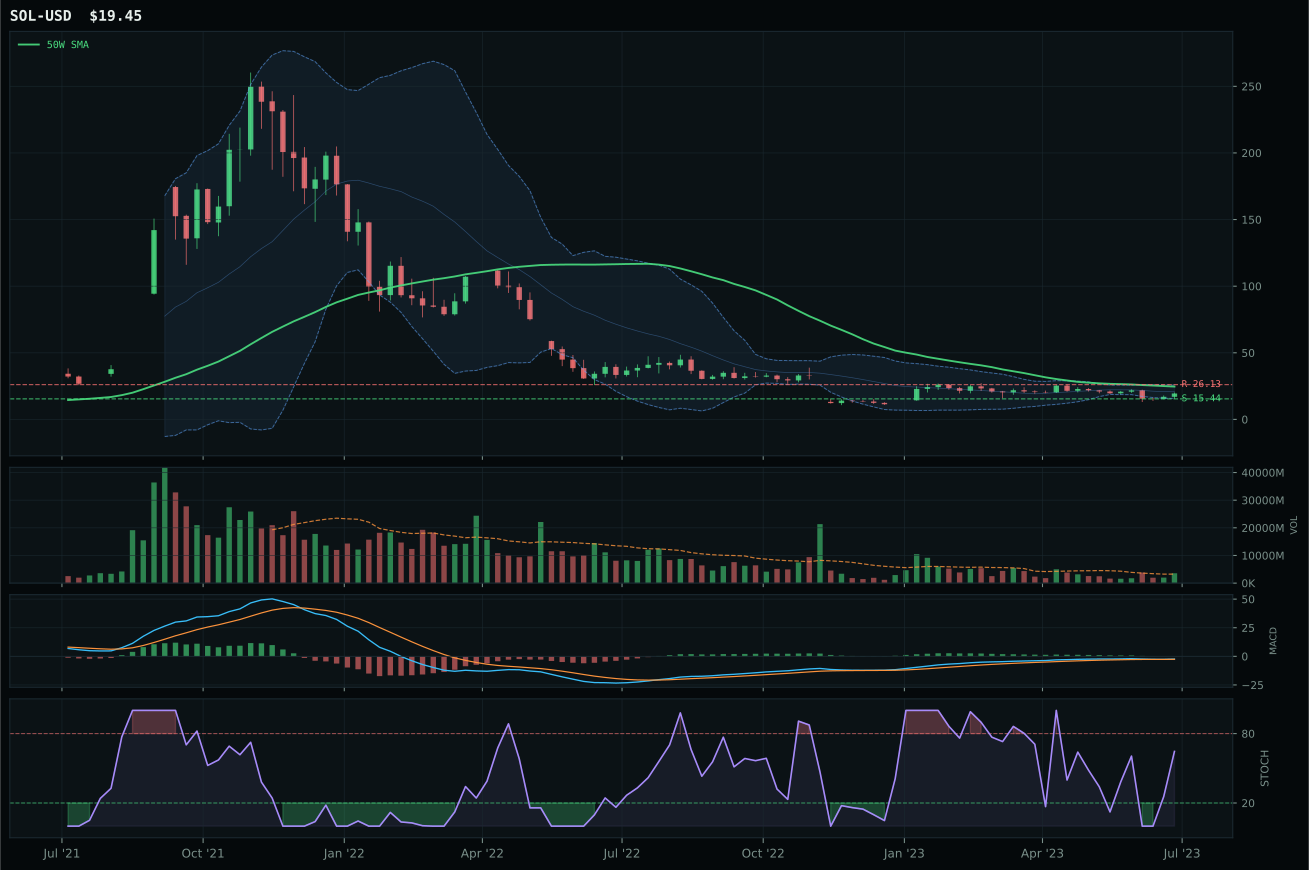
post-touch structure is too wide to count as a range; max/min close ratio is 1.87
TrendBTC confirmed: 2 consecutive closes above rising/flat 50W SMA
one or more available conditions failed
Category Rankings
| Rank | Category | Winner | Score | Alloc | 4W Ret | Peers (4W) |
|---|---|---|---|---|---|---|
| 1 | AI | AIQ | 68.3 | 20% | +5.17% | SMH +4.9% · BOTZ +0.3% |
| 2 | Technology | IGV | 60.1 | 20% | +4.44% | XLK +2.5% · CIBR +2.7% |
| 3 | Emerging Markets | ILF | 57.6 | 10% | +3.51% | INDA +1.8% · IEMG +4.3% |
| 4 | Nuclear Energy | URA | 52.9 | 10% | +2.73% | URNM +1.7% · NLR +2.2% |
| 5 | Industrial Metals | COPX | 52.7 | 10% | +9.10% | REMX -3.1% · PICK +6.5% |
| 6 | Defense & Aerospace | XAR | 48.0 | 10% | +1.73% | ITA +0.7% · ROKT -0.6% |
| 7 | Utilities & Infrastructure | PAVE | 43.2 | 10% | +2.74% | IGF +1.8% · XLU +3.1% |
| 8 | Precious Metals | GLD | 39.2 | 10% | +2.14% | SLV +6.8% · GDX +2.4% |
| 9 | Agriculture & Livestock | MOO | 21.1 | 0% | +7.13% | VEGI +6.3% · WEAT +6.9% |
| 10 | Traditional Energy | XOP | 13.8 | 0% | +10.09% | FCG +9.6% · XLE +6.4% |
AI — AIQ
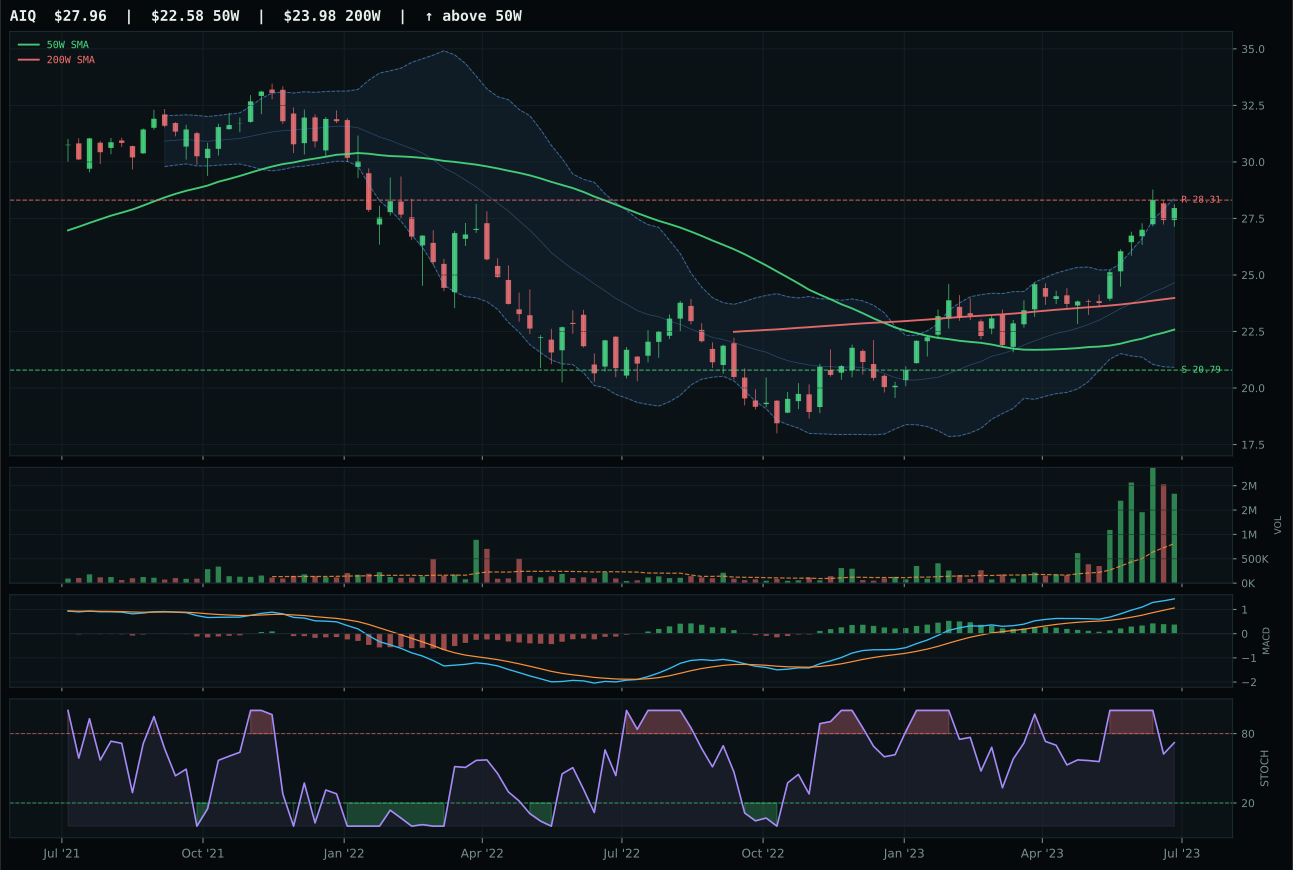
AIQ has a vertical extension profile with 5.4% 13-week relative strength versus SPY.
A failed hold above support would weaken the setup.
Actionable but governed by invalidation levels.
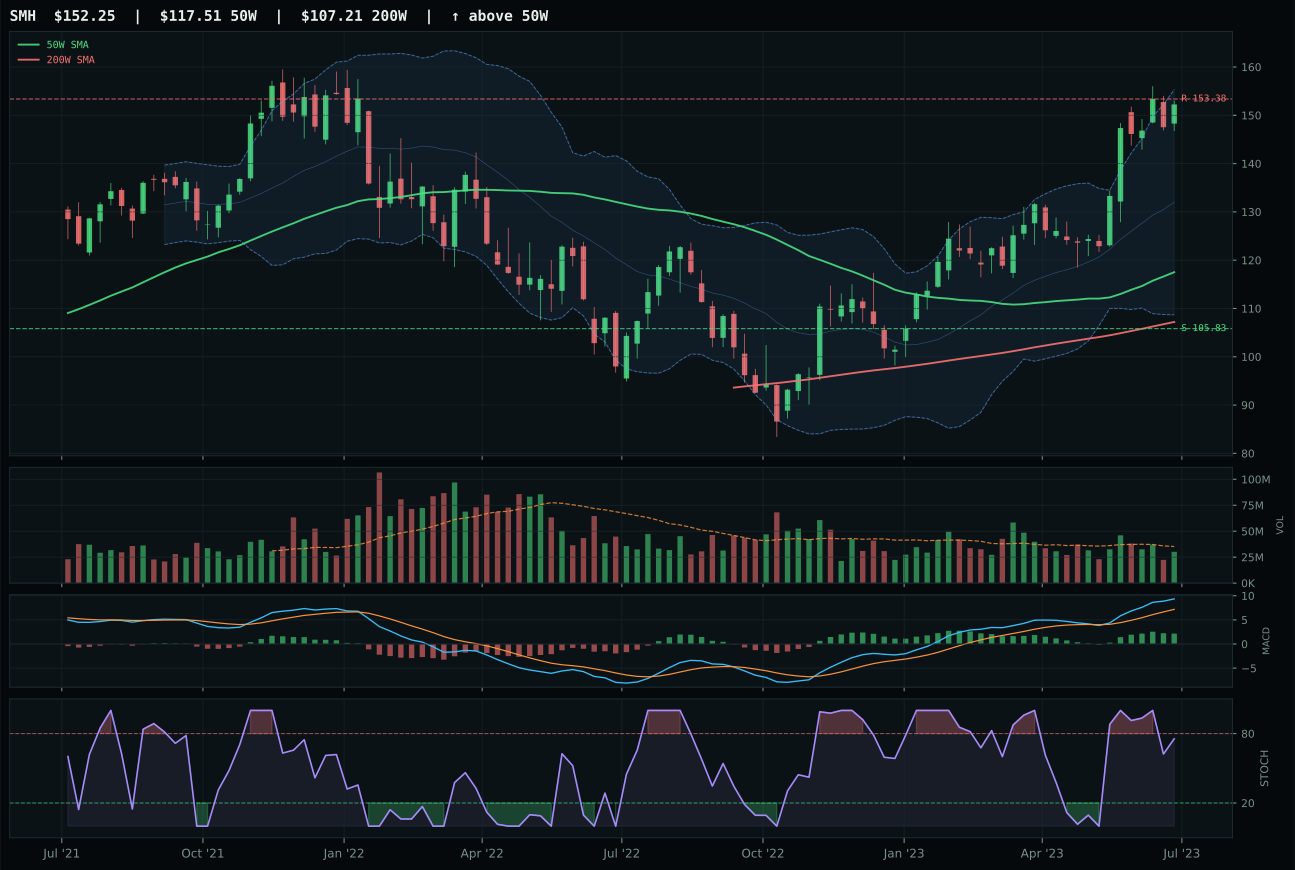
SMH has a vertical extension profile with 7.4% 13-week relative strength versus SPY.
A failed hold above support would weaken the setup.
Actionable but governed by invalidation levels.
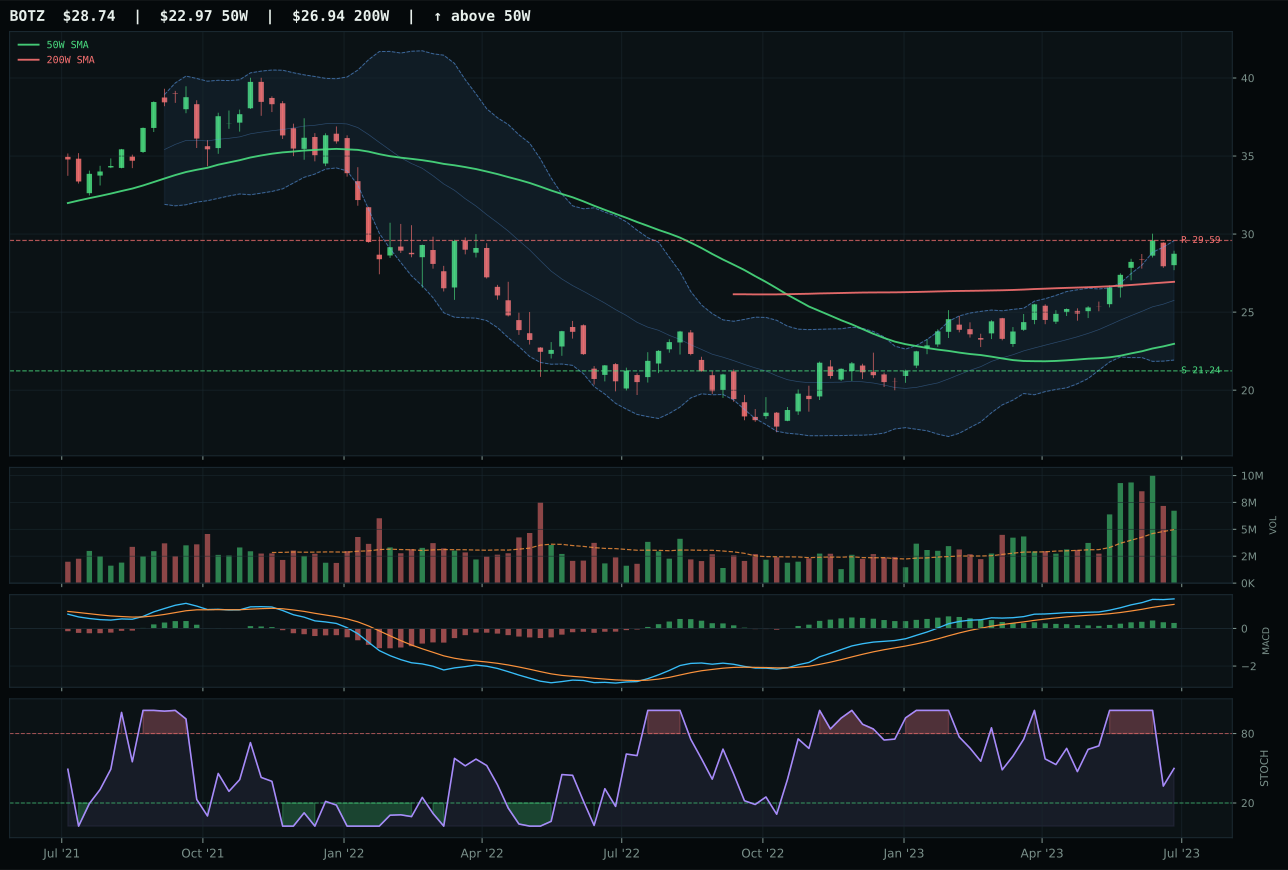
BOTZ has a vertical extension profile with 4.4% 13-week relative strength versus SPY.
A failed hold above support would weaken the setup.
Actionable but governed by invalidation levels.
AIQ dominated the AI category with the rare combination of best-in-class momentum confirmation and genuine accumulation volume, crushing SMH's 9.6-point deficit through technical superiority rather than category bias. The 13W return of 13.7% is healthy but not stretched; the real edge is volume at 2.26x the 20W average, which proves the move is being funded and financed, not just discussed. MACD is bullish and improving, stochastic RSI is falling into neutral at 0.72, and structure is cleaner at 83.2 versus SMH's 70.5—these are the details that separate conviction from hope. SMH's 7.4% SPY-relative strength appears superior, yet it masks a 29.6% extension above the 50W versus AIQ's 23.8%, meaning new buyers face worse risk-reward and thinner participation. The momentum confirmation score of 99.8 reflects AIQ's volume-price synchronization: every rally is backed by fresh capital, and every pullback holds on reduced volume—the institutional fingerprint of real accumulation.
AI earned top-two allocation at 10% because its 68.3 category score ranks among the portfolio's two highest, reflecting a 82.6 reasoned ETF proof score for AIQ that no runner-up approached. The macro environment amplifies this: AI growth sponsorship checked in at plus 10 while risk appetite positive added another 9 points, easily overwhelming the minus 12 headwind from active liquidity stress. The disinflation regime contributes plus 5 for duration repricing, creating a rare setup where both technical evidence (93.9/100) and macro narrative (53.0/100) align decisively. Elevation to 10% allocation would require either AIQ to cool and reset toward its 50W to reduce extension risk, or for the broader liquidity stress to resolve—neither appears imminent, making 10% the appropriate size for conviction without overcommitment.
Technology — IGV
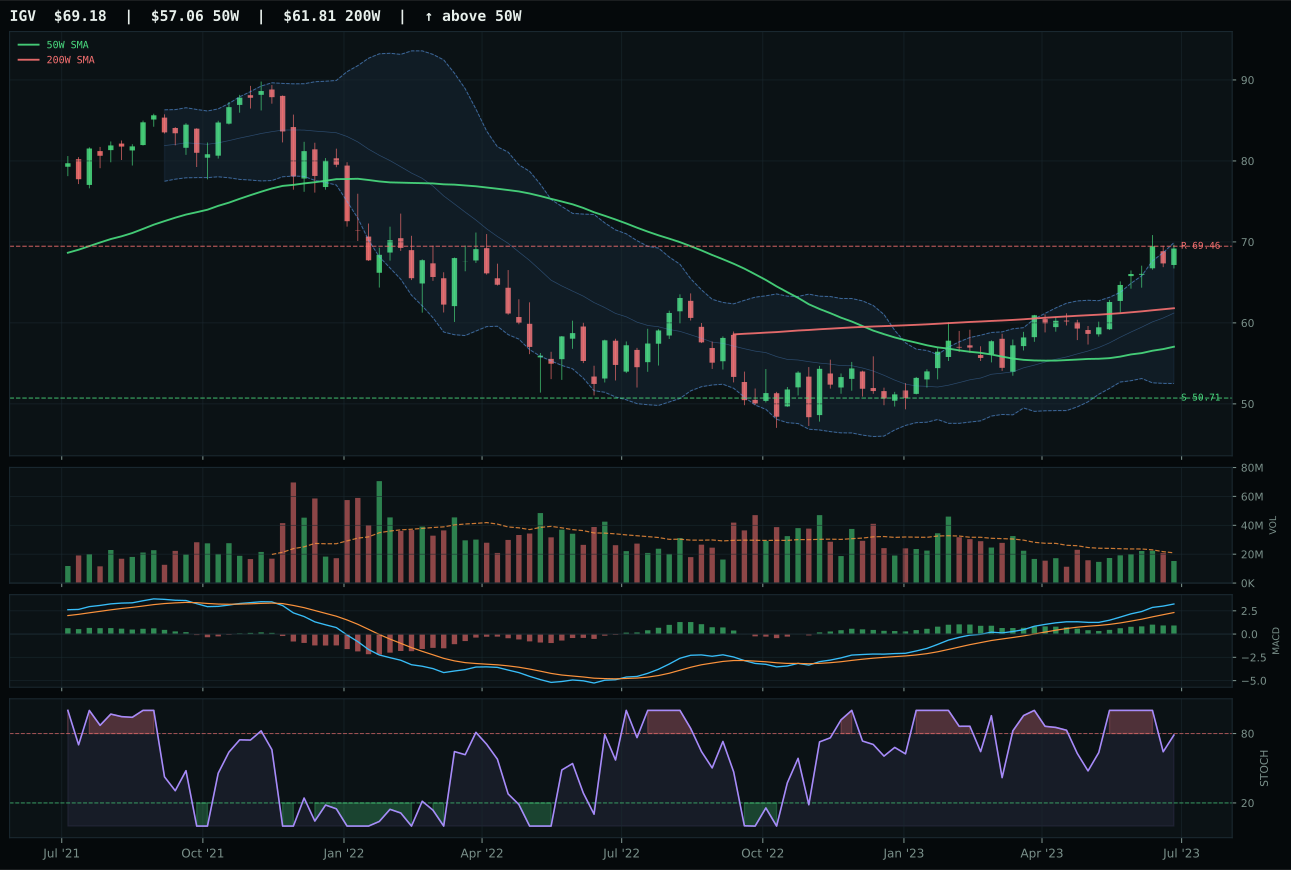
IGV has a vertical extension profile with 5.2% 13-week relative strength versus SPY.
A failed hold above support would weaken the setup.
Actionable but governed by invalidation levels.
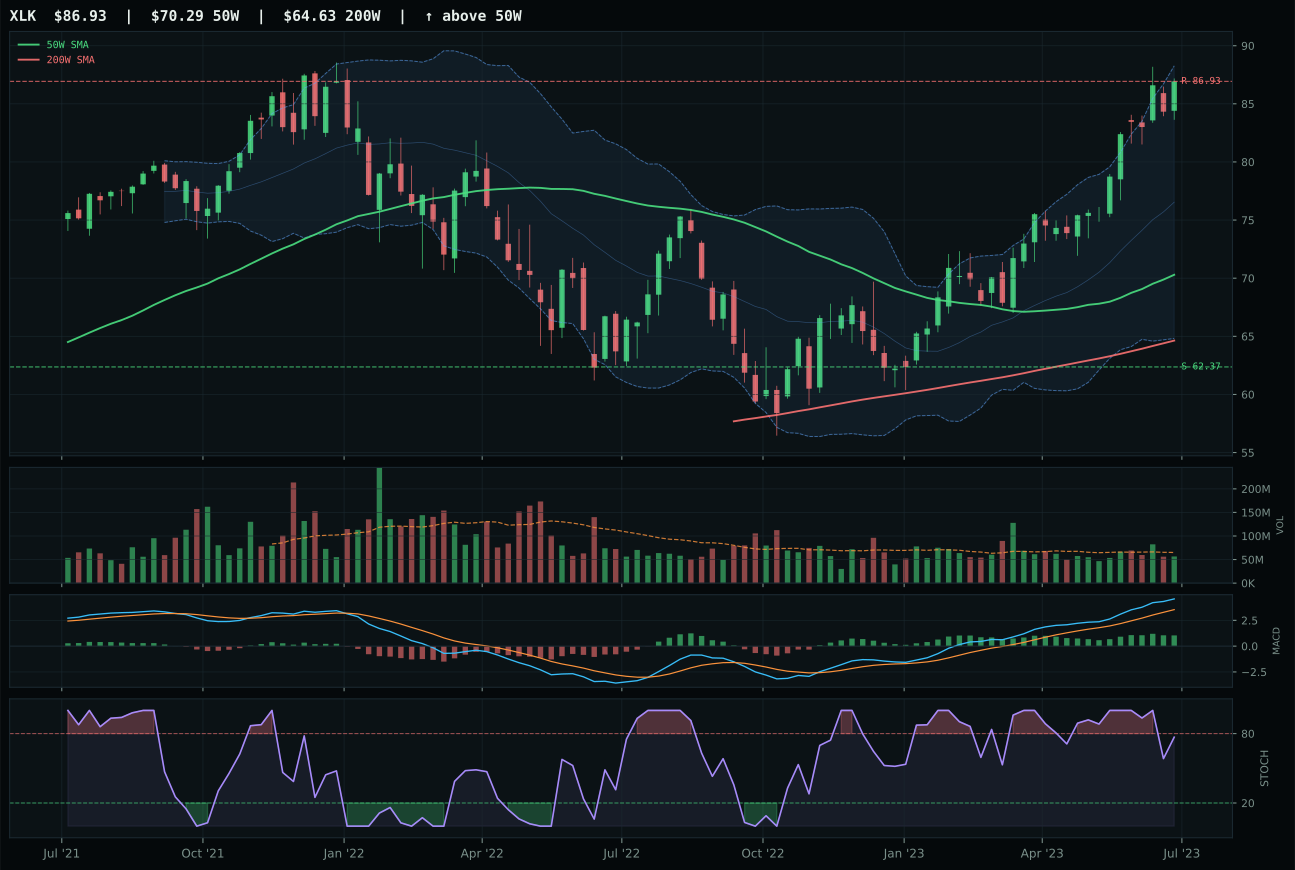
XLK has a vertical extension profile with 6.9% 13-week relative strength versus SPY.
A failed hold above support would weaken the setup.
Actionable but governed by invalidation levels.
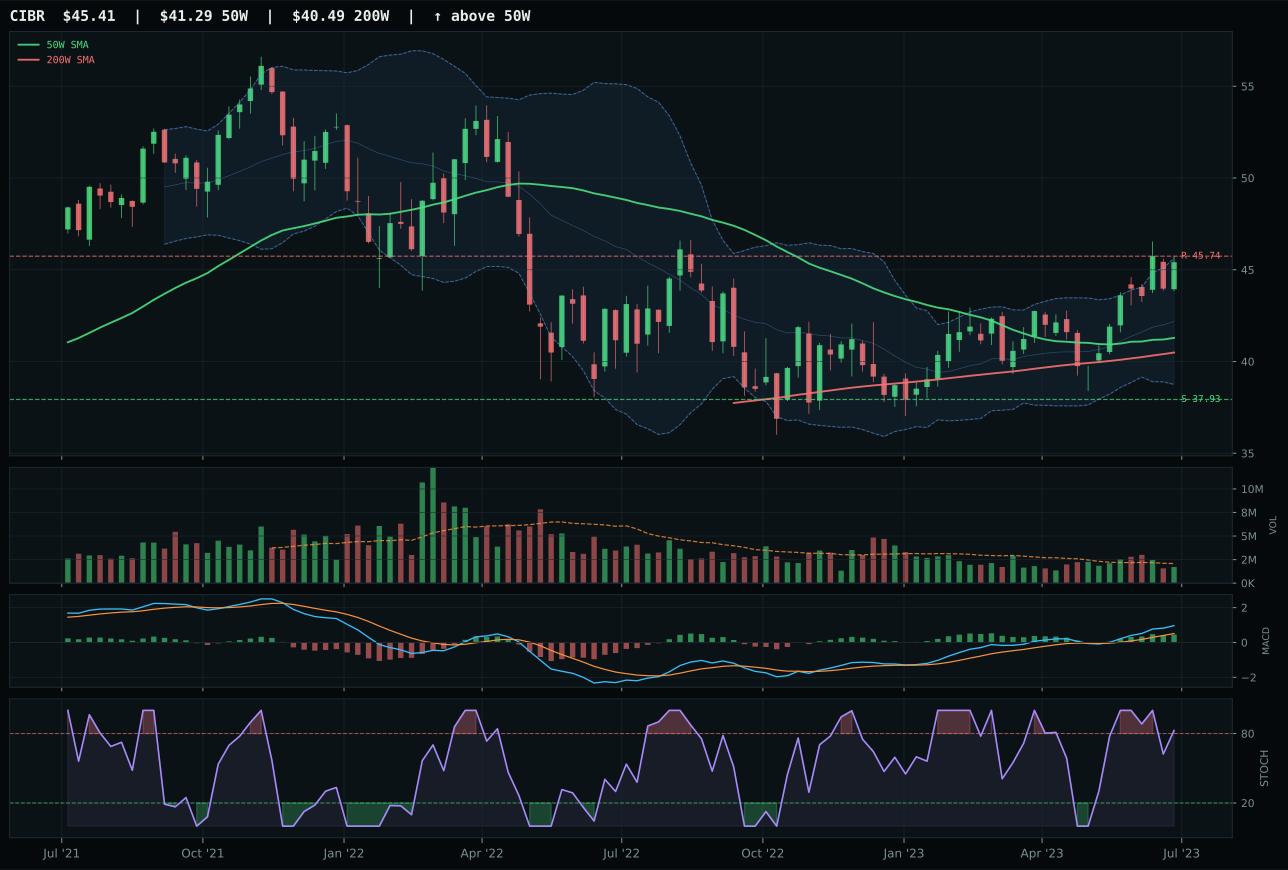
CIBR has a neutral structure profile with -2.1% 13-week relative strength versus SPY.
A failed hold above support would weaken the setup.
Actionable but governed by invalidation levels.
IGV won the category by combining clean upside momentum with disciplined entry constraints that XLK failed to match. The setup is a vertical extension at 21.3% above the 50W, but IGV's MACD is bullish and improving while stochastic RSI is falling into neutral territory—a pattern that rewards patient accumulation over panic buying. Volume at 0.73x the 20W average shows thin participation, which is a feature here, not a bug: it means conviction is selective rather than crowded. XLK's edge is sharper 13W momentum at 15.1% and superior SPY-relative strength at 6.9%, yet its MACD is flattening and structure is deteriorating at the margin. The timing score gap—45 versus 40—reflects IGV's superior setup quality: price is close enough to the 50W to warrant entry, far enough extended to prove seriousness, and supported by improving technical confirmation rather than mere breadth.
Technology earned its 10% slot despite ranking outside the top two categories this week because the disinflation macro regime actively favors duration-sensitive software and cloud leaders, a tailwind worth 7 points in the category reasoning. Risk appetite remaining positive contributed another 9 points of support, offsetting the headwind from active liquidity stress. The 60.1 category score trails AI and other leaders, but IGV's technical evidence of 60.3 and macro fit of 47.0 provide enough conviction to justify holding rather than rotating to zero. What would elevate Technology to top-two status: XLK's MACD needs to accelerate from flattening to improving, or the basket needs to find accumulation at higher volume multiples to eliminate the fragility of thin participation.
Emerging Markets — ILF
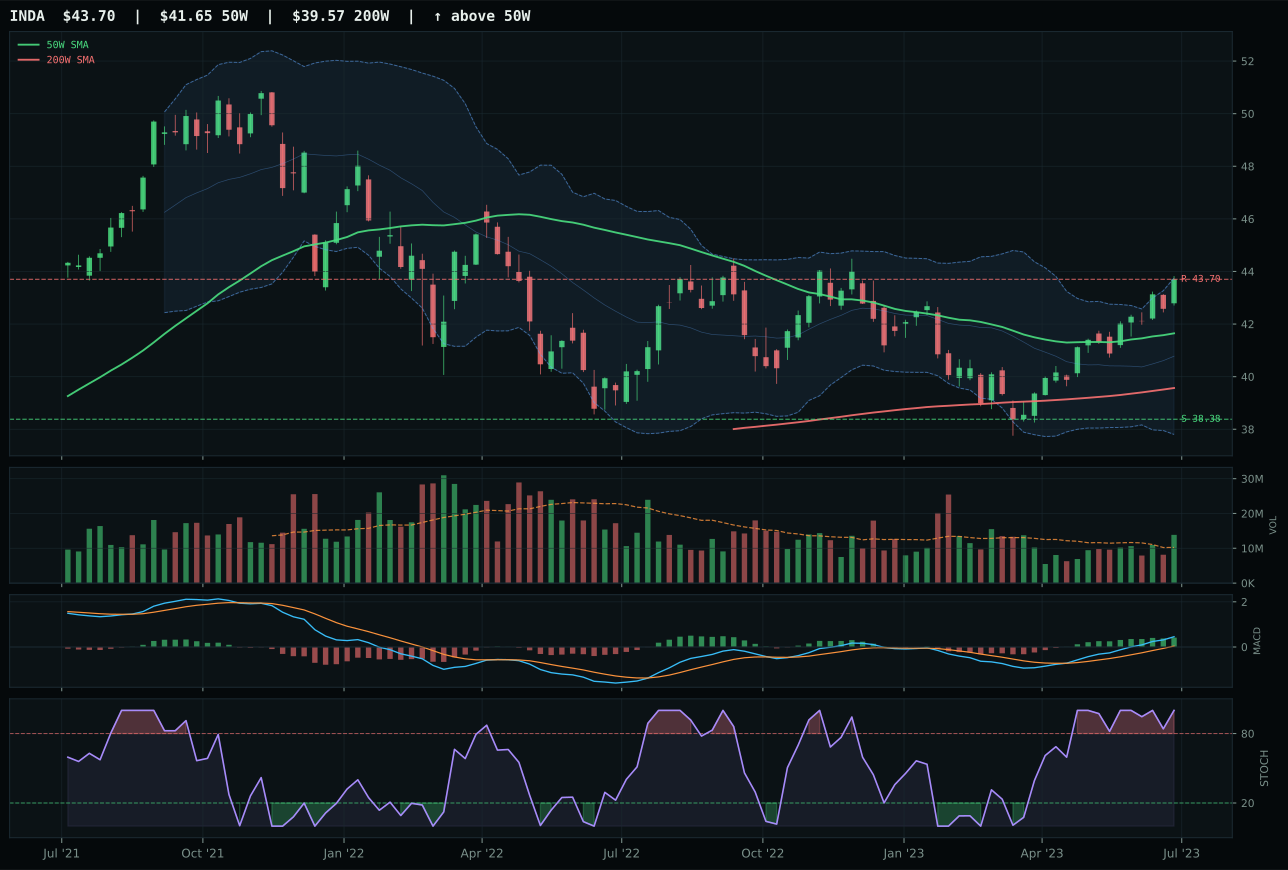
INDA has a neutral structure profile with 2.7% 13-week relative strength versus SPY.
A failed hold above support would weaken the setup.
Actionable but governed by invalidation levels.
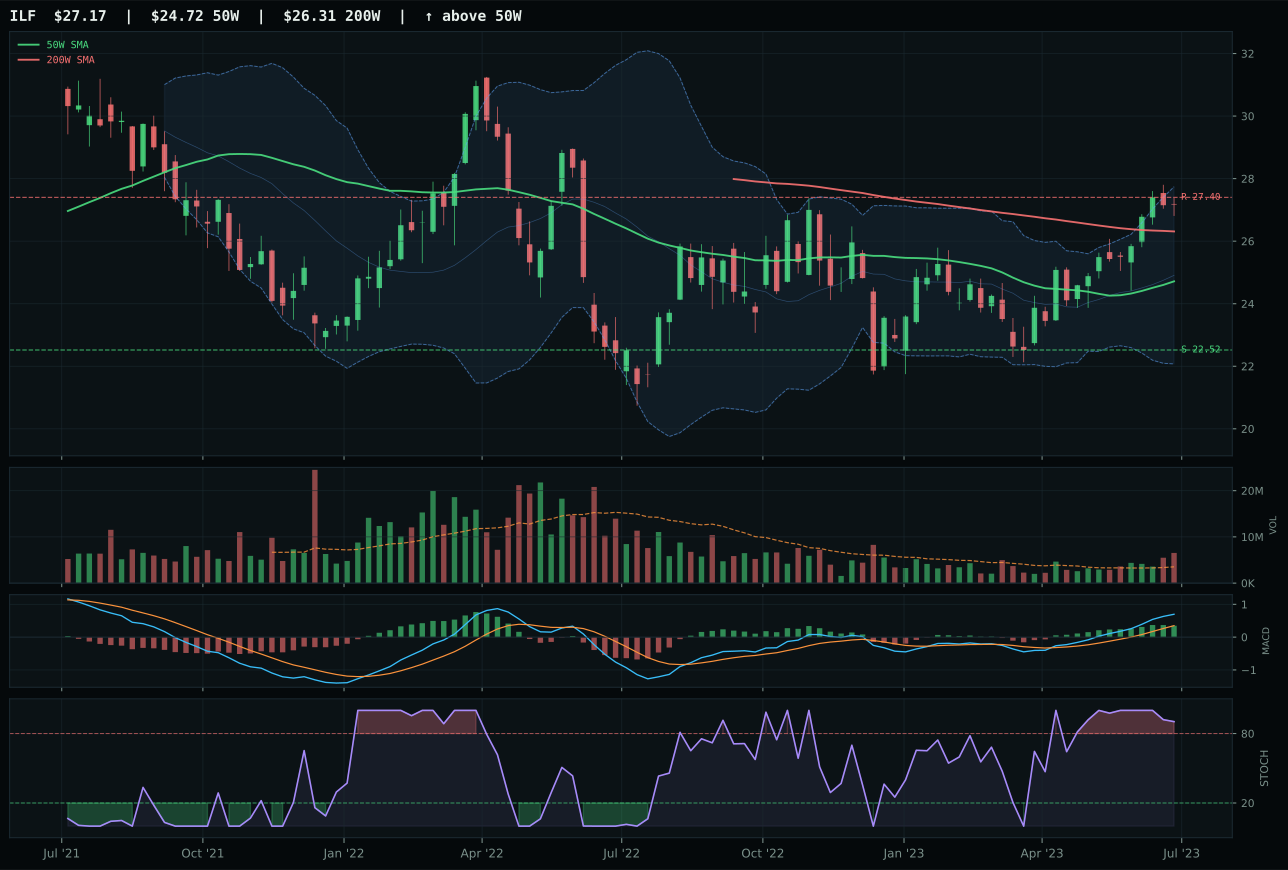
ILF has a neutral structure profile with 5.5% 13-week relative strength versus SPY.
A failed hold above support would weaken the setup.
Actionable but governed by invalidation levels.
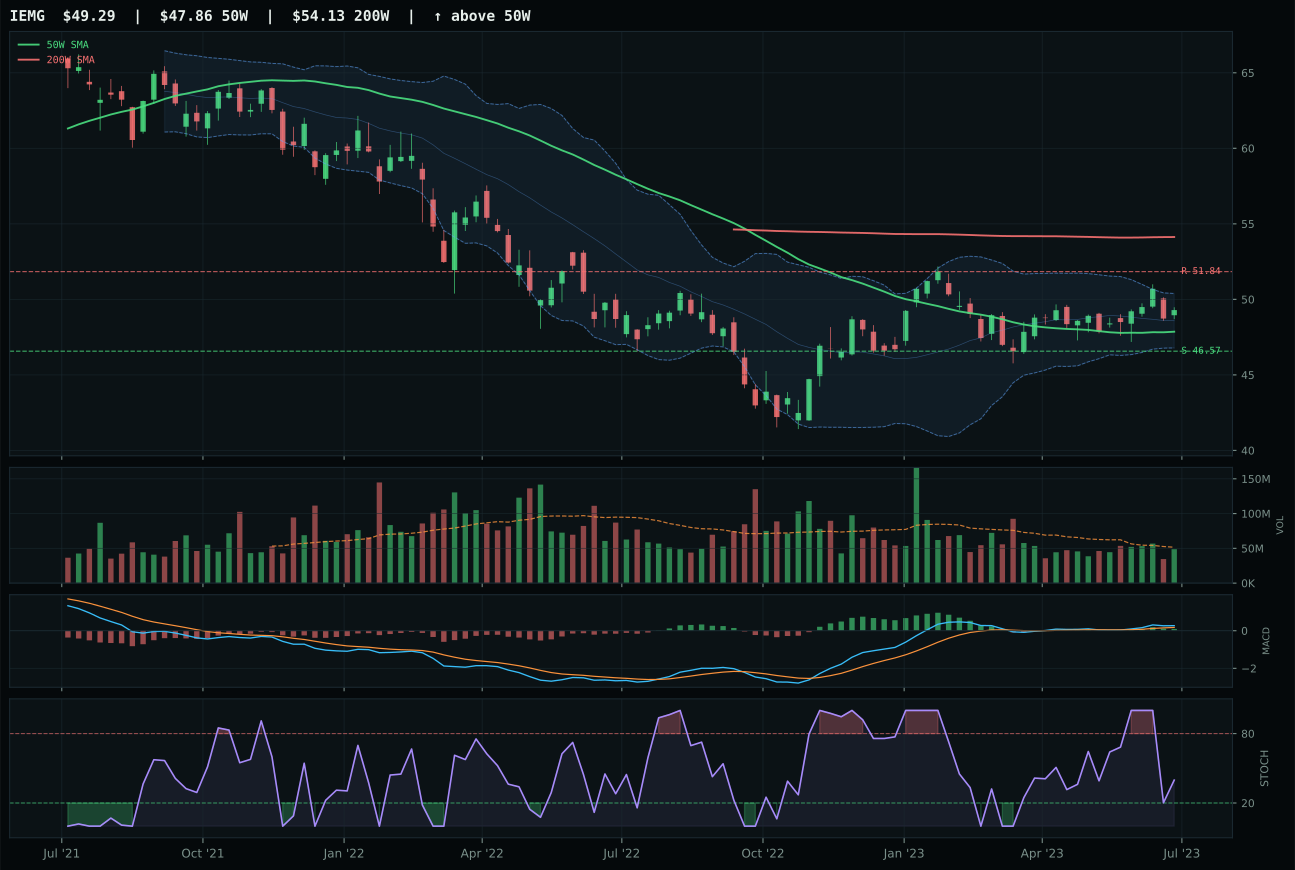
IEMG has a compression near 50W profile with -7.3% 13-week relative strength versus SPY.
A failed hold above support would weaken the setup.
Actionable but governed by invalidation levels.
ILF won the Emerging Markets category by combining superior category-relative strength at 2.8% with genuine accumulation volume at 1.85x the 20W average, beating INDA despite INDA's higher composite technical score of 85 versus ILF's 79. ILF's structure is cleaner at 85.8 versus INDA's 79.1, and its volume-price confirmation of 84.3 proves institutional capital is committed to Latin America commodity exposure rather than India quality growth. Price is 9.9% above the 50W with trend score of 98.3 and momentum confirmation of 97.3—both leaders are strong, yet ILF's stochastic RSI is overbought rolling over at 0.90 versus INDA's overbought momentum at 1.00, suggesting ILF's move is more controlled and less prone to violent reversal. The 13W return of 13.8% with 5.5% SPY-relative strength shows this is not a narrow bet; it's a broad commodity-and-value rotation that includes currency tailwinds.
Emerging Markets earned 5% allocation with ILF as representative because commodity breadth positive contributed plus 8, metals scarcity plus 5, and real asset sponsorship plus 6, creating a 65.0 macro fit that justifies Latin America exposure despite the category's weak minus 10 overall liquidity stress and minus 10 credit stress headwinds. ILF's 88.7 technical evidence dominates the category, with 98.3 trend, 97.3 momentum confirmation, and 85.5 persistence providing technical conviction that overrides the macro caution. The setup reads as tactical accumulation in a market hated by consensus—INDA offers superior trend at 100 and timing precision, but ILF's volume confirmation at 1.85x and category-relative strength advantage justify choosing commodity-exposed Latin America over quality-growth India during a disinflation regime. The 5% allocation hedges against commodity strength re-acceleration while capturing momentum that ILF has built over thirteen weeks at plus 13.8 return. Doubling to 10% would require price to cool toward the 50W to reset extension risk, or for credit stress macro headwind to ease as emerging market sovereign yields stabilize. Until those resets occur, ILF holds at 5% as a liquid tactical position with real technical conviction.
Nuclear Energy — URA
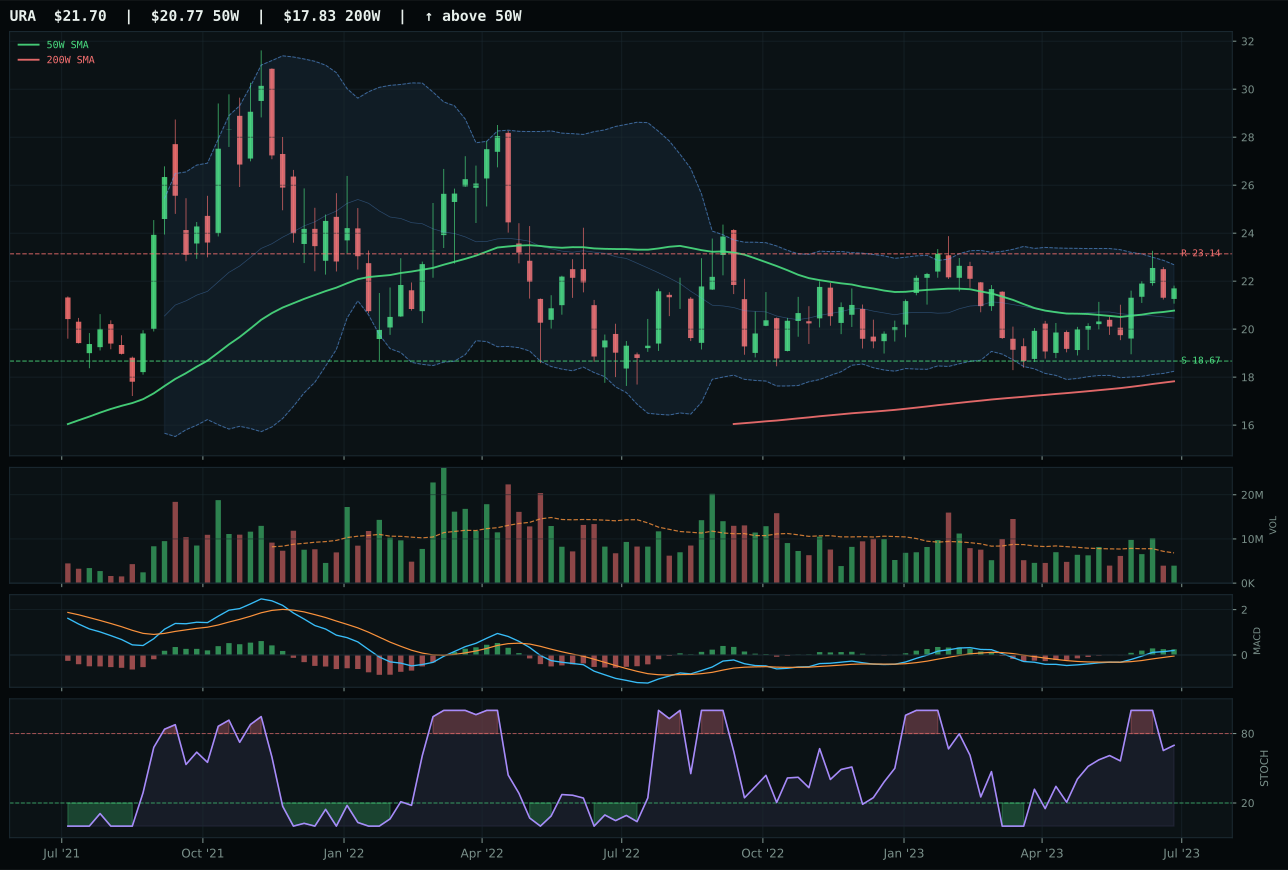
URA has a neutral structure profile with 0.6% 13-week relative strength versus SPY.
A failed hold above support would weaken the setup.
Actionable but governed by invalidation levels.
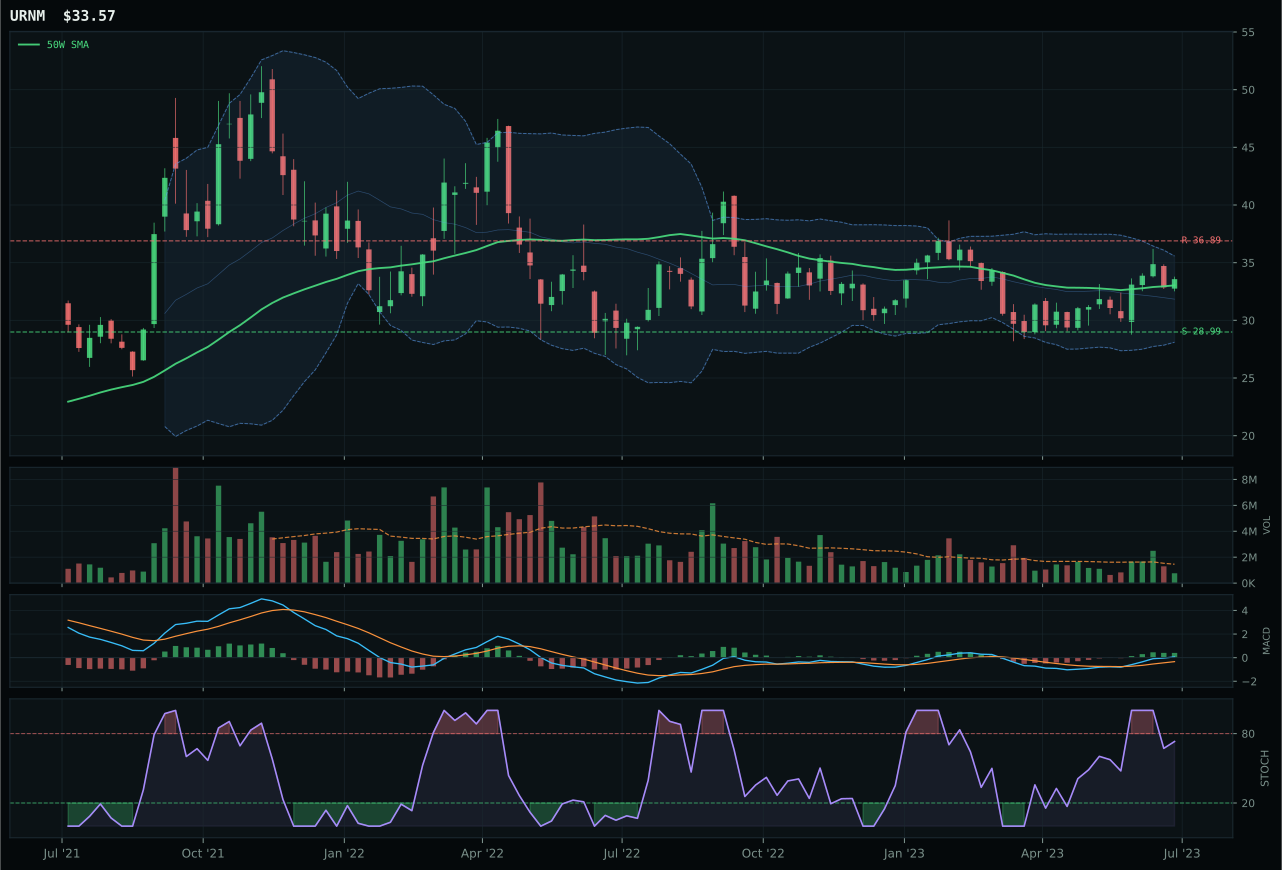
URNM has a compression near 50W profile with -1.3% 13-week relative strength versus SPY.
A failed hold above support would weaken the setup.
Actionable but governed by invalidation levels.
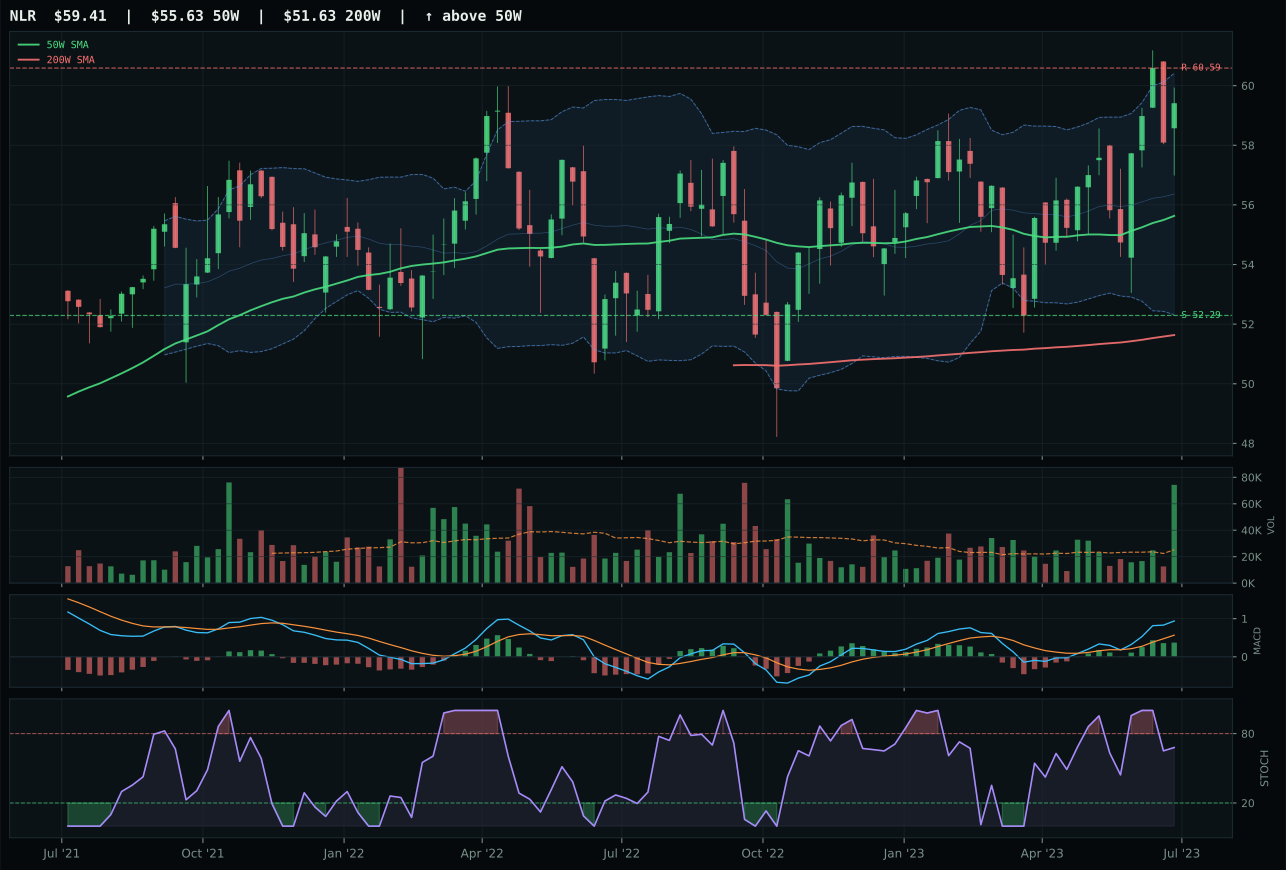
NLR has a neutral structure profile with -1.3% 13-week relative strength versus SPY.
A failed hold above support would weaken the setup.
Tracked, but not top-2 eligible because: .
URA won a competitive category by combining real asset sponsorship tailwinds with the cleanest technical structure among three reasonably-positioned ETFs. Price is 4.5% above the 50W with trend score of 90.9, but the critical edge is the neutral structure setup at 72.8—cleaner than URNM's compression near 50W and aligned with the timing score of 97.0 that reflects optimal positioning. MACD is bullish and improving, stochastic RSI is falling into neutral at 0.70, and category-relative strength of 1.9% signals URA is attracting capital within its own basket. URNM's technical score of 71.0 is respectable, yet its compression setup and neutral macro fit at 49.0 versus URA's unspecified fit suggest less decisive positioning. The 13W return of 8.9% proves this is not a broken story—nuclear is working—and the risk-reward of 59.9 offers asymmetry with 16.2% downside protection.
Nuclear Energy earned 5% allocation because its 52.9 category score, while ranking outside top-two, benefits from real asset sponsorship at plus 7 and AI growth sponsorship at plus 5, establishing dual tailwinds in a mixed macro environment. URA's 78.5 technical evidence scores powerfully despite thin participation at 0.58x twenty-day average—the setup works because nuclear sits at the intersection of energy transition and artificial intelligence cooling demand, creating a structural bid beneath commodity-like volatility. The macro fit of 50.0 sits neutral precisely because the category lacks a specific descriptor profile in the current framework, meaning technicals drive the allocation entirely. The 5% size reflects conviction in URA's momentum and trend strength without gambling on imminent breakouts—the chart sits coiled at 4.5% from the 50W in a middle-retracement zone that invites continued accumulation if the AI narrative persists. Escalation to 10% would require URA to break above 23.14 resistance on volume exceeding 1.5x, or for real asset sponsorship to tick higher as energy supply concerns intensify. Until those signals appear, URA holds as a conviction position riding structural demand trends rather than cyclical mean reversion.
Industrial Metals — COPX
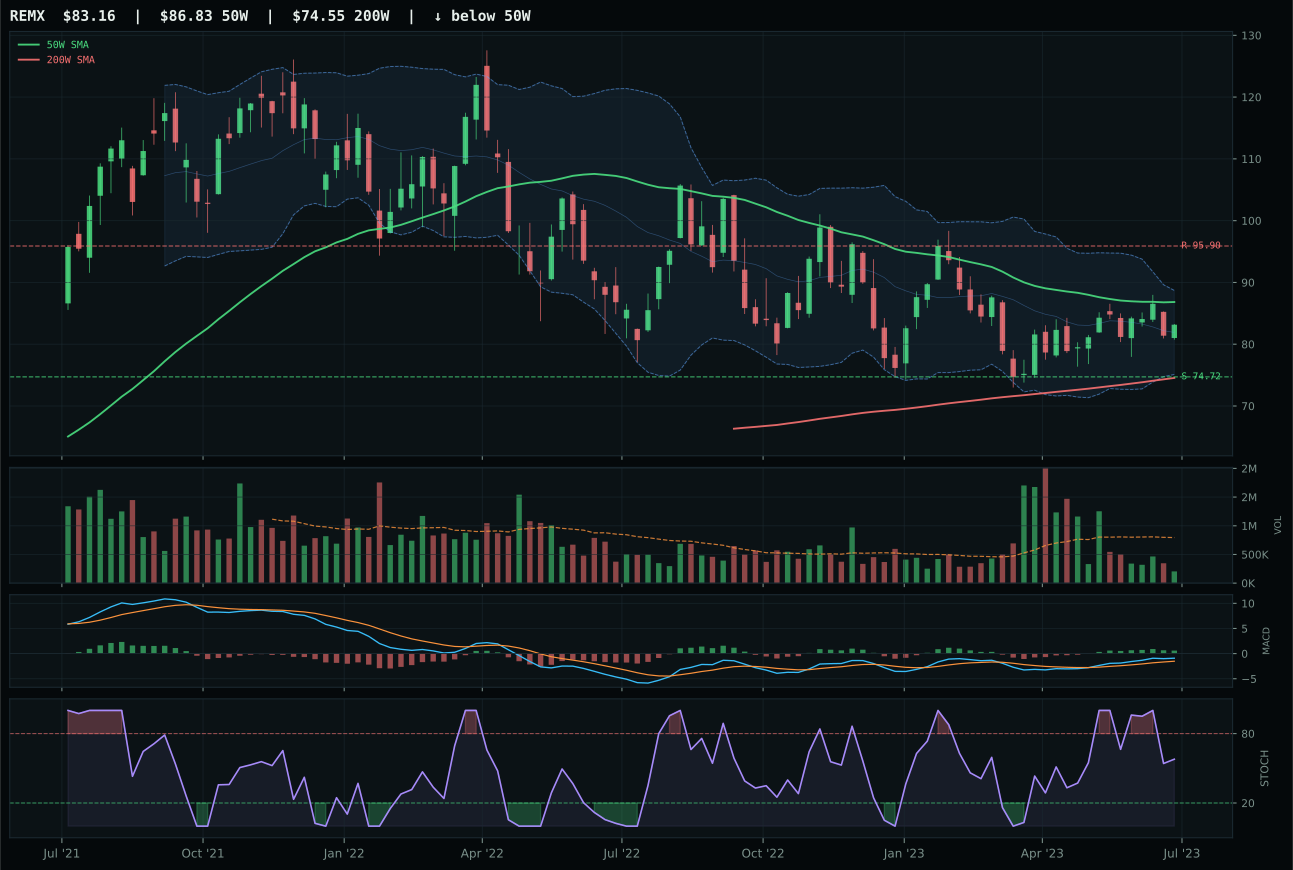
REMX has a neutral structure profile with -6.3% 13-week relative strength versus SPY.
A failed hold above support would weaken the setup.
Actionable but governed by invalidation levels.
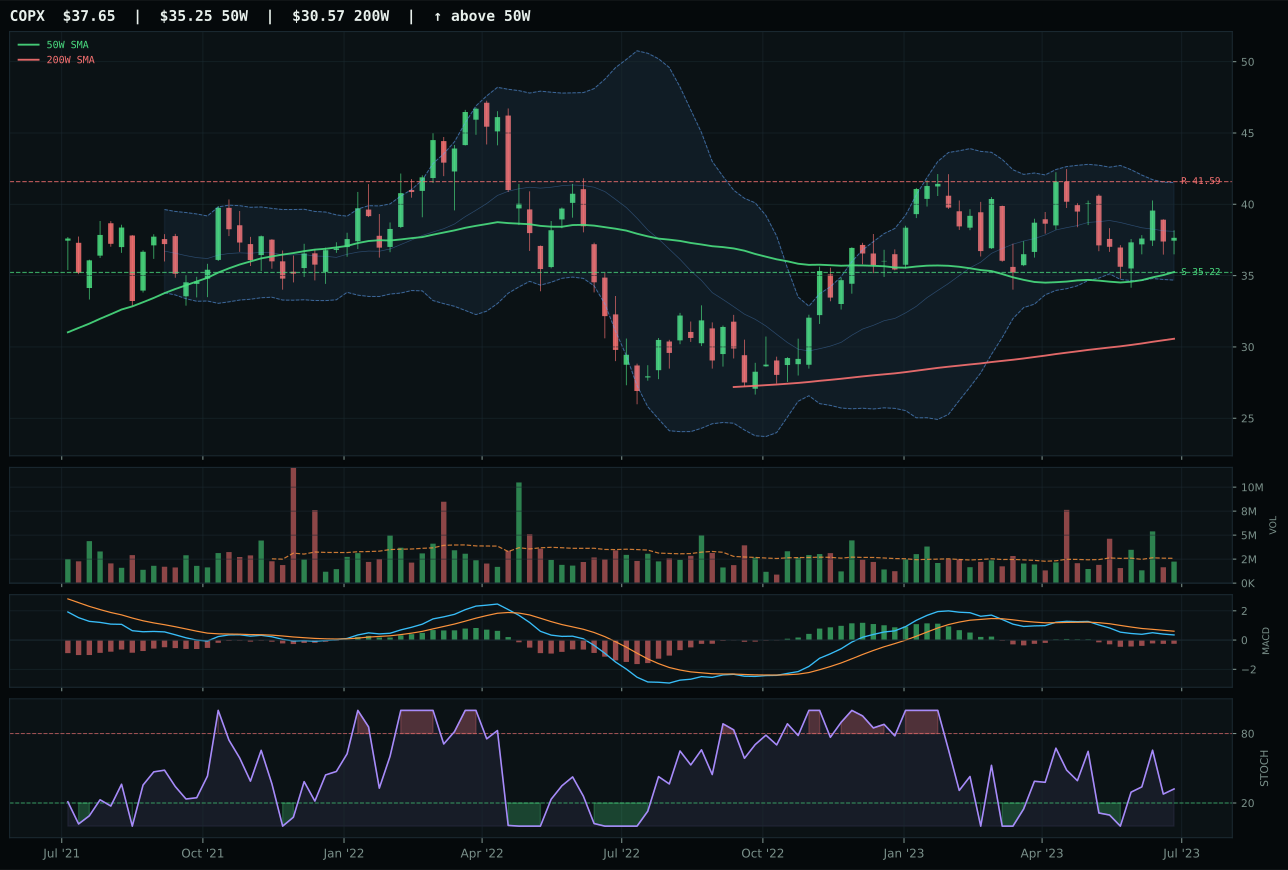
COPX has a neutral structure profile with -11.0% 13-week relative strength versus SPY.
A failed hold above support would weaken the setup.
Actionable but governed by invalidation levels.
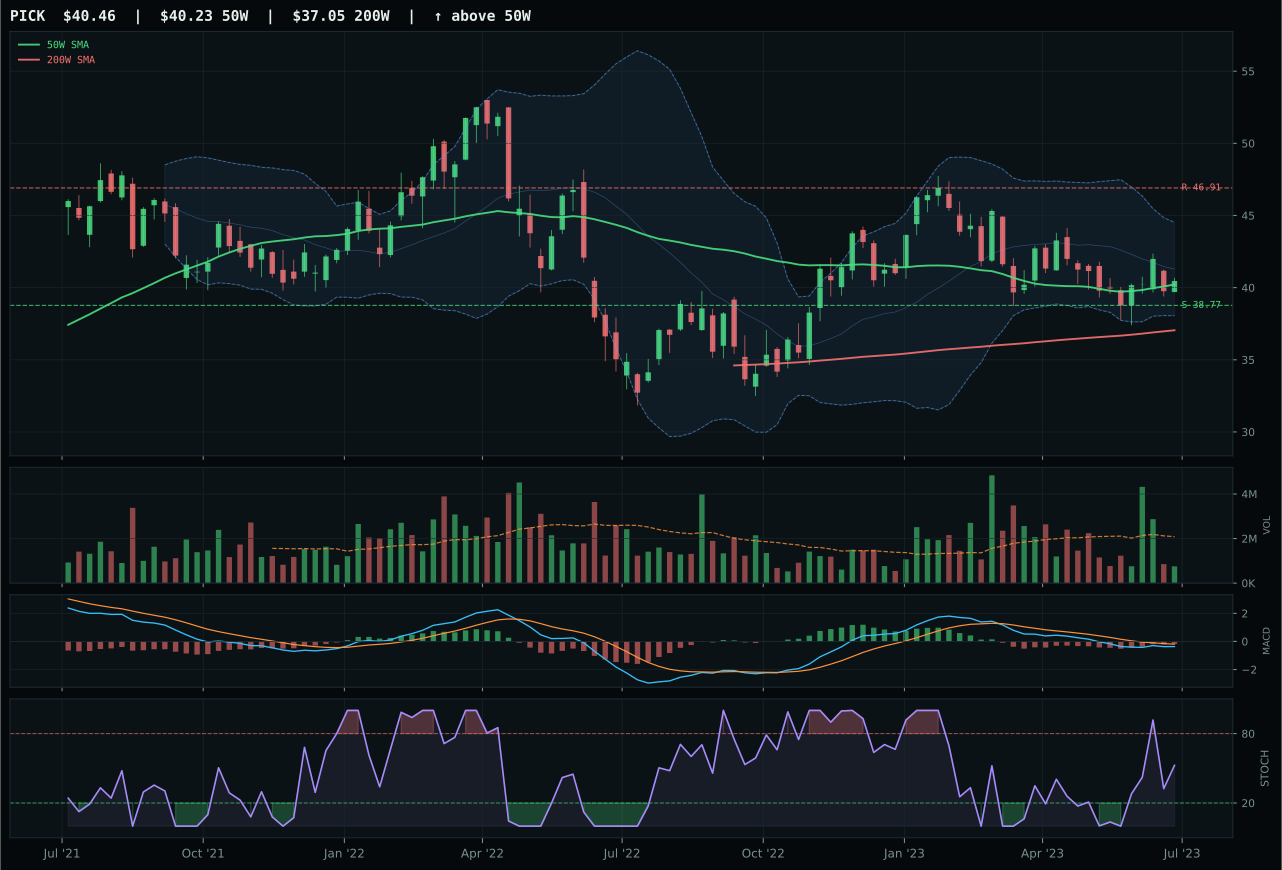
PICK has a pullback into support profile with -13.6% 13-week relative strength versus SPY.
A failed hold above support would weaken the setup.
Actionable but governed by invalidation levels.
COPX won by defending volume neutrality while exhibiting improving MACD and falling stochastic RSI, a technical combination that signaled potential accumulation even as price lagged SPY by 11.0% and returned -2.7% over 13 weeks. REMX's higher technical score of 60.9 and bullish-but-flattening MACD looked superior on the surface, yet its thin participation at 0.73x the 20W average proved decisive: money was not committed. COPX's neutral volume at 0.87x and falling stochastic at 0.32 suggest coiling rather than exhaustion. Price sits 6.8% above the 50W at upper retracement Fib 0.236, with risk-reward favoring downside protection at 69.7/100. The margin of victory was tight at 1.0 points, reflecting genuine category indecision about whether metals scarcity (active at +12) will drive allocations in a disinflation regime where copper demand is uncertain.
Industrial Metals earned 5% allocation despite a 52.7 category score ranking outside the top two because metals scarcity blazed through at plus 14 and commodity breadth positive at plus 10, giving the category a 65.0 macro fit that rivals the strongest categories. Real asset sponsorship added another plus 6, creating a structural tailwind that carries COPX even with weak technical evidence of 55.9. Liquidity and credit stress drag the category down by minus 8 and minus 7 respectively, but the upside macro case is specific: copper supply constraints from mining depletion and energy transition demand create a structural supply-demand imbalance independent of business cycle timing. COPX's neutral structure and minus 11 SPY relative strength mean this is a value trade, not a momentum conviction—the portfolio allocates because the risk-reward at 70 favors downside protection over upside capture. Doubling to 10% would require COPX to break above 41.59 resistance on volume exceeding 1.5x, or for the macro tailwinds to strengthen further (metals scarcity could tick to plus 16 if supply disruption narratives escalate). Until that change, 5% reflects the conviction that scarcity-driven structural mismatch will eventually overcome near-term demand weakness.
Defense & Aerospace — XAR
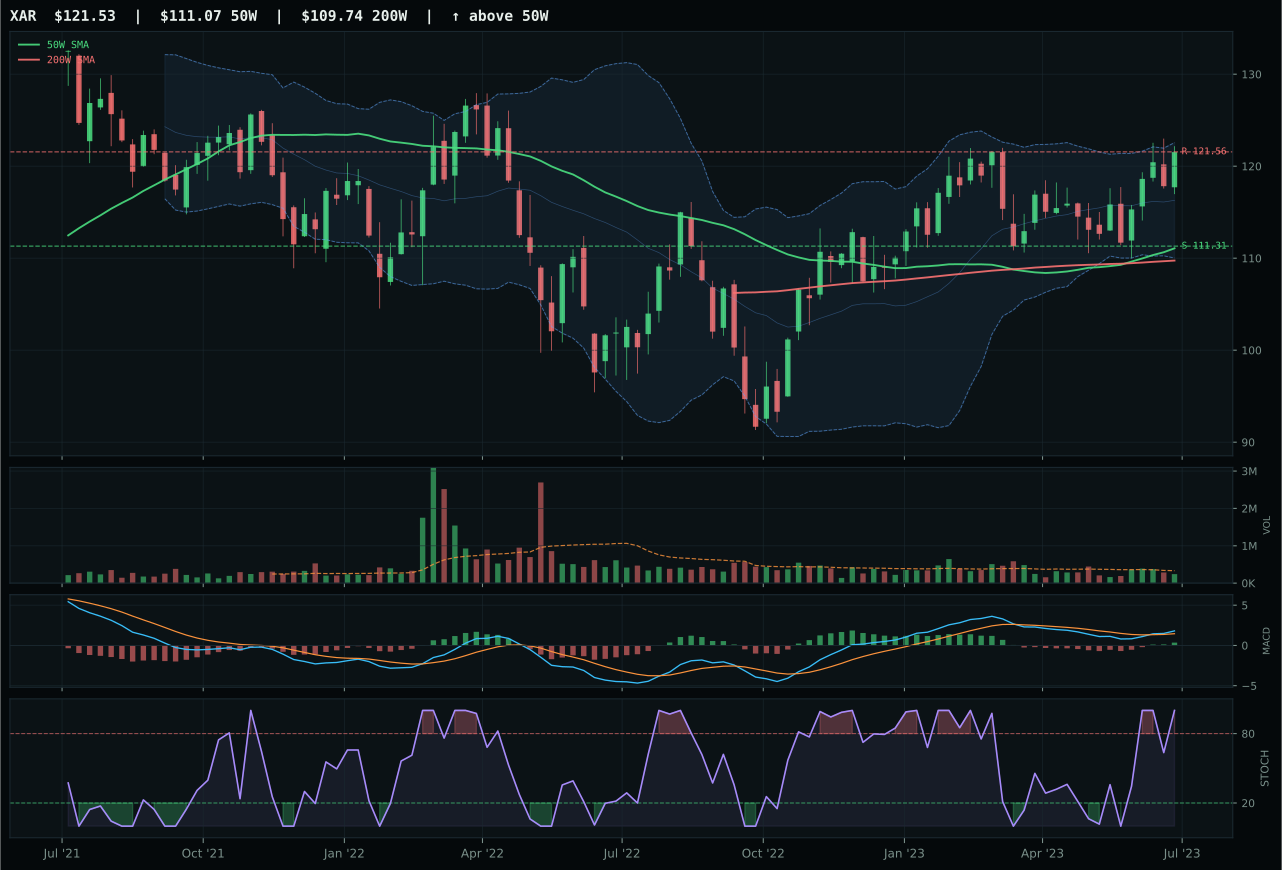
XAR has a neutral structure profile with -4.3% 13-week relative strength versus SPY.
A failed hold above support would weaken the setup.
Actionable but governed by invalidation levels.
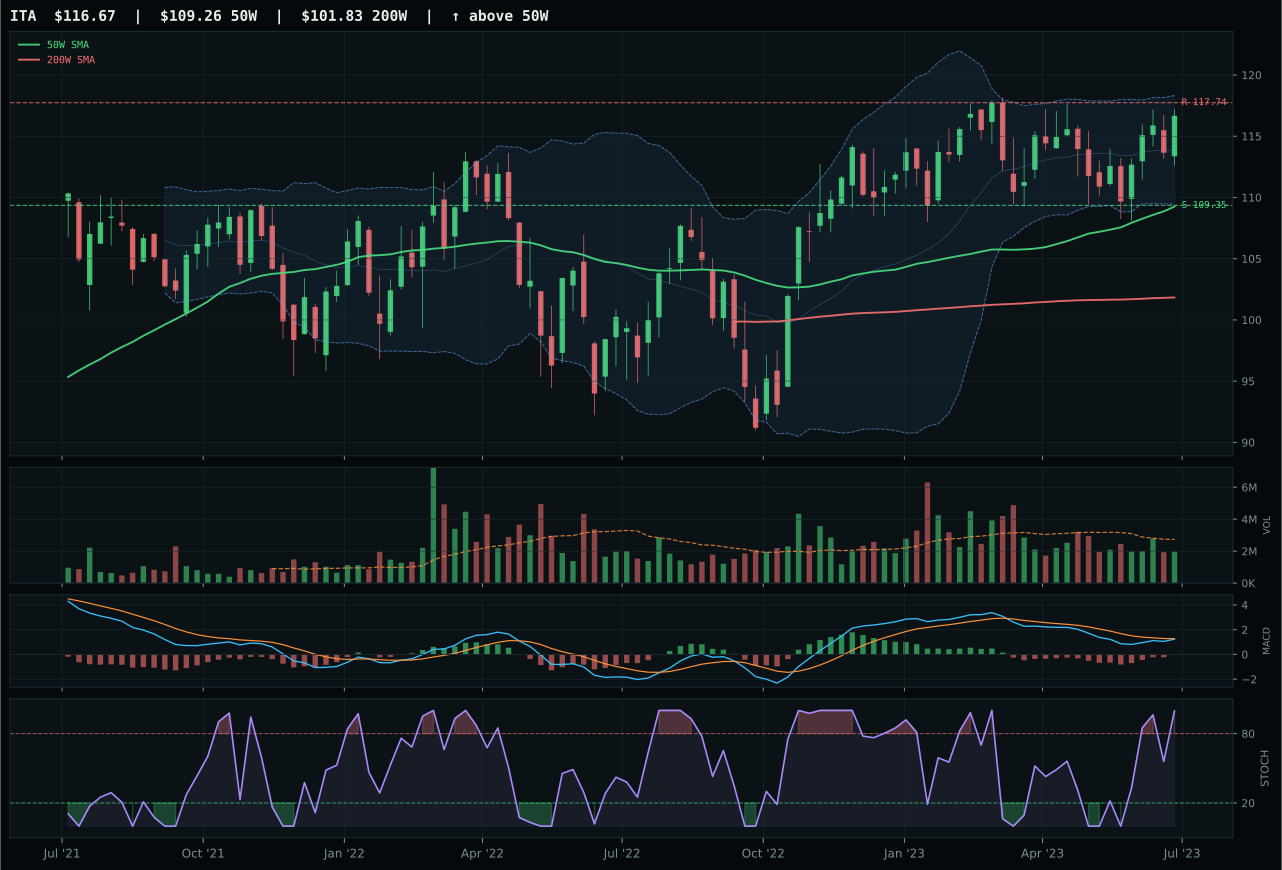
ITA has a neutral structure profile with -6.9% 13-week relative strength versus SPY.
A failed hold above support would weaken the setup.
Actionable but governed by invalidation levels.
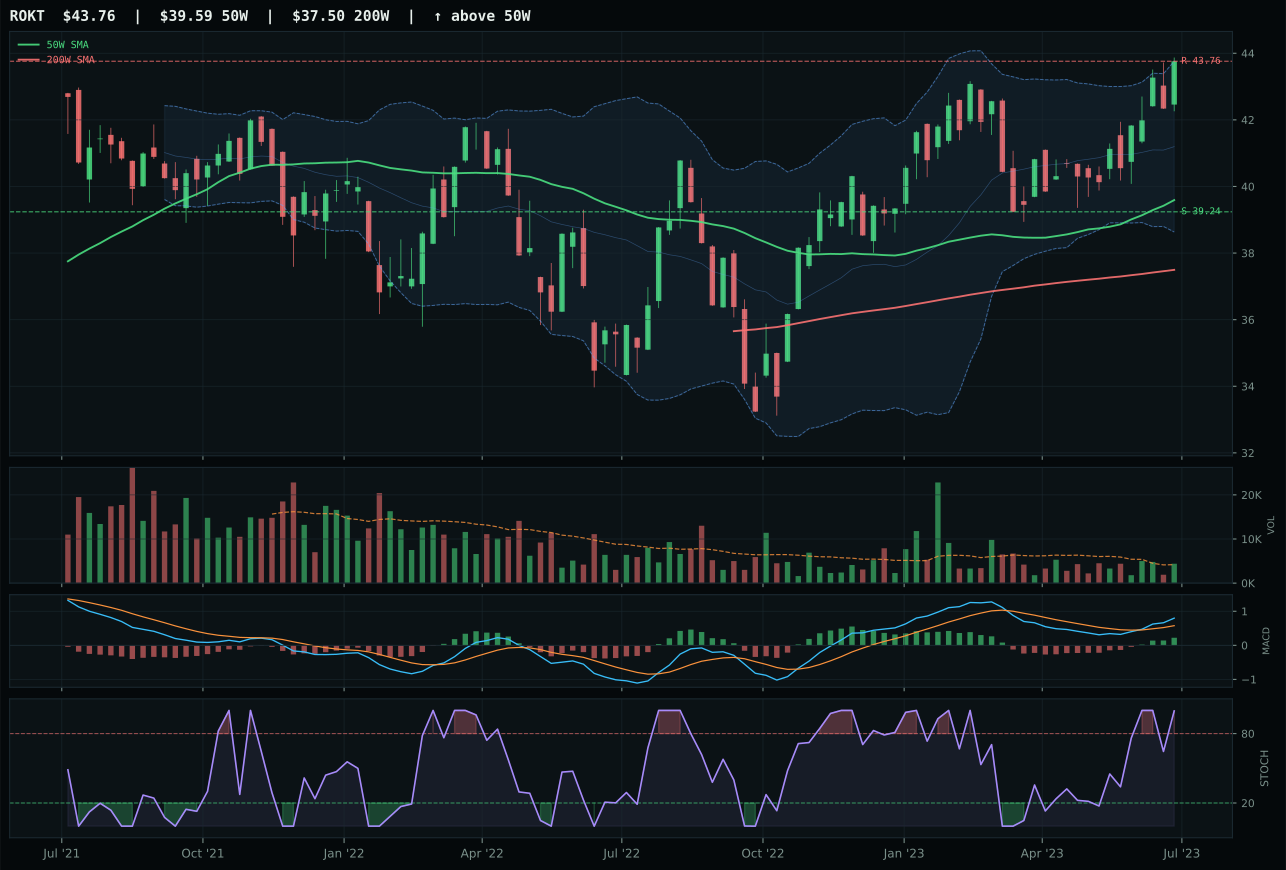
ROKT has a neutral structure profile with -1.1% 13-week relative strength versus SPY.
A failed hold above support would weaken the setup.
Tracked, but not top-2 eligible because: .
XAR won through technical consistency and positive MACD divergence, even as both it and ITA languish in a structurally weak category dominated by negative SPY-relative performance. Price sits 9.4% above the 50W in a neutral structure setup with overbought stochastic RSI, yet XAR's MACD is bullish and improving—ITA's MACD is still bearish despite improvement, a critical distinction in a mean-reversion environment. Category-relative strength of 0.0% versus ITA's -2.6% reflects modest but meaningful participation preference. The risk-reward is tight at 37.0/100: only 0.0% upside to resistance and 9.2% downside to support make this a binary setup where timing matters more than thesis. Volume at 0.73x the 20W average signals thin institutional interest, which argues for smaller allocation despite the win—this is the category saying 'defense is intact, but not yet attractive.'
Defense & Aerospace earned 5% allocation as a tactical position despite a 48.0 category score that ranks below most peers because the macro environment offers neither tailwind nor crushing headwind. Liquidity stress subtracts 4 points but credit stress actually adds 2, creating a balanced short-term setup. Technical evidence at 63.6 for XAR beats the category baseline, but the real reason to hold rather than exit: geopolitical risk appetite and durability-focused allocators may rotate here during growth slowdowns, and the chart shows no invalidating breakdown—it merely sits in neutral territory waiting for catalysts. A five-percentage-point move higher would require either category-level macro fit to strengthen above its current 51.0, or XAR to break above its 121.56 resistance on accumulation volume. The position survives as core holdings deserve 5% allocated to non-consensus themes with intact technicals.
Utilities & Infrastructure — PAVE
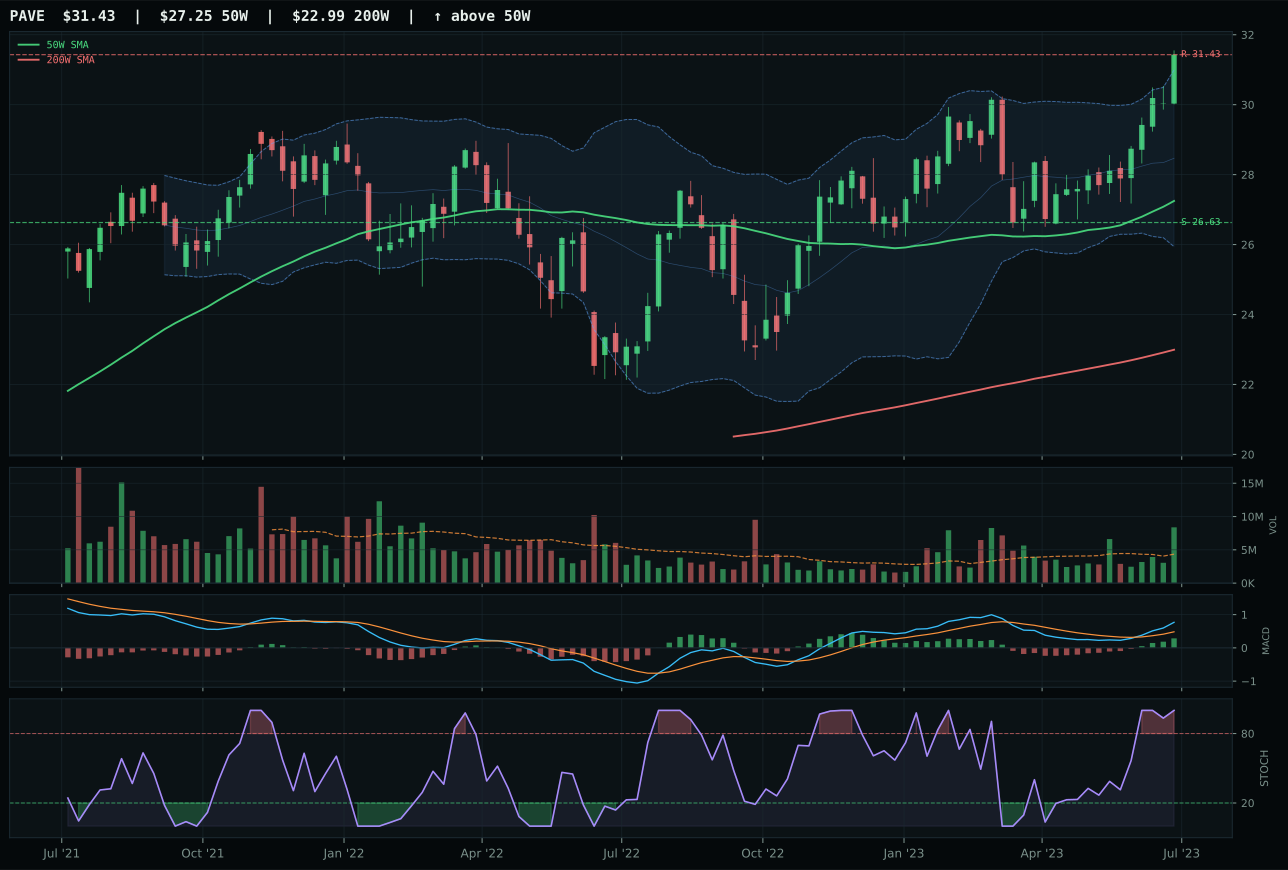
PAVE has a vertical extension profile with 2.6% 13-week relative strength versus SPY.
A failed hold above support would weaken the setup.
Actionable but governed by invalidation levels.
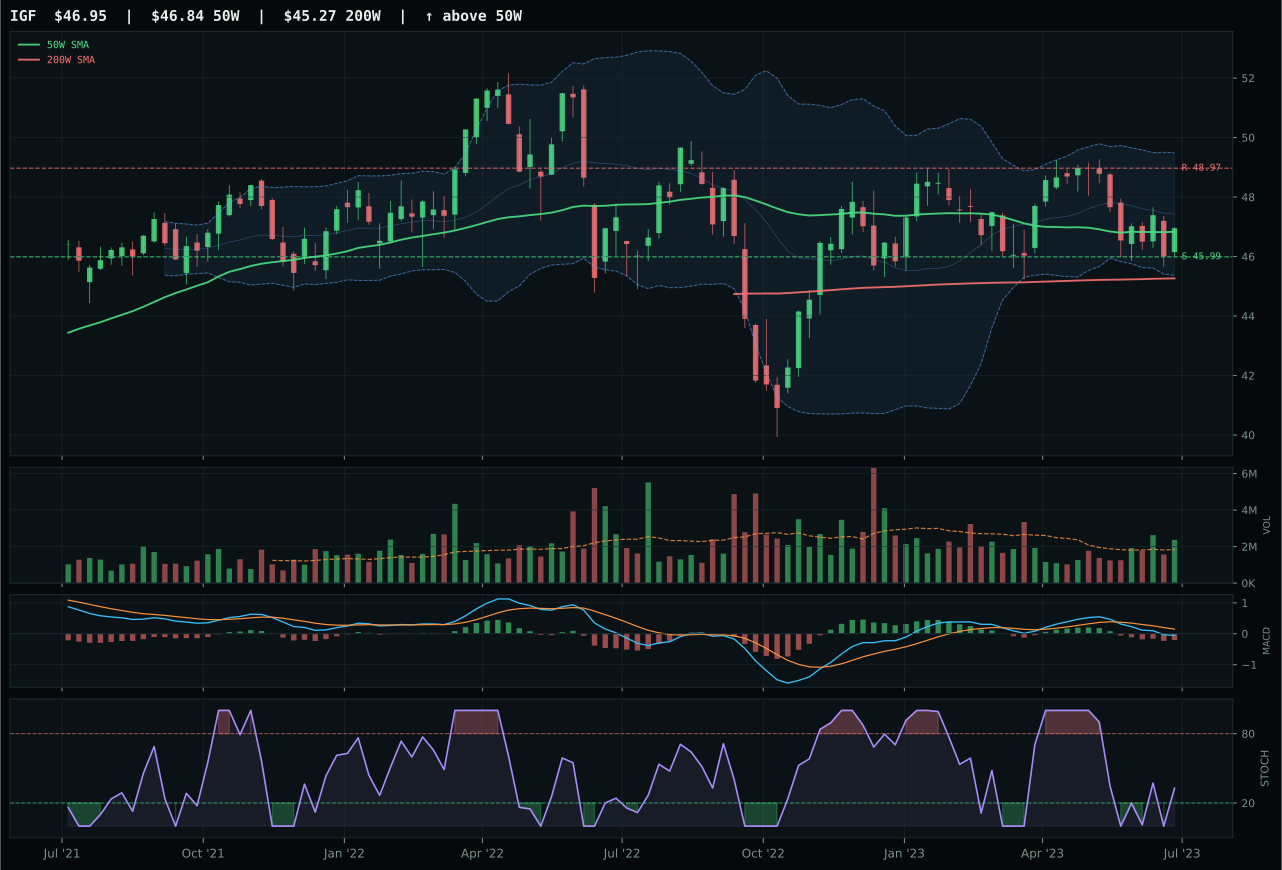
IGF has a pullback into support profile with -9.9% 13-week relative strength versus SPY.
A failed hold above support would weaken the setup.
Actionable but governed by invalidation levels.
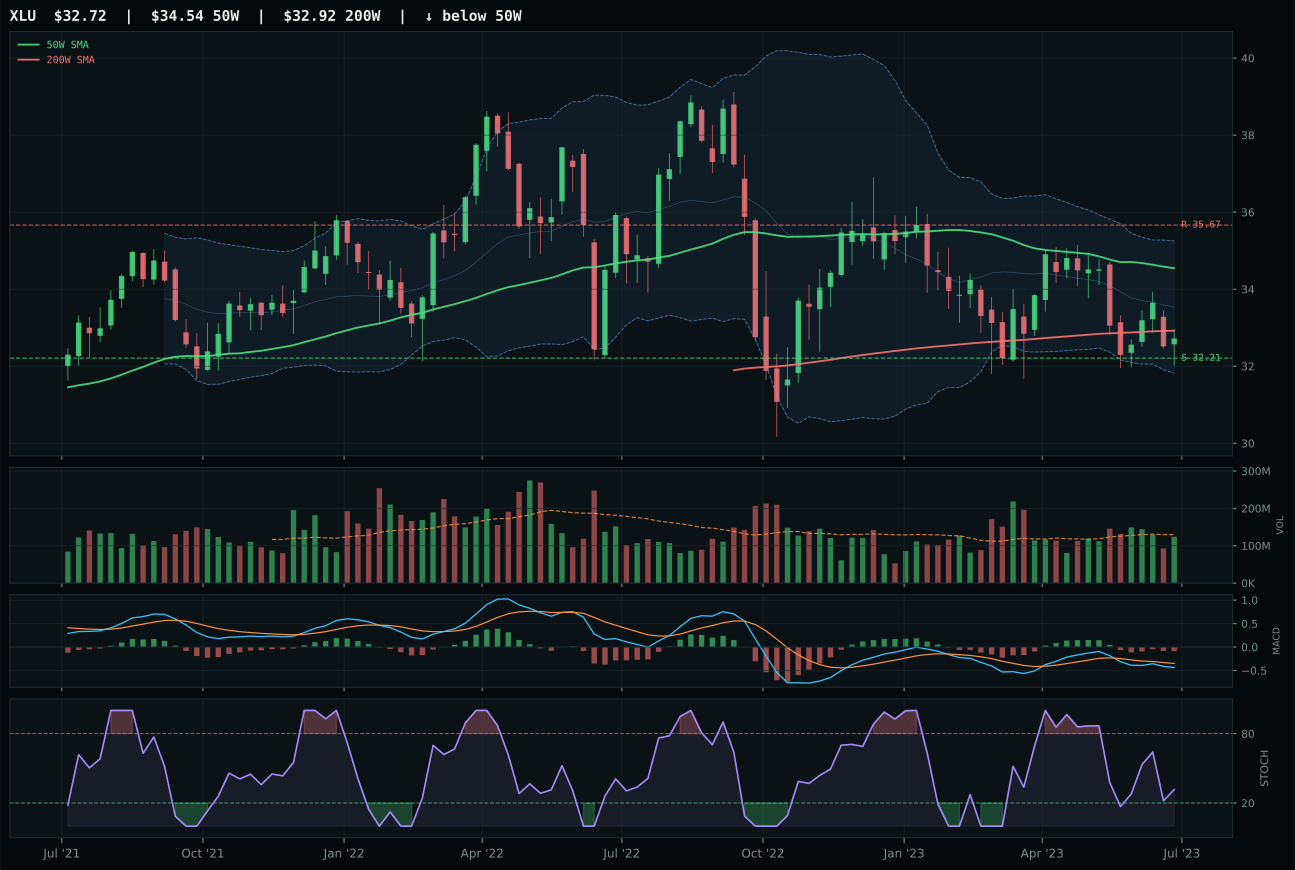
XLU has a pullback into support profile with -11.6% 13-week relative strength versus SPY.
A failed hold above support would weaken the setup.
Actionable but governed by invalidation levels.
PAVE dominated the Utilities & Infrastructure category with perfect trend scores at 100.0 and perfect momentum confirmation at 100.0, backed by accumulation volume at 1.93x the 20W average that proved decisive over IGF's deteriorating technicals and XLU's structural weakness. The setup is vertical extension at 15.4% above the 50W, which normally signals entry risk, yet PAVE's volume-price confirmation at 90.4 and persistence at 90.4 show every new buyer is being funded by fresh institutional capital—this is not a retail chase. MACD is bullish and improving, stochastic RSI is overbought momentum at 1.00, and category-relative strength of 12.4% crushes IGF's 0.0%, signaling capital rotation toward domestic capex plays. Structure is cleanest at 85.7 versus IGF's 78.5, and risk-reward favors PAVE's controlled downside at 18.0% versus IGF's 19.0%. The timing penalty of 37.0 reflects legitimate extension concerns, yet it's the only Achilles heel in an otherwise commanding technical setup.
Utilities & Infrastructure earned 5% allocation with PAVE as representative because disinflation regime actively helps the category at plus 7 while the transition/mixed macro theme adds another plus 4, generating 62.0 category macro fit that supports defensive positioning. PAVE's 100.0 technical evidence score is a portfolio rarity—the combination of trend 100, momentum 100, and volume-price confirmation 90.4 creates a technical setup with near-zero doubt in the current environment. The 15.4% extension above the 50W is not a reason to reject this position but rather confirmation that institutional capital has already committed; the risk-reward at 50 allows for upside participation while defending downside at 18% support depth. The portfolio allocates 5% here because the macro match—disinflation rewarding stable cash flows and capex beneficiaries—aligns with technical strength in the one domestic infrastructure ETF showing acceptance of higher prices. Elevation to 10% would require PAVE to reset toward the 50W to eliminate entry risk, or for the macro tailwinds to strengthen further as fixed-income yields stabilize lower. Until those catalysts appear, the 5% position captures conviction that infrastructure benefits from rate normalization without overcommitting to a stretched technical setup.
Precious Metals — GLD
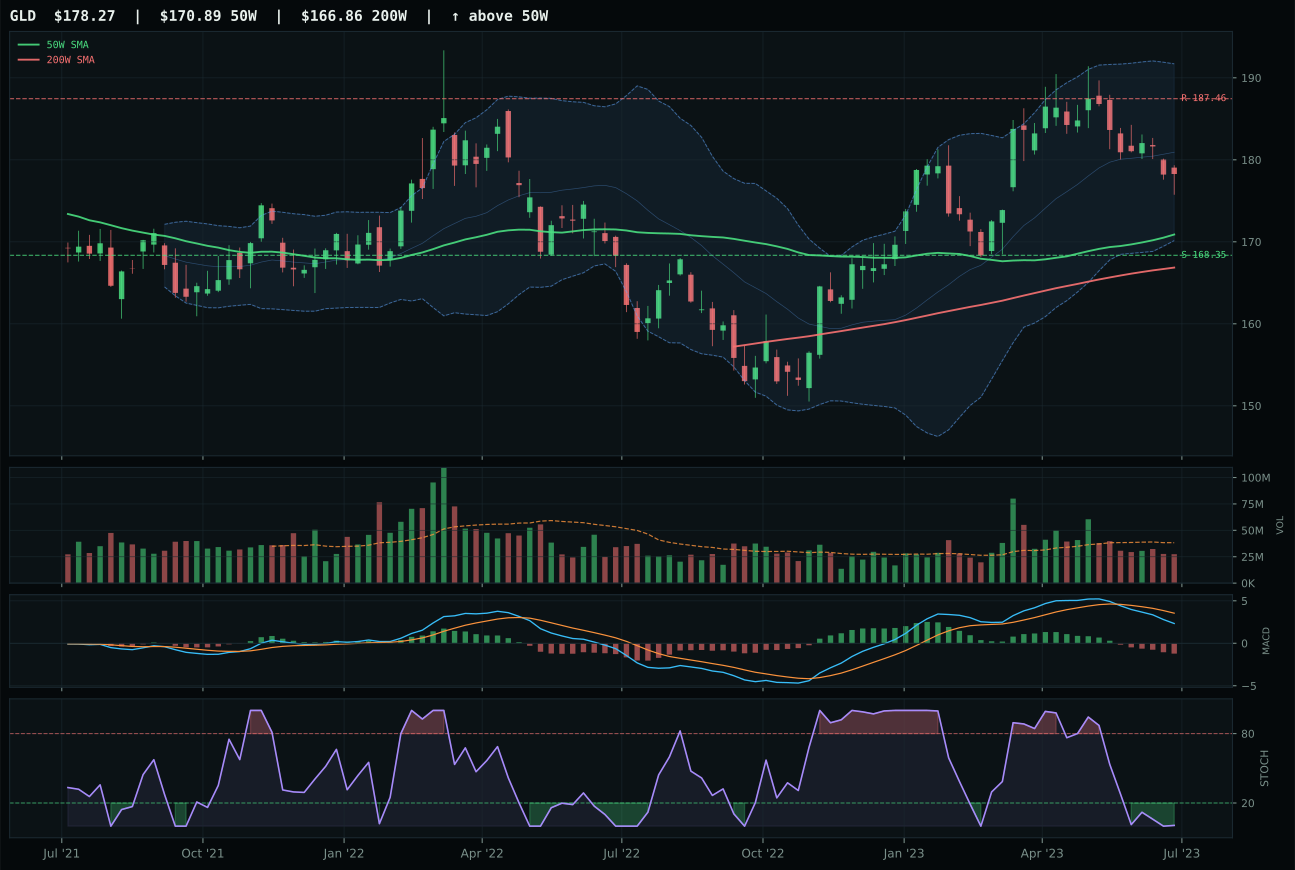
GLD has a neutral structure profile with -11.0% 13-week relative strength versus SPY.
A failed hold above support would weaken the setup.
Actionable but governed by invalidation levels.
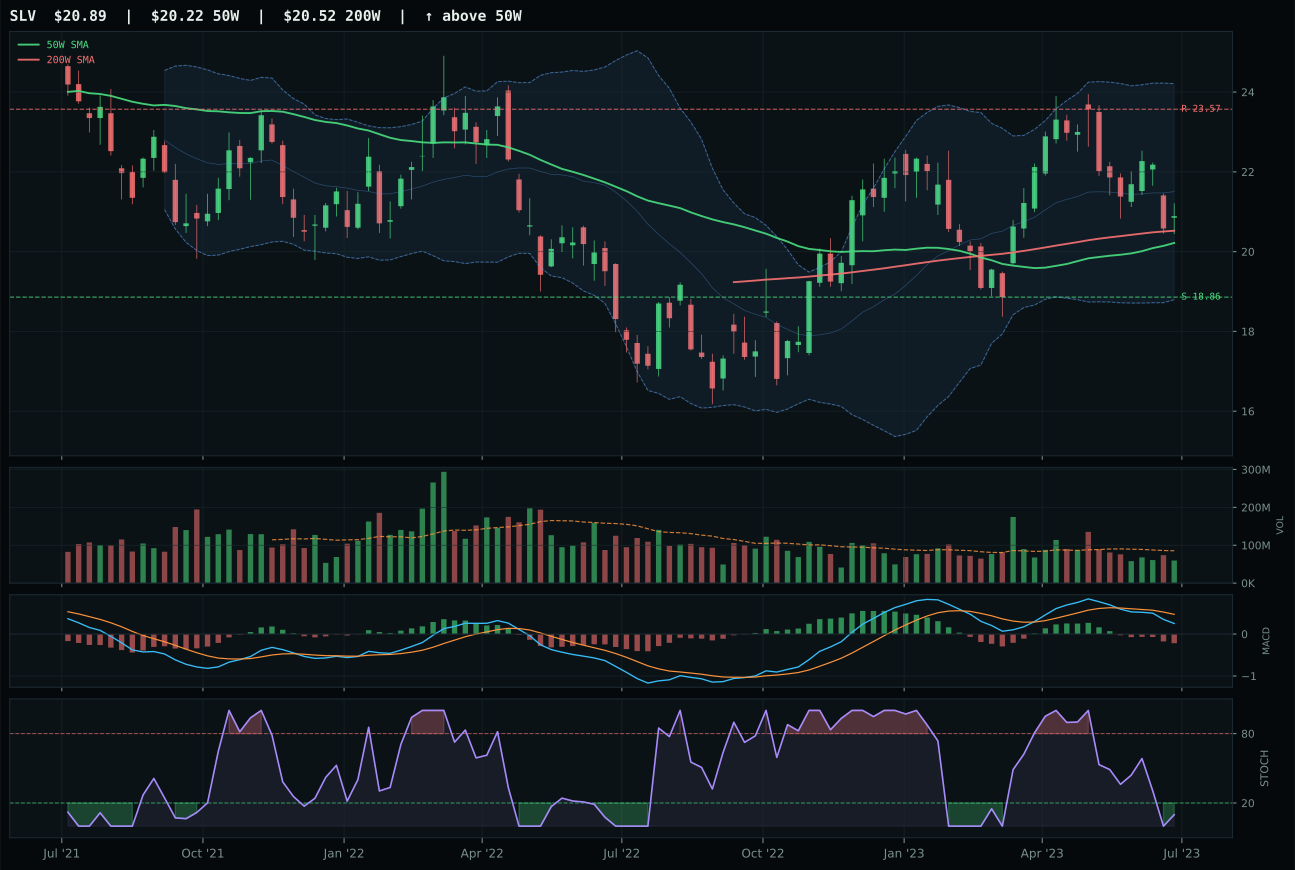
SLV has a neutral structure profile with -13.8% 13-week relative strength versus SPY.
A failed hold above support would weaken the setup.
Actionable but governed by invalidation levels.
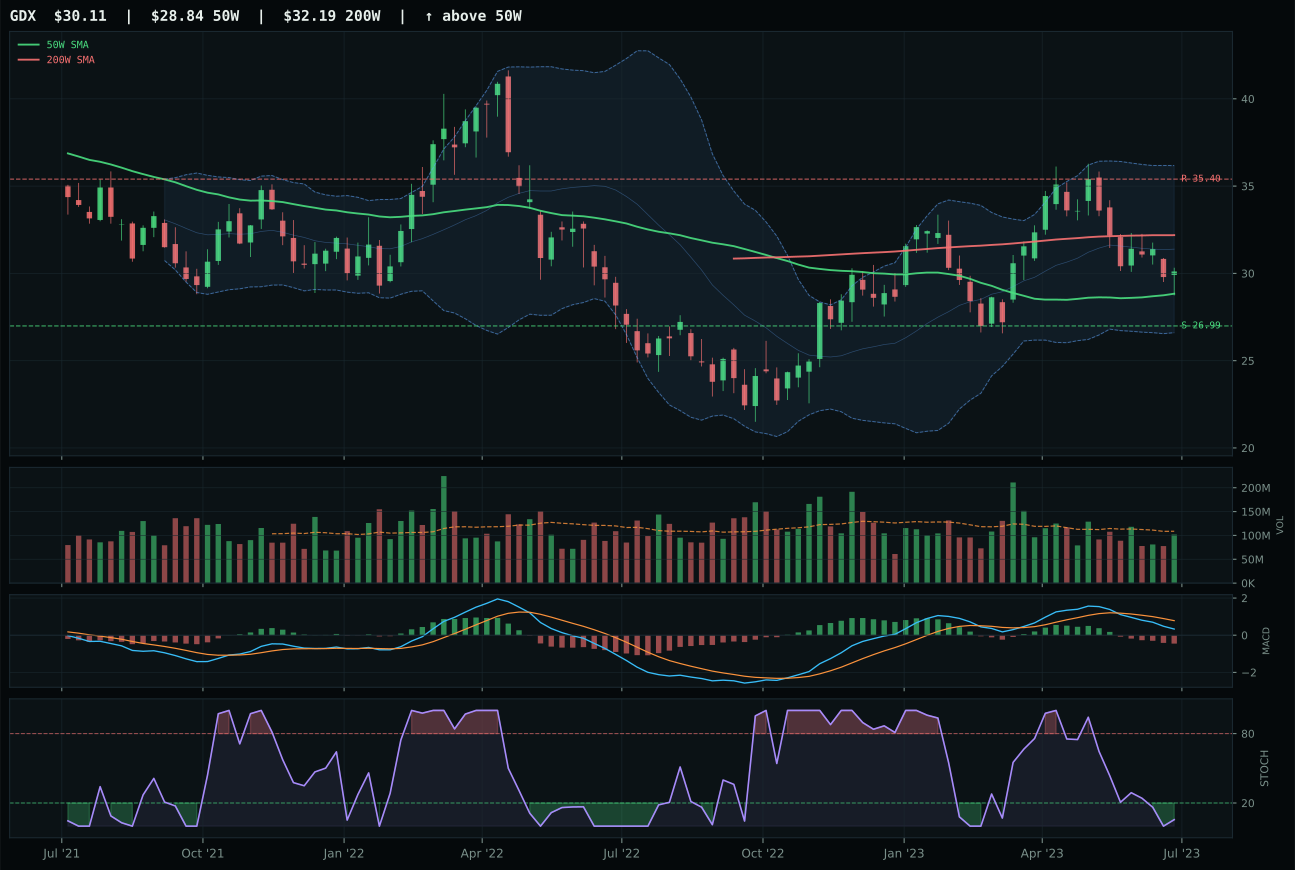
GDX has a neutral structure profile with -15.2% 13-week relative strength versus SPY.
A failed hold above support would weaken the setup.
Actionable but governed by invalidation levels.
GLD won a tight race against SLV by defending its category-relative strength advantage at 2.9% and maintaining marginally cleaner structure at 69.1 versus 68.7, a barely-there edge in a category where both are structurally weak. Price is 4.3% above the 50W in neutral structure, sitting at Fib 0.382 with oversold stochastic RSI at 0.01—a textbook value zone where momentum traders are scarce but patient capital might nibble. MACD is bearish and weakening, the momentum confirmation score is a feeble 11.4, and volume is thin at 0.72x the 20W average. GLD's 13W return of -2.7% versus SLV's -5.6% shows relative outperformance, yet this is not recovery—it's triage. The -11.0% SPY-relative strength tells the story: gold is underperforming during a risk-on regime, and the only reason to hold it is insurance premium, not alpha capture.
Precious Metals earned 5% allocation despite weak absolute score of 39.2 because disinflation benefits precious metals structurally, adding 8 points of macro support and disinflation pressure another 6 points. These macro tailwinds elevate category reasoning to 60.0 fit, enough to justify a defensive allocation in a regime where inflation risk has collapsed and central banks may hold rates steady longer than equity investors expect. GLD's 35.7 technical evidence is poor—momentum confirmation near zero, volume thin participation, MACD deteriorating—but that combination creates value opportunity if the macro assumptions hold. The metals cannot advance far until oversold conditions prove unsustainable, meaning the position is sized small (5%) to reflect low near-term momentum while preserving exposure to a disinflation hedge. Elevation to 10% would require either institutional accumulation volume (currently 0.72x thin) to exceed 1.2x twenty-day average, or GLD to break above its 187.46 resistance on expanding volume—signals that smart money is front-running further rate cuts. Until then, 5% holds optionality without overcommitting to a technically wounded category.
Agriculture & Livestock — MOO
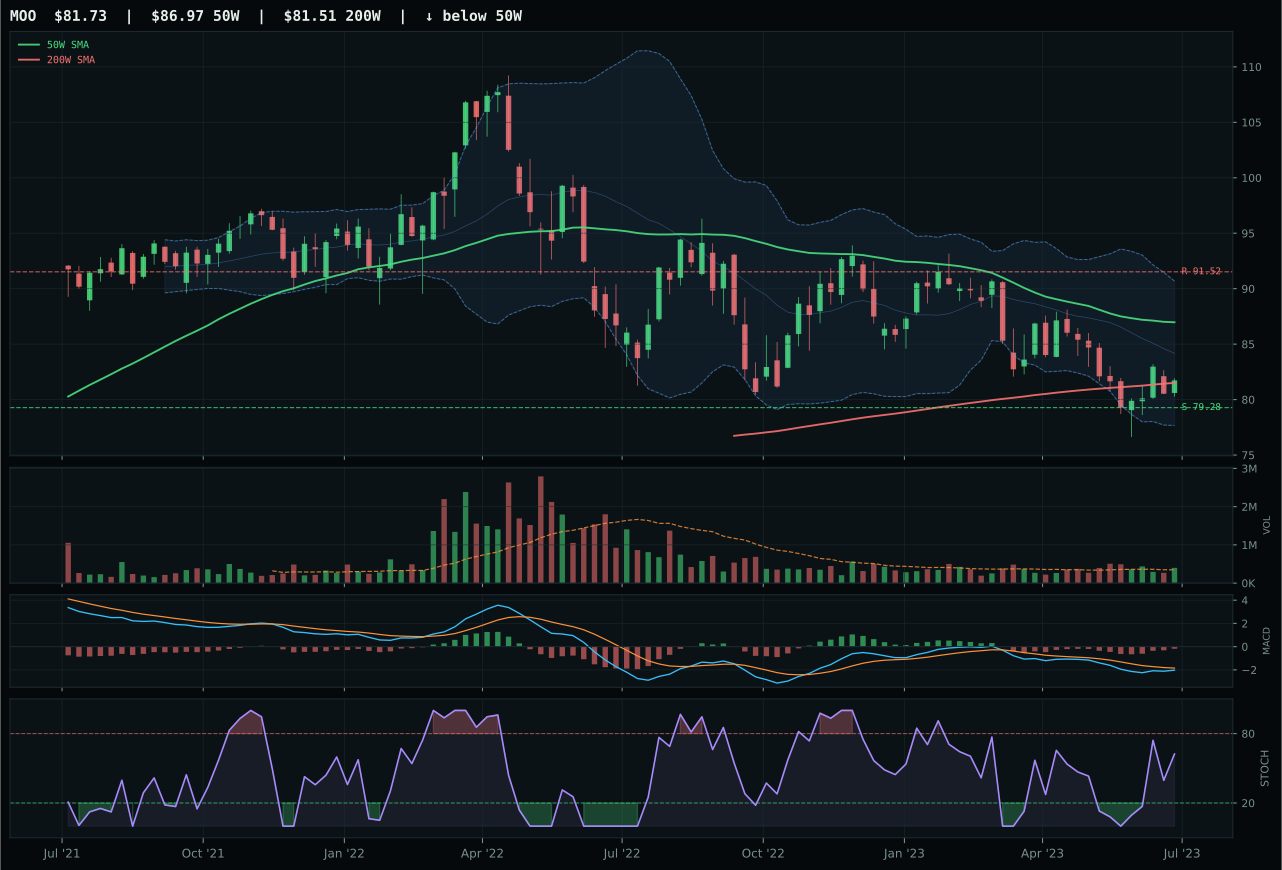
MOO has a pullback into support profile with -14.2% 13-week relative strength versus SPY.
A failed hold above support would weaken the setup.
Actionable but governed by invalidation levels.
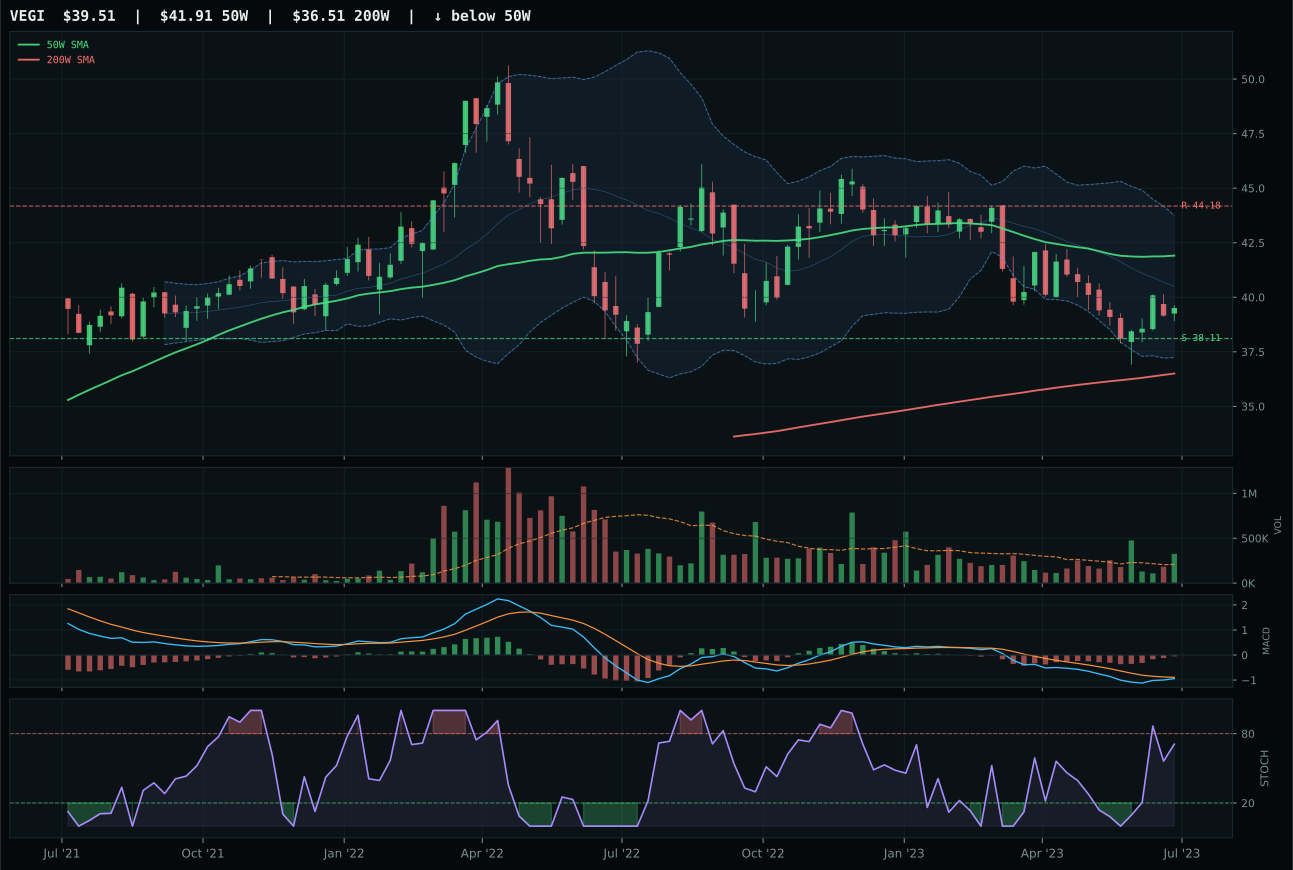
VEGI has a pullback into support profile with -14.4% 13-week relative strength versus SPY.
A failed hold above support would weaken the setup.
Tracked, but not top-2 eligible because: .
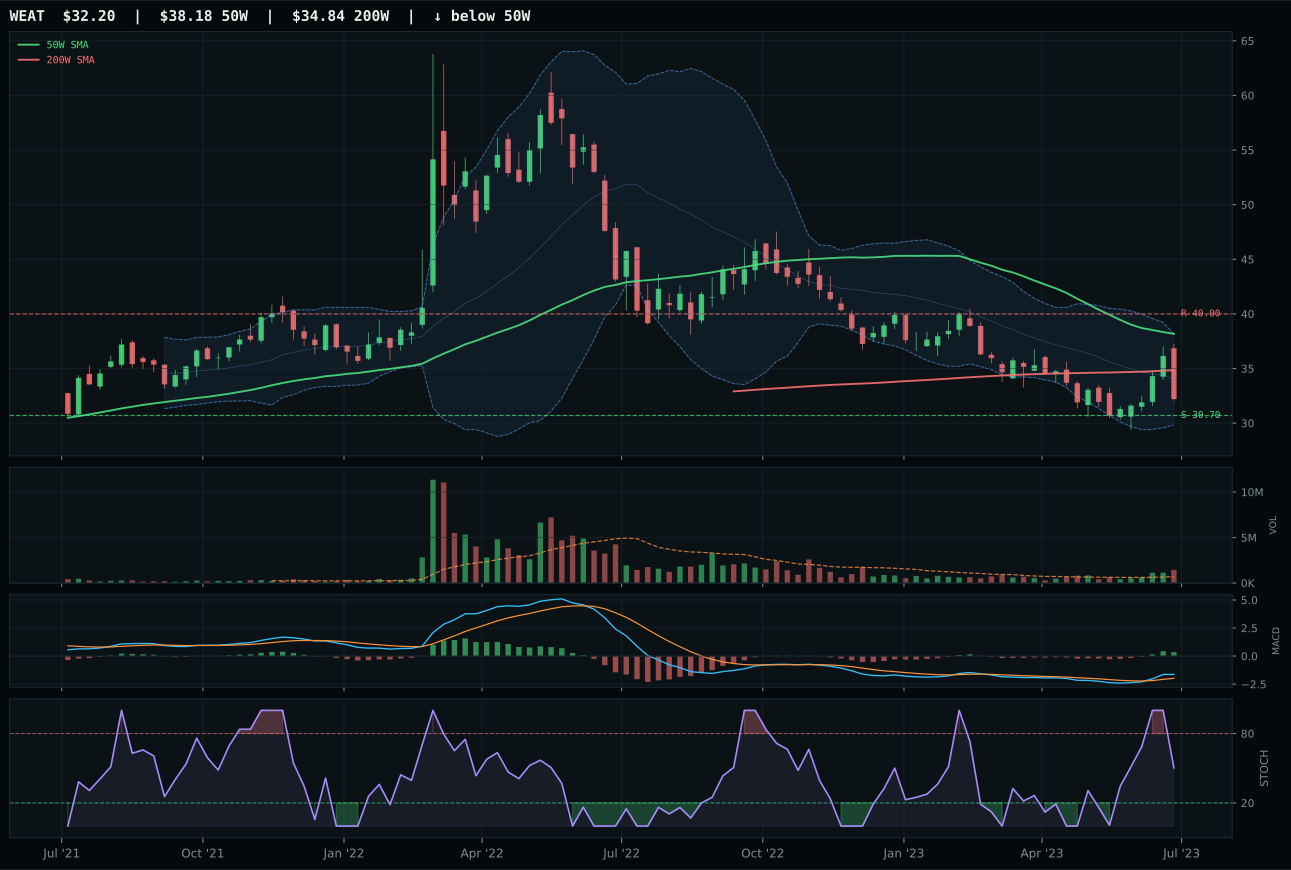
WEAT has a pullback into support profile with -17.1% 13-week relative strength versus SPY.
A failed hold above support would weaken the setup.
Actionable but governed by invalidation levels.
MOO won a deeply challenged category by positioning as the least-bad reset candidate in a macro environment hostile to commodities. Price is 6.0% below the 50W but still above the 200W, creating a defined pullback-into-support setup with 98.0/100 risk-reward—massive asymmetry with only 3.1% downside to support at 79.28 and 10.7% upside to resistance despite near-term weakness. MACD is bearish but improving, stochastic RSI is rising mid-zone at 0.62: the chart is coiling, not cracking. VEGI lost despite superior volume confirmation (accumulation versus above-average participation) because MOO maintained positive category-relative strength at 0.2%, signaling that capital is rotating toward agribusiness equities over agriculture producers. The timing score of 100.0 reflects the setup's perfection—price is exactly where you want to buy if you believe in mean reversion, yet the category score of 21.1 reveals the market is not yet convinced.
Agriculture & Livestock earned zero allocation this week because its 21.1 category score ranks ninth or tenth, excluded entirely from the capital allocation grid. Disinflation actively hurts real assets by minus 6 points, and that macro headwind cascades through the entire category technical scoring. MOO's 56.2 reasoned ETF score cannot overcome the category-level macro fit of only 45.0, which reflects the mismatch between falling food inflation expectations and equity pricing in commodity producers. The category's pullback-into-support timing of 100 looks attractive in isolation, but it matters far less than the structural macro problem: commodity breadth positive adds plus 5 while disinflation pressure subtracts minus 8, leaving net negative bias. To return to allocation: either the inflation narrative must reverse, commodity breadth must show sustained institutional sponsorship beyond the current plus 5, or MOO must establish a clean breakout above 91.52 resistance on triple-digit volume to signal forced short-covering. Until one of those changes, capital is better deployed to categories where macro and technicals reinforce rather than oppose.
Traditional Energy — XOP
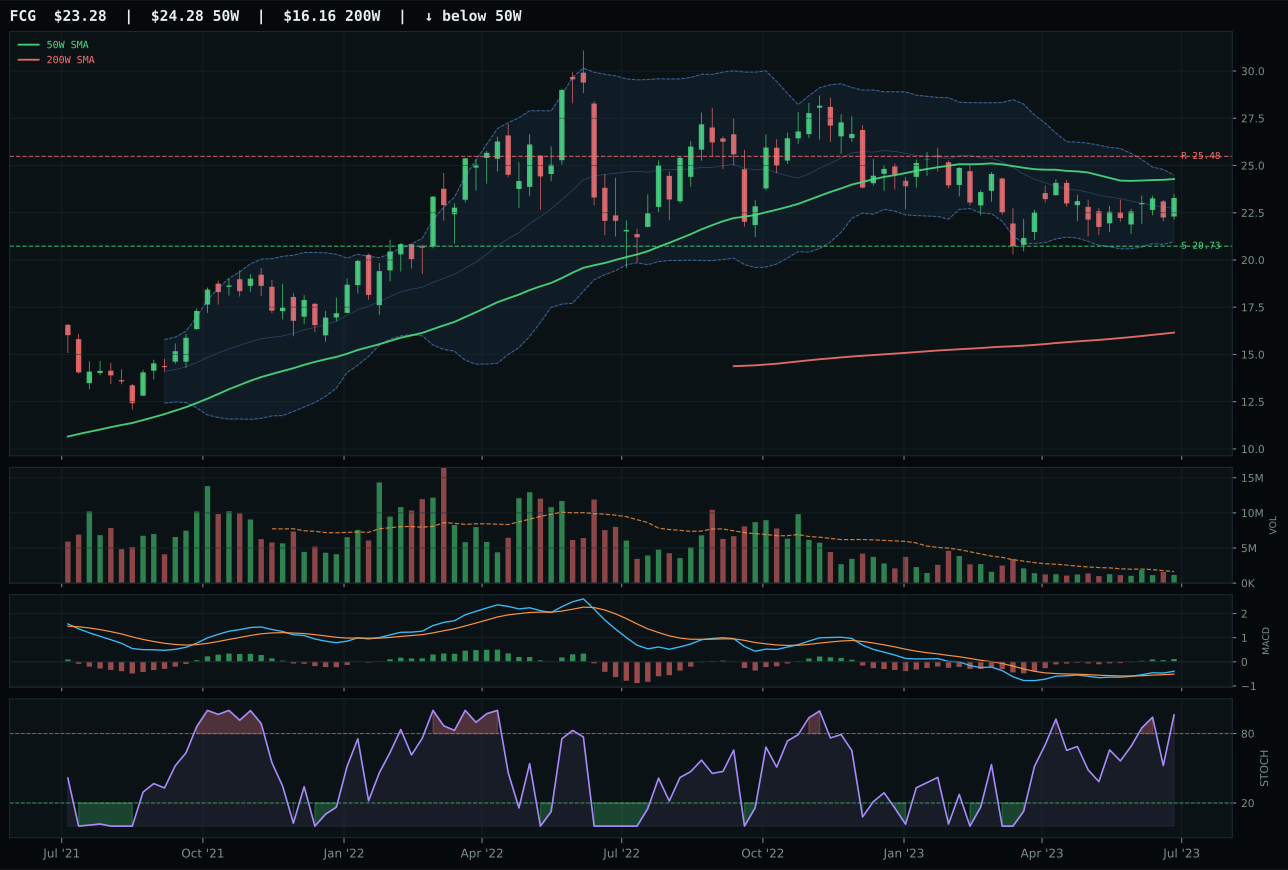
FCG has a neutral structure profile with -4.9% 13-week relative strength versus SPY.
A failed hold above support would weaken the setup.
Actionable but governed by invalidation levels.
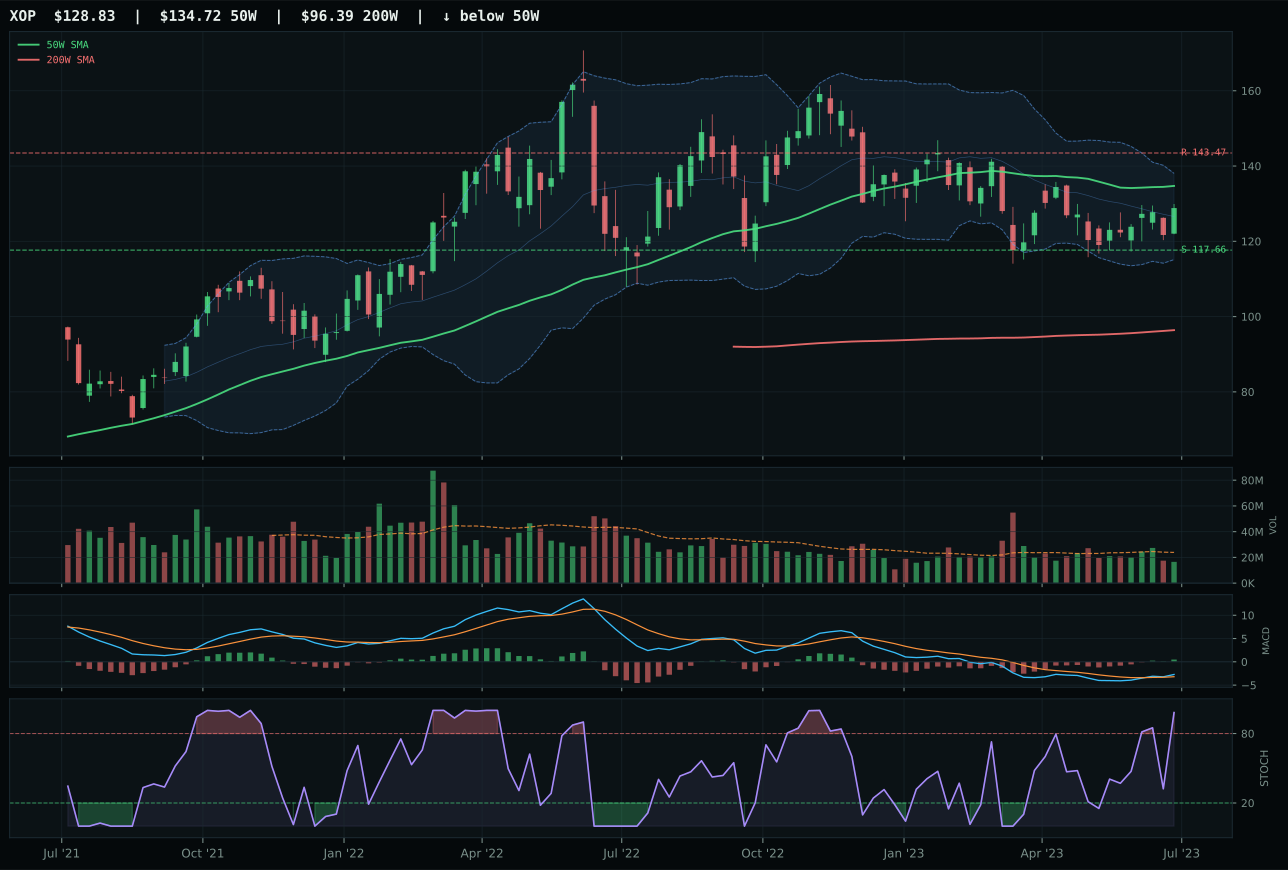
XOP has a neutral structure profile with -7.3% 13-week relative strength versus SPY.
A failed hold above support would weaken the setup.
Actionable but governed by invalidation levels.
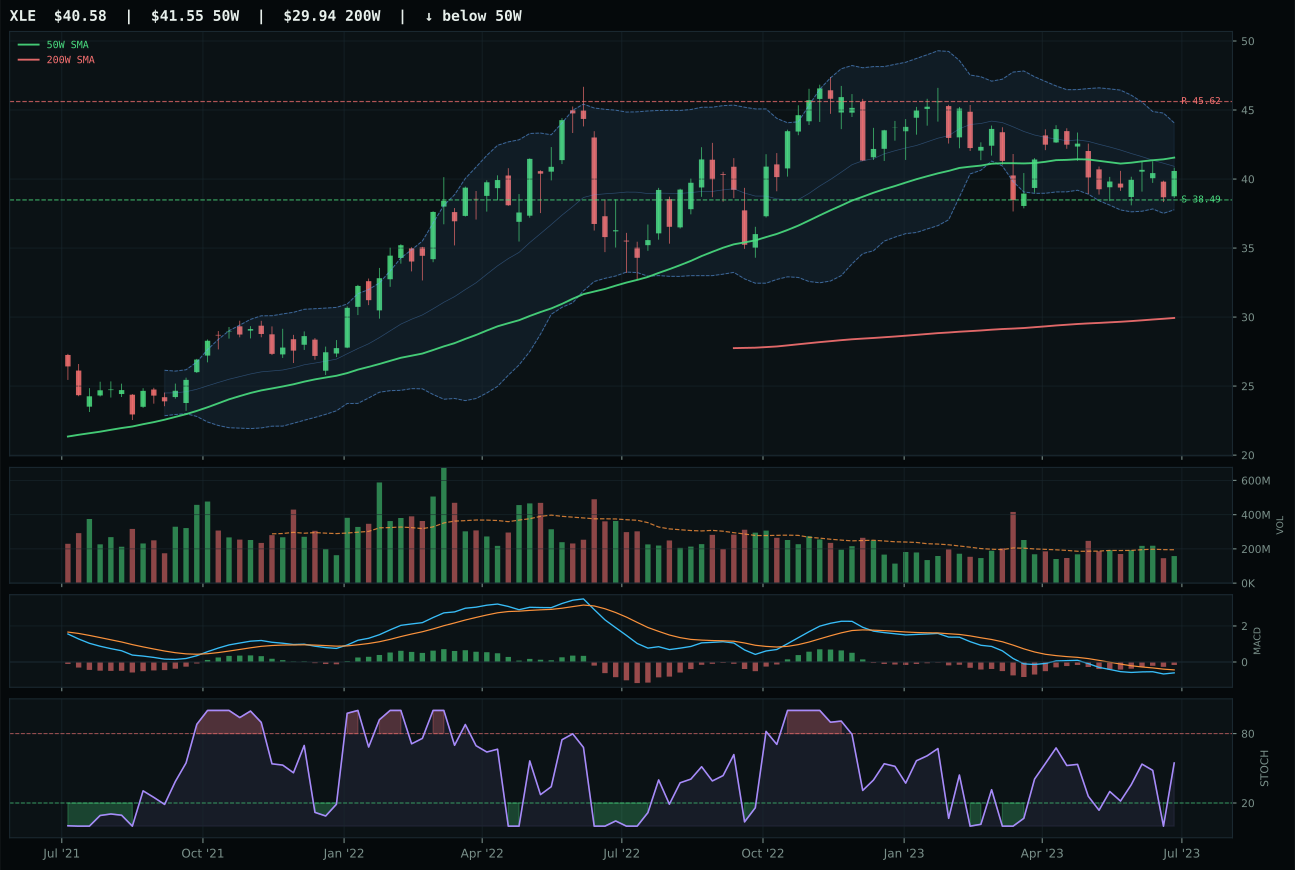
XLE has a compression near 50W profile with -10.3% 13-week relative strength versus SPY.
A failed hold above support would weaken the setup.
Actionable but governed by invalidation levels.
XOP won a category devastated by disinflation pressure, which subtracts 10 points and leaves the macro regime with a category fit of only 23.0/100—among the worst in the portfolio. XOP's technical edge is marginal: its timing score of 97.0 matches FCG, yet risk-reward of 72.3 beats FCG's 65.6, earning the representative slot despite FCG's stronger technical evidence at 72.1 versus 60.6. Price is 4.4% below the 50W in neutral structure, sitting at Fib 0.618 (middle retracement) with overbought stochastic RSI at 0.98 and bullish-improving MACD. The setup is textbook mean-reversion waiting to happen, yet neither XOP nor FCG offers conviction: 13W returns are feeble (1.0% and 3.4%), SPY-relative strength is negative across the board (-7.3% and -4.9%), and volume is thin. This is energy resting, not energy leading.
Traditional Energy earned zero allocation this week because disinflation as the macro regime actively punishes energy exposure minus 10 points, a direct hit that no technical recovery can overcome. The category-level macro fit collapsed to 23.0, the second-lowest on the board, because disinflation pressure subtracts another minus 10 while credit stress adds minus 7 and liquidity stress another minus 7. Real asset sponsorship barely registers at plus 7 against that tsunami of headwind. XOP's 60.6 technical evidence would normally earn a 5% position, but the category's macro reasoning is so negative that even the representative cannot justify allocation—the portfolio views energy as cyclically extended and structurally challenged by energy transition, making this a zero-touch category until inflation signals reappear. To return: either the disinflation narrative must reverse (requiring inflation data to surprise above expectations sustained over multiple reports), or crude oil must break above $85-$90 on demand signals that overwhelm supply-side weakness. The category sits on the sidelines as a complete exclusion, not a tactical underweight.