
2023-06-23
Informational purposes only. The content in this report, including allocations, analysis, and commentary, is provided solely for informational and educational purposes. It does not constitute financial advice, investment advice, trading advice, or any other type of advice. Past performance does not guarantee future results. Always conduct your own research and consult a qualified financial professional before making investment decisions.
Weekly Allocation
| Ticker | Category | Weight | Role |
|---|---|---|---|
| FBTC | 50% | Overlay | |
| AIQ | AI | 10% | Top-2 (10%) |
| URNM | Nuclear Energy | 10% | Top-2 (10%) |
| IGV | Technology | 5% | Tier-2 (5%) |
| COPX | Industrial Metals | 5% | Tier-2 (5%) |
| XAR | Defense & Aerospace | 5% | Tier-2 (5%) |
| XLE | Traditional Energy | 5% | Tier-2 (5%) |
| PAVE | Utilities & Infrastructure | 5% | Tier-2 (5%) |
| GLD | Precious Metals | 5% | Tier-2 (5%) |
Trade Instructions — Monday Open
Sell the tranche from 2023-05-26 (completing its 4-week hold). Buy the new tranche. Instructions show net portfolio changes — same-asset positions cancel, weight changes show the delta.
| Action | Ticker | Instruction |
|---|---|---|
| SELL | CIBR | Sell entire CIBR position (2.50% of portfolio) |
| SELL | SMH | Sell 29% of SMH position (reduce 8.75% → 6.25%) |
| SELL | INDA | Sell 50% of INDA position (reduce 2.50% → 1.25%) |
| SELL | URA | Sell 50% of URA position (reduce 2.50% → 1.25%) |
| BUY | IGV | Buy IGV — 16.67% of freed cash (adds 1.25% to portfolio) |
| BUY | URNM | Buy URNM — 33.33% of freed cash (adds 2.50% to portfolio) |
| BUY | COPX | Buy COPX — 16.67% of freed cash (adds 1.25% to portfolio) |
| BUY | AIQ | Buy AIQ — 33.33% of freed cash (adds 2.50% to portfolio) |
Current Portfolio After Trade
Combined holdings across all 4 active tranches. Each tranche is 25% of the portfolio.
| Ticker | % of Portfolio | Weight Bar |
|---|---|---|
| FBTC | 50.00% | |
| IGV | 7.50% | |
| SMH | 6.25% | |
| COPX | 6.25% | |
| XAR | 5.00% | |
| URNM | 5.00% | |
| GLD | 3.75% | |
| PAVE | 3.75% | |
| XLE | 3.75% | |
| ILF | 2.50% | |
| AIQ | 2.50% | |
| INDA | 1.25% | |
| URA | 1.25% | |
| WEAT | 1.25% |
Macro Regime — Transition / Mixed
Macro Evidence Charts
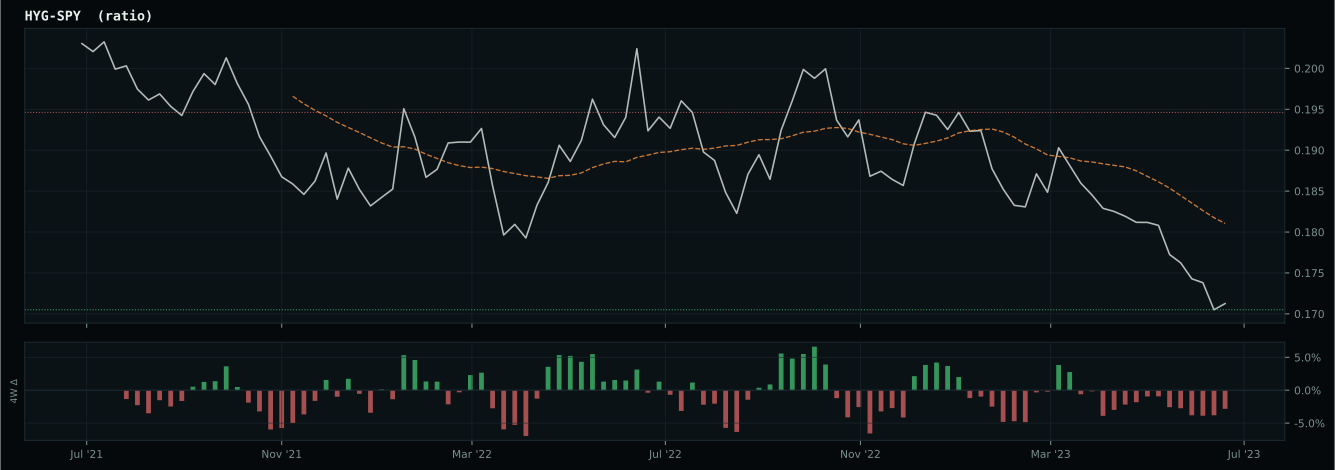
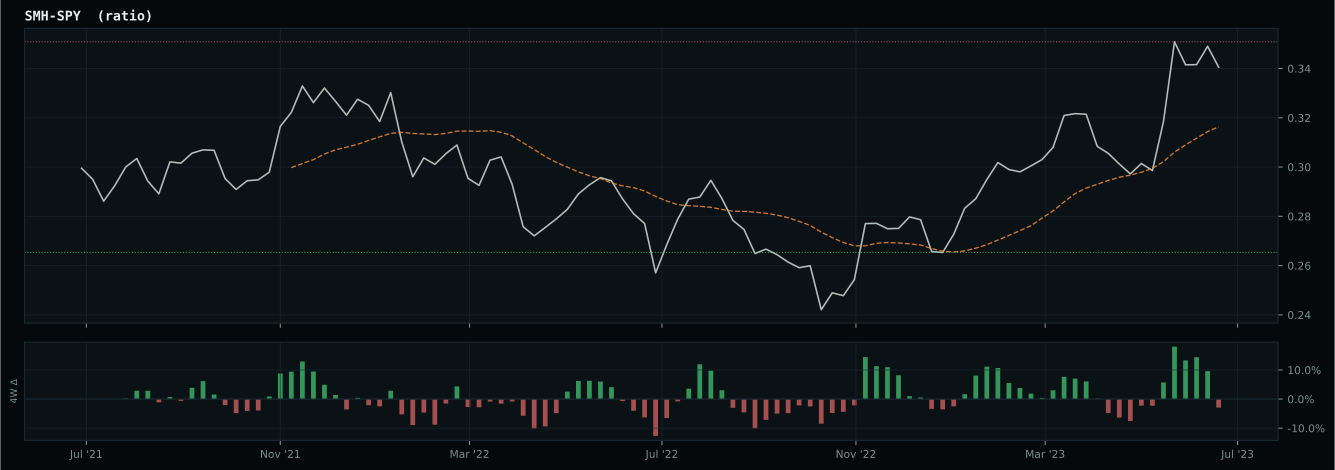
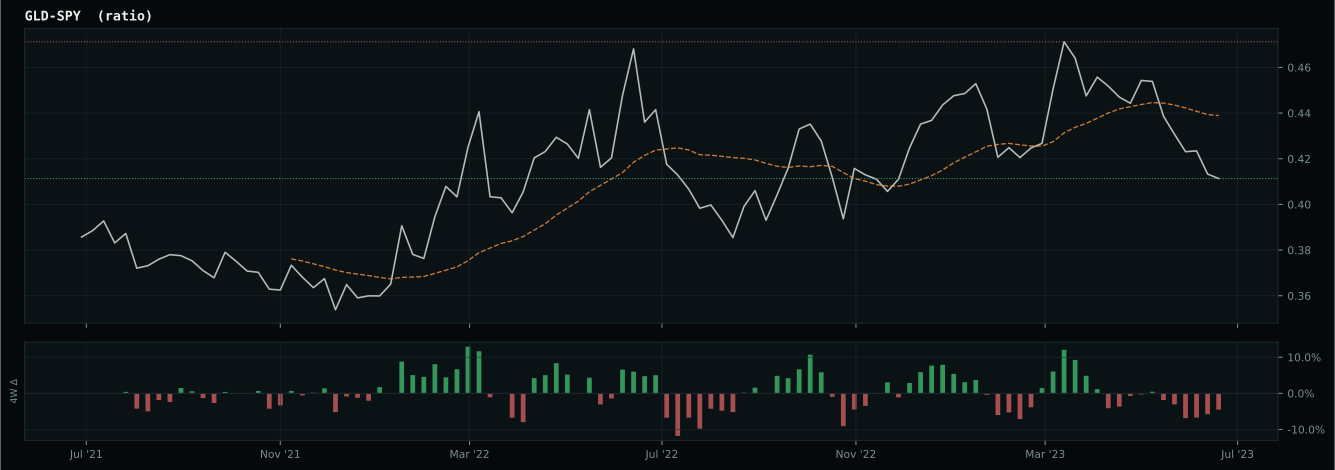
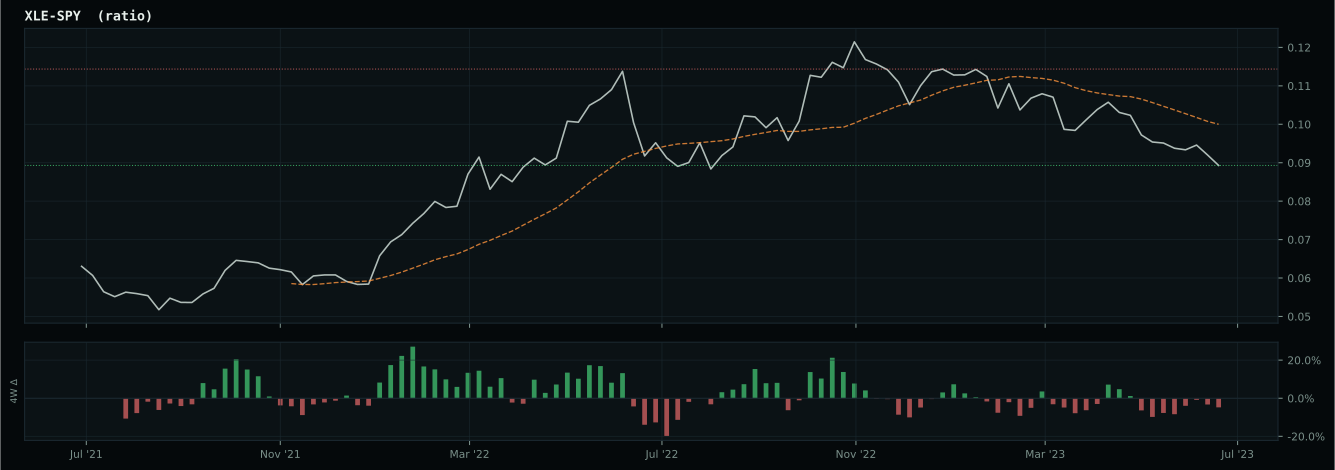
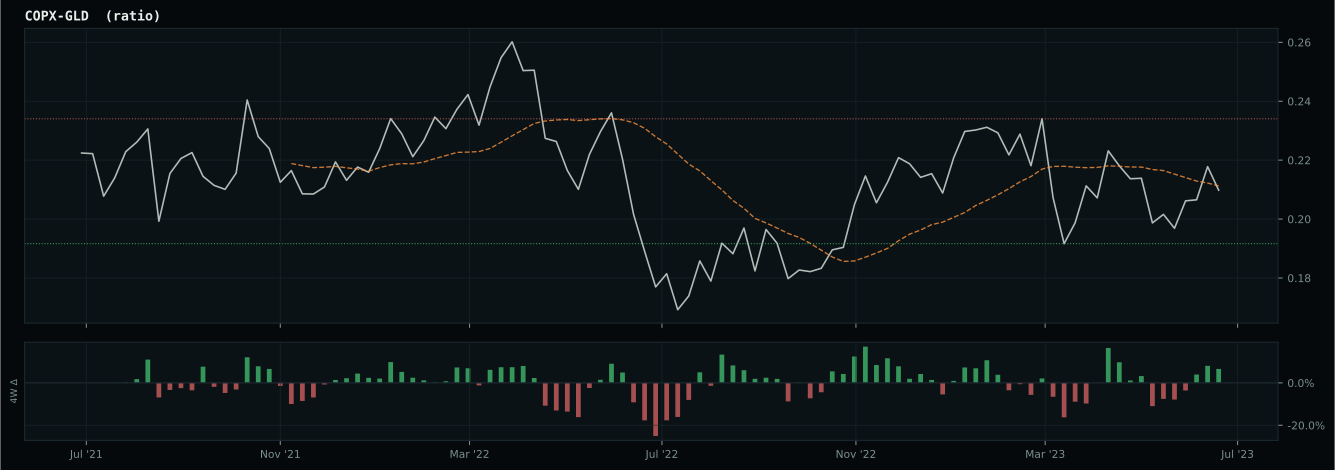
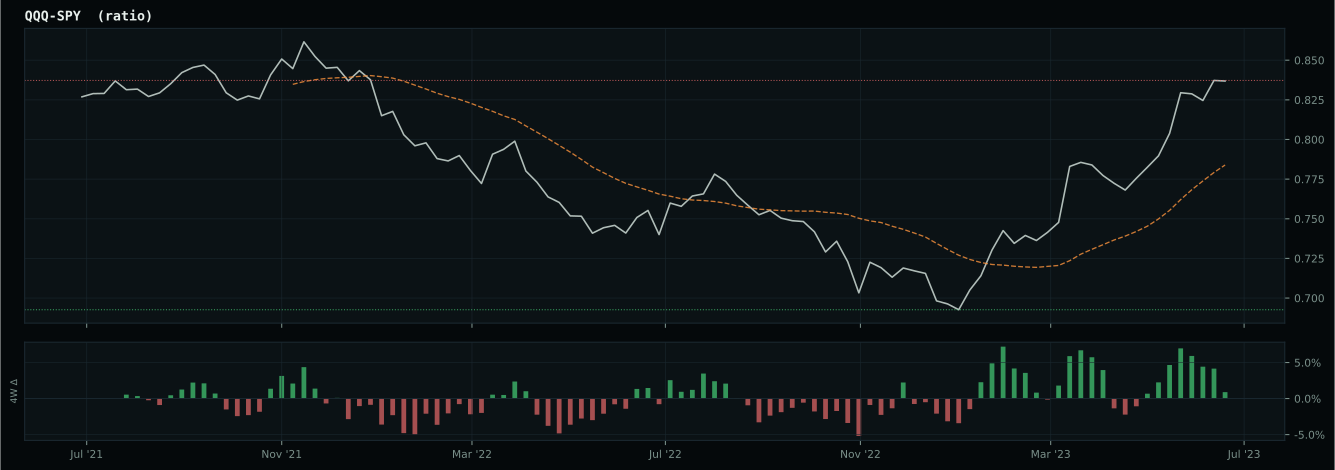
Market-implied signals behind the macro regime scores. Each ratio compares two assets; the direction and slope of the ratio is what the macro engine reads.
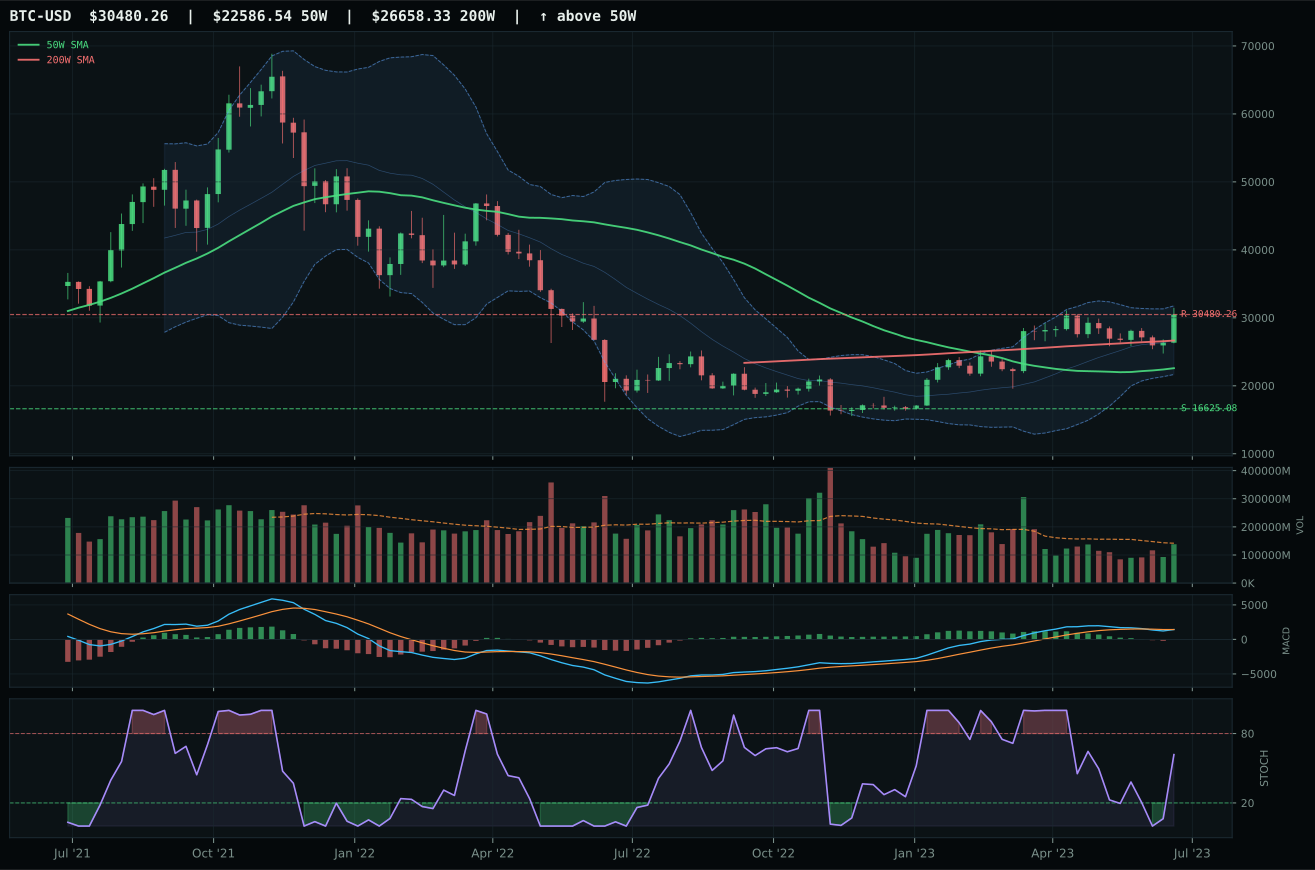
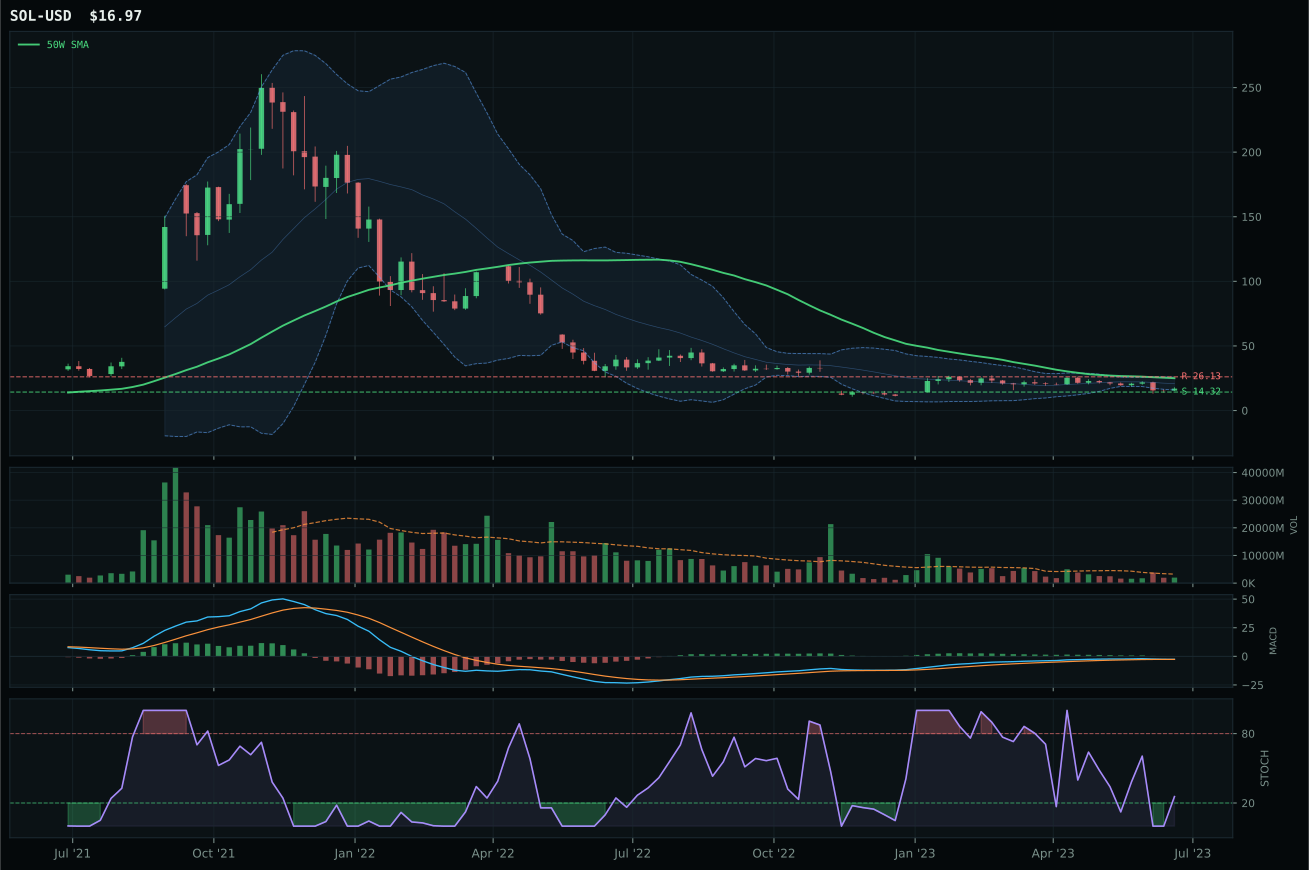
Crypto Regime — TrendBTC
post-touch structure is too wide to count as a range; max/min close ratio is 1.86
TrendBTC confirmed: 2 consecutive closes above rising/flat 50W SMA
one or more available conditions failed
Category Rankings
| Rank | Category | Winner | Score | Alloc | 4W Ret | Peers (4W) |
|---|---|---|---|---|---|---|
| 1 | AI | AIQ | 59.6 | 20% | +4.52% | BOTZ +3.9% · SMH +3.9% |
| 2 | Nuclear Energy | URNM | 58.5 | 20% | +1.13% | URA +1.9% · NLR +2.7% |
| 3 | Technology | IGV | 57.5 | 10% | +7.05% | XLK +4.8% · CIBR +4.4% |
| 4 | Industrial Metals | COPX | 52.1 | 10% | +4.43% | REMX +0.6% · PICK +5.6% |
| 5 | Defense & Aerospace | XAR | 51.0 | 10% | +3.81% | ITA +2.5% · ROKT +4.2% |
| 6 | Traditional Energy | XLE | 43.6 | 10% | +9.33% | FCG +10.5% · XOP +12.0% |
| 7 | Utilities & Infrastructure | PAVE | 38.2 | 10% | +6.23% | IGF +3.8% · XLU +5.3% |
| 8 | Precious Metals | GLD | 37.7 | 10% | +1.77% | SLV +7.4% · GDX +5.2% |
| 9 | Agriculture & Livestock | WEAT | 32.7 | 0% | -2.44% | MOO +7.1% · VEGI +6.0% |
| 10 | Emerging Markets | ILF | 30.2 | 0% | +2.43% | INDA +3.9% · IEMG +3.1% |
AI — AIQ
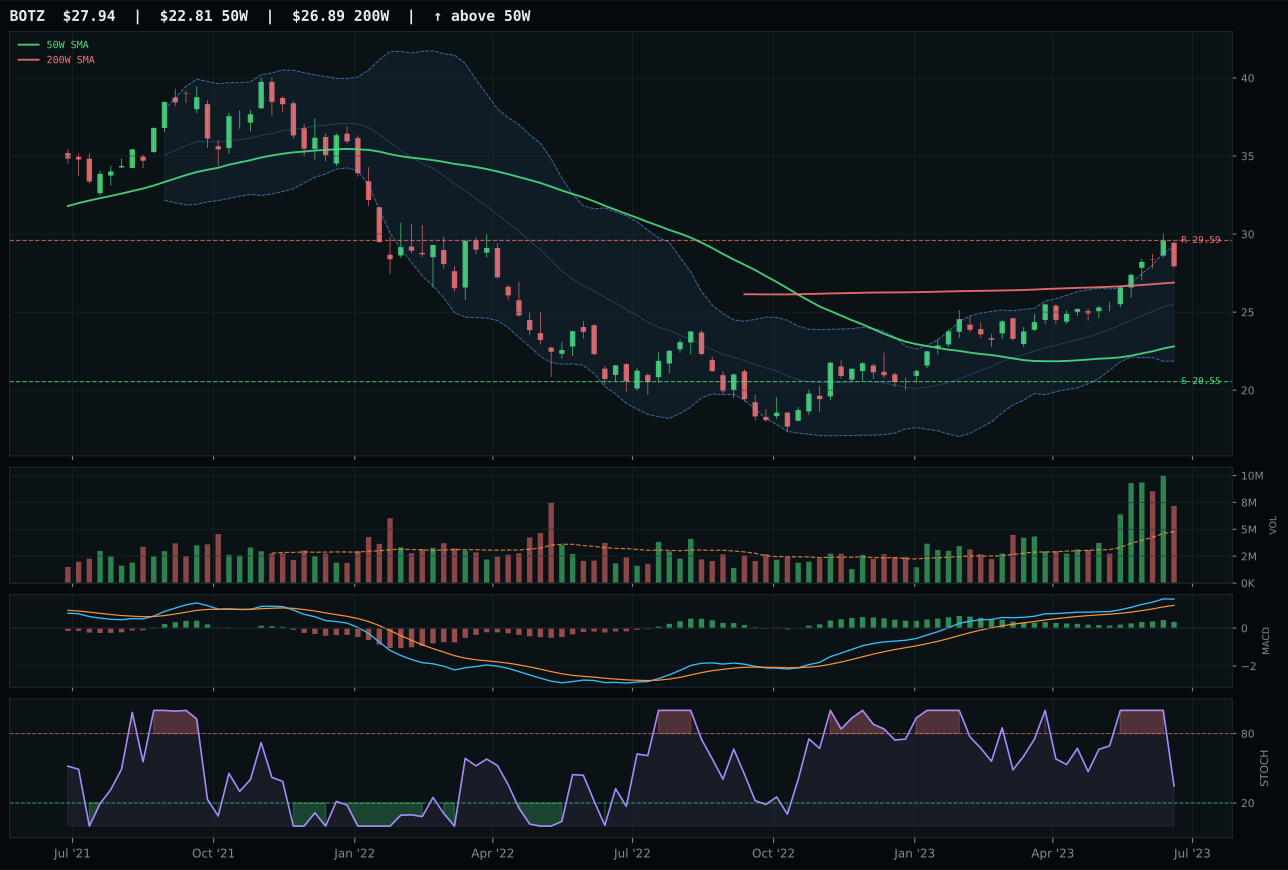
BOTZ has a vertical extension profile with 5.2% 13-week relative strength versus SPY.
A failed hold above support would weaken the setup.
Actionable but governed by invalidation levels.
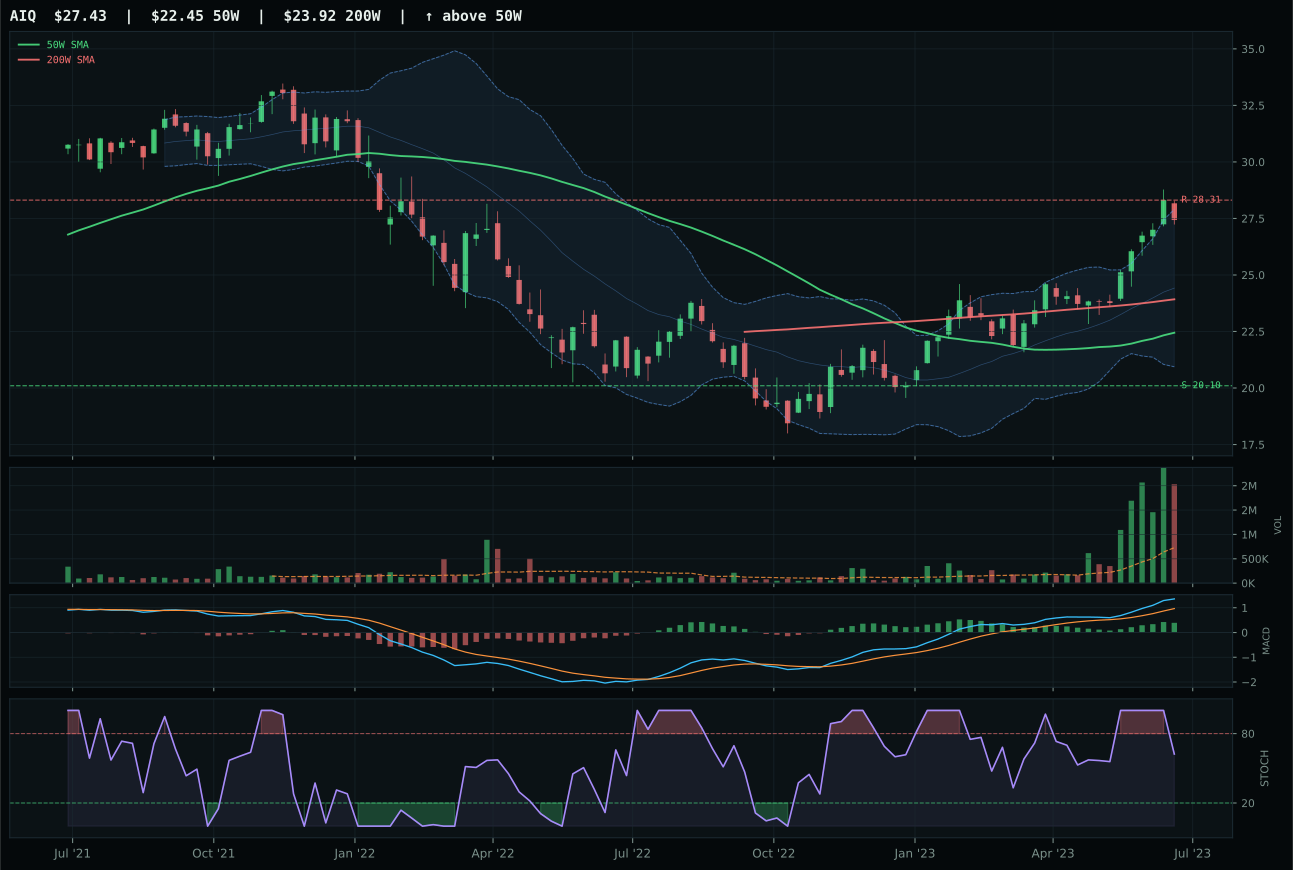
AIQ has a vertical extension profile with 7.6% 13-week relative strength versus SPY.
A failed hold above support would weaken the setup.
Actionable but governed by invalidation levels.
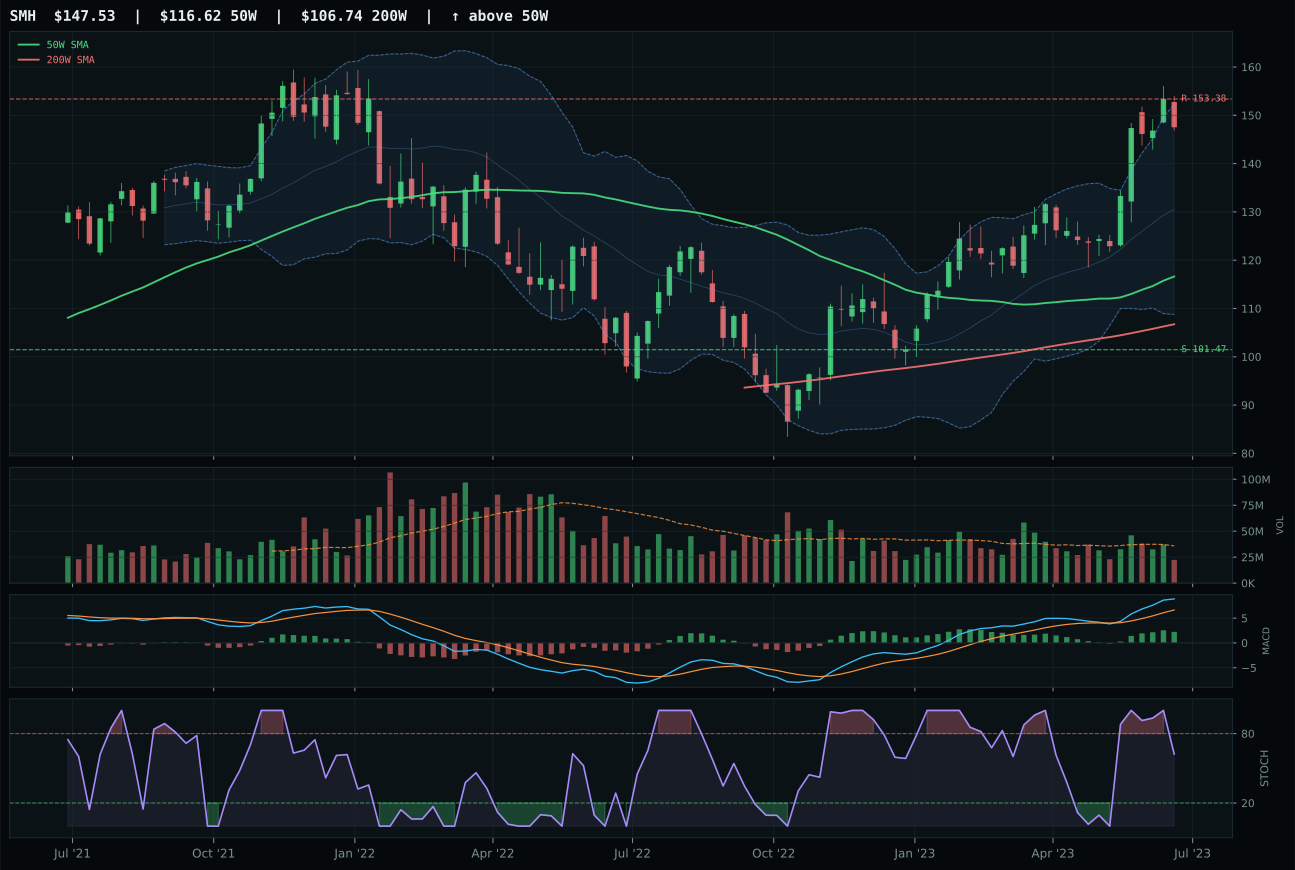
SMH has a vertical extension profile with 6.4% 13-week relative strength versus SPY.
A failed hold above support would weaken the setup.
Actionable but governed by invalidation levels.
AIQ wins despite weaker technical evidence (43.9 vs BOTZ's 83.8) because its 7.6% SPY relative strength and 1.1% category edge tell the story the regime wants to hear right now: AI applications, not AI hardware, are the momentum magnet. The 13-week return of 17.0% trails only emerging markets among growth exposures, yet the real sell is category-relative strength—AIQ's 1.1% advantage over the median signals software-application breadth is outpacing robotics and semiconductor cyclicality. Volume trades at 2.79x the 20-week average, creating distribution pressure that typically penalizes setups, yet the MACD remains bullish and improving, suggesting institutional accumulation into weakness rather than forced liquidation. BOTZ ranked technically superior at 73.9 versus AIQ's 46.8 in the reasoning layer, but lost on macro fit: its 47.0% narrative alignment trails AIQ's 53.0%, and with liquidity stress and credit stress both active penalties, the 3/2/1 weighted basket selection elevated AIQ despite inferior technical proof.
AI earns a top-2 overweight allocation of 10% because its 59.6 final category score ranks among the two highest eligible opportunities in this week's regime. The macro environment amplifies AI's edge: risk appetite positive is +10, AI growth sponsorship is +14, yet liquidity stress (-12) and credit stress (-8) create headwinds that favor the narrowest, most conviction-driven expressions over generalists. At 22.2% extended above the 50-week mean, AIQ's entry risk is real, but the allocation decision reflects not blind momentum chasing but rather the macro thesis that AI application capex and software ROI will outperform hardware cycles through an earnings-quality squeeze. The 10% allocation reflects conviction that despite extended price, the category ranking justifies top-tier capital commitment in a regime where growth revaluation risk is offset by AI's structural tailwinds and the absence of better alternatives in credit-stressed, liquidity-constrained conditions.
Nuclear Energy — URNM
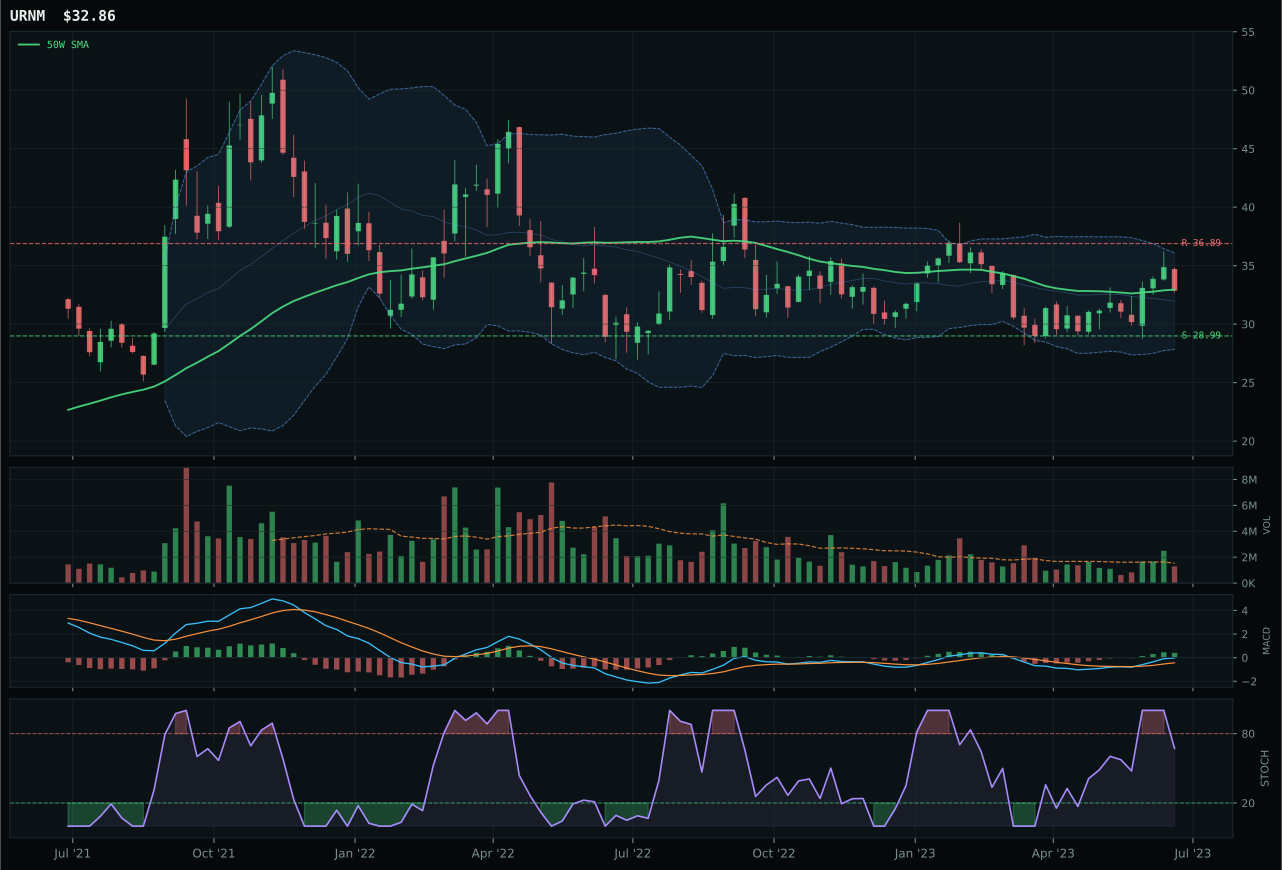
URNM has a compression near 50W profile with 3.9% 13-week relative strength versus SPY.
A failed hold above support would weaken the setup.
Actionable but governed by invalidation levels.
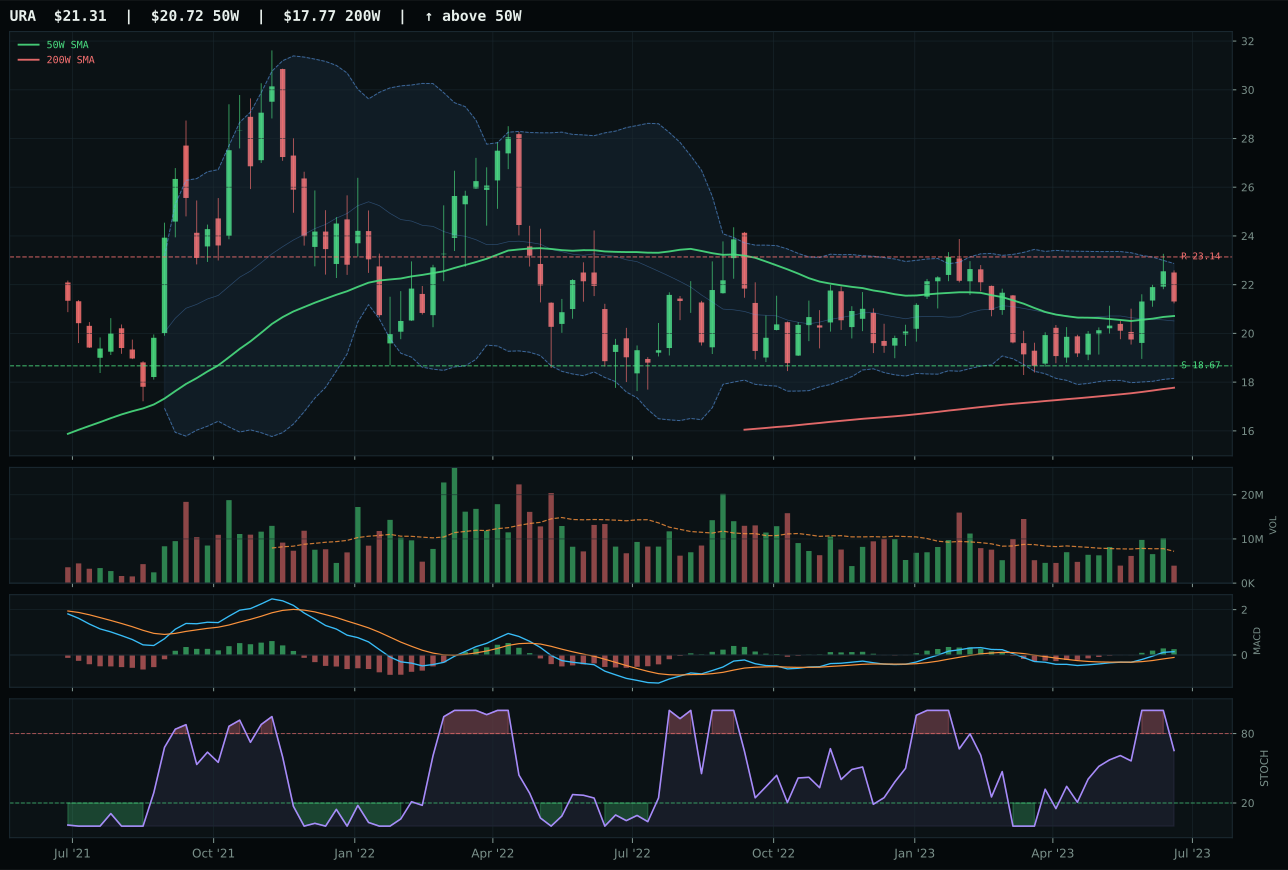
URA has a compression near 50W profile with 4.7% 13-week relative strength versus SPY.
A failed hold above support would weaken the setup.
Actionable but governed by invalidation levels.
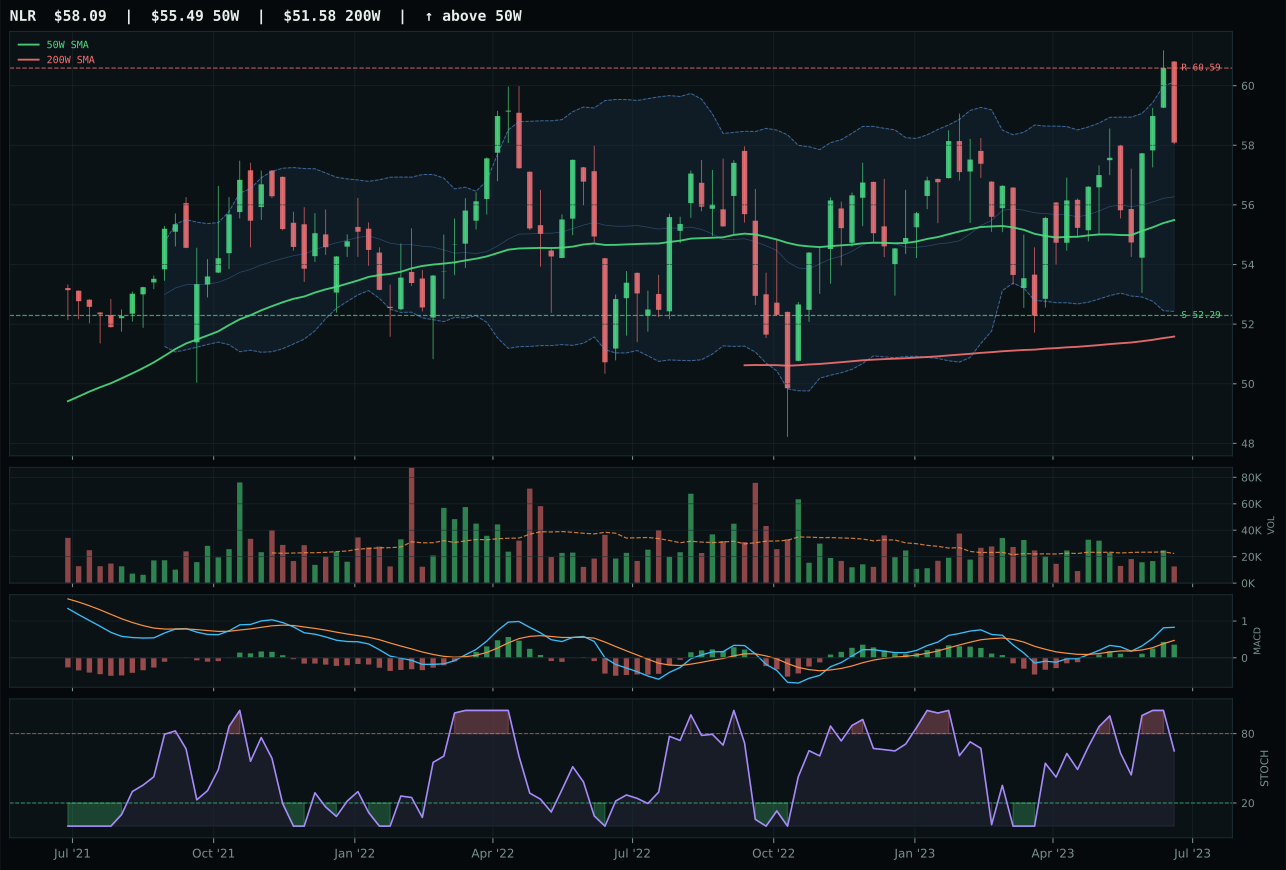
NLR has a neutral structure profile with 1.6% 13-week relative strength versus SPY.
A failed hold above support would weaken the setup.
Tracked, but not top-2 eligible because: .
URNM wins by offering perfect timing in a category where trend is ambiguous: price sits just -0.3% from the 50-week moving average at a compression zone (70.9/100 structure cleanliness), with stochastic RSI falling neutrally at 0.67 and MACD bullish and improving, creating a setup where buyers defend the mean and sellers are exhausted. The timing score of 100.0/100 is the highest in the entire portfolio, reflecting that URNM is positioned at maximum leverage point—nearest to the 50-week with the cleanest MACD confirmation. The 13.3% 13-week return and 3.9% SPY relative strength appear modest until compared to URA's 14.1% and 4.7%, revealing that URNM's true edge is category-relative strength of 0.0% (parity with the median) versus URA's technical superiority; the market is choosing URNM's uranium-miner scarcity expression over URA's pure commodity exposure despite URNM's 9.0% composite score disadvantage. Volume-price confirmation at 67.5/100 and momentum at 96.6/100 confirm accumulation into compression.
Nuclear Energy earns a top-2 overweight allocation of 10% because its 58.5 category score ranks among the two highest in the portfolio, elevating it above every tier-2 category despite technical evidence of only 77.5% (solid but not exceptional). The macro fit of 57.0% is the swing factor: energy scarcity is active at +9, real asset sponsorship at +7, and risk appetite positive at +5, overwhelmingly offsetting liquidity stress (-8) and credit stress (-5). In a Transition/Mixed regime where commodity tailwinds and energy-security concerns dominate headlines, nuclear's emergence as a tier-1 allocation slot signals that the macro framework favors real-asset demand over tech extrapolation. The 10% allocation reflects conviction that uranium supply constraints and AI data-center power demand will drive sustained outperformance through the portfolio review cycle. However, URNM's -0.3% proximity to the 50-week means the setup is fragile; if price breaks below support at 28.99 on thin volume, the category's macro arguments lose technical confirmation and warrant immediate rebalance to defensive tier-2 expressions.
Technology — IGV
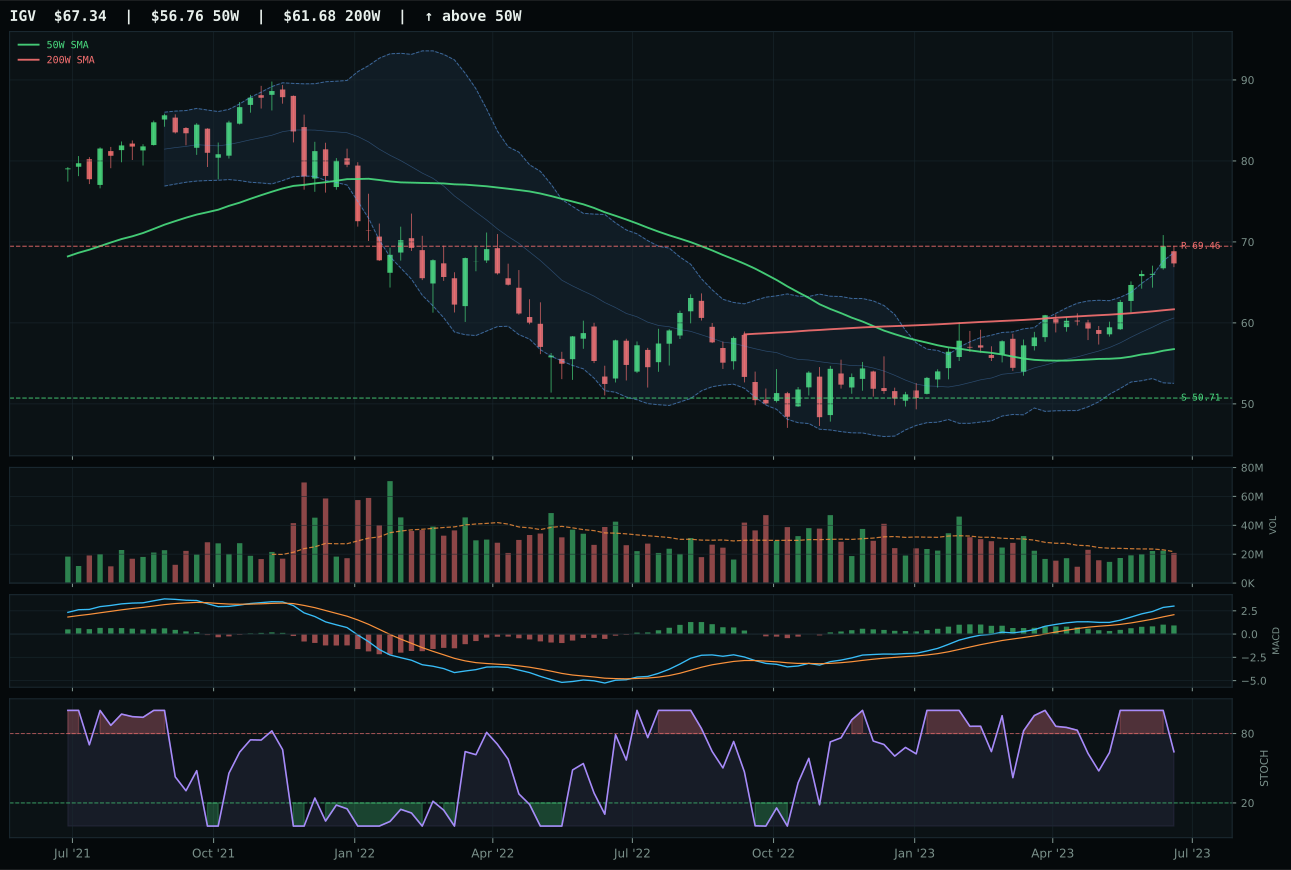
IGV has a vertical extension profile with 6.2% 13-week relative strength versus SPY.
A failed hold above support would weaken the setup.
Actionable but governed by invalidation levels.
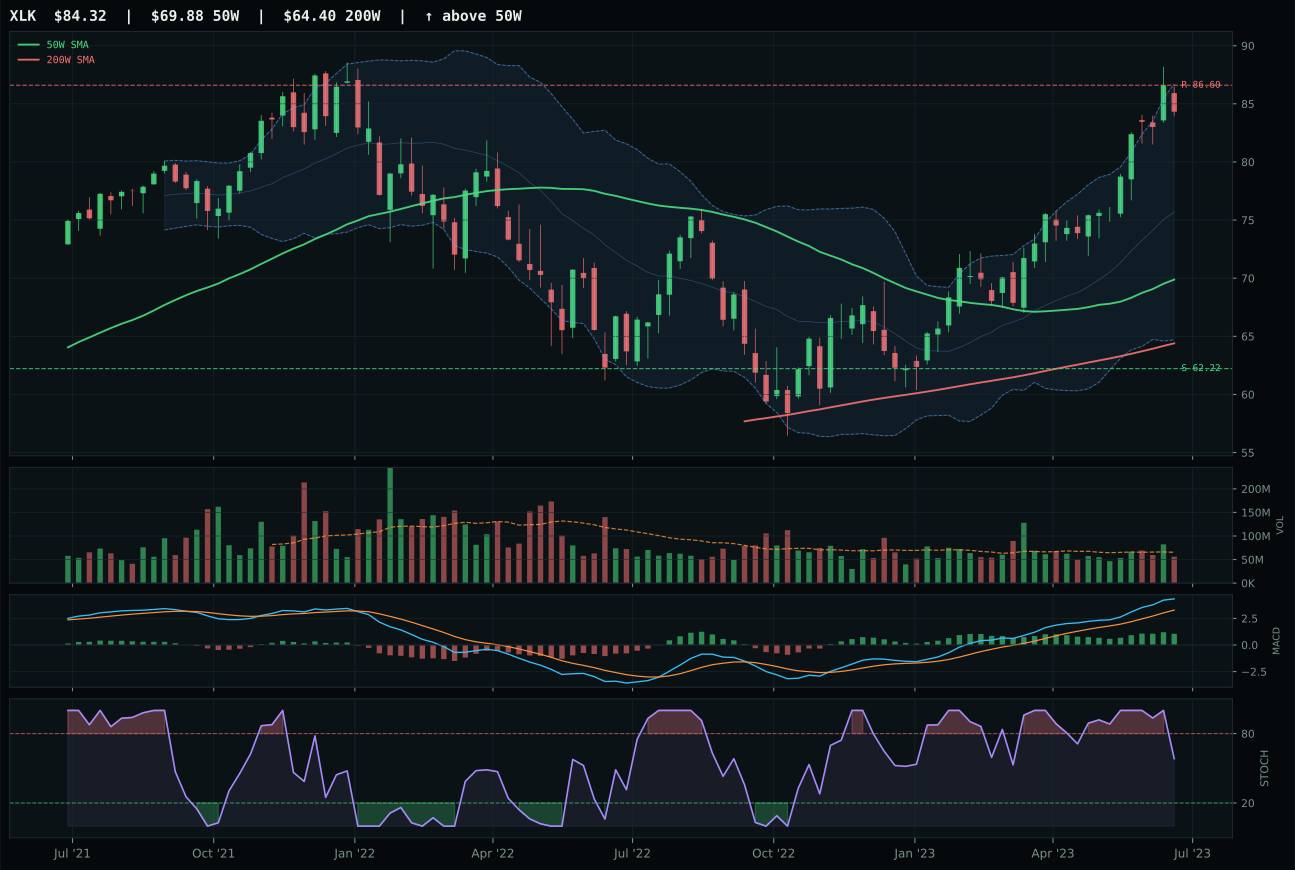
XLK has a vertical extension profile with 6.1% 13-week relative strength versus SPY.
A failed hold above support would weaken the setup.
Actionable but governed by invalidation levels.
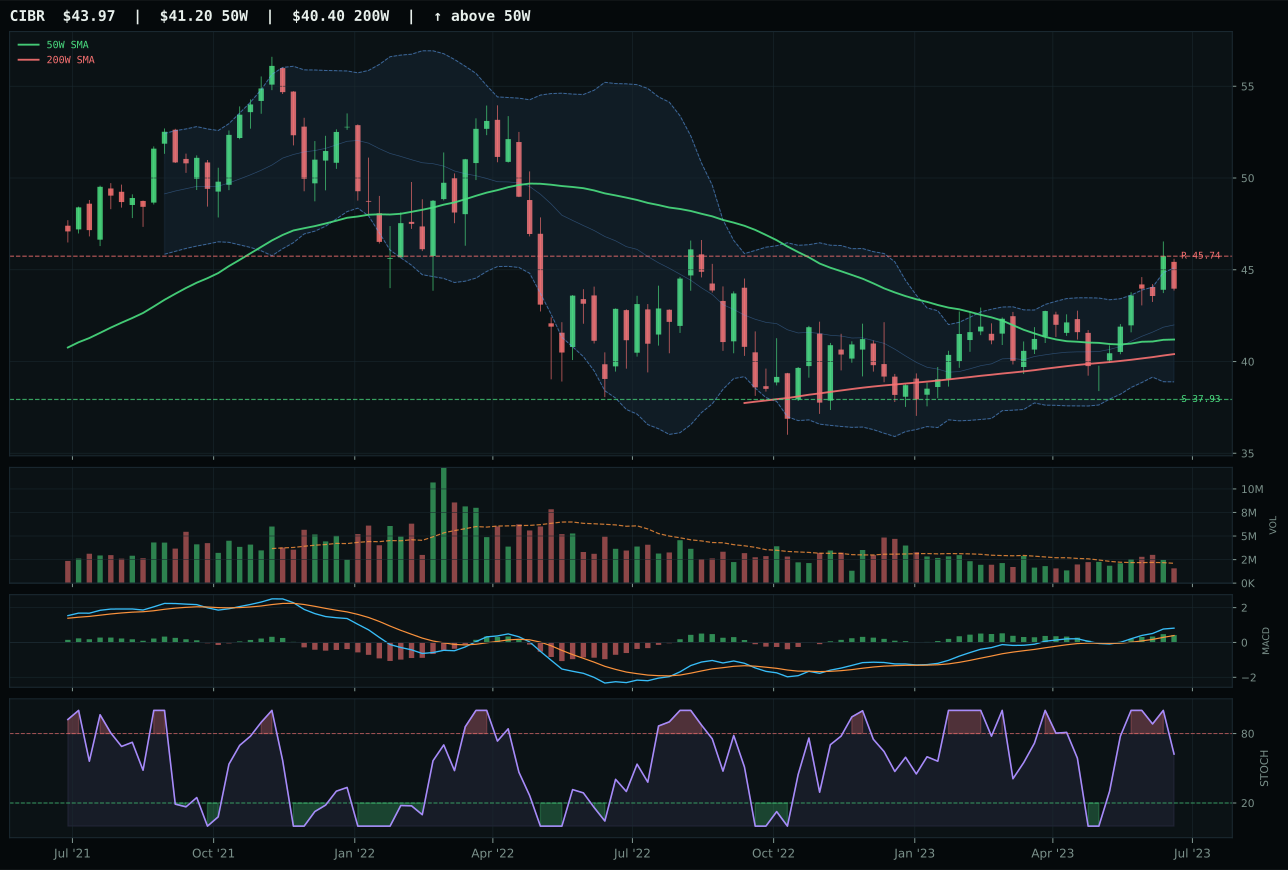
CIBR has a neutral structure profile with -2.8% 13-week relative strength versus SPY.
A failed hold above support would weaken the setup.
Actionable but governed by invalidation levels.
IGV captures the category because its 6.2% relative strength versus SPY and 0.2% edge within its peer basket demonstrate that institutional buyers are favoring enterprise software over broader tech exposure. The setup is a vertical extension 18.6% above the 50-week moving average—expensive entry territory—yet MACD remains bullish and improving with stochastic RSI falling neutrally at 0.64, signaling that momentum hasn't yet rolled over despite the altitude. XLK, the runner-up, stumbles on structure cleanliness (72.1 vs 74.3) and a flat 0.0% category-relative strength that suggests its broad profitable technology mandate lacks the specialized conviction driving IGV's outperformance. Both charts sit in identical setups and price zones, but IGV's narrow 1.1-point gap versus XLK masks a critical differentiator: buyers of application software are rotating ahead of buyers of semiconductor and computing infrastructure, a beta split that favors the specialist when risk appetite remains positive.
Technology earns 5% as a tier-2 category, ranked outside the top two despite solid 57.5 technical execution. The category's 48.0% macro fit score reveals credit stress and liquidity stress both active at -9 and -8 respectively, offsetting risk appetite's +9 contribution and the +6 boost from AI growth sponsorship. In a Transition/Mixed regime, broad software leadership competes against higher-conviction bets in nuclear and AI, both of which rank above this category's score. The real constraint is risk asymmetry: at 18.6% above the 50-week mean, IGV is offering late-stage entry into a trend that has already captured most of the move. That 5% allocation serves as a hold for existing exposure rather than a fresh conviction trade—keep the position but don't chase it higher into a regime where credit stress could accelerate rotation toward value and real assets.
Industrial Metals — COPX
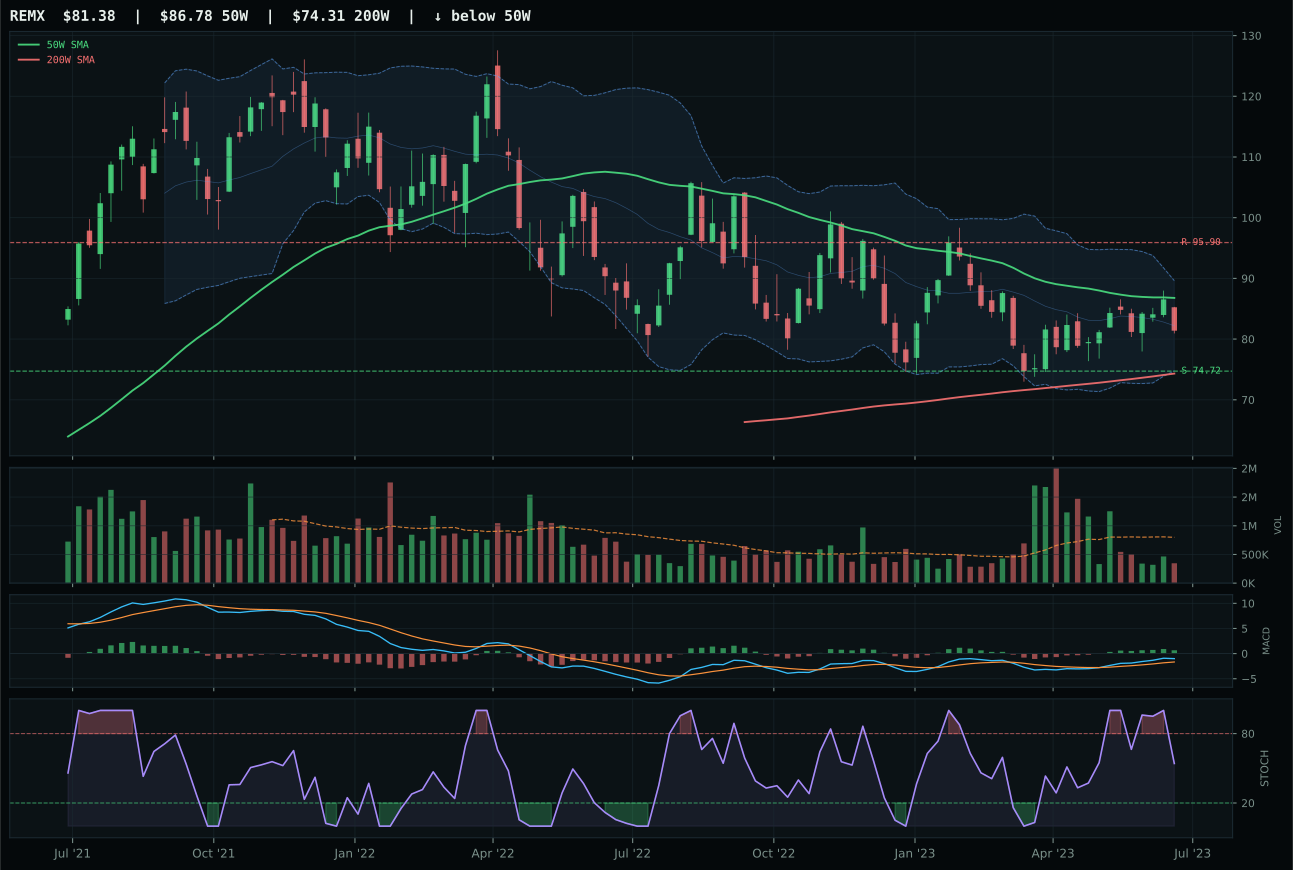
REMX has a neutral structure profile with -1.3% 13-week relative strength versus SPY.
A failed hold above support would weaken the setup.
Actionable but governed by invalidation levels.
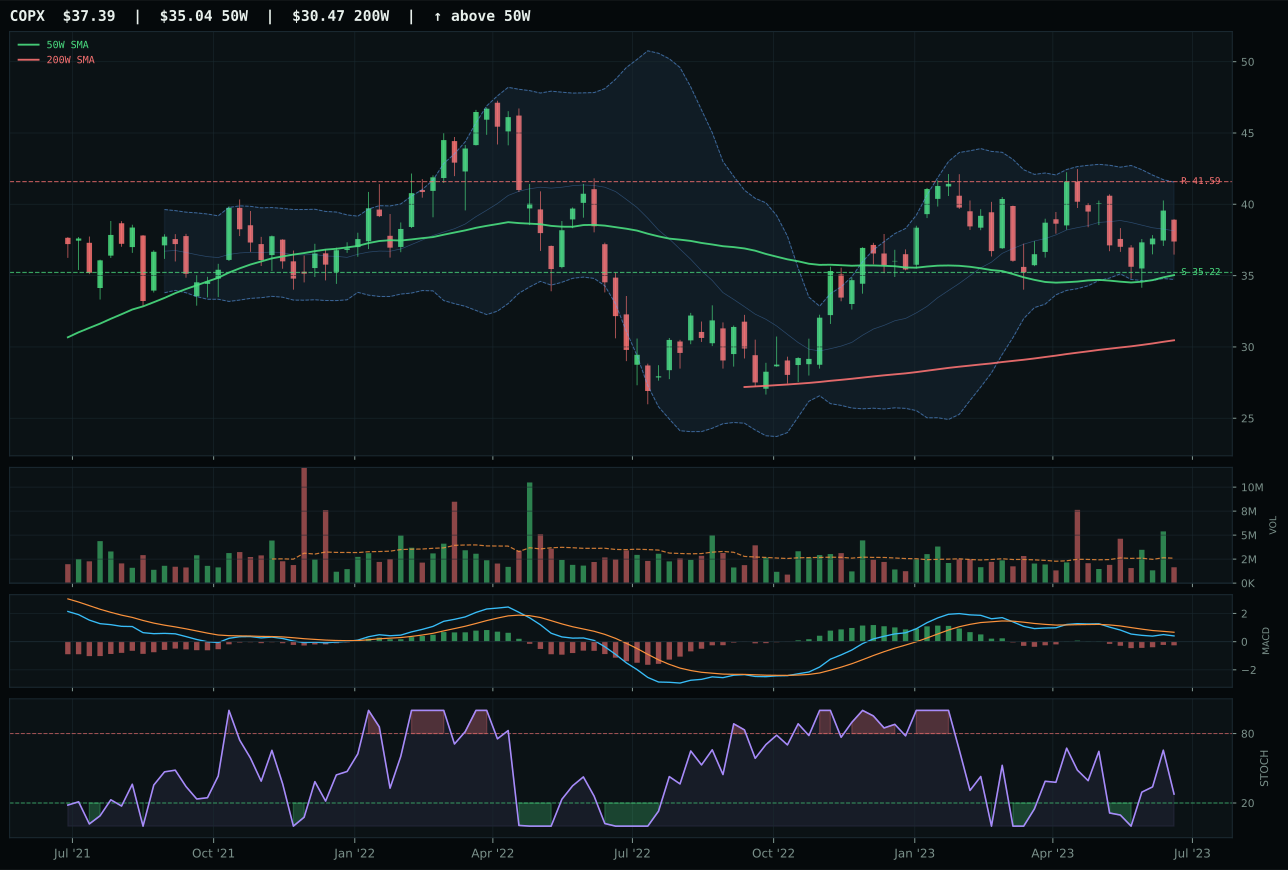
COPX has a neutral structure profile with -7.0% 13-week relative strength versus SPY.
A failed hold above support would weaken the setup.
Actionable but governed by invalidation levels.
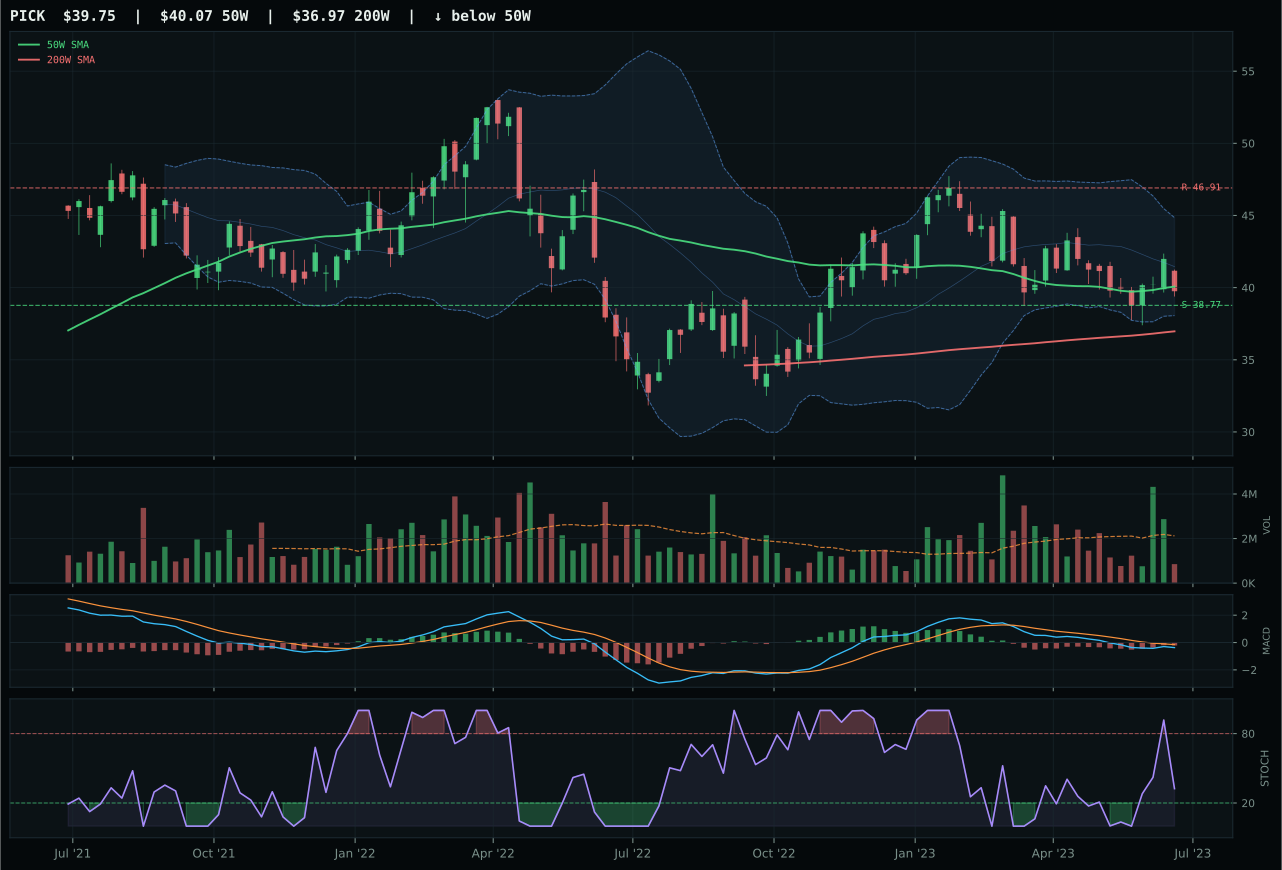
PICK has a pullback into support profile with -10.6% 13-week relative strength versus SPY.
A failed hold above support would weaken the setup.
Actionable but governed by invalidation levels.
COPX captures the category despite REMX's superior 68.9 technical ranking because the category reasoner elevated macro fit (65.0%) over pure technical merit in a regime where metals scarcity is active at +14 and commodity breadth is positive at +10. COPX's 82.5/100 trend score from 6.7% extension above the 50-week and neutral structure setup, combined with exceptional 74.5/100 risk/reward (upside to resistance -10.1%, downside to support 6.2%), appeals to allocators sizing capital around macro commodity themes rather than momentum chasing. The -7.0% SPY relative weakness appears to be a penalty but masks a category decision: copper scarcity and industrial demand drove COPX's selection over REMX's rare-earth speculation despite REMX's bullish MACD and +5.8% category-relative strength. The 1.1-point score margin is wafer-thin, confirming that commodity metal expressions are interchangeable at this risk/reward inflection—the winner today could reverse next week if macro descriptors shift.
Industrial Metals earns 5% at tier-2, justified by a 52.1 category score that sits precisely on the border between conviction and caution. The 65.0% macro fit is the highest score in the category's favor—metals scarcity (+14), commodity breadth positive (+10), and real asset sponsorship (+6) combine to offset liquidity stress (-8) and credit stress (-7), making industrial metals the only real-asset category with clear macro tailwinds. However, COPX's thin participation volume (0.64x 20-week average) and -7.0% SPY relative weakness prevent tier-1 elevation; the category is technically sound but structurally slow. The 5% allocation reflects conviction that copper demand from AI infrastructure capex and energy-transition hardware will outperform equities through summer, yet recognizes that if commodity breadth narrows or credit stress accelerates, this capital will redeploy quickly to technology or nuclear upside. Monitor REMX's MACD and COPX's volume—if either breaks neutral or thin participation rises to 1.2x+ average, the category warrants upgrade consideration.
Defense & Aerospace — XAR
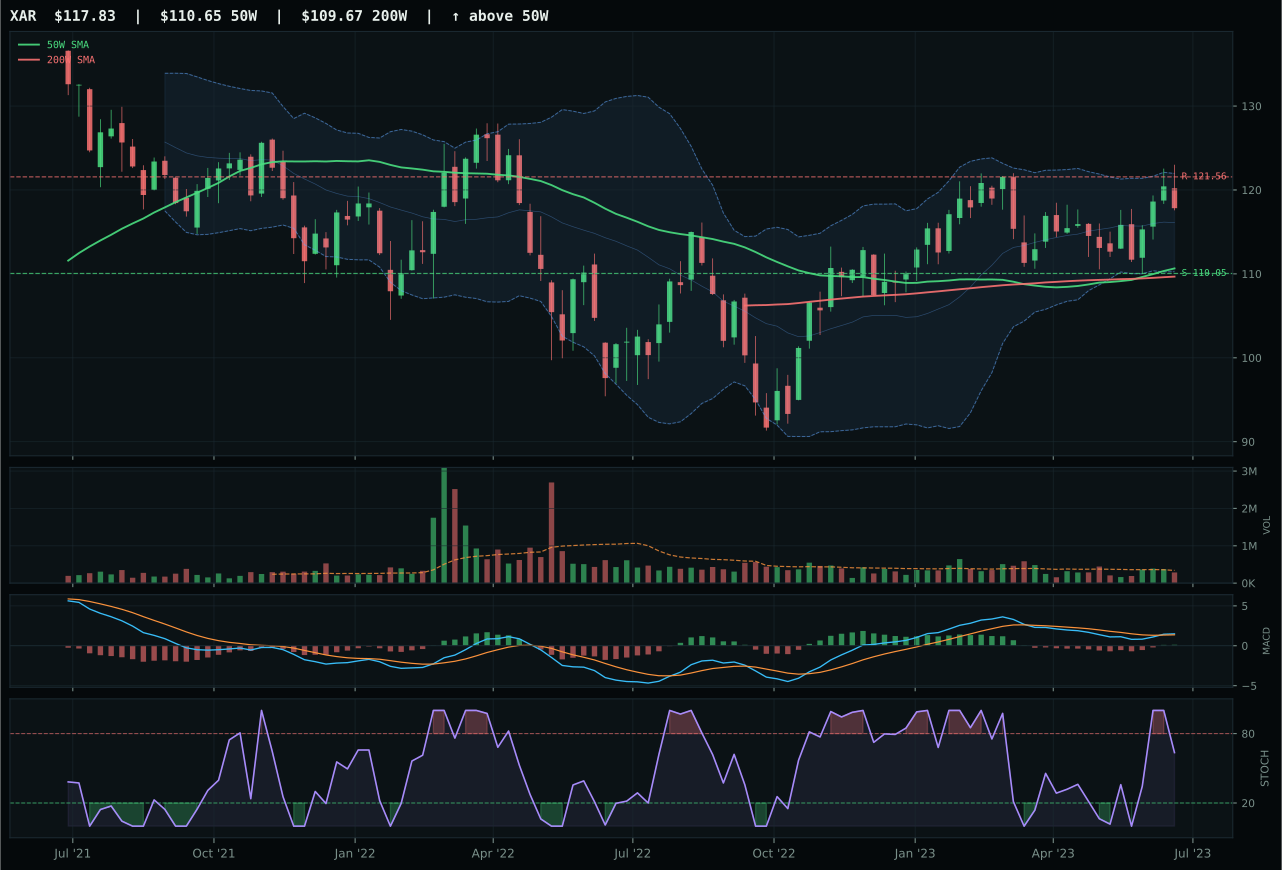
XAR has a neutral structure profile with -5.1% 13-week relative strength versus SPY.
A failed hold above support would weaken the setup.
Actionable but governed by invalidation levels.
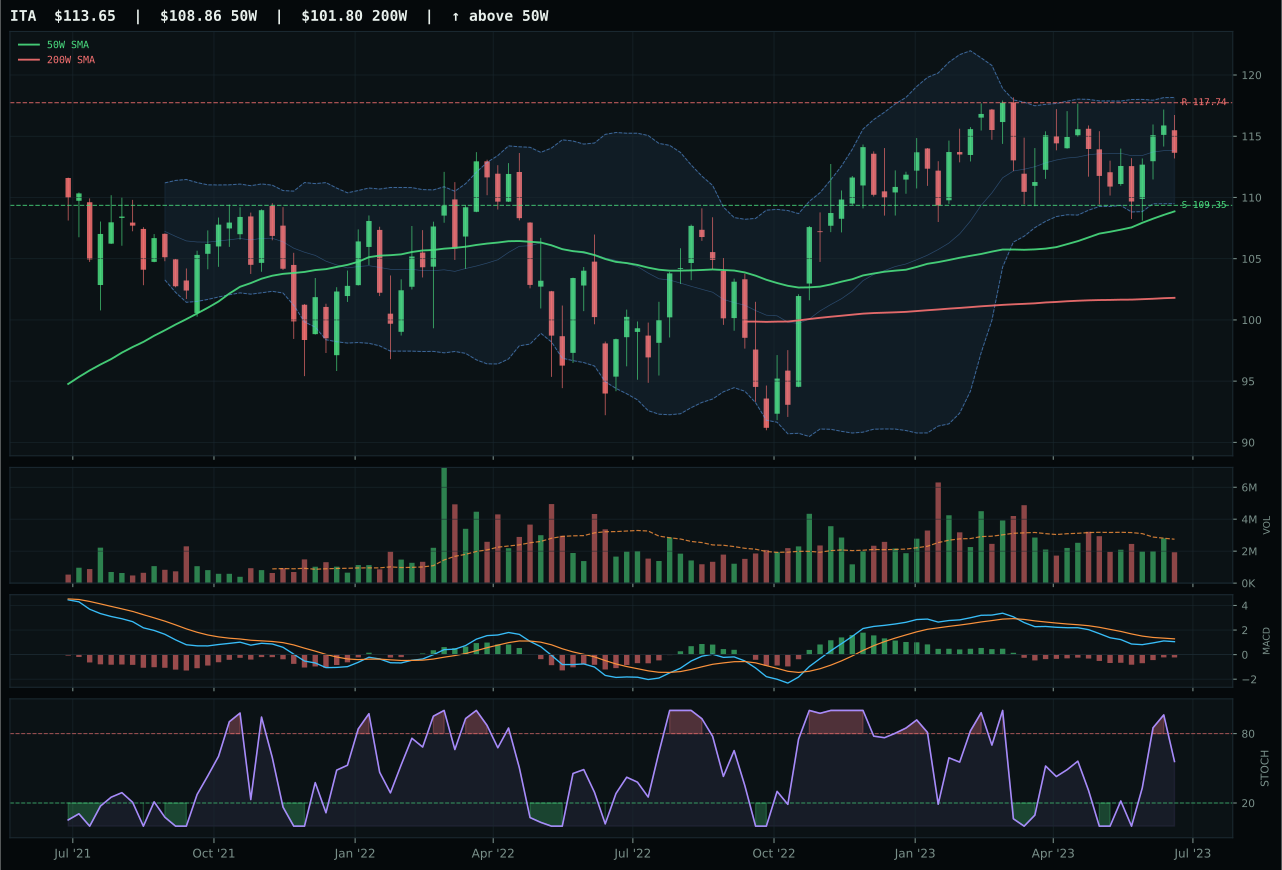
ITA has a pullback into support profile with -7.3% 13-week relative strength versus SPY.
A failed hold above support would weaken the setup.
Actionable but governed by invalidation levels.
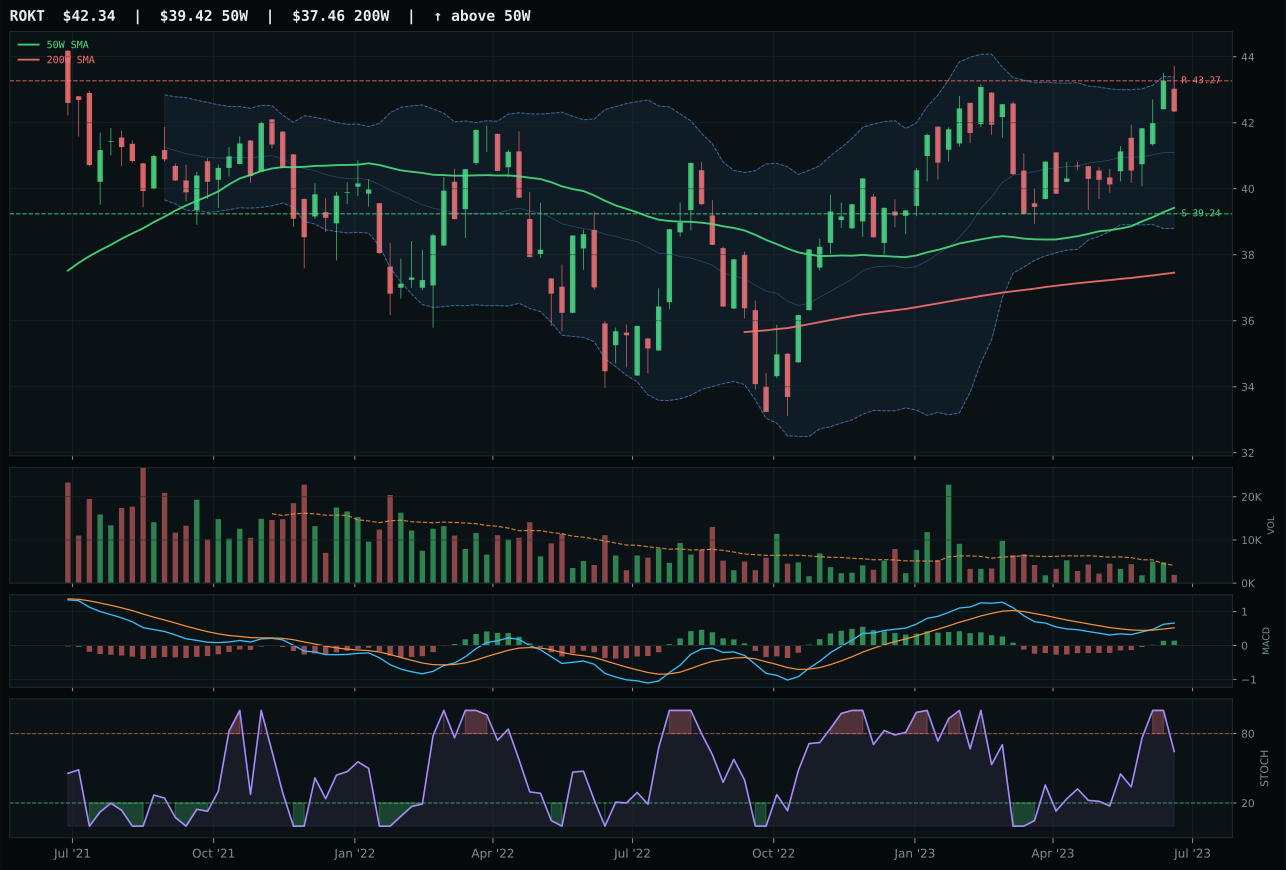
ROKT has a neutral structure profile with -2.1% 13-week relative strength versus SPY.
A failed hold above support would weaken the setup.
Tracked, but not top-2 eligible because: .
XAR wins by executing a rare setup: neutral structure with solid trend (92.3) and exceptional timing (83.0) that makes this a pullback into strength rather than a chase of extended momentum. The -5.1% relative weakness versus SPY appears damaging until examined against category context—XAR's 0.0% edge within its peer basket confirms this is the market's chosen defense expression, even if equities broadly are underperforming. The setup is compressed near the 50-week mean, just 6.5% away, with stochastic RSI rising mid-zone and MACD bullish and improving—classic coil setup where buyers defending the moving average unlock participation. ITA, technically cleaner on some metrics (composite 77 vs 76), fails because its MACD is bearish but improving (weaker confirmation than bullish and improving), volume is thin participation rather than neutral, and the -2.2% category-relative strength tells the market that defense-prime durability is being crowded out by pure aerospace-prime exposure. This is a mean-reversion setup with defined support at 110.05, not an extended breakout.
Defense & Aerospace earns 5% at tier-2 rank, held despite a modest 51.0 category score that reflects neutral macro fit (50.0%) in a Transition/Mixed regime where neither credit stress (+2) nor liquidity stress (-4) provides strong directional sponsorship. The category's 63.5 3/2/1 basket score tests poorly against leadership, volume-price sponsorship, and persistence, all of which penalize setups lacking distributed accumulation or broad participation. Geopolitical tailwinds and defense budget certainty are real, yet technical evidence at 78.2% cannot compensate for macro neutrality and the absence of category-level conviction signals. The 5% allocation is structural and defensive rather than tactical—hold it as portfolio insulation against volatility spikes, but recognize that XAR at support requires follow-through buying to justify adding into weakness. This category would earn top-2 status only if credit stress intensified or risk appetite collapsed, neither of which is the current regime signal.
Traditional Energy — XLE
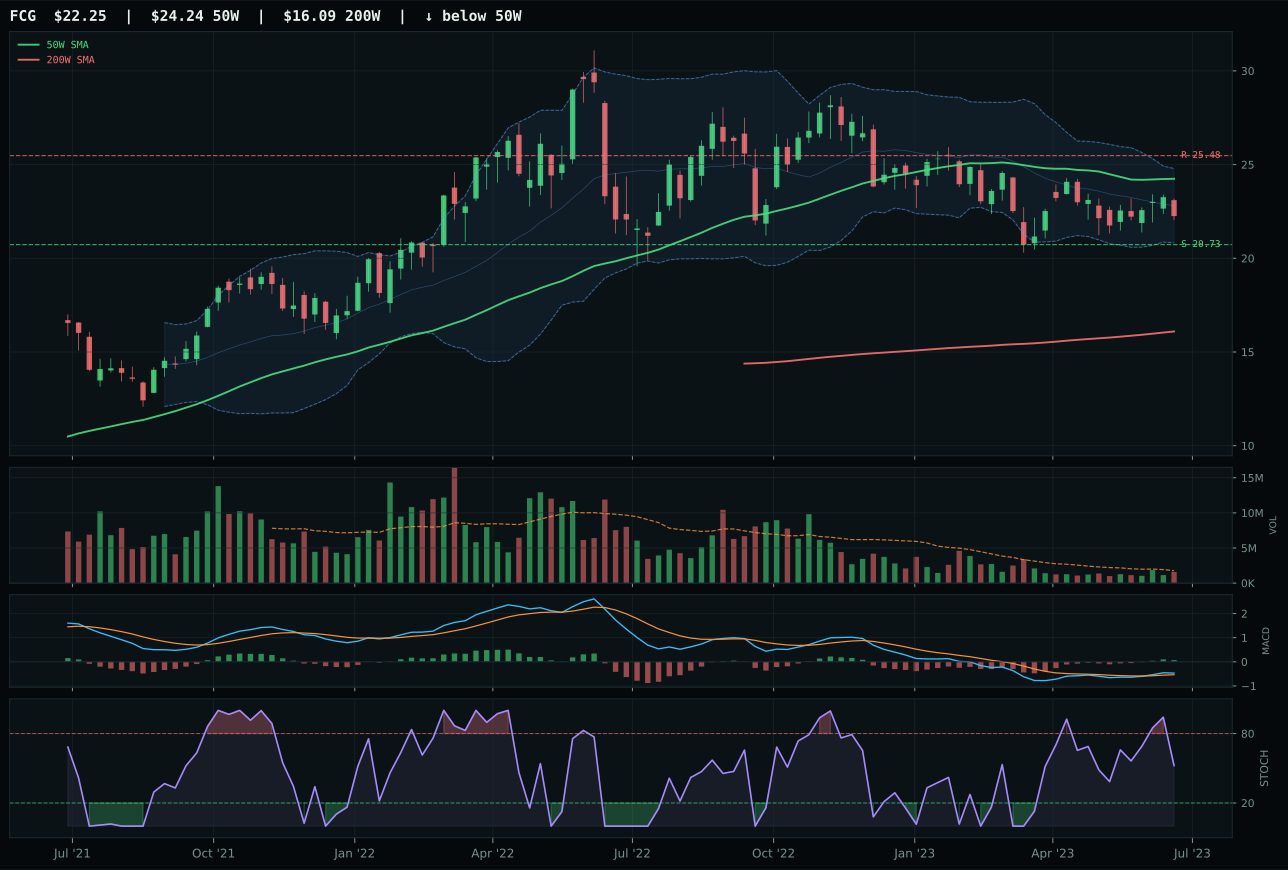
FCG has a neutral structure profile with -4.3% 13-week relative strength versus SPY.
A failed hold above support would weaken the setup.
Actionable but governed by invalidation levels.
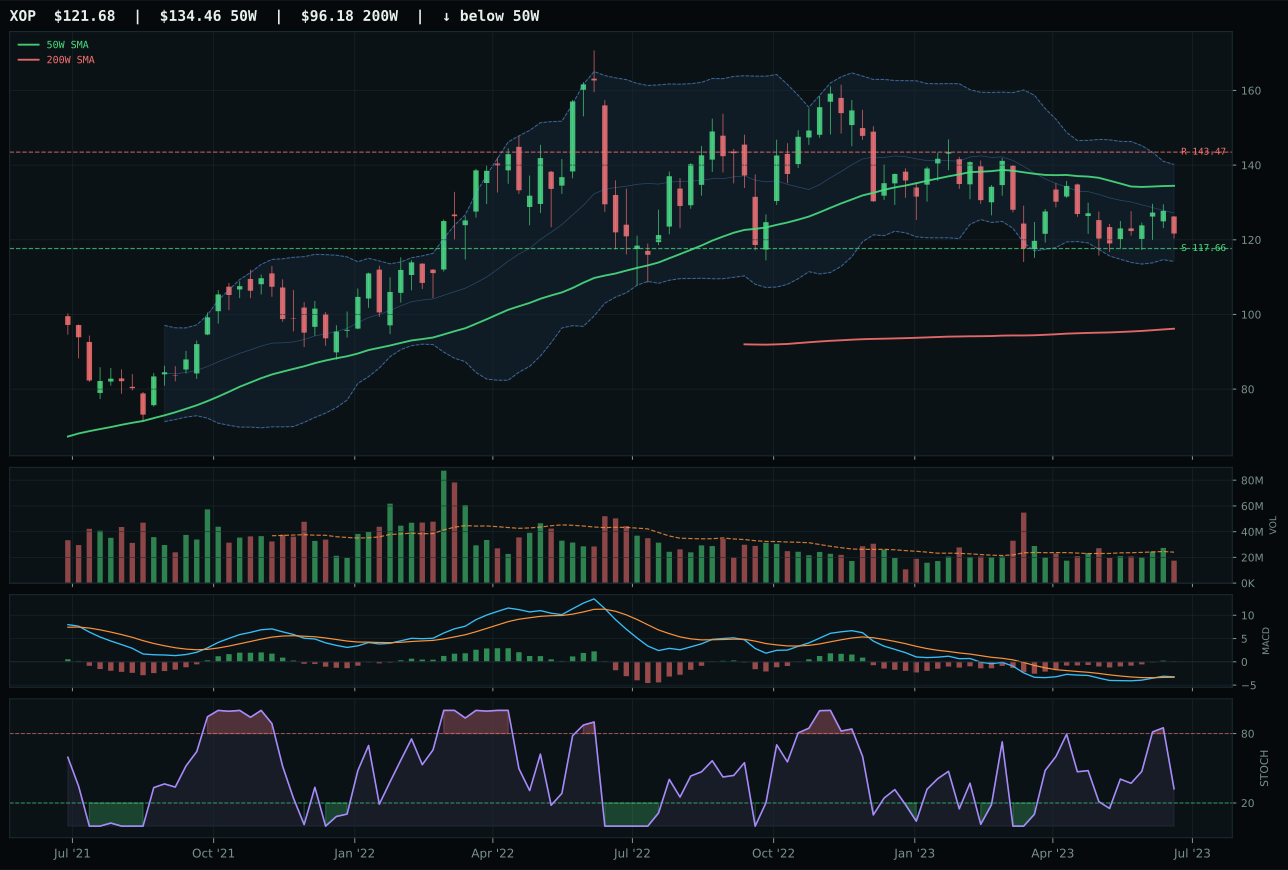
XOP has a pullback into support profile with -7.8% 13-week relative strength versus SPY.
A failed hold above support would weaken the setup.
Actionable but governed by invalidation levels.
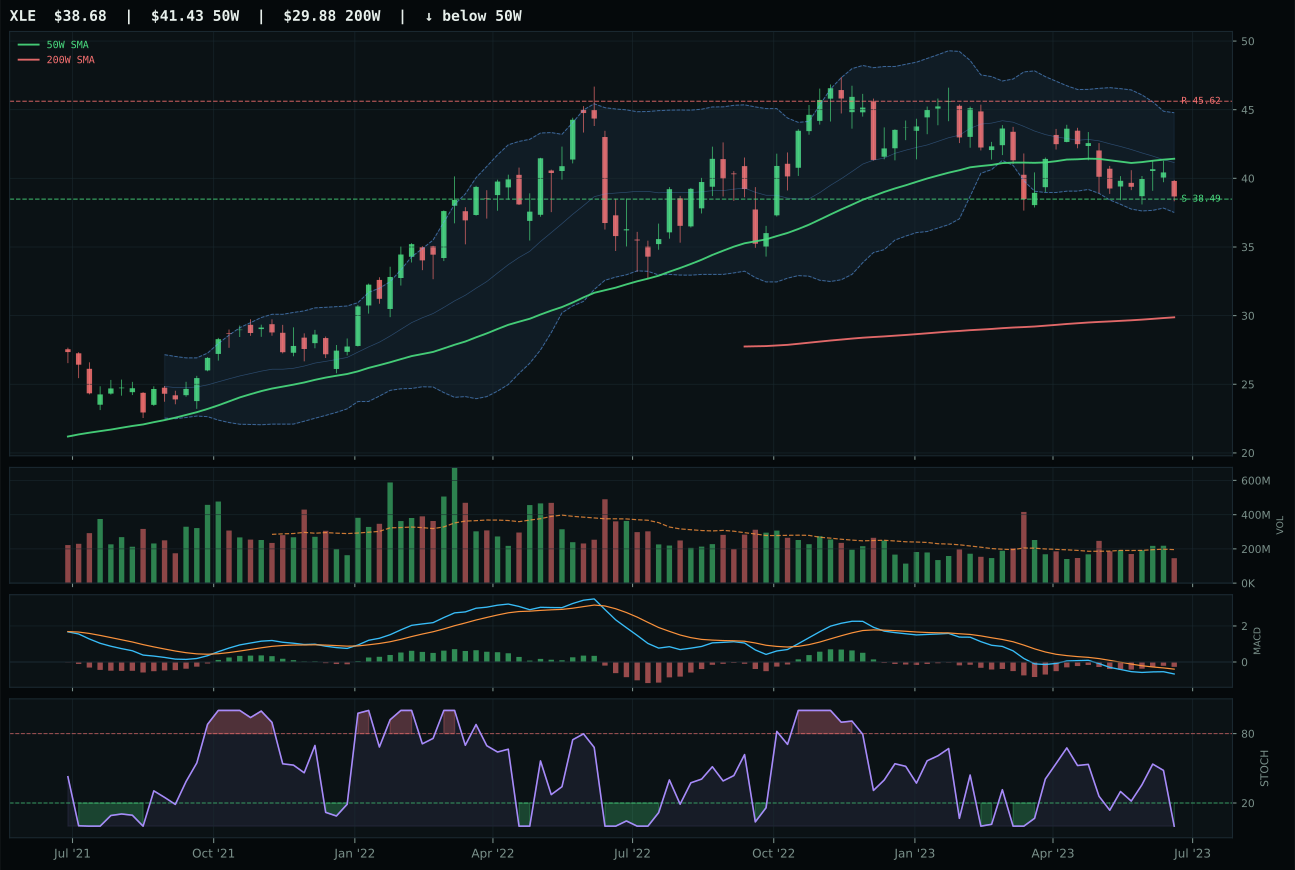
XLE has a pullback into support profile with -10.1% 13-week relative strength versus SPY.
A failed hold above support would weaken the setup.
Actionable but governed by invalidation levels.
XLE wins by offering the cleanest risk-defined mean-reversion setup in the category: price is -6.6% below the 50-week moving average but still above the 200-week, with support at 38.49 precisely 0.5% below current price—a false-break trap setup waiting for institutional defense. The timing score is exceptional at 92.0/100, driven by Fibonacci positioning at 0.618 (decision zone) combined with oversold stochastic RSI at 0.00 and MACD bearish but improving, creating the classic coil-compression pattern. Risk-reward is outstanding at 98.0/100, with downside limited to 0.5% and upside to resistance at -15.2% (meaning 45.62 level is -15% away from current 38.49 support), so the setup is asymmetric in favor of buyers at support. FCG's 74-point technical composite and bullish MACD appear superior, yet it trades near the 50-week in a neutral structure—expensive entry territory where new buyers face distribution risk. XLE at support is the allocator's tool for positioning ahead of energy-scarcity macro themes without overpaying for entry.
Traditional Energy earns 5% at tier-2 despite a weak 43.6 category score because the macro fit of 59.0% and active energy scarcity descriptor (+16) carry outsized weight in capital allocation against technical mediocrity. The -10.1% SPY relative weakness and -0.7% 13-week return would normally trigger zero allocation, yet energy scarcity is the strongest commodity tailwind in the regime, justified by real asset sponsorship (+7) and broad commodity demand. The portfolio's 50% crypto overlay halves every tier-1 and tier-2 allocation to 10% and 5%, respectively; traditional energy retains 5% not for momentum but for macro hedging against continued energy-transition bottlenecks and geopolitical supply constraints. However, XLE at support is a constructive setup, not a conviction trade—the 5% position should be rebalanced immediately if price breaks 38.49 support (signal of demand failure) or if FCG's superior trend (trend 79 vs XLE's 63) breaks higher with volume confirmation, suggesting leadership rotation from defensive cash-flow to natural-gas optionality.
Utilities & Infrastructure — PAVE
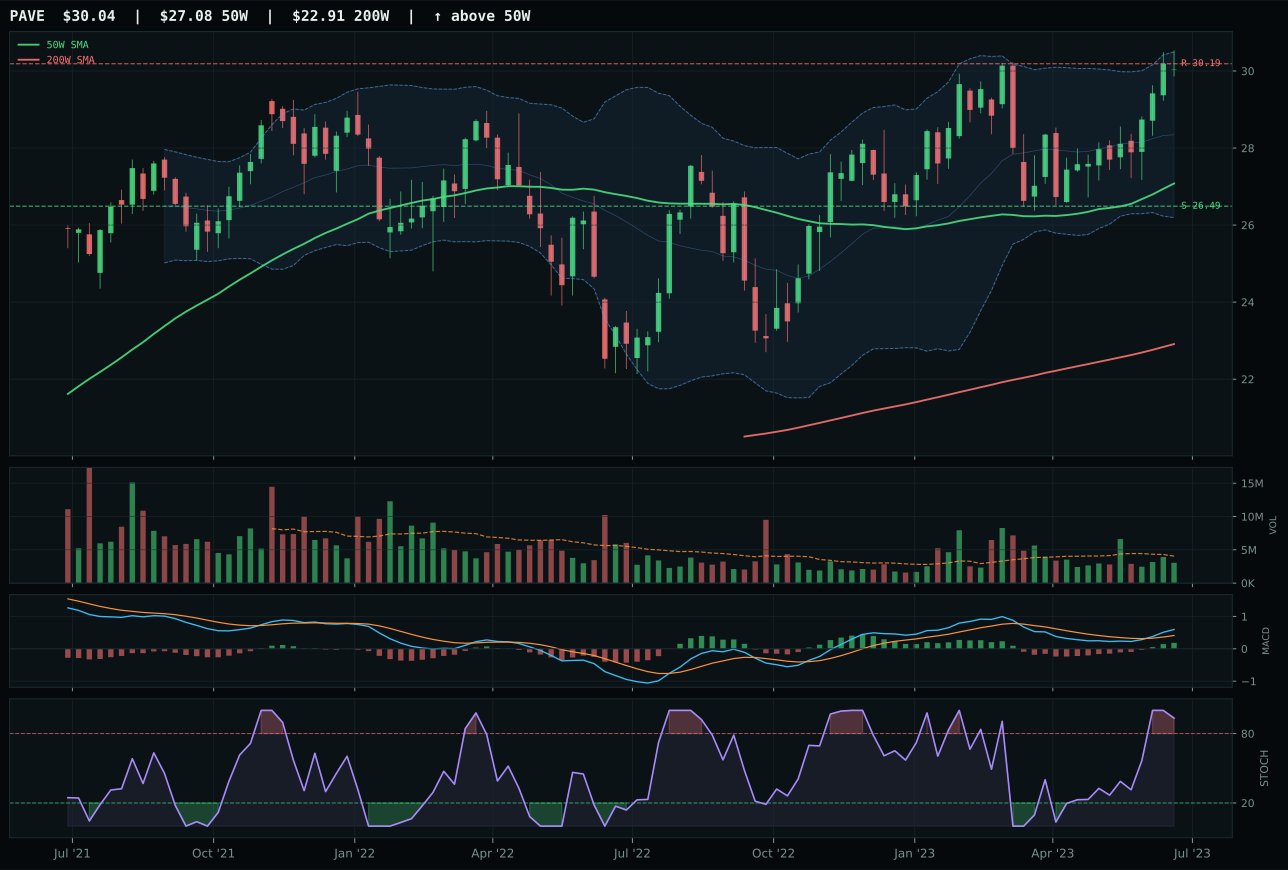
PAVE has a neutral structure profile with 1.7% 13-week relative strength versus SPY.
A failed hold above support would weaken the setup.
Actionable but governed by invalidation levels.
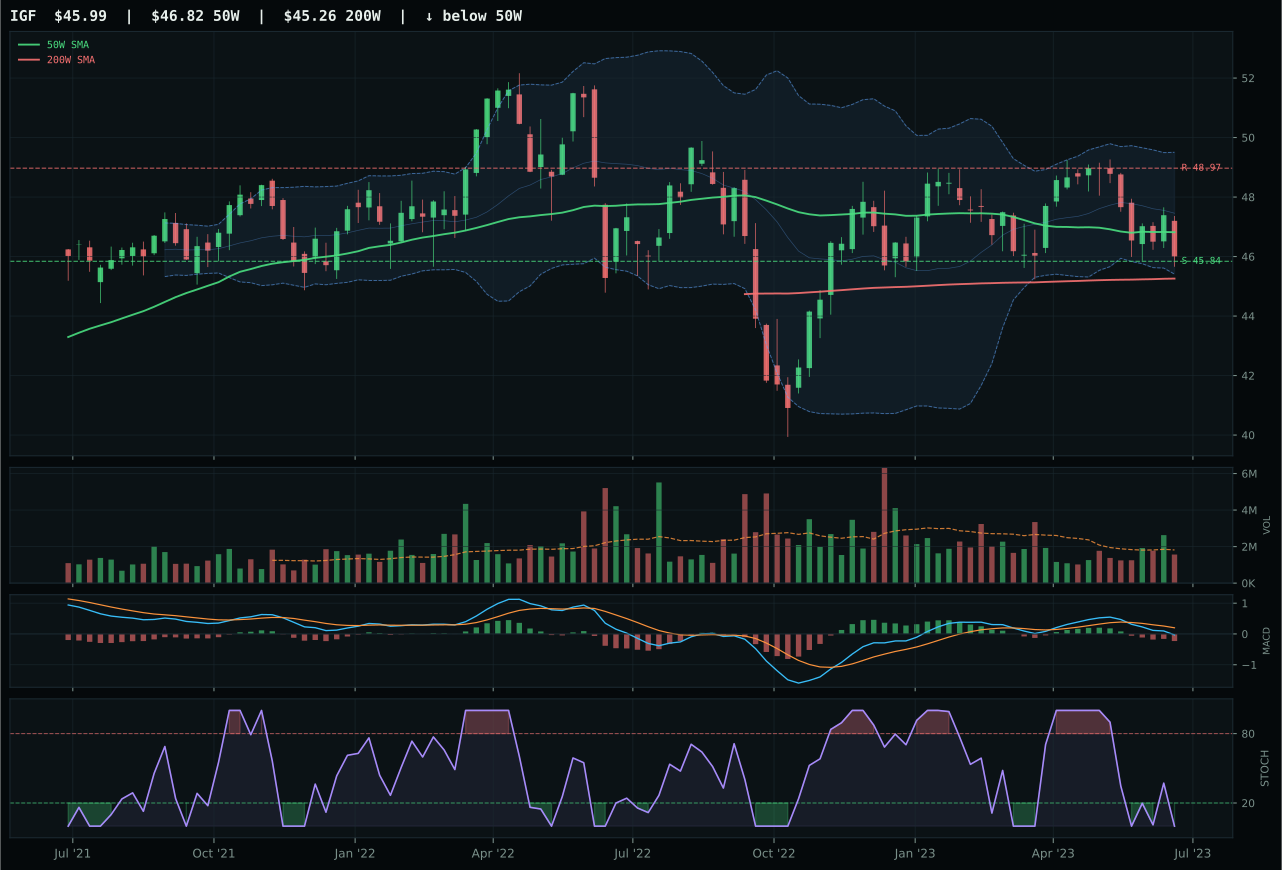
IGF has a pullback into support profile with -9.6% 13-week relative strength versus SPY.
A failed hold above support would weaken the setup.
Actionable but governed by invalidation levels.
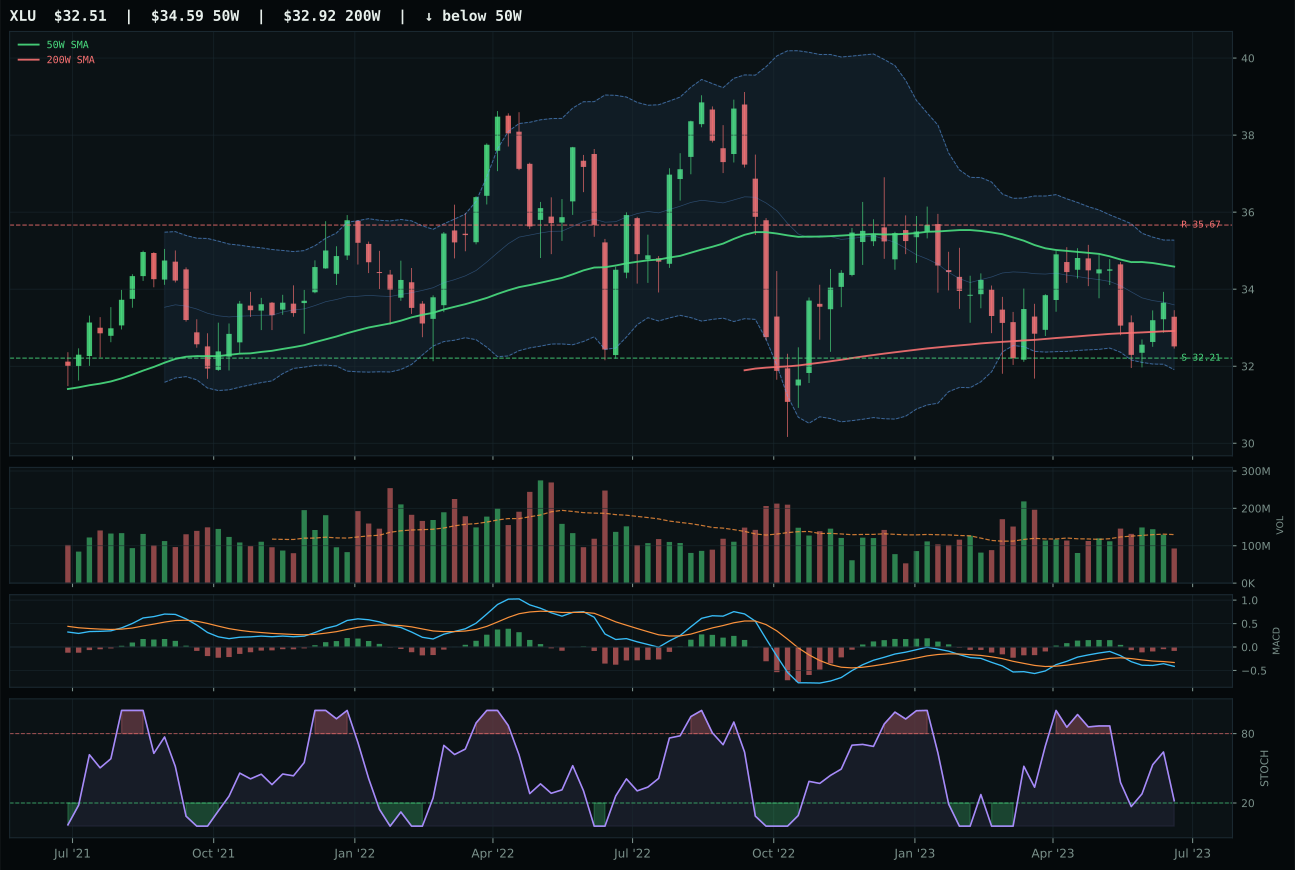
XLU has a pullback into support profile with -10.5% 13-week relative strength versus SPY.
A failed hold above support would weaken the setup.
Actionable but governed by invalidation levels.
PAVE dominates its category by posting the highest portfolio momentum confirmation score (100.0/100) with 11.2% 13-week returns and 11.3% category-relative strength, proving that domestic infrastructure capex demand is outpacing global utilities and traditional utility stocks. The 100.0/100 trend score from price 10.9% above the 50-week and 0.5% slope confirms a clean intermediate uptrend, while the 76.7/100 structure (neutral) and exceptional volume-price confirmation at 82.6/100 reveal that this move is being sponsored by institutional capex positioning. The stochastic RSI is overbought momentum at 0.93, but MACD remains bullish and improving with volume at neutral 0.75x average—not distribution pressure but disciplined institutional accumulation ahead of infrastructure spending cycles. IGF's -9.6% SPY weakness and bearish/weakening MACD expose it as a dead index play in a regime favoring domestic U.S. capex momentum over global dividend income, explaining the 25.4-point score gap.
Utilities & Infrastructure earns 5% at tier-2, justified by a 38.2 category score that reflects infrastructure's emerging appeal as a growth-transition play rather than a defensive utility bet. The 49.0% macro fit is moderate—Transition/Mixed regime helps at +4, yet liquidity stress (-3) and risk appetite (-2) create drag—but PAVE's 86.3/100 technical evidence is the highest composite in tier-2, signaling that domestic capex beneficiaries are outpacing traditional defensive expressions. The 5% allocation is structural recognition that AI data-center power requirements and grid modernization will drive infrastructure demand through 2024, yet the category's overbought momentum and near-52-week-high pricing limit upside. If PAVE's stochastic RSI rolls over or volume shifts from neutral to distribution pressure (0.75x to below 0.60x 20-week average), immediately rebalance the 5% to technology tier-2 or metals tier-2. Conversely, if price breaks above 30.19 resistance with volume expansion, PAVE merits tier-1 consideration at a future review—infrastructure has shifted from yield play to growth cycle, and early recognition of that rotation is worth capital commitment.
Precious Metals — GLD
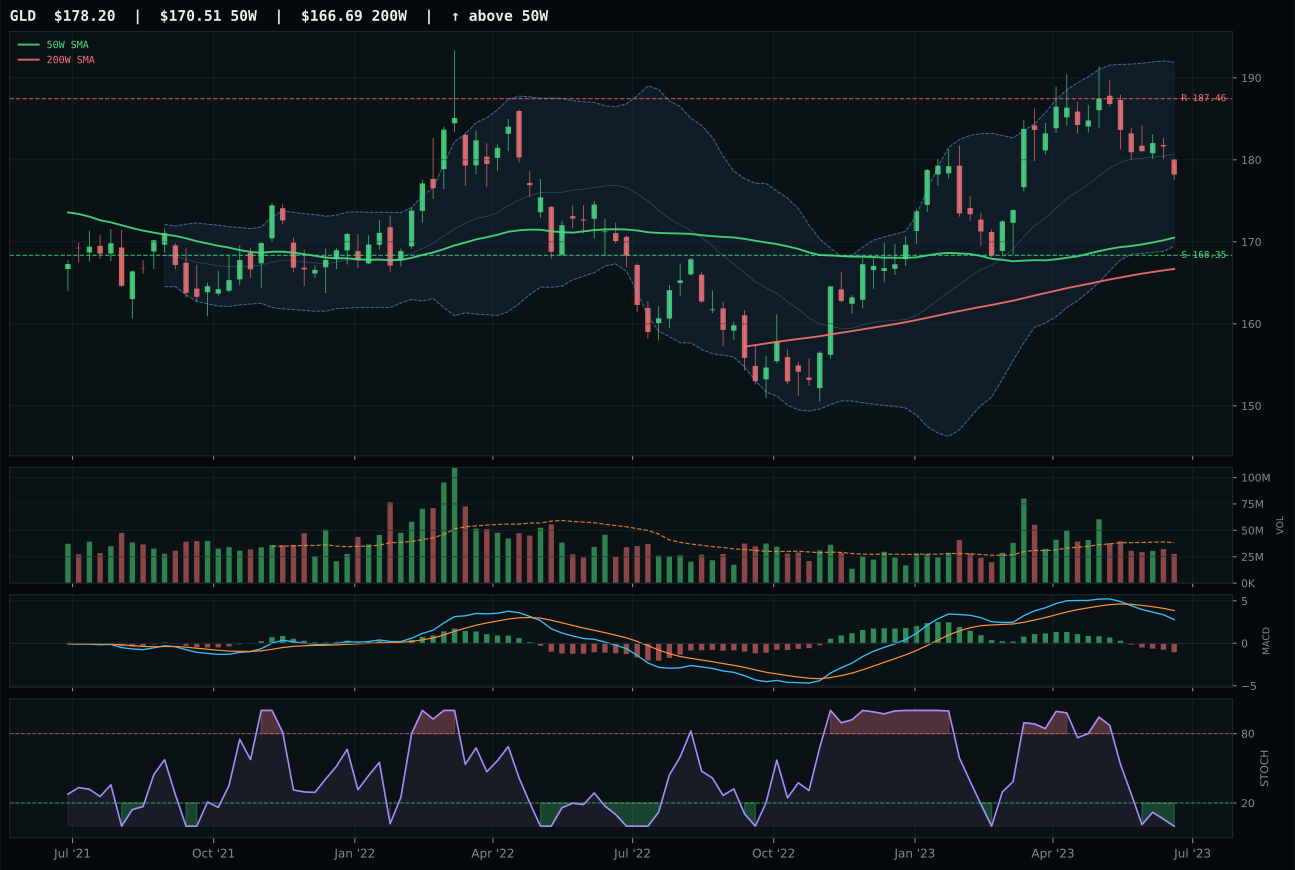
GLD has a neutral structure profile with -12.4% 13-week relative strength versus SPY.
A failed hold above support would weaken the setup.
Actionable but governed by invalidation levels.
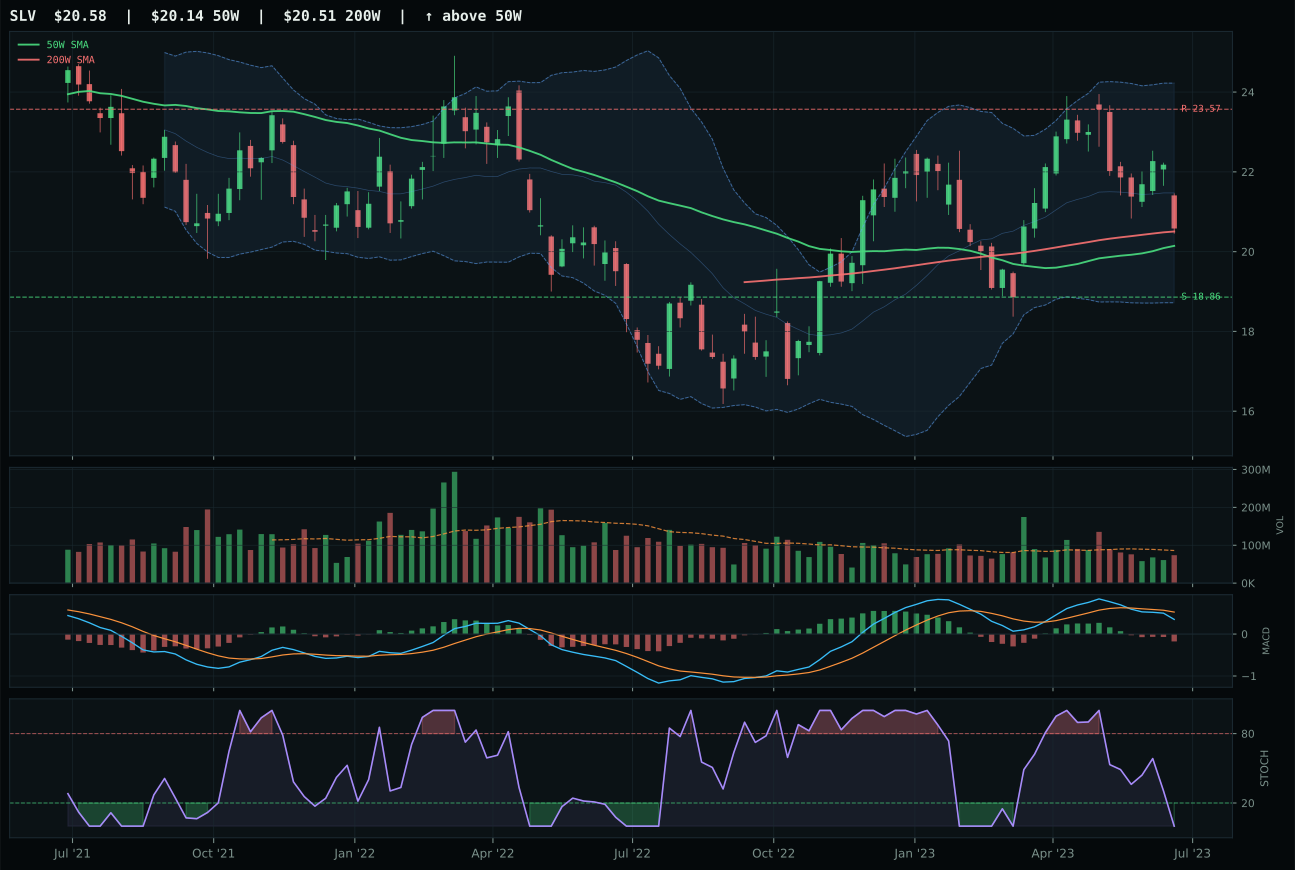
SLV has a compression near 50W profile with -12.5% 13-week relative strength versus SPY.
A failed hold above support would weaken the setup.
Actionable but governed by invalidation levels.
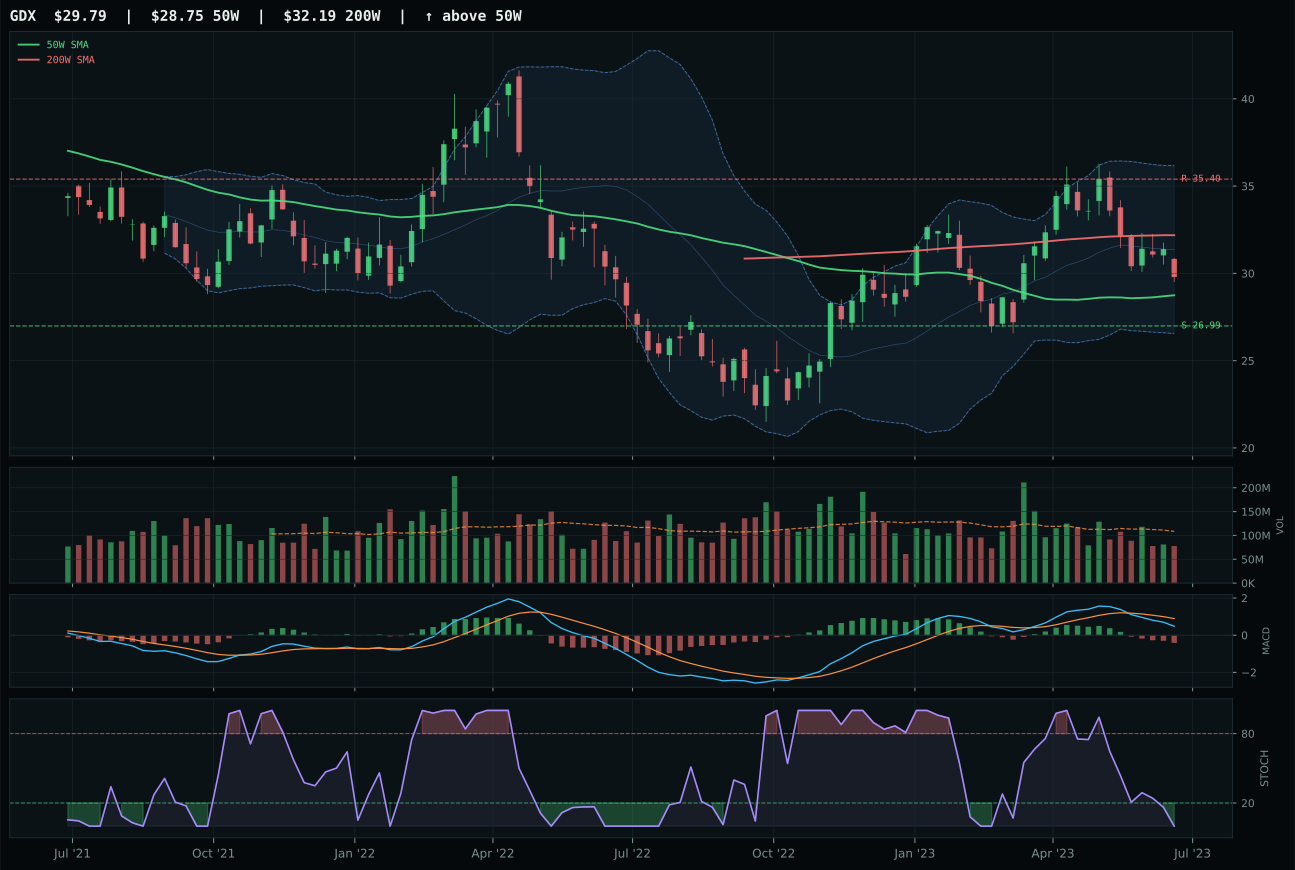
GDX has a neutral structure profile with -15.0% 13-week relative strength versus SPY.
A failed hold above support would weaken the setup.
Actionable but governed by invalidation levels.
GLD wins by default in a category paralyzed by technical deterioration: both GLD and SLV post identical -12.4 to -12.5% SPY relative weakness with flat -3.0% 13-week returns and oversold stochastic RSI at 0.00, yet GLD's 74.3-point composite score edges SLV's 65-point by executing marginally cleaner trend (67.0 vs 57.0) and structure (69.0 vs unknown). Neither setup has conviction—MACD is bearish/weakening across the category, volume participation is thin, and momentum confirmation scores near zero (4.6/100 for GLD), confirming that bullion is holding on monetary hedge faith rather than technical sponsorship. The category's 50/100 macro fit reflects risk appetite's -4 penalty overwhelming any liquidity-stress tailwind, making gold and silver expressions functionally dead weight in a regime where equity risk appetite remains positive and credit stress constrains real-asset rotation.
Precious Metals earns 5% at tier-2 despite a 37.7 category score that ranks among the portfolio's weakest performers, retained primarily for portfolio insurance and diversification mechanics rather than conviction. The 32.9/100 technical evidence and 46.0% macro fit both score in the bottom quartile; gold's historical negative equity correlation is the only argument supporting this allocation in a Transition/Mixed regime where credit stress (-7) and risk appetite (-4) point away from haven demand. The 5% slot would immediately redeploy to higher-ranked opportunities if either category score climbed above 45 or if risk-off signals emerged (volatility spiking, credit spreads widening, equity dividend yields compressing). For now, treat this as a rebalancing hold and a downside insurance premium—GLD and SLV are not broken, but they are quiet, and quiet precious metals in positive risk appetite regimes tend to stay quiet until sentiment completely reverses.
Agriculture & Livestock — WEAT
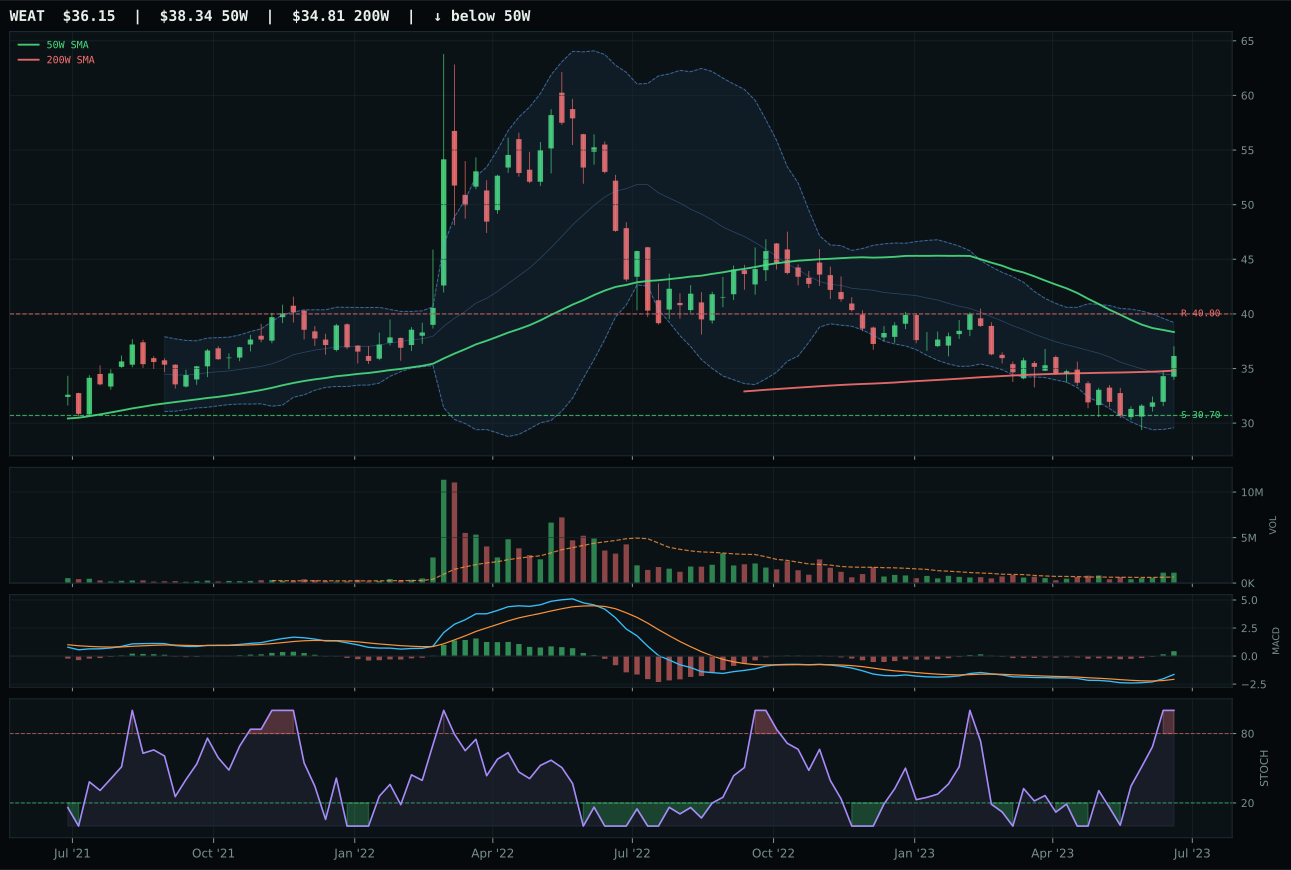
WEAT has a neutral structure profile with -6.6% 13-week relative strength versus SPY.
A failed hold above support would weaken the setup.
Actionable but governed by invalidation levels.
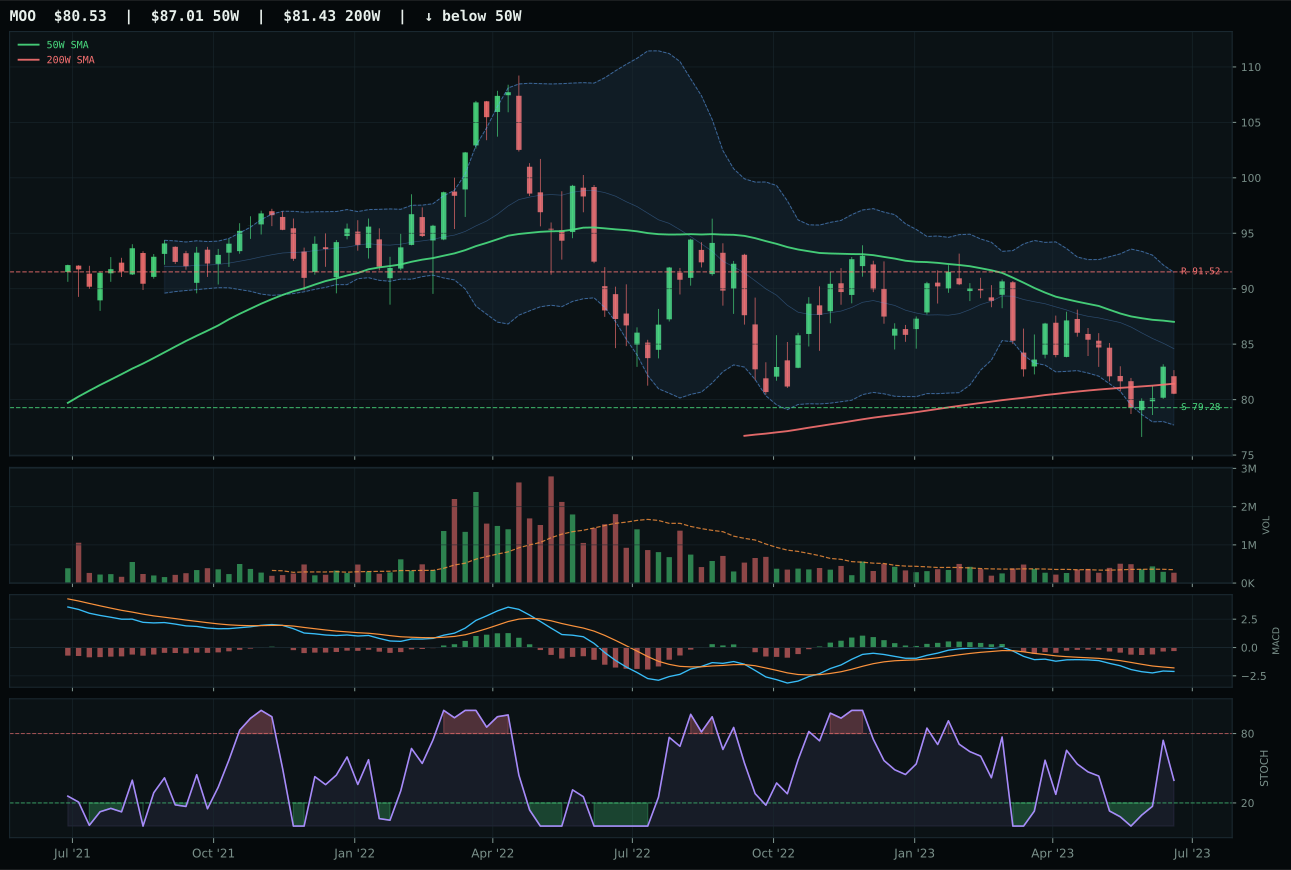
MOO has a pullback into support profile with -13.1% 13-week relative strength versus SPY.
A failed hold above support would weaken the setup.
Actionable but governed by invalidation levels.
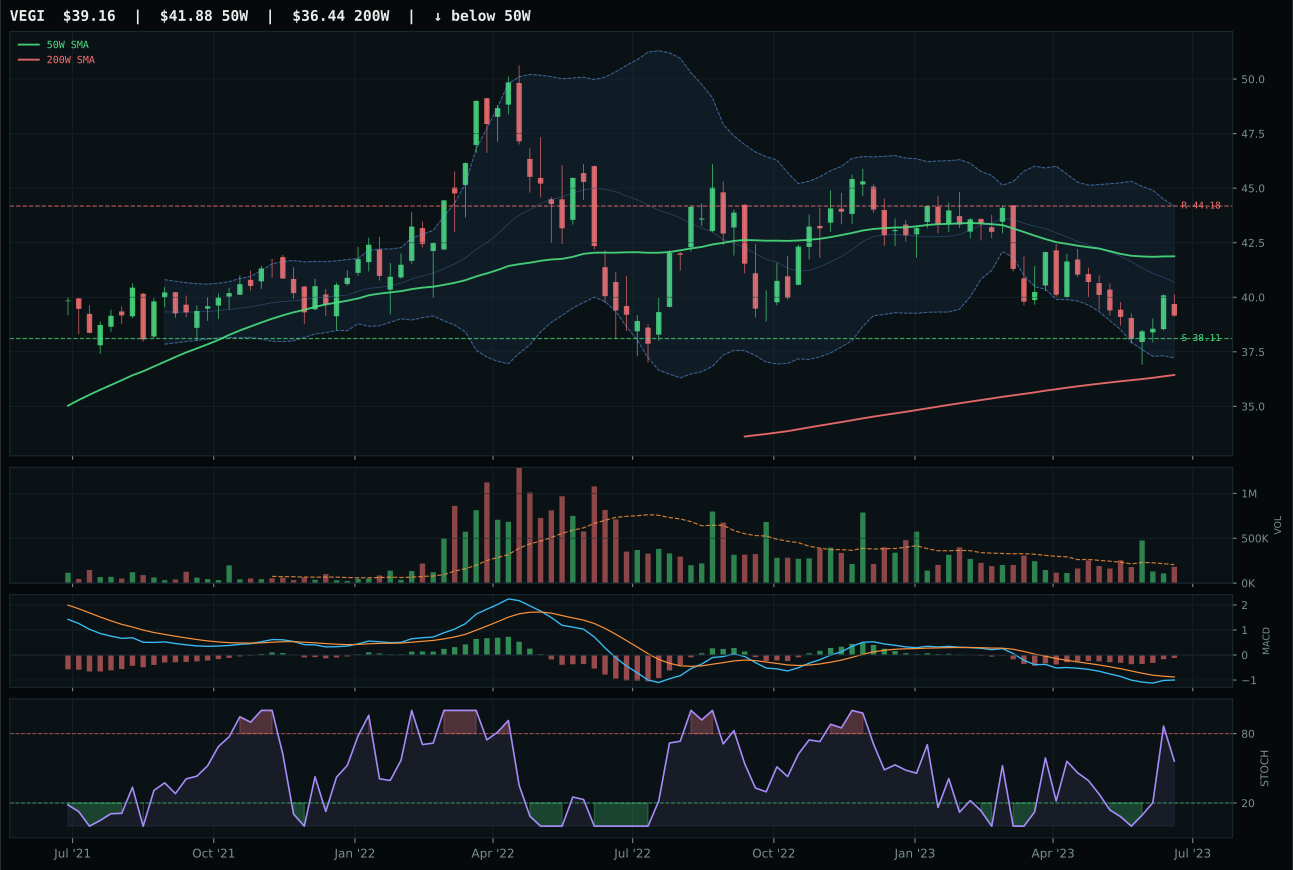
VEGI has a pullback into support profile with -12.1% 13-week relative strength versus SPY.
A failed hold above support would weaken the setup.
Tracked, but not top-2 eligible because: .
WEAT wins a category that received zero allocation by posting the most compelling intermediate setup: price below the 50-week (-5.7%) but still above the 200-week, with stochastic RSI at overbought 1.00 and MACD bullish and improving, marking a genuine mean-reversion coil at deep Fibonacci value (0.618). The 4-week return of 15.5% and 13-week return of 2.8% create a paradox—recent buyers made money, but longer-term performance has stalled, suggesting institutions are testing support at 30.70 with disciplined sizing. Volume at 1.72x the 20-week average and momentum confirmation scoring 97.5/100 reveal accumulation, not distribution—the kind of price action that precedes breakouts when macro conditions align. MOO's 20.6-point score deficit is catastrophic: it posts -3.7% 13-week performance with -13.1% SPY relative weakness, bearish but improving MACD, and thin participation, confirming that generalist agribusiness exposure lacks the conviction driving wheat-specific accumulation.
Agriculture & Livestock receives 0% allocation despite WEAT's 82.0/100 technical evidence because the category score collapsed to 32.7 after testing against persistence, volume-price sponsorship, and setup quality. The macro fit of 59.0% is respectable—commodity breadth positive is +5, real asset sponsorship is +8—yet liquidity stress (-4) drags and the category itself ranks 9th or 10th among the portfolio's ten allocation slots. The regime's top-2 positions (AI and Nuclear) absorb the conviction capital, while tier-2 categories (Technology, Defense, Metals, Energy, Infrastructure) are favored over a pure commodity bet that lacks diversification benefit. WEAT's setup is technically sound but isolated; it would earn tier-2 status only if commodity breadth extended to broader agricultural equities or if real asset sponsorship intensified enough to carry the category higher. For now, the opportunity sits on the bench—a trade-watch candidate if liquidity stress reverses and real assets rotate into top-2 conviction.
Emerging Markets — ILF
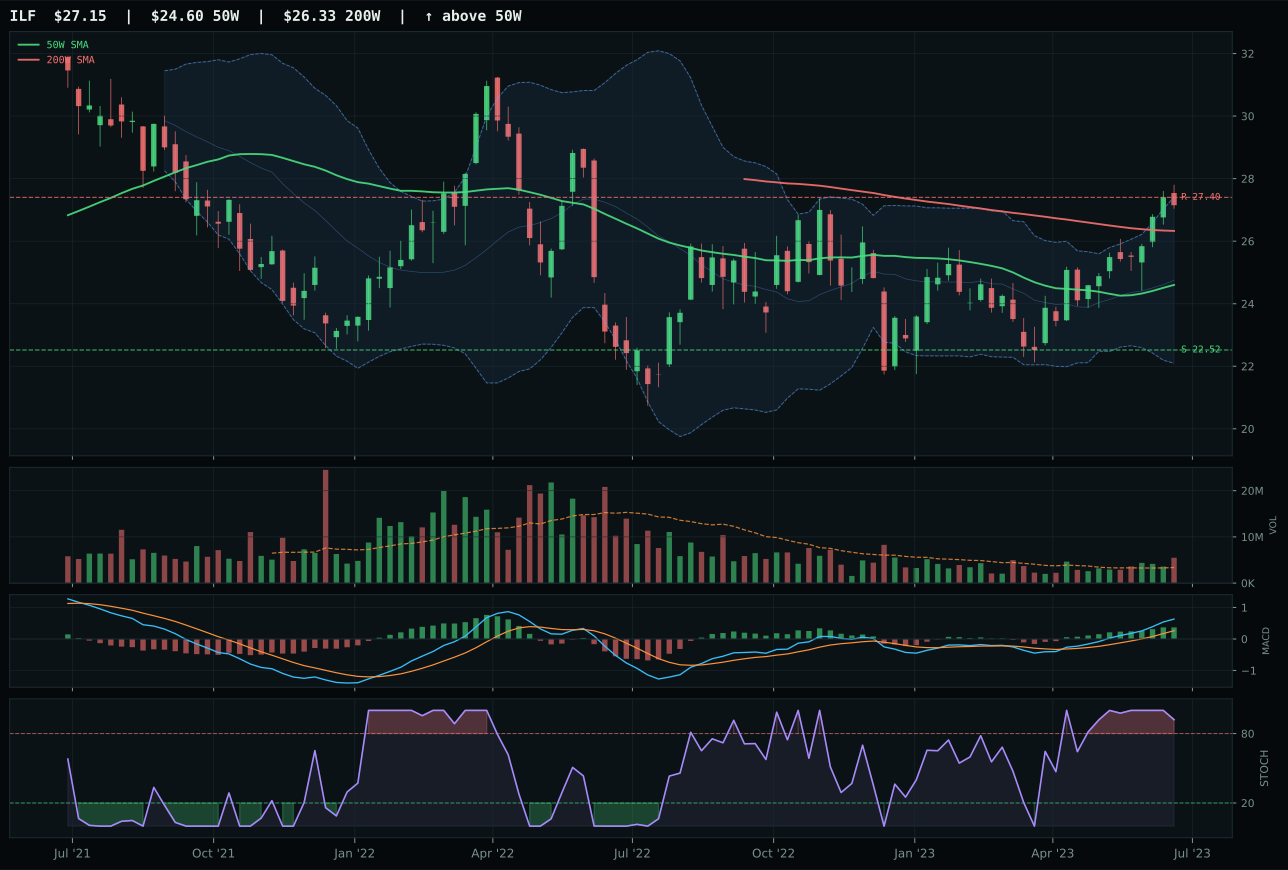
ILF has a neutral structure profile with 11.1% 13-week relative strength versus SPY.
A failed hold above support would weaken the setup.
Actionable but governed by invalidation levels.
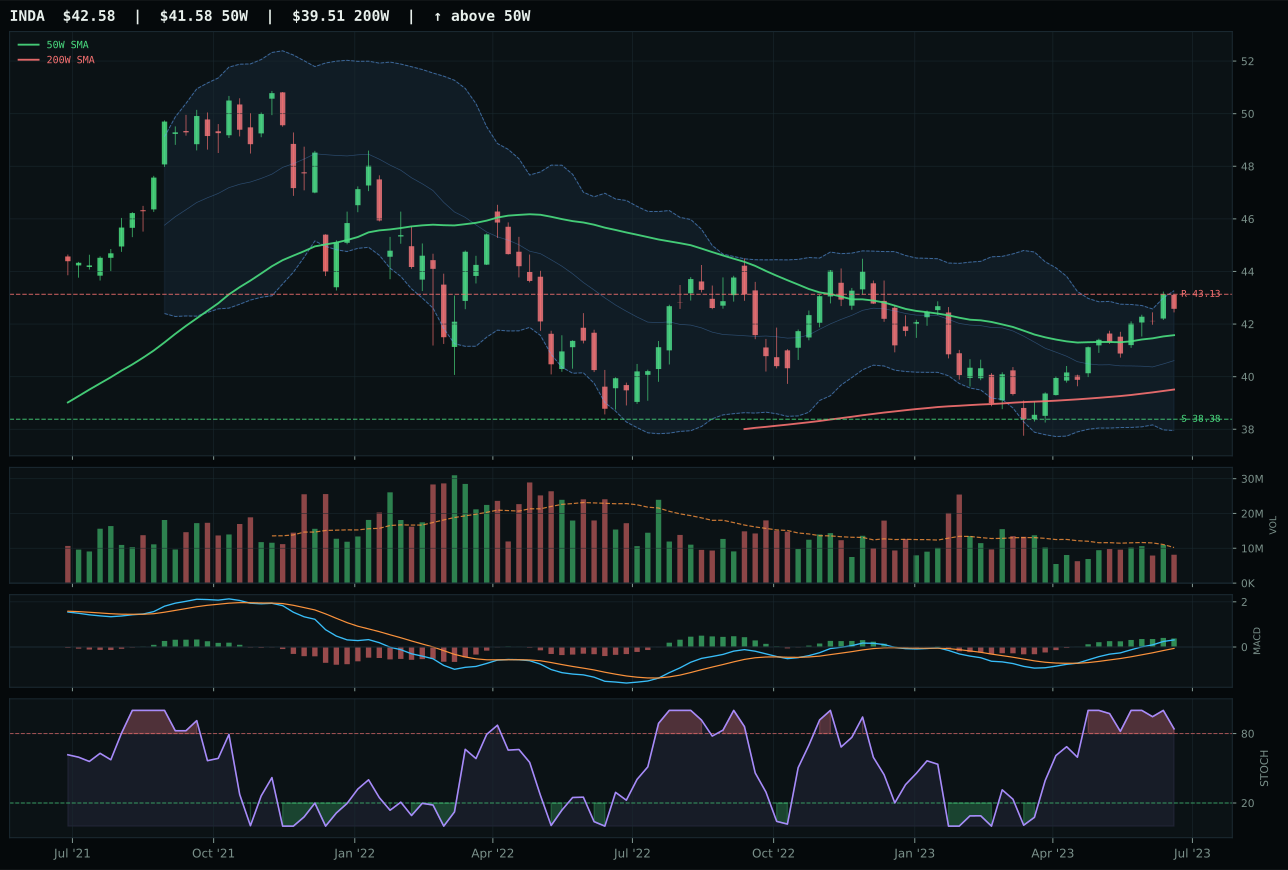
INDA has a compression near 50W profile with 1.0% 13-week relative strength versus SPY.
A failed hold above support would weaken the setup.
Actionable but governed by invalidation levels.
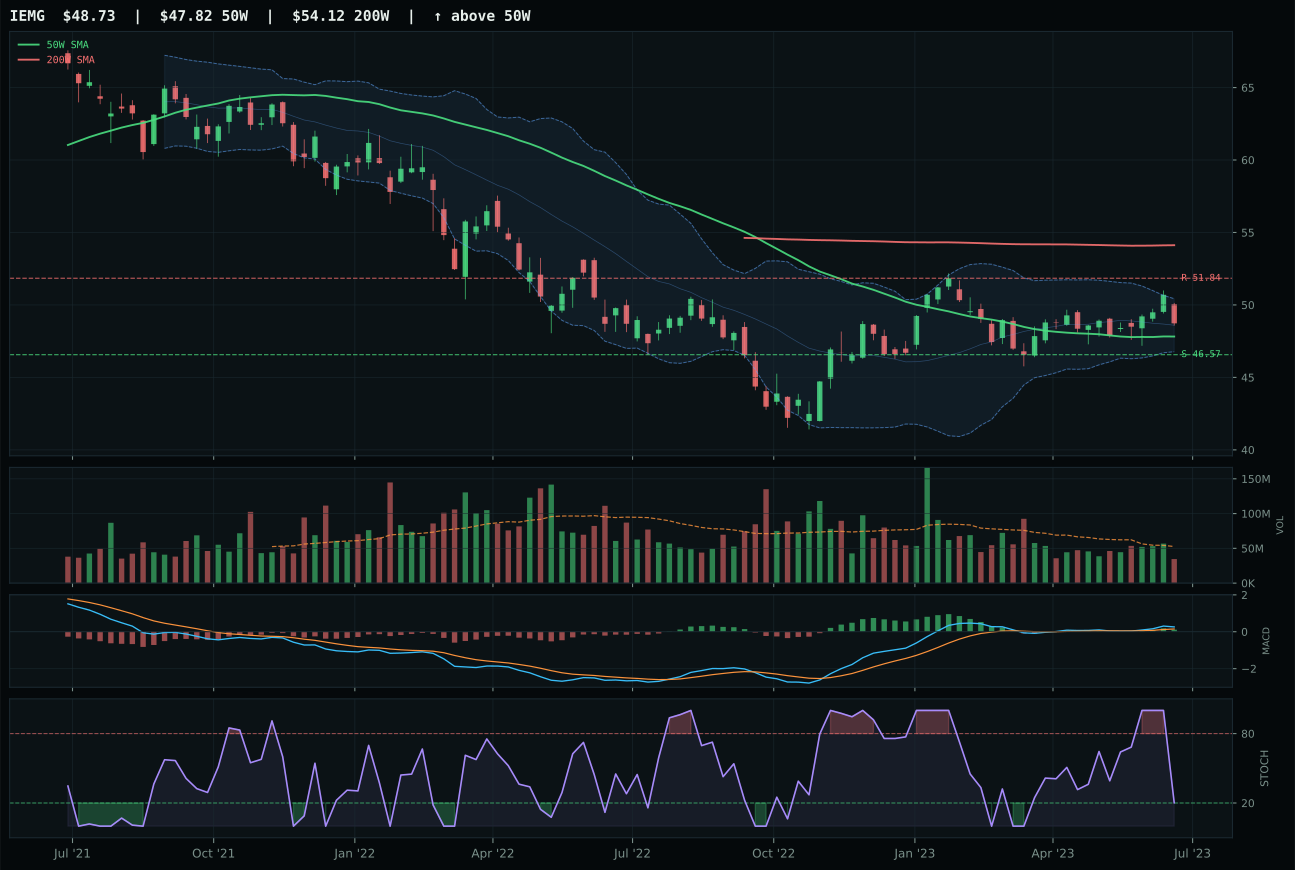
IEMG has a pullback into support profile with -7.6% 13-week relative strength versus SPY.
A failed hold above support would weaken the setup.
Actionable but governed by invalidation levels.
ILF wins the category with a paradoxical setup: it posts the strongest trend evidence in the entire portfolio (100.0/100) with 20.6% 13-week returns and 11.1% SPY relative strength, yet the category itself receives zero allocation because risk-reward has evaporated. At 10.4% extended above the 50-week near the 52-week high, ILF is facing only -0.9% upside to resistance (28.13 level) against 20.6% downside to support, inverting the asymmetry every allocator seeks. Stochastic RSI is overbought rolling over at 0.92, volume trades at 1.63x average (distribution pressure), and momentum confirmation of 100.0/100 actually signals that all available buyers have already acted—classic late-stage extension in an emerging-markets category suffering from credit stress (-10) and liquidity stress (-10). INDA's 0.0% category-relative strength versus ILF's 10.1% confirms market preference for Latin America commodity exposure, yet even that edge cannot overcome the portfolio's macro regime rejection of emerging markets altogether.
Emerging Markets receives 0% allocation despite ILF's technical excellence because the category score of 30.2 ranks 9th or 10th in this week's regime, with 38.0% macro fit that reflects credit stress (-10) and liquidity stress (-10) overwhelming commodity breadth positive (+8). In a Transition/Mixed environment, credit stress narrows to developing-market credit spreads, and liquidity stress constrains currency hedging and EM fund flows—structural headwinds that technical momentum cannot overcome. ILF's extended setup and overbought momentum actually reinforce the rejection: the category's best performer is already priced for perfection, leaving no opportunity for risk-adjusted entry. Allocators should monitor this category for mean-reversion signals: if credit stress descriptors reverse (widened EM spreads tighten) and ILF's price breaks below 25.00 support with volume confirmation, a 5% tier-2 position becomes tactically attractive as a contrarian play on re-risking. For now, capital is better deployed in tech growth (AI) and energy (nuclear) where macro tailwinds align with technical setup cleanliness rather than chasing EM strength that has already materialized.