
2023-06-16
Informational purposes only. The content in this report, including allocations, analysis, and commentary, is provided solely for informational and educational purposes. It does not constitute financial advice, investment advice, trading advice, or any other type of advice. Past performance does not guarantee future results. Always conduct your own research and consult a qualified financial professional before making investment decisions.
Weekly Allocation
| Ticker | Category | Weight | Role |
|---|---|---|---|
| FBTC | 50% | Overlay | |
| COPX | Industrial Metals | 10% | Top-2 (10%) |
| XLE | Traditional Energy | 10% | Top-2 (10%) |
| URNM | Nuclear Energy | 5% | Tier-2 (5%) |
| SMH | AI | 5% | Tier-2 (5%) |
| IGV | Technology | 5% | Tier-2 (5%) |
| ILF | Emerging Markets | 5% | Tier-2 (5%) |
| WEAT | Agriculture & Livestock | 5% | Tier-2 (5%) |
| XAR | Defense & Aerospace | 5% | Tier-2 (5%) |
Trade Instructions — Monday Open
Sell the tranche from 2023-05-19 (completing its 4-week hold). Buy the new tranche. Instructions show net portfolio changes — same-asset positions cancel, weight changes show the delta.
| Action | Ticker | Instruction |
|---|---|---|
| SELL | GLD | Sell 40% of GLD position (reduce 6.25% → 3.75%) |
| SELL | PAVE | Sell 40% of PAVE position (reduce 6.25% → 3.75%) |
| SELL | XLK | Sell entire XLK position (1.25% of portfolio) |
| BUY | COPX | Buy COPX — 20.00% of freed cash (adds 1.25% to portfolio) |
| BUY | XLE | Buy XLE — 40.00% of freed cash (adds 2.50% to portfolio) |
| BUY | IGV | Buy IGV — 20.00% of freed cash (adds 1.25% to portfolio) |
| BUY | WEAT | Buy WEAT — 20.00% of freed cash (adds 1.25% to portfolio) |
Current Portfolio After Trade
Combined holdings across all 4 active tranches. Each tranche is 25% of the portfolio.
| Ticker | % of Portfolio | Weight Bar |
|---|---|---|
| FBTC | 50.00% | |
| SMH | 8.75% | |
| IGV | 6.25% | |
| COPX | 5.00% | |
| XAR | 5.00% | |
| XLE | 3.75% | |
| GLD | 3.75% | |
| PAVE | 3.75% | |
| URNM | 2.50% | |
| ILF | 2.50% | |
| CIBR | 2.50% | |
| INDA | 2.50% | |
| URA | 2.50% | |
| WEAT | 1.25% |
Macro Regime — Late-Cycle Reflation
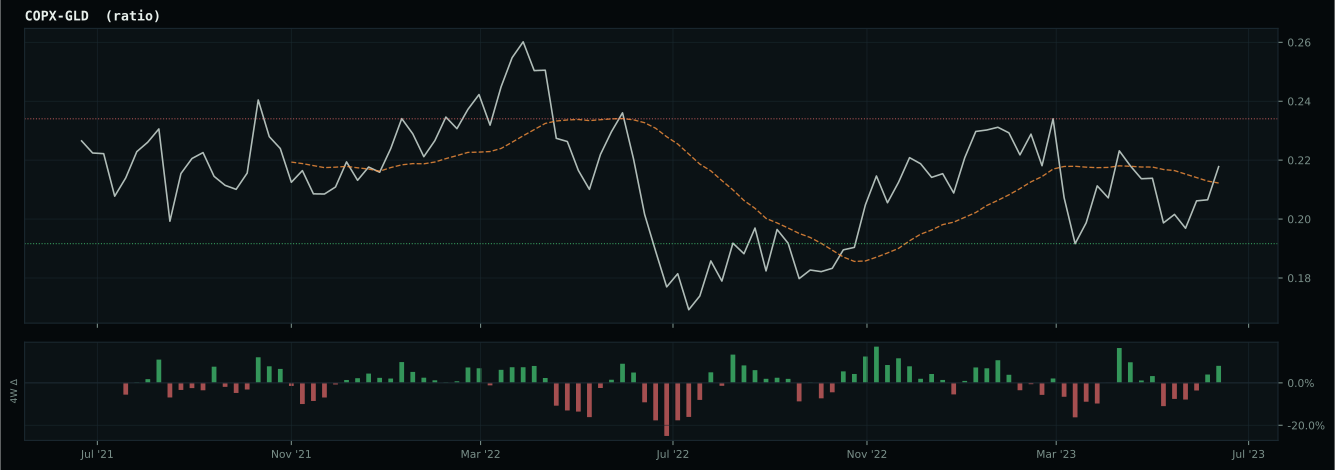
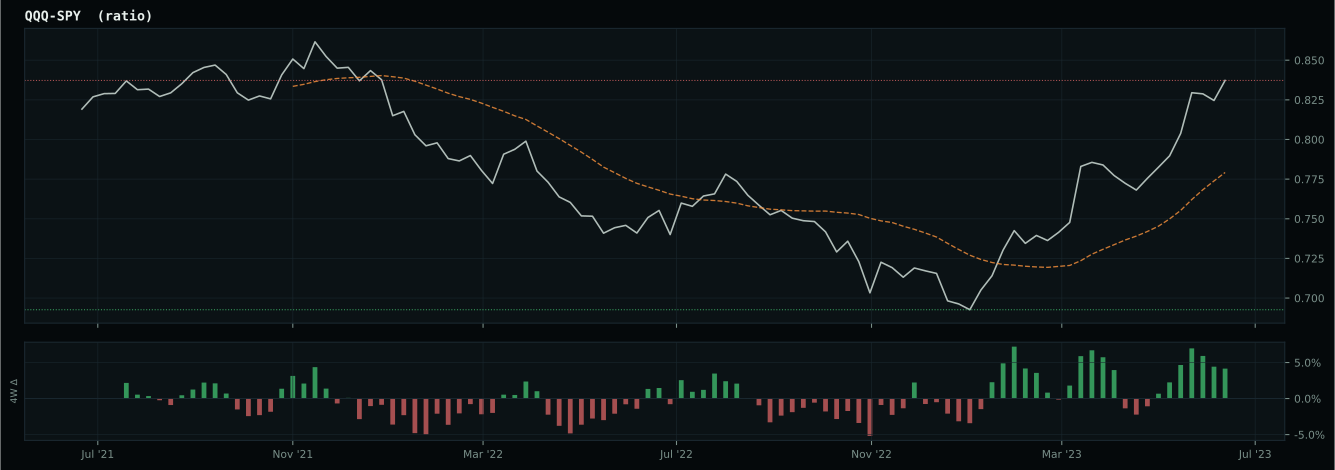
Macro Evidence Charts
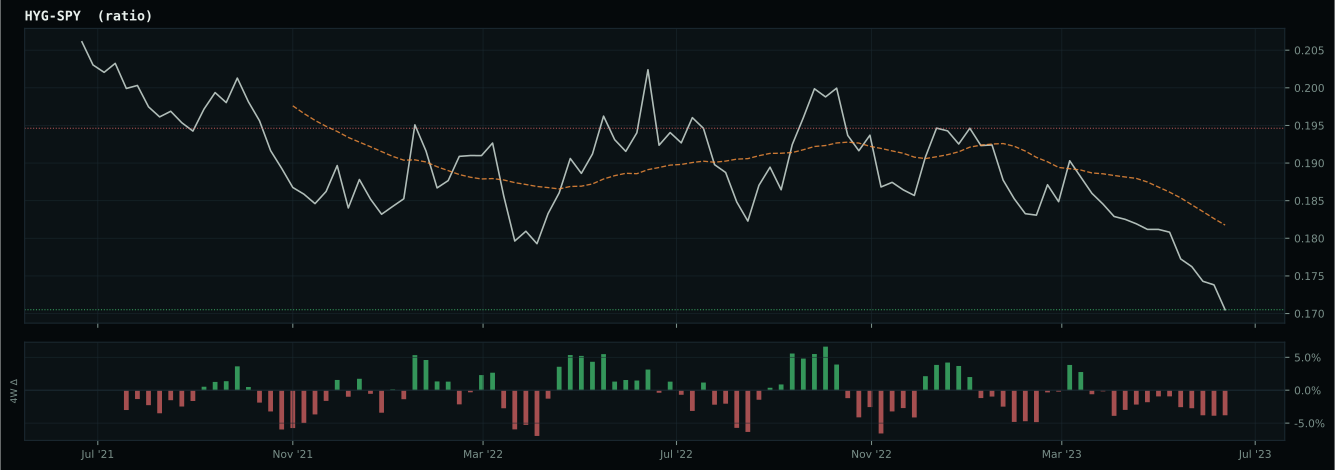
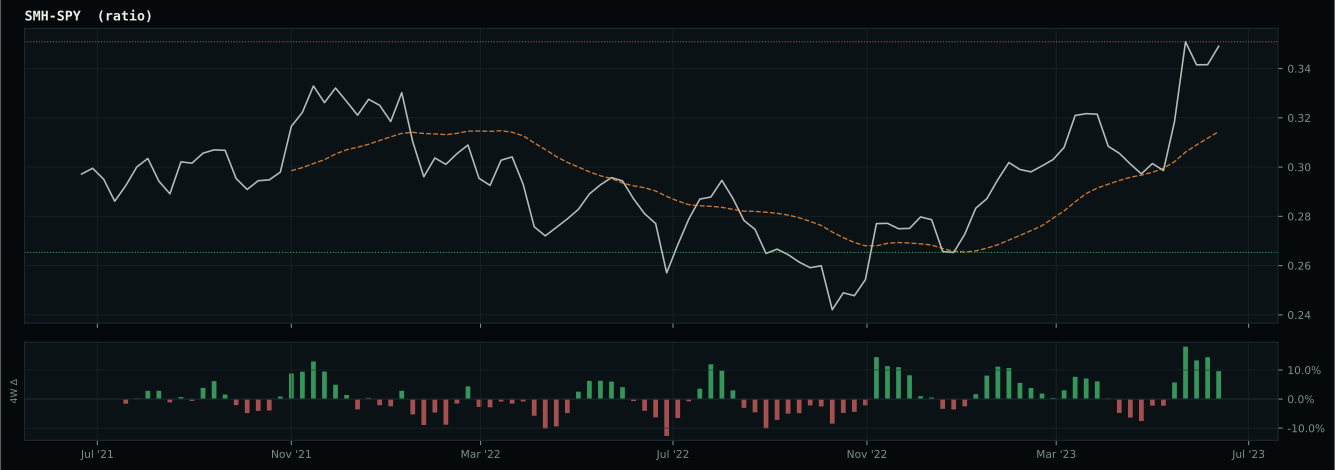
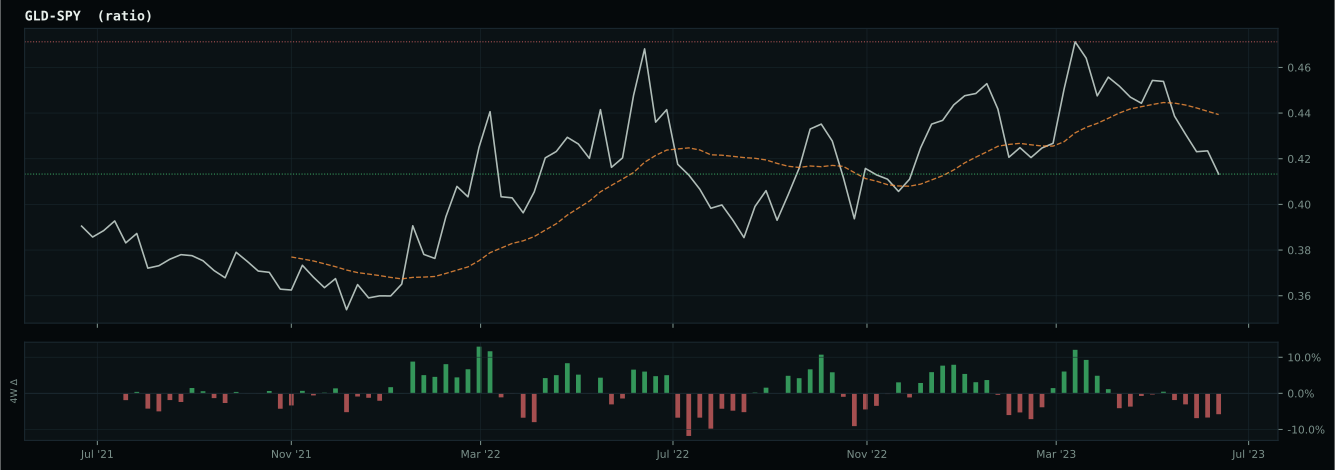
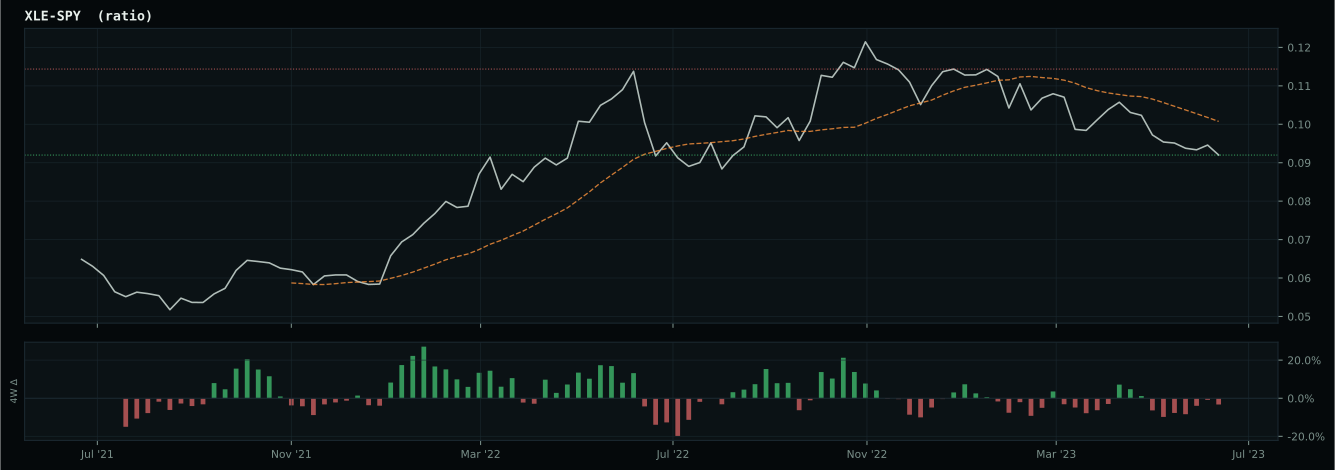
Market-implied signals behind the macro regime scores. Each ratio compares two assets; the direction and slope of the ratio is what the macro engine reads.
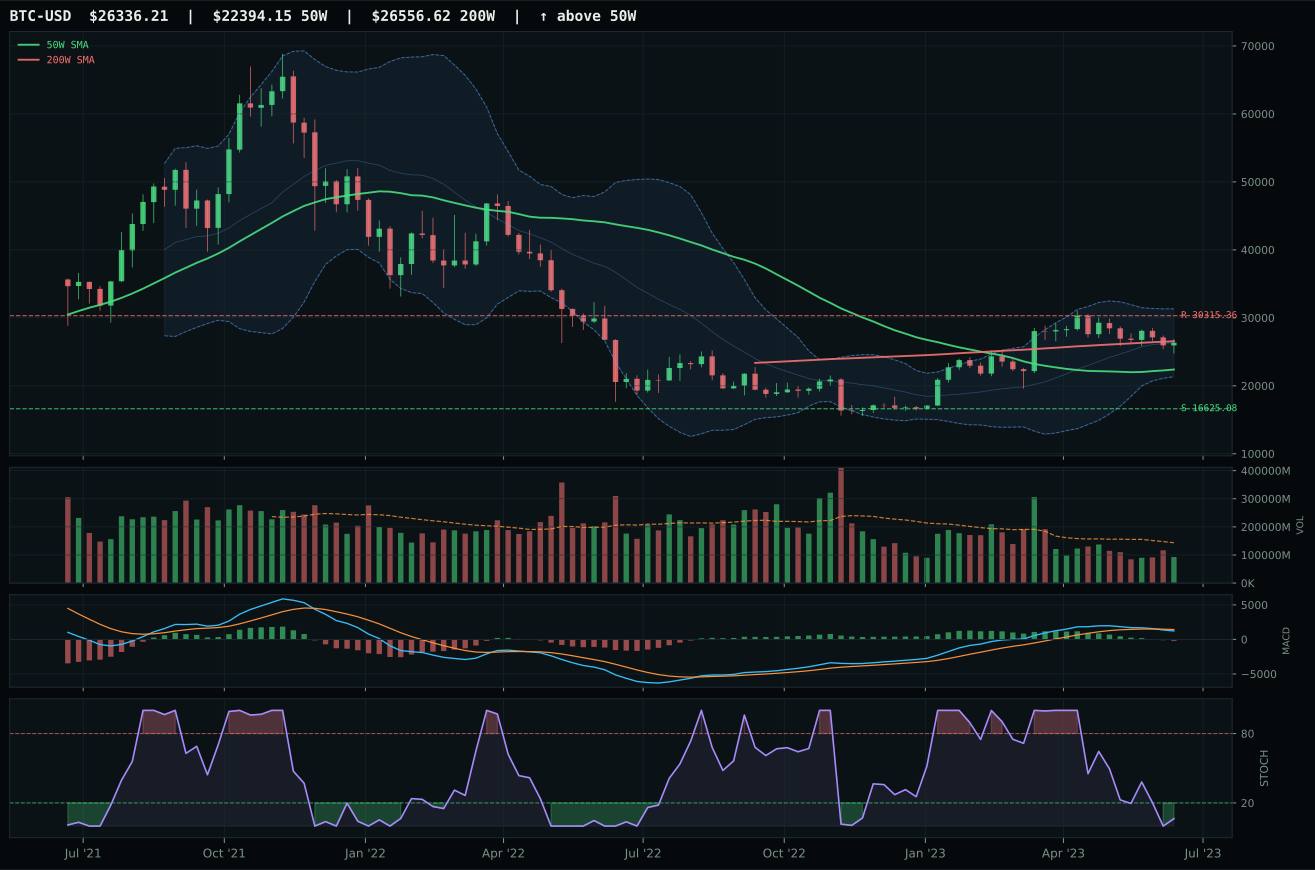
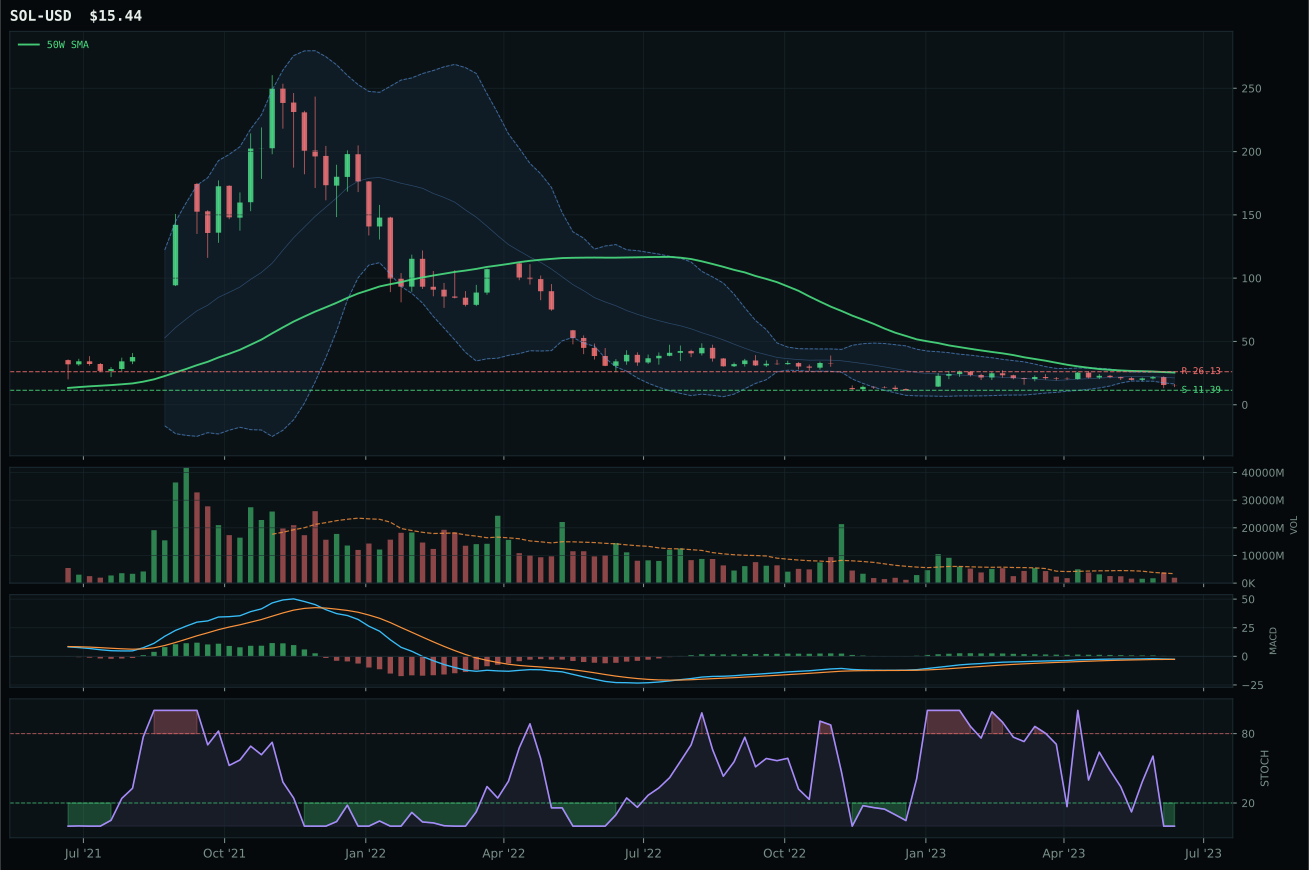
Crypto Regime — TrendBTC
post-touch structure is too wide to count as a range; max/min close ratio is 1.86
TrendBTC confirmed: 2 consecutive closes above rising/flat 50W SMA
one or more available conditions failed
Category Rankings
| Rank | Category | Winner | Score | Alloc | 4W Ret | Peers (4W) |
|---|---|---|---|---|---|---|
| 1 | Industrial Metals | COPX | 76.0 | 20% | +0.92% | REMX +0.3% · PICK +2.0% |
| 2 | Traditional Energy | XLE | 73.0 | 20% | +1.93% | FCG +1.1% · XOP +1.9% |
| 3 | Nuclear Energy | URNM | 70.1 | 10% | -3.28% | URA -4.1% · NLR -1.0% |
| 4 | AI | SMH | 68.2 | 10% | +2.93% | AIQ +3.1% · BOTZ +0.2% |
| 5 | Technology | IGV | 60.6 | 10% | +4.50% | XLK +2.6% · CIBR +0.2% |
| 6 | Emerging Markets | ILF | 57.5 | 10% | -1.71% | INDA +3.0% · IEMG +1.5% |
| 7 | Agriculture & Livestock | WEAT | 47.1 | 10% | -1.31% | MOO +1.6% · VEGI +1.5% |
| 8 | Defense & Aerospace | XAR | 45.8 | 10% | +0.73% | ITA +0.4% · ROKT +2.4% |
| 9 | Utilities & Infrastructure | PAVE | 35.3 | 0% | +5.36% | IGF +0.3% · XLU +0.1% |
| 10 | Precious Metals | GLD | 34.0 | 0% | +0.52% | SLV +6.0% · GDX +2.9% |
Industrial Metals — COPX
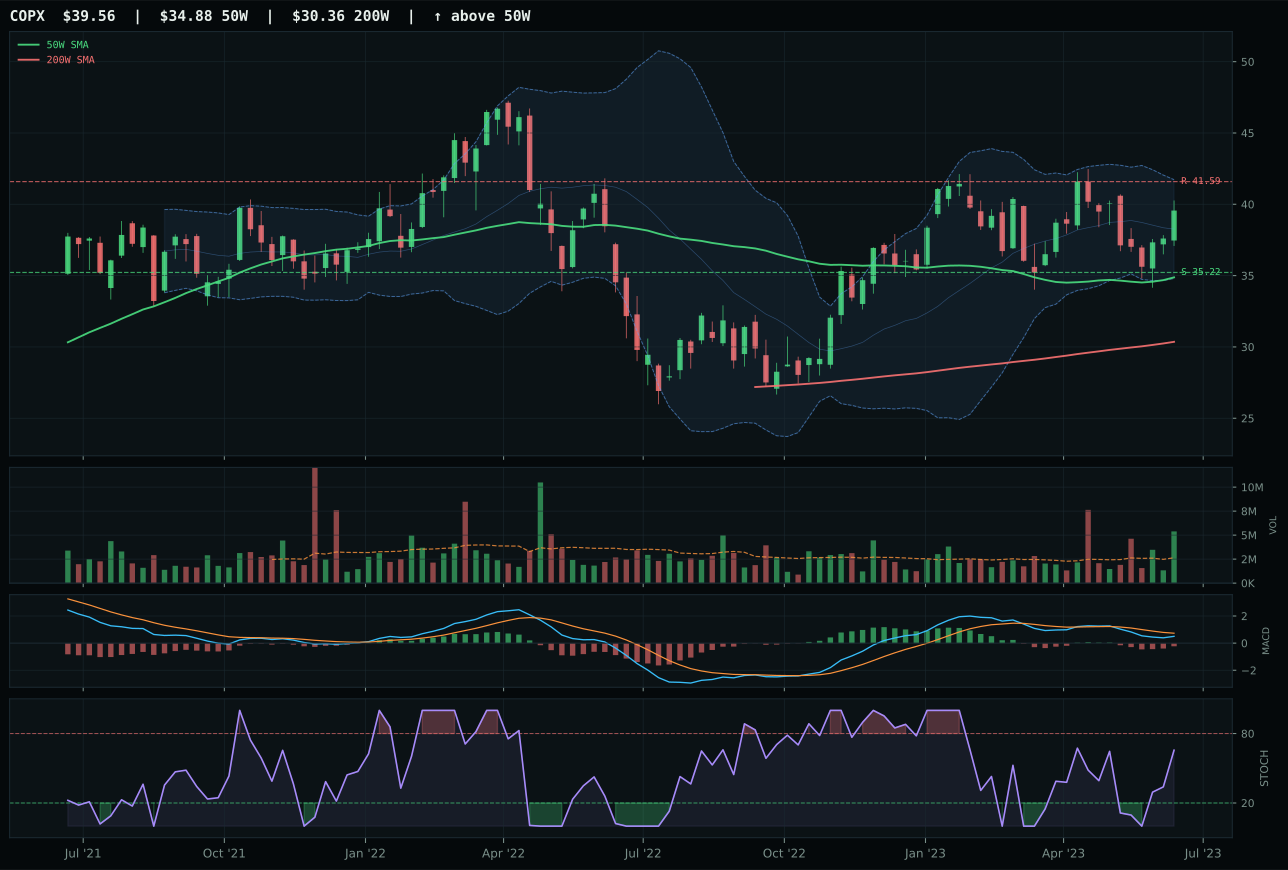
COPX has a neutral structure profile with -0.4% 13-week relative strength versus SPY.
A failed hold above support would weaken the setup.
Actionable but governed by invalidation levels.
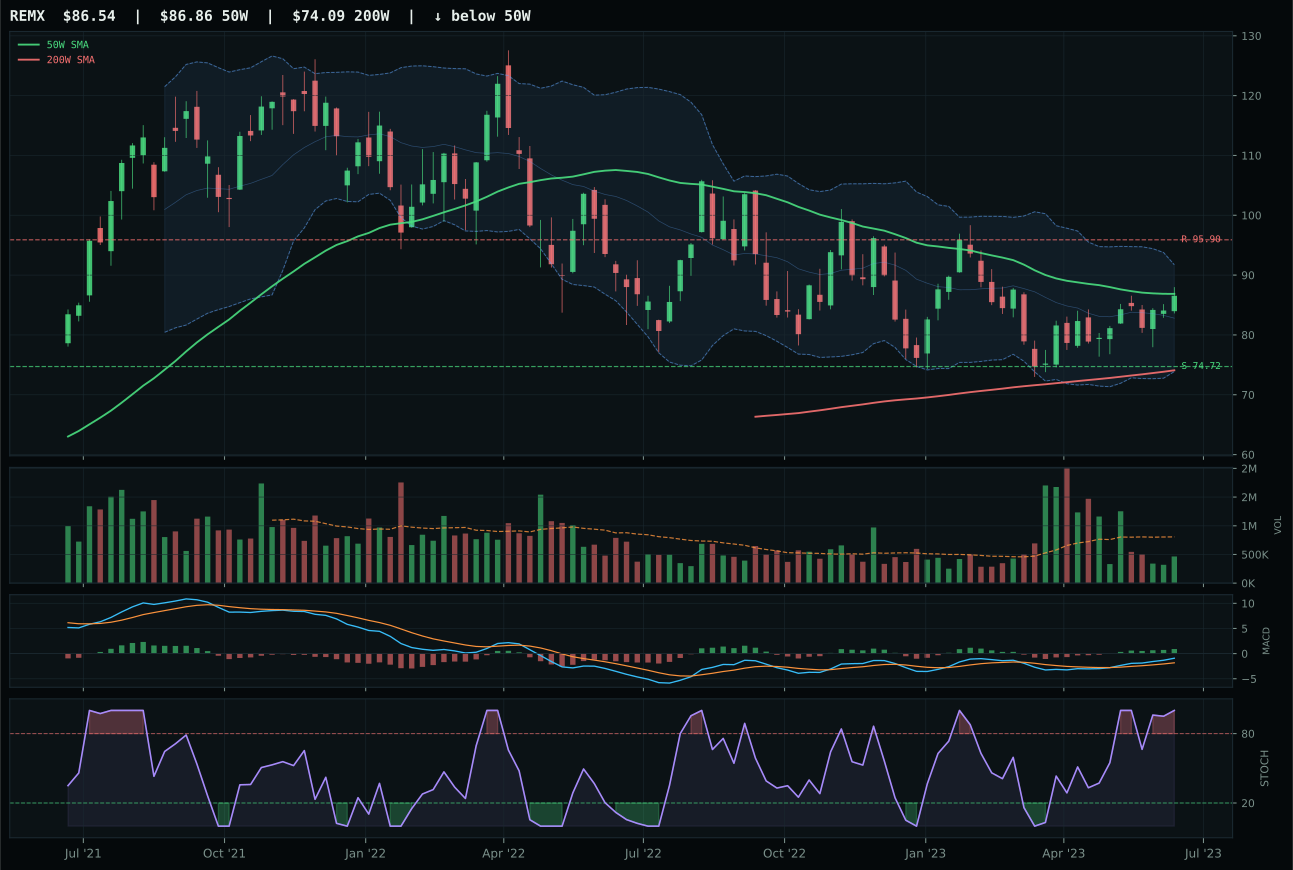
REMX has a compression near 50W profile with 3.1% 13-week relative strength versus SPY.
A failed hold above support would weaken the setup.
Actionable but governed by invalidation levels.
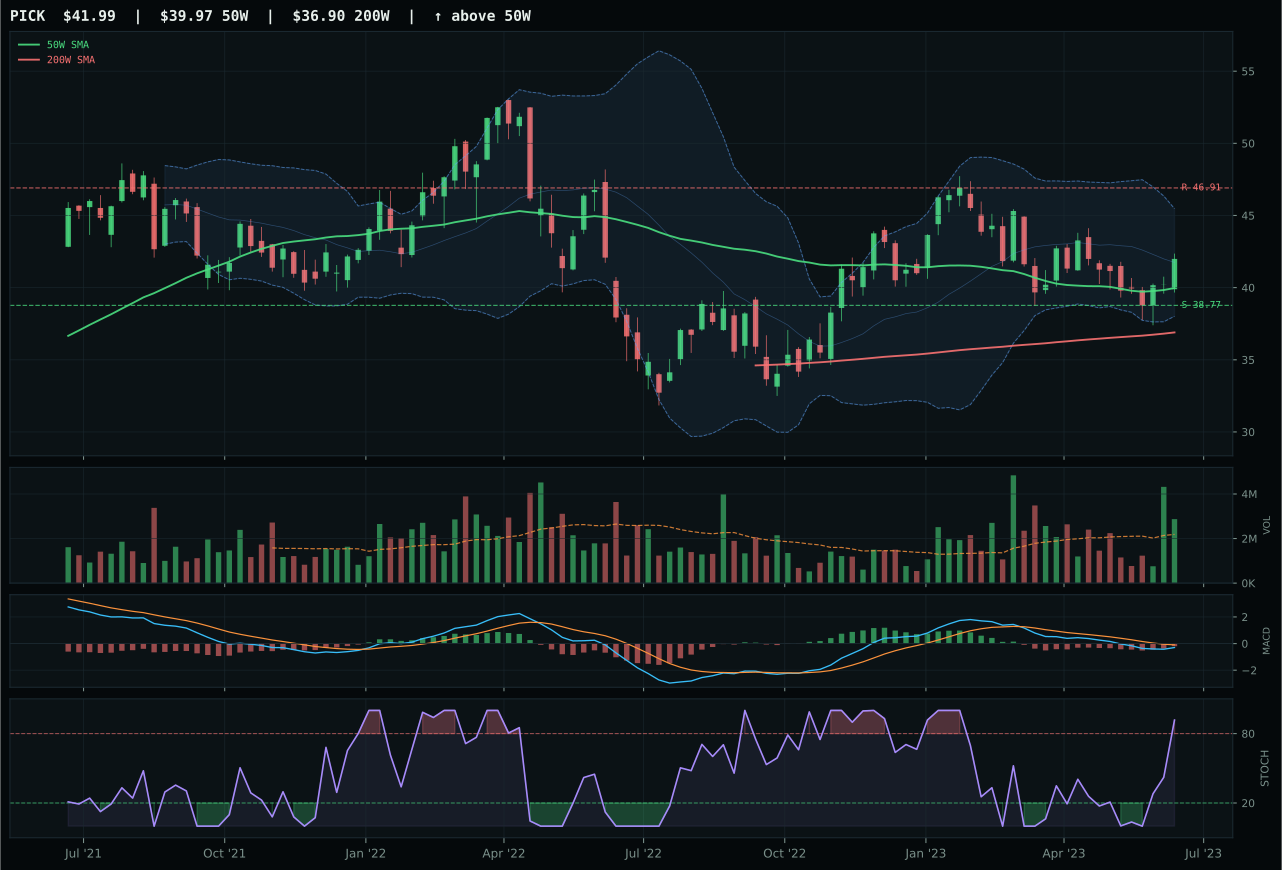
PICK has a neutral structure profile with -6.8% 13-week relative strength versus SPY.
A failed hold above support would weaken the setup.
Actionable but governed by invalidation levels.
COPX captures top-2 status with a 76.0 category score and 10% allocation by combining rock-solid trend (92.5) with exceptional volume-price confirmation (85.5) and persistent 82.8 momentum confirmation. The setup is neutral structure at 13.4% above the 50W, which positions COPX as a controlled accumulation trade rather than an extended chase; volume at 2.04x the 20W average in accumulation/confirmation pattern signals institutional conviction without panic buying. MACD is bearish-but-improving and stochastic RSI sits at rising mid-zone (0.66), not overbought, a configuration that rewards steady buyers over manic chasers. REMX, the close runner-up at a 1.4-point gap, boasts superior timing (100.0 versus COPX's 83.0) and competitive momentum (85 versus 83), yet its stochastic RSI overbought momentum and thin participation volume indicate forced buying or momentum follower accumulation rather than foundational demand. COPX's 12.3% thirteen-week return and neutral category-relative strength (0.0%) confirm that copper scarcity beta is attracting steady sponsorship aligned with supply-shock narratives, not speculative chasing.
Industrial metals earned 10% top-2 allocation with a category score of 76.0 and macro fit of 75.0, the highest macro alignment among all categories this week. Late-cycle reflation delivers explicit tailwinds: metals scarcity +14, commodity breadth positive +10, real asset sponsorship +6, with only liquidity stress -8 as a drag. COPX's technical evidence score of 89.1 justifies the overweight; the combination of trend strength, volume accumulation, and momentum persistence in a category where macro descriptors are explicitly active creates a high-conviction setup. The portfolio weights COPX and XLE (traditional energy) at 10% each because both categories offer synchronized macro drivers (supply shortage, inflation pressure, real asset flows) and technical setups that avoid extended momentum chasing. COPX sits at only 13.4% extension from the 50W with clean accumulation, while XLE sits just 2.3% below its 50W in a coil pattern, both offering sound risk/reward. This category ranks second only because energy's macro fit (90.0) edges metals marginally, and XLE's timing score of 100.0 reflects perfect setup geometry. Industrial metals are the portfolio's core real-asset convex bet in the current regime.
Traditional Energy — XLE
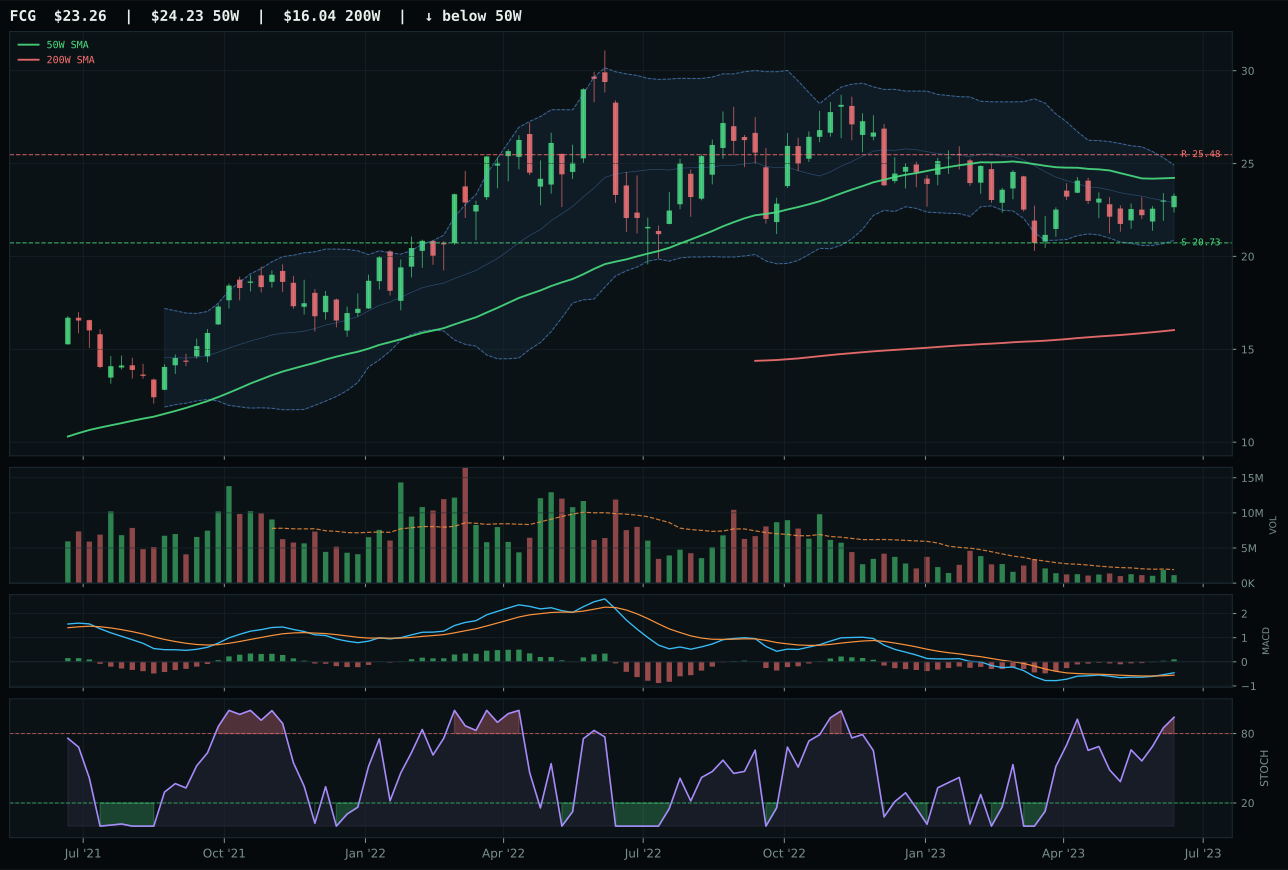
FCG has a neutral structure profile with -0.5% 13-week relative strength versus SPY.
A failed hold above support would weaken the setup.
Actionable but governed by invalidation levels.
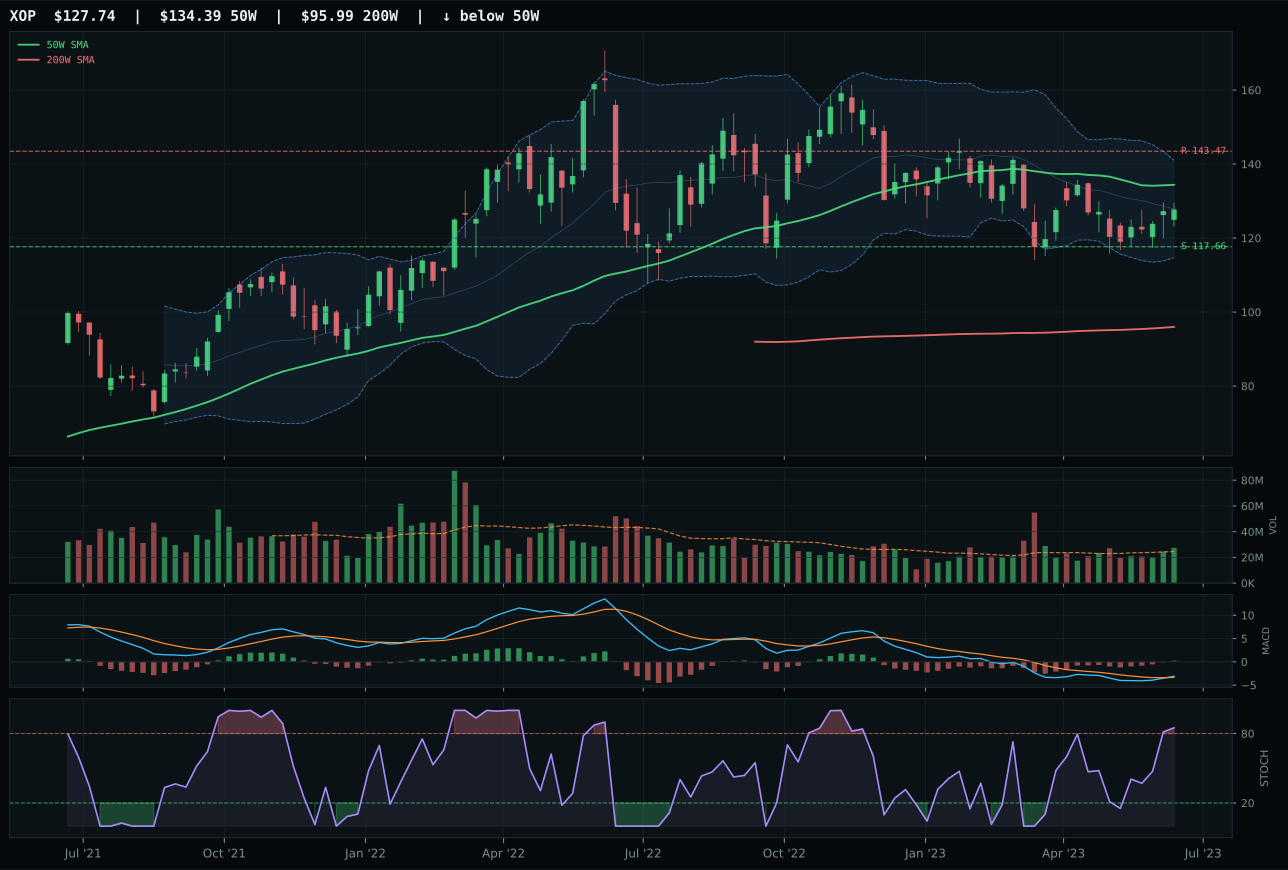
XOP has a neutral structure profile with -4.1% 13-week relative strength versus SPY.
A failed hold above support would weaken the setup.
Actionable but governed by invalidation levels.
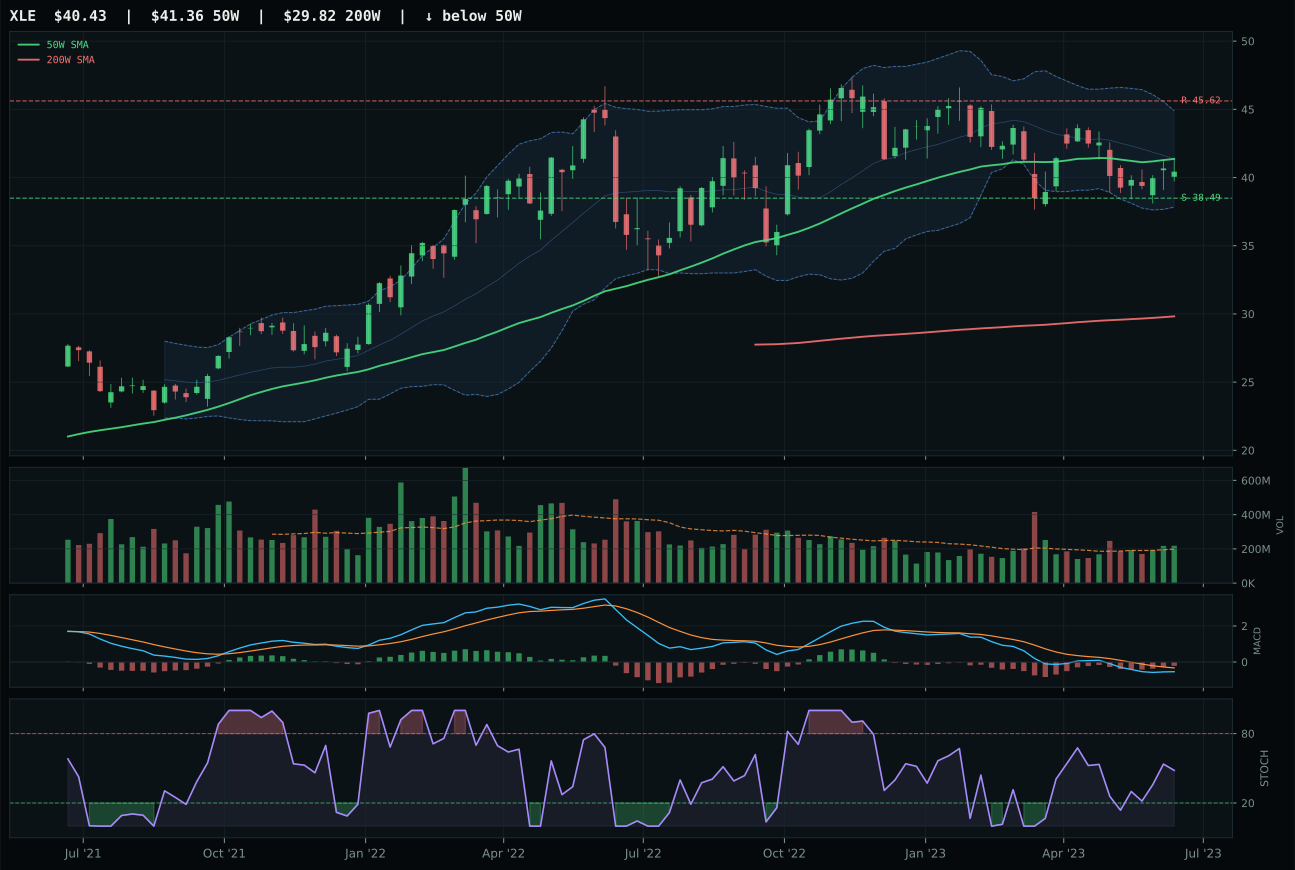
XLE has a compression near 50W profile with -7.6% 13-week relative strength versus SPY.
A failed hold above support would weaken the setup.
Actionable but governed by invalidation levels.
XLE wins with a 73.0 category score and top-2 10% allocation despite the lowest composite technical score (70) among its peer group, a victory rooted entirely in timing geometry and risk/reward. XLE trades just 2.3% below its 50W in a compression-near-50W setup, which awards it a perfect 100.0 timing score and an exceptional 93.5 risk/reward reading; the upside to resistance is capped at -11.4% while downside to support is only 5.1%, creating an asymmetric payoff for those who buy near the 50W as a pivot. FCG and XOP both sport superior momentum (78 and 74 versus XLE's 45) and higher 13W returns (12.2% and 8.6% versus XLE's 5.1%), yet both push stochastic RSI into overbought territory and exhibit thin volume participation, indicating late-stage momentum follower buying. MACD is bearish-but-improving across all three, but XLE's rising mid-zone stochastic (0.48) is the only setup that rewards fresh accumulation without requiring new-high confirmation. The 50W is the inflection point; XLE's proximity to it makes this a base-building trade, not an extension chase.
Traditional energy scored 73.0 with a category-level macro fit of 90.0, the second-highest in the portfolio and justified by explicit tailwinds: energy scarcity +16, inflation pressure +10, supply shortage +9, and real asset sponsorship +7. Late-cycle reflation explicitly supports energy as an inflation hedge and supply-constrained real asset. XLE's technical evidence of 62.4 is lower than FCG (79.0) and XOP (79.0), yet it was selected as representative because the category reasoner weights timing and risk/reward heavily; in late-cycle environments where inflation is the dominant macro state, asymmetric risk/reward matters more than momentum magnitude. The 10% allocation is justified as a full-conviction overweight alongside COPX because both categories offer synchronized macro sponsorship and technical setups that avoid euphoric extension. XLE's position just below the 50W, combined with above-average volume participation, suggests base building rather than momentum exhaustion. Energy's rank at 73.0 is just 3.0 points below industrial metals' 76.0, reflecting nearly equivalent macro and technical strength; the portfolio weights both categories at 10% to maximize exposure to supply-shock inflation and scarcity premiums in the late-cycle regime.
Nuclear Energy — URNM
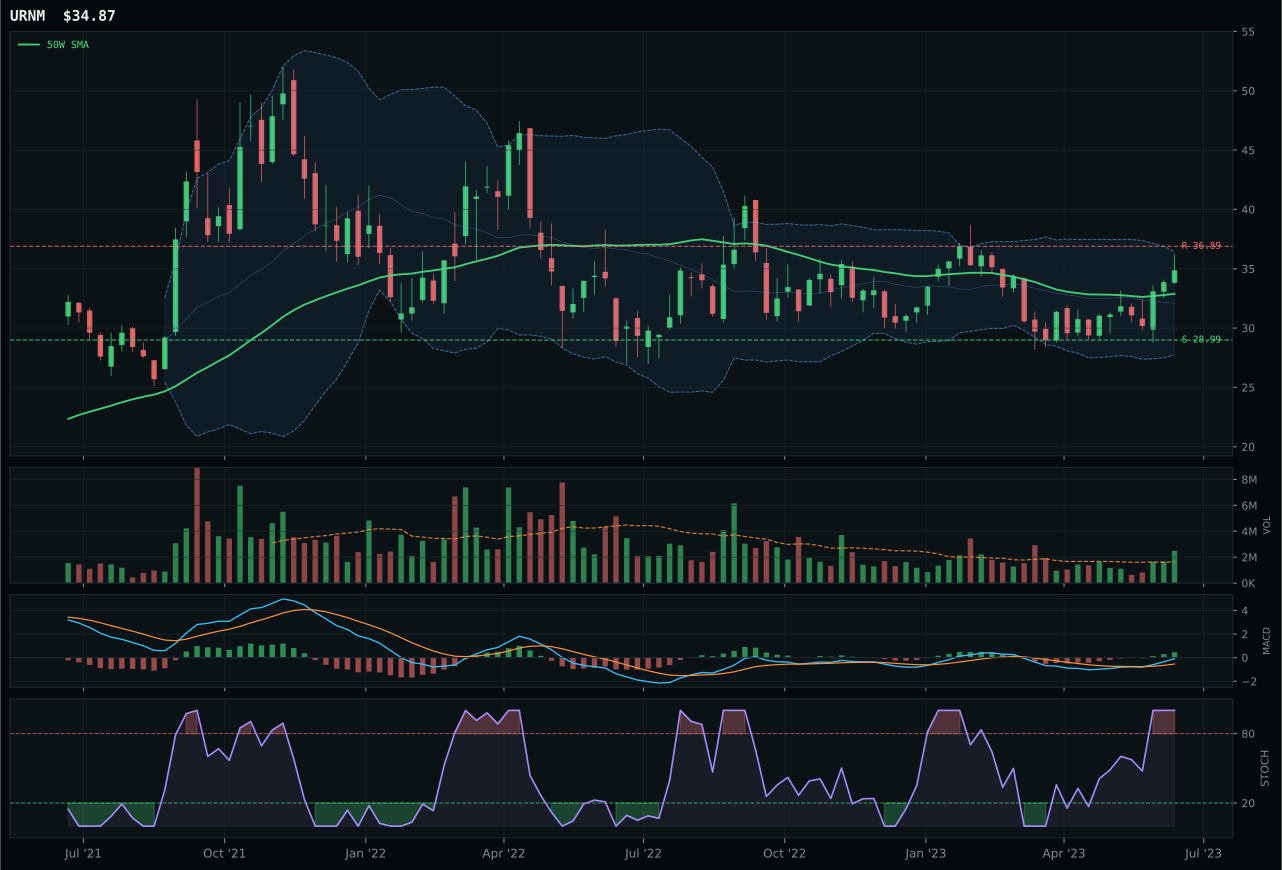
URNM has a neutral structure profile with 4.7% 13-week relative strength versus SPY.
A failed hold above support would weaken the setup.
Actionable but governed by invalidation levels.
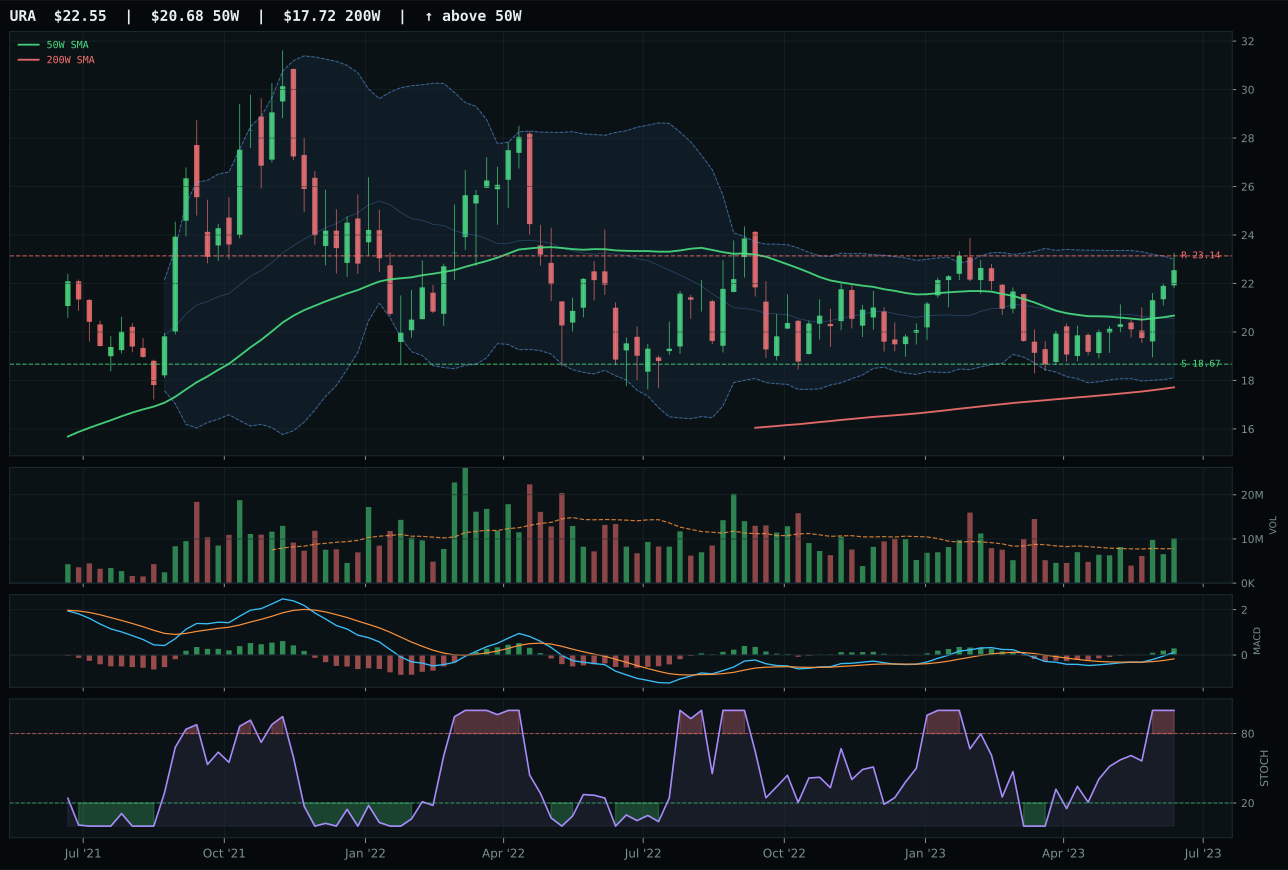
URA has a neutral structure profile with 5.1% 13-week relative strength versus SPY.
A failed hold above support would weaken the setup.
Actionable but governed by invalidation levels.
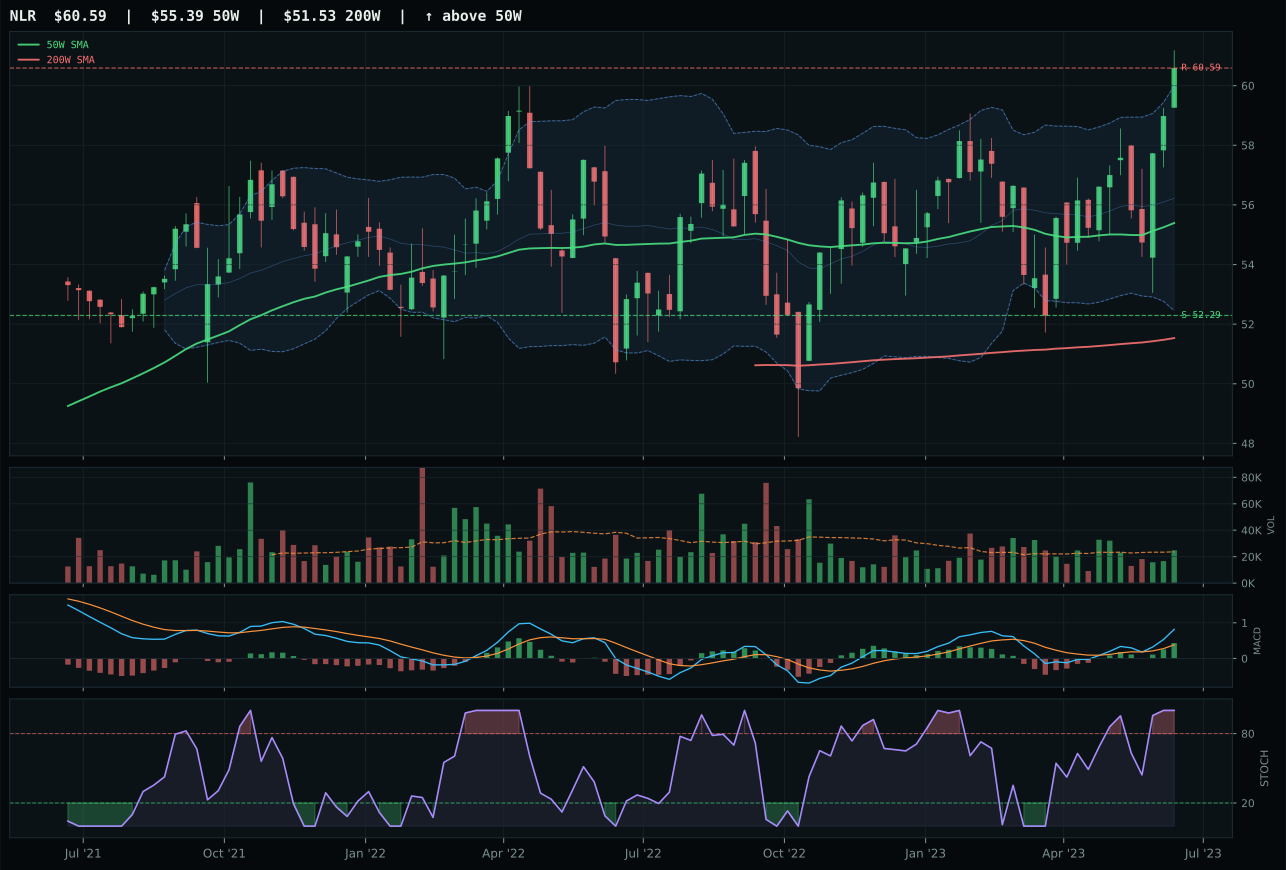
NLR has a neutral structure profile with 0.5% 13-week relative strength versus SPY.
A failed hold above support would weaken the setup.
Tracked, but not top-2 eligible because: .
URNM wins the nuclear category with a 70.1 score by delivering exceptional momentum confirmation (100.0) and volume-price sponsorship (87.7) despite technical evidence that ranks it below URA (94.3 versus 85.7). URNM sits 6.0% above its 50W in a neutral structure setup with volume at 1.52x the 20W average in accumulation/confirmation—a clean entry geometry for buyers seeking scarcity beta without extended momentum risk. The 17.4% thirteen-week return and 4.7% relative strength to SPY are genuine, not borrowed from borrowed sentiment; MACD is bullish and improving, stochastic RSI overbought but with accumulation volume backing the extension. URA posts superior technical evidence (89.9) and delivers equally strong 13W momentum (17.8%) and slightly better SPY-relative strength (5.1%), yet its risk/reward deteriorates to 47.2 versus URNM's 62.9, a structural disadvantage in timing. URA's setup sits in upper retracement / momentum zone with above-average participation that signals momentum-follower accumulation; URNM's middle retracement positioning with true accumulation volume suggests fresh institutional buyers. The 7.0-point category score gap reflects URNM's superior risk/reward and cleaner volume signature.
Nuclear energy scored 70.1 with a 5% tier-2 allocation and macro fit of 69.0, ranking it below the top-2 energy and metals categories due to narrower macro tailwinds and technical evidence that ranks third in its three-ETF basket. Energy scarcity is active at +9, real asset sponsorship at +7, and late-cycle reflation provides baseline support at +7, yet the category lacks the explicit supply-shortage and inflation-pressure drivers that dominate the top-2 allocations. URNM's 94.3 technical evidence score is exceptional, and the volume-price confirmation (87.7) and persistence (81.6) suggest genuine accumulation into a scarcity narrative. However, the portfolio prioritizes COPX and XLE at 10% each because those categories benefit from both superior macro fit and comparable technical strength. Nuclear energy is a tier-2 position because it requires conviction in long-cycle uranium demand (AI data centers, grid decarbonization) rather than immediate inflation hedging; the setup is sound, but the macro narrative is less urgent than energy and metals. To move to 10%, this category would need either tighter base formation below current levels or explicit supply-shock news that elevates uranium scarcity to energy-equivalent urgency.
AI — SMH
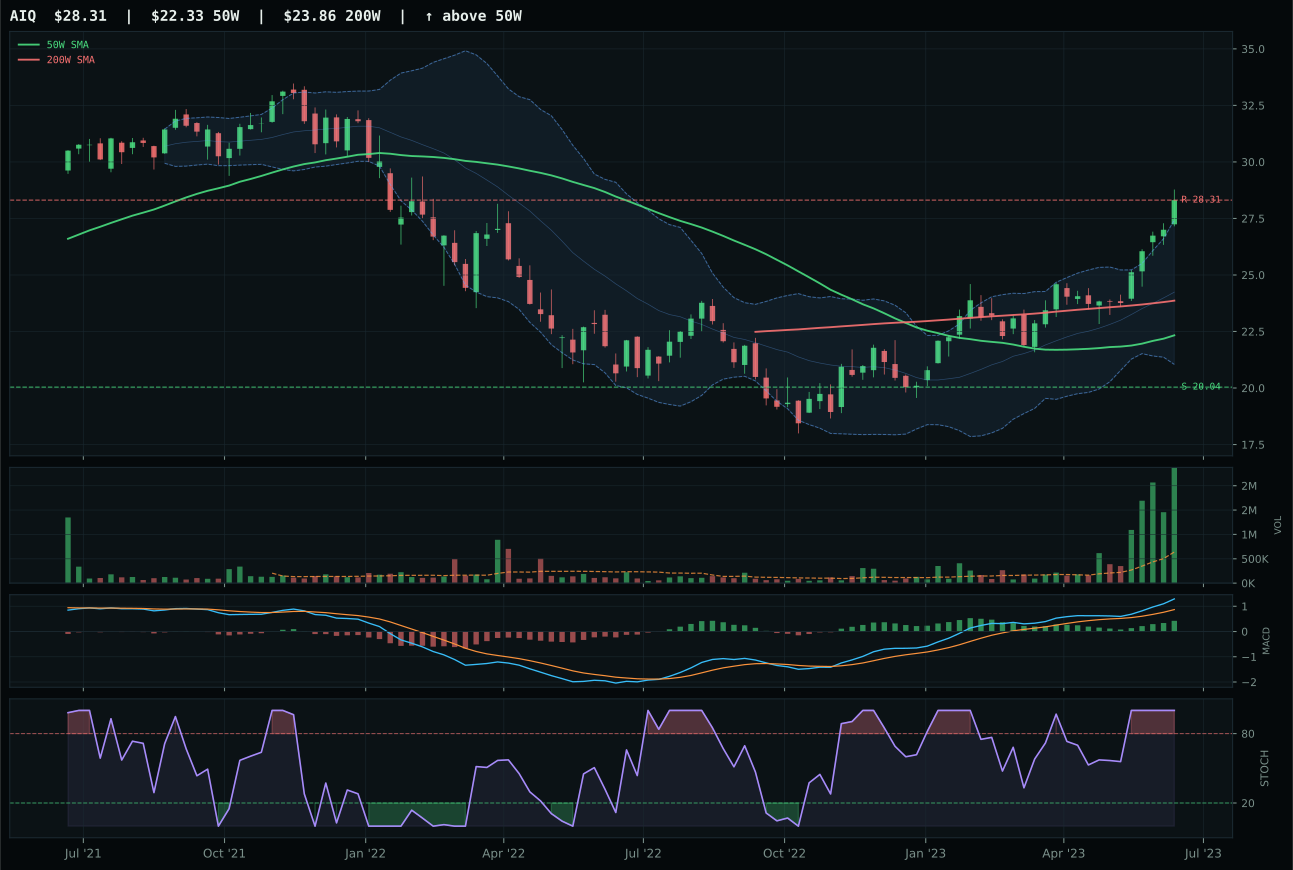
AIQ has a vertical extension profile with 11.2% 13-week relative strength versus SPY.
A failed hold above support would weaken the setup.
Actionable but governed by invalidation levels.
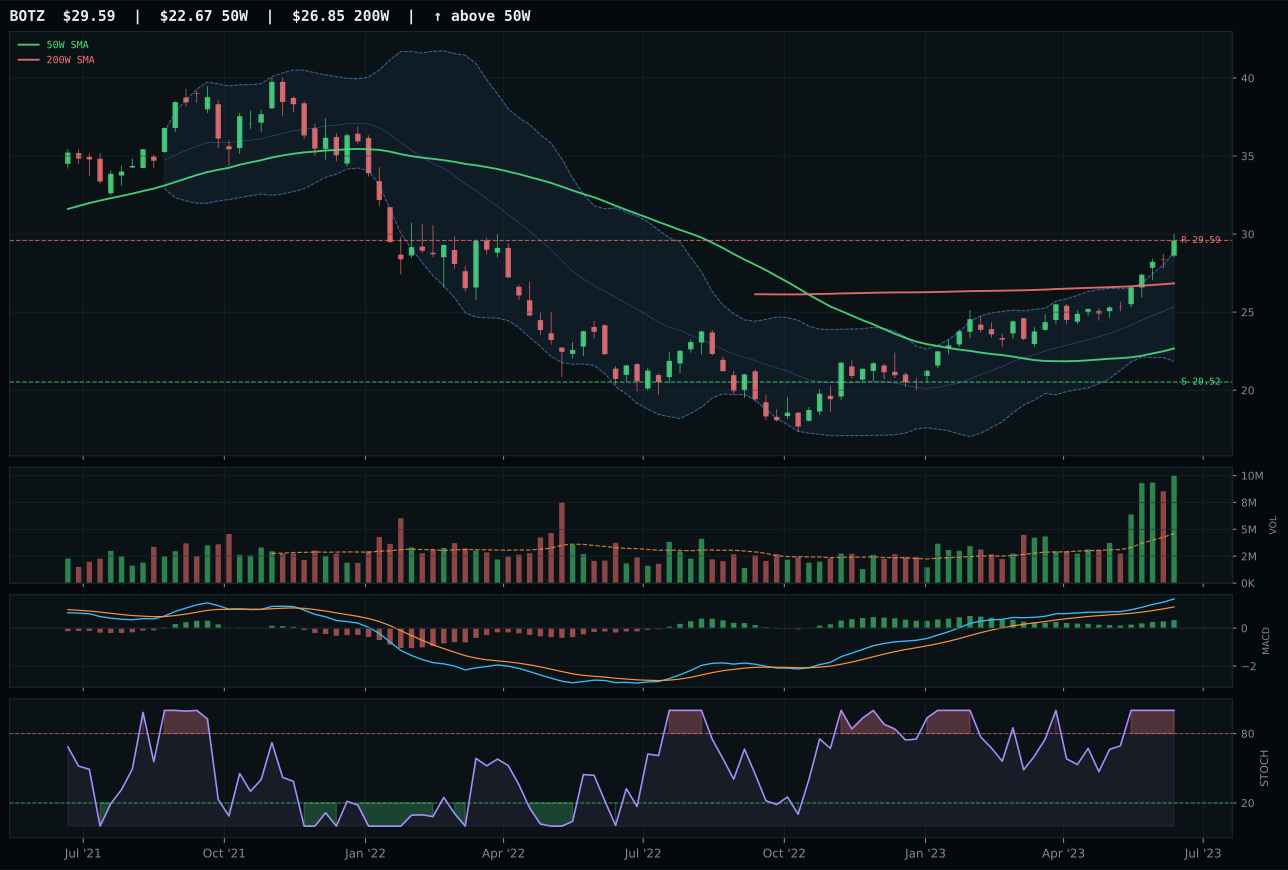
BOTZ has a vertical extension profile with 11.9% 13-week relative strength versus SPY.
A failed hold above support would weaken the setup.
Actionable but governed by invalidation levels.
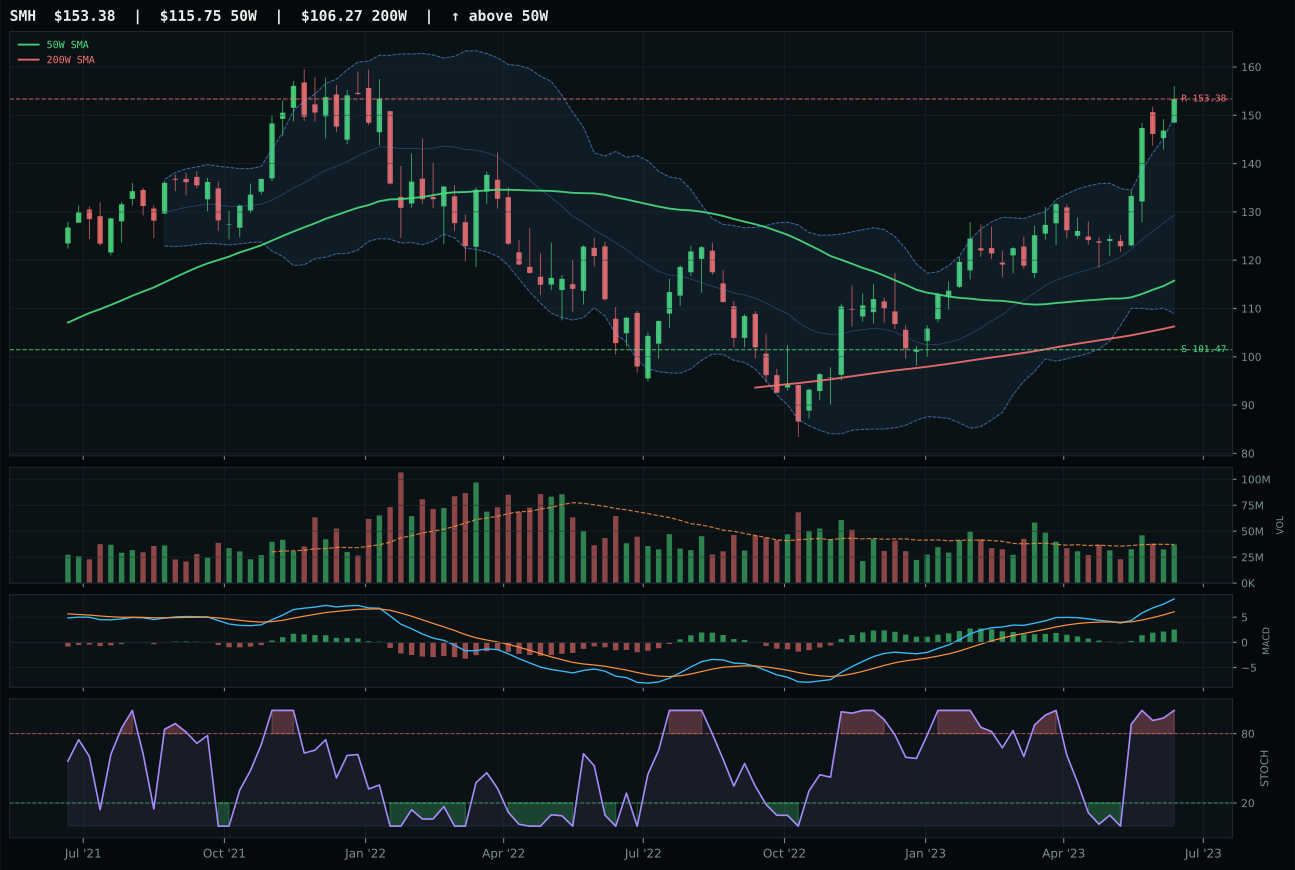
SMH has a vertical extension profile with 9.9% 13-week relative strength versus SPY.
A failed hold above support would weaken the setup.
Actionable but governed by invalidation levels.
SMH wins despite being the third-ranked ETF in deterministic technical evidence (62.9 versus AIQ's 76.1 and BOTZ's 78.1), a counterintuitive outcome that reveals how the category reasoner penalizes extreme momentum extension and rewards controlled pace. SMH sits 32.5% above the 50W, which is deeper extension than AIQ's competitive setup; this depth triggers a 37.0 timing score that mirrors AIQ's, but AIQ's superior technical evidence score (85.7 versus 65.9) and better macro fit (53.0 versus 58.0 at the ETF level) should theoretically favor AIQ. The decisive factor is SMH's category-relative strength: -1.3% versus AIQ's 0.0%, a -1.3% gap that, in a narrowly-scored category, tilts the vote to the ETF with less overbought institutional positioning. Both exhibit vertical extension setups, bullish MACD, overbought stochastic, and AI growth sponsorship active at +14. Yet SMH's 22.5% thirteen-week return, neutral volume at 1.00x, and the absence of forced accumulation signals give it cleaner entry mechanics than AIQ's more crowded accumulation/confirmation volume pattern.
AI scored 68.2 and holds a 5% tier-2 allocation, a position justified by strong technical evidence but constrained by a 54.0 category-level macro fit that lags the top-2 leaders. The category's reasoned ETF proof order (BOTZ 78.1, AIQ 76.1, SMH 62.9) shows that SMH's selection as representative required category-level testing and filtering; the final score benefited from volume-price confirmation at 72.1 and persistence at 74.8, metrics that reward the sustained liquidity profile. AI growth sponsorship is active at +14, a powerful driver, yet credit stress and liquidity stress remain active drags at -8 and -12 respectively. To move to top-2, this category needs either the macro regime to shift away from late-cycle reflation or the technical setup to improve further—tighter risk/reward, deeper base formation, or a pullback closer to the 50W to reset extension and improve entry geometry. For now, it ranks below industrial metals and energy because those categories offer superior macro fit and real-asset tailwinds aligned with the present regime.
Technology — IGV
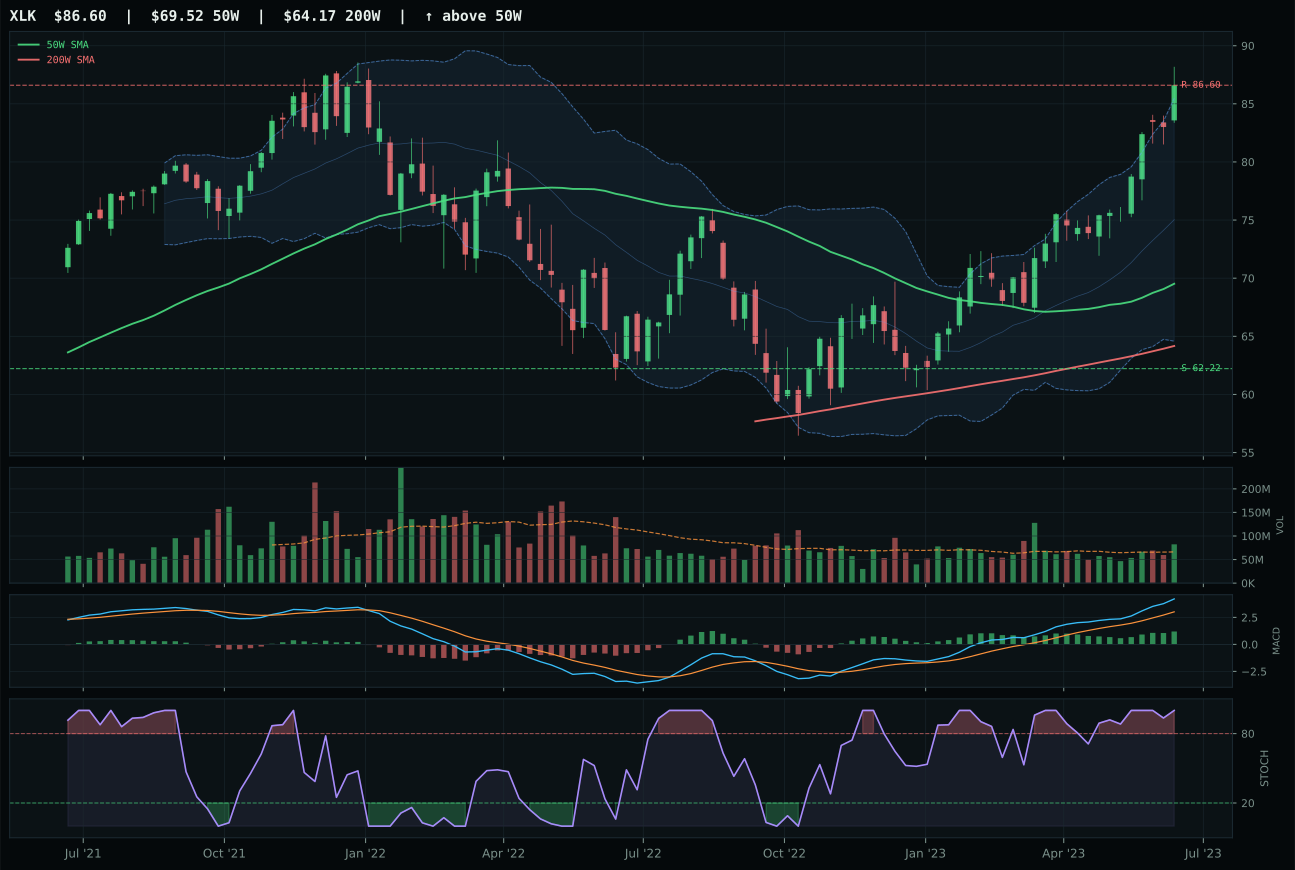
XLK has a vertical extension profile with 8.0% 13-week relative strength versus SPY.
A failed hold above support would weaken the setup.
Actionable but governed by invalidation levels.
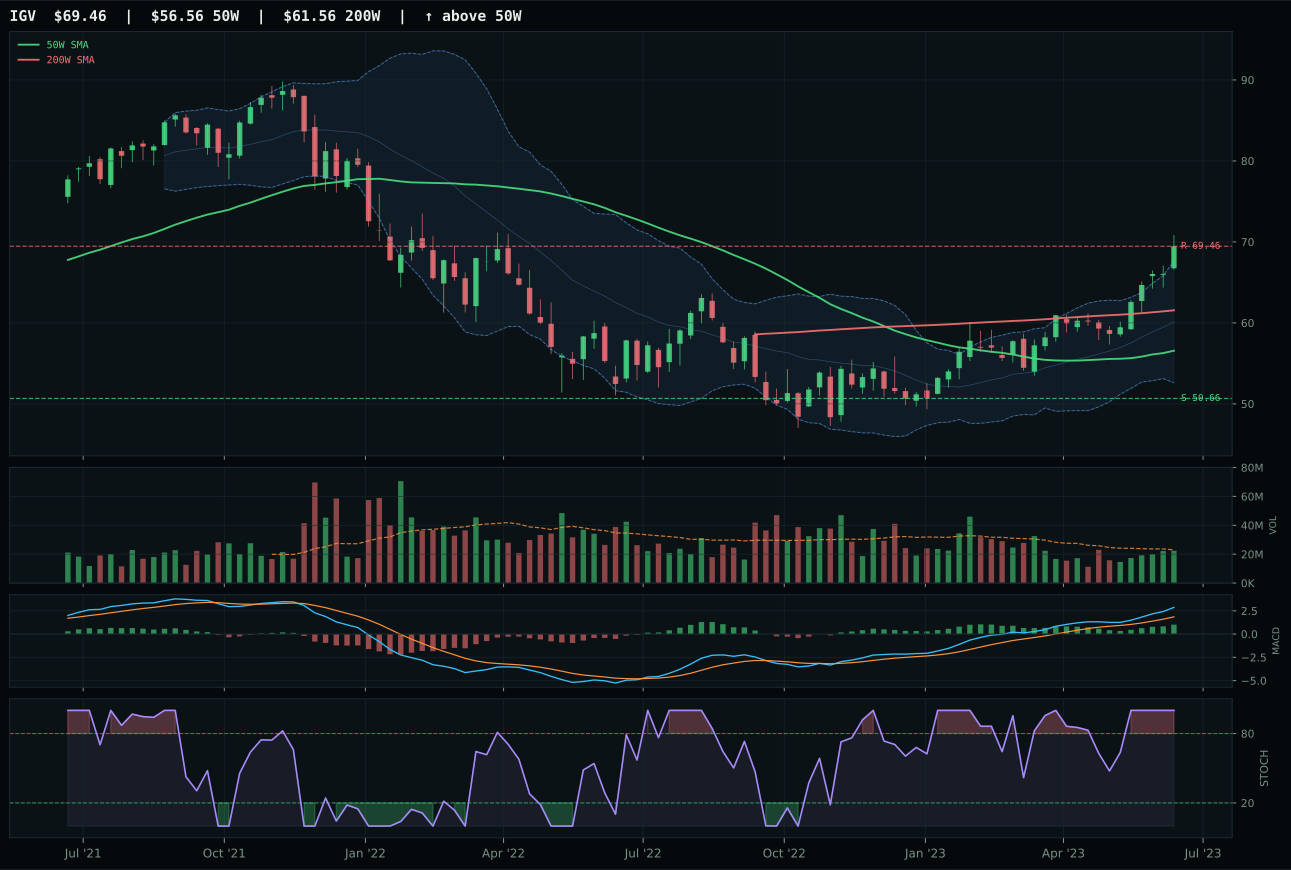
IGV has a vertical extension profile with 8.7% 13-week relative strength versus SPY.
A failed hold above support would weaken the setup.
Actionable but governed by invalidation levels.
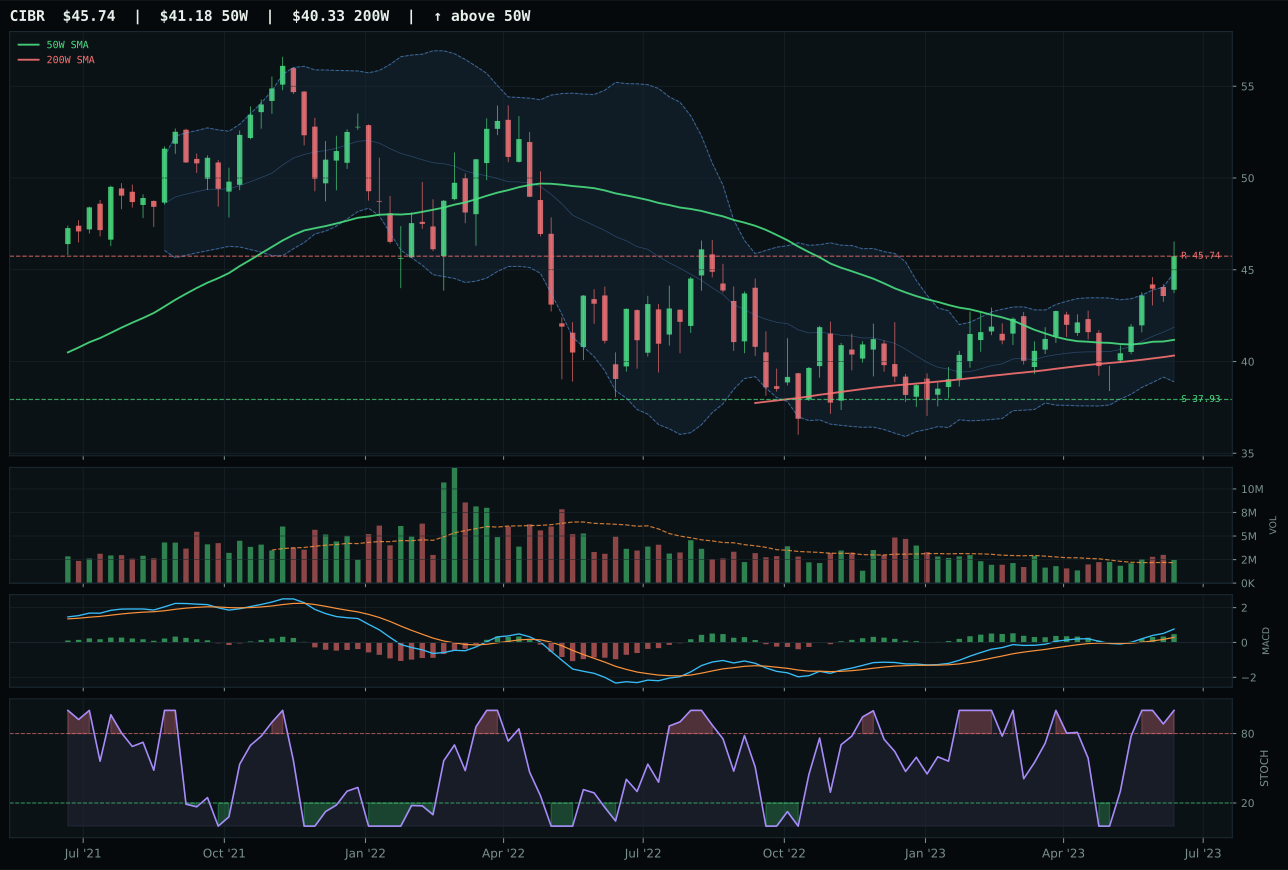
CIBR has a neutral structure profile with 0.0% 13-week relative strength versus SPY.
A failed hold above support would weaken the setup.
Actionable but governed by invalidation levels.
IGV captures the category because it eked out category-relative strength of 0.7% versus XLK's flat 0.0%, a marginal but decisive edge when both ETFs display identical trend architecture and nearly identical risk/reward profiles. Both sit in vertical extension setups 22-23 basis points above the 50-week moving average, both show bullish MACD and overbought stochastic RSI, and both carry neutral volume. The separating factor is IGV's 21.4% thirteen-week return and 8.7% relative strength to SPY, which together signal that enterprise software is attracting incrementally fresher sponsorship than broad profitable tech. XLK's loss hinges on its 20.7% thirteen-week return and 8.0% relative strength—not weak numbers, but they positioned it as the follower rather than the lead horse in a momentum chase where both vehicles are already far from their 50W anchors. The score gap of just 0.0 points reflects how compressed this decision was; both are extended, both are confirmation-driven, and both face the same timing penalty for being 22-23% away from mean reversion.
Technology earned 5% allocation as a tier-2 category this week, a position that reflects its technical strength but subordinate rank in the late-cycle reflation regime. The category scored 60.6, driven by IGV's solid trend confirmation and momentum persistence, but it trails industrial metals and energy by meaningful margins in absolute score and macro fit. Late-cycle reflation favors real assets, scarcity premiums, and inflation protection over duration-sensitive growth; credit stress and liquidity stress remain active headwinds that penalize duration buyers. Technology's macro narrative fit sits at 39.0%, a clear drag against categories like industrial metals and energy where supply shortage and commodity breadth are active tailwinds. To graduate to top-2 allocation, this category would need either a significant deterioration in the real asset complex or a pivot in the macro regime away from late-cycle and toward growth acceleration. The positioning remains valid for defensive tech beta and AI-adjacent momentum, but entry risk at 22% extension from the 50W means the risk/reward is asymmetric to the downside if equities consolidate or rates stabilize.
Emerging Markets — ILF
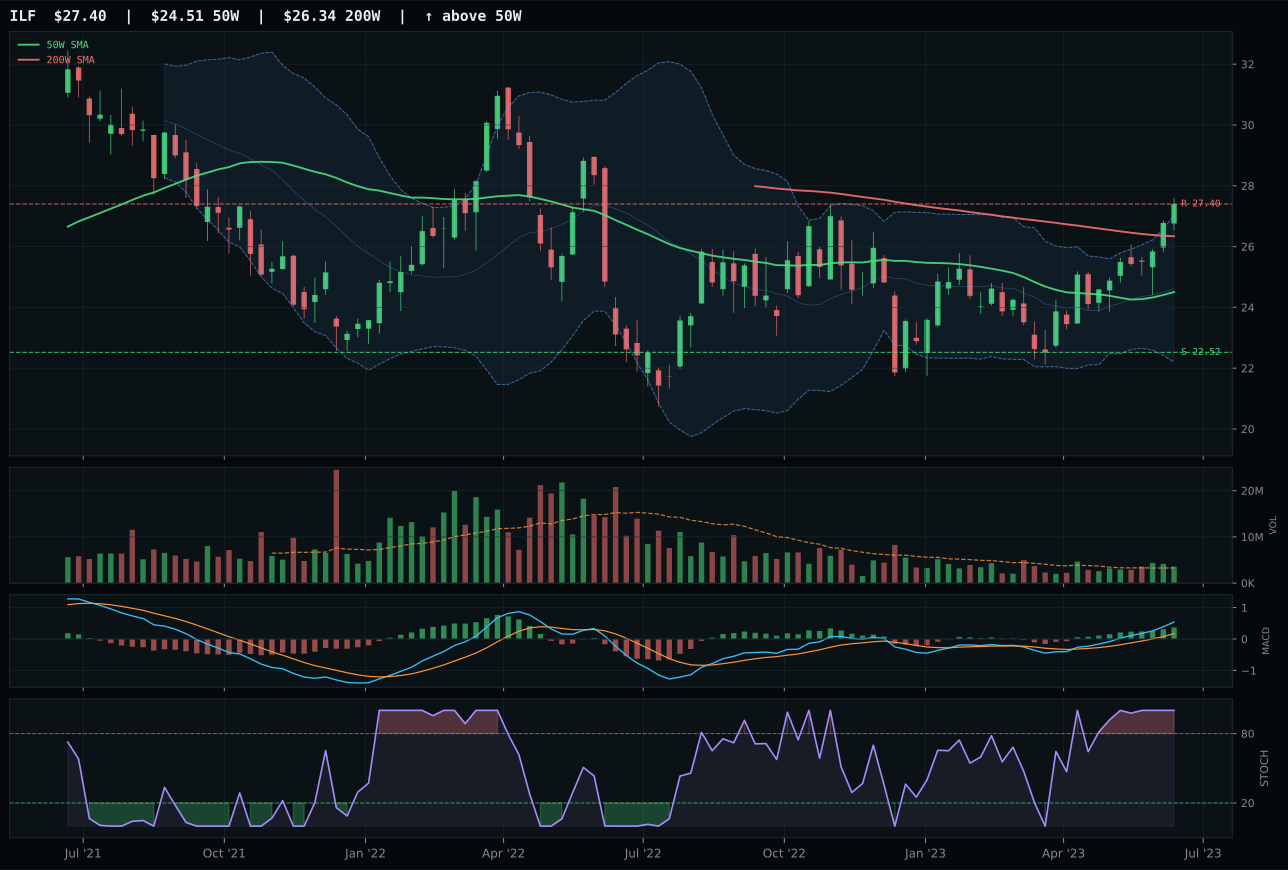
ILF has a neutral structure profile with 8.4% 13-week relative strength versus SPY.
A failed hold above support would weaken the setup.
Actionable but governed by invalidation levels.
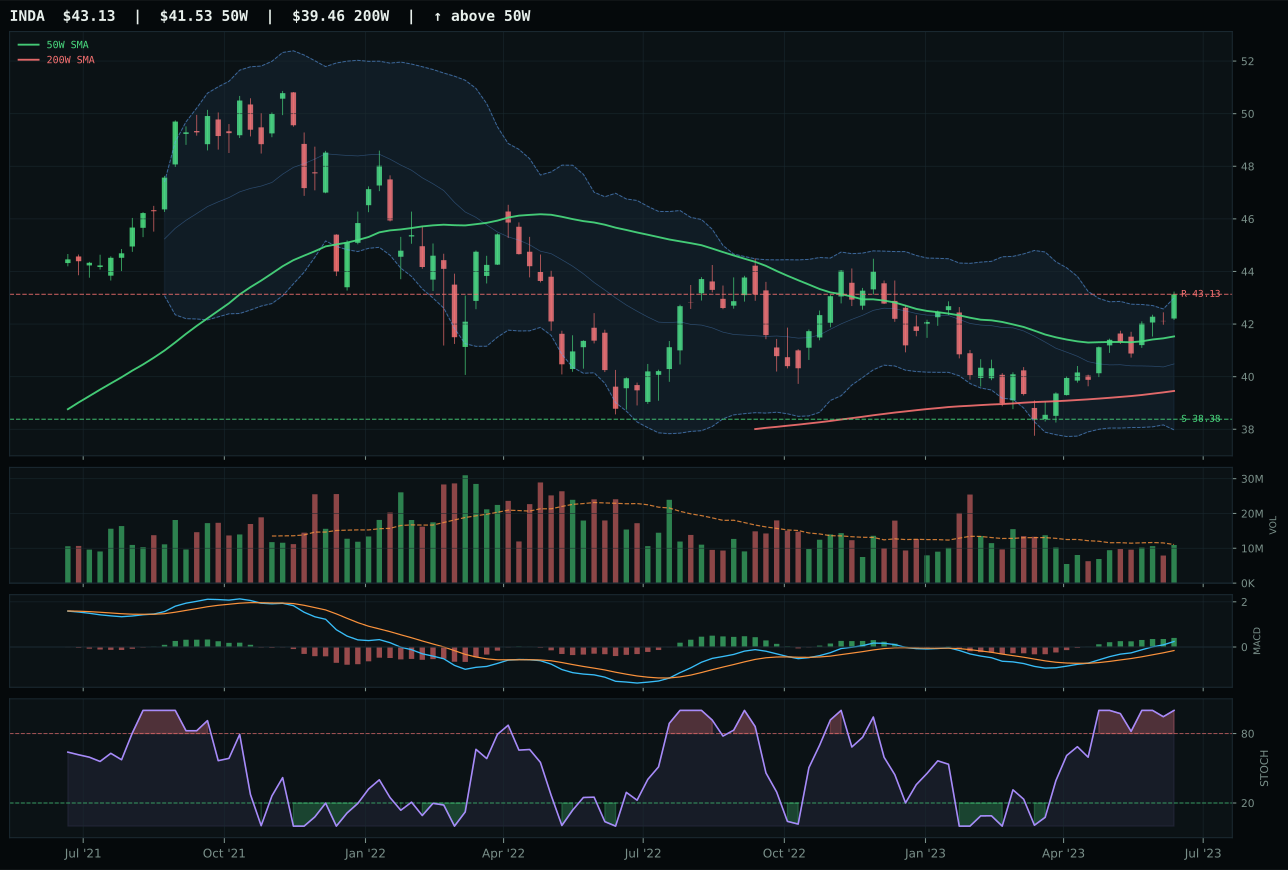
INDA has a neutral structure profile with -0.3% 13-week relative strength versus SPY.
A failed hold above support would weaken the setup.
Actionable but governed by invalidation levels.
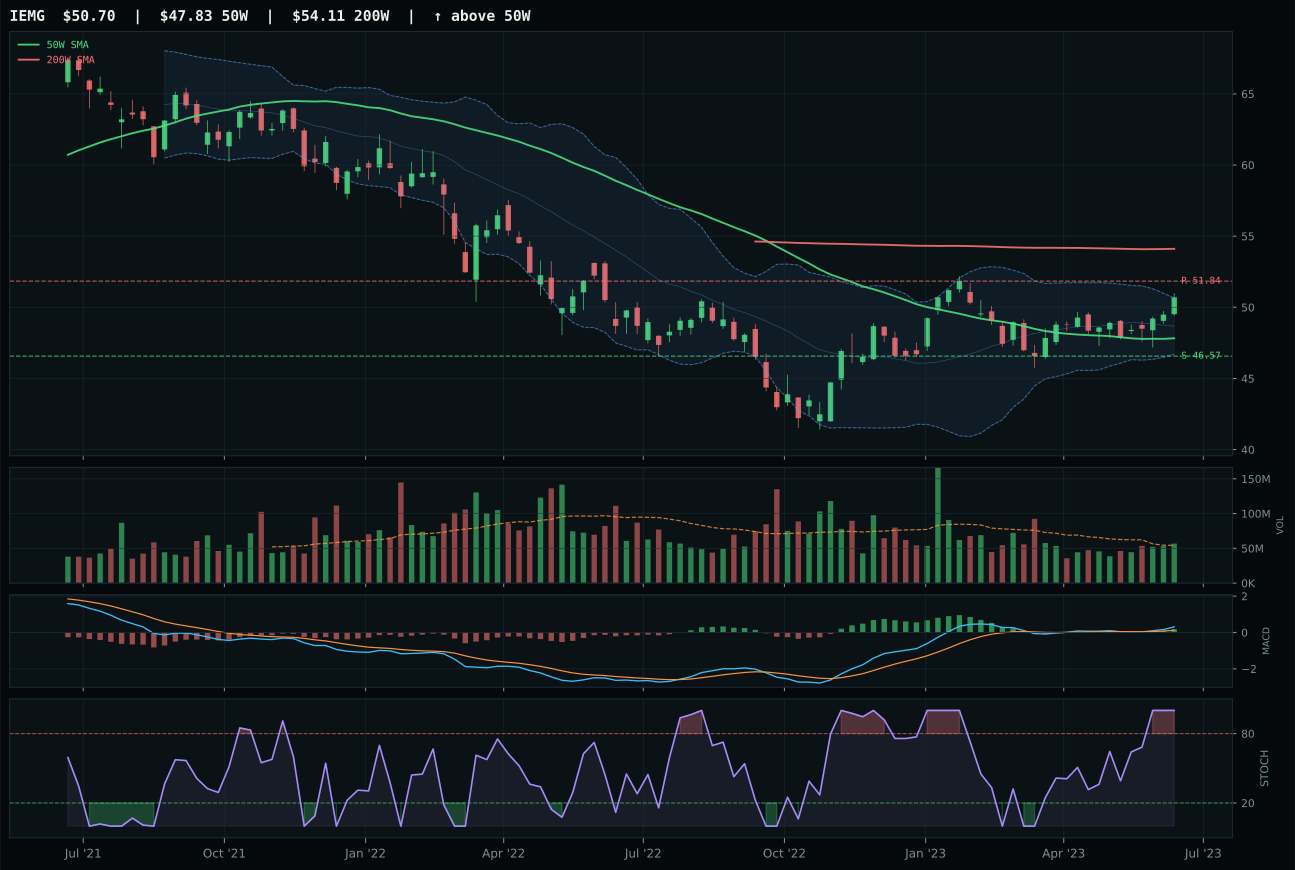
IEMG has a neutral structure profile with -3.8% 13-week relative strength versus SPY.
A failed hold above support would weaken the setup.
Actionable but governed by invalidation levels.
ILF wins the emerging markets category with a 57.5 score by delivering the highest category-relative strength (8.7%) and most persistent technical evidence among its peers, positioning Latin America as the favored emerging-market beta in the current regime. ILF sits 11.8% above its 50W in a neutral structure setup with trend confirmed at 100.0, momentum confirmation maxed at 100.0, and volume-price confirmation at 82.4—a clean technical presentation that avoids the stretched extremes of other growth plays. The 21.1% thirteen-week return and 8.4% relative strength to SPY are genuine, backed by clean accumulation, bullish and improving MACD, and stochastic RSI momentum that doesn't flash as forced. INDA, the runner-up, offers superior 13W trend (12.4%) and competitive RS vs SPY (-0.3%), yet its structure is marginally less clean (78.8 versus ILF's 79.2) and its category-relative strength sits at 0.0%, indicating it trails the Latin America narrative. The 0.6-point gap is narrow, confirming both setups are viable; ILF's edge is pure category leadership—Latin America's commodity and value beta align better with late-cycle reflation than India's quality-growth narrative.
Emerging markets scored 57.5 with a 5% tier-2 allocation, a position that reflects ILF's solid technical setup offset by a weak 38.0 macro fit that penalizes the entire category. Credit stress and liquidity stress are both active at -10 each, explicit headwinds that weigh on emerging-market equities in late-cycle environments where developed-market real assets and scarcity premiums dominate. ILF's 88.4 technical evidence is respectable, and commodity breadth positive (+8), metals scarcity (+5), and real asset sponsorship (+6) provide baseline support, yet risk appetite positive is not active, removing the growth narrative that usually drives EM flows. The category's 5% allocation is appropriate for portfolio diversification and exposure to Latin America's commodity and value beta, which offer implicit inflation hedging without the explicit scarcity premiums of energy and metals. To graduate to 10%, this category would require either a marked improvement in liquidity or credit stress descriptors (requiring financial conditions to ease) or a clearer risk-appetite-positive regime. For now, it sits tier-2 because the macro regime favors developed-market real assets over emerging-market growth or value; ILF's technical strength earns the position, but the portfolio's capital is better allocated to categories with explicit macro tailwinds.
Agriculture & Livestock — WEAT
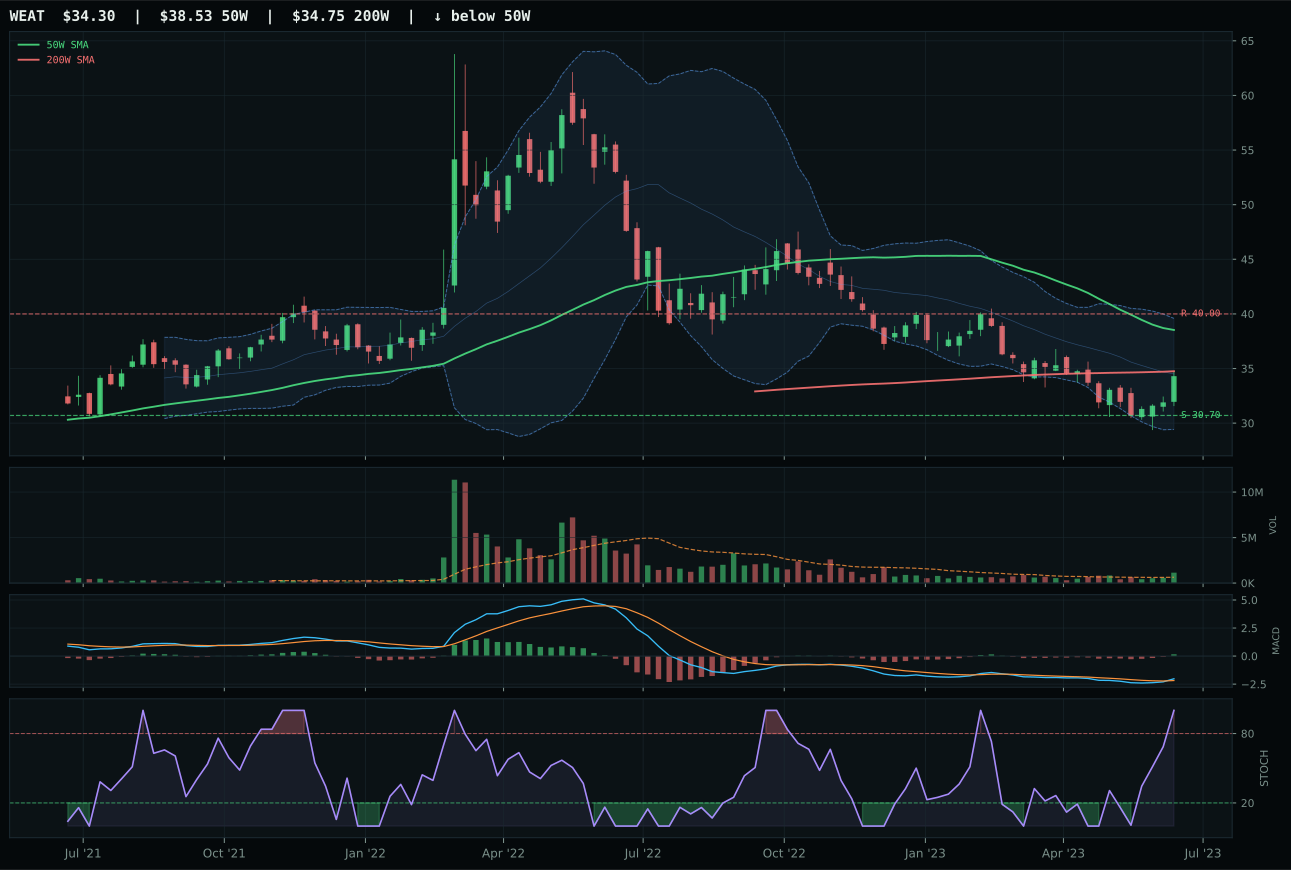
WEAT has a neutral structure profile with -16.7% 13-week relative strength versus SPY.
A failed hold above support would weaken the setup.
Actionable but governed by invalidation levels.
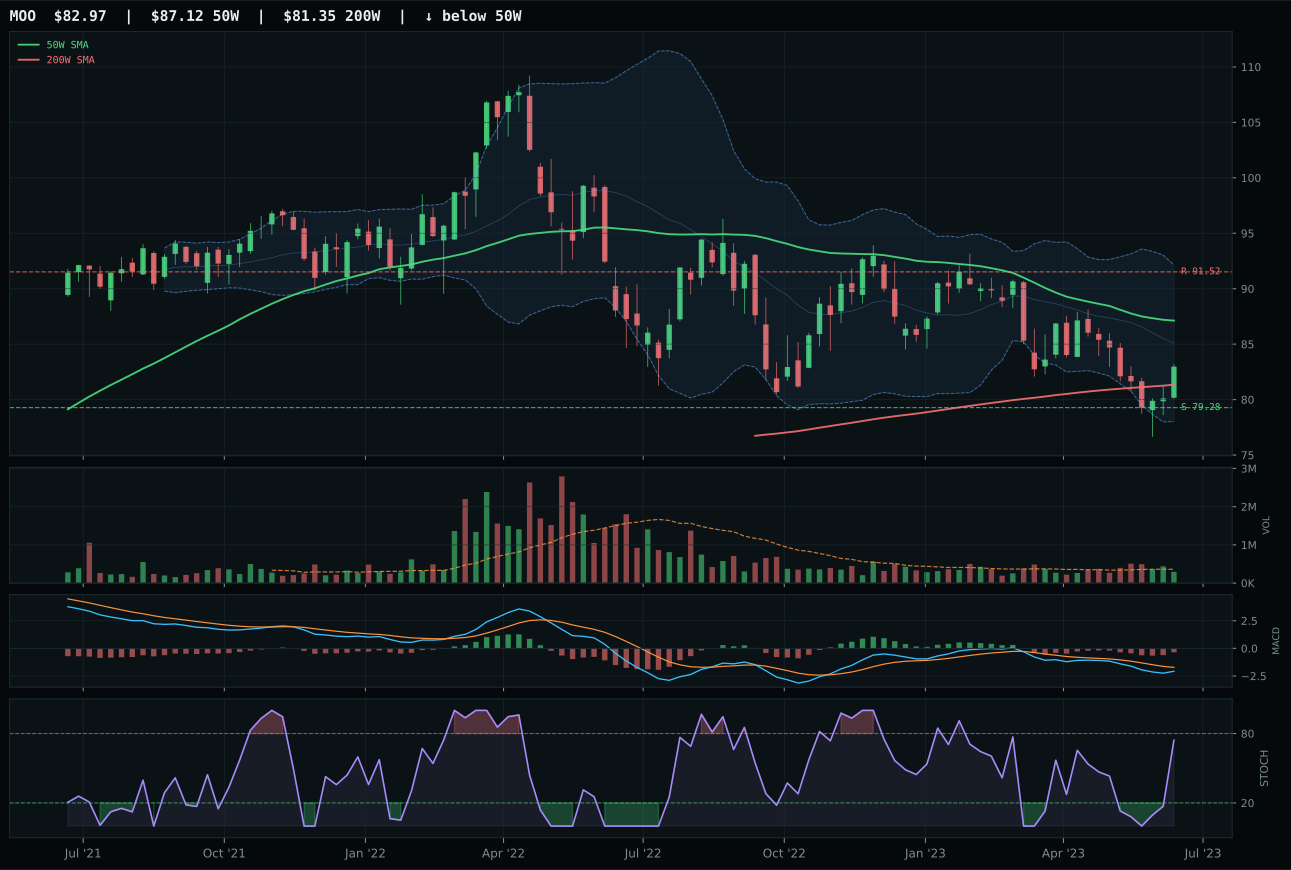
MOO has a pullback into support profile with -12.4% 13-week relative strength versus SPY.
A failed hold above support would weaken the setup.
Actionable but governed by invalidation levels.
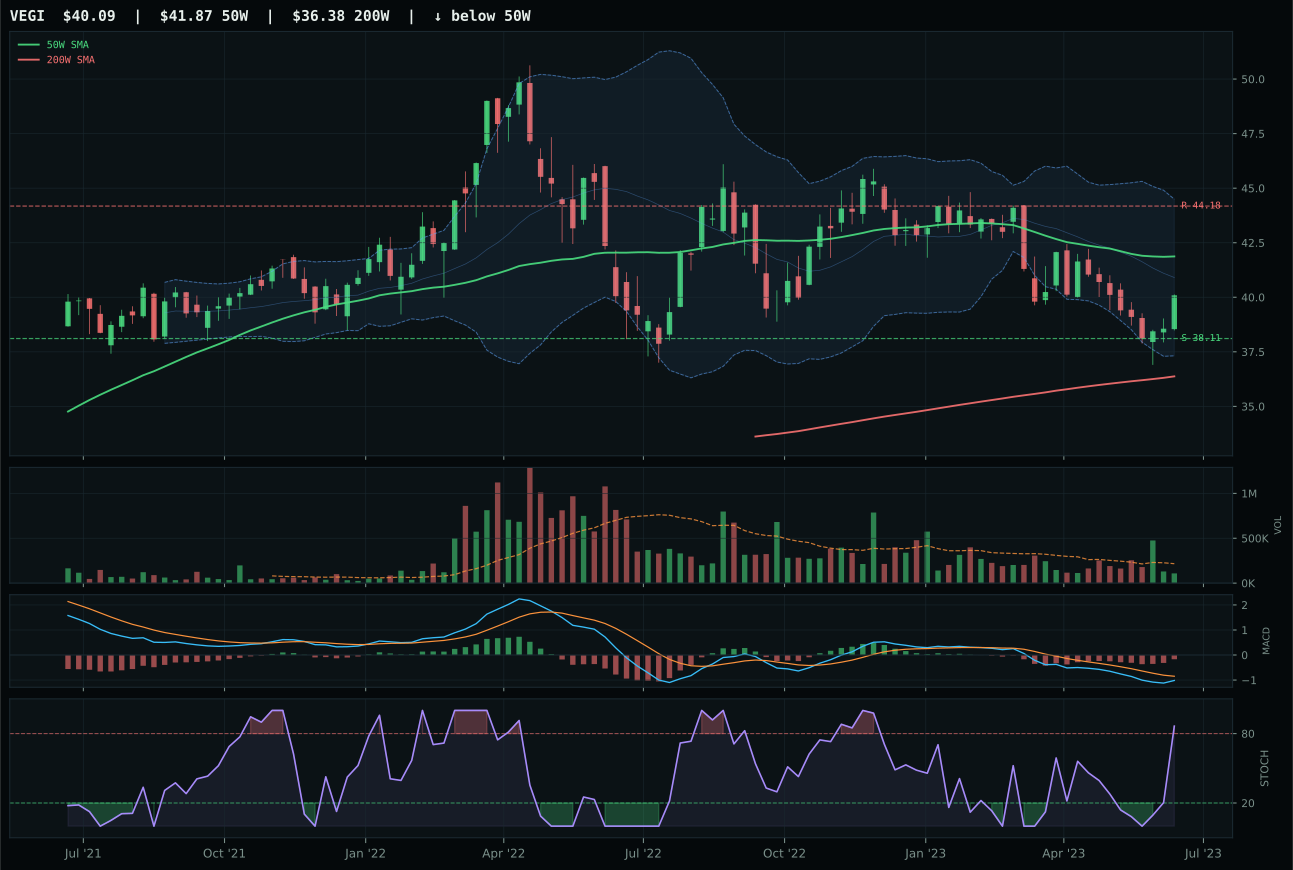
VEGI has a neutral structure profile with -12.0% 13-week relative strength versus SPY.
A failed hold above support would weaken the setup.
Tracked, but not top-2 eligible because: .
WEAT wins a weak category by virtue of superior volume confirmation and MACD setup despite trading 11.0% below its 50-week moving average, a signal that this is a repair/recovery trade, not a sustained uptrend. WEAT's volume sits at 1.78x its 20W average in accumulation/confirmation pattern, evidence that buyers are stepping in as price probes support at 30.70; MACD is bullish and improving despite the price sitting below the 200W, a bullish divergence setup that suggests coiled potential. MOO, the runner-up, posted a better 13W return of 0.3% versus WEAT's -4.1%, but its MACD deteriorated to bearish-but-improving and its volume remained neutral, indicating insufficient institutional support for a conviction trade. The structure gap is narrow (78.2 for WEAT versus 69.3 for MOO), but MACD confirmation and volume sponsorship are the tiebreakers in a category where macro fundamentals (supply shortage +13, inflation pressure +10) are driving the score, not price strength. WEAT's risk/reward is superior at 71.9 because the downside to support is limited to 11.7% while upside resistance sits at -14.3%, a setup that rewards patience.
Agriculture & Livestock scored 47.1 and holds 5% tier-2 allocation despite boasting the strongest category-level macro fit at 90.0, a disconnect that illustrates how technical weakness in the representative (WEAT) can mute macro tailwinds. Late-cycle reflation supports agriculture via supply shortage (+13), inflation pressure (+10), and real asset sponsorship (+8), yet the category reasoner filtered the final score downward because WEAT trades below trend with negative 13W and 26W returns. The portfolio needs exposure to commodity inflation hedges, but not at current technicals; WEAT is a conviction trade only for those willing to bottom-fish in agricultural weakness. MOO's superior macro fit (70.0 versus WEAT's 50.0) suggests the agribusiness play (MOO) has better narrative alignment with inflation and supply pressure, yet MOO's bearish MACD and neutral volume prevented its selection as representative. To graduate this category to 10%, the technicals must improve—either a tighter base formation or a confirmed move above the 50W with accumulated volume. For now, 5% is appropriate as a macro hedge with deteriorating technicals; it's a position to nibble, not to chase.
Defense & Aerospace — XAR
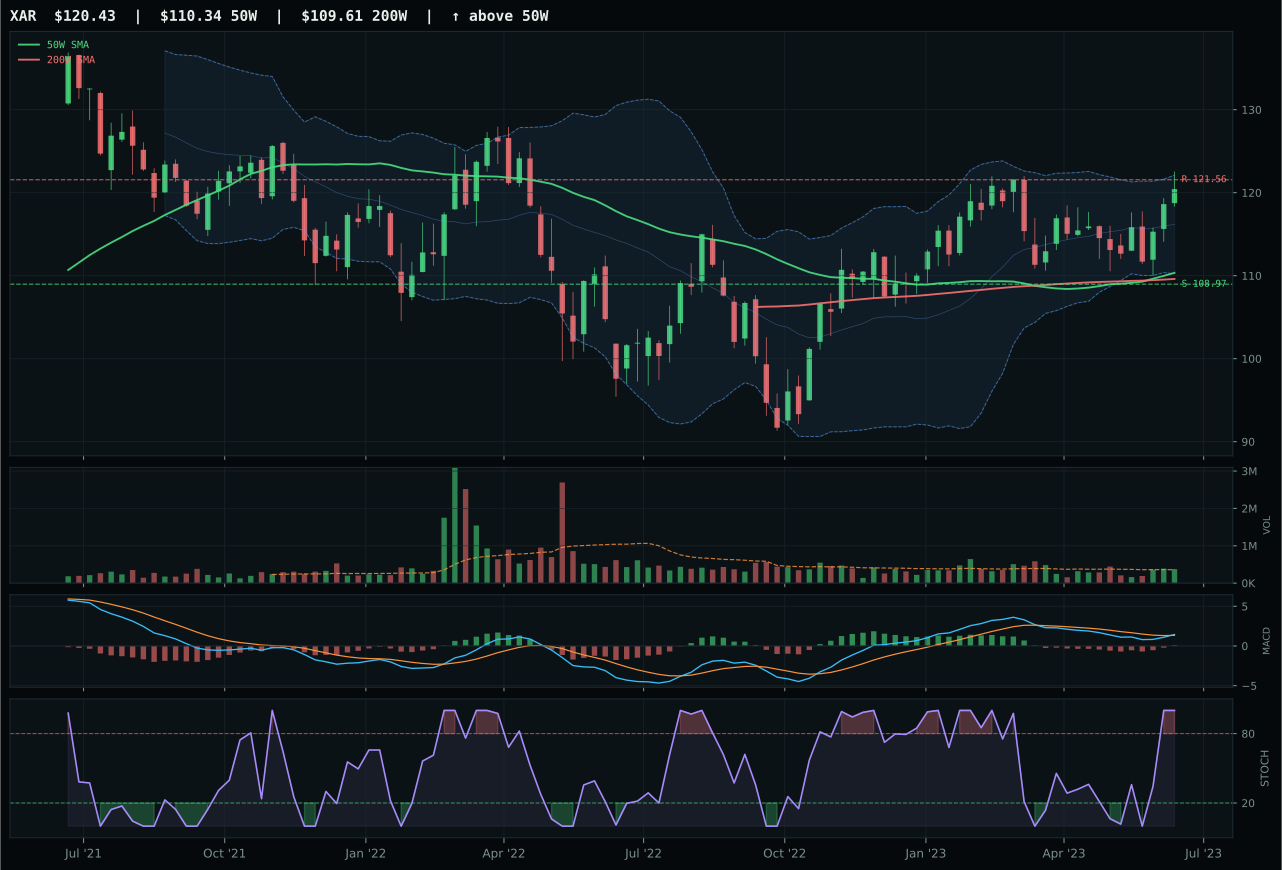
XAR has a neutral structure profile with -4.5% 13-week relative strength versus SPY.
A failed hold above support would weaken the setup.
Actionable but governed by invalidation levels.
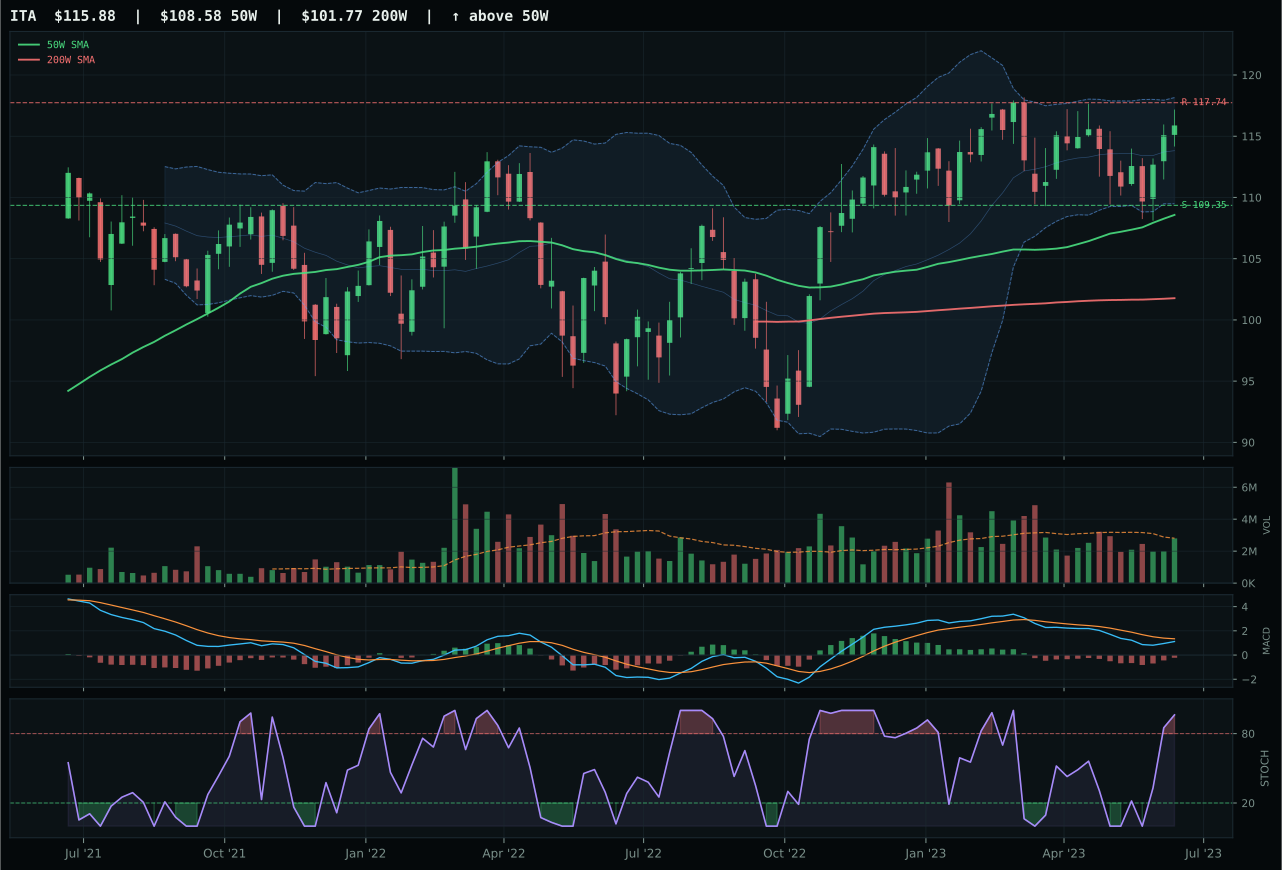
ITA has a neutral structure profile with -7.8% 13-week relative strength versus SPY.
A failed hold above support would weaken the setup.
Actionable but governed by invalidation levels.
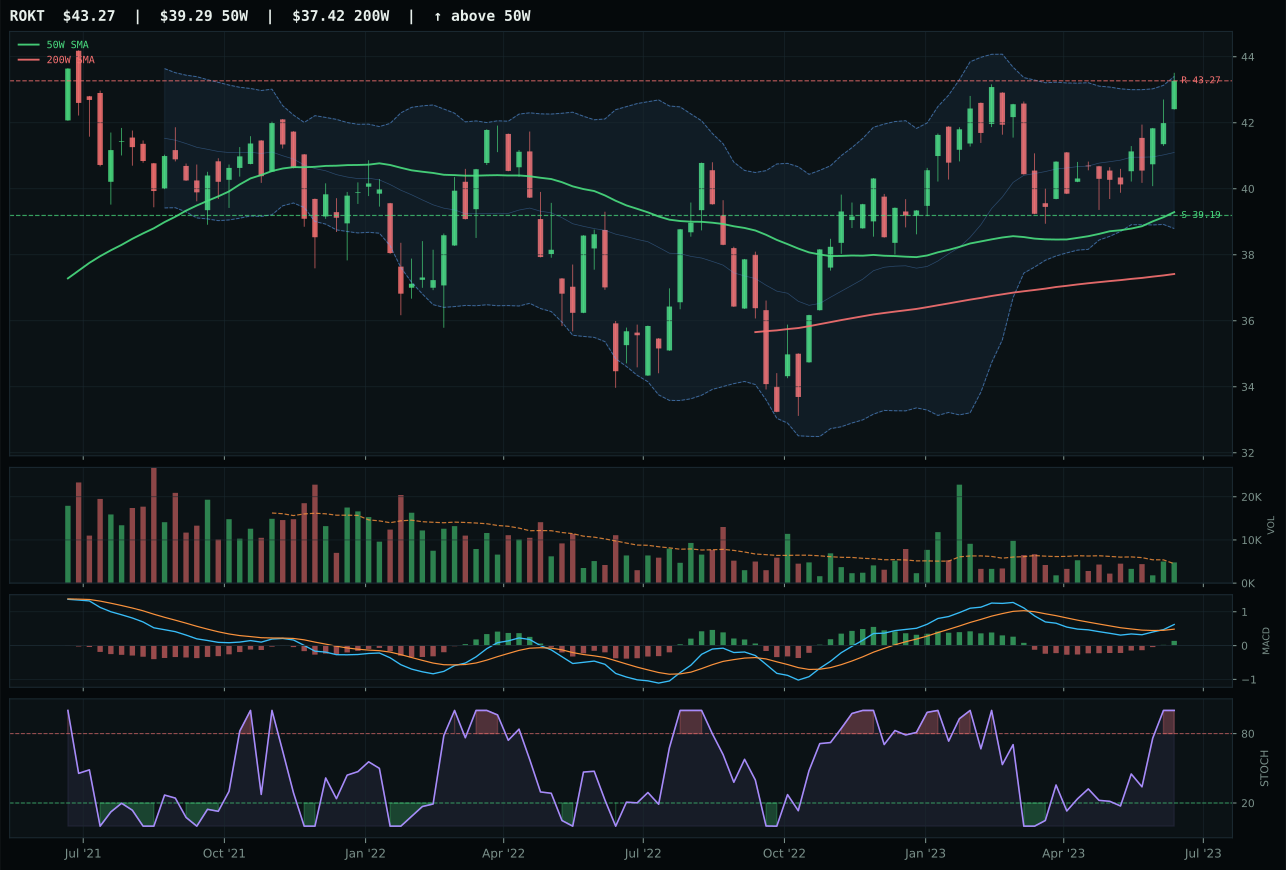
ROKT has a neutral structure profile with -2.4% 13-week relative strength versus SPY.
A failed hold above support would weaken the setup.
Tracked, but not top-2 eligible because: .
XAR wins with a 73 composite score driven by a clean 93.3 trend foundation and a remarkably strong 75.0 timing score, the latter stemming from its tight 9.1% proximity to the 50-week moving average. The setup is neutral structure—not a breakout, not a collapse—which makes XAR's victory conditional on disciplined technical discipline rather than momentum magnitude. Its 13W return of 8.2% and category-relative strength of 0.0% (median parity) signal breadth and durability; MACD bullish and improving with stochastic RSI in overbought momentum territory means the structure is supported by positive direction even if not by explosive acceleration. ITA lost because MACD confirmation weakened to bearish-but-improving (a deterioration signal) while category-relative strength fell to -3.3%, indicating lagging positioning within the peer set. The 7.1-point gap between XAR and ITA is decisive; it reflects XAR's ability to hold the 50W as a pivot without relying on momentum thrusts, a setup that favors continuity over panic.
Defense & Aerospace earned 5% tier-2 allocation with a category score of 45.8, placing it squarely in the middle tier despite XAR's technical competence. The macro fit of 57.0 is neutral; late-cycle reflation helps defense slightly (+6) while liquidity stress drags (-4), a wash that leaves the category dependent on technical evidence. The category's 73.7 technical evidence score (XAR's contribution) is respectable but trails energy and metals where macro tailwinds are abundant. Risk appetite positive is not active in this cycle, a structural headwind for defense equities; they perform when fear rises, not when real-asset inflation and supply scarcity dominate. To earn 5% allocation, this category would require either a flight-to-quality regime or a sharp deterioration in equities that lifts de-risking flows. For now, it holds tier-2 status because XAR's neutral-structure setup offers stability but limited upside, and the macro regime offers no sponsorship layer to extend its reach. The positioning is prudent for portfolio balance, not for conviction.
Utilities & Infrastructure — PAVE
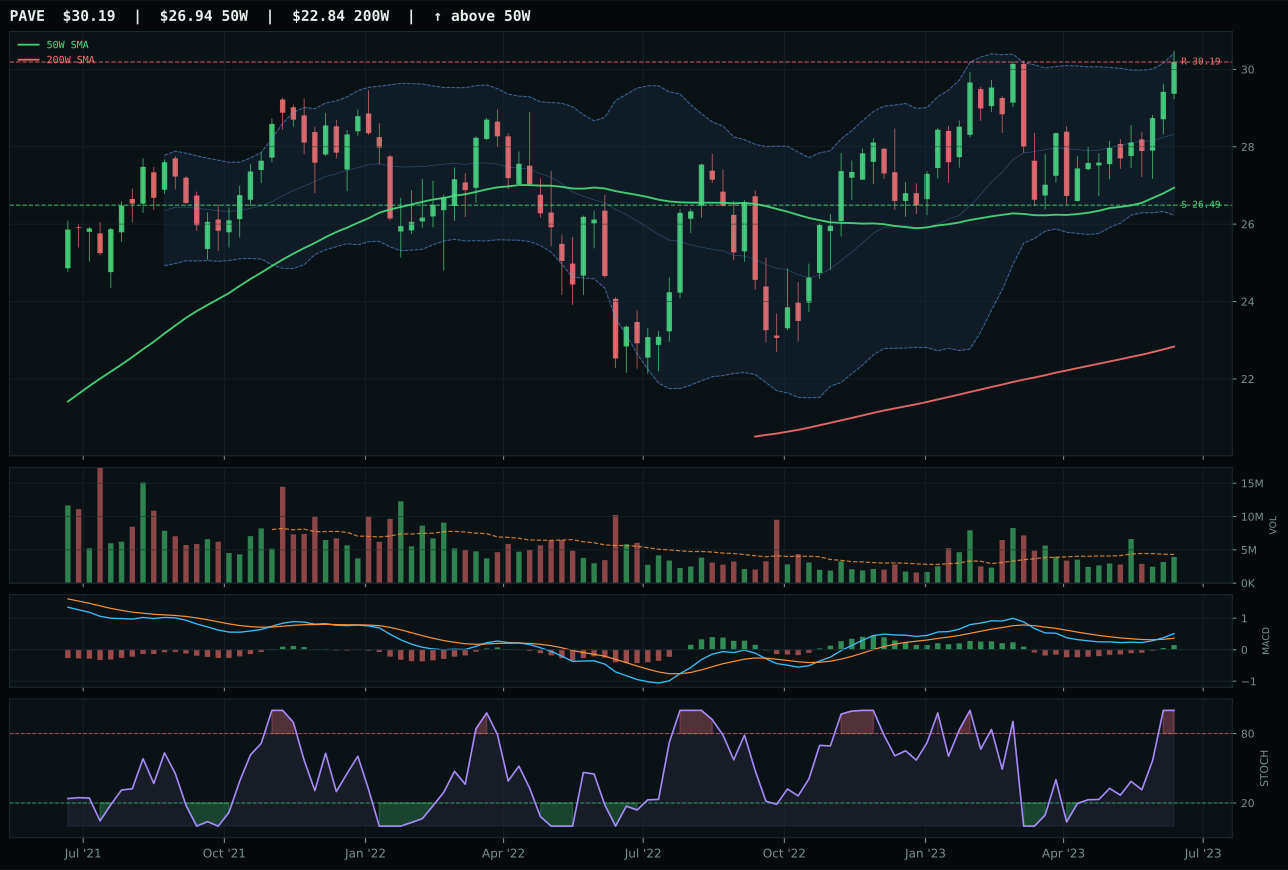
PAVE has a neutral structure profile with 0.7% 13-week relative strength versus SPY.
A failed hold above support would weaken the setup.
Actionable but governed by invalidation levels.
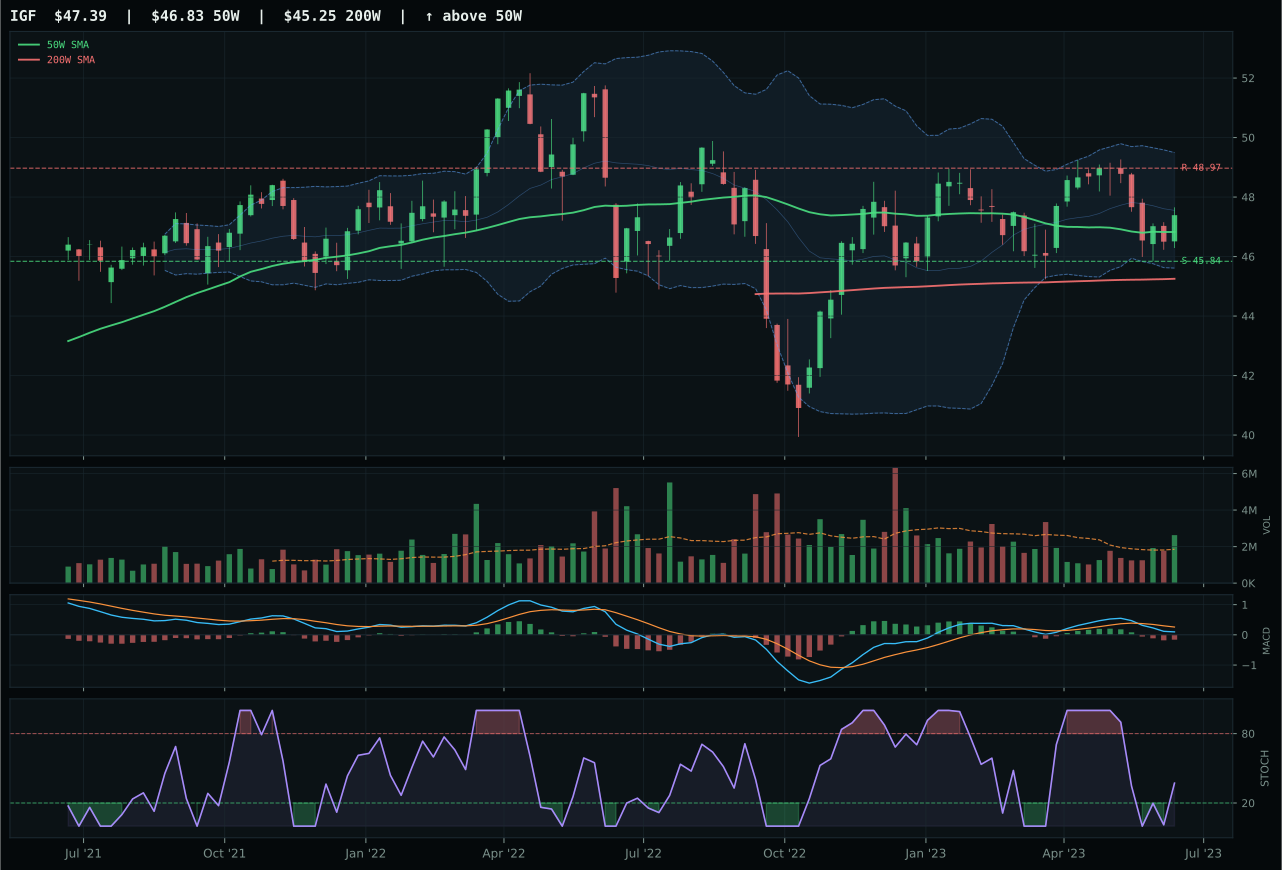
IGF has a pullback into support profile with -9.8% 13-week relative strength versus SPY.
A failed hold above support would weaken the setup.
Actionable but governed by invalidation levels.
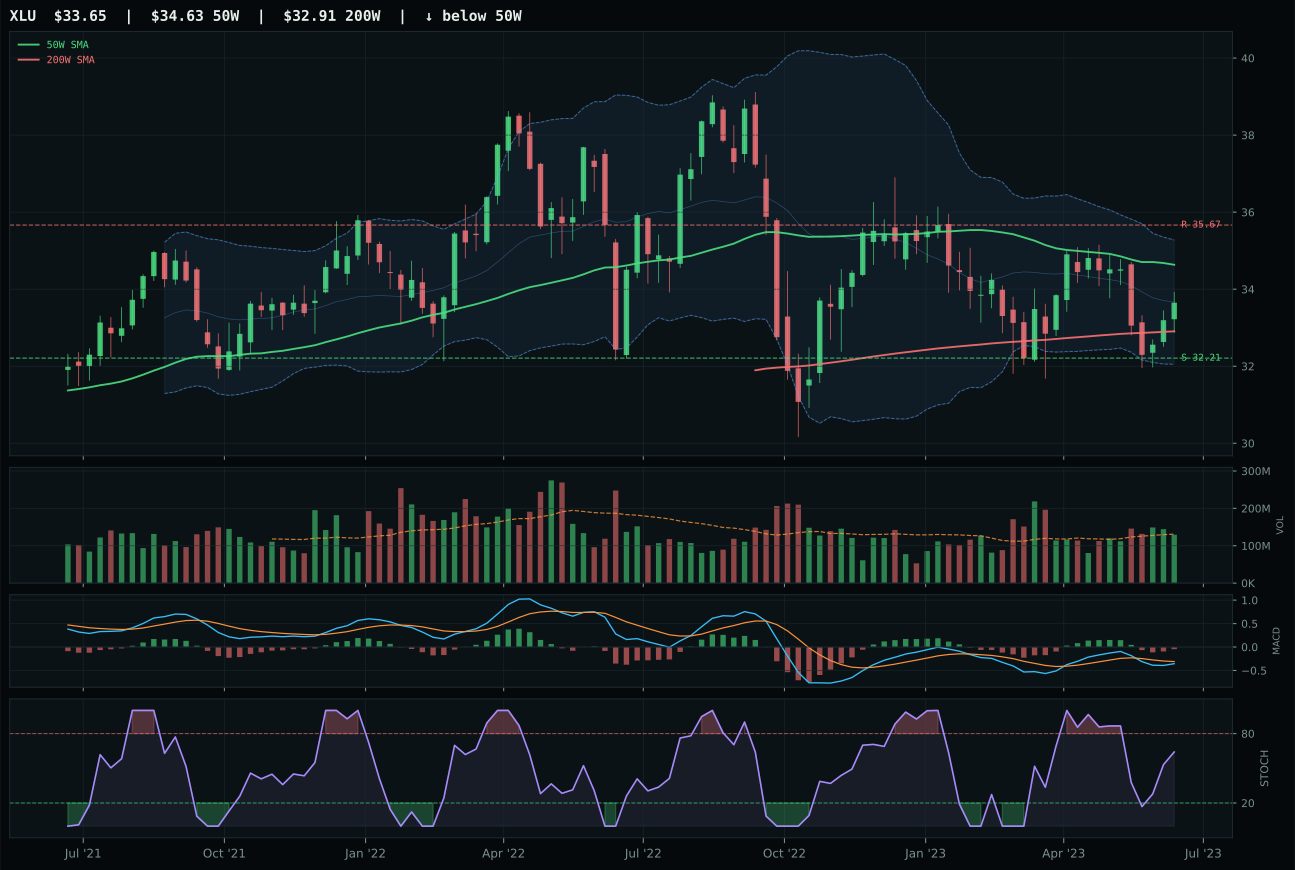
XLU has a pullback into support profile with -12.2% 13-week relative strength versus SPY.
A failed hold above support would weaken the setup.
Actionable but governed by invalidation levels.
PAVE wins utilities and infrastructure with a 35.3 category score by combining a clean 100.0 trend and 100.0 momentum confirmation with the highest category-relative strength (10.5%), yet this victory is hollow because the category itself is ranked outside the portfolio at 0% allocation. PAVE sits 12.1% above its 50W with bullish and improving MACD, overbought stochastic RSI, and neutral volume at 0.91x the 20W average, a setup that reflects solid technical infrastructure but carries the same extended-momentum risks seen across growth-heavy categories. The 13.4% thirteen-week return and 0.7% relative strength to SPY are decent, yet the absence of forced accumulation volume signals that institutional conviction is tepid. IGF, the runner-up, offers superior timing (100.0 versus PAVE's 59.0) by sitting closer to support in pullback-into-support setup, yet its MACD deteriorated to bearish/weakening, a confirmation failure that correctly penalizes it. The 8.9-point gap reflects PAVE's technical superiority, but technical strength in a weak category carries no allocation weight.
Utilities and infrastructure scored 35.3 and earned 0% allocation this week, ranking outside the portfolio as a tier-3 exclusion. The macro fit is poor at 43.0; inflation pressure is active as a -6 descriptor (rate-sensitive utilities struggle in high-inflation environments), and both liquidity stress and credit stress create headwinds despite modest tailwinds from transition/mixed regime support (+4). PAVE's exceptional technical evidence (86.8) and clean 100.0 trend cannot overcome the structural macro unfitness of duration-sensitive utilities in late-cycle reflation with active inflation. The portfolio's capital is allocated to categories with explicit supply-shortage and scarcity-premium narratives (energy, metals, agriculture); defensive and infrastructure plays rank below these in priority. To earn 5% allocation, this category would require either a pivot toward risk-off sentiment that lifts demand for defensive assets or a decline in inflation pressure that removes the rate-sensitivity headwind. For now, utilities and infrastructure are excluded because they offer neither growth momentum nor inflation hedging; they are simply duration-loaded equities in an environment where real assets and scarcity premiums dominate.
Precious Metals — GLD
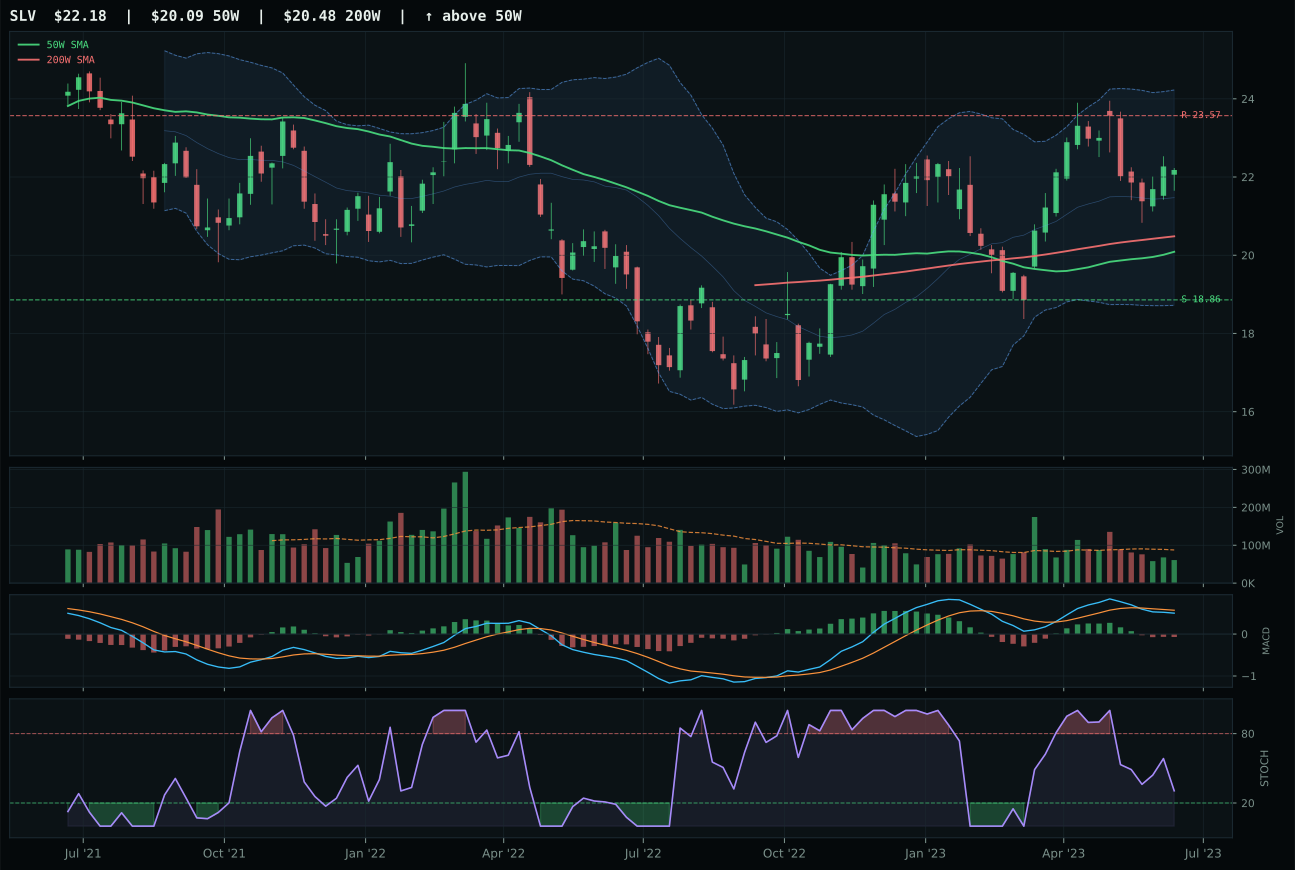
SLV has a neutral structure profile with -5.2% 13-week relative strength versus SPY.
A failed hold above support would weaken the setup.
Actionable but governed by invalidation levels.
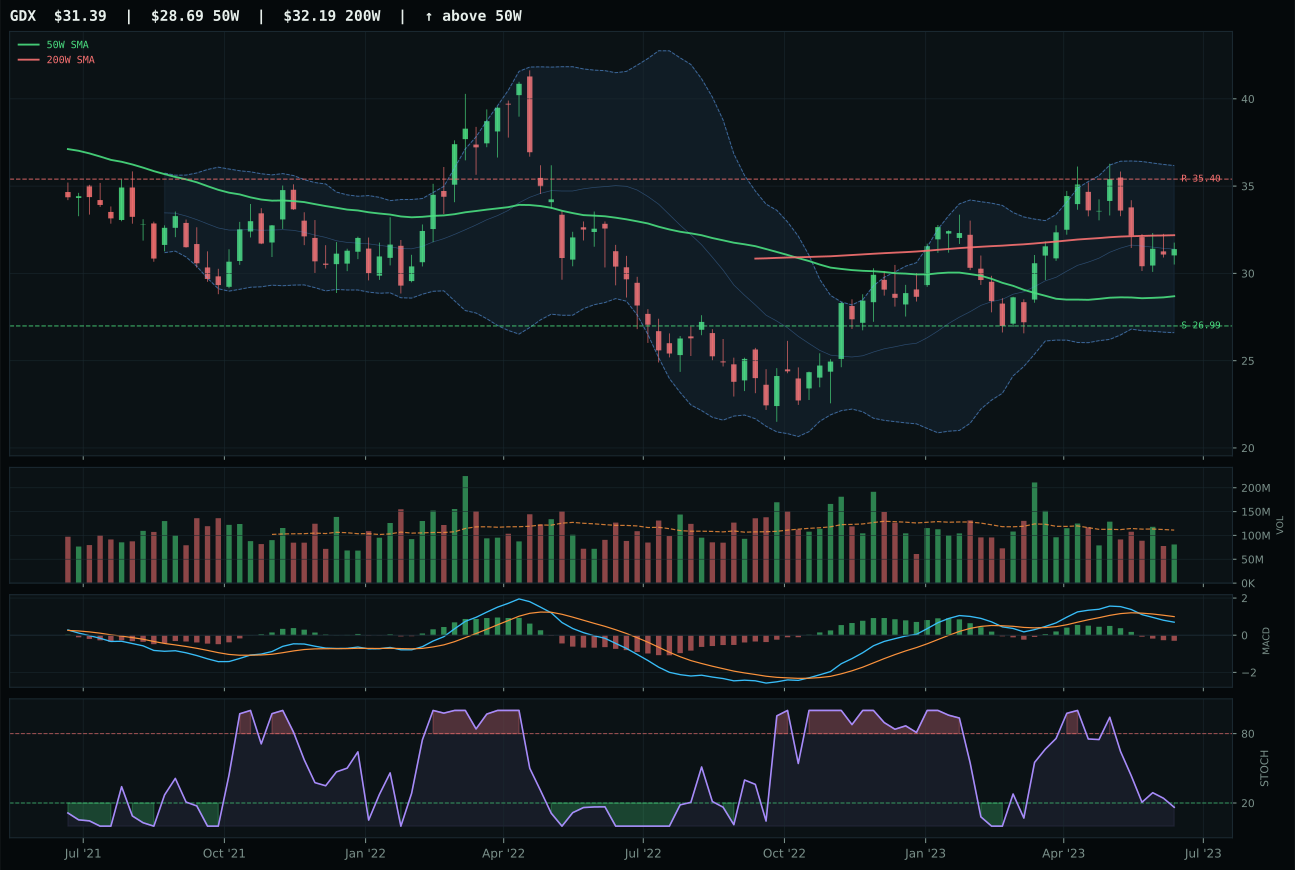
GDX has a neutral structure profile with -10.0% 13-week relative strength versus SPY.
A failed hold above support would weaken the setup.
Actionable but governed by invalidation levels.
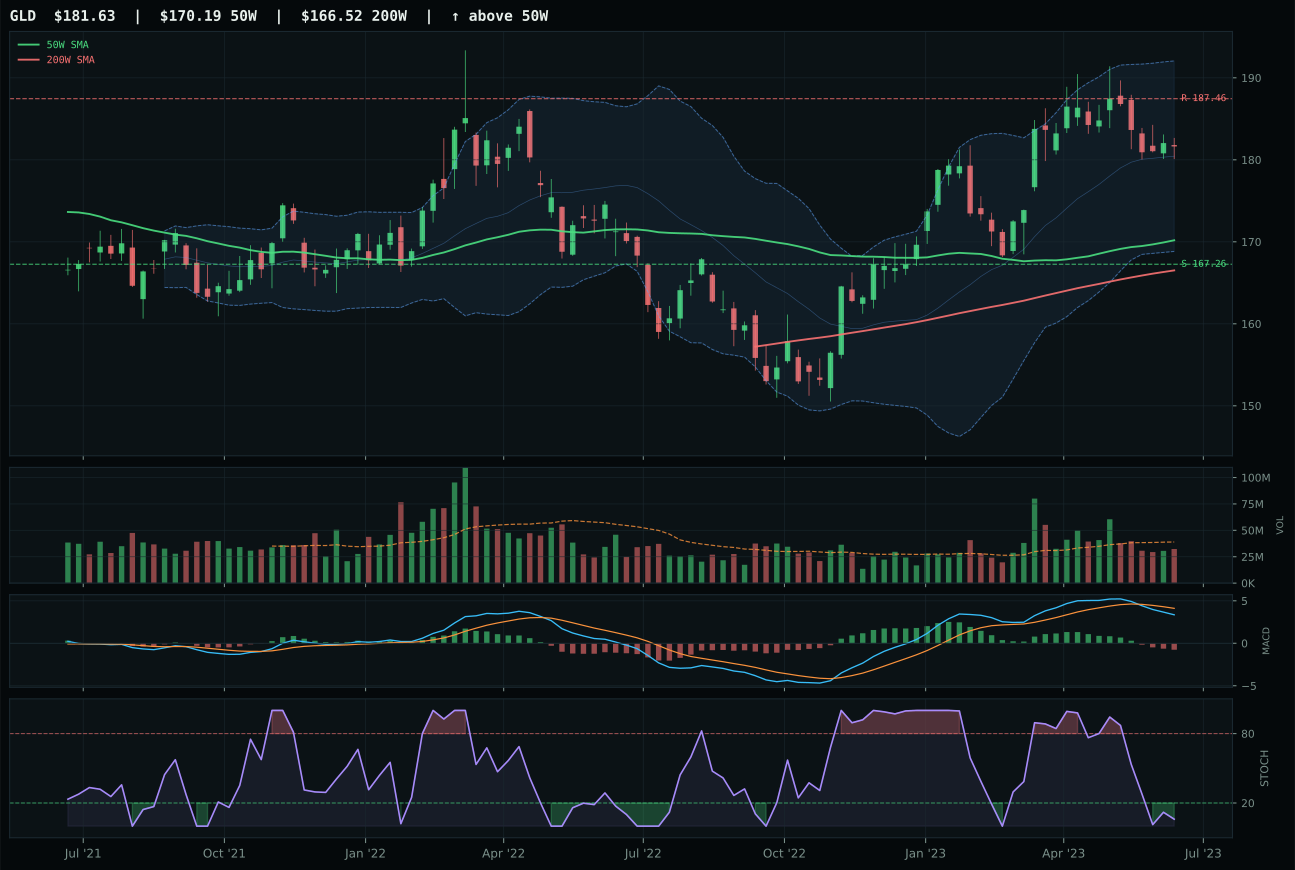
GLD has a neutral structure profile with -13.8% 13-week relative strength versus SPY.
A failed hold above support would weaken the setup.
Actionable but governed by invalidation levels.
GLD wins by margin over SLV despite both displaying bearish/weakening MACD and oversold/falling stochastic RSI momentum, because GLD's category-relative strength of -3.8% is slightly less negative than SLV's 4.9%, a technical signal that gold is experiencing less forced selling pressure within its peer group. The distinction is subtle but meaningful: both sit above their 50W (GLD 6.7%, SLV marginally closer), both face headwinds from risk appetite positive being active as a -4 descriptor, and both exhibit neutral to thin participation volume. GLD's 13W return of -1.2% and SLV's 7.5% should favor silver, yet GLD's tighter structure (70.5 versus SLV's comparable score) and neutral volume (versus SLV's thin participation) give it a durability edge. The risk/reward is nearly identical (51.5 for GLD versus 51.0 for SLV), confirming this is a coin-flip decision within a deteriorating category. What tips it to GLD is the absence of forced selling signature; neutral volume means fewer forced redemptions and better liquidity mechanics for a holder.
Precious metals scored 34.0 and earned 0% allocation this week, placing it outside the portfolio entirely as a ranked 9th or 10th category. The technical evidence score of 25.7 for GLD is abysmal—momentum confirmation at 3.7 from four-week negative returns, thirteen-week underperformance, and category-relative weakness all signal institutional de-conviction. The macro fit of 46.0 is not strong enough to compensate; risk appetite positive is active as a -4 descriptor in late-cycle reflation, an explicit headwind for safe-haven metals. Precious metals thrive when credit stress and liquidity stress spike; in the current regime, they are dormant. Neither gold nor silver offers entry clarity or macro sponsorship. To earn even 5% allocation, this category would require either a sharp uptick in credit stress signals (currently active but not severe) or a flight-to-quality event that lifts safe-haven demand. For now, exclusion is correct; the portfolio's real-asset bets are better placed in commodities and energy where supply scarcity and inflation create tailwinds, not in precious metals where risk-on sentiment actively penalizes them.