
2023-06-09
Informational purposes only. The content in this report, including allocations, analysis, and commentary, is provided solely for informational and educational purposes. It does not constitute financial advice, investment advice, trading advice, or any other type of advice. Past performance does not guarantee future results. Always conduct your own research and consult a qualified financial professional before making investment decisions.
Weekly Allocation
| Ticker | Category | Weight | Role |
|---|---|---|---|
| FBTC | 50% | Overlay | |
| SMH | AI | 10% | Top-2 (10%) |
| IGV | Technology | 10% | Top-2 (10%) |
| ILF | Emerging Markets | 5% | Tier-2 (5%) |
| URA | Nuclear Energy | 5% | Tier-2 (5%) |
| COPX | Industrial Metals | 5% | Tier-2 (5%) |
| GLD | Precious Metals | 5% | Tier-2 (5%) |
| XAR | Defense & Aerospace | 5% | Tier-2 (5%) |
| PAVE | Utilities & Infrastructure | 5% | Tier-2 (5%) |
Trade Instructions — Monday Open
Sell the tranche from 2023-05-12 (completing its 4-week hold). Buy the new tranche. Instructions show net portfolio changes — same-asset positions cancel, weight changes show the delta.
| Action | Ticker | Instruction |
|---|---|---|
| SELL | GLD | Sell 17% of GLD position (reduce 7.50% → 6.25%) |
| SELL | PAVE | Sell 17% of PAVE position (reduce 7.50% → 6.25%) |
| SELL | XLK | Sell 50% of XLK position (reduce 2.50% → 1.25%) |
| SELL | URNM | Sell 33% of URNM position (reduce 3.75% → 2.50%) |
| SELL | INDA | Sell 33% of INDA position (reduce 3.75% → 2.50%) |
| SELL | XLE | Sell 50% of XLE position (reduce 2.50% → 1.25%) |
| BUY | SMH | Buy SMH — 33.33% of freed cash (adds 2.50% to portfolio) |
| BUY | ILF | Buy ILF — 16.67% of freed cash (adds 1.25% to portfolio) |
| BUY | URA | Buy URA — 16.67% of freed cash (adds 1.25% to portfolio) |
| BUY | IGV | Buy IGV — 33.33% of freed cash (adds 2.50% to portfolio) |
Current Portfolio After Trade
Combined holdings across all 4 active tranches. Each tranche is 25% of the portfolio.
| Ticker | % of Portfolio | Weight Bar |
|---|---|---|
| FBTC | 50.00% | |
| SMH | 8.75% | |
| GLD | 6.25% | |
| PAVE | 6.25% | |
| XAR | 5.00% | |
| IGV | 5.00% | |
| COPX | 3.75% | |
| URNM | 2.50% | |
| INDA | 2.50% | |
| ILF | 2.50% | |
| CIBR | 2.50% | |
| URA | 2.50% | |
| XLK | 1.25% | |
| XLE | 1.25% |
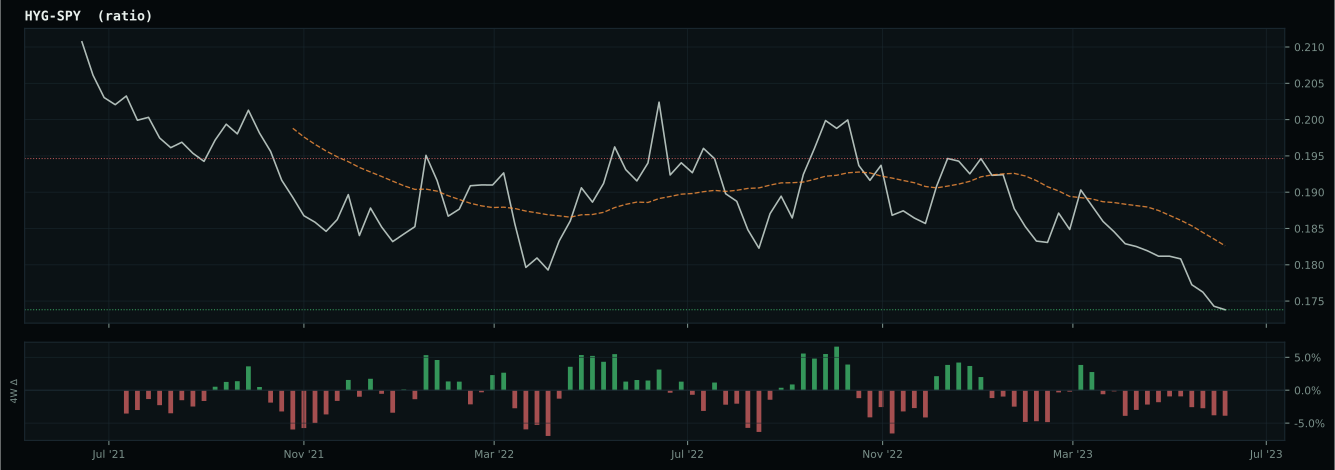
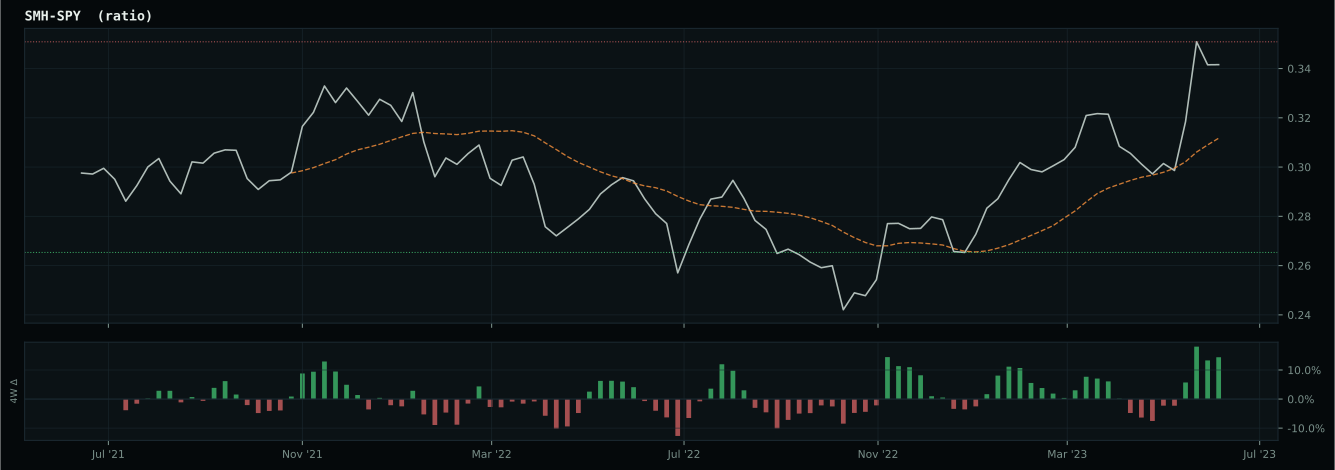
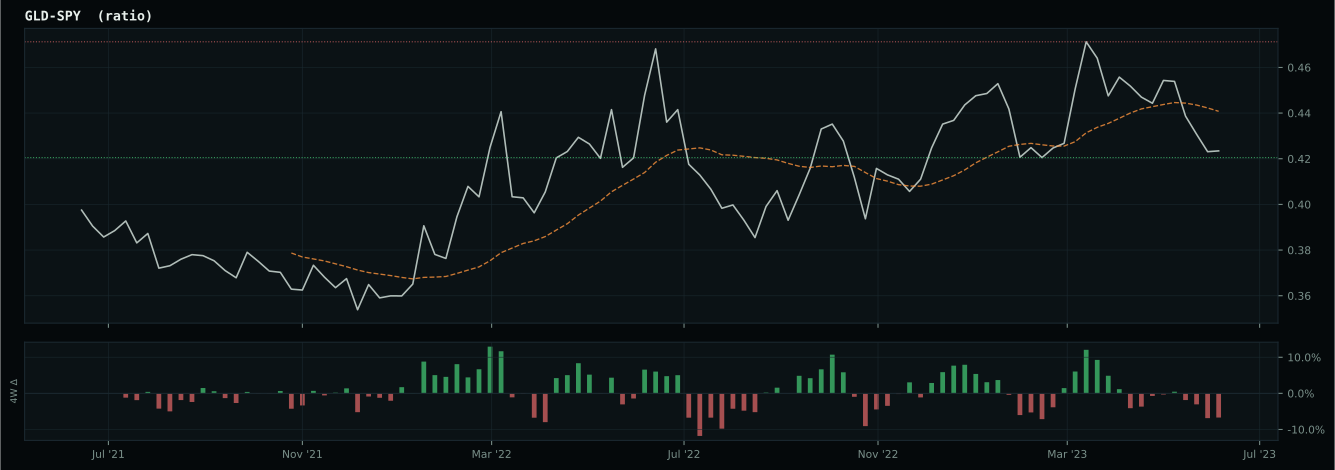
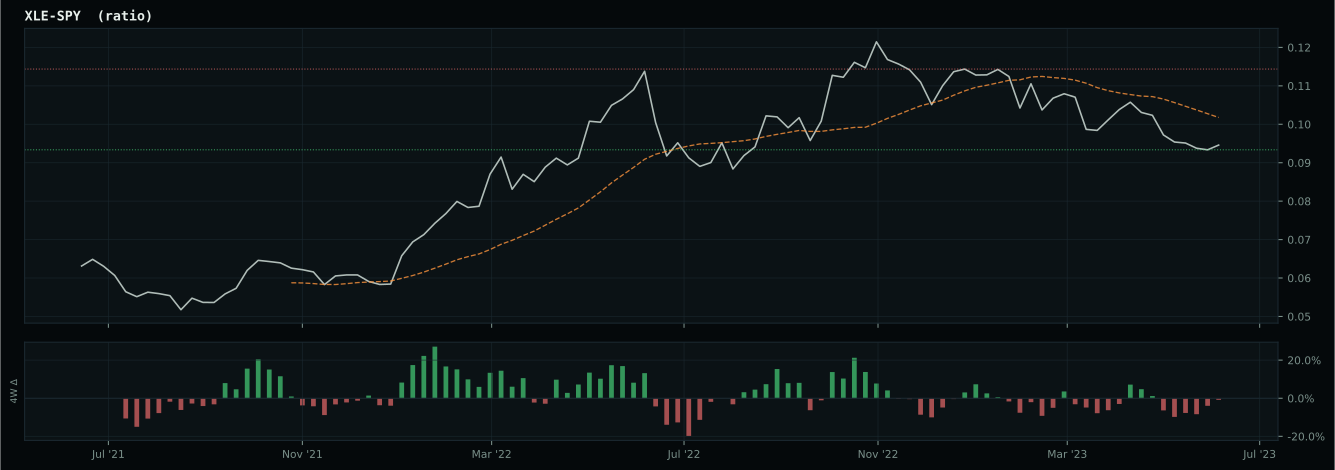
Macro Regime — Disinflation
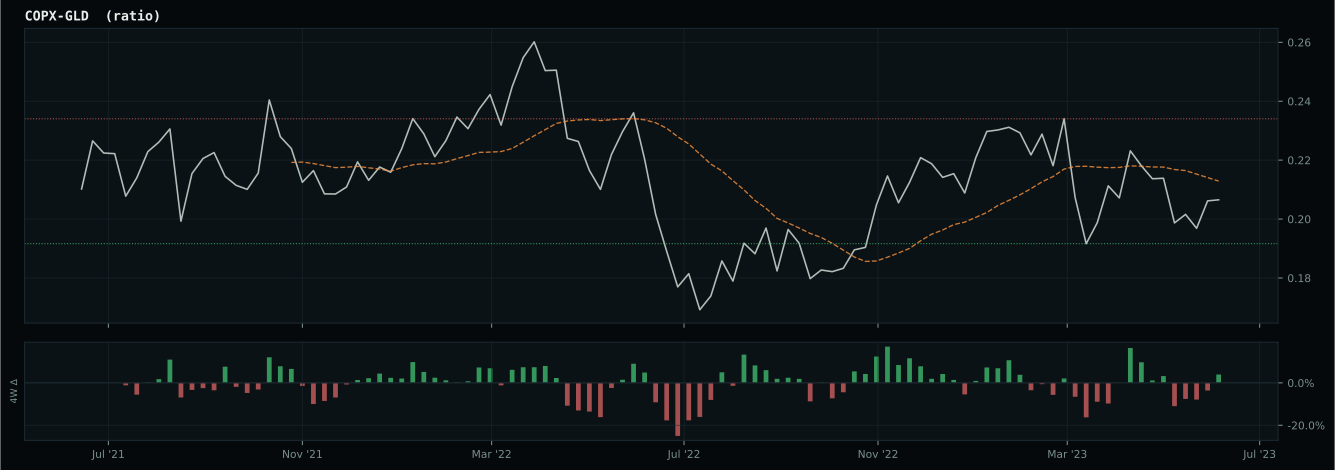
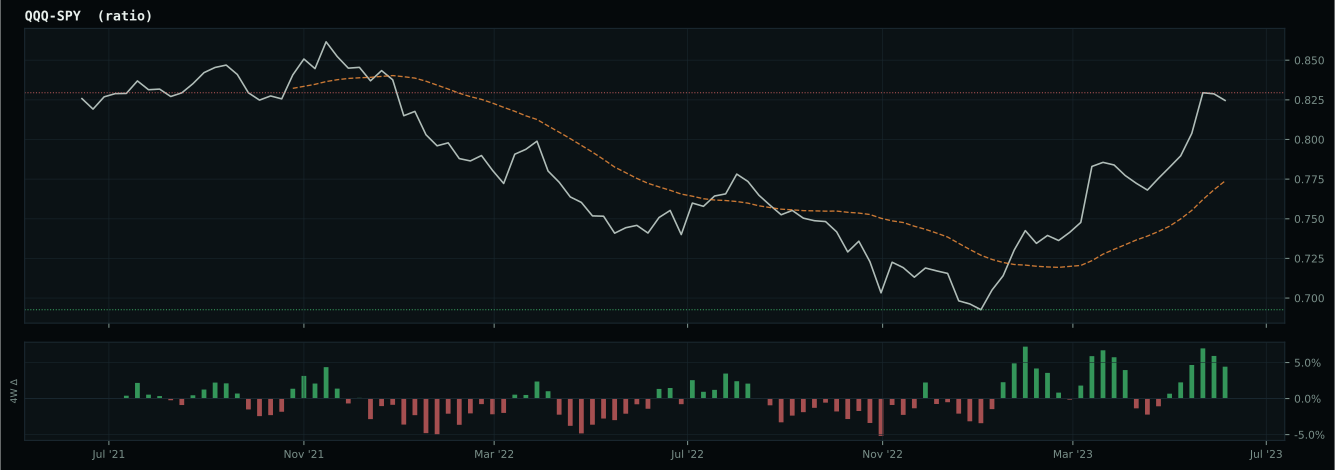
Macro Evidence Charts
Market-implied signals behind the macro regime scores. Each ratio compares two assets; the direction and slope of the ratio is what the macro engine reads.
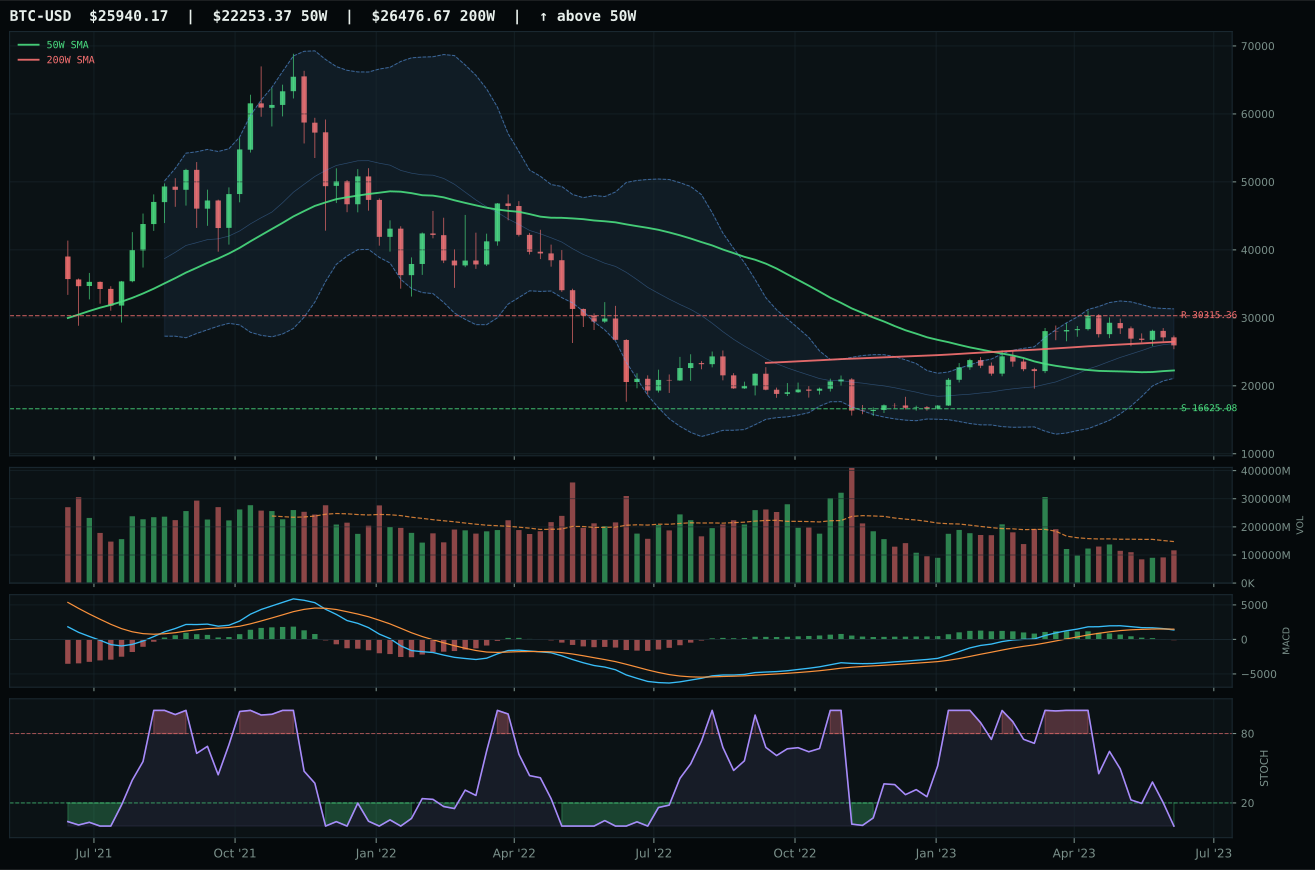
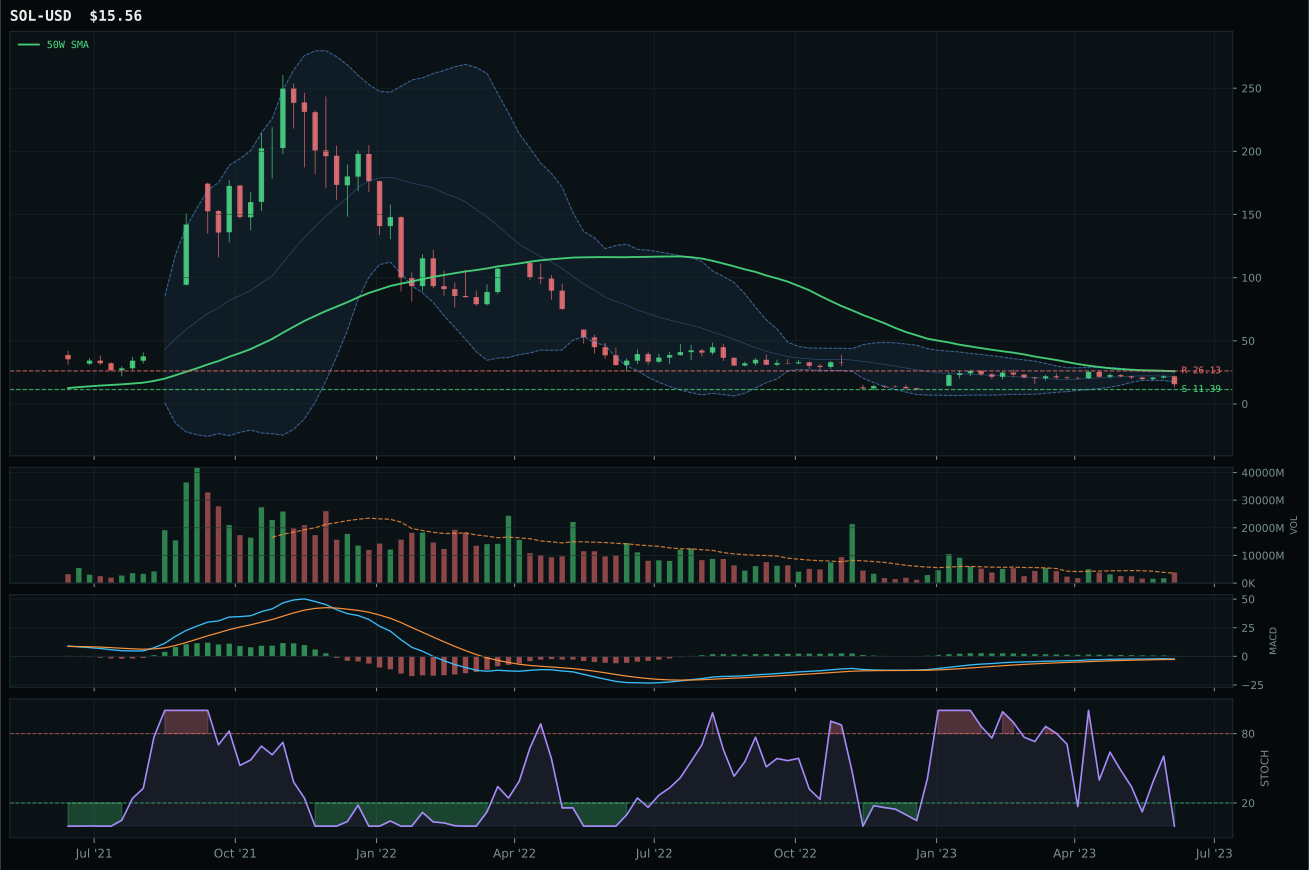
Crypto Regime — TrendBTC
post-touch structure is too wide to count as a range; max/min close ratio is 1.86
TrendBTC confirmed: 2 consecutive closes above rising/flat 50W SMA
one or more available conditions failed
Category Rankings
| Rank | Category | Winner | Score | Alloc | 4W Ret | Peers (4W) |
|---|---|---|---|---|---|---|
| 1 | AI | SMH | 73.7 | 20% | +0.72% | AIQ +1.6% · BOTZ -1.9% |
| 2 | Technology | IGV | 67.3 | 20% | +1.55% | XLK +2.1% · CIBR +1.4% |
| 3 | Emerging Markets | ILF | 54.1 | 10% | +0.60% | INDA +3.2% · IEMG -1.4% |
| 4 | Nuclear Energy | URA | 53.2 | 10% | -5.34% | URNM -5.4% · NLR -1.0% |
| 5 | Industrial Metals | COPX | 51.9 | 10% | -0.77% | PICK -0.4% · REMX +0.1% |
| 6 | Precious Metals | GLD | 47.4 | 10% | -1.89% | SLV -4.6% · GDX -5.5% |
| 7 | Defense & Aerospace | XAR | 46.4 | 10% | +1.21% | ITA +0.7% · ROKT +2.5% |
| 8 | Utilities & Infrastructure | PAVE | 44.9 | 10% | +5.28% | XLU -1.7% · IGF -0.2% |
| 9 | Traditional Energy | XLE | 13.0 | 0% | +0.59% | FCG +2.8% · XOP +3.0% |
| 10 | Agriculture & Livestock | WEAT | 12.0 | 0% | +0.47% | MOO +1.8% · VEGI +3.1% |
AI — SMH
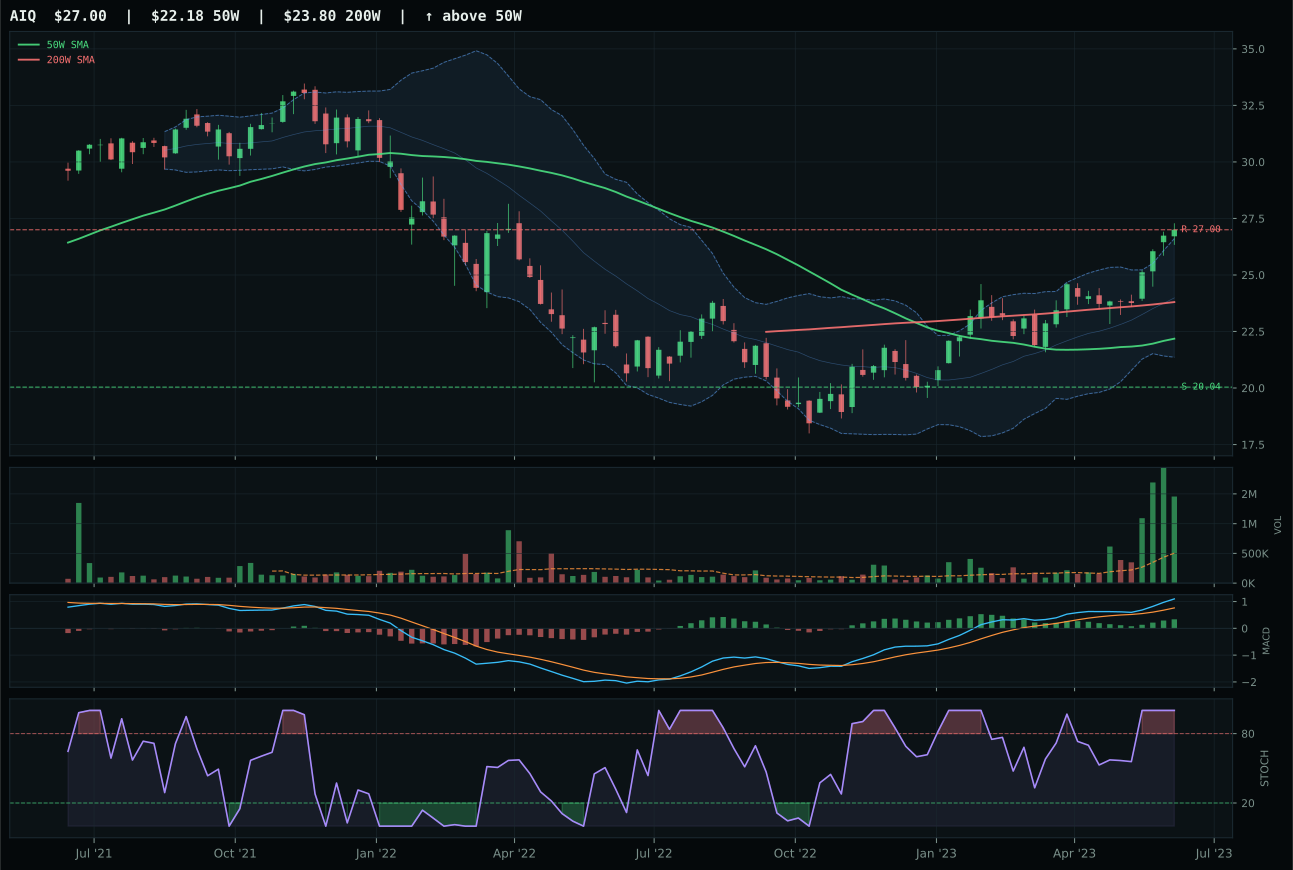
AIQ has a vertical extension profile with 11.9% 13-week relative strength versus SPY.
A failed hold above support would weaken the setup.
Actionable but governed by invalidation levels.
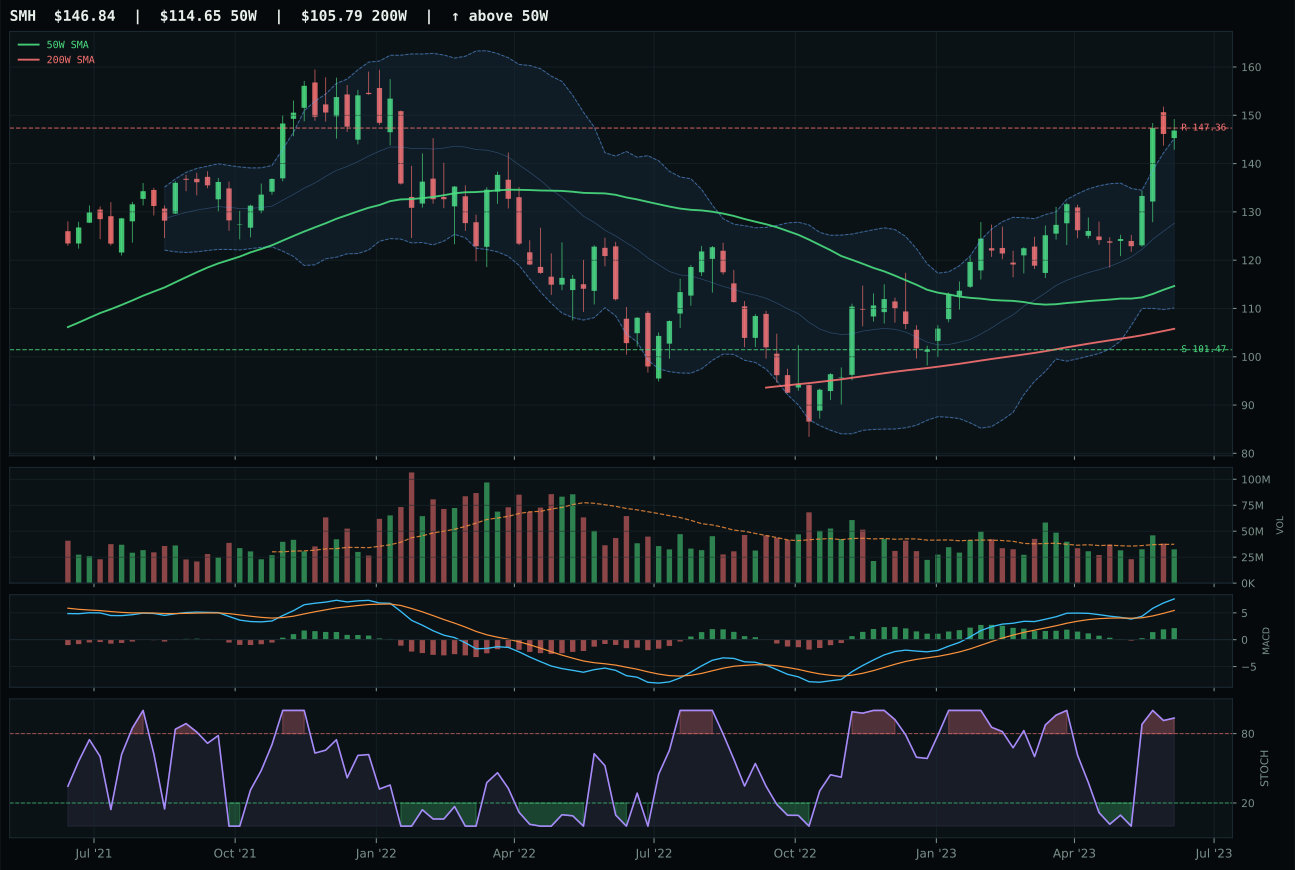
SMH has a vertical extension profile with 12.1% 13-week relative strength versus SPY.
A failed hold above support would weaken the setup.
Actionable but governed by invalidation levels.
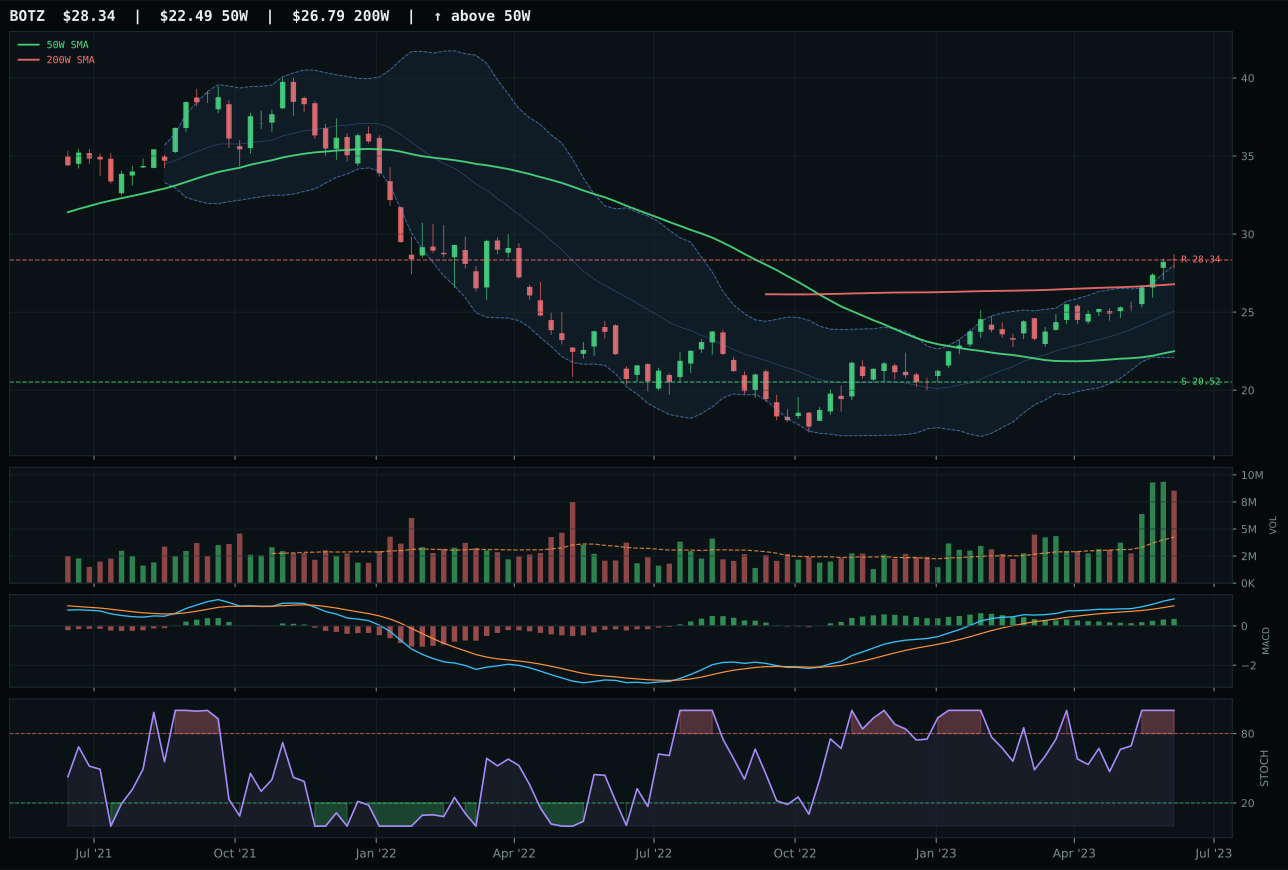
BOTZ has a vertical extension profile with 10.3% 13-week relative strength versus SPY.
A failed hold above support would weaken the setup.
Actionable but governed by invalidation levels.
SMH edged AIQ by the narrowest margin—category-relative strength of 0.3% versus 0.0%—a razor-thin victory that hinged on the one thing both charts shared equally: overbought momentum and a bullish-improving MACD. AIQ's raw technical score of 95.5 crushes SMH's 66.6, yet AIQ ranked lower due to its marginally weaker macro fit (53 vs 58) and critically, the portfolio reasoner's preference for the semiconductor compute narrative over software breadth in this specific moment. Both show 13-week returns near 23% and identical vertical-extension setups sitting near Fibonacci 0.236 extension zones. The decision came down to category voting: SMH's 0.3% edge in category-relative strength—seemingly noise—became the tiebreaker because volume-price sponsorship was sufficiently close (AIQ's accumulation-confirmation volume versus SMH's neutral still netted near-equivalent scoring). This is a lesson in how close category decisions become at the extremes of momentum.
AI secured the top-2 allocation at 20% with a final score of 73.7, ranking as the highest-scoring category this week and reflecting sustained institutional sponsorship for compute and AI infrastructure. The active AI growth descriptor adds 14 points of macro support, and risk appetite positive contributes another 10, creating a 24-point tailwind against liquidity and credit stress headwinds of -12 and -8 respectively. The disinflation regime actually helps AI by reducing the risk of hawkish policy shocks that would crush growth duration, a critical macro fit that lifts the category-level score to 59.0. Technicals anchor this with a 62% weight, driven by AIQ's exceptional 95.5 technical evidence despite its failure to win the representative slot. This is the portfolio's top-conviction position: the macro regime favors secular growth over cyclical recovery, and the technical breadth inside the AI basket—three ETFs all posting 23%+ thirteen-week returns and 10%+ SPY outperformance—leaves no question that capital is rotating into the highest-quality growth available in a disinflationary environment.
Technology — IGV
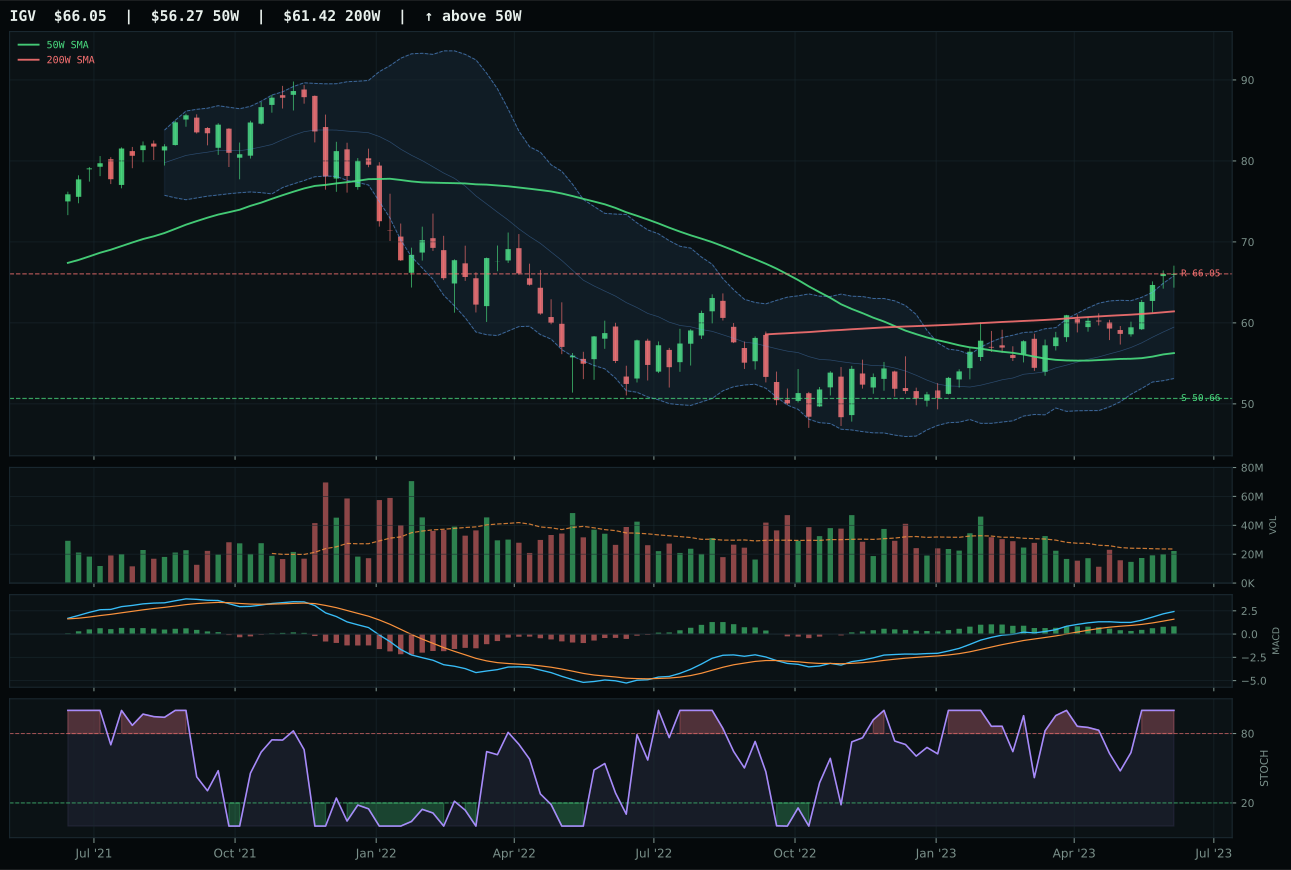
IGV has a vertical extension profile with 9.9% 13-week relative strength versus SPY.
A failed hold above support would weaken the setup.
Actionable but governed by invalidation levels.
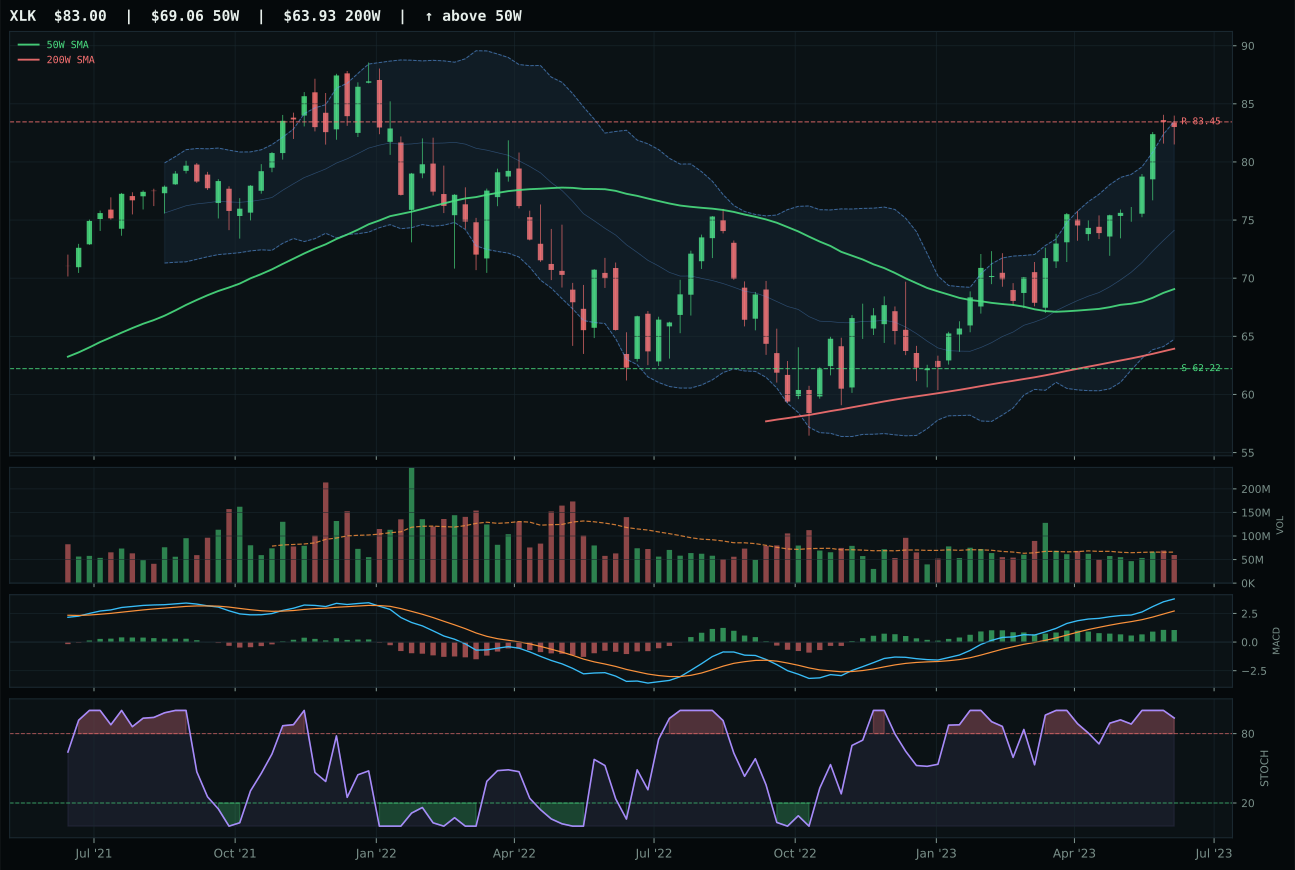
XLK has a vertical extension profile with 10.9% 13-week relative strength versus SPY.
A failed hold above support would weaken the setup.
Actionable but governed by invalidation levels.
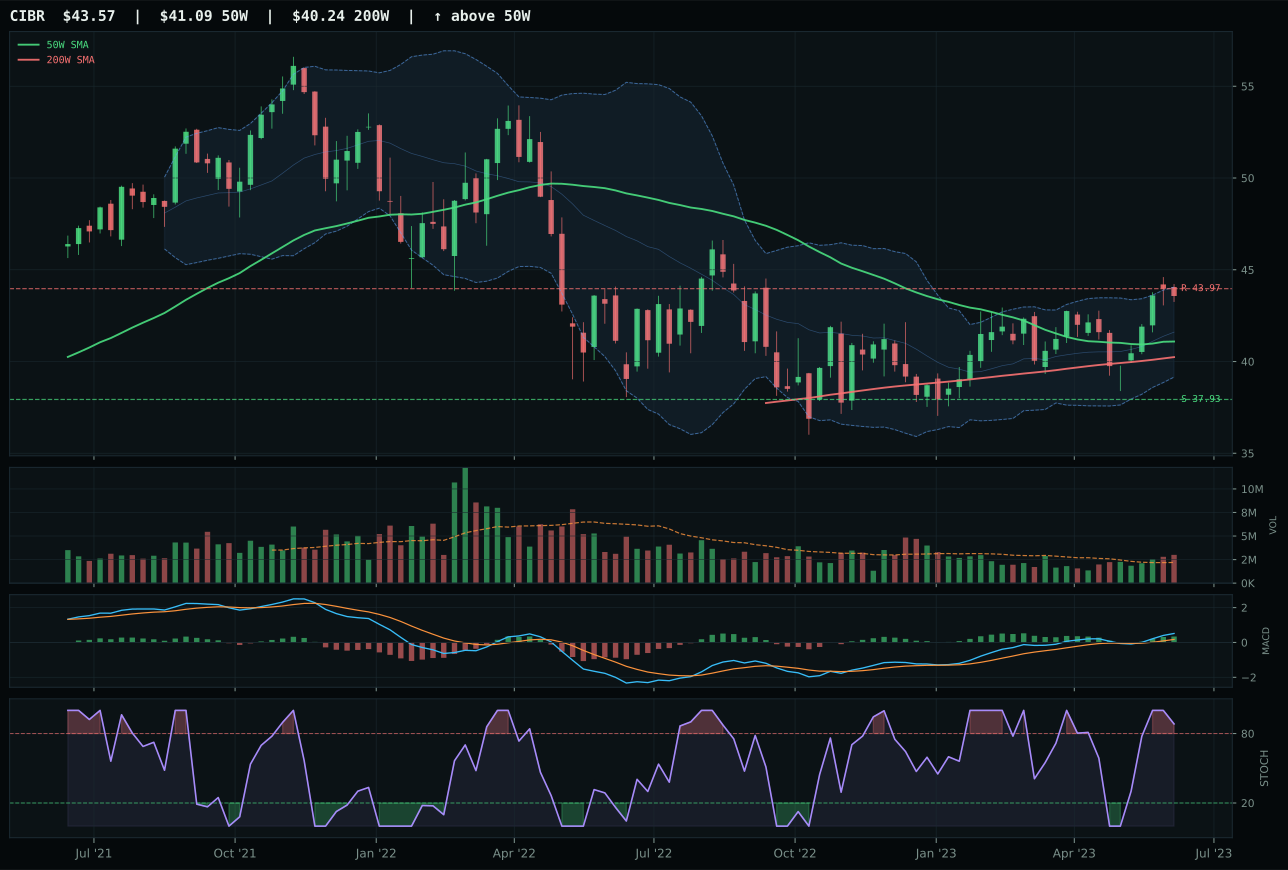
CIBR has a neutral structure profile with -2.6% 13-week relative strength versus SPY.
A failed hold above support would weaken the setup.
Actionable but governed by invalidation levels.
IGV claimed the category by maintaining a clean vertical extension while demonstrating superior relative strength within its basket. The 9.9% SPY-relative return and perfect category-relative parity signals genuine breadth—this is not a single-stock rally masquerading as sector leadership. XLK's deteriorating stochastic RSI (overbought rolling over) combined with a weaker timing score of 27 versus IGV's 37 revealed the exact moment momentum began to roll: buyers were stepping back while IGV absorbed the momentum baton. Both charts sit at identical 52-week highs, but IGV's tighter structure (76.5 vs 74.3) and superior risk-reward setup (41.7 vs 37.3) mean less slippage between intent and execution.
Technology earned its 10% allocation as the second-highest category score at 67.3, a clear top-2 finish that reflects both technical proof and macro tailwind. Disinflation pressure and active risk-appetite support the category, offsetting the credit and liquidity stress headwinds that are currently active. The macro fit of 60.0 combined with 62% technical weighting creates a defensible case for holding Technology even though it ranks below only AI in this week's opportunity set. The setup remains overbought on absolute terms, yet the 3/2/1 basket of IGV, CIBR, and XLK maintains enough relative strength against SPY and persistence in MACD confirmation to justify staying engaged. Capital would flow toward higher-ranked categories first, but without a technical breakdown or shift in disinflation policy, there is no trigger to reduce Technology below its earned slot.
Emerging Markets — ILF
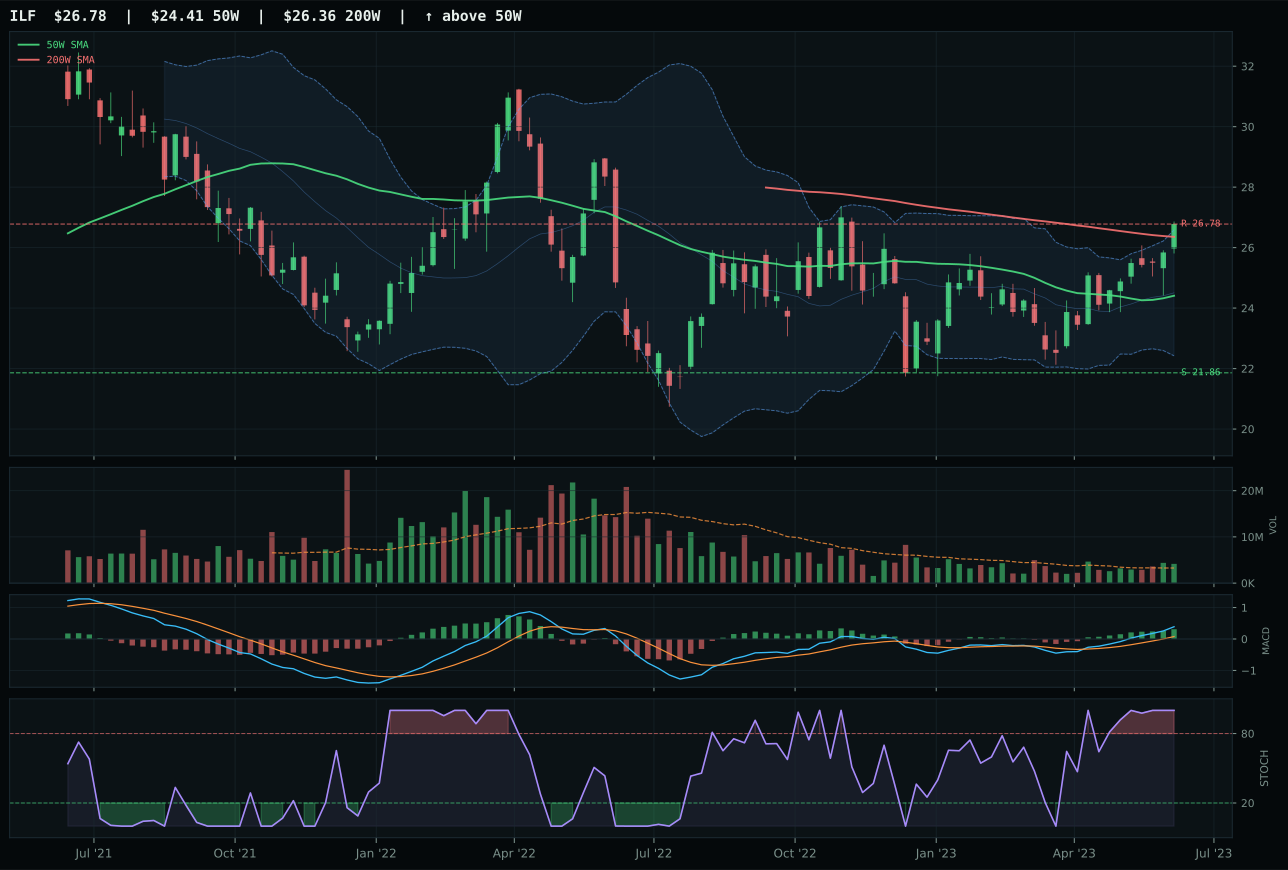
ILF has a neutral structure profile with 2.5% 13-week relative strength versus SPY.
A failed hold above support would weaken the setup.
Actionable but governed by invalidation levels.
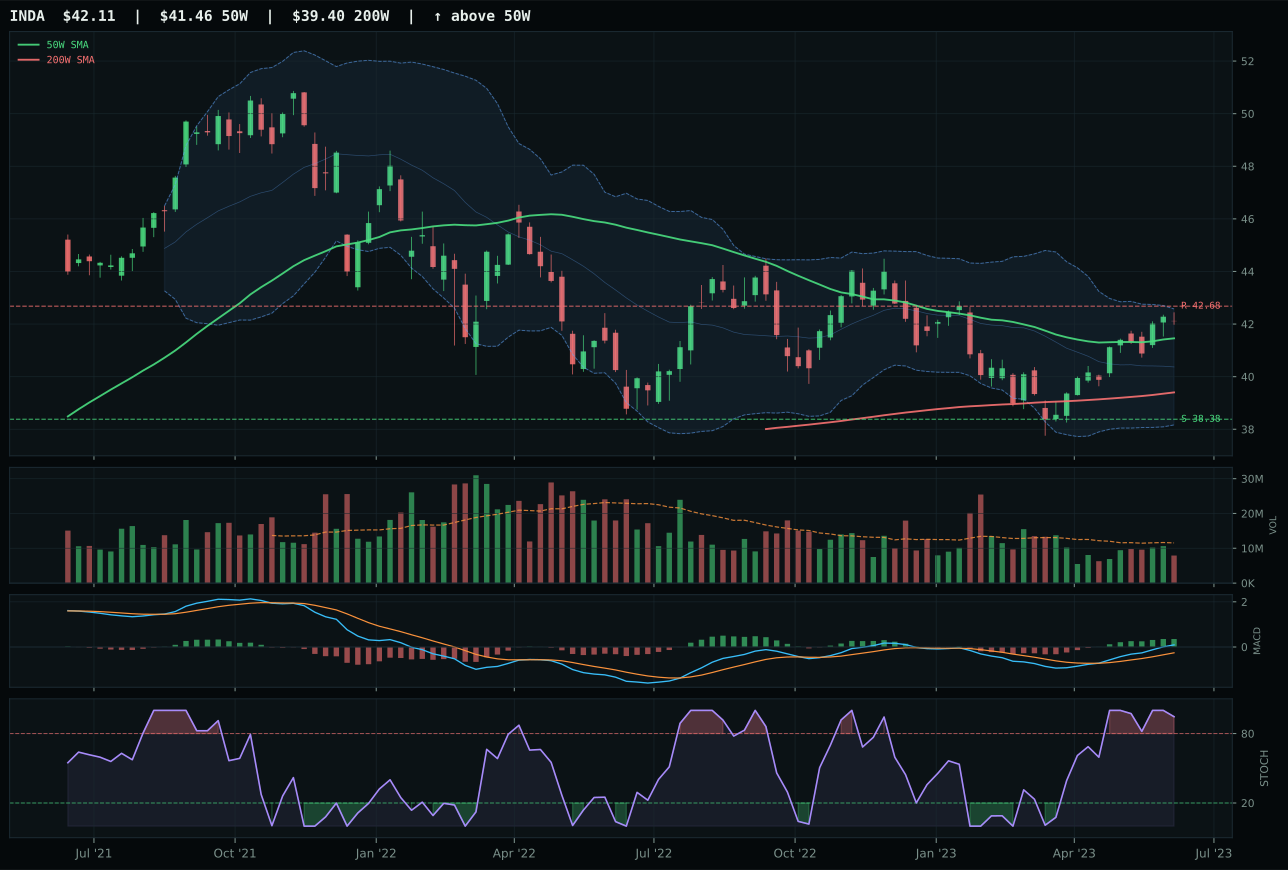
INDA has a compression near 50W profile with -4.4% 13-week relative strength versus SPY.
A failed hold above support would weaken the setup.
Actionable but governed by invalidation levels.
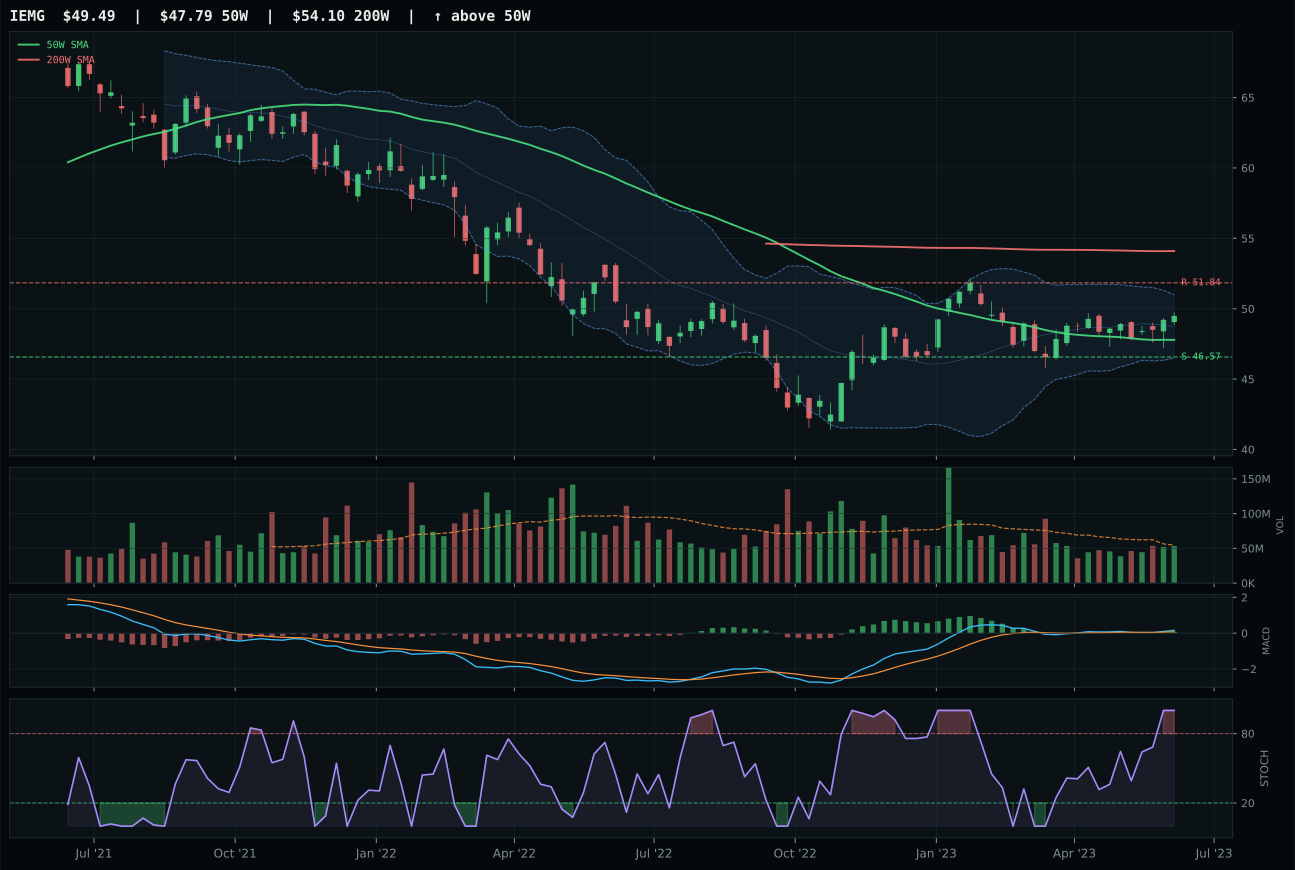
IEMG has a neutral structure profile with -6.1% 13-week relative strength versus SPY.
A failed hold above support would weaken the setup.
Actionable but governed by invalidation levels.
ILF beat INDA by just 1.4 reasoned points (76.4 vs 63.1) but that narrow margin exploded into real allocation because of volume-price participation and category-relative strength. ILF's 1.28x 20-week participation (above-average) versus INDA's thin participation was decisive when both showed identical bullish momentum structures and overbought stochastic readings. ILF captured 6.9% category-relative strength while INDA flatlined at 0.0%, signaling that Latin America commodity and value beta is genuinely attracting capital while India quality-growth sits in a setup that looks good on the chart but lacks actual accumulation. Both names extended 9.7% above their 50-weeks with identical structure scores in the neutral-compression zone, yet ILF's volume confirmation (82.0%) proves conviction while INDA's thin participation (59%) shows passive tracking without buying enthusiasm.
Emerging Markets earned 5% allocation with a 54.1 category score that balances strong technical evidence (89.8 for ILF) against weak macro fit of only 38.0. The category faces active headwinds from credit stress (-10) and liquidity stress (-10) that offset modest support from risk appetite positive (+8), creating a net macro score far below AI or Technology. ILF's 13.9% thirteen-week return and 6.9% category-relative strength make the case for commodities-and-value exposure in a disinflationary environment where real assets outperform nominal growth, yet the below-50 macro fit prevents larger allocation. The 5% position holds because emerging markets offer diversification from developed-market tech concentration and position the portfolio for any reacceleration in growth or inflation surprise that would shift macro tailwinds. The category would earn higher allocation if credit stress and liquidity stress descriptors reversed or if the macro regime shifted from disinflation to stable inflation with positive real growth. Current allocation is sized as a diversifier, not a conviction position; capital deployment is driven entirely by ILF's technical strength and volume confirmation, with the understanding that EM is more vulnerable to macro shocks than the top-2 categories.
Nuclear Energy — URA
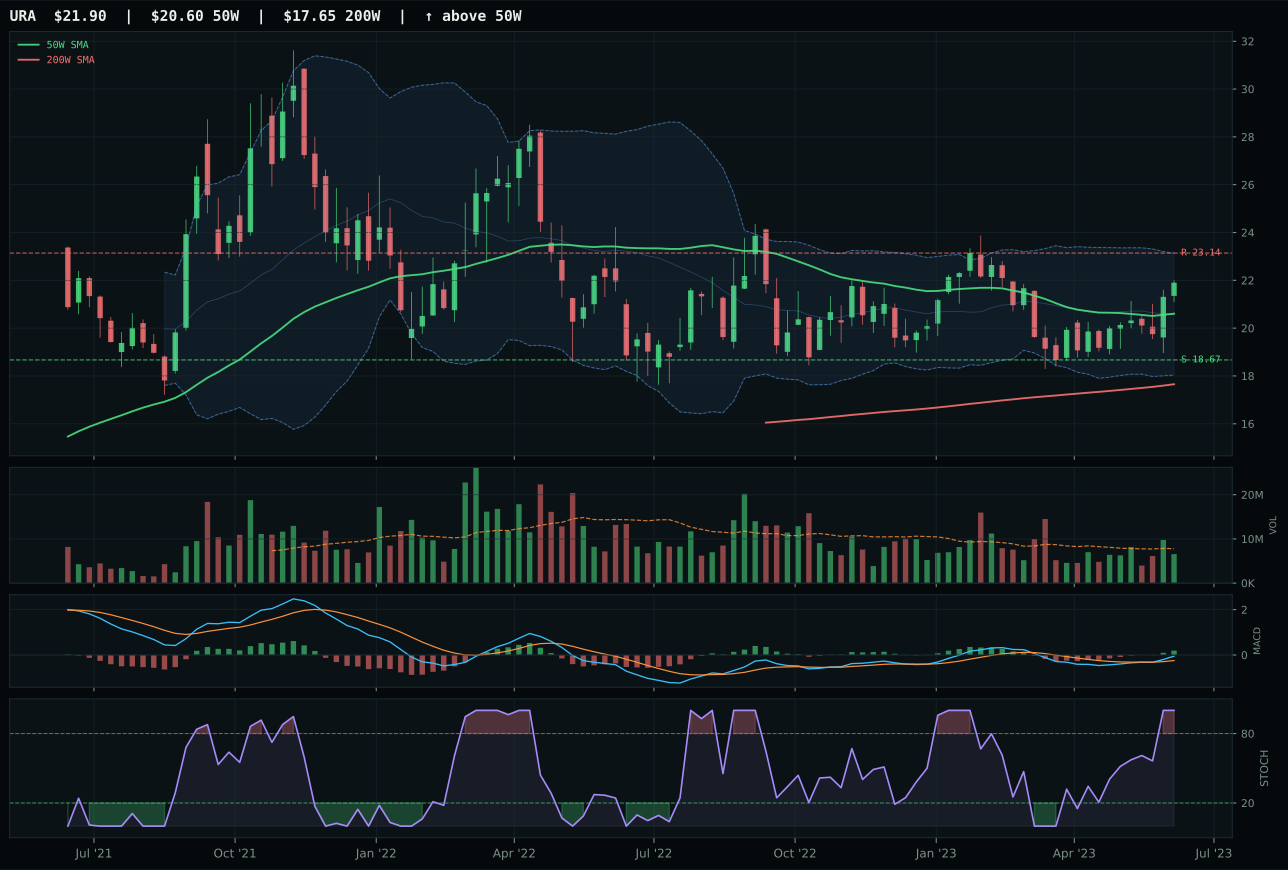
URA has a neutral structure profile with 0.2% 13-week relative strength versus SPY.
A failed hold above support would weaken the setup.
Actionable but governed by invalidation levels.
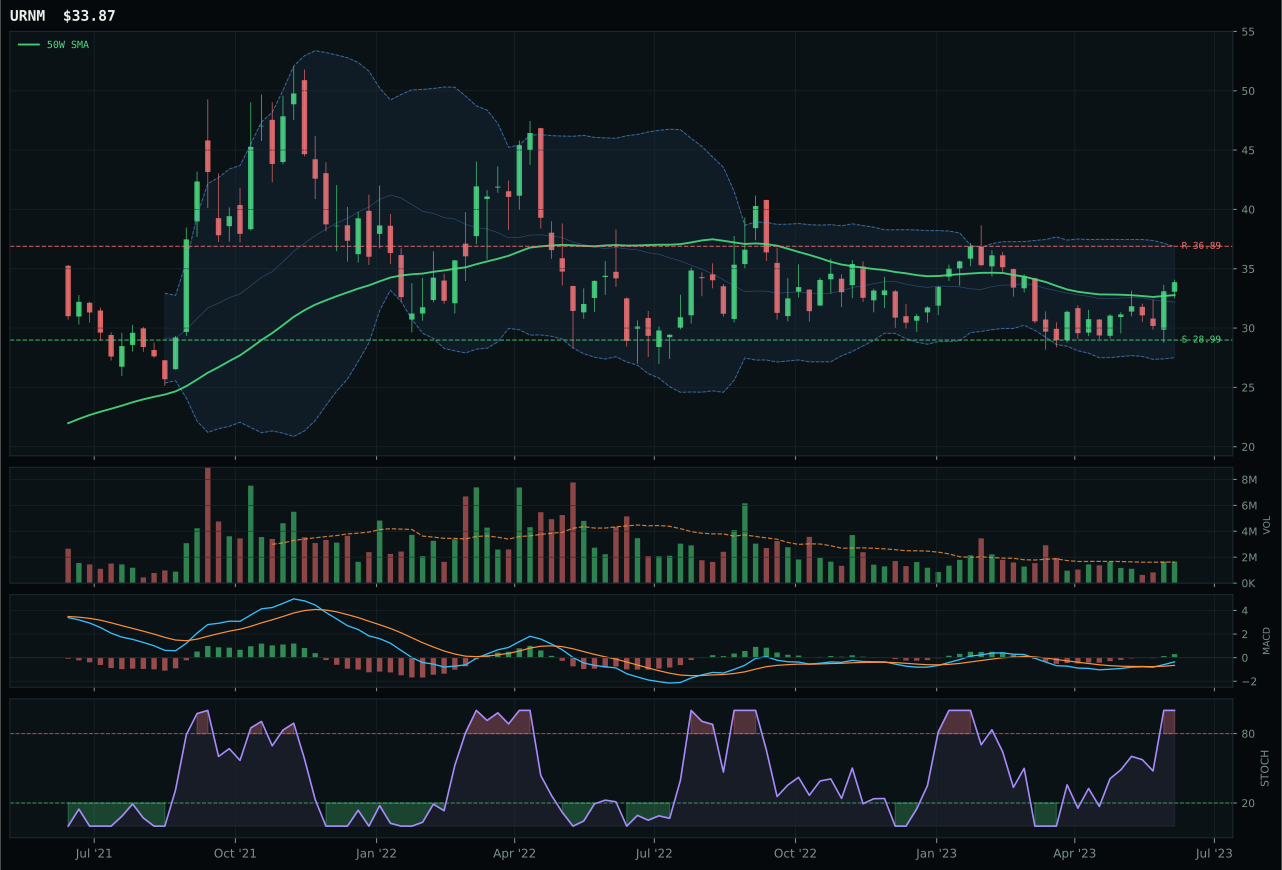
URNM has a neutral structure profile with -0.6% 13-week relative strength versus SPY.
A failed hold above support would weaken the setup.
Actionable but governed by invalidation levels.
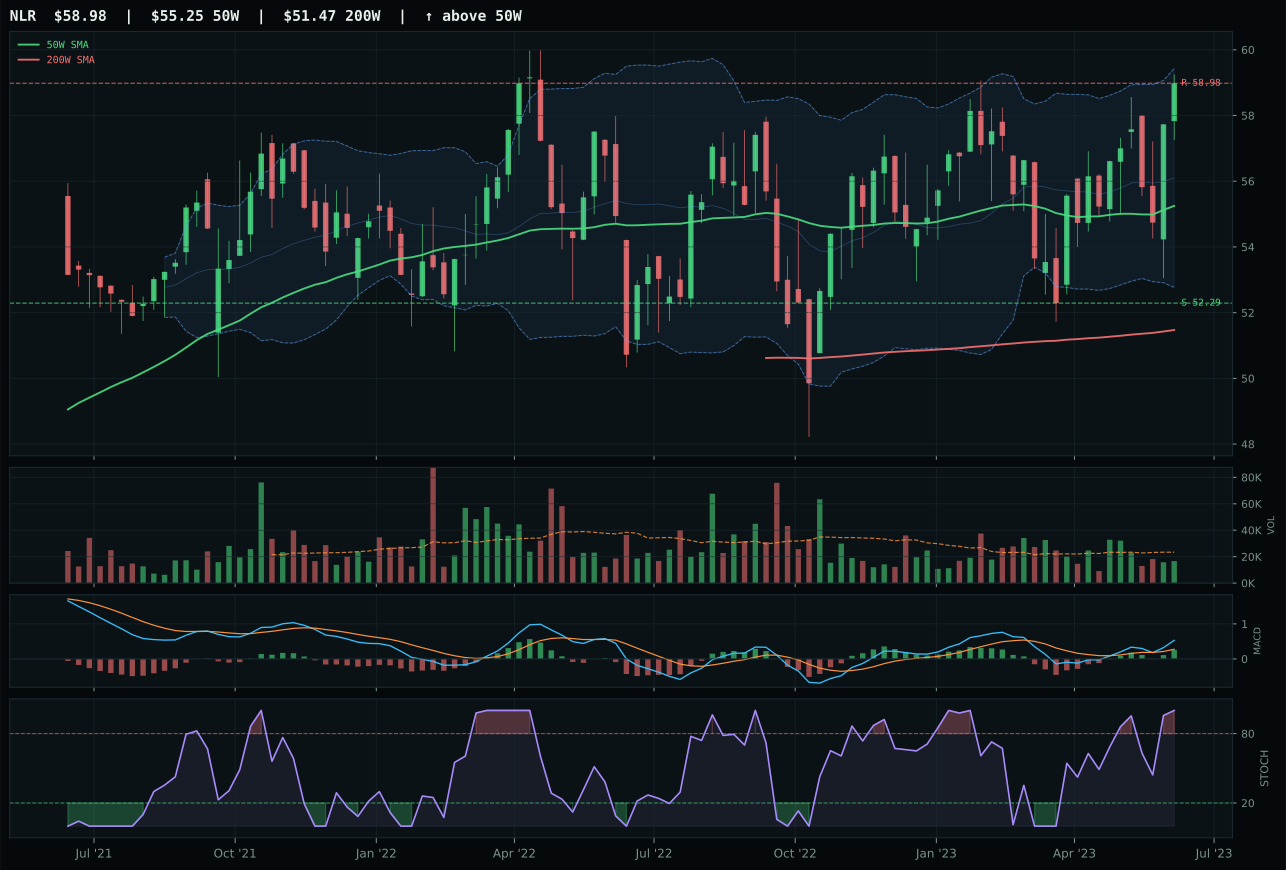
NLR has a neutral structure profile with -1.5% 13-week relative strength versus SPY.
A failed hold above support would weaken the setup.
Tracked, but not top-2 eligible because: .
URA won a close decision over URNM (70.1 vs 67.0 reasoned score) by capturing category-relative strength advantage (0.8% vs 0.0%) and slightly cleaner structure (71.6 vs 70.5). Both names show identical trend strength at 90+ and identical overbought momentum at 0.7–1.0 stochastic RSI, both displaying bullish-improving MACD with neutral volume. URA's 11.6% 13-week return matches URNM's 10.8%, and both sit near Fibonacci extension zones indicating extended entries. The margin was structure quality and the single data point of category-relative strength—URA is keeping pace with its peers while URNM lags by microscopically small amounts. In a category this tight, process voting systems reveal portfolio preference: when technicals are nearly identical, the name with better relative breadth (even if microscopically better) gets the nod.
Nuclear Energy earned 5% allocation as a real-asset diversifier with a 53.2 category score that reflects strong technical evidence (78.7) offset by neutral macro fit (50.0). The macro descriptors lack category-specific support—real asset sponsorship (+7) and AI growth sponsorship (+5) provide modest tailwinds against liquidity and credit stress (-7 and -5)—leaving the category dependent almost entirely on technical validation. URA's 87.8 momentum confirmation, 90.2 trend score, and 67.7 persistence drive the allocation, with the 11.6% thirteen-week return and neutral SPY relative strength creating a balanced expression of the nuclear thesis. The category holds because uranium scarcity and AI-driven electricity demand create a structural narrative that extends beyond this week's technical setup, yet the allocation remains at the 5% minimum because the category ranks below AI, Technology, Emerging Markets, and several commodity categories. Capital would flow toward higher-ranked categories first; Nuclear Energy persists only as long as technicals remain above trend and MACD stays bullish. A roll-over in momentum confirmation or breakdown below the 50-week would be an immediate sell signal for the 5% position.
Industrial Metals — COPX
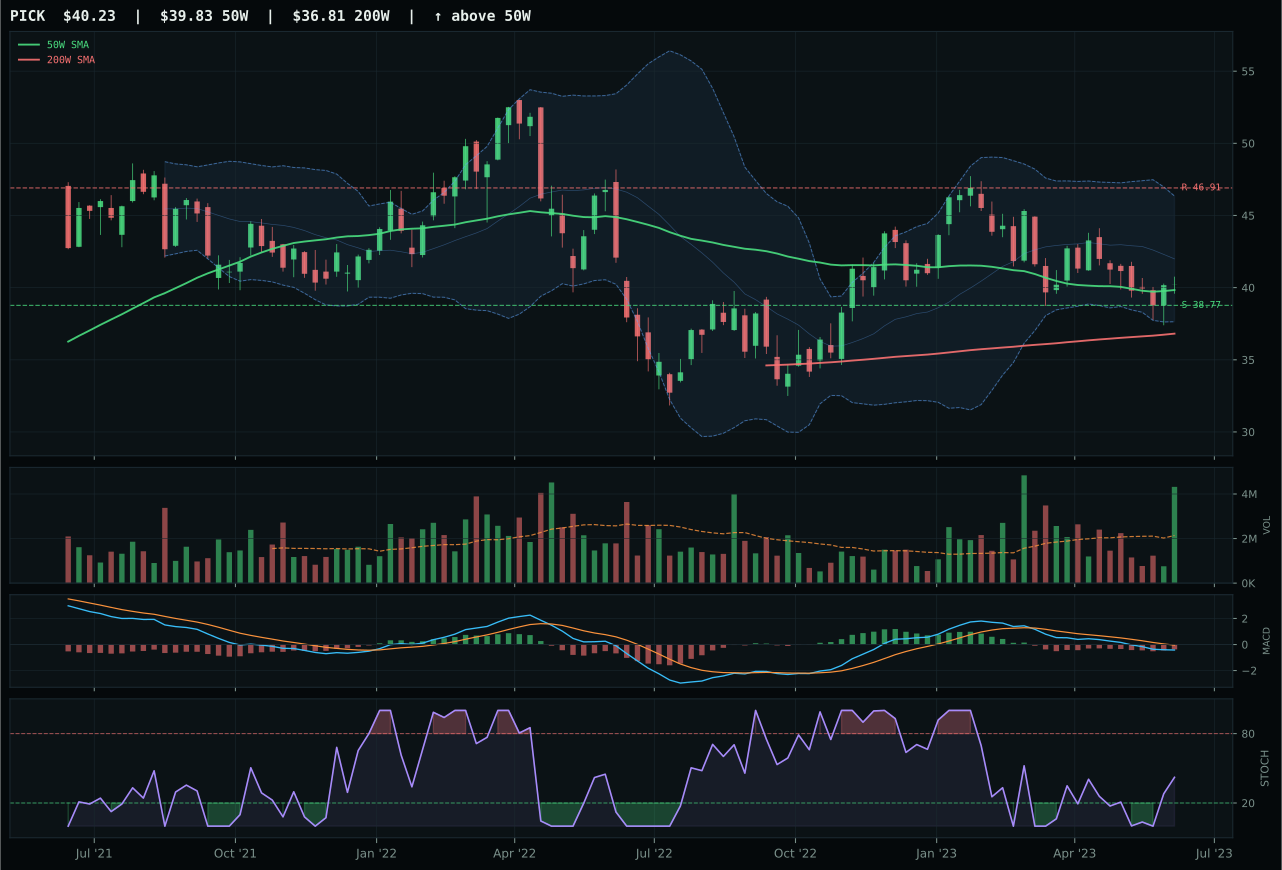
PICK has a pullback into support profile with -14.7% 13-week relative strength versus SPY.
A failed hold above support would weaken the setup.
Actionable but governed by invalidation levels.
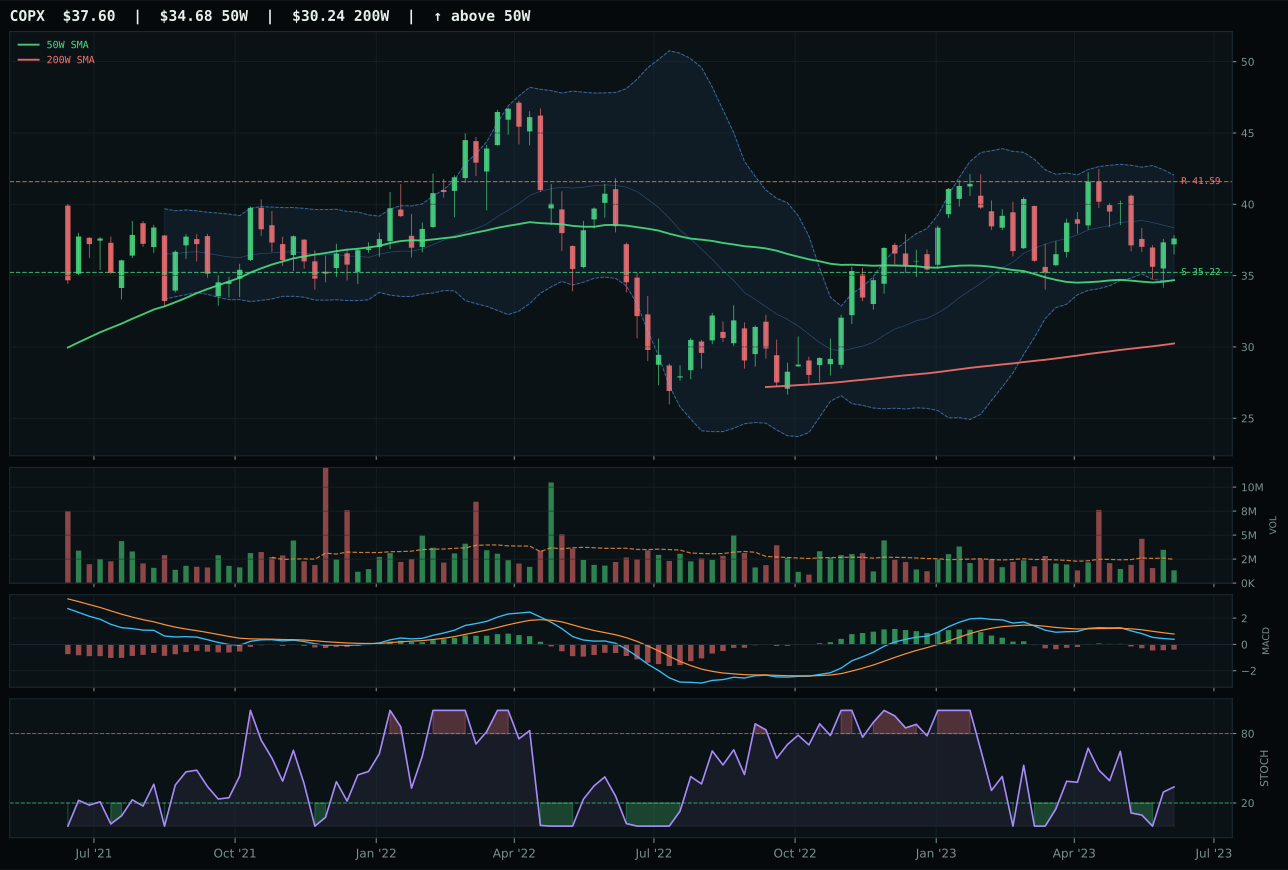
COPX has a neutral structure profile with -7.1% 13-week relative strength versus SPY.
A failed hold above support would weaken the setup.
Actionable but governed by invalidation levels.
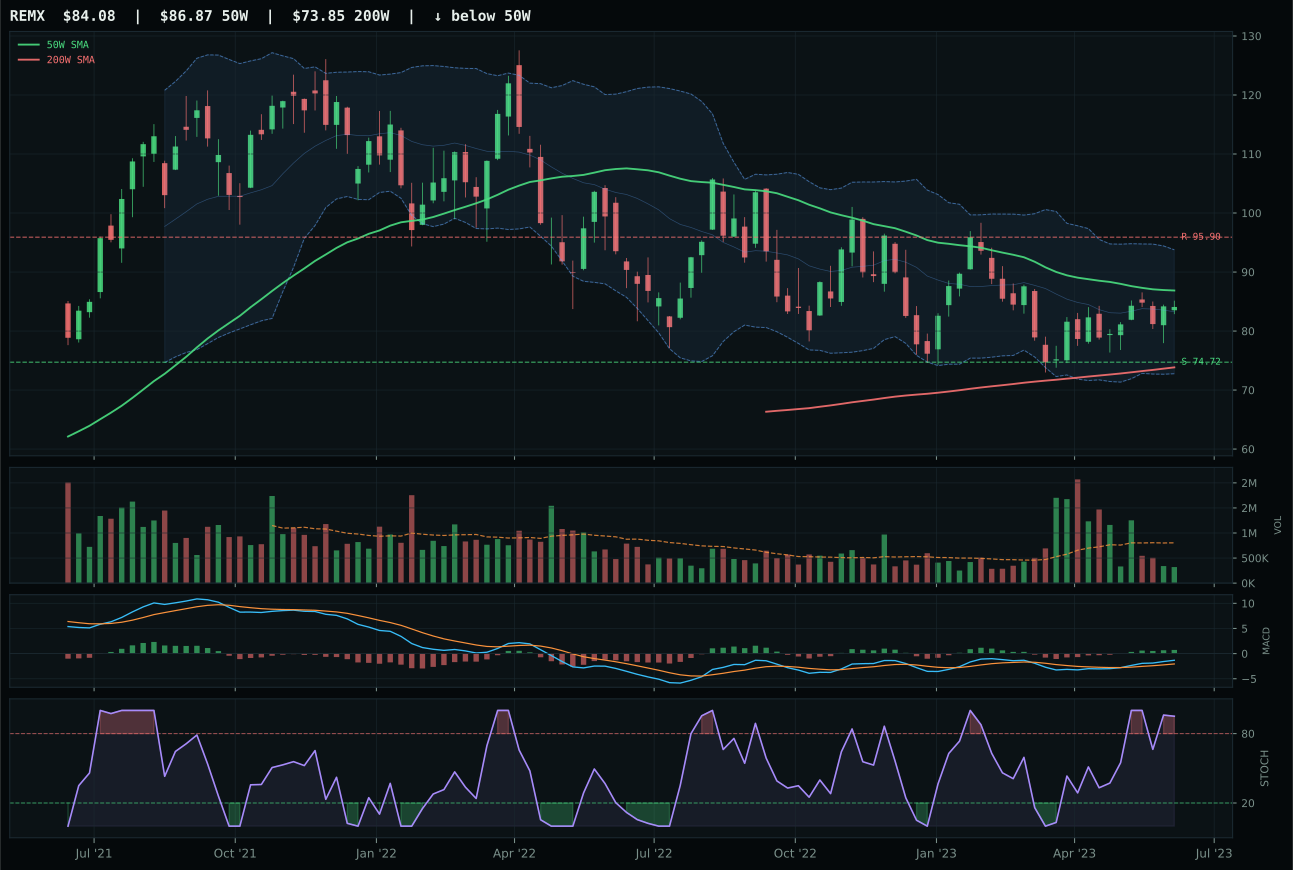
REMX has a neutral structure profile with -4.9% 13-week relative strength versus SPY.
A failed hold above support would weaken the setup.
Actionable but governed by invalidation levels.
COPX won despite being outscored technically by PICK (75.8 vs 43.2 technical evidence), because category-relative strength decisively favored COPX at 0.0% versus PICK's -7.7%. PICK sits in a pullback-into-support setup with strong volume-price confirmation (accumulation confirmed), yet its 13-week return of -3.3% and massive SPY-relative drag (-14.7%) signal that miners are not participating in any broader metals rally—the setup is clean but the buyers are gone. COPX is structurally weaker (neutral vs pullback), but its zero category-relative reading and flat 4.3% 13-week return mean it is keeping pace with category median strength, even if that median is weak. In a category about scarcity and industrial demand, relative participation matters more than absolute chart cleanliness, and COPX is the least-lagging option.
Industrial Metals secured 5% allocation on macro strength despite a 51.9 category score that reflects mixed technical evidence. The category-level macro fit of 65.0 is the highest non-AI exposure among all categories, driven by active metals scarcity (+14), commodity breadth positive (+10), and real asset sponsorship (+6) that together overcome liquidity and credit stress headwinds of -8 and -7. PICK's superior technical evidence of 75.8 versus COPX's 43.2 would normally drive allocation toward the mining-breadth exposure, yet PICK's relative weakness versus the category median pushed the representative slot to COPX. The allocation holds because the macro regime—disinflation with active commodity scarcity and positive breadth—provides a structural case for metals exposure independent of short-term technical setups. COPX's thin volume and neutral momentum are liabilities that would normally exclude it, but the portfolio's macro view on scarcity and industrial demand supports maintaining the 5% position. Capital would shift toward PICK if category-relative strength reverses and accumulation volume appears on the pullback-into-support setup; absent that, the allocation remains size-limited to a single 5% slot despite the category's macro tailwind.
Precious Metals — GLD
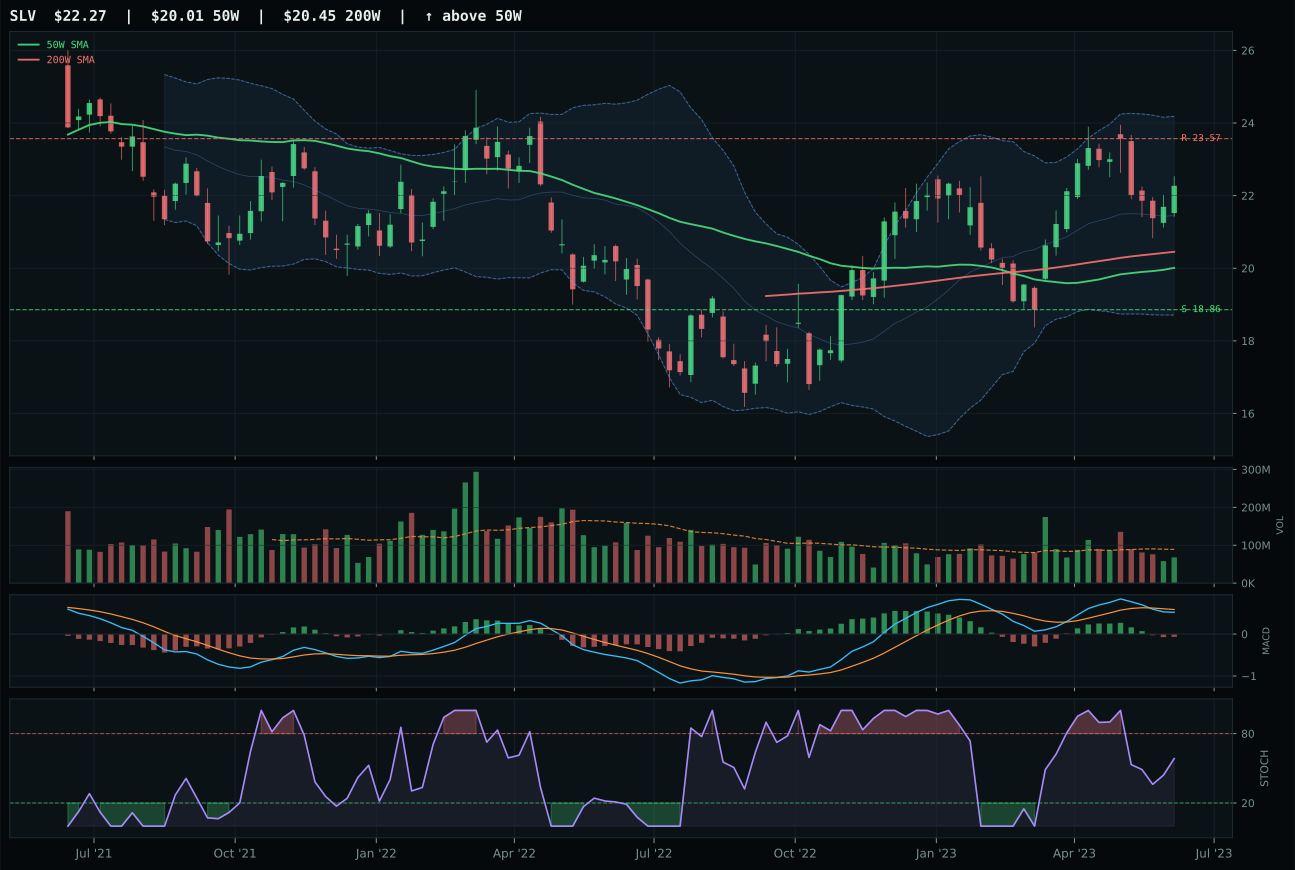
SLV has a neutral structure profile with 6.7% 13-week relative strength versus SPY.
A failed hold above support would weaken the setup.
Actionable but governed by invalidation levels.
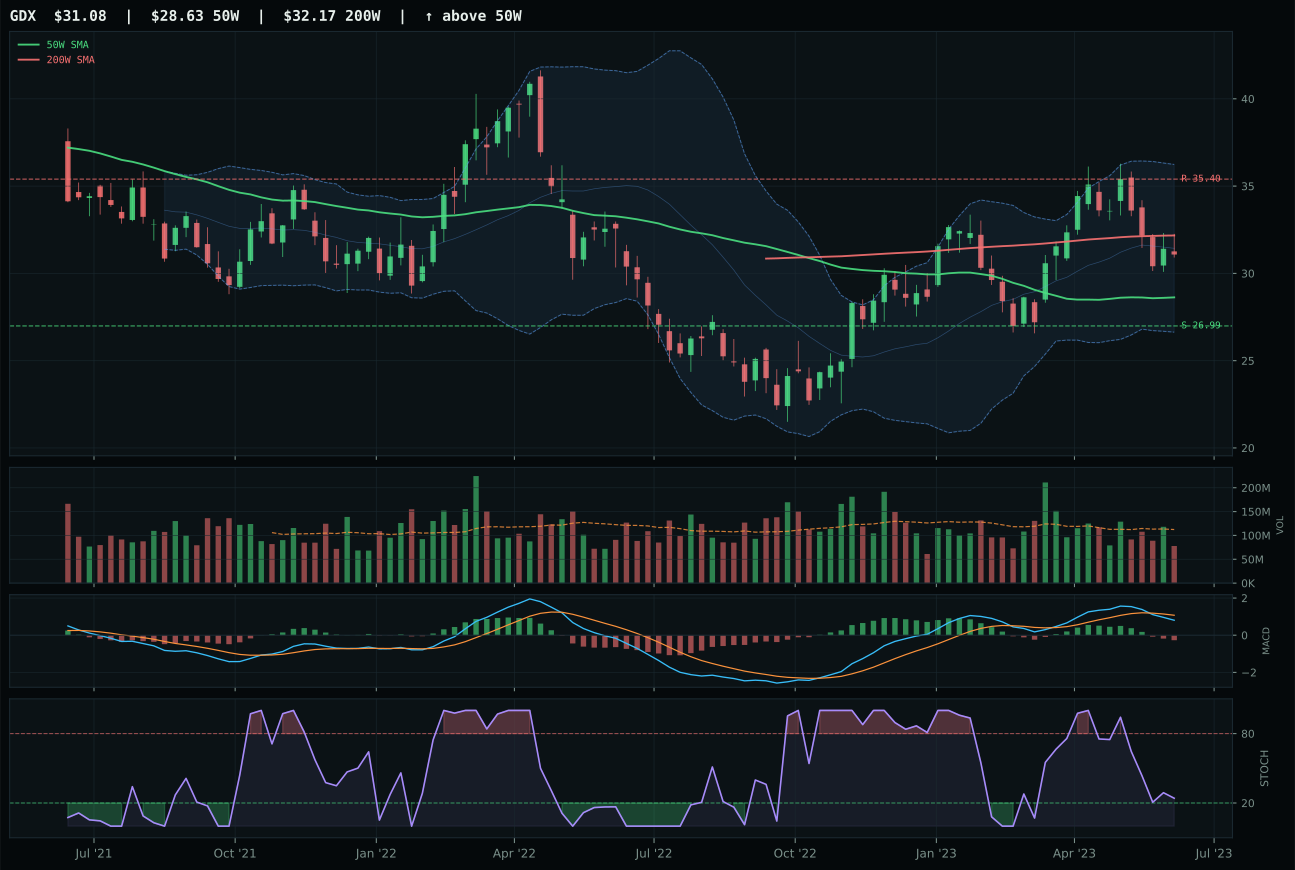
GDX has a neutral structure profile with 2.9% 13-week relative strength versus SPY.
A failed hold above support would weaken the setup.
Actionable but governed by invalidation levels.
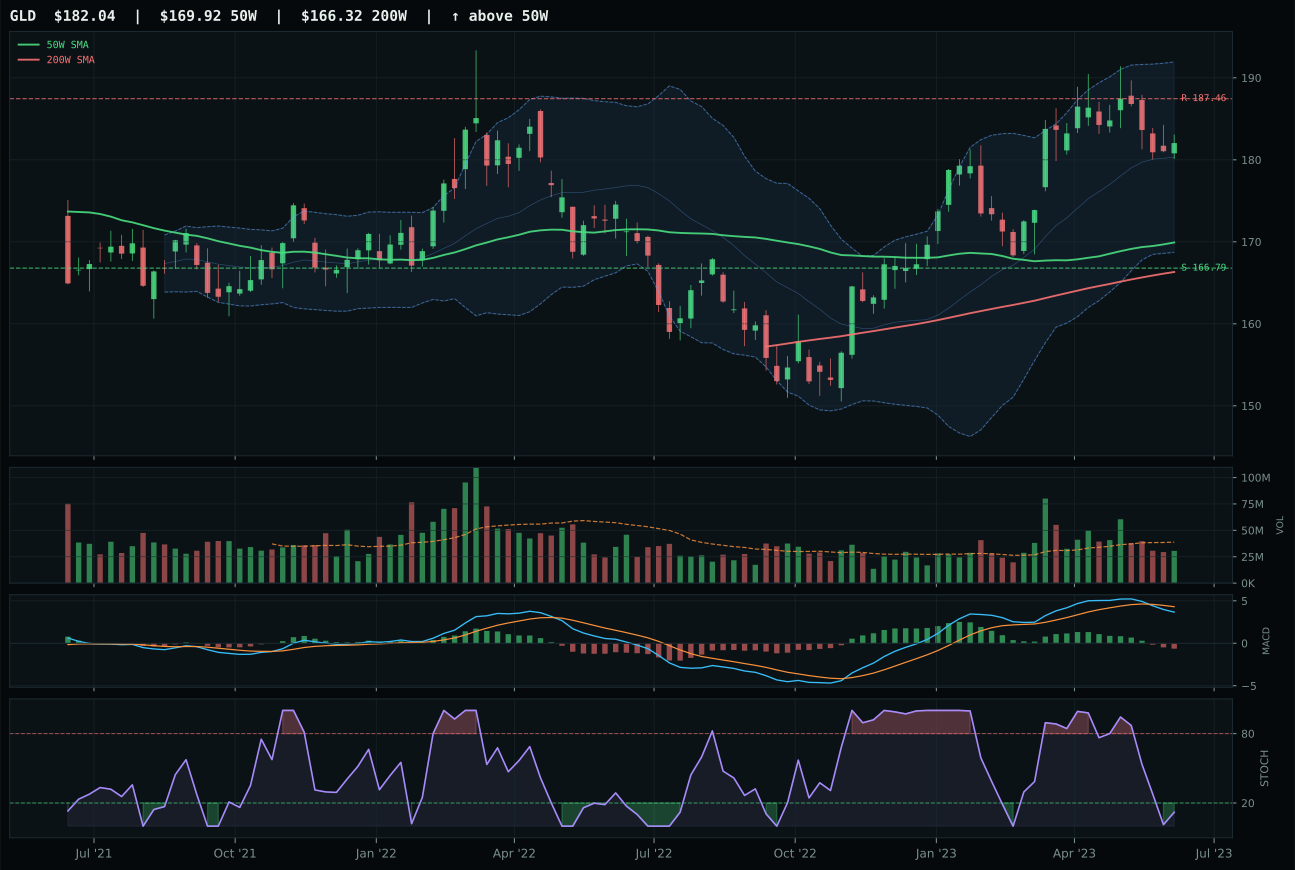
GLD has a neutral structure profile with -6.7% 13-week relative strength versus SPY.
A failed hold above support would weaken the setup.
Actionable but governed by invalidation levels.
GLD won a technical beauty contest where its competitor, SLV, had far superior mechanics. SLV's 18.1% 13-week return and 6.7% SPY-relative strength dwarf GLD's 4.7% and -6.7% respectively, and SLV's volume-price evidence shows neutral participation versus GLD's neutral skepticism. Yet GLD won because the reasoning layer weighted macro fit at 54 versus SLV's 52—a two-point advantage flowing from disinflation pressure being particularly supportive of gold-as-hedge narratives. Within an overbought-momentum setup where both sit at Fibonacci 0.236 extension zones, GLD's oversold stochastic (0.12) offered a marginally cleaner pullback structure than SLV's rising mid-zone reading. This is a category where gold's clean monetary narrative trumps silver's industrial beta complexity, even as the numbers suggest the opposite directionally.
Precious Metals earned 5% allocation as a diversifier, ranking lower in the opportunity set than AI or Technology but higher than Agriculture or Traditional Energy. The category score of 47.4 reflects strong macro support (disinflation pressure +8, disinflation descriptor +6) offsetting weak technical evidence of only 27.2, a tell-tale sign that this category is held for macro hedge value rather than technical conviction. Gold's oversold RSI (0.12) and position near an upper retracement zone suggest mean-reversion possibility, and the 50.0 category-level macro fit combines with 62% technical weighting to create a defensible case for small-position exposure. SLV's technical superiority (61.1 technical evidence) positions it as a higher-conviction alternative within the category, yet the representative assignment to GLD reflects the category reasoner's preference for more conservative, less leveraged exposure in a macro-uncertain environment. The 5% slot holds because disinflation regimes typically favor gold as a monetary hedge, even when technicals are weak; the allocation would grow only if gold breaks above resistance on accumulation volume and rebuilds four-week and thirteen-week momentum confirmation.
Defense & Aerospace — XAR
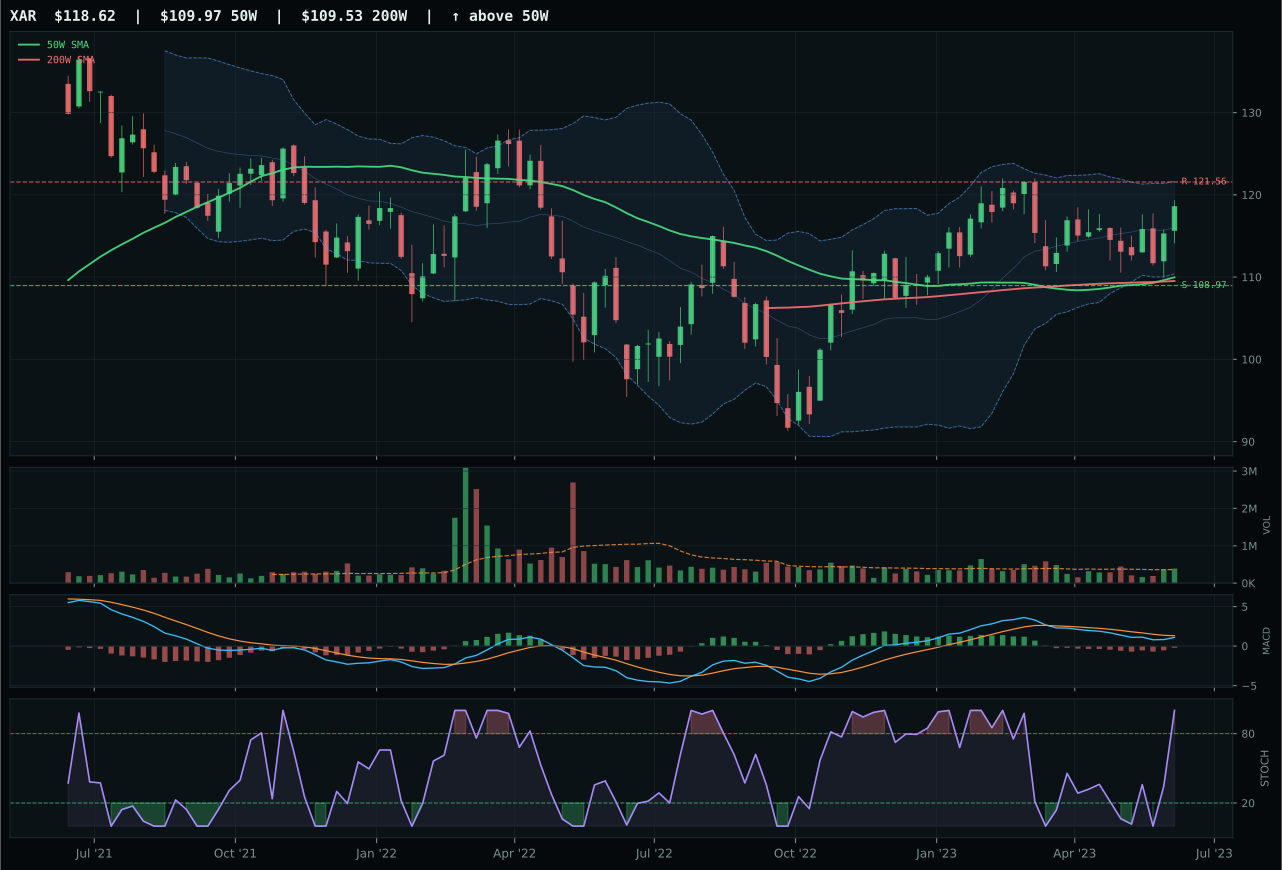
XAR has a neutral structure profile with -8.6% 13-week relative strength versus SPY.
A failed hold above support would weaken the setup.
Actionable but governed by invalidation levels.
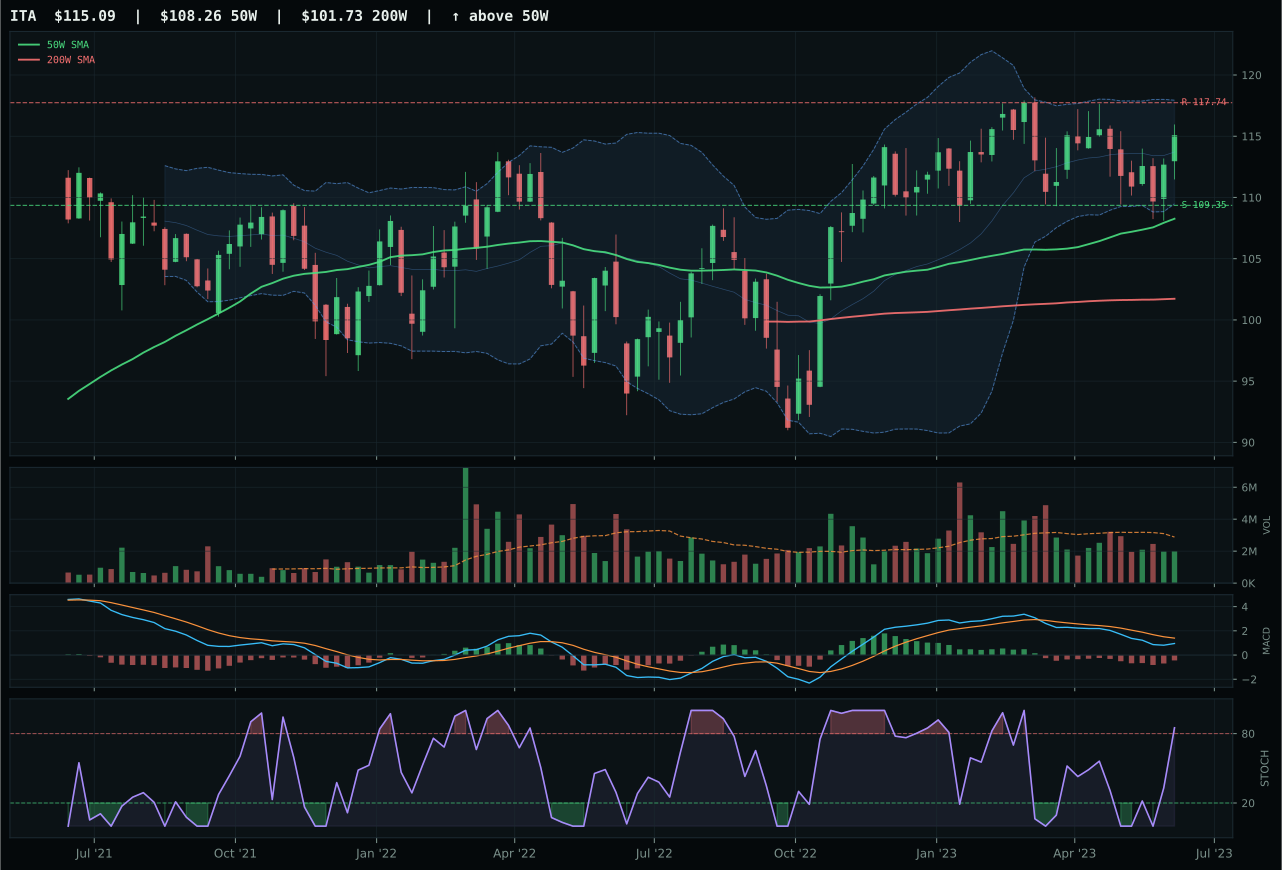
ITA has a neutral structure profile with -9.6% 13-week relative strength versus SPY.
A failed hold above support would weaken the setup.
Actionable but governed by invalidation levels.
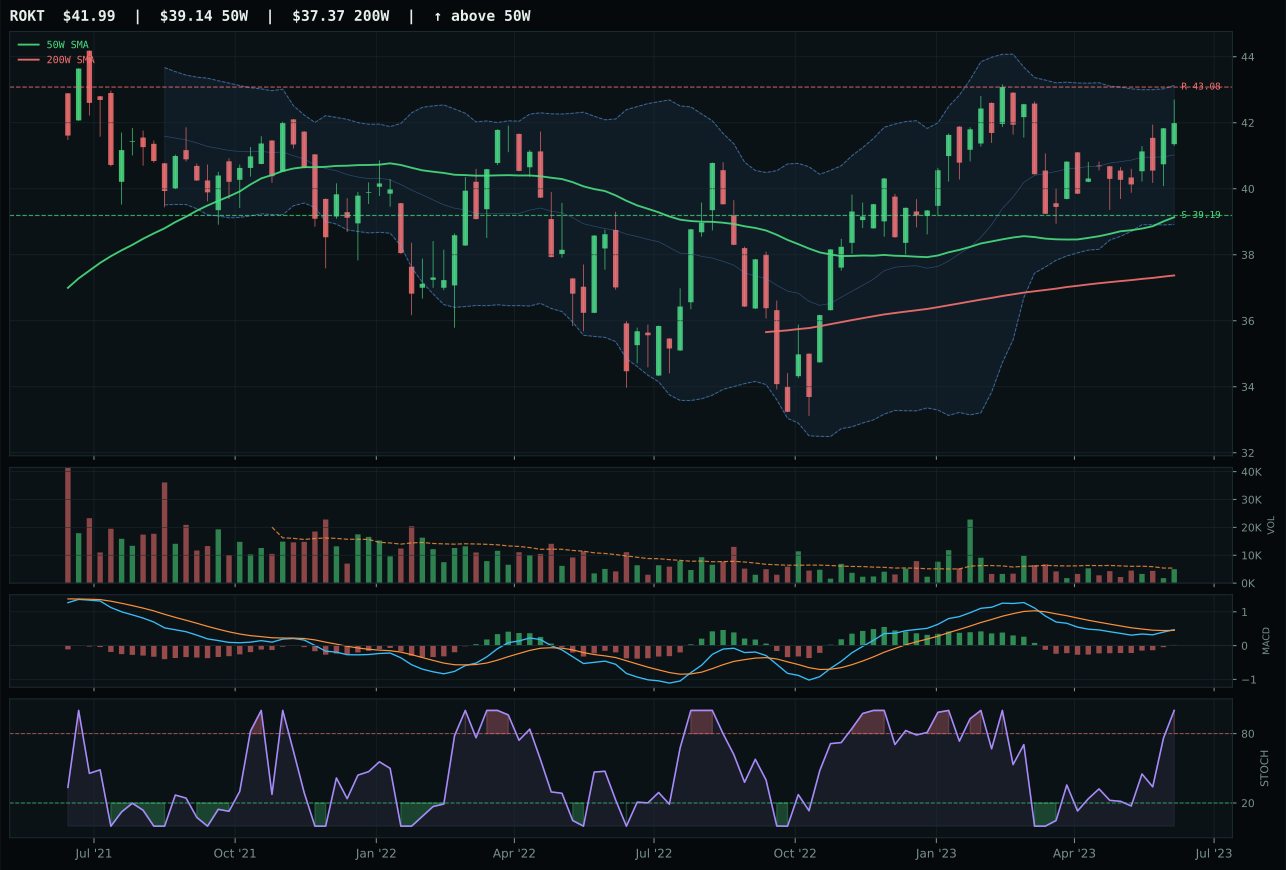
ROKT has a neutral structure profile with -7.6% 13-week relative strength versus SPY.
A failed hold above support would weaken the setup.
Tracked, but not top-2 eligible because: .
XAR won a slow-motion category where momentum has stalled but base-building is underway. Price sits 7.9% above the 50-week with MACD bearish but improving and stochastic RSI overbought—a setup that screams timing reset rather than fresh bullish impulse. XAR's 2.8% 13-week return and -8.6% SPY-relative performance are dismal on their face, but within a category where all three names are negative, XAR's neutral structure and superior timing score (75 vs 75 for ITA but with cleaner structure) made it the least bad choice. ITA's thin participation volume and weaker structure (72.7 vs 74.1) confirmed that buyers have genuinely walked away. The category-relative strength tie at 0.0% means XAR is neither leading nor lagging its peers—it is simply the most neutral-to-clean chart when momentum has fled entirely.
Defense & Aerospace earned only its 5% baseline allocation and ranks 9th or 10th in the opportunity set, excluded from meaningful exposure despite technical eligibility. The category score of 46.4 reflects a 59.3 technical composite dragged down by a 50.0 macro fit that amounts to neutral descriptor positioning—no specific macro profile supports or penalizes aerospace exposure in the current disinflation regime. The 3/2/1 basket of XAR, ITA, and ROKT averages 53.7 before category reasoner penalties for poor persistence, weak momentum confirmation, and failed volume-price sponsorship. Credit stress and liquidity stress headwinds combine for a -7 macro hit, and the category's -8.6% SPY relative strength over thirteen weeks confirms that capital is actively rotating away from defense. For allocation to improve, XAR and ITA would need to break above resistance with accumulation volume, rebuild thirteen-week relative strength toward flat or positive, and show MACD confirmation that the coil is resolving higher. Until then, this is a low-conviction slot held only to maintain diversification.
Utilities & Infrastructure — PAVE
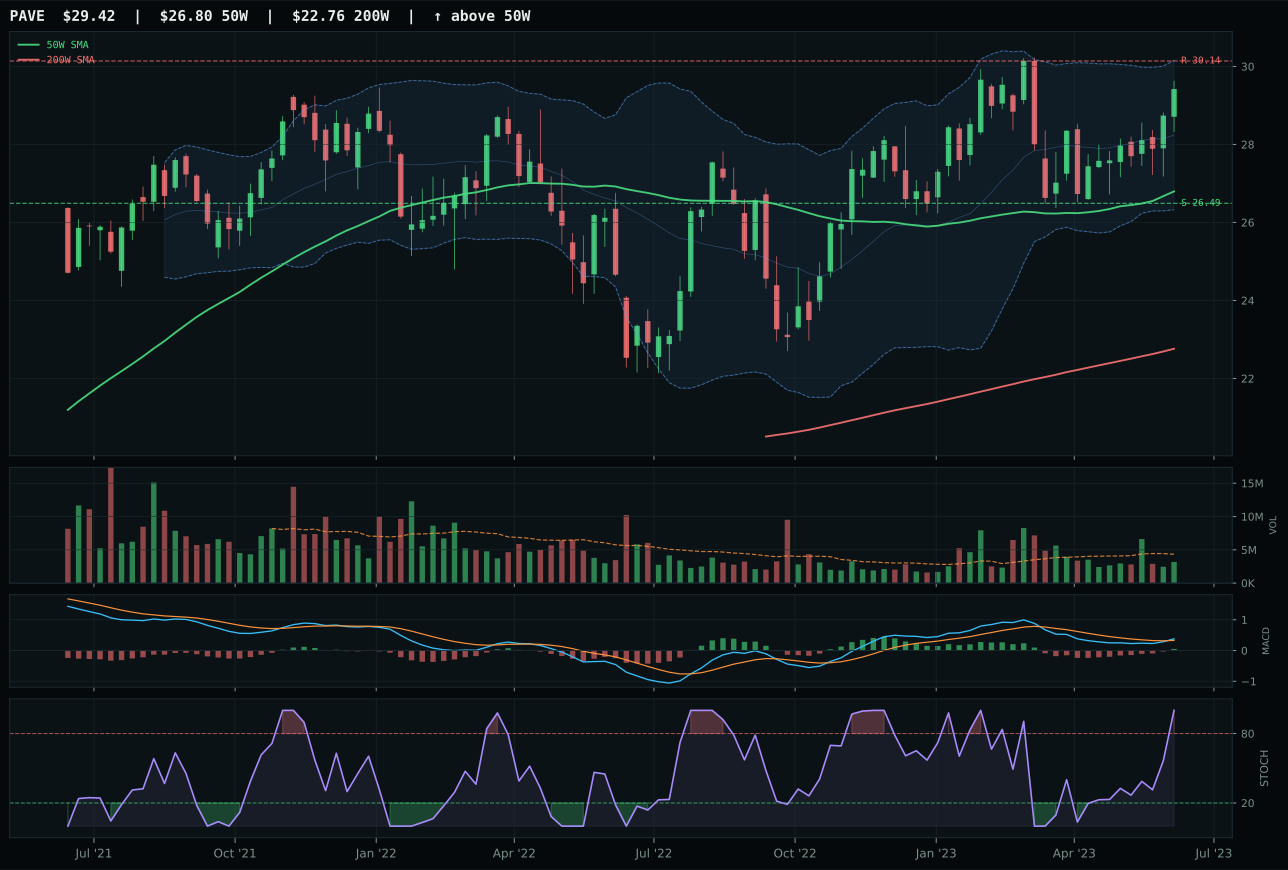
PAVE has a neutral structure profile with -6.3% 13-week relative strength versus SPY.
A failed hold above support would weaken the setup.
Actionable but governed by invalidation levels.
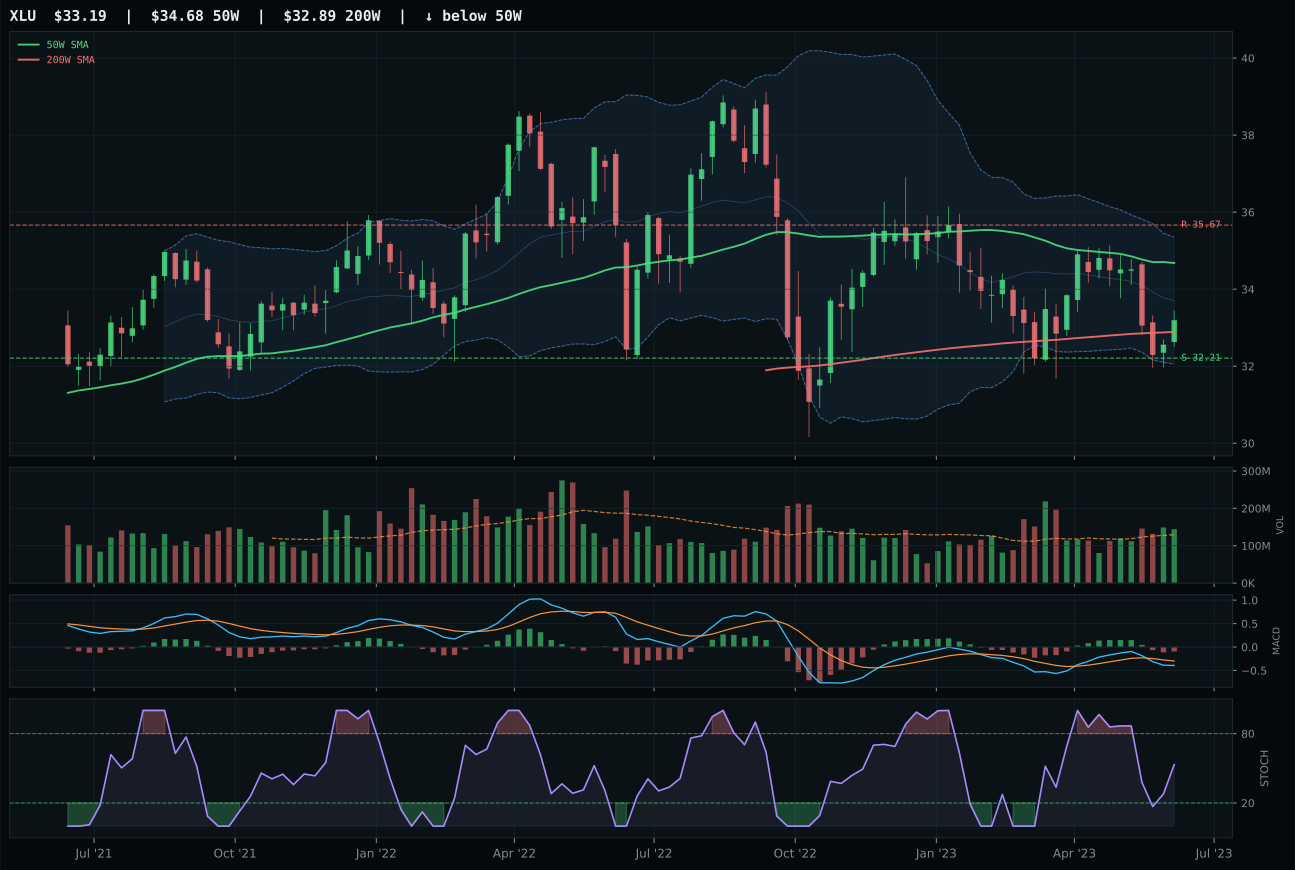
XLU has a pullback into support profile with -8.3% 13-week relative strength versus SPY.
A failed hold above support would weaken the setup.
Actionable but governed by invalidation levels.
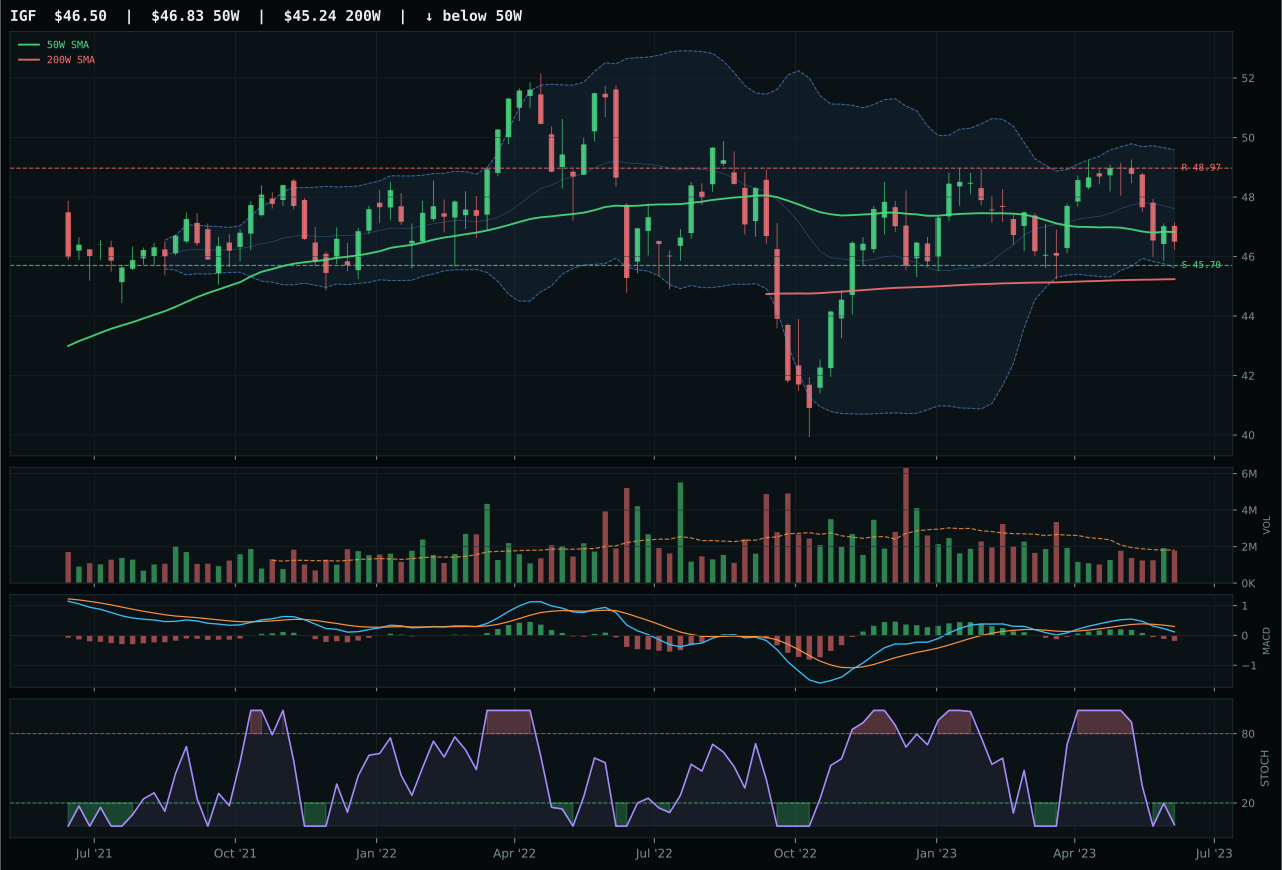
IGF has a pullback into support profile with -10.7% 13-week relative strength versus SPY.
A failed hold above support would weaken the setup.
Actionable but governed by invalidation levels.
PAVE won decisively by capturing superior trend strength (90.5% vs 34% for XLU) and MACD confirmation (bullish and improving versus XLU's bearish/weakening). Both sit at identical 75% timing scores with price at near 52-week highs and extension zones, but PAVE's bullish momentum versus XLU's declining momentum tells the full story: infrastructure capex and demand for PAVE's holdings are genuine, while utility regulation and defensive posture in XLU are trapped in older price action. XLU's 94% risk-reward score (huge downside buffer to support) would normally be attractive, but that metric only matters if there is a reason to buy—PAVE's 65% momentum confirmation versus XLU's 22% proves institutional money is flowing into infrastructure, not utilities. Category-relative strength favors PAVE at 2.0% versus XLU's 0.0%, another data point confirming sector selection is working.
Utilities & Infrastructure earned 5% allocation on reasonable macro support and strong PAVE technicals, with a 44.9 category score that masks the poor composition of its representative. Category-level macro fit of 62.0 reflects disinflation help (+7), transition/mixed regime support (+4), and disinflation pressure (+6) offsetting modest liquidity and risk-appetite headwinds. PAVE's 63.6 technical evidence drives the allocation despite thin volume participation (0.73x), a structural weakness that limits conviction. The category ranks below AI, Technology, Emerging Markets, and Industrial Metals; allocation persists as a capex and infrastructure bet in a disinflationary regime where real asset returns and government spending support domestic cyclical recovery. XLU's defensive setup with 94/100 risk-reward represents a fallback option if macro stress emerges, yet current allocation favors PAVE's growth exposure over XLU's protection. The 5% position would require either volume deterioration in PAVE or a sharp spike in credit stress (moving from active to severely stressed) to rotate toward XLU. Without such a macro shift, PAVE holds as the portfolio's infrastructure and capex duration play in a regime favoring real assets and domestic cyclical economic activity.
Traditional Energy — XLE
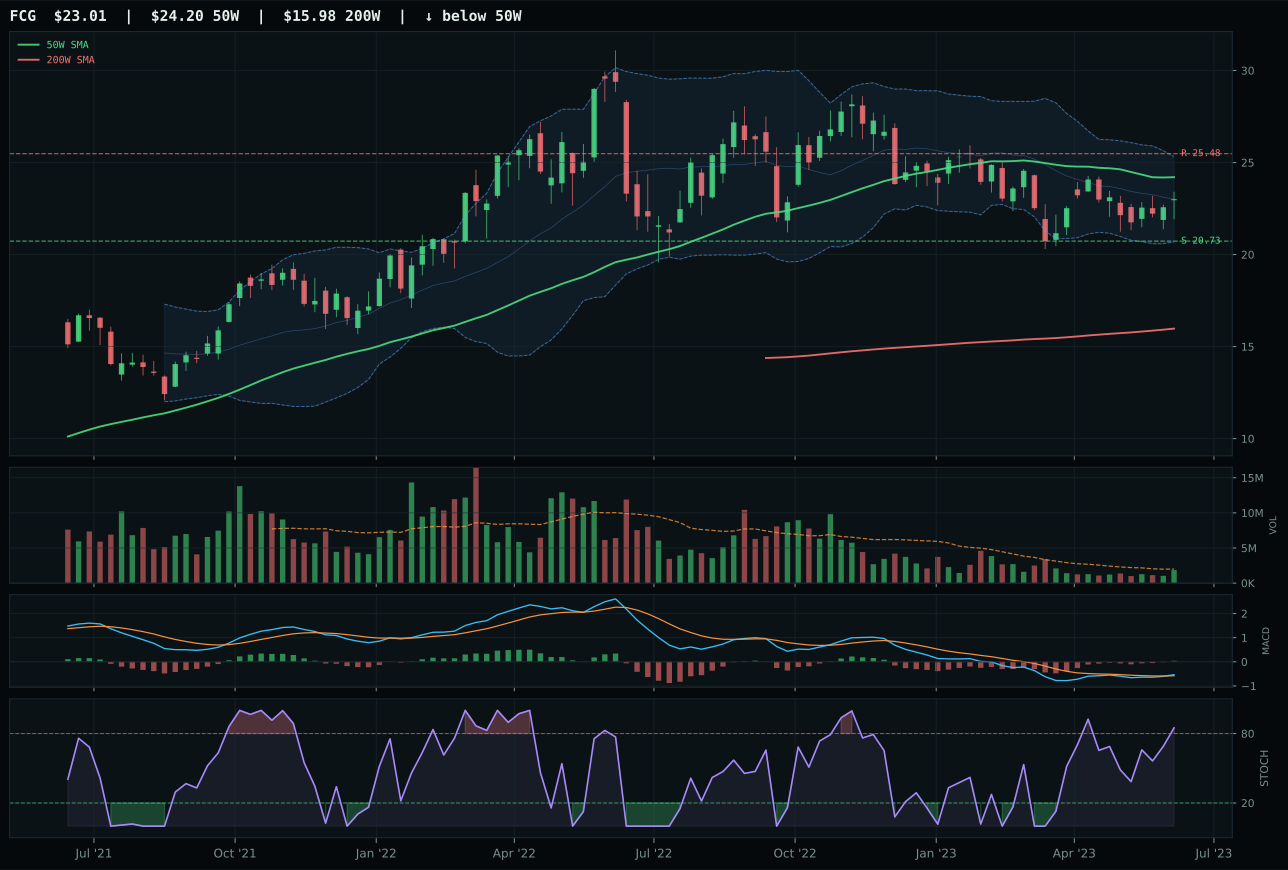
FCG has a neutral structure profile with -9.2% 13-week relative strength versus SPY.
A failed hold above support would weaken the setup.
Actionable but governed by invalidation levels.
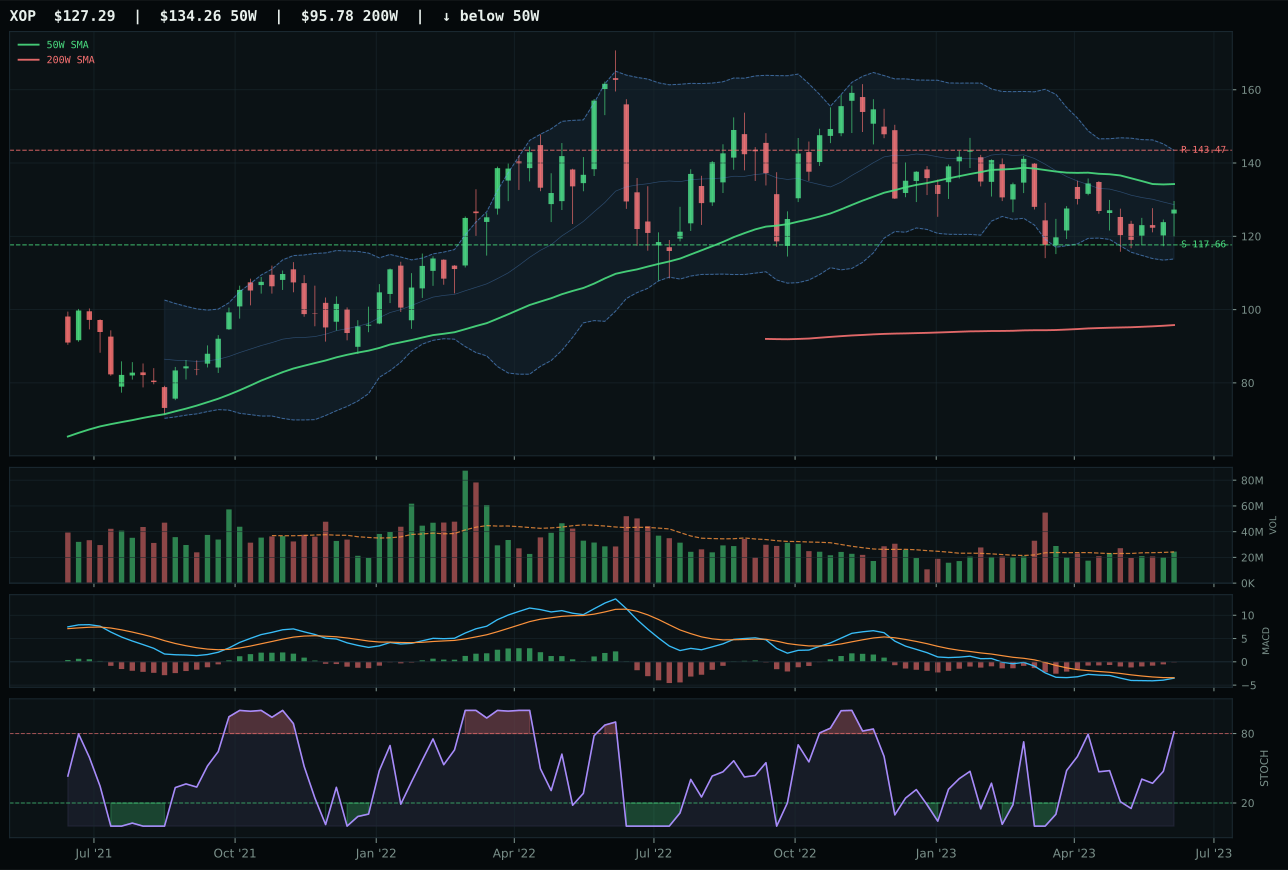
XOP has a neutral structure profile with -12.0% 13-week relative strength versus SPY.
A failed hold above support would weaken the setup.
Actionable but governed by invalidation levels.
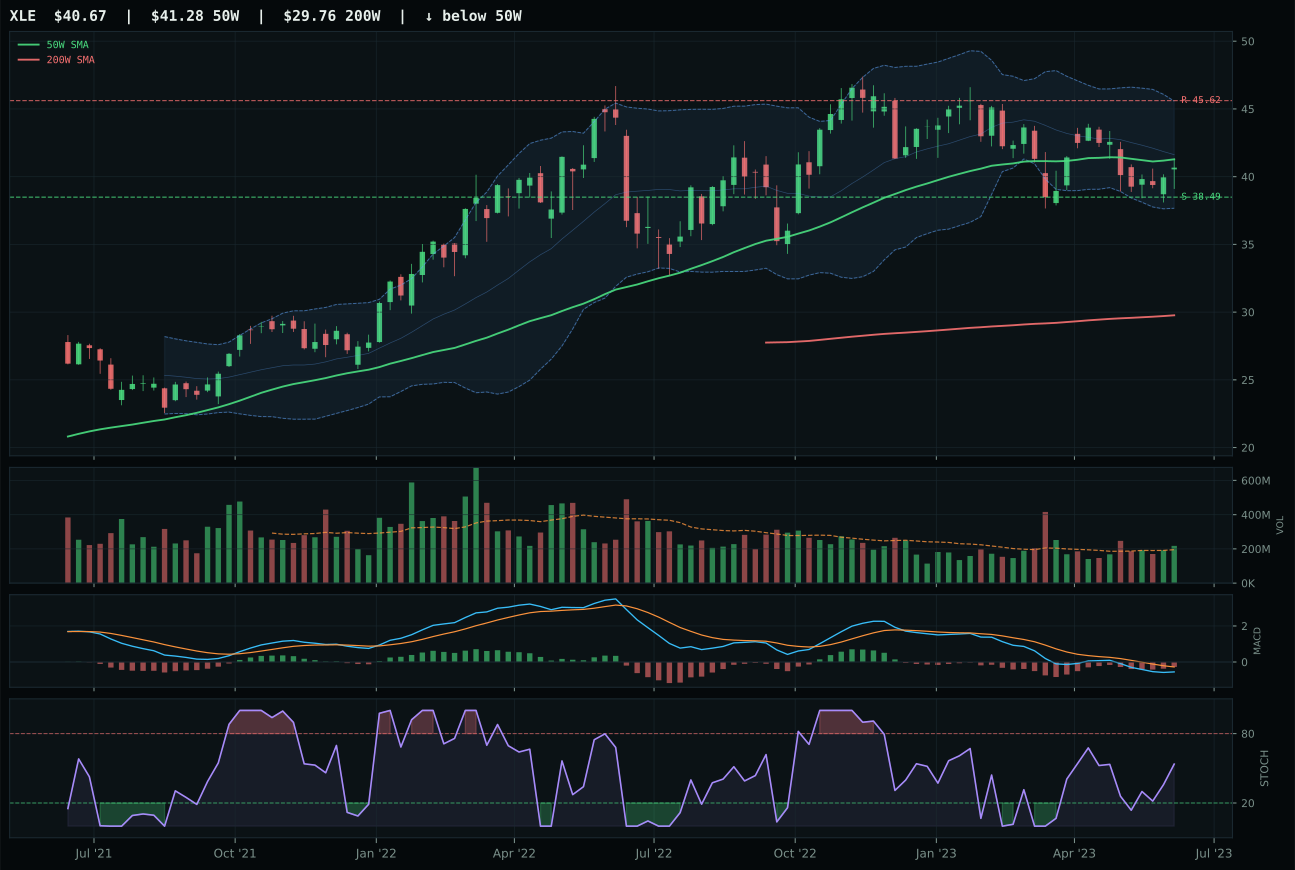
XLE has a compression near 50W profile with -13.0% 13-week relative strength versus SPY.
A failed hold above support would weaken the setup.
Actionable but governed by invalidation levels.
XLE won a race to the bottom where price discipline mattered more than momentum. XLE sits at -1.5% from the 50-week in a pure compression setup near the Fibonacci 0.500 midpoint—neither extended nor broken, just waiting. XLE's stochastic RSI is rising mid-zone (0.54) and volume is above-average participation (1.12x 20-week), meaning buyers are methodically accumulating despite a -1.6% 13-week return that screams deflation risk. FCG, the technical superior at 71.3 evidence score, sits in neutral structure with overbought stochastic momentum and neutral volume—a setup that looks bullish until you realize the momentum is rolling over and no fresh buying is visible. XLE's timing score of 100 (price at exact 50W decision point) beats FCG's 97, and when both fundamentals are terrible, process matters: XLE's compression near support offers defined risk, whereas FCG's overbought rollover is offer a whipsaw.
Traditional Energy earned zero allocation this week, ranking 9th or 10th and excluded entirely as capital rotates away from fossil-fuel exposure. The category score of 13.0 is the second-lowest, driven by a macro regime actively hostile to energy: disinflation hurts this category (-10), disinflation pressure is active (-10), and credit stress (-7) plus liquidity stress (-7) combine for -34 points of macro headwind. Technical evidence across the 3/2/1 basket (FCG, XOP, XLE) averaged 60.4 reasoned proof, but the category-level macro fit of only 23.0 dragged the final score below viability. XLE's superior timing and risk-reward setup would normally merit a slot, yet the macro regime—a disinflationary environment with no catalyst for energy demand acceleration—makes any allocation to fossil fuels a bet against portfolio positioning. Real asset sponsorship (+7) provides the only macro support, insufficient to offset the structural headwinds. For allocation to return, energy would need either a breach above resistance on institutional accumulation volume or a macro regime shift toward inflation that lifts disinflation pressure and credit stress descriptors. Until then, the category is simply not aligned with the current macro and risk-appetite environment.
Agriculture & Livestock — WEAT
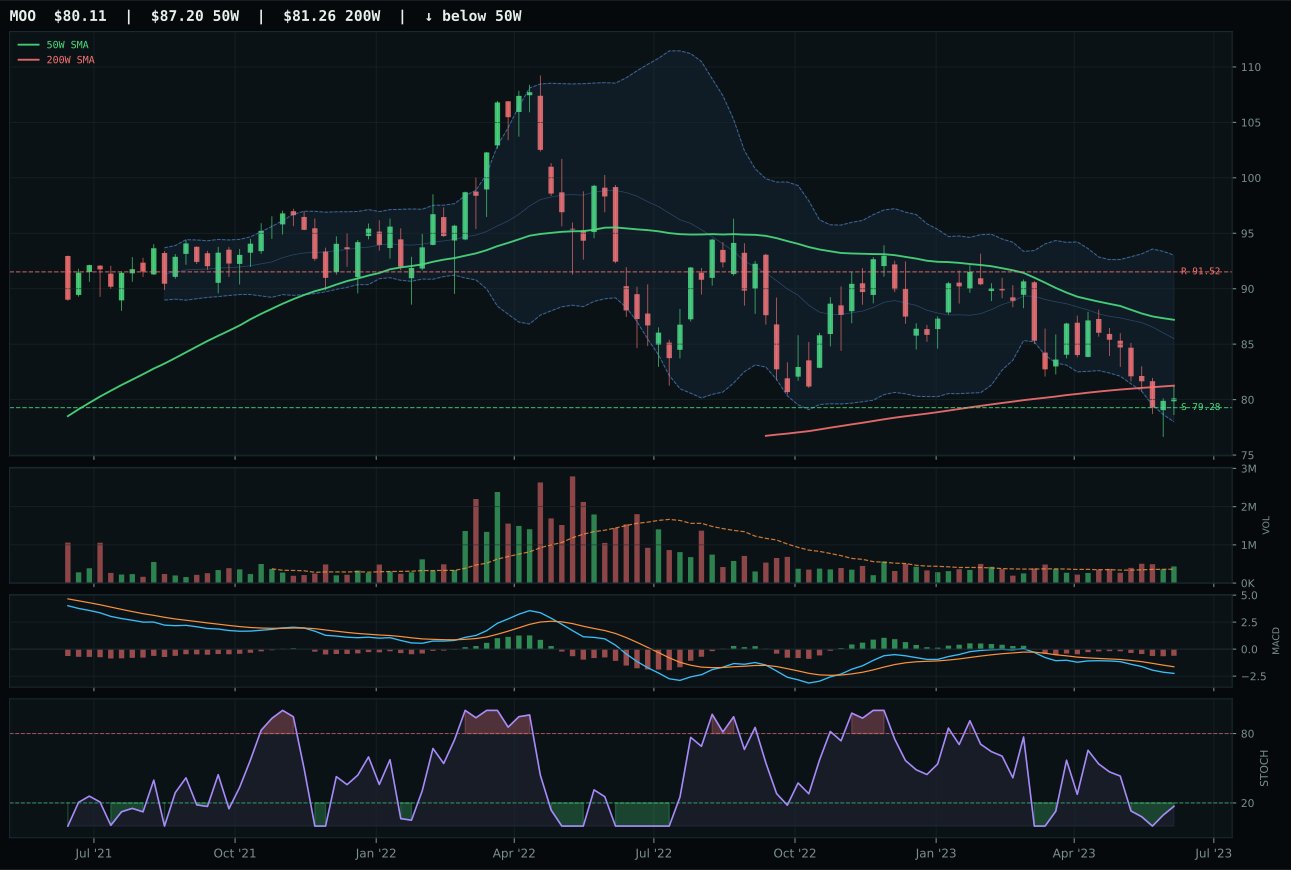
MOO has a pullback into support profile with -17.5% 13-week relative strength versus SPY.
A failed hold above support would weaken the setup.
Actionable but governed by invalidation levels.
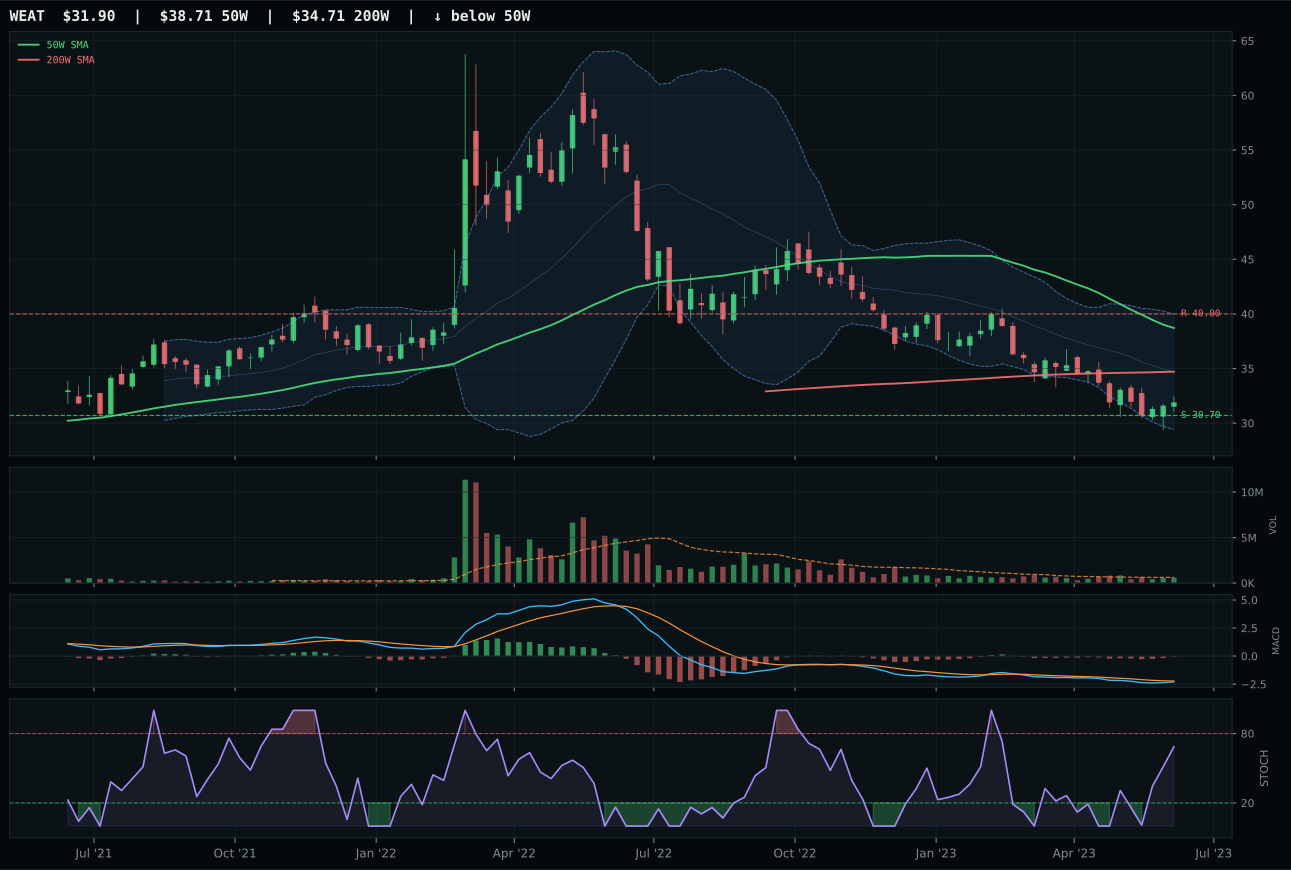
WEAT has a pullback into support profile with -19.3% 13-week relative strength versus SPY.
A failed hold above support would weaken the setup.
Actionable but governed by invalidation levels.
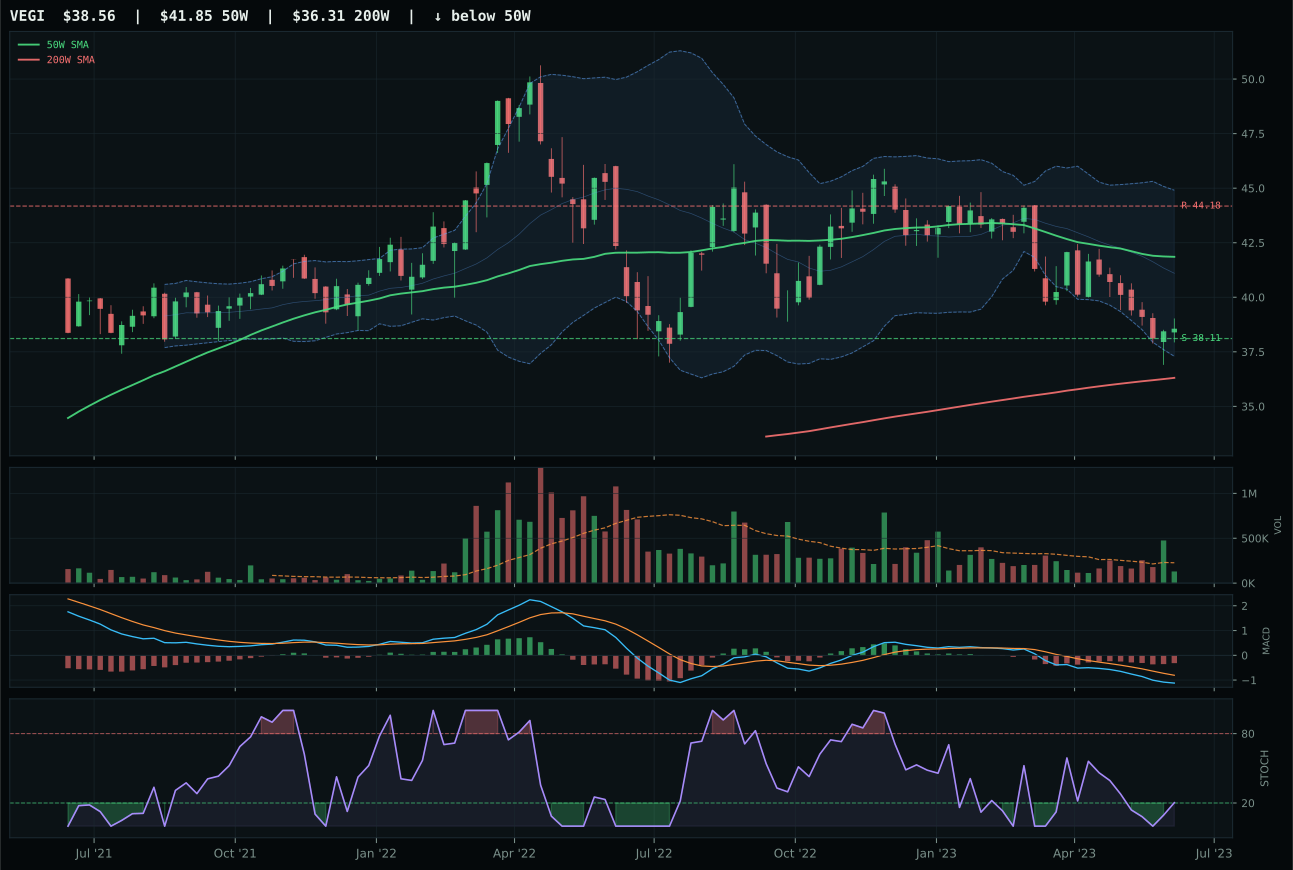
VEGI has a pullback into support profile with -18.0% 13-week relative strength versus SPY.
A failed hold above support would weaken the setup.
Tracked, but not top-2 eligible because: .
WEAT won by a fraction: 31.2 reasoned score versus MOO's 31.6, yet the final category score cratered to 12.0 because the entire basket is technically broken. WEAT's edge came from a marginally better MACD signal (bearish but improving versus MOO's bearish/weakening) and a longer pullback into support that provides cleaner invalidation logic. Both names are down sharply over 13 weeks (WEAT -7.9%, MOO -6.1%) and underwater on relative strength (WEAT -19.3% vs SPY, MOO -17.5%). The real story is that WEAT's stochastic RSI sits at rising mid-zone (0.69) while MOO is oversold turning up—and in dying markets, the one with slightly less oversold pressure wins by default because it hasn't overextended the downside energy yet. This is not a vote of confidence; it is a recognition that support at 30.70 is the only actionable level left.
Agriculture & Livestock earned zero allocation this week, ranking 9th or 10th and excluded entirely from the portfolio. The category score of 12.0 is the lowest among all ten, driven by a terminal 24.4% technical evidence composite and a 50.0 macro fit that provides no descriptor support. Disinflation actively hurts this category (-6 points), and the active descriptors of real asset sponsorship (+8) and commodity breadth positive (+5) cannot overcome the structural headwinds. The 3/2/1 basket of VEGI, MOO, and WEAT averages 32.7 before heavy category reasoner penalties for failed volume-price confirmation, collapsed persistence, and momentum confirmation near zero. Thirteen-week returns span -7.9% to -6.1% across the winners and runners-up; relative strength to SPY ranges from -19.3% to -17.5%. For this category to earn allocation, the entire complex would need to stabilize at support, show volume participation on a bounce attempt, and rebuild relative strength toward flat or positive versus SPY. Currently it is in freefall with no bid, and capital is best deployed into categories with positive technical and macro validation.