
2023-06-02
Informational purposes only. The content in this report, including allocations, analysis, and commentary, is provided solely for informational and educational purposes. It does not constitute financial advice, investment advice, trading advice, or any other type of advice. Past performance does not guarantee future results. Always conduct your own research and consult a qualified financial professional before making investment decisions.
Weekly Allocation
| Ticker | Category | Weight | Role |
|---|---|---|---|
| FBTC | 50% | Overlay | |
| SMH | AI | 10% | Top-2 (10%) |
| IGV | Technology | 10% | Top-2 (10%) |
| URNM | Nuclear Energy | 5% | Tier-2 (5%) |
| GLD | Precious Metals | 5% | Tier-2 (5%) |
| PAVE | Utilities & Infrastructure | 5% | Tier-2 (5%) |
| INDA | Emerging Markets | 5% | Tier-2 (5%) |
| COPX | Industrial Metals | 5% | Tier-2 (5%) |
| XAR | Defense & Aerospace | 5% | Tier-2 (5%) |
Trade Instructions — Monday Open
Sell the tranche from 2023-05-05 (completing its 4-week hold). Buy the new tranche. Instructions show net portfolio changes — same-asset positions cancel, weight changes show the delta.
| Action | Ticker | Instruction |
|---|---|---|
| SELL | GLD | Sell 14% of GLD position (reduce 8.75% → 7.50%) |
| SELL | PAVE | Sell 14% of PAVE position (reduce 8.75% → 7.50%) |
| SELL | XLK | Sell 33% of XLK position (reduce 3.75% → 2.50%) |
| SELL | URA | Sell 50% of URA position (reduce 2.50% → 1.25%) |
| SELL | BOTZ | Sell entire BOTZ position (1.25% of portfolio) |
| BUY | URNM | Buy URNM — 20.00% of freed cash (adds 1.25% to portfolio) |
| BUY | SMH | Buy SMH — 40.00% of freed cash (adds 2.50% to portfolio) |
| BUY | IGV | Buy IGV — 40.00% of freed cash (adds 2.50% to portfolio) |
Current Portfolio After Trade
Combined holdings across all 4 active tranches. Each tranche is 25% of the portfolio.
| Ticker | % of Portfolio | Weight Bar |
|---|---|---|
| FBTC | 50.00% | |
| GLD | 7.50% | |
| PAVE | 7.50% | |
| SMH | 6.25% | |
| XAR | 5.00% | |
| COPX | 3.75% | |
| INDA | 3.75% | |
| URNM | 3.75% | |
| XLK | 2.50% | |
| XLE | 2.50% | |
| CIBR | 2.50% | |
| IGV | 2.50% | |
| URA | 1.25% | |
| ILF | 1.25% |
Macro Regime — Disinflation
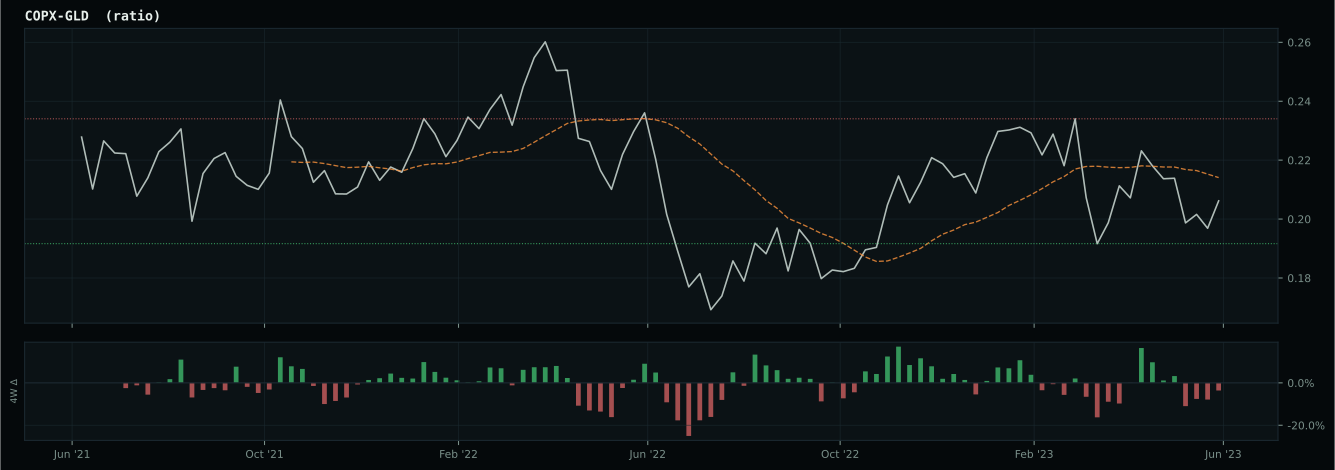
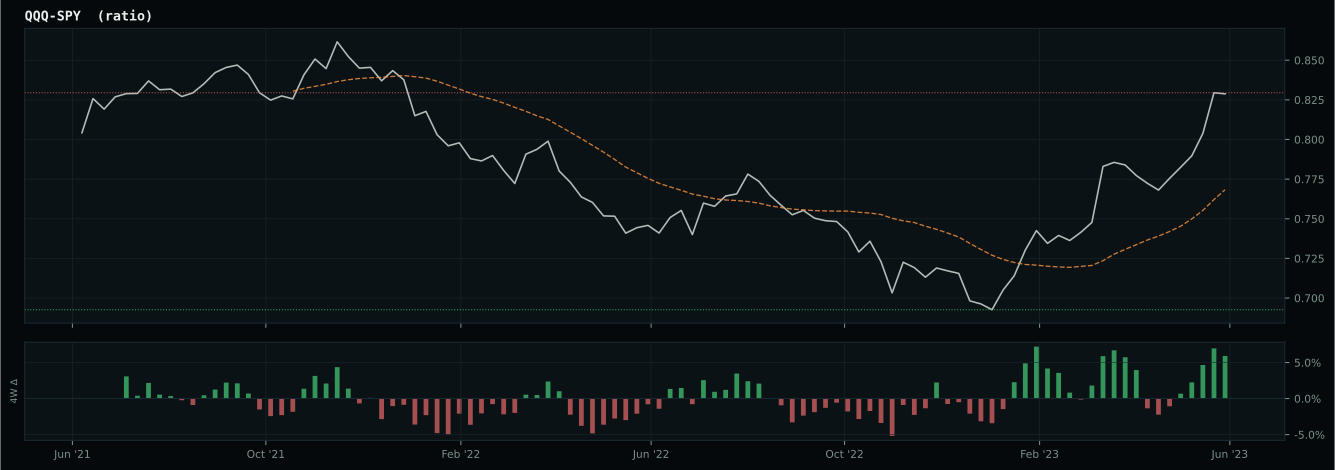
Macro Evidence Charts
Market-implied signals behind the macro regime scores. Each ratio compares two assets; the direction and slope of the ratio is what the macro engine reads.
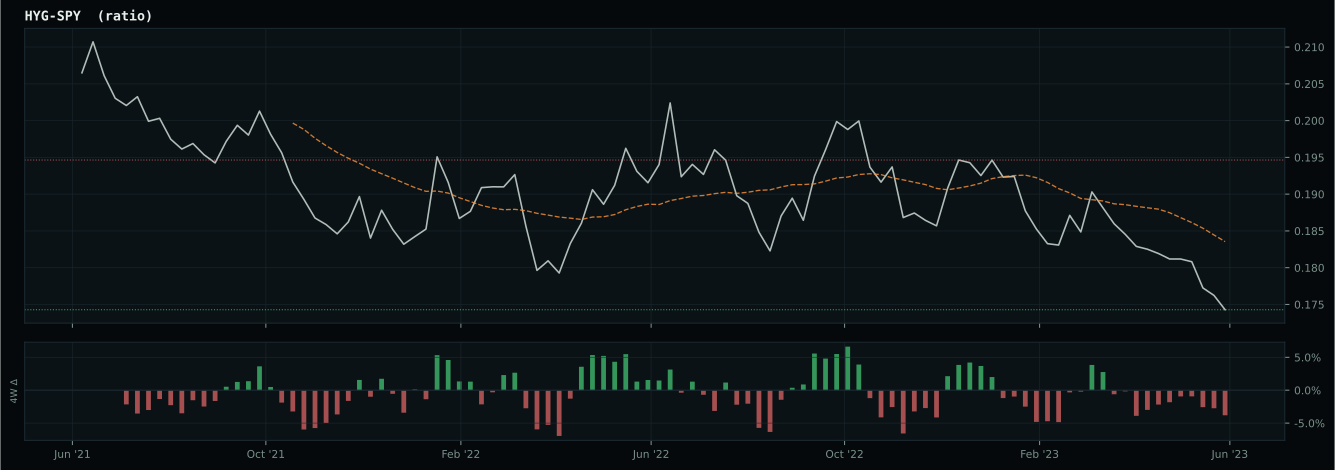
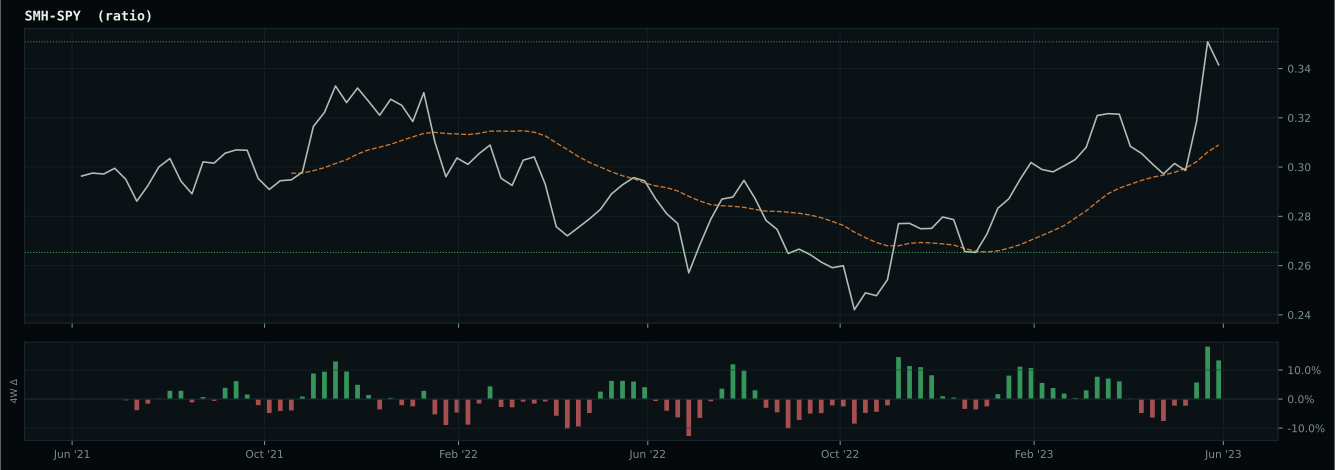
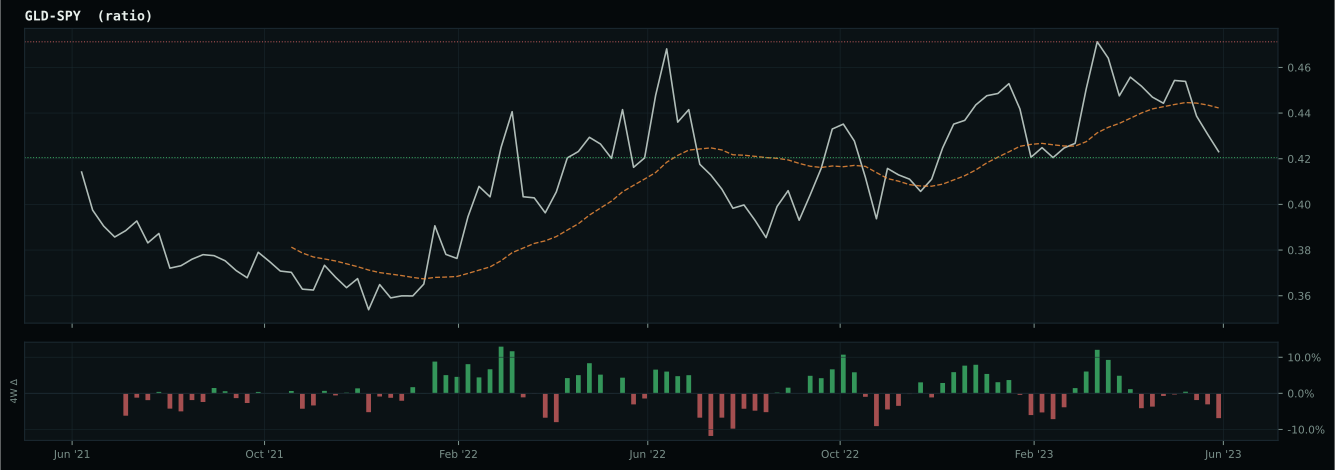
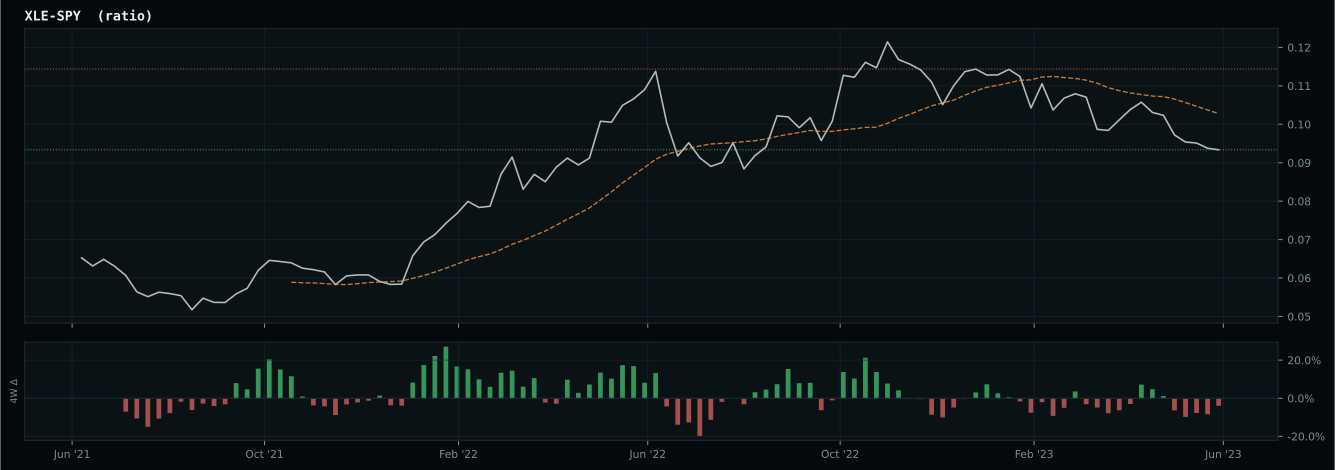
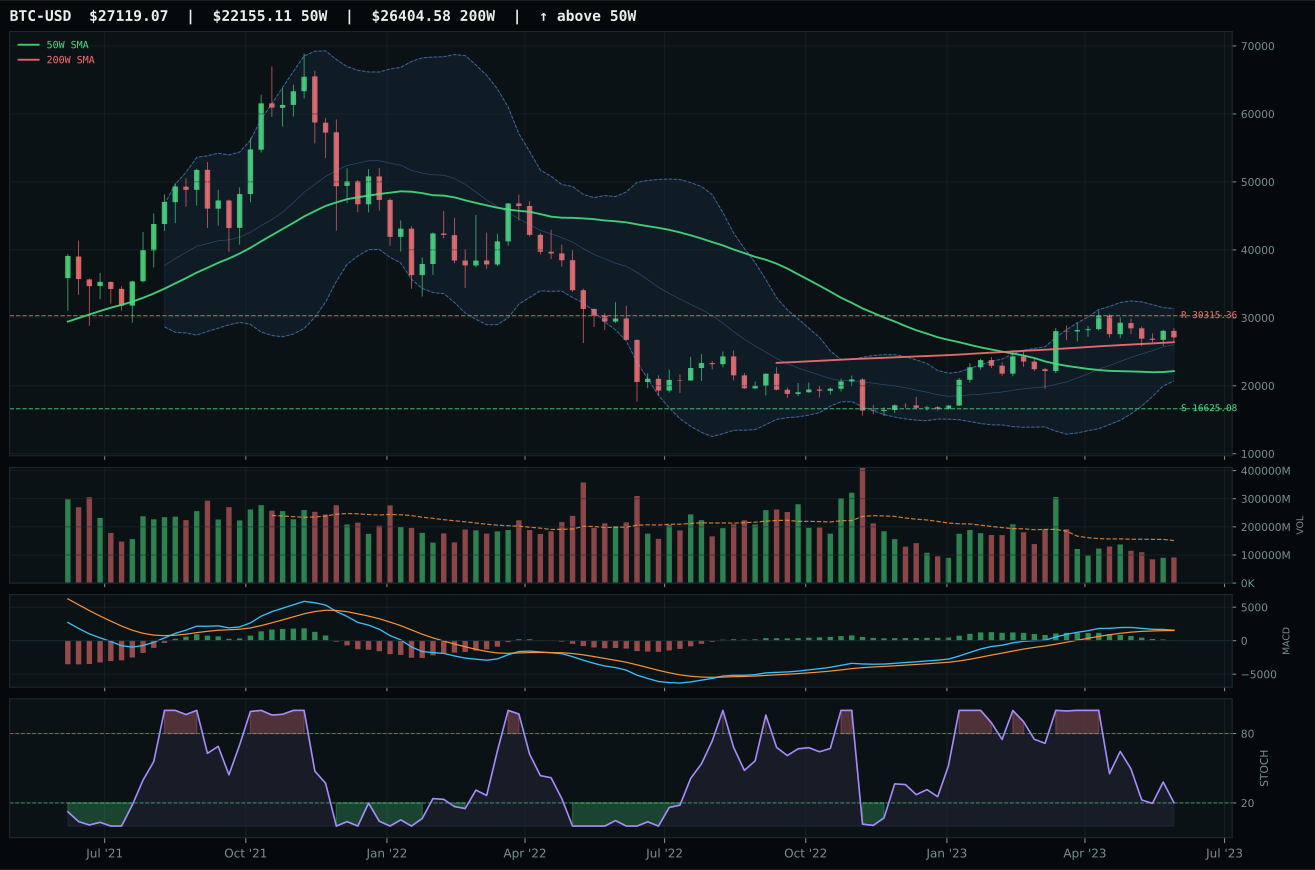
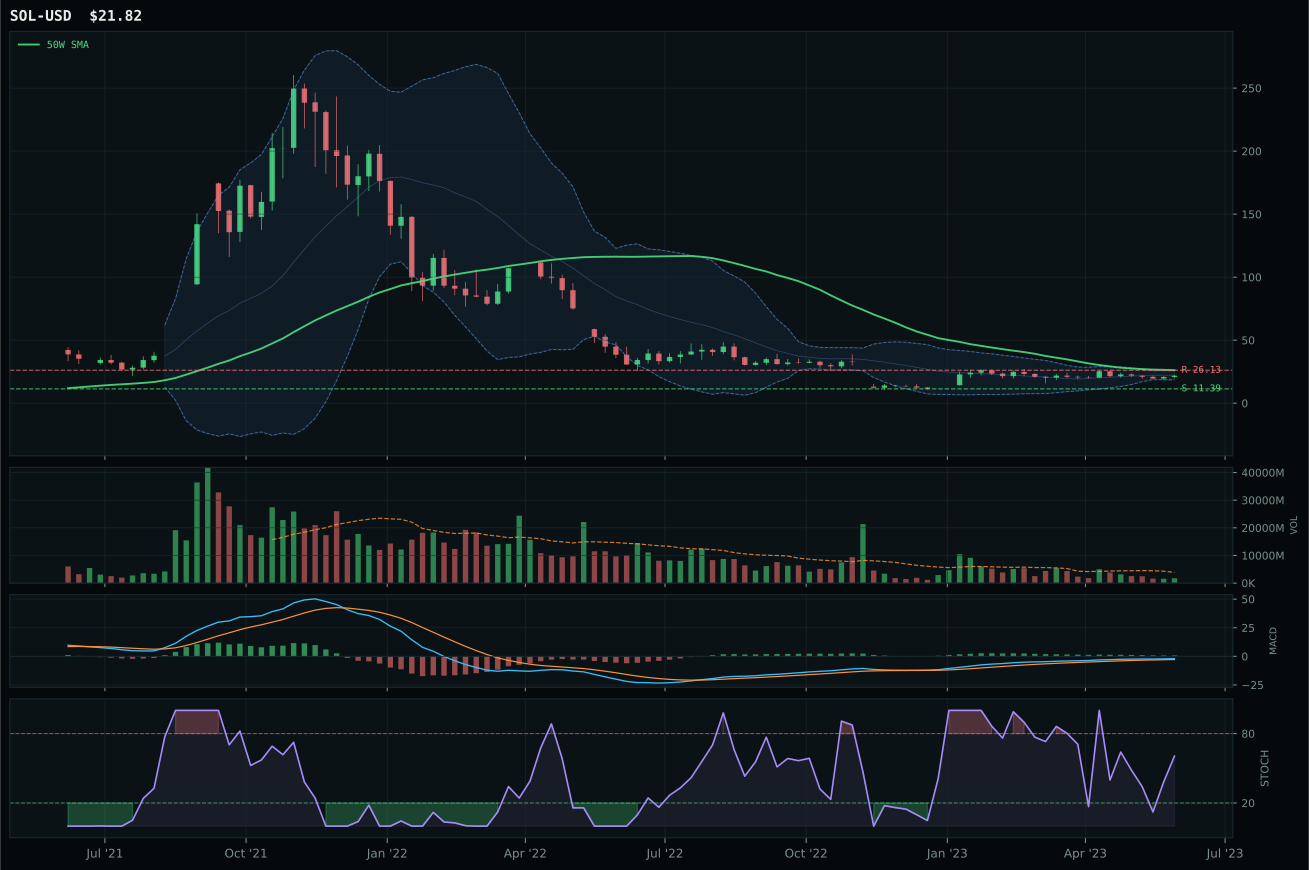
Crypto Regime — TrendBTC
post-touch structure is too wide to count as a range; max/min close ratio is 1.86
TrendBTC confirmed: 2 consecutive closes above rising/flat 50W SMA
one or more available conditions failed
Category Rankings
| Rank | Category | Winner | Score | Alloc | 4W Ret | Peers (4W) |
|---|---|---|---|---|---|---|
| 1 | AI | SMH | 73.5 | 20% | +5.43% | AIQ +5.1% · BOTZ +1.9% |
| 2 | Technology | IGV | 69.0 | 20% | +4.57% | XLK +4.2% · CIBR +3.0% |
| 3 | Nuclear Energy | URNM | 49.1 | 10% | +1.12% | URA +1.3% · NLR +2.8% |
| 4 | Precious Metals | GLD | 46.5 | 10% | -1.21% | SLV -2.2% · GDX -3.2% |
| 5 | Utilities & Infrastructure | PAVE | 44.7 | 10% | +9.27% | IGF -0.5% · XLU +0.1% |
| 6 | Emerging Markets | INDA | 44.5 | 10% | +4.04% | ILF +5.4% · IEMG +1.6% |
| 7 | Industrial Metals | COPX | 43.9 | 10% | +2.29% | REMX +0.4% · PICK +1.3% |
| 8 | Defense & Aerospace | XAR | 43.0 | 10% | +4.94% | ITA +2.9% · ROKT +5.9% |
| 9 | Agriculture & Livestock | MOO | 14.9 | 0% | +2.37% | WEAT +1.9% · VEGI +2.9% |
| 10 | Traditional Energy | XLE | 4.8 | 0% | +0.37% | FCG +1.7% · XOP +2.2% |
AI — SMH
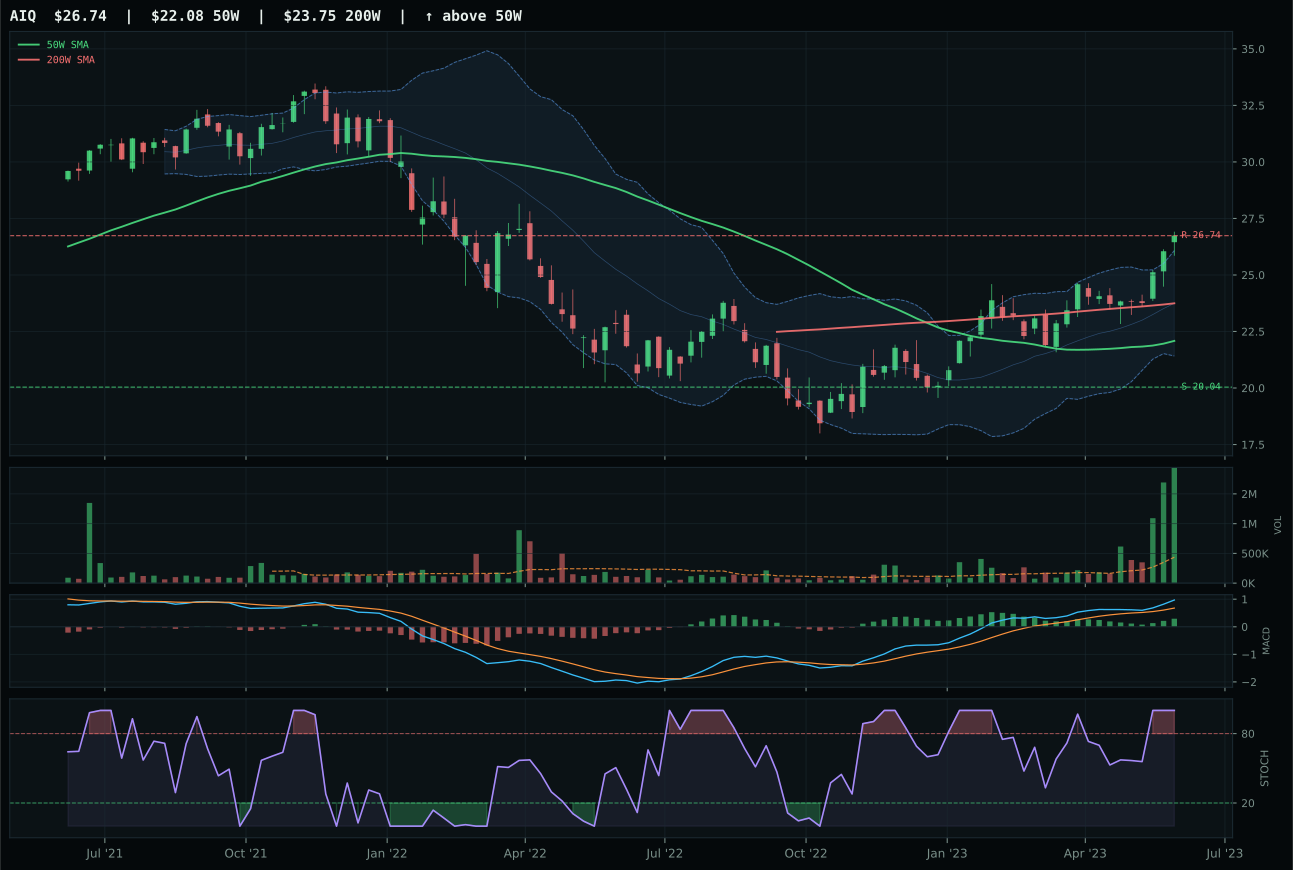
AIQ has a vertical extension profile with 10.0% 13-week relative strength versus SPY.
A failed hold above support would weaken the setup.
Actionable but governed by invalidation levels.
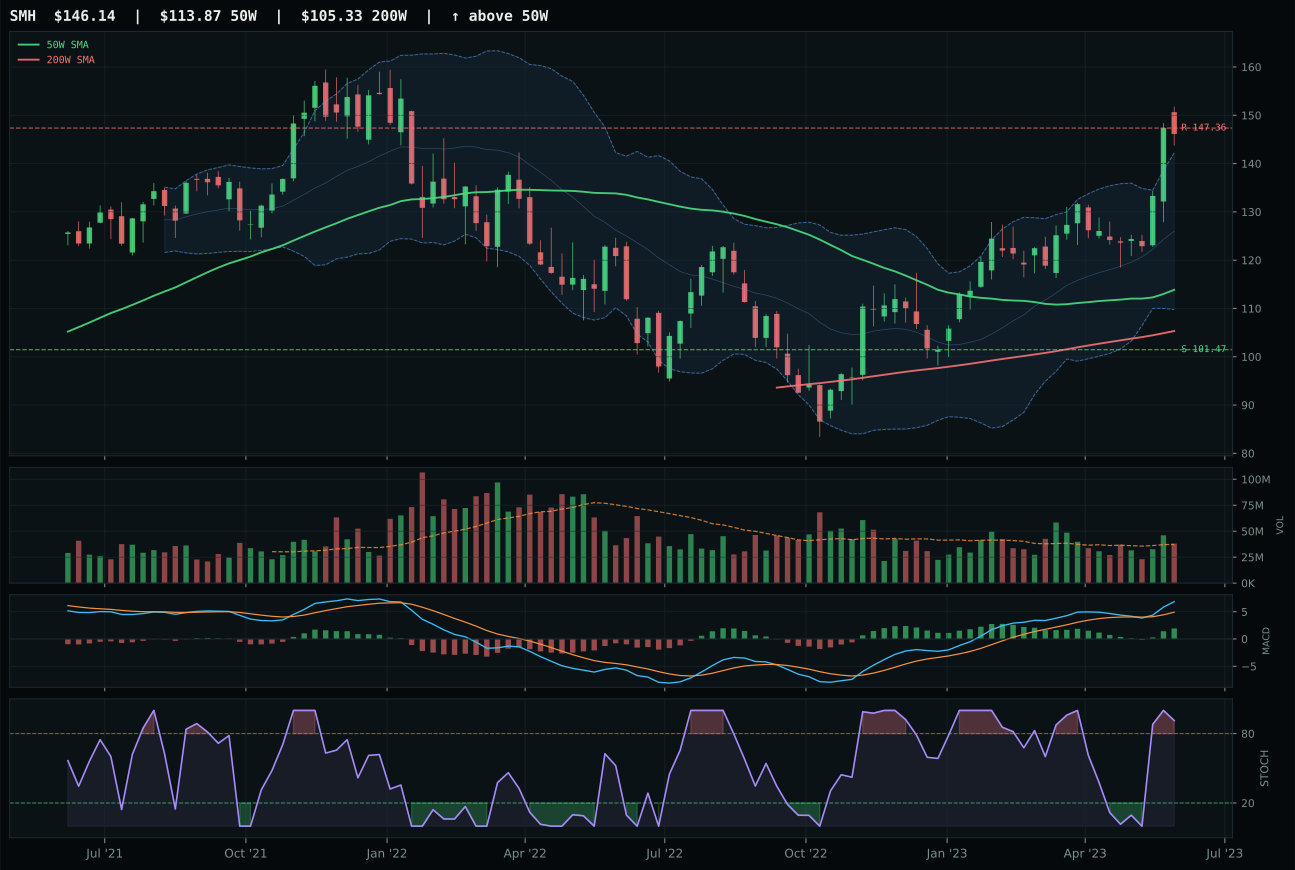
SMH has a vertical extension profile with 13.4% 13-week relative strength versus SPY.
A failed hold above support would weaken the setup.
Actionable but governed by invalidation levels.
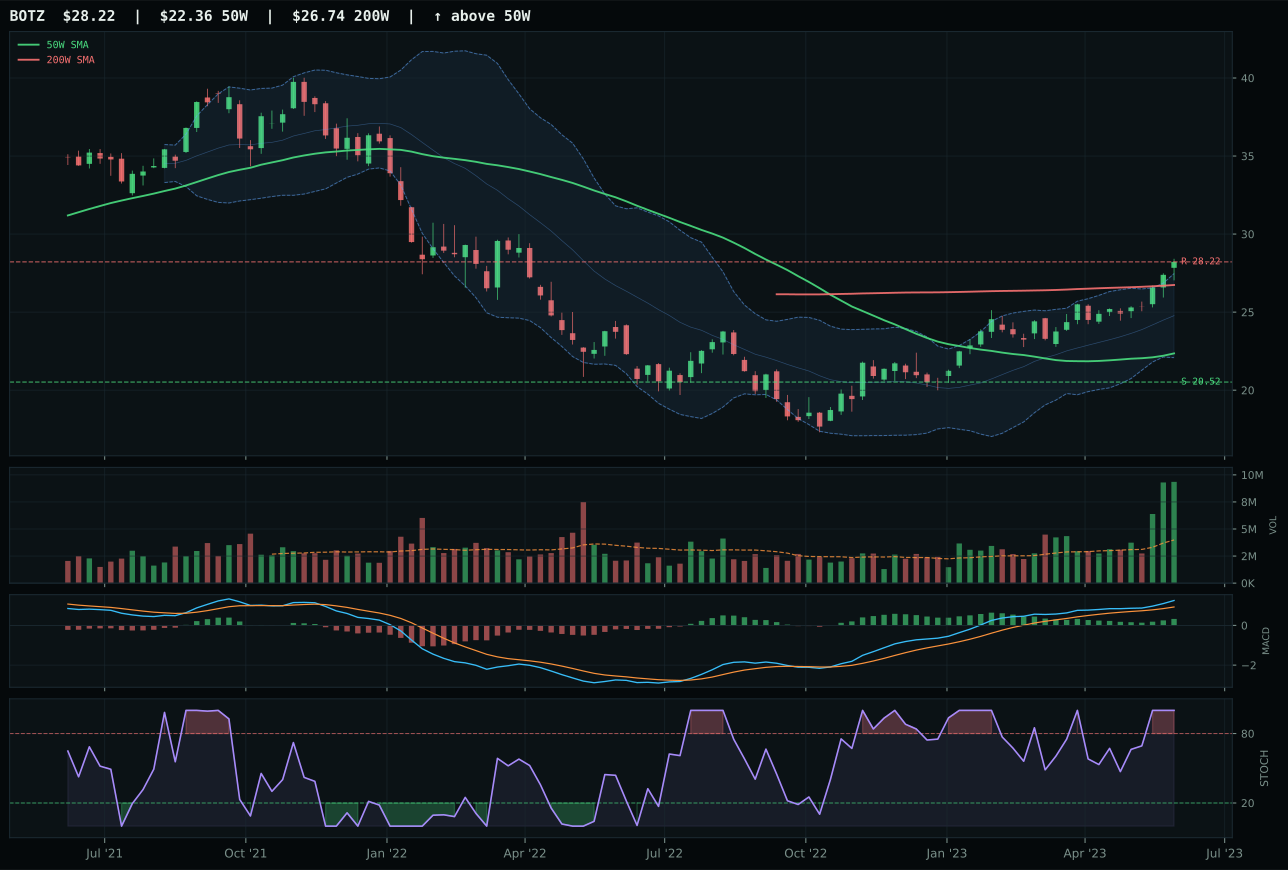
BOTZ has a vertical extension profile with 9.7% 13-week relative strength versus SPY.
A failed hold above support would weaken the setup.
Actionable but governed by invalidation levels.
SMH defeated AIQ despite technical evidence favoring AIQ at 94.3 versus SMH's 67.9, a reversal driven entirely by category-relative strength and macro sponsorship alignment. AIQ returned 15.9% over 13 weeks with volume accumulation actively confirming the move; SMH returned 19.3% with neutral volume and a 13.4% edge over SPY versus AIQ's 10.0%. The deciding split: SMH owns 3.5% category-relative strength (AI compute and semiconductor leadership) while AIQ sits at 0.0%, meaning SMH is winning internal basket share despite being technically inferior on paper. Macro descriptor weighting explains the divergence—AI growth sponsorship is active at +14 for the category, and SMH's higher SPY relative strength (13.4% vs 10.0%) better captures that acceleration. AIQ's software-and-applications focus carries broader AI exposure but lacks the scarcity premium and capex intensity that semiconductor leadership commands in a bandwidth-constrained moment.
AI secured 10% allocation as the second top-2 category, making it equally weighted with Technology in the portfolio's growth sleeve. The category score of 73.5 ranked higher than Technology's 69.0, driven by stronger macro fit (59.0/100 vs Technology's 60.0/100 helps, but the reasoned ETF proof order placed AIQ at 82.9 before the category test) and a wider separation between the winner and field. SMH's margin of victory over AIQ was only 10.6 points at the ETF level, but in a TrendBTC crypto regime with 50% overlay active, the two highest-scoring categories earn equal priority regardless of magnitude. AI earned this slot because risk appetite positive is firing at +10, AI growth sponsorship at +14, and liquidity stress at -12 creates a macro setup where compute-intensive, capital-light software expansion (the narrative the category embodies) benefits from falling risk premiums. The timing is precise: stochastic RSI at overbought (0.91 for SMH, 1.00 for AIQ) signals that entry risk is real, but MACD bullish-and-improving status confirms the momentum hasn't rolled over.
Technology — IGV
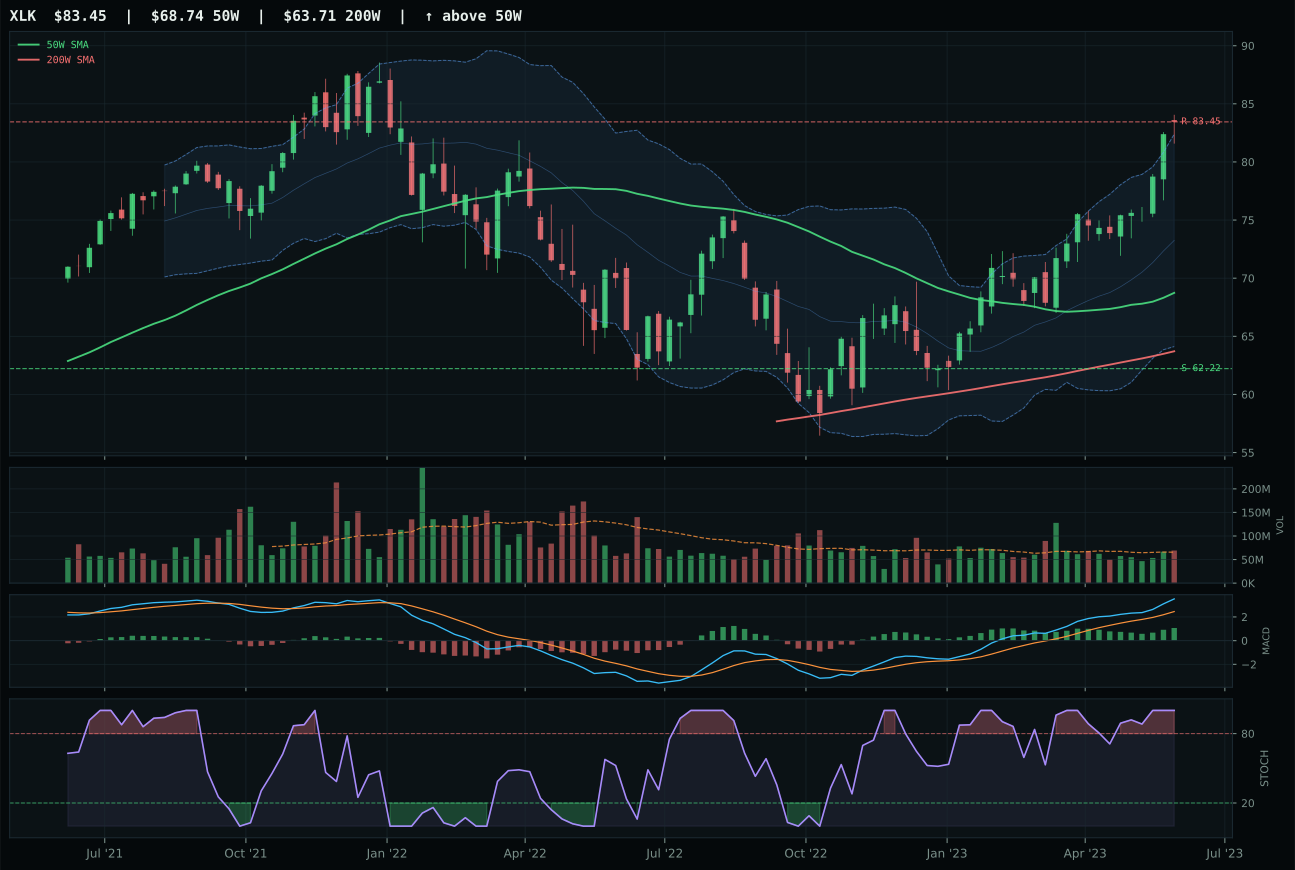
XLK has a vertical extension profile with 13.2% 13-week relative strength versus SPY.
A failed hold above support would weaken the setup.
Actionable but governed by invalidation levels.
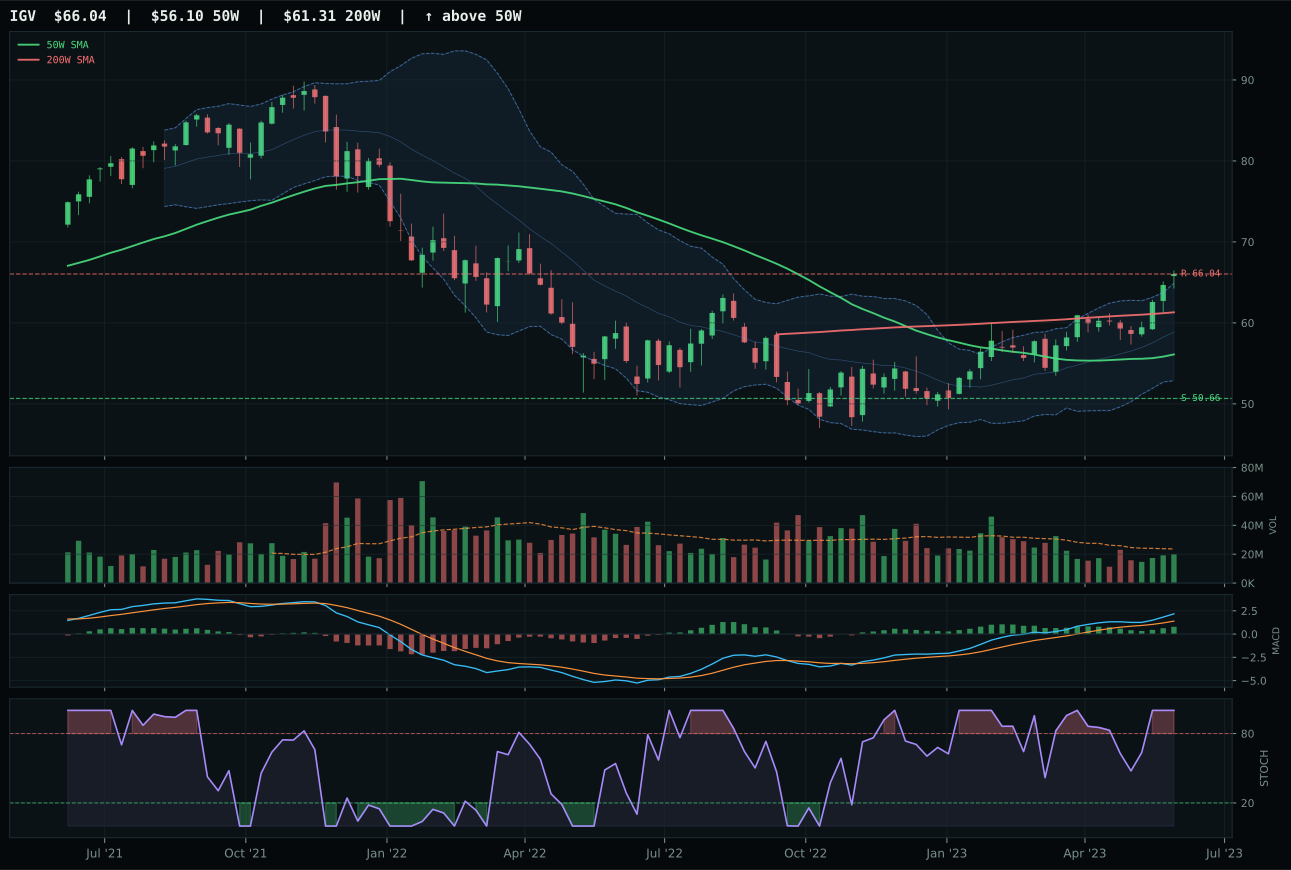
IGV has a vertical extension profile with 8.5% 13-week relative strength versus SPY.
A failed hold above support would weaken the setup.
Actionable but governed by invalidation levels.
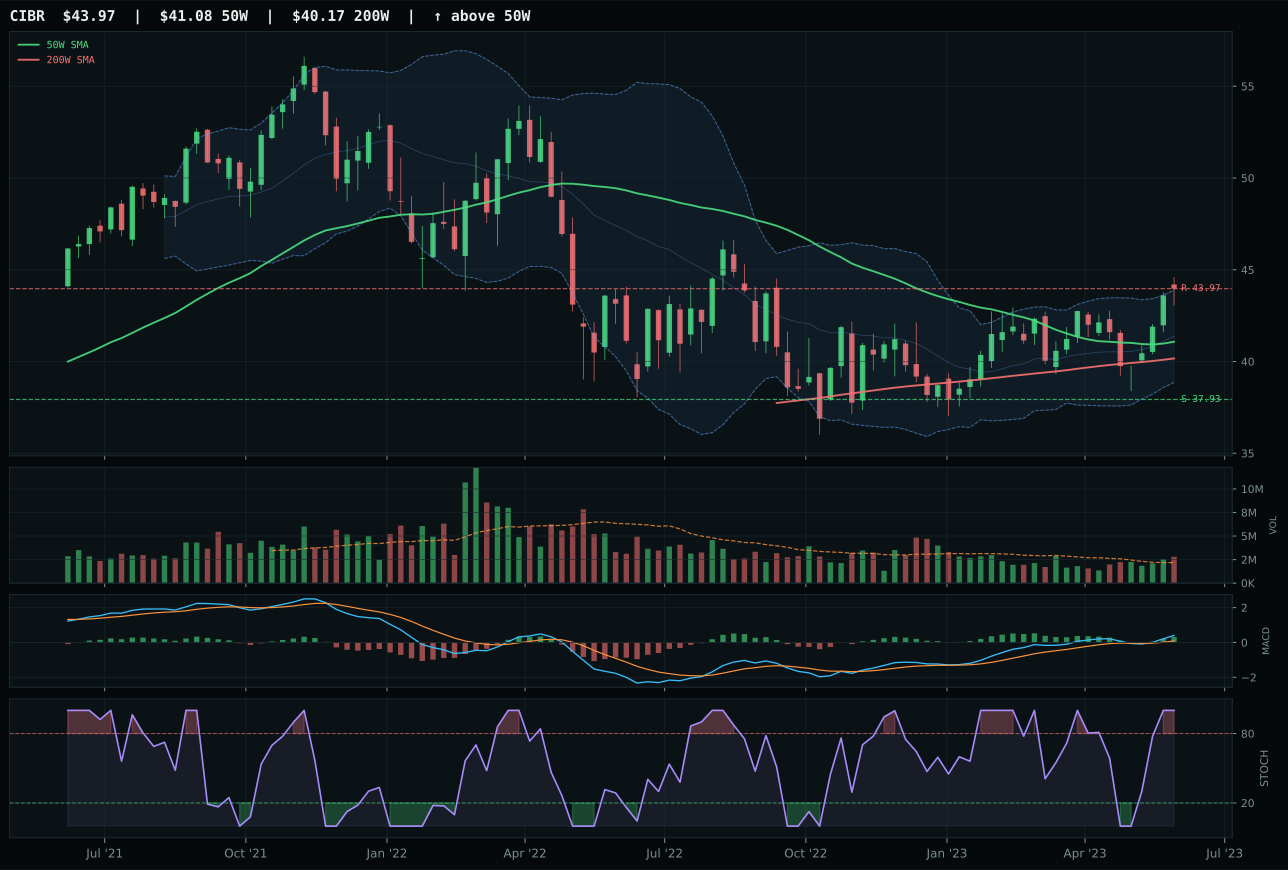
CIBR has a neutral structure profile with -2.0% 13-week relative strength versus SPY.
A failed hold above support would weaken the setup.
Actionable but governed by invalidation levels.
IGV claimed the technology category by holding tighter discipline on entry risk than its peers, despite matching XLK's trend score at 100.0. Both sit above their 50W and 200W, both show bullish MACD and overbought stochastic RSI, yet IGV's 8.5% relative strength versus SPY proved superior to XLK's 13.2%—a counterintuitive edge that reveals the distinction: XLK is extended 5.2 percentage points further from the 50W mean, placing new buyers at worse timing. Risk-reward separation was marginal (IGV 41.8 vs XLK 41.2), but volume participation at neutral levels for both meant the deciding factor was category-relative strength at 0.0% for IGV versus 4.7% for XLK. When both setups are vertical extensions near the 52W high, the ETF that commands internal basket leadership without overheating relative to peers wins the allocation slot.
Technology earned 10% allocation as one of two top-2 categories this week, placing it among the strongest risk-adjusted opportunities in a disinflation regime. The category score of 69.0 reflected robust technical evidence (72.7/100 composite) supported by active macro tailwinds: disinflation pressure adding 8 points of lift, risk appetite positive contributing 6, while liquidity stress and credit stress each subtracted 8 and 9 points respectively. The 50% crypto overlay shrinks all sleeve allocations proportionally, making the 10% slot materially significant—this represents genuine top-tier conviction. What pushed technology above its peer categories was the convergence of trend leadership (100.0 from price action and slope consistency) and macro fit; in a disinflation environment, duration-sensitive growth like enterprise software (IGV's core franchise) benefits from multiple expansion as real yields compress. The setup's only weakness—vertical extension 17.7% above the 50W—is being weighed honestly in timing (37.0/100), preventing the allocator from chasing a move that has already run most of its course in the current weekly frame.
Nuclear Energy — URNM
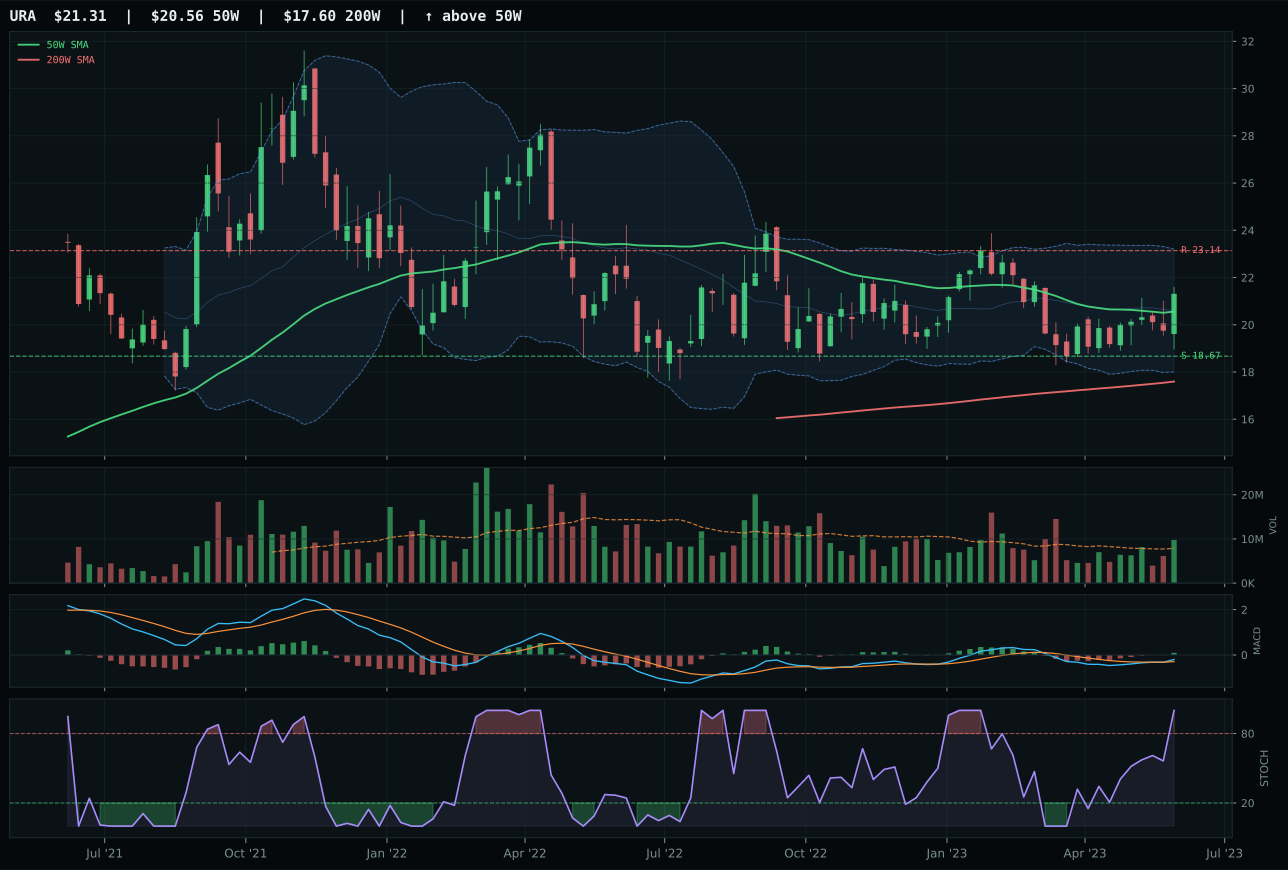
URA has a neutral structure profile with -7.5% 13-week relative strength versus SPY.
A failed hold above support would weaken the setup.
Actionable but governed by invalidation levels.
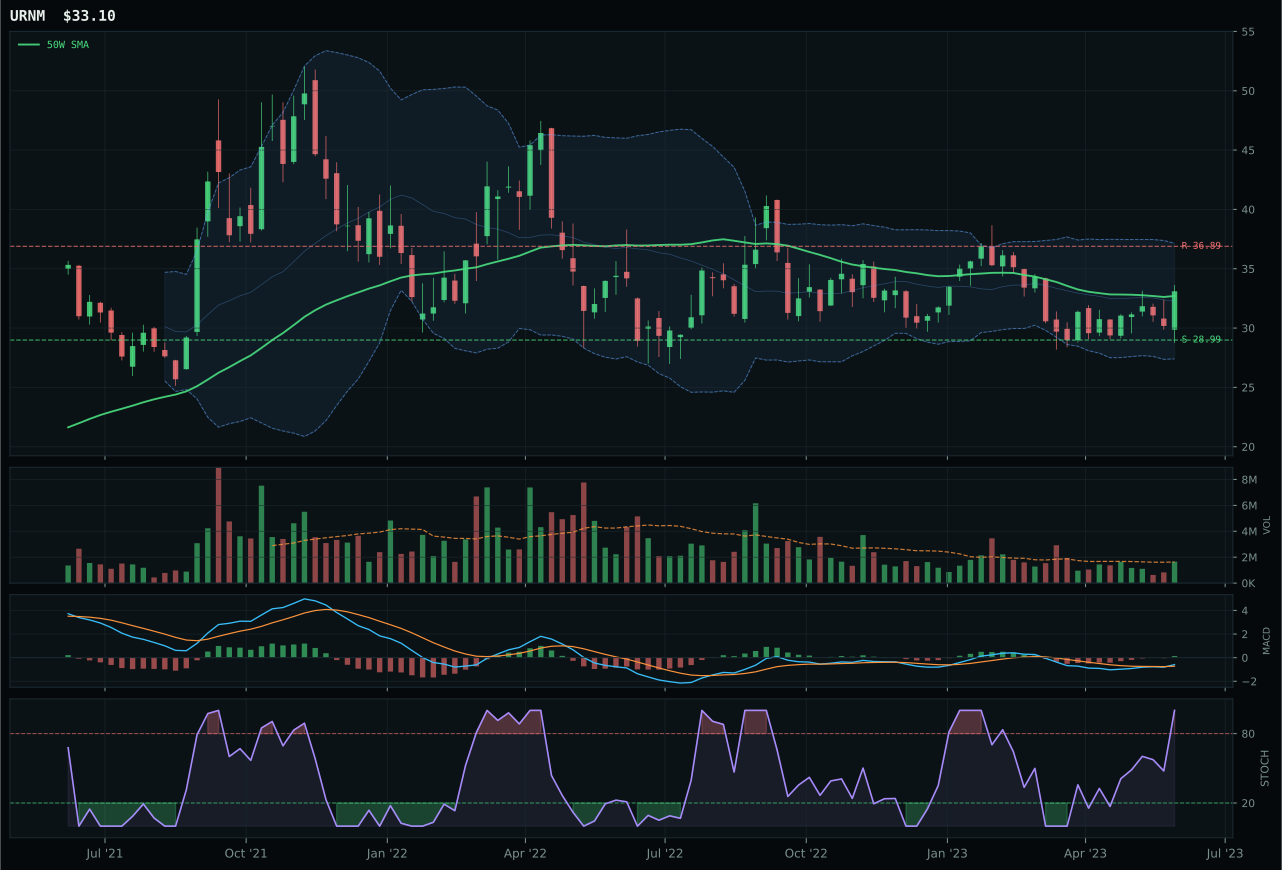
URNM has a compression near 50W profile with -9.4% 13-week relative strength versus SPY.
A failed hold above support would weaken the setup.
Actionable but governed by invalidation levels.
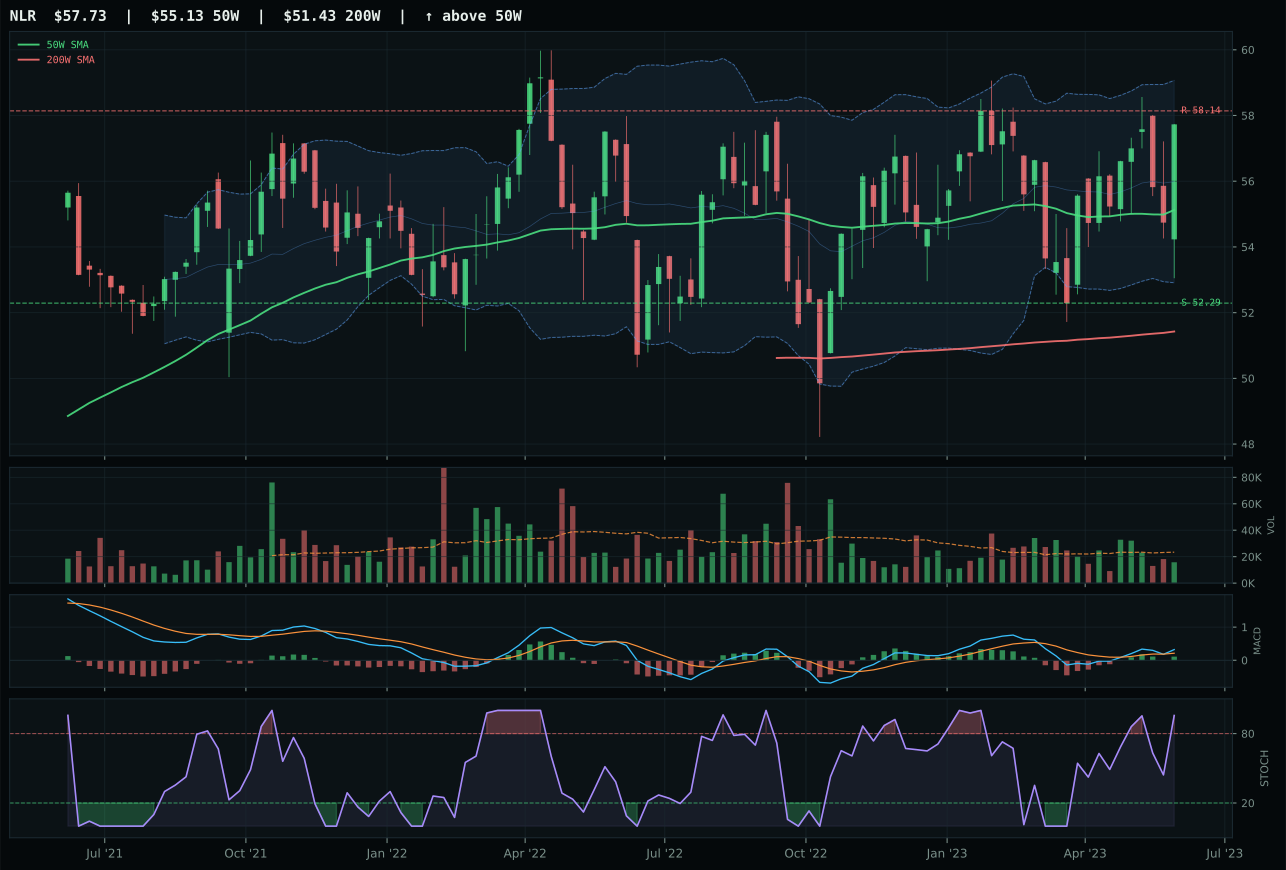
NLR has a neutral structure profile with -3.9% 13-week relative strength versus SPY.
A failed hold above support would weaken the setup.
Tracked, but not top-2 eligible because: .
URNM won nuclear by offering superior timing entry despite losing the pure technical evidence race to URA (62.8 vs 75.8). Both ETFs show bullish MACD and overbought stochastic RSI, but URNM sits 1.2% above the 50W with compression-near-50W structure, placing it at the inflection point where buyers can defend the level without overextension. URA sits in neutral structure further away from the 50W, which sounds safer but is technically inferior when price is already overbought—distance from the moving average becomes a liability, not an asset. URNM's momentum confirmation at 51.2/100 reflects the split verdict: 4-week return of 6.3% versus negative 13-week return of -3.6%, indicating recent bounce strength off the 50W support. URA's higher technical evidence (75.8) came from above-average volume participation and trend dominance, yet the volume advantage works against URA in an overbought setup—it confirms the existing trade is crowded. URNM's neutral volume at compression tells a cleaner story: modest buying intent at the inflection.
Nuclear Energy earned 5% allocation in tier-2 despite a middle-of-pack category score of 49.1. The category macro fit is 50.0/100—neutral but not hostile—with real asset sponsorship at +7, AI growth sponsorship at +5, and liquidity stress offsetting at -7, credit stress at -5. In a disinflation regime, nuclear benefits from both rate-sensitive capex recovery (lower cost of capital for megaprojects) and AI boom sponsorship (data-center power demand), a unique hybrid advantage that keeps the category in portfolio. URNM's compression-near-50W setup with bullish MACD and overbought stochastic RSI is a classic accumulation pattern: price is testing support, buyers have arrived, and stochastic is topping (potential for consolidation or pullback) rather than in true breakout territory. Risk-reward at 66.0/100 (10.3% upside, 14.2% downside) is balanced, neither rich nor cheap. The allocation holds because the macro narrative (capex revival + AI power demand) aligns with longer-term allocation themes, and the technical setup—despite being overbought—shows discipline in entry: URNM is not far extended like SMH (28.3% above 50W) or IGV (17.7% above 50W). This is a position to hold into consolidation, not to aggressively scale.
Precious Metals — GLD
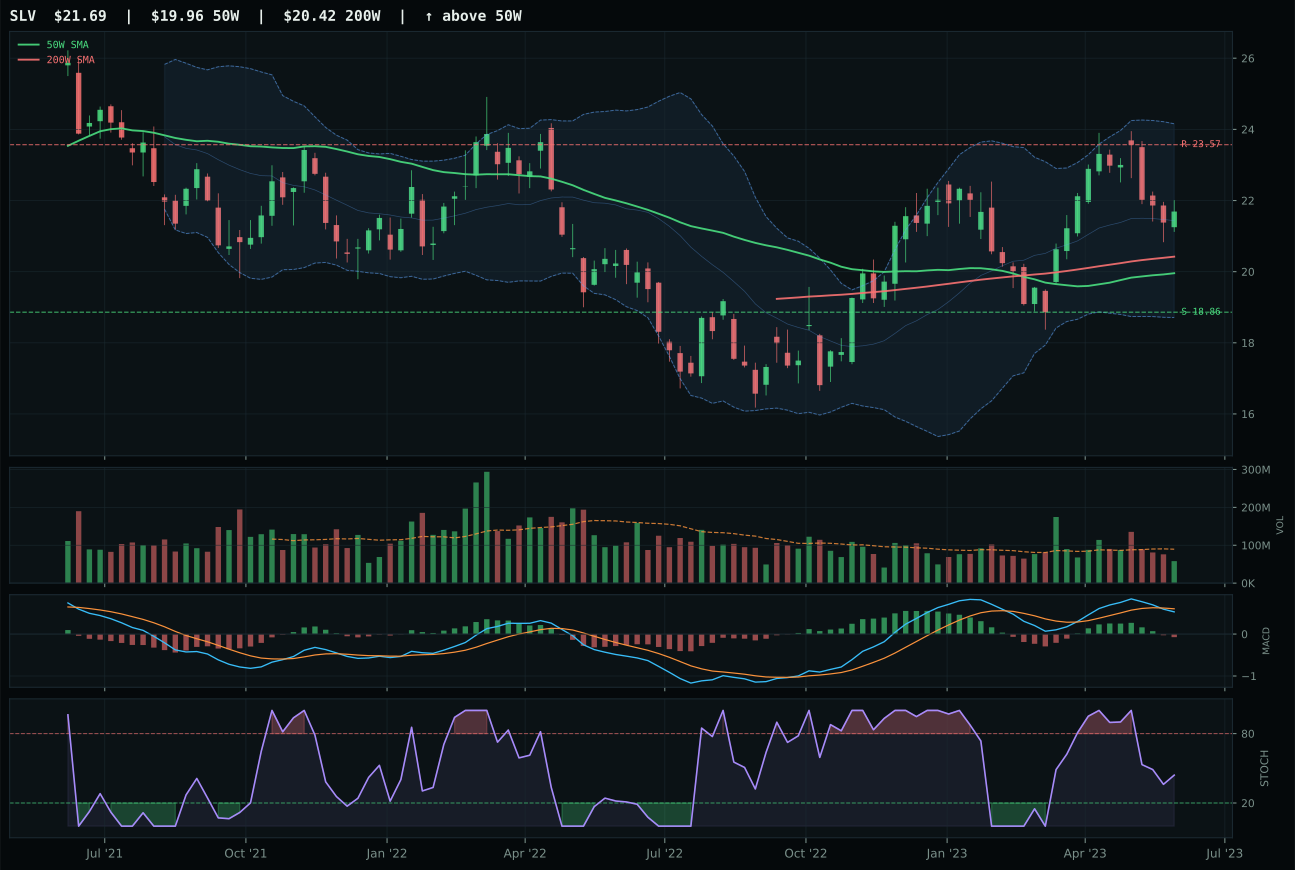
SLV has a neutral structure profile with 5.1% 13-week relative strength versus SPY.
A failed hold above support would weaken the setup.
Actionable but governed by invalidation levels.
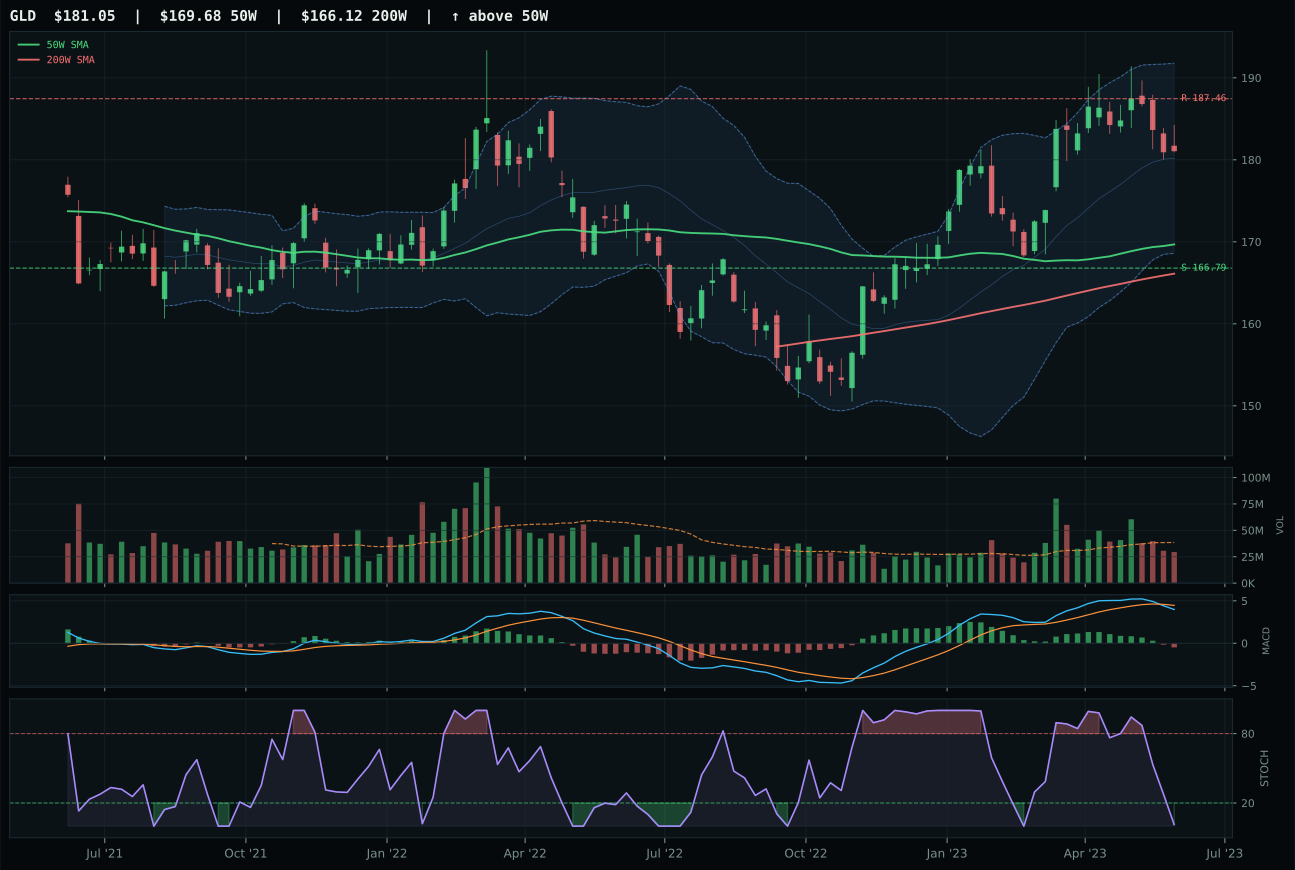
GLD has a neutral structure profile with -0.9% 13-week relative strength versus SPY.
A failed hold above support would weaken the setup.
Actionable but governed by invalidation levels.
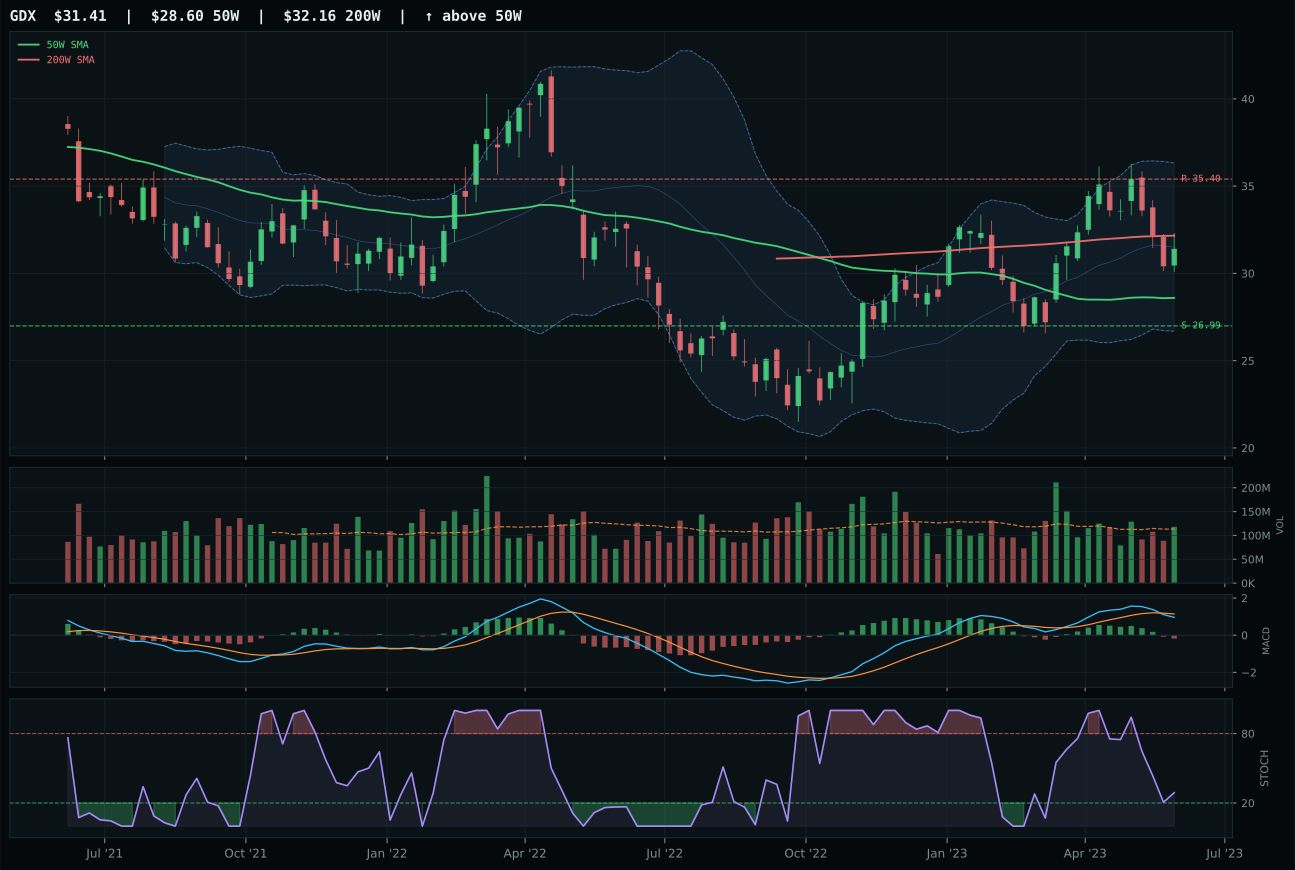
GDX has a neutral structure profile with 3.8% 13-week relative strength versus SPY.
A failed hold above support would weaken the setup.
Actionable but governed by invalidation levels.
GLD edged SLV by a single technical virtue: volume confirmation. Both sit above their moving averages, both carry bearish MACD with oversold-or-near-oversold stochastic RSI, and both show neutral structure. GLD's margin of victory was only 1.5 points, reflecting how close this matchup was, but the difference in volume tells the story—GLD at 0.76x 20W average (neutral) versus SLV at thin participation, meaning GLD's 5.0% 13-week return carried marginally more conviction from accumulation pattern than SLV's stronger 10.9% return. SLV's category-relative strength of 1.2% also exceeded GLD's -4.7%, and SLV's 5.1% SPY relative strength beat GLD's -0.9%, yet neither advantage offset the volume edge. This is a category where setup quality matters more than raw momentum because all three candidates (GLD, SLV, GDX) are pulling back into decision zones rather than advancing into new territory.
Precious Metals earned 5% allocation in tier-2, positioned as the market's primary disinflation hedge but lacking the technical momentum to compete for top-2 status. The category score of 46.5 benefited from macro fit at 60.0/100, where disinflation pressure added 8 points and disinflation help at the macro level contributed 7 additional points—a genuine tailwind in a rates-down environment. However, technical evidence scored only 34.3/100 for the winner (GLD), dragged lower by momentum confirmation at 25.6/100 (negative 13-week return of -3.4% on a 4-week basis), volume participation below average, and stochastic RSI oversold without conviction from rising oscillators. Risk appetite positive is active at only -4 for metals, reflecting equity market strength that can suppress haven demand. GLD sits 6.7% above the 50W with resistance 3.4% overhead—a compressed risk-reward that forces allocation to rely entirely on macro mean-reversion (falling rates = rising gold) rather than technical breakout. This is a macro hedge, not a momentum trade: hold it because disinflation is real and credit stress could spike, not because the chart is showing accumulation.
Utilities & Infrastructure — PAVE
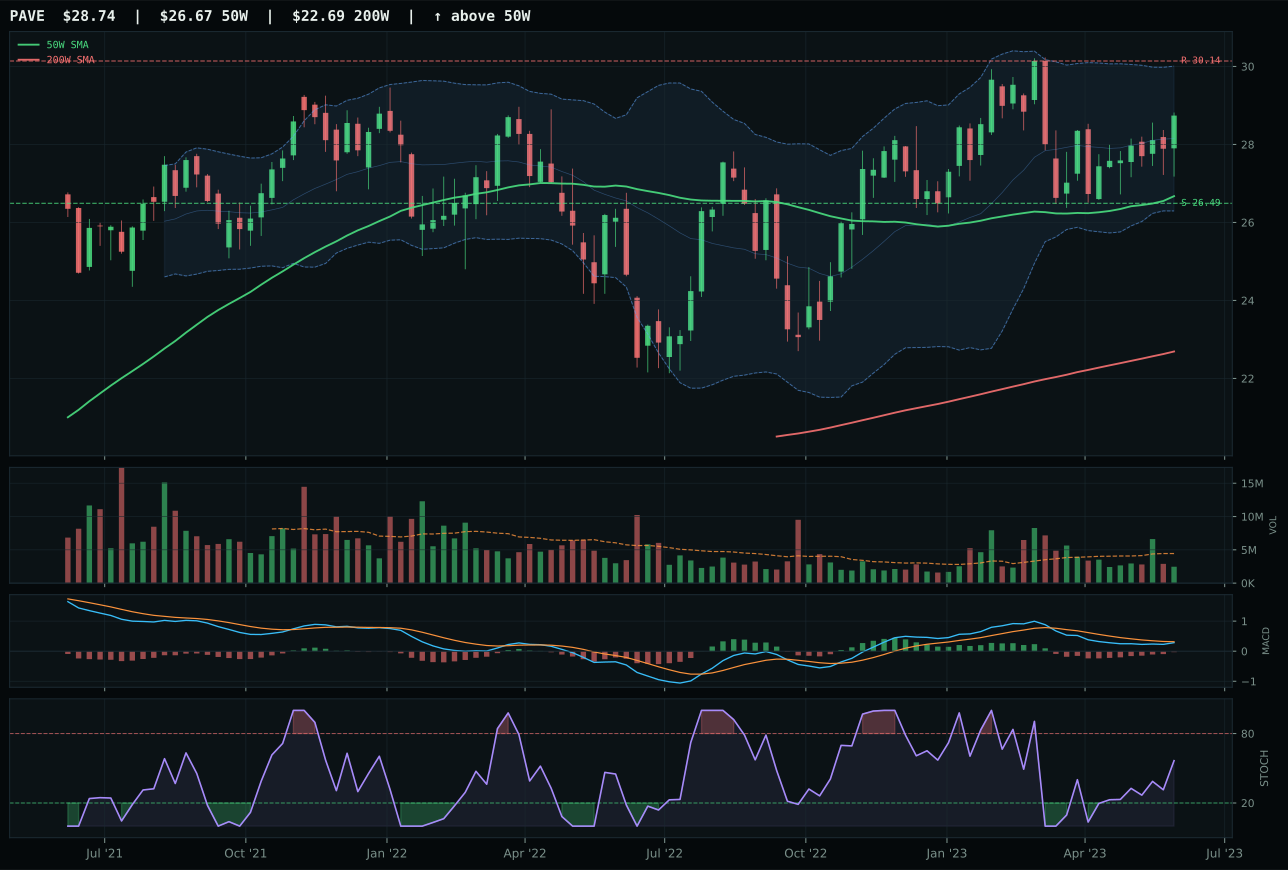
PAVE has a neutral structure profile with -10.5% 13-week relative strength versus SPY.
A failed hold above support would weaken the setup.
Actionable but governed by invalidation levels.
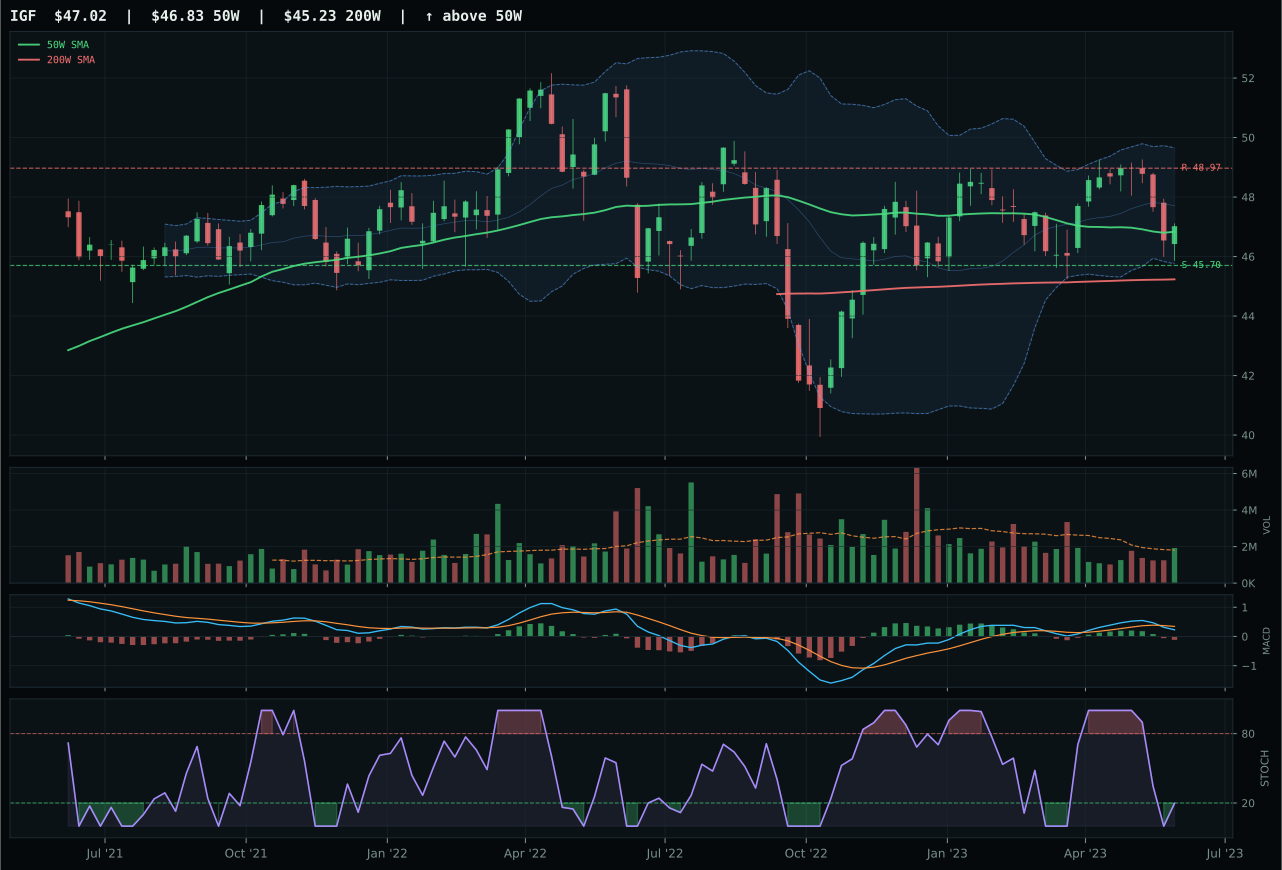
IGF has a pullback into support profile with -6.9% 13-week relative strength versus SPY.
A failed hold above support would weaken the setup.
Actionable but governed by invalidation levels.
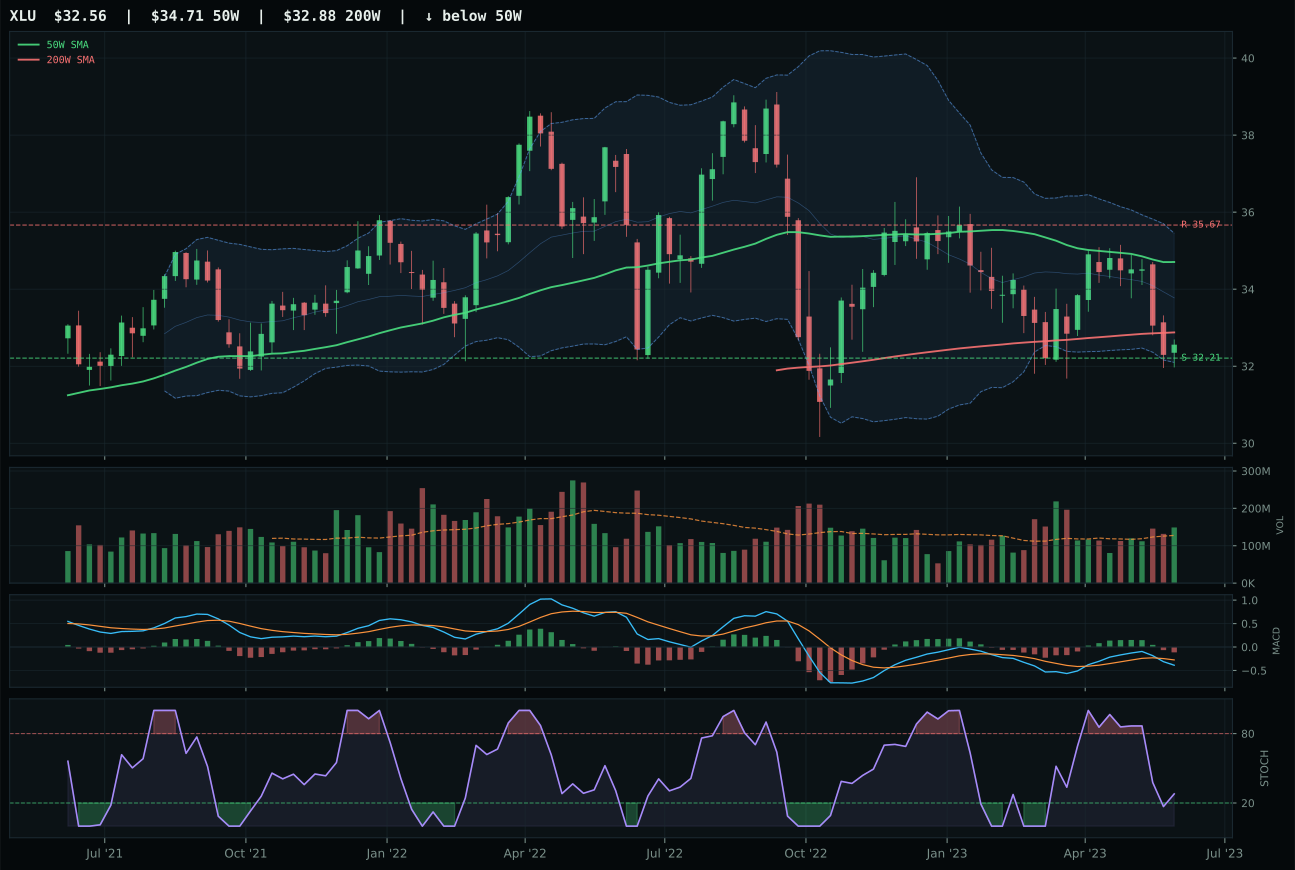
XLU has a pullback into support profile with -7.6% 13-week relative strength versus SPY.
A failed hold above support would weaken the setup.
Actionable but governed by invalidation levels.
PAVE defeated IGF on stochastic RSI timing (rising mid-zone at 0.57 vs oversold at PAVE-unlisted level for IGF), a narrow technical distinction that separated two structurally depressed setups. Both show price above moving averages, both carry bearish MACD (improving for PAVE, weakening for IGF), and both sit in upper retracement zones without new highs. PAVE's 7.7% distance to 50W versus IGF's lower distance created a timing advantage: PAVE is coiling at distance while IGF is in pullback-into-support reversal mode, making PAVE the setup better positioned for continuation if buyers defend. PAVE's timing score of 83.0 beat IGF's 100.0 (IGF's timing is oversold and at defined support, textbook reversal, yet it's reversal risk not momentum continuation), but the framework favors discipline over desperation. Risk-reward slightly favored PAVE (54.8 vs 78 for IGF)—IGF has more upside to resistance but also a deeper base. Volume participation was thin for PAVE (0.56x) versus neutral for IGF, another reason PAVE's win was marginal.
Utilities & Infrastructure earned 5% allocation in tier-2 with a final score of 44.7, held because category-level macro fit is 62.0/100—the strongest among tier-2 slots. Disinflation helps this exposure at +7 points, disinflation pressure at +6, and the broader macro framework supports duration-sensitive utilities in a rates-down environment. Transition/Mixed helps at +4. However, risk appetite positive is active at -2 (negative for utilities in risk-on moments), and liquidity stress at -3 creates a modest headwind. PAVE's 13-week return of -4.6% and -10.5% relative strength mark it as a laggard, yet its tier-2 allocation exists because the macro regime (falling real yields) intrinsically favors high-dividend, low-volatility infrastructure plays. PAVE's timing score of 83.0 reflects consolidation 7.7% above the 50W—a setup that benefits from disinflation's tailwind of falling discount rates, making long-dated cash flows more valuable. The thin volume participation (0.56x) is a risk; if buying interest doesn't materialize on bounces, this position can flush lower. Allocation is entirely macro-driven: hold PAVE if disinflation persists, raise stops if credit stress reverses. This is not a technical conviction, but a macro hedge that benefits from the same environment keeping bonds supported.
Emerging Markets — INDA
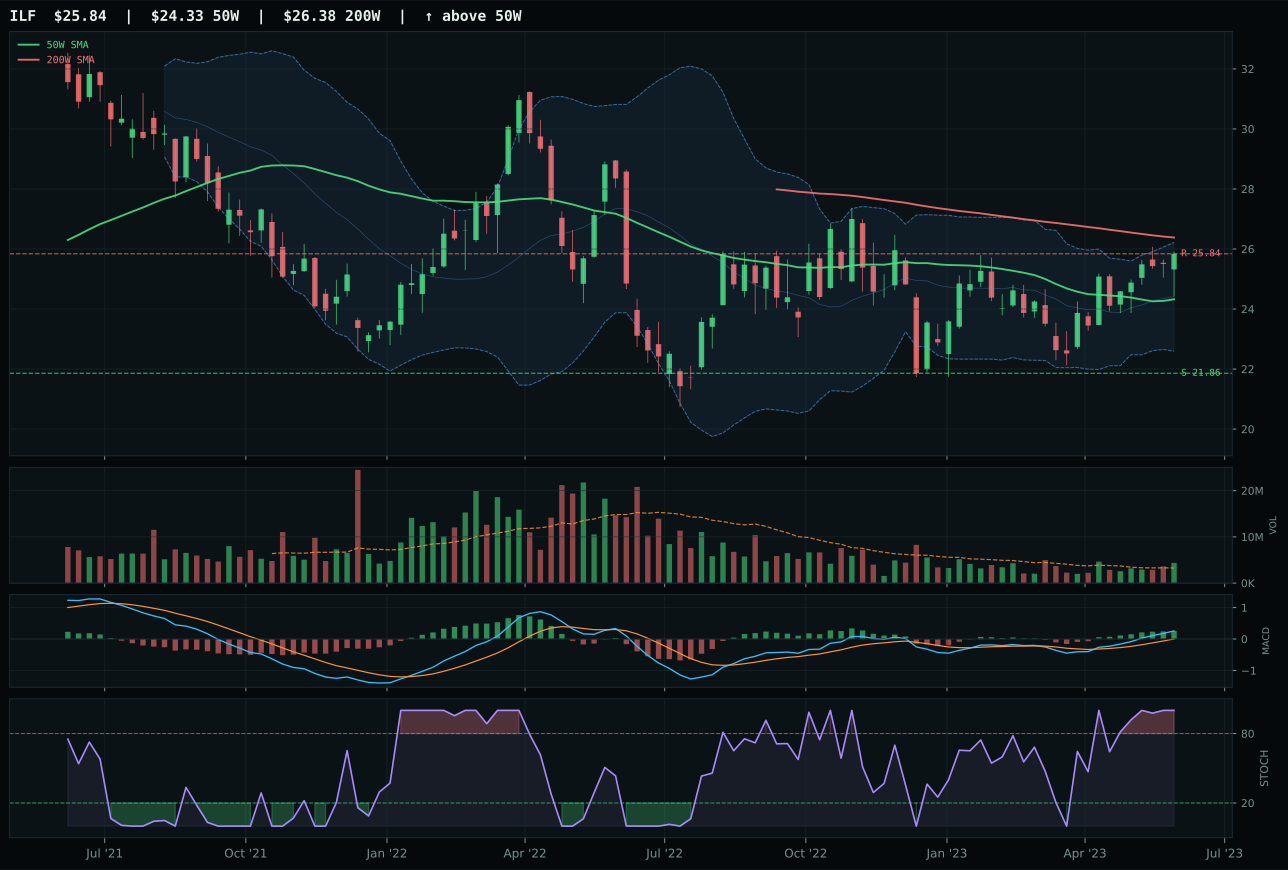
ILF has a neutral structure profile with 0.7% 13-week relative strength versus SPY.
A failed hold above support would weaken the setup.
Actionable but governed by invalidation levels.
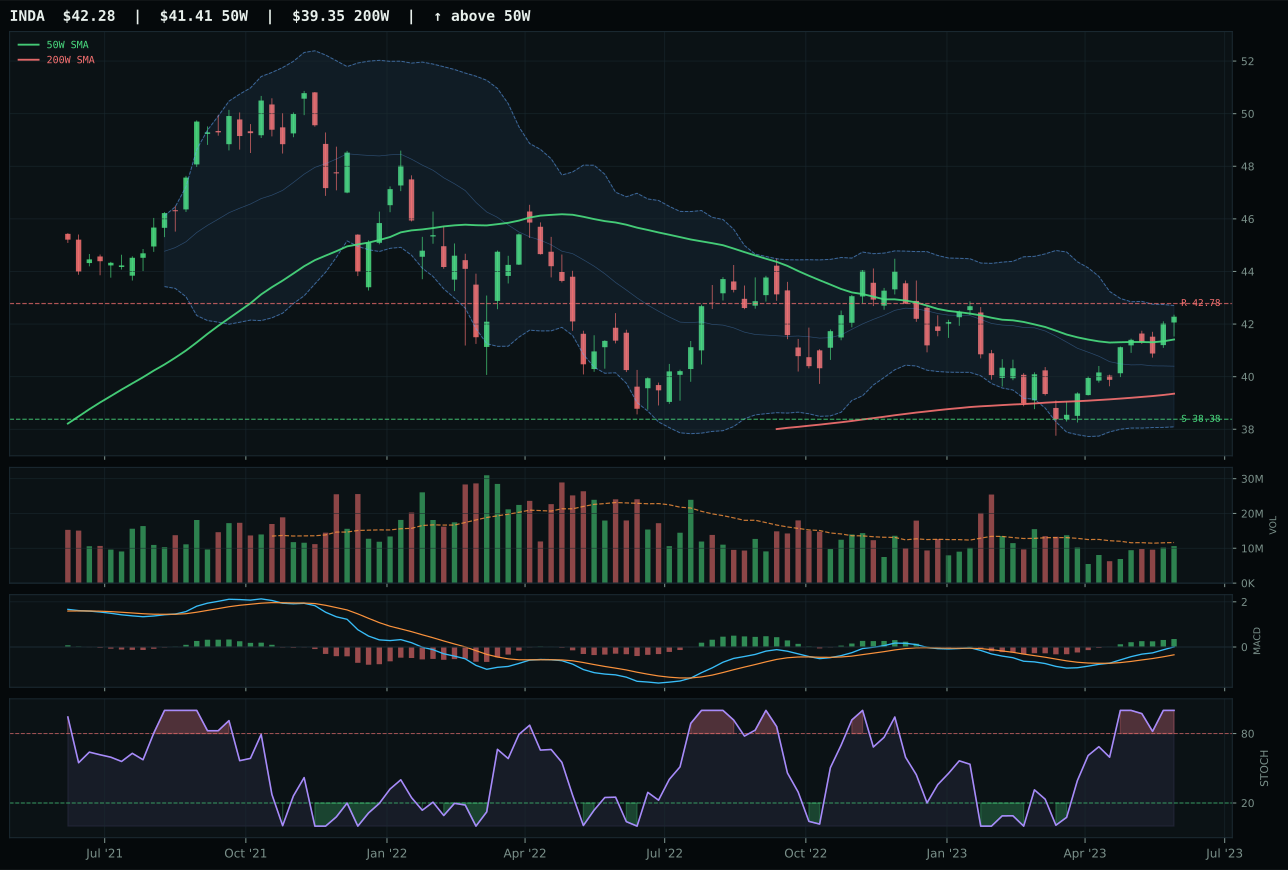
INDA has a compression near 50W profile with -0.4% 13-week relative strength versus SPY.
A failed hold above support would weaken the setup.
Actionable but governed by invalidation levels.
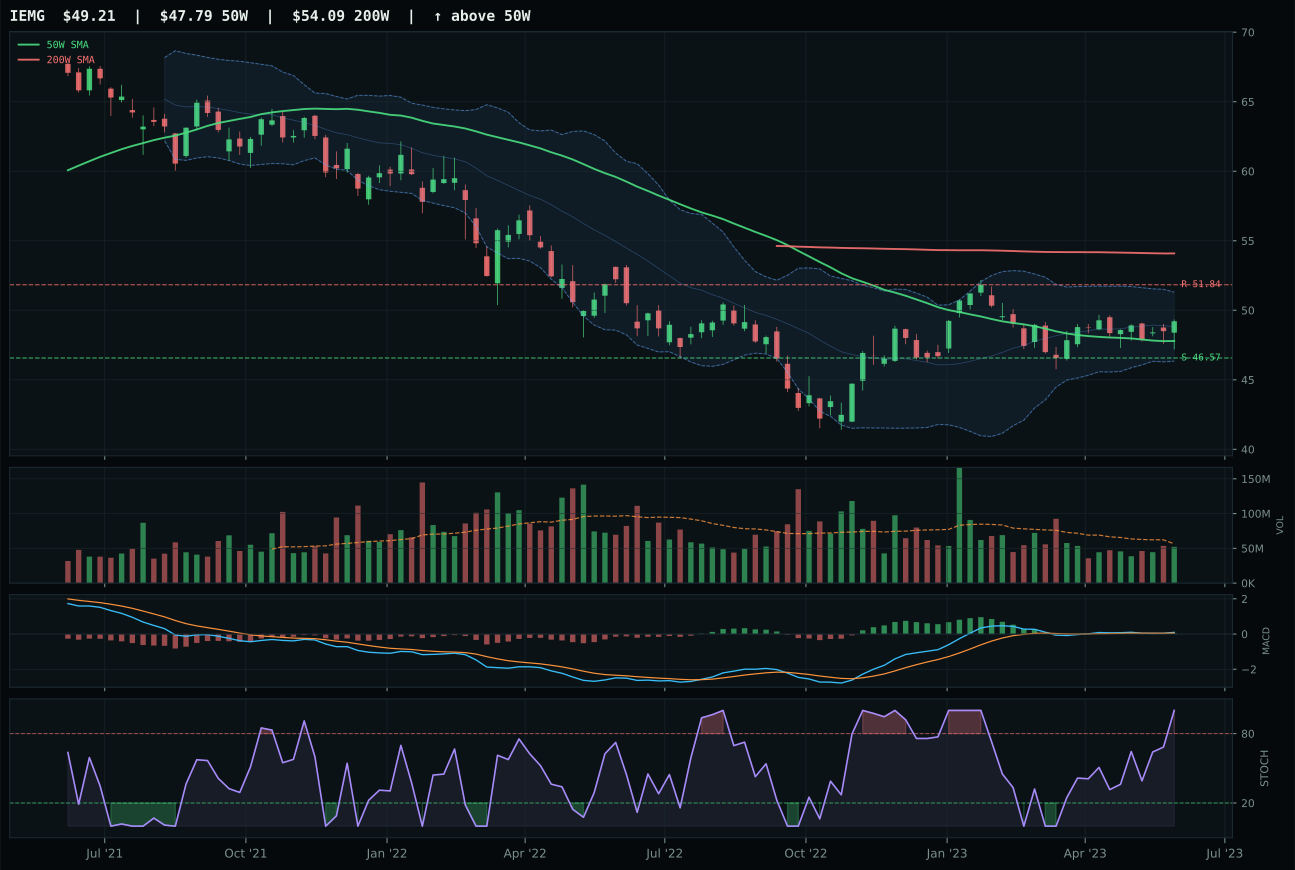
IEMG has a compression near 50W profile with -5.3% 13-week relative strength versus SPY.
A failed hold above support would weaken the setup.
Actionable but governed by invalidation levels.
INDA decisively beat ILF by a margin of 8.1 points, a large gap in a category where technical evidence is strong across the board. Both show above-average trend scores (INDA 89.4, ILF 81), both have bullish MACD and overbought stochastic RSI, both sit above all moving averages. INDA's 2.1% distance to the 50W with compression-near-50W structure yielded a perfect 100.0 timing score, whereas ILF's distance-to-50W of higher (neutral structure) scored only 75.0. The structure cleanliness gap favored INDA (66.7 vs 76.7 for compression), but the timing differential—compression implies accumulation coiling without extension risk—proved more important than cleanliness. INDA's category-relative strength of 0.0% matched ILF's 1.1%, neutralizing that advantage. Momentum confirmation for INDA (70.0/100) versus ILF (82/100) shows ILF had stronger recent returns (13W: 6.6% vs 5.5%), yet INDA's technical setup at the inflection point was preferred to ILF's extended position.
Emerging Markets earned 5% allocation in tier-2 with a final category score of 44.5, held in the portfolio despite macro fit concerns. The category-level macro fit is only 38.0/100—the lowest among tier-2 categories—due to credit stress at -10 and liquidity stress at -10 points. Risk appetite positive at +8 is insufficient to offset. In disinflation with rising credit stress, emerging markets face dual headwinds: slower growth reduces demand for EM exports, while risk-off sentiment drains liquidity from developing economies. INDA avoids this trap by being India-specific (quality-growth franchise with low commodity beta) rather than broad EM exposure, which is why it won despite the category's macro weakness. The allocation holds because INDA's compression-near-50W setup and 100.0 timing score signal that institutional buyers are accumulating at exactly the right technical spot—the 50W support level—not extended into expensive territory. The 89.4% trend score (price above 50W and 200W with shallow slope) shows durability without euphoria. Emergence of this position into strength is conditional: if credit stress reverses (risk appetite positive goes negative) or if INDA fails to hold the 50W, tier-2 status becomes indefensible. Currently, it's a technical trade on quality Asian growth, not a macro conviction.
Industrial Metals — COPX
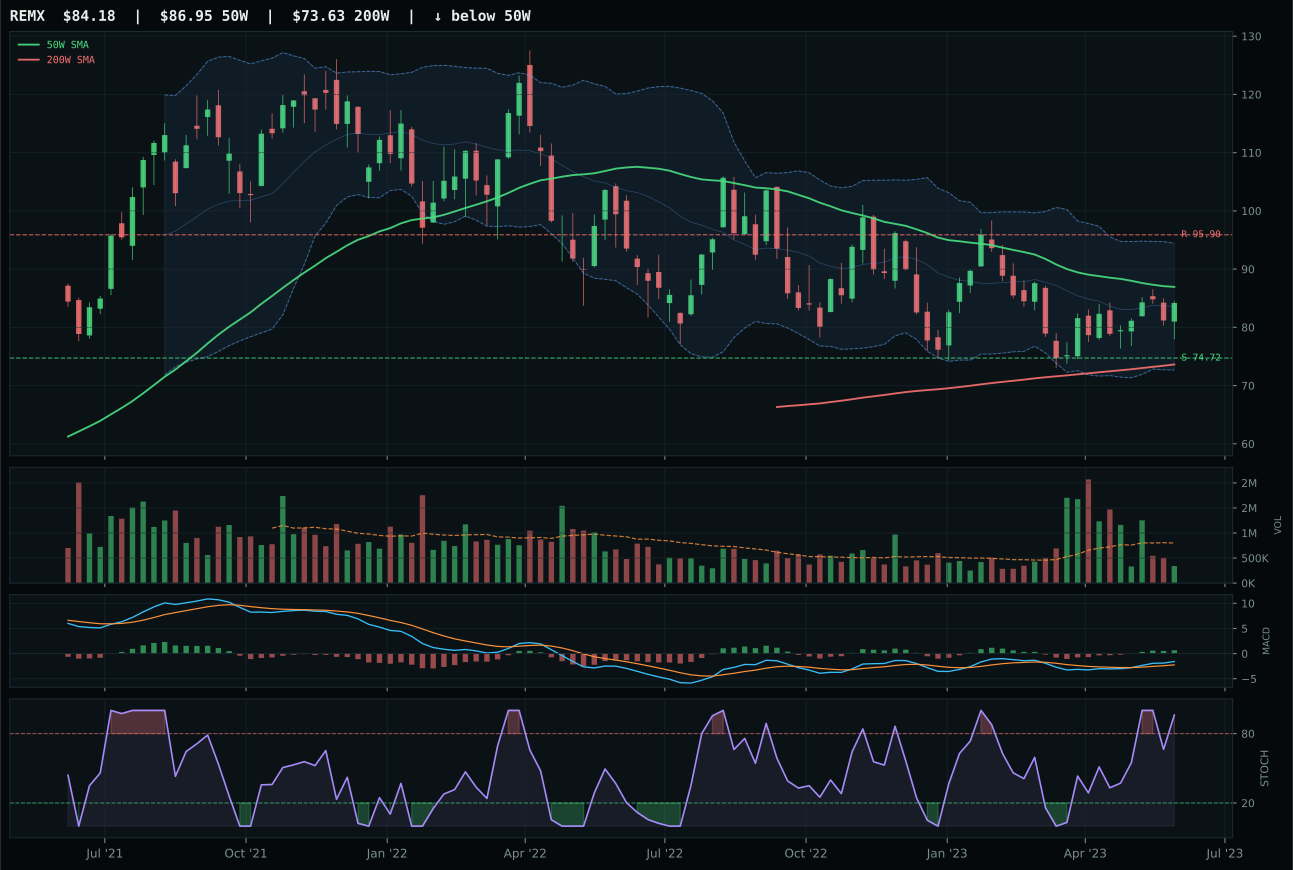
REMX has a neutral structure profile with -9.8% 13-week relative strength versus SPY.
A failed hold above support would weaken the setup.
Actionable but governed by invalidation levels.
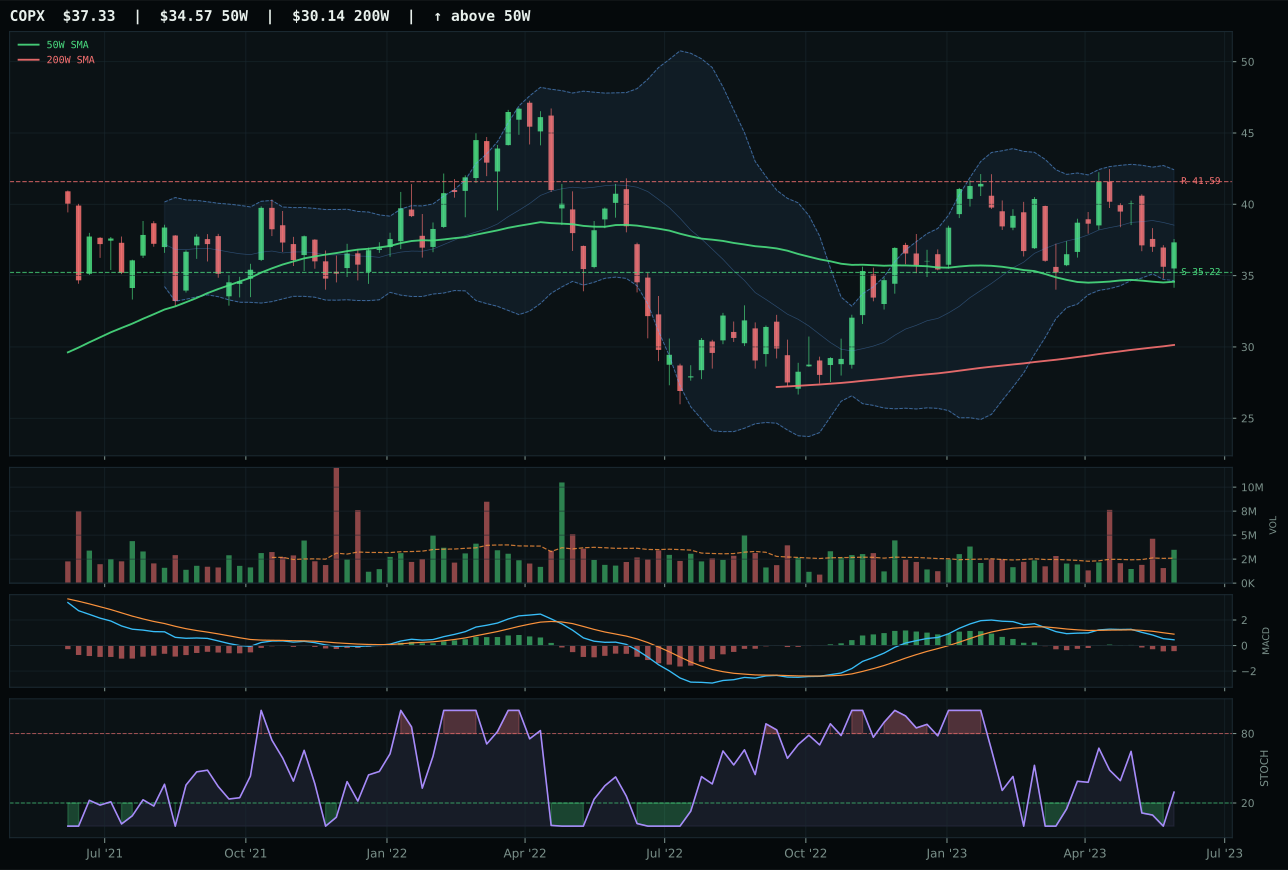
COPX has a neutral structure profile with -13.4% 13-week relative strength versus SPY.
A failed hold above support would weaken the setup.
Actionable but governed by invalidation levels.
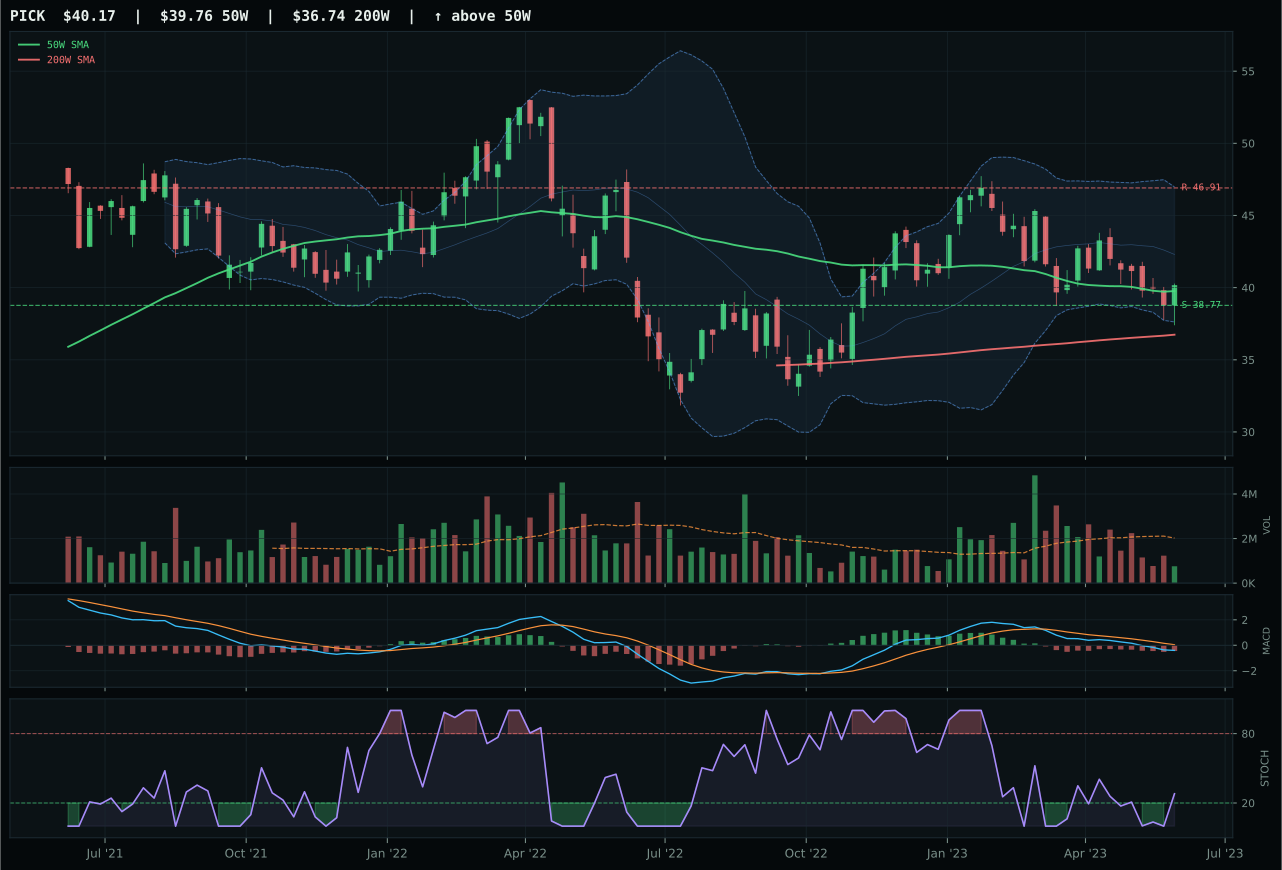
PICK has a pullback into support profile with -17.2% 13-week relative strength versus SPY.
A failed hold above support would weaken the setup.
Actionable but governed by invalidation levels.
COPX won industrial metals by defending better timing than REMX despite inferior momentum confirmation and technical evidence. Both ETFs sit in neutral structure above their 50W, both show bearish MACD, but COPX's 8.0% distance to the 50W and rising-mid-zone stochastic RSI (0.29) positioned it closer to the inflection point than REMX's overbought stochastic rolling over at a Fibonacci deep-retracement zone. COPX's risk-reward of 75.8/100 superior to REMX's 70.4/100 reflected tighter risk geometry: only 10.2% downside to support versus 6.0% upside potential, whereas REMX offered more skew. The volume advantage was decisive: COPX at above-average participation (1.33x 20W average) versus REMX at thin, meaning COPX's institutional buyers are present even as price stalls. Momentum confirmation collapsed for both (0.0 and 41 respectively), but COPX's macro fit of 62.0/100 beat REMX's 47.0, largely due to metals scarcity at +12 versus +9.
Industrial Metals earned 5% allocation in tier-2, justified by strong macro fit (65.0/100 category-level) despite weak technicals. Metals scarcity is active at +14, commodity breadth positive at +10, and real asset sponsorship at +6, creating a narrative tailwind that offsets negative momentum and weak SPY relative strength (-13.4% for COPX). The disinflation regime normally hurts industrial metals by crushing growth expectations and capex cycles, yet the category scored 65.0/100 on macro because scarcity and supply-chain tightness override the cyclical headwind—copper is constrained by mine depletion, rare earths by geopolitical supply concentration. COPX's -7.5% 13-week return and -13.4% relative strength tell the technical reality: this is a setup dependent entirely on mean-reversion to commodity levels supported by supply fundamentals, not momentum. Momentum confirmation is 0.0/100. The allocation exists because the macro narrative is strong and risk-reward at support levels is favorable (6.0% downside, 10.2% upside), making this a scarcity-play position for portfolio diversification. Exit if metals scarcity descriptor flips or if commodity breadth positive turns—without those, COPX is fighting structural headwinds from disinflation that will eventually weigh.
Defense & Aerospace — XAR
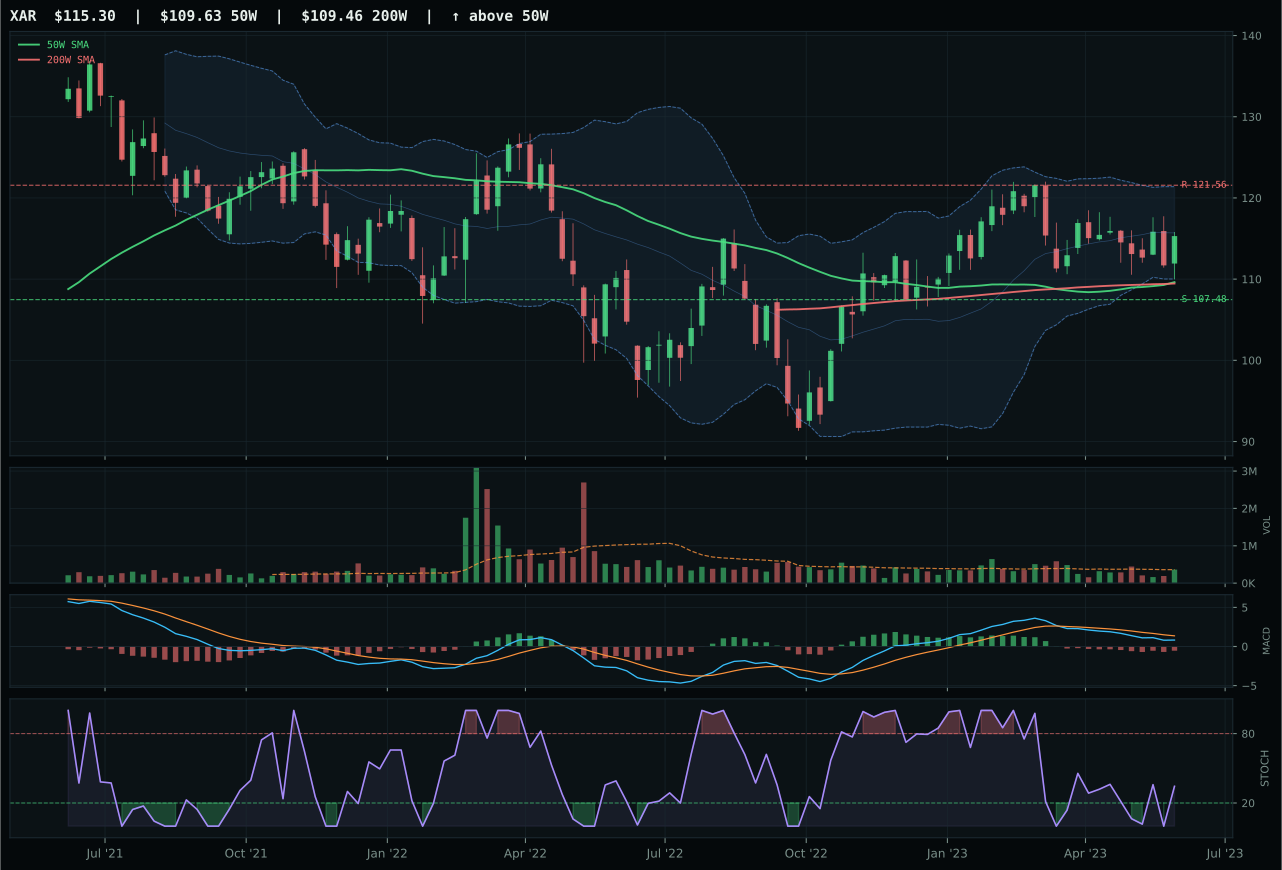
XAR has a neutral structure profile with -11.0% 13-week relative strength versus SPY.
A failed hold above support would weaken the setup.
Actionable but governed by invalidation levels.
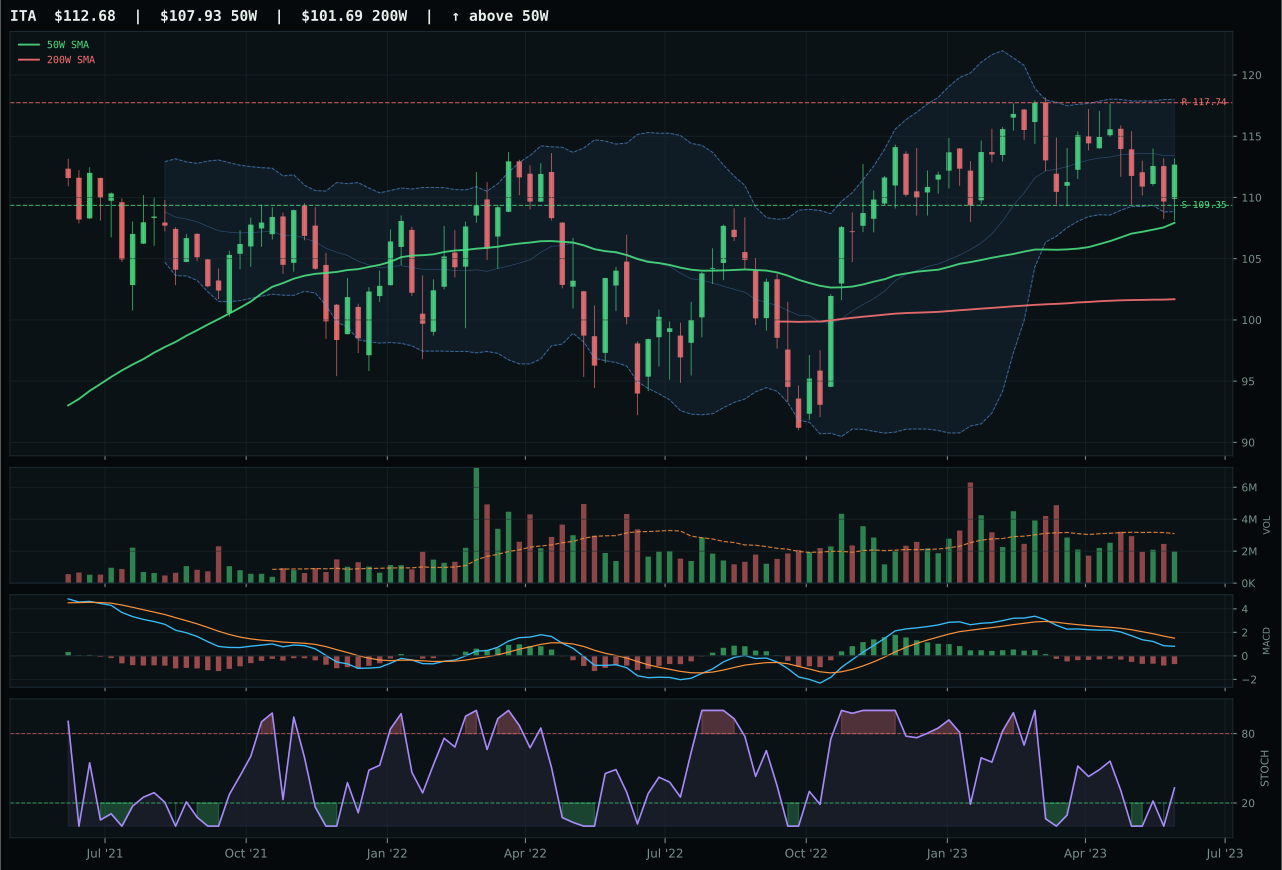
ITA has a pullback into support profile with -10.2% 13-week relative strength versus SPY.
A failed hold above support would weaken the setup.
Actionable but governed by invalidation levels.
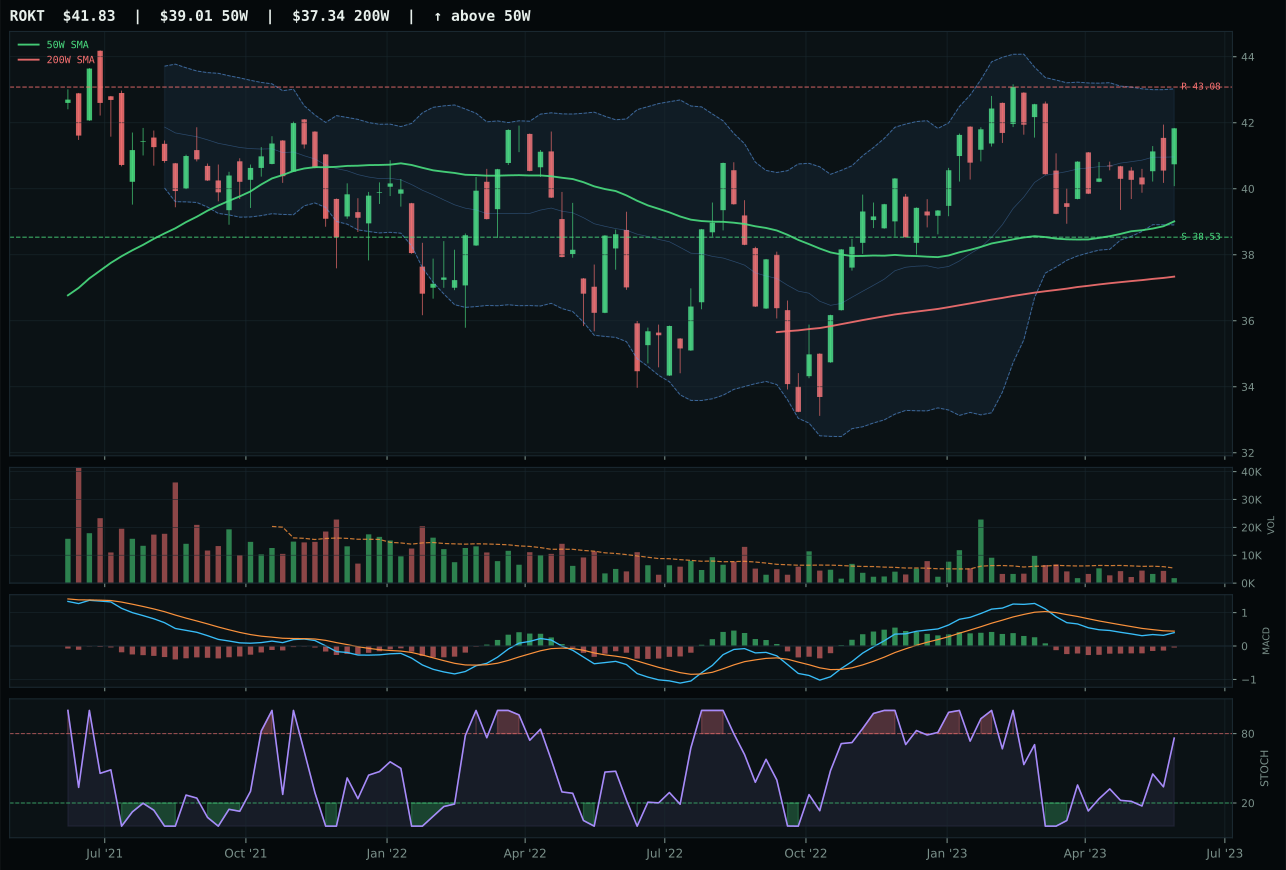
ROKT has a neutral structure profile with -7.6% 13-week relative strength versus SPY.
A failed hold above support would weaken the setup.
Tracked, but not top-2 eligible because: .
XAR won by being the least broken among three struggling candidates, a distinction that matters in tier-2 allocation. The category is uniformly weak—XAR's trend score of 78.0 against a -11.0% relative strength versus SPY marks the kind of setup where price is still above moving averages but buyers have checked out. XAR beat ITA (runner-up) because structure cleanliness was marginally better (71.6 vs 70.1), timing was superior (83.0 vs 100.0 for ITA, but ITA's 100.0 timing came from oversold stochastic and lower distance to 50W—a defensive setup, not a constructive one), and volume confirmation was neutral rather than thin. Momentum confirmation across all three ETFs was anemic: XAR at 30.9/100, ITA at 11/100, ROKT at 43/100. This is a category where the winner isn't winning by being strong but by failing to fail as badly as the competition.
Defense & Aerospace received 5% allocation despite its fourth-place ranking among eligible categories, a tier-2 commitment driven more by portfolio construction rules than conviction. The category score of 43.0 reflected weak technical evidence (58.8/100 for the winner) partially offset by neutral macro fit (51.0/100 on the category level) that weighted credit stress at +2 and liquidity stress at -4. In a disinflation regime, defensive sectors like aerospace typically underperform because falling growth expectations hurt capex cycles more than they help balance sheets—the macro isn't tailored to this category's needs. XAR's -5.1% 13-week return and -11.0% relative strength tell the story: capital allocation into defense is stalling in a rates-down environment, and the 5.2% distance to the 50W offers almost no cushion if support breaks. The allocation exists because tier-2 slots require some representation, and XAR's neutral structure and improving (though still bearish) MACD provide slightly more optionality than pure breakdown candidates. Watch for credit stress reversal or explicit geopolitical premium to justify holding—currently, this is a placeholder position pending macro regime shift.
Agriculture & Livestock — MOO
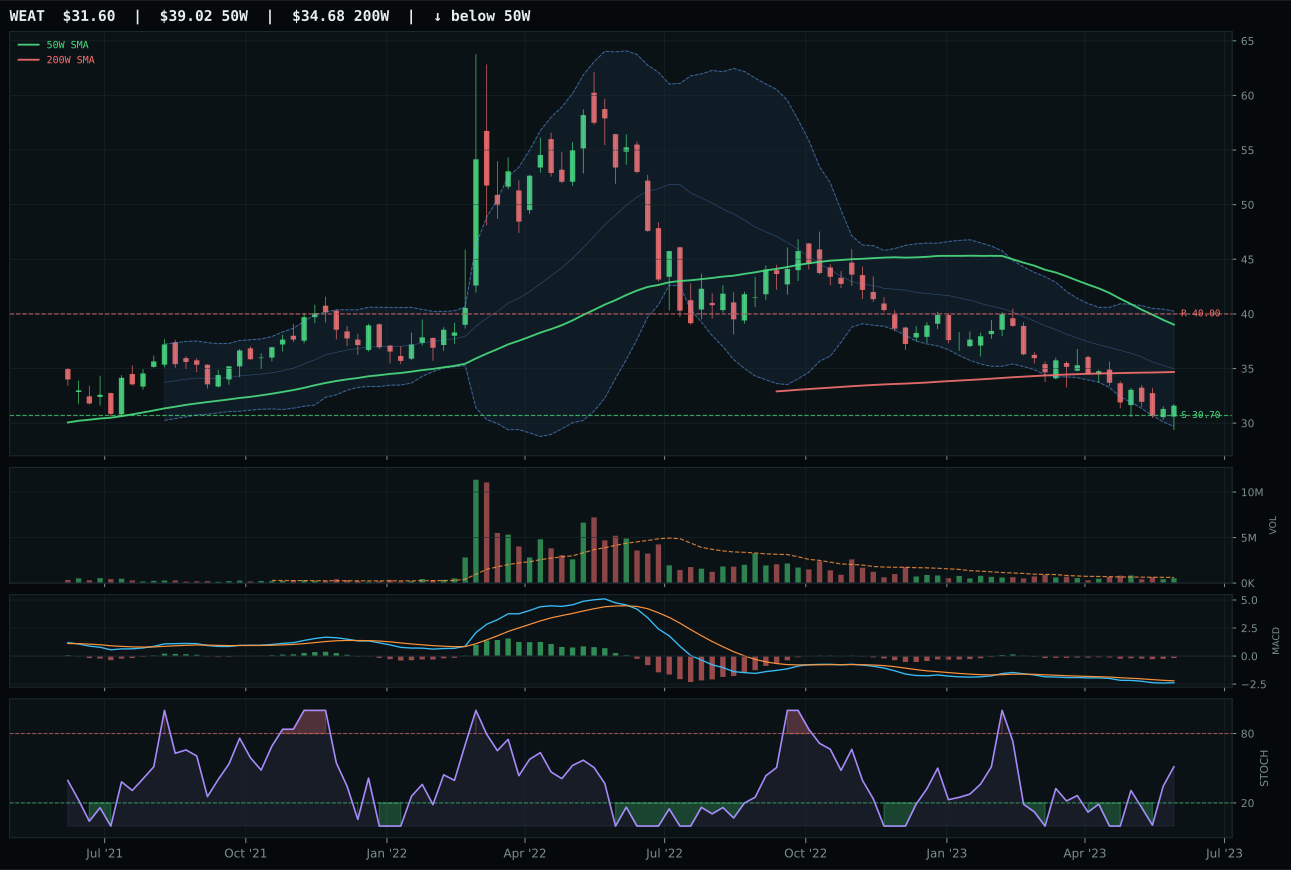
WEAT has a pullback into support profile with -18.0% 13-week relative strength versus SPY.
A failed hold above support would weaken the setup.
Actionable but governed by invalidation levels.
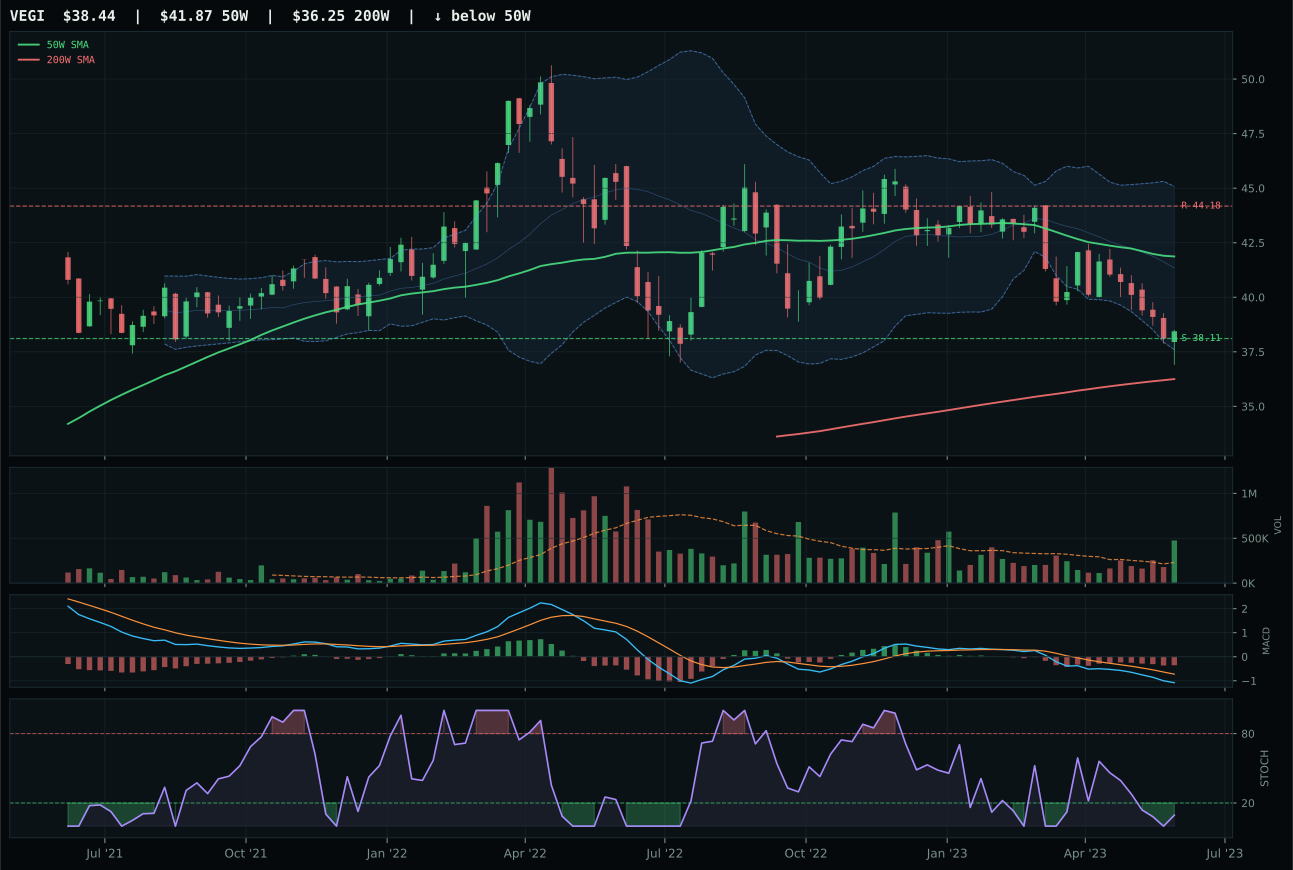
VEGI has a pullback into support profile with -18.7% 13-week relative strength versus SPY.
A failed hold above support would weaken the setup.
Tracked, but not top-2 eligible because: .
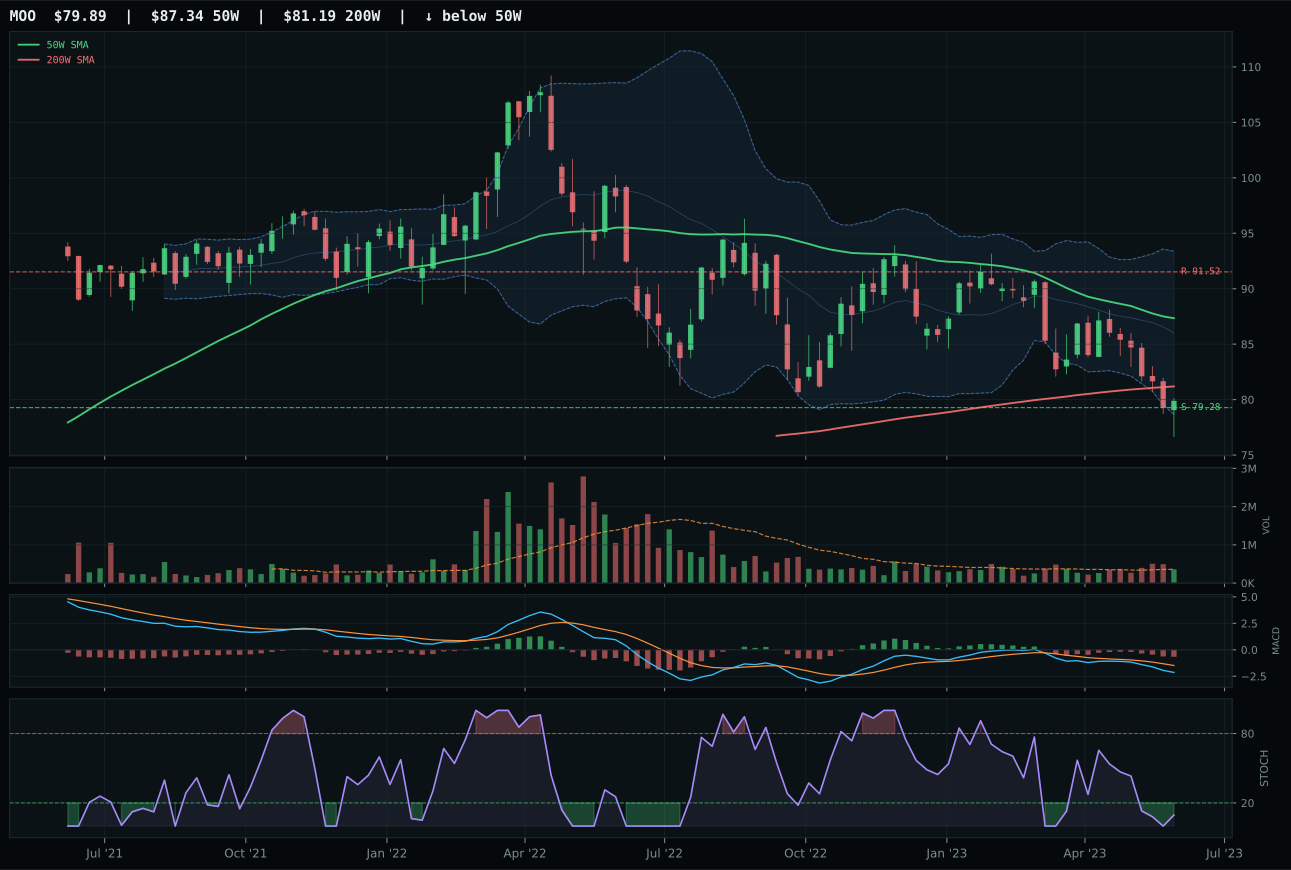
MOO has a pullback into support profile with -17.8% 13-week relative strength versus SPY.
A failed hold above support would weaken the setup.
Actionable but governed by invalidation levels.
MOO won the agriculture category in name only, claiming the title of first among weaklings with a 14.9 final score that earned 0% allocation. The category is in deep structural weakness: all three ETFs show price below their 50W and 200W, bearish MACD, and 13-week returns between -11.9% and -12.8%. MOO edged WEAT because its timing score was 7 points higher (80.0 vs 73.0), reflecting a pullback-into-support setup that is oversold at stochastic 0.10 rather than rising-mid-zone, and category-relative strength at +0.2% versus WEAT's flat 0.0%. Neither margin is meaningful. The real story is that agriculture category momentum is 0.0/100 across the board, volume participation collapsed, and even the best-positioned candidate (MOO) sits -8.5% below the 50W with -17.8% relative strength versus SPY.
Agriculture & Livestock received 0% allocation this week after ranking 9th or 10th among all eligible categories, disqualified by a final score of 14.9 that couldn't compete with any tier-2 threshold. The category-level macro fit scored 45.0/100—pulled lower by disinflation pressure at -8 and liquidity stress at -4, offset only partially by commodity breadth positive at +5 and real asset sponsorship at +8. In a disinflation regime with falling real yields and no growth sponsorship, agricultural commodity prices face a structural headwind: input costs decline, but so does demand across the global supply chain. MOO's -11.9% 13-week return and ITA's -12.1% return reflect this deterioration in real time. The oversold stochastic RSI (0.10 for MOO) and excellent risk-reward (90.0/100 upside to resistance) create a textbook mean-reversion candidate, but mean reversion requires a catalyst—either a supply shock or a sharp reversal in disinflation momentum. Neither is priced into this week's setup, making the category a watch-and-wait opportunity. Re-entry would require either commodity breadth positive to flip to negative (signaling supply concerns) or risk appetite to collapse (forcing defensive flows into real assets).
Traditional Energy — XLE
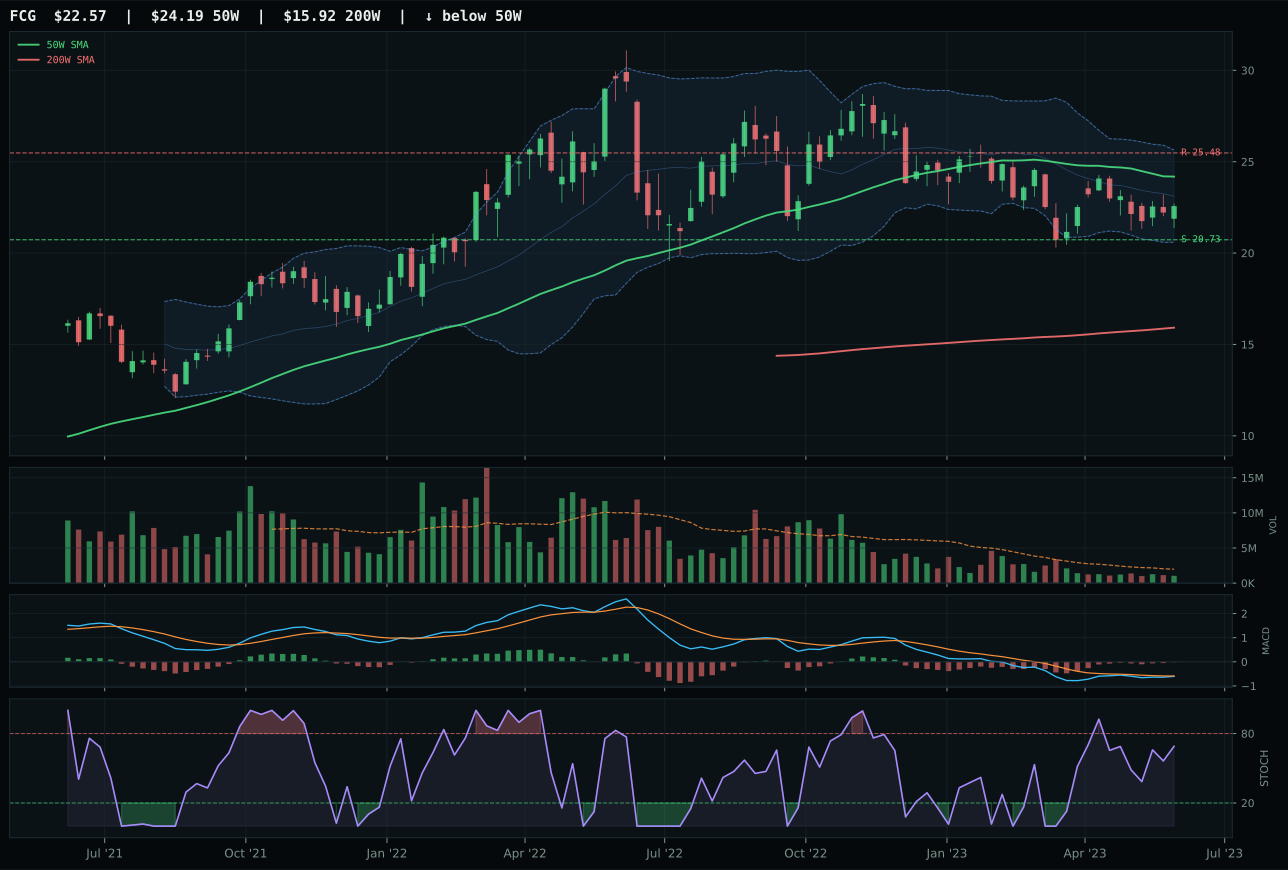
FCG has a neutral structure profile with -13.9% 13-week relative strength versus SPY.
A failed hold above support would weaken the setup.
Actionable but governed by invalidation levels.
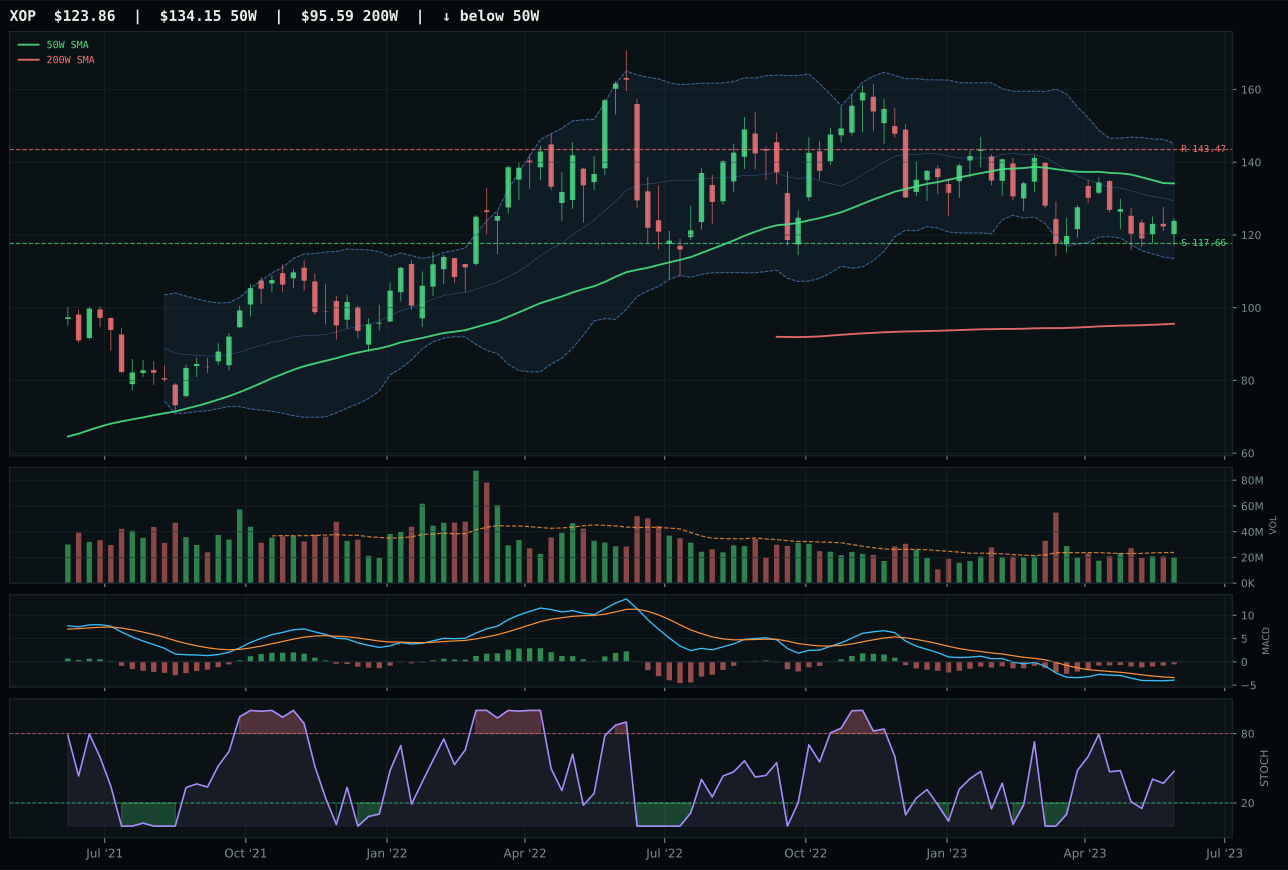
XOP has a neutral structure profile with -18.1% 13-week relative strength versus SPY.
A failed hold above support would weaken the setup.
Actionable but governed by invalidation levels.
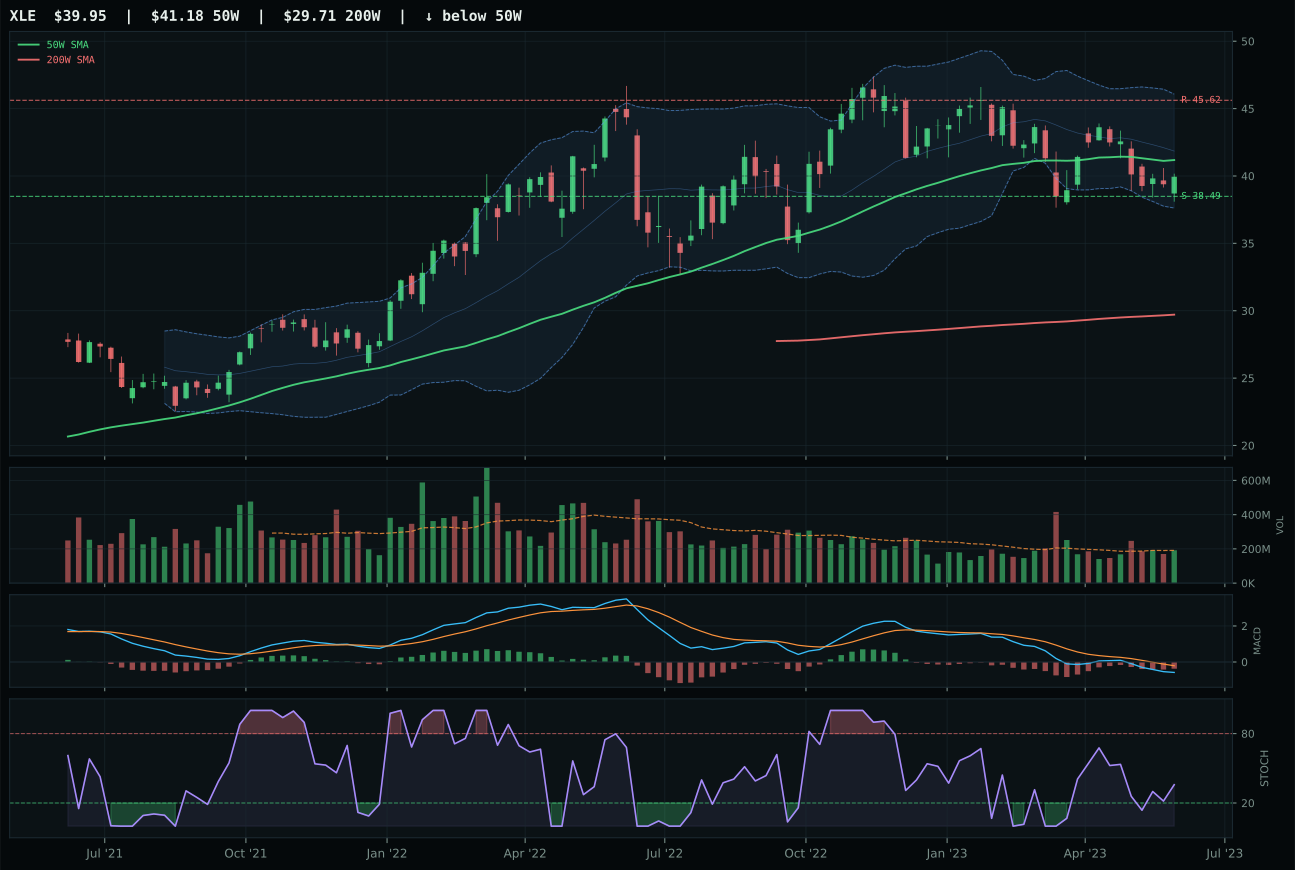
XLE has a pullback into support profile with -14.3% 13-week relative strength versus SPY.
A failed hold above support would weaken the setup.
Actionable but governed by invalidation levels.
XLE won traditional energy but earned 0% allocation, a distinction that clarifies how weak this entire category is. XLE beat FCG on timing (100.0 vs 90.0) and risk-reward (98.0 vs 76.2) because it sits 3.0% below the 50W in a pullback-into-support setup at the Fibonacci 0.500 midpoint—a textbook decision zone—versus FCG's neutral structure higher up. XLE's stochastic RSI at rising mid-zone (0.36) while MACD remains bearish/weakening created the superior timing setup: buyers are showing interest (rising RSI) but sellers haven't yet capitulated (MACD not yet bullish). The Fibonacci geography matters: XLE at 0.500 is the natural buyer's target, not yet deep retracement (0.618-0.786). However, XLE's 13-week return of -8.4%, -14.3% relative strength, and momentum confirmation at only 3.4/100 reveal the core problem: energy is broken regardless of setup quality.
Traditional Energy received 0% allocation this week after scoring 4.8 final points—dead last among all categories. Category-level macro fit is 23.0/100, the lowest across the entire portfolio, damaged by disinflation at -10 points and disinflation pressure at another -10 points. Energy prices collapse when growth expectations fall and rates drop, the exact scenario playing out in disinflation. Real asset sponsorship at +7 and real asset scarcity at +5 provide minimal offset. XLE's setup is technically pristine: defined support at 38.49, defined resistance at 45.62, ratio of 3.8% downside to 12.4% upside, and timing at 100.0/100. Yet technical perfection cannot overcome macro annihilation—this is precisely when mean-reversion setups fail because the reversal never comes. Energy will return to the allocation when either disinflation pressure flips or real asset sponsorship becomes urgent (inflation surprise, supply shock, geopolitical premium). Currently, it is structurally excluded from capital flows in an environment where central banks are fighting inflation backwards and oil demand is sticky-downward from slower growth. Watch XLE's support at 38.49; a break below closes the mean-reversion narrative entirely.