
2023-05-26
Informational purposes only. The content in this report, including allocations, analysis, and commentary, is provided solely for informational and educational purposes. It does not constitute financial advice, investment advice, trading advice, or any other type of advice. Past performance does not guarantee future results. Always conduct your own research and consult a qualified financial professional before making investment decisions.
Weekly Allocation
| Ticker | Category | Weight | Role |
|---|---|---|---|
| FBTC | 50% | Overlay | |
| CIBR | Technology | 10% | Top-2 (10%) |
| SMH | AI | 10% | Top-2 (10%) |
| GLD | Precious Metals | 5% | Tier-2 (5%) |
| PAVE | Utilities & Infrastructure | 5% | Tier-2 (5%) |
| INDA | Emerging Markets | 5% | Tier-2 (5%) |
| URA | Nuclear Energy | 5% | Tier-2 (5%) |
| XAR | Defense & Aerospace | 5% | Tier-2 (5%) |
| XLE | Traditional Energy | 5% | Tier-2 (5%) |
Trade Instructions — Monday Open
Sell the tranche from 2023-04-28 (completing its 4-week hold). Buy the new tranche. Instructions show net portfolio changes — same-asset positions cancel, weight changes show the delta.
| Action | Ticker | Instruction |
|---|---|---|
| SELL | GLD | Sell 12% of GLD position (reduce 10.00% → 8.75%) |
| SELL | IGF | Sell entire IGF position (2.50% of portfolio) |
| SELL | XLK | Sell 25% of XLK position (reduce 5.00% → 3.75%) |
| SELL | COPX | Sell 25% of COPX position (reduce 5.00% → 3.75%) |
| SELL | ITA | Sell entire ITA position (1.25% of portfolio) |
| SELL | BOTZ | Sell 50% of BOTZ position (reduce 2.50% → 1.25%) |
| SELL | ILF | Sell 50% of ILF position (reduce 2.50% → 1.25%) |
| BUY | PAVE | Buy PAVE — 12.50% of freed cash (adds 1.25% to portfolio) |
| BUY | XAR | Buy XAR — 12.50% of freed cash (adds 1.25% to portfolio) |
| BUY | INDA | Buy INDA — 12.50% of freed cash (adds 1.25% to portfolio) |
| BUY | XLE | Buy XLE — 12.50% of freed cash (adds 1.25% to portfolio) |
| BUY | SMH | Buy SMH — 25.00% of freed cash (adds 2.50% to portfolio) |
| BUY | CIBR | Buy CIBR — 25.00% of freed cash (adds 2.50% to portfolio) |
Current Portfolio After Trade
Combined holdings across all 4 active tranches. Each tranche is 25% of the portfolio.
| Ticker | % of Portfolio | Weight Bar |
|---|---|---|
| FBTC | 50.00% | |
| GLD | 8.75% | |
| PAVE | 8.75% | |
| XAR | 5.00% | |
| XLK | 3.75% | |
| COPX | 3.75% | |
| INDA | 3.75% | |
| SMH | 3.75% | |
| URA | 2.50% | |
| URNM | 2.50% | |
| XLE | 2.50% | |
| CIBR | 2.50% | |
| BOTZ | 1.25% | |
| ILF | 1.25% |
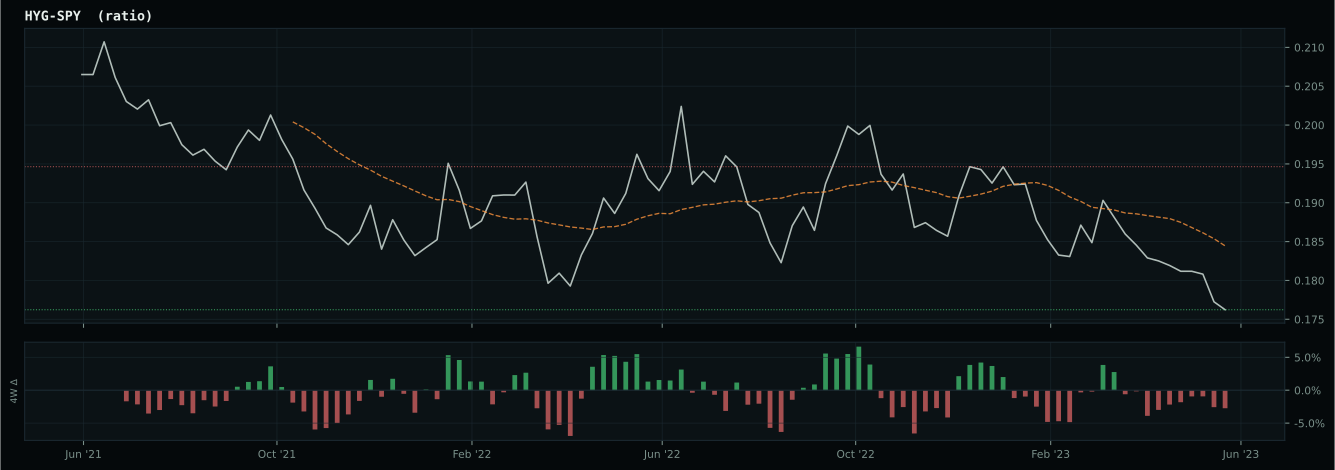
Macro Regime — Disinflation
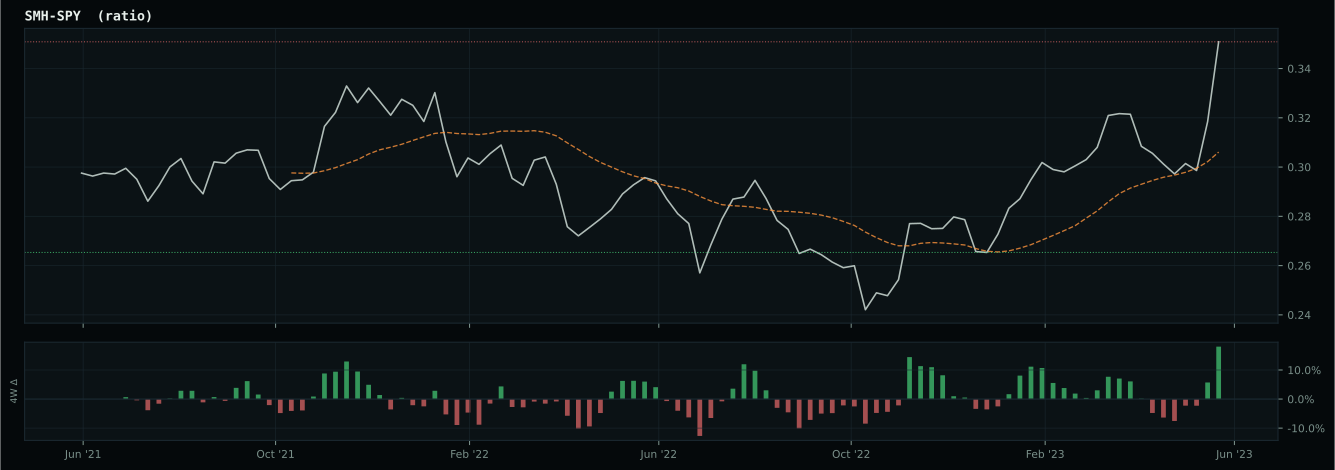
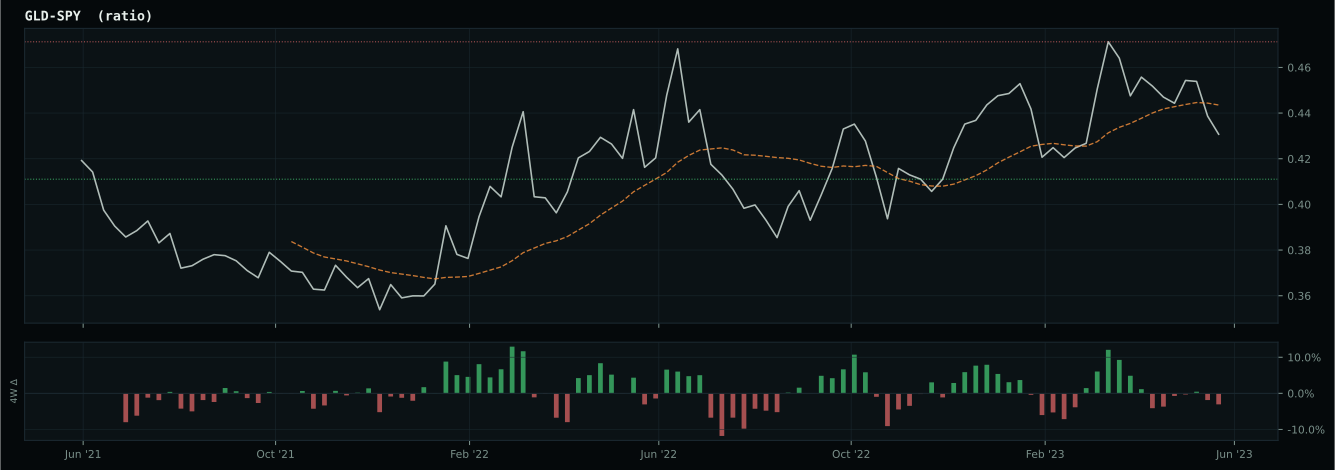
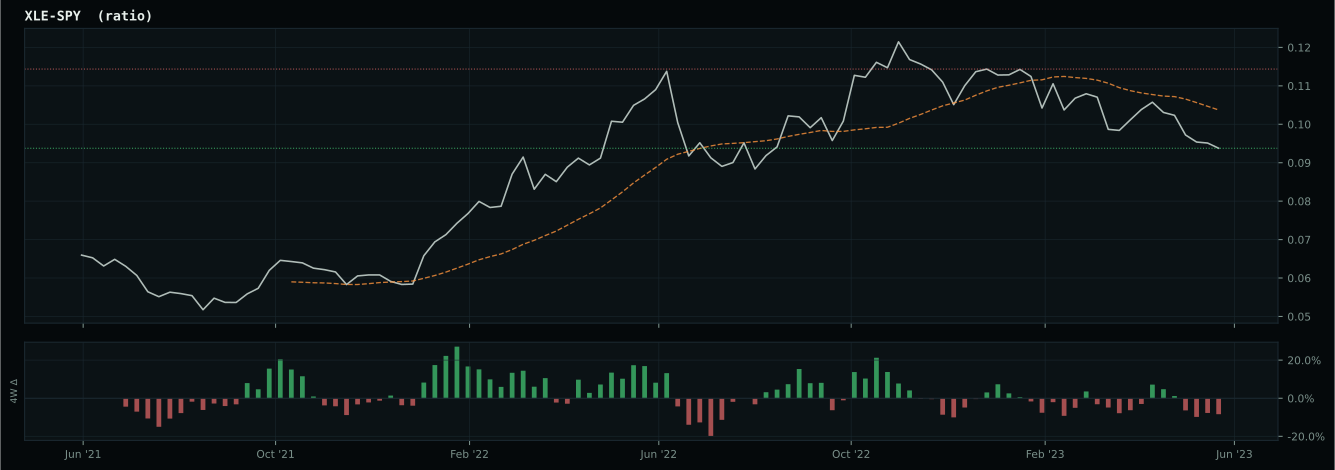
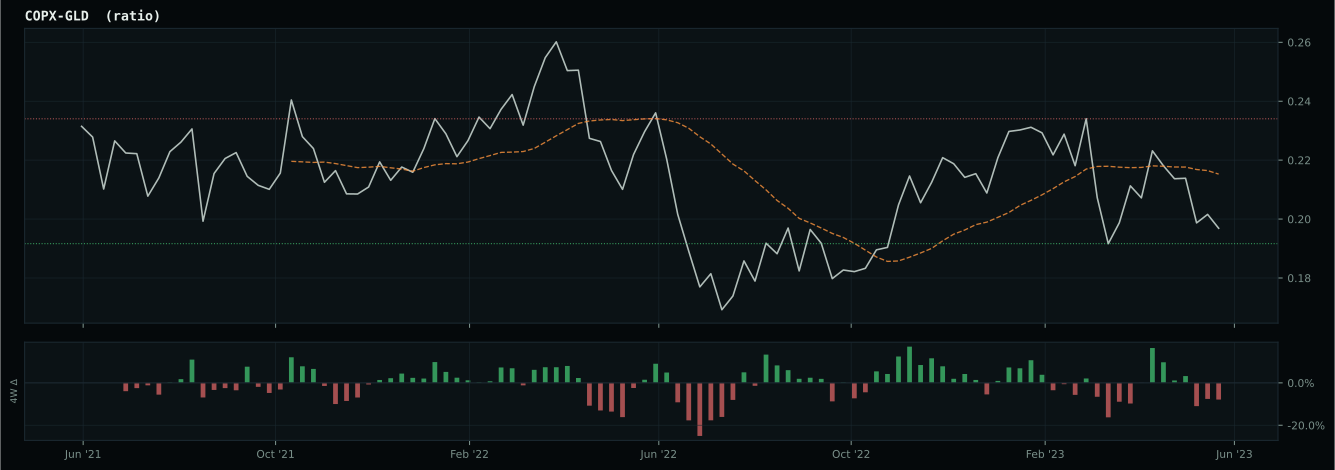
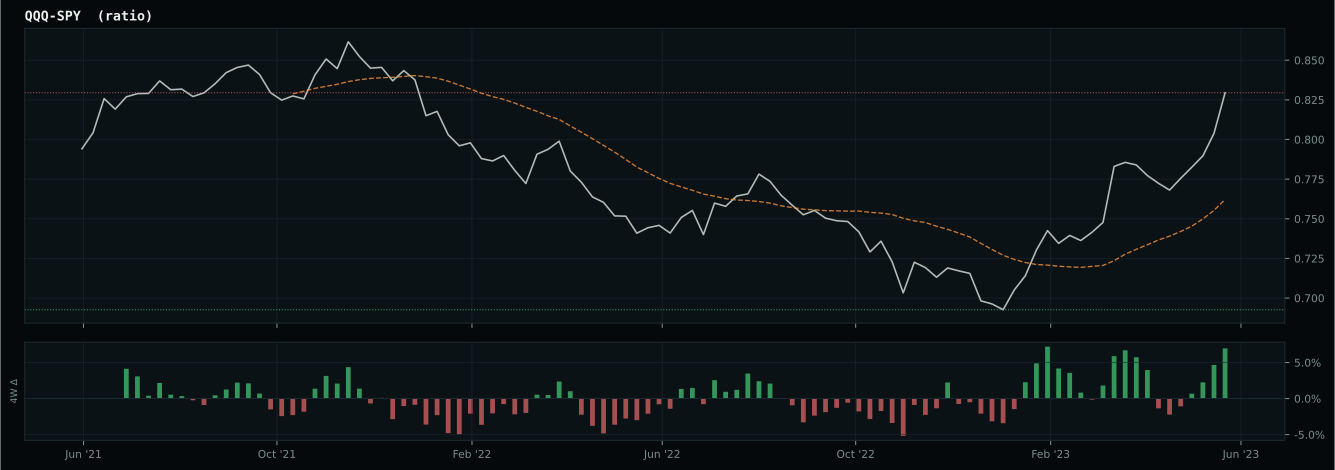
Macro Evidence Charts
Market-implied signals behind the macro regime scores. Each ratio compares two assets; the direction and slope of the ratio is what the macro engine reads.
Crypto Regime — TrendBTC
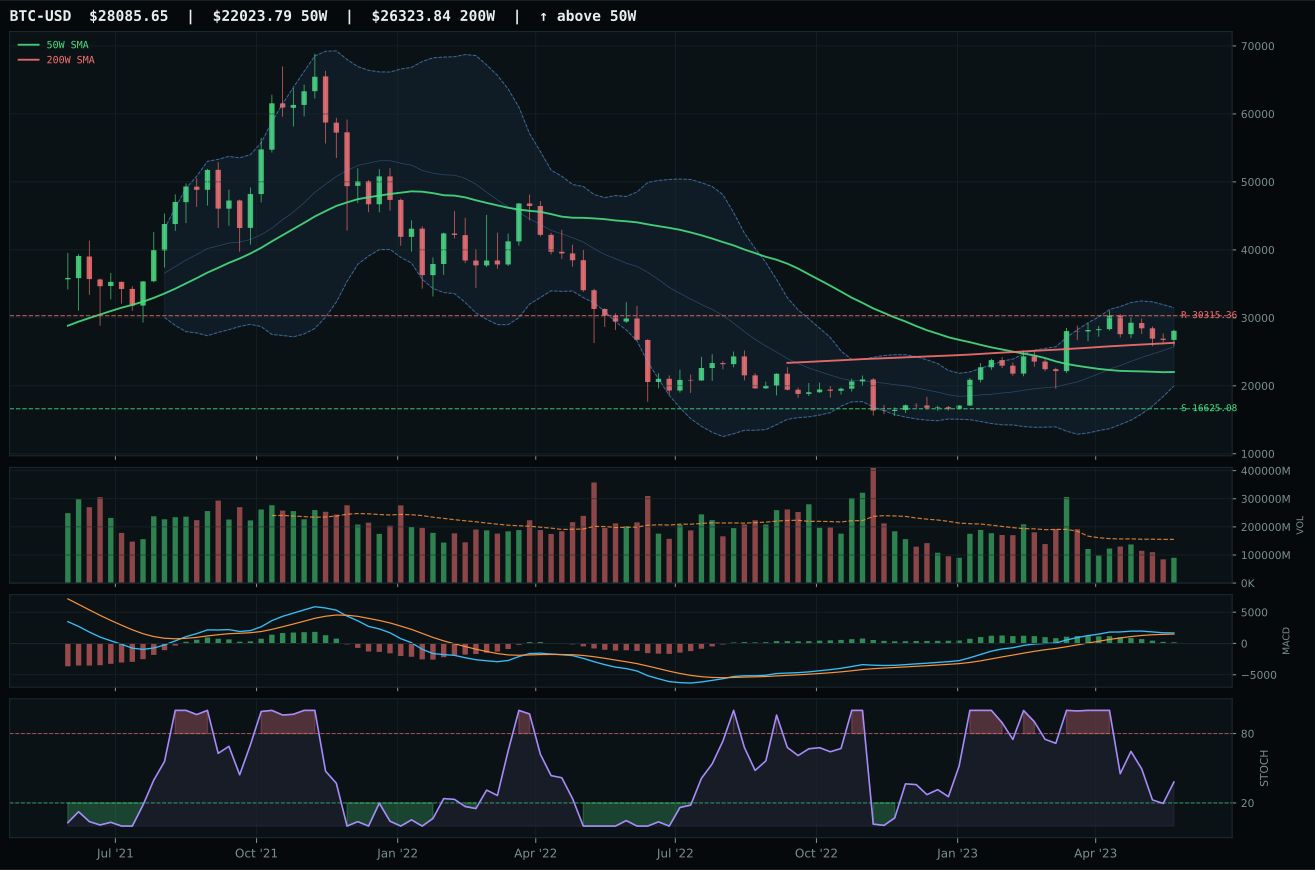
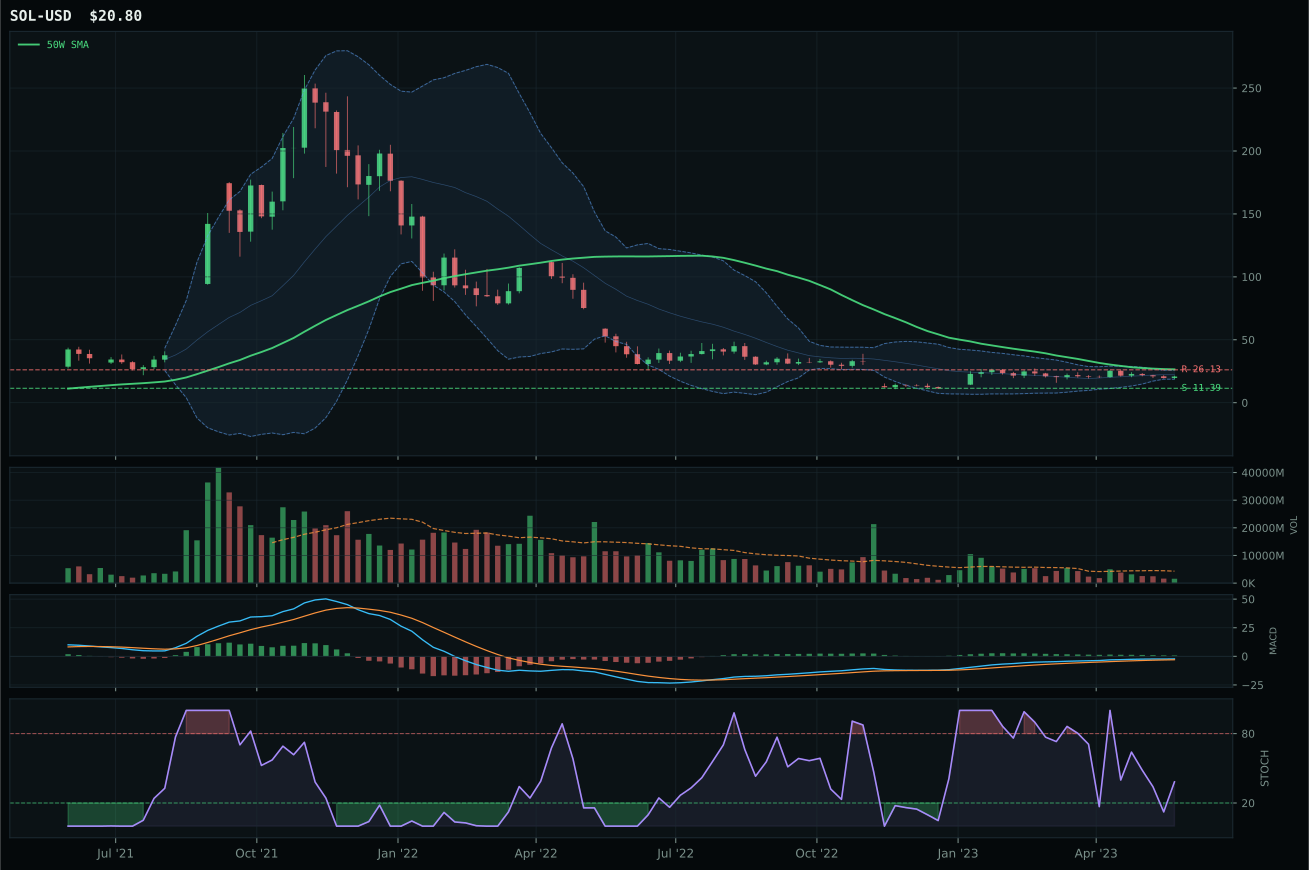
post-touch structure is too wide to count as a range; max/min close ratio is 1.86
TrendBTC confirmed: 2 consecutive closes above rising/flat 50W SMA
one or more available conditions failed
Category Rankings
| Rank | Category | Winner | Score | Alloc | 4W Ret | Peers (4W) |
|---|---|---|---|---|---|---|
| 1 | Technology | CIBR | 69.6 | 20% | -0.59% | XLK +1.0% · IGV +2.1% |
| 2 | AI | SMH | 67.0 | 20% | -1.57% | BOTZ +0.6% · AIQ +3.7% |
| 3 | Precious Metals | GLD | 47.8 | 10% | -1.47% | SLV -1.9% · GDX -1.8% |
| 4 | Utilities & Infrastructure | PAVE | 43.6 | 10% | +7.63% | IGF -0.6% · XLU +0.7% |
| 5 | Emerging Markets | INDA | 41.3 | 10% | +1.74% | ILF +7.4% · IEMG +1.2% |
| 6 | Nuclear Energy | URA | 35.9 | 10% | +8.41% | URNM +9.7% · NLR +8.0% |
| 7 | Defense & Aerospace | XAR | 34.7 | 10% | +5.17% | ITA +3.2% · ROKT +4.2% |
| 8 | Industrial Metals | COPX | 13.6 | 10% | +5.49% | REMX +0.0% · PICK +2.4% |
| 9 | Agriculture & Livestock | WEAT | — | 0% | +20.42% | VEGI +3.4% · MOO +2.0% |
| 10 | Traditional Energy | XLE | — | 0% | +0.13% | FCG +1.9% · XOP +1.5% |
Technology — CIBR
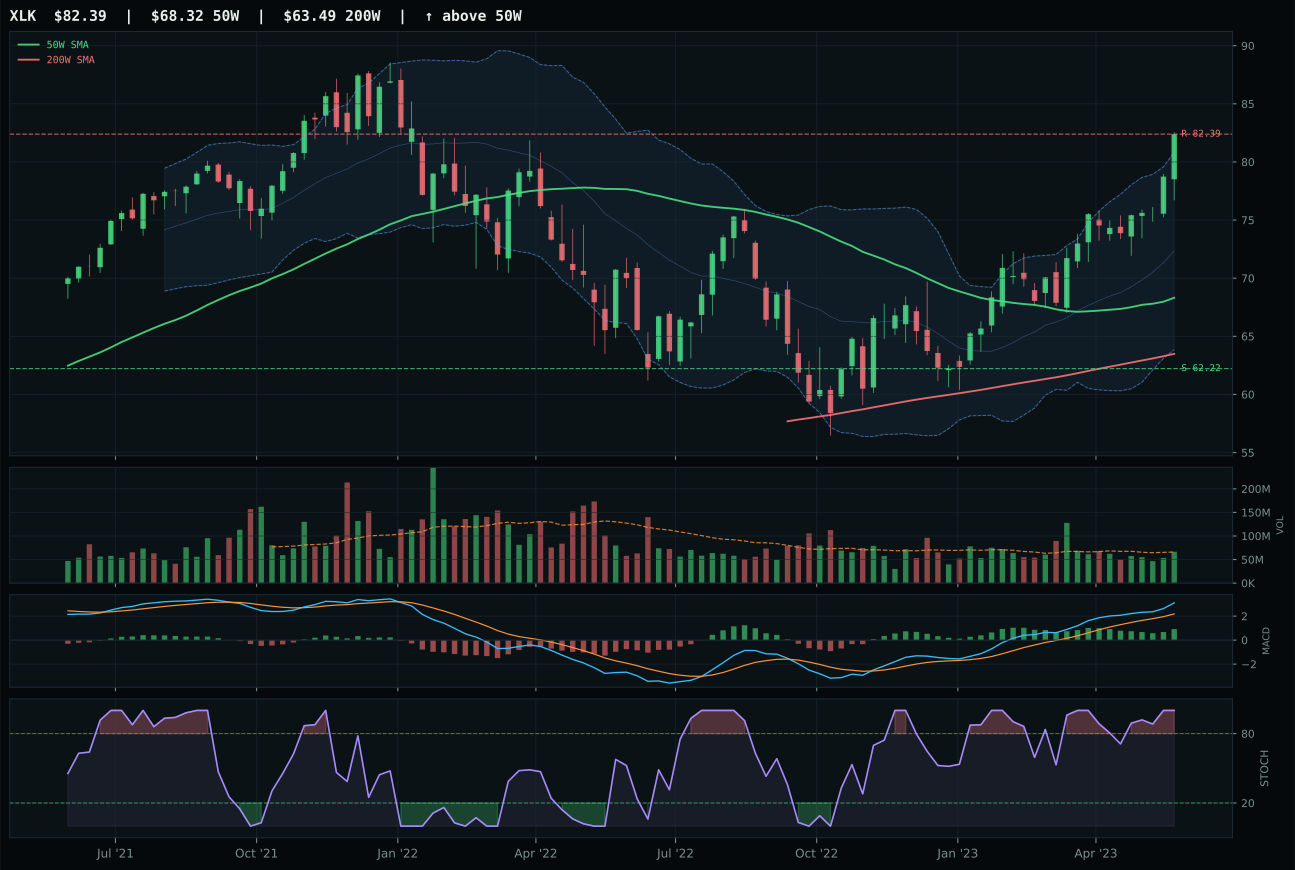
XLK has a vertical extension profile with 15.1% 13-week relative strength versus SPY.
A failed hold above support would weaken the setup.
Actionable but governed by invalidation levels.
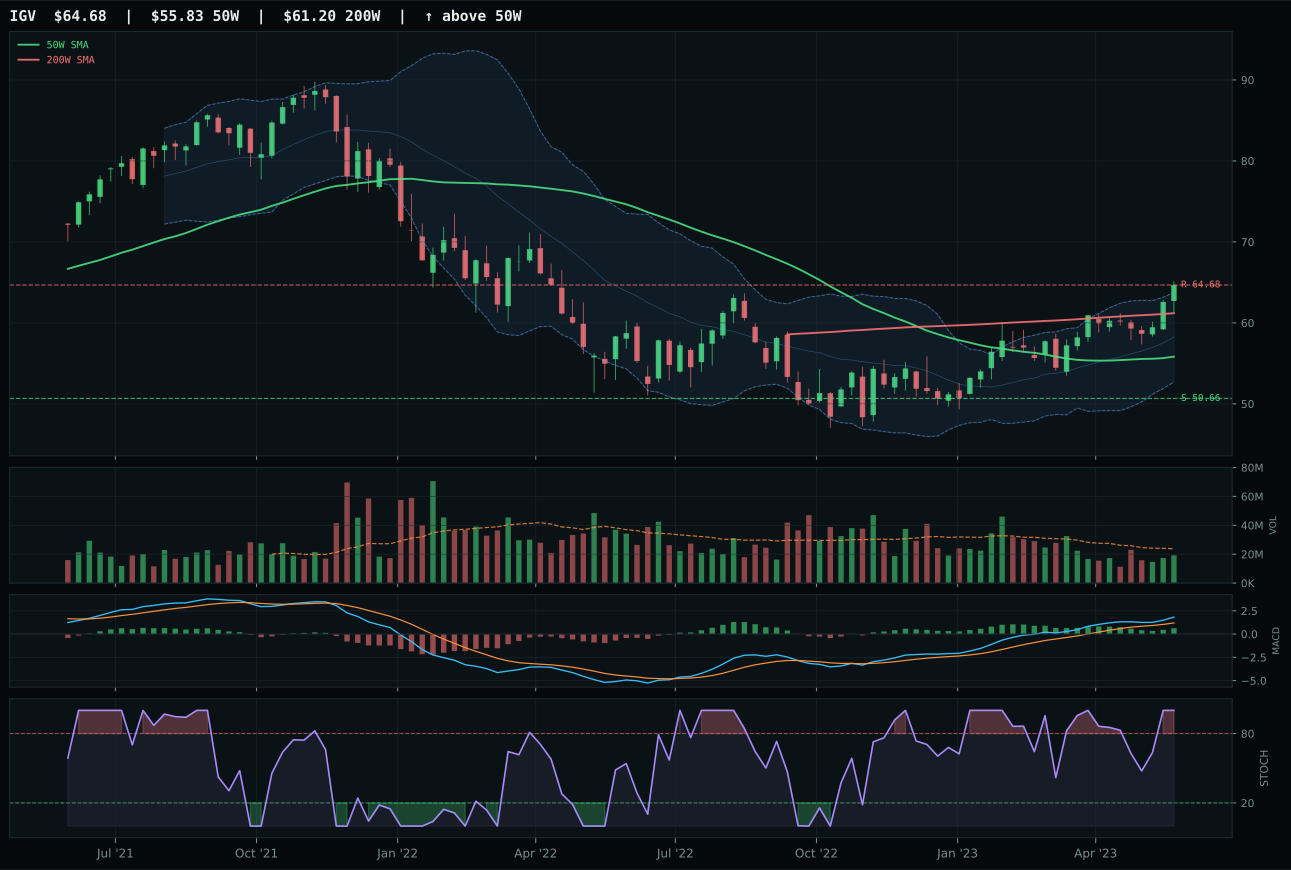
IGV has a vertical extension profile with 10.2% 13-week relative strength versus SPY.
A failed hold above support would weaken the setup.
Actionable but governed by invalidation levels.
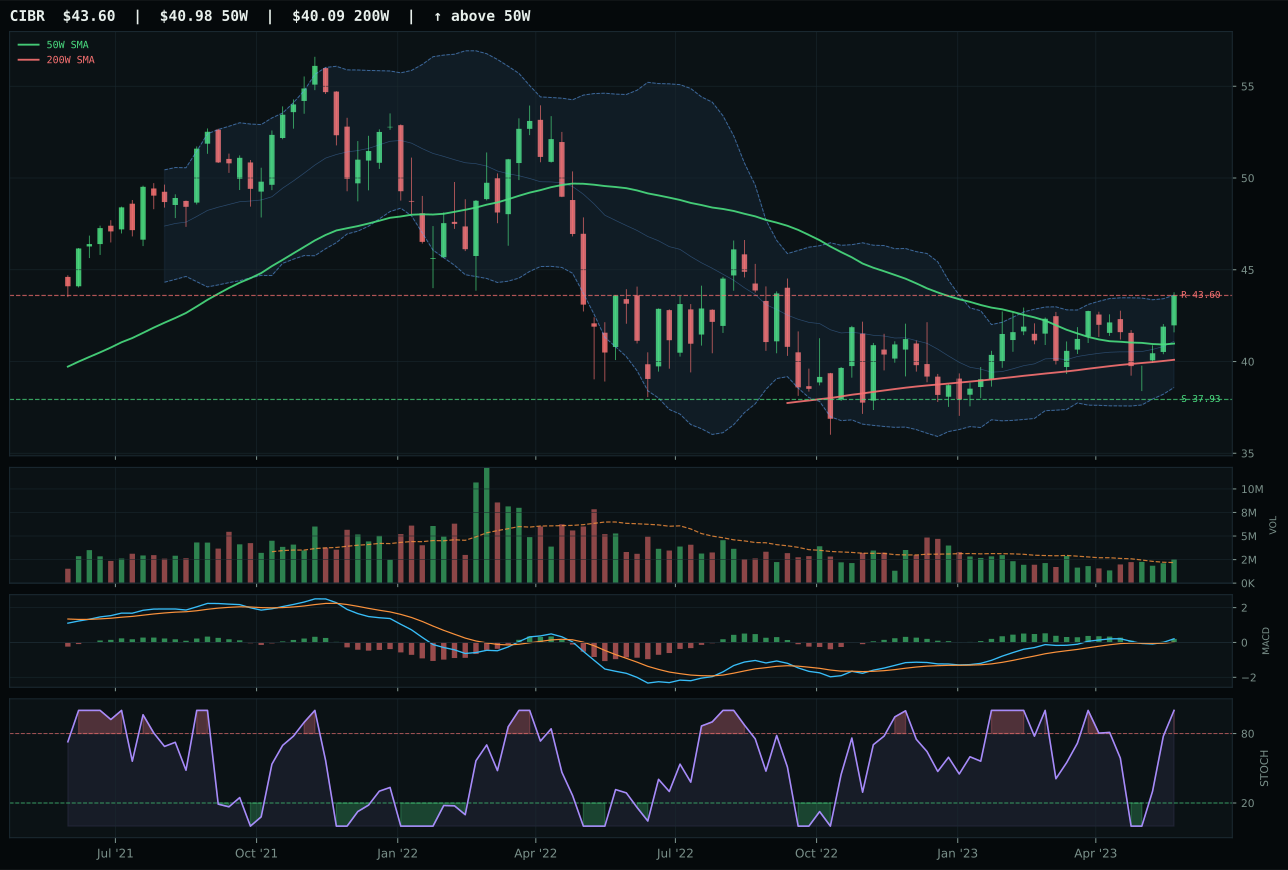
CIBR has a neutral structure profile with -0.0% 13-week relative strength versus SPY.
A failed hold above support would weaken the setup.
Actionable but governed by invalidation levels.
CIBR wins the category by combining a near-perfect trend alignment with defensive positioning that maximizes entry quality over chase momentum. Price sits just 6.4% above the 50-week moving average with a slope holding steady at 0.1%, creating a setup where new money entering at current levels faces minimal extension risk—this is why timing scores 75 versus 37 for runner-up XLK, which trades 20.6% above its 50W and sits near 52-week highs. The relative strength picture tells the story: CIBR is flat versus SPY at -0.0%, while XLK's 15.1% outperformance means every macro shift toward caution punishes the premium valuation. Volume at 1.17x the 20-week average confirms accumulation rather than distribution, and the MACD remains bullish and improving despite overbought stochastic RSI readings. The category-relative strength edge of 5.9% over XLK's 4.9% means cybersecurity specialists are winning capital allocation inside their own peer set.
Technology earned 10% allocation as the higher-ranked of two top-2 overweight categories this week, reflecting a disinflation macro backdrop that paradoxically supports information technology durability while pressuring capital-cycle spending. The category scored 69.6 on technical evidence (75.9/100) and macro fit (48.0/100), landing it firmly in the two best risk-adjusted opportunities available across all 10 sleeves. Credit stress is active and liquidity stress is active, both headwinds, yet disinflation itself adds 7 points and AI growth sponsorship contributes 6, creating a mixed but resilient narrative—defensive alpha in a regime where real yields stay sticky and price discovery stays painful. The 50% crypto overlay halves normal allocation tiers, making this 10% slot carry meaningful portfolio weight despite the sizing constraint. What sustains this category at top-2 rather than falling to tier-2 is the combination of clean entry risk (CIBR's proximity to its 50W) and breadth support from AI-adjacent infrastructure, both of which fade quickly if disinflation narratives reverse or credit stress widens meaningfully.
AI — SMH
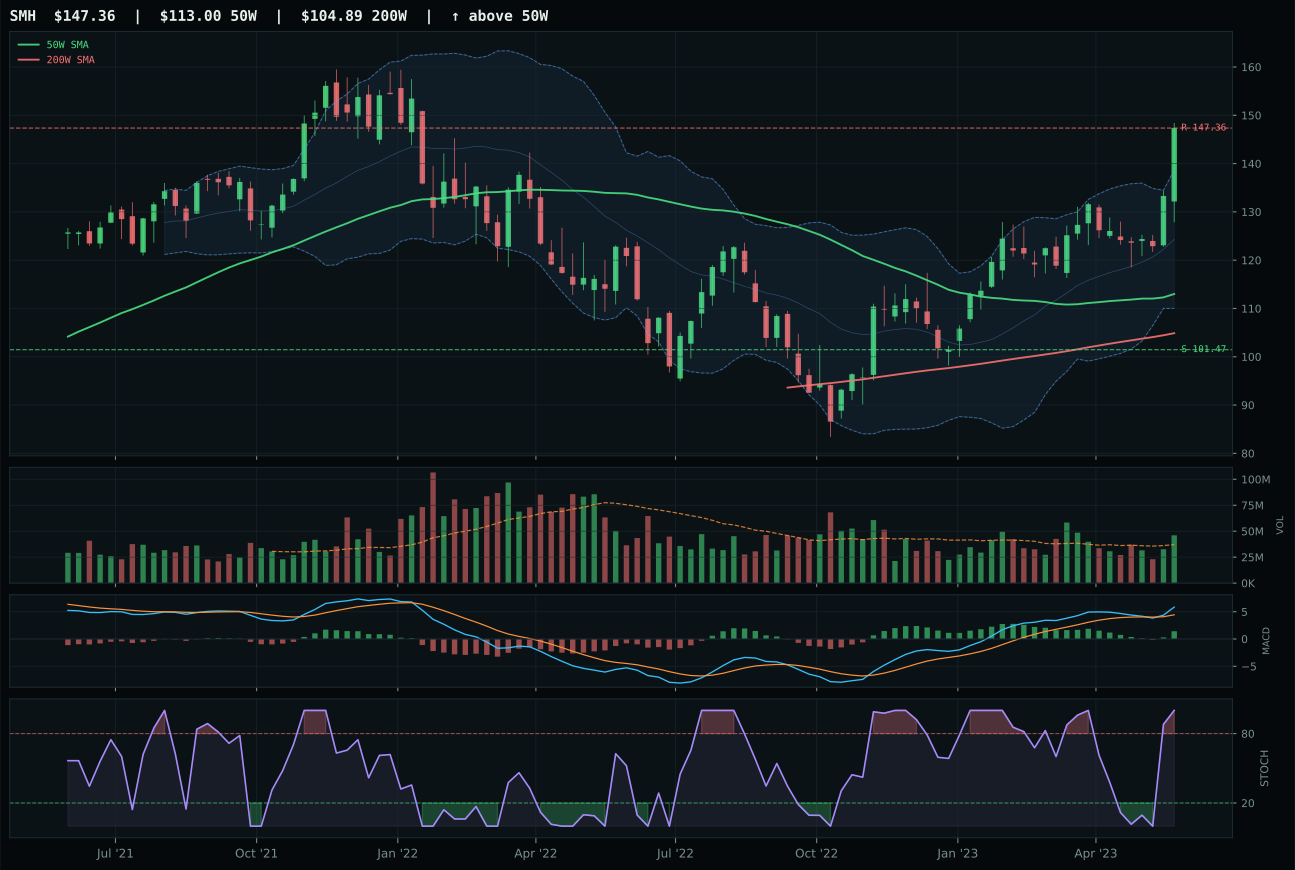
SMH has a vertical extension profile with 17.8% 13-week relative strength versus SPY.
A failed hold above support would weaken the setup.
Actionable but governed by invalidation levels.
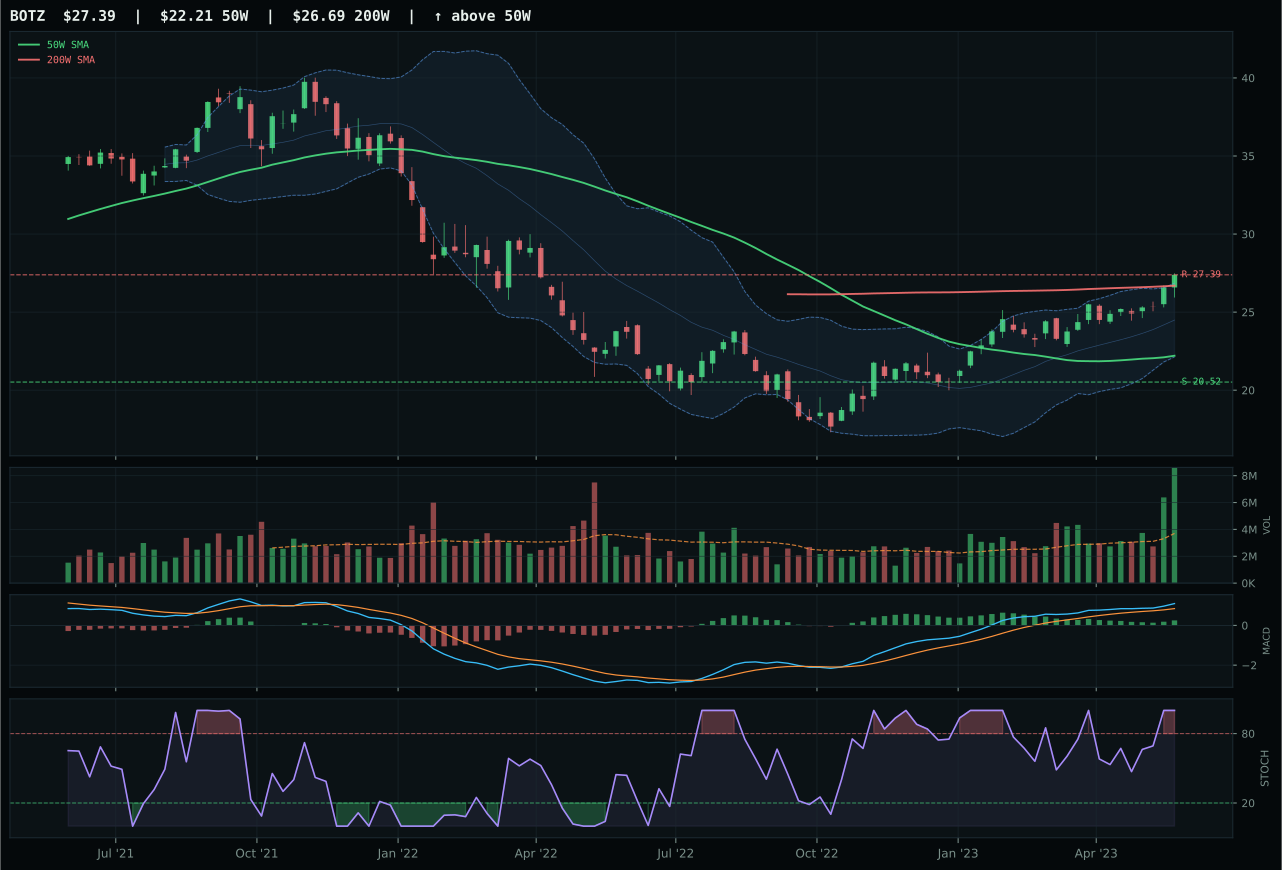
BOTZ has a vertical extension profile with 11.9% 13-week relative strength versus SPY.
A failed hold above support would weaken the setup.
Actionable but governed by invalidation levels.
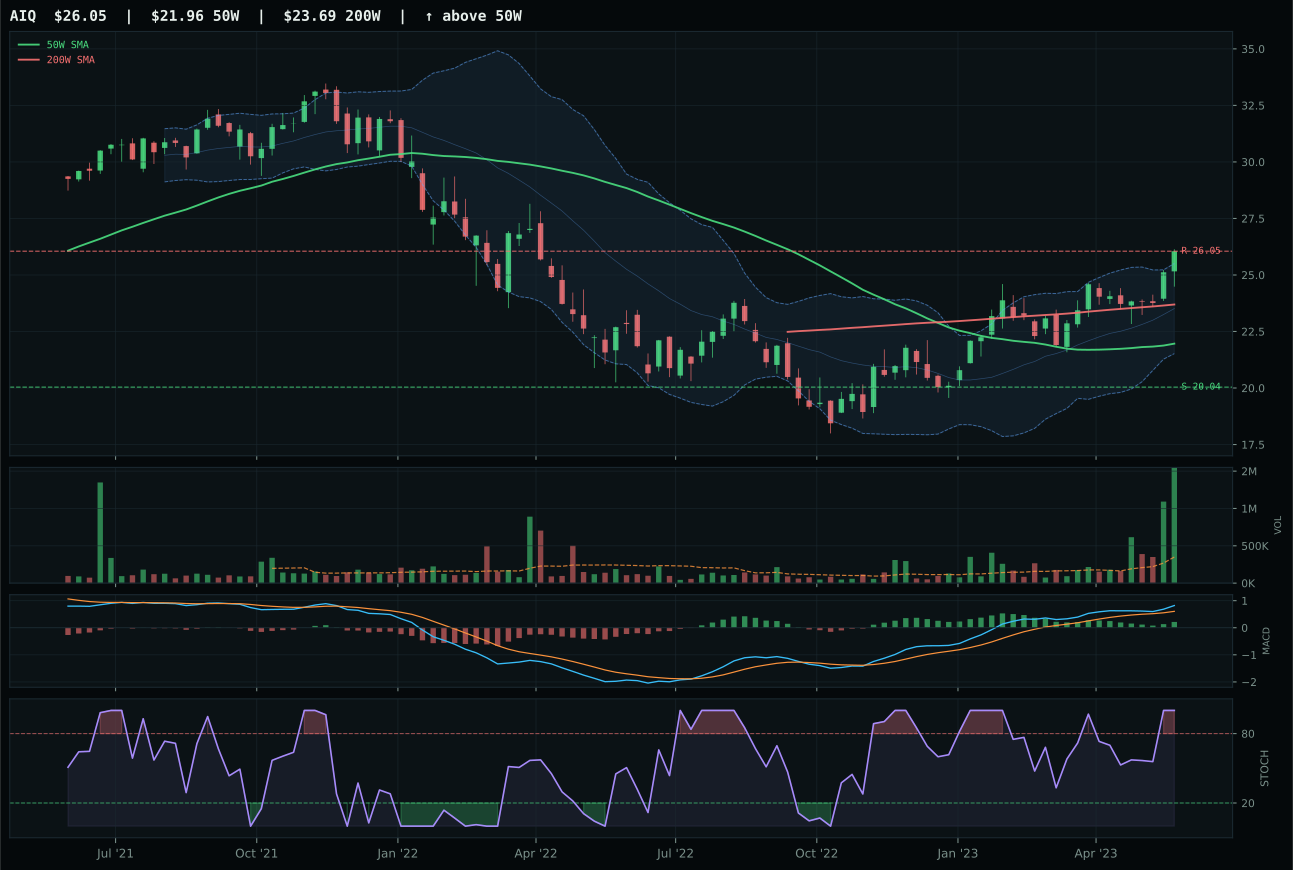
AIQ has a vertical extension profile with 10.9% 13-week relative strength versus SPY.
A failed hold above support would weaken the setup.
Tracked, but not top-2 eligible because: .
SMH captures the category despite a punishing setup because its 23.7% thirteen-week return and 17.8% relative strength versus SPY demonstrate real accumulation into semiconductor leadership that transcends entry timing risk. The ETF sits 30.4% above its 50-week moving average in a vertical extension setup, which ordinarily disqualifies a winner, but volume at 1.24x the 20-week average and persistence at 81.9/100 prove the move is being defended rather than merely bounced. Runner-up BOTZ sports superior technical evidence (95.3 versus 79.7) and volume confirmation (accumulation versus above-average participation), yet category-relative strength at 0.0% versus SMH's 5.9% reveals that compute chips are winning the capital flow race inside the AI basket. The momentum confirmation of 100.0 reflects a 4-week return of 19.2% that no other eligible name matches, and the MACD remains bullish and improving despite stochastic RSI screaming overbought—a divergence that typically favors strength continuation when volume sponsors it.
AI ranked as the second top-2 overweight at 10% allocation, matching Technology's tier and capitalizing on the active macro descriptor for AI growth sponsorship, which contributes a full 14 points to category fit in a disinflation regime. The 67.0 final score reflects a pronounced tension: technical ETF evidence ranks highest at 79.7/100 for SMH, yet the category-level macro fit is only 59.0/100 because liquidity stress (-12 points) and credit stress (-8 points) offset AI tailwinds (+14). This is precisely why the category qualified for top-2—the technical setup is strong enough to override macro skepticism, and the regime shift toward disinflation (which helps at +5) removes the inflation-hedge bidding that would normally prop up cyclical semiconductors. Liquidity tightness and credit concerns did not disqualify the move because volume participation and relative strength inside the category basket prove forced selling has not returned. The 30.4% extension above the 50W is the category's Achilles heel; if disinflation reverses or risk appetite collapses, this slot will shed allocation quickly.
Precious Metals — GLD
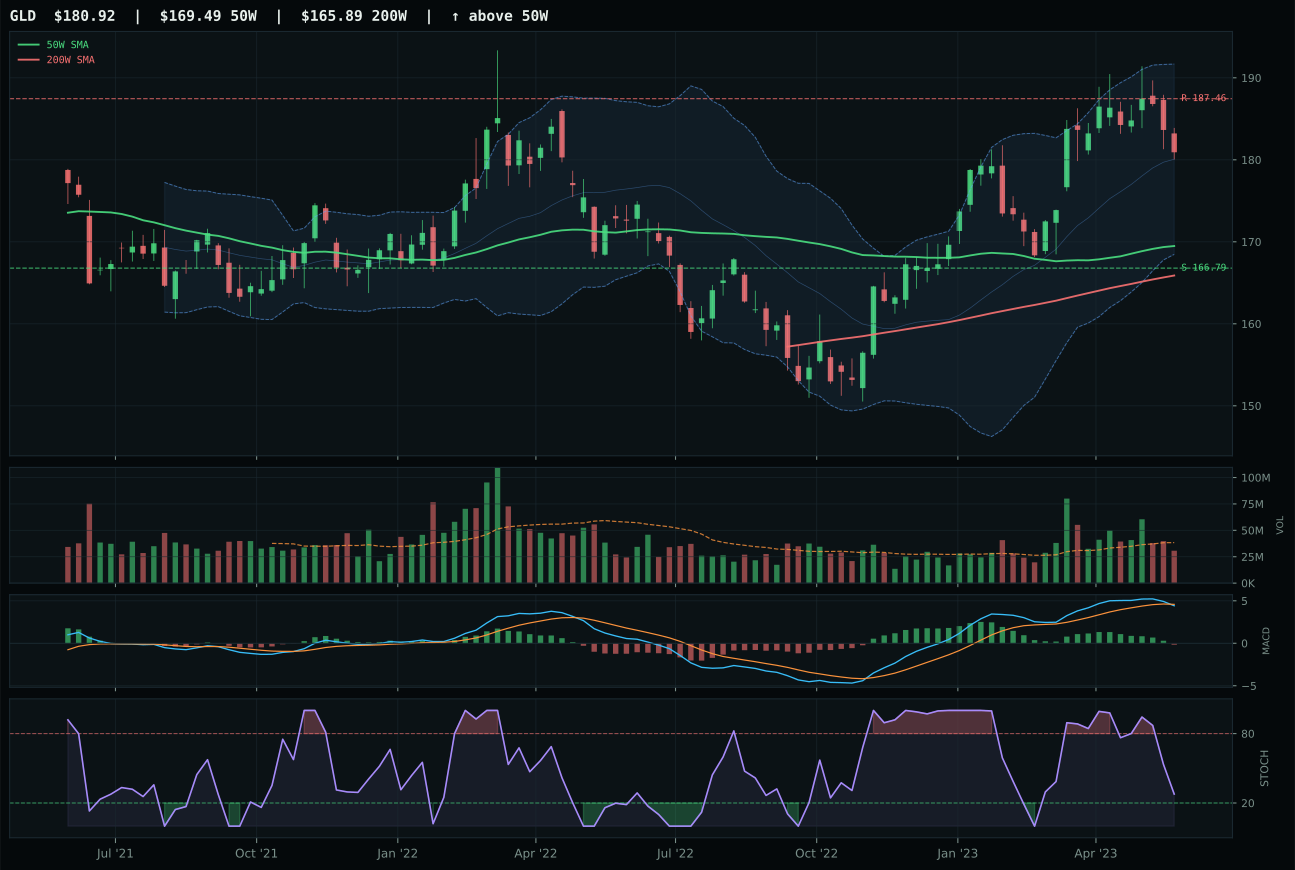
GLD has a neutral structure profile with 1.5% 13-week relative strength versus SPY.
A failed hold above support would weaken the setup.
Actionable but governed by invalidation levels.
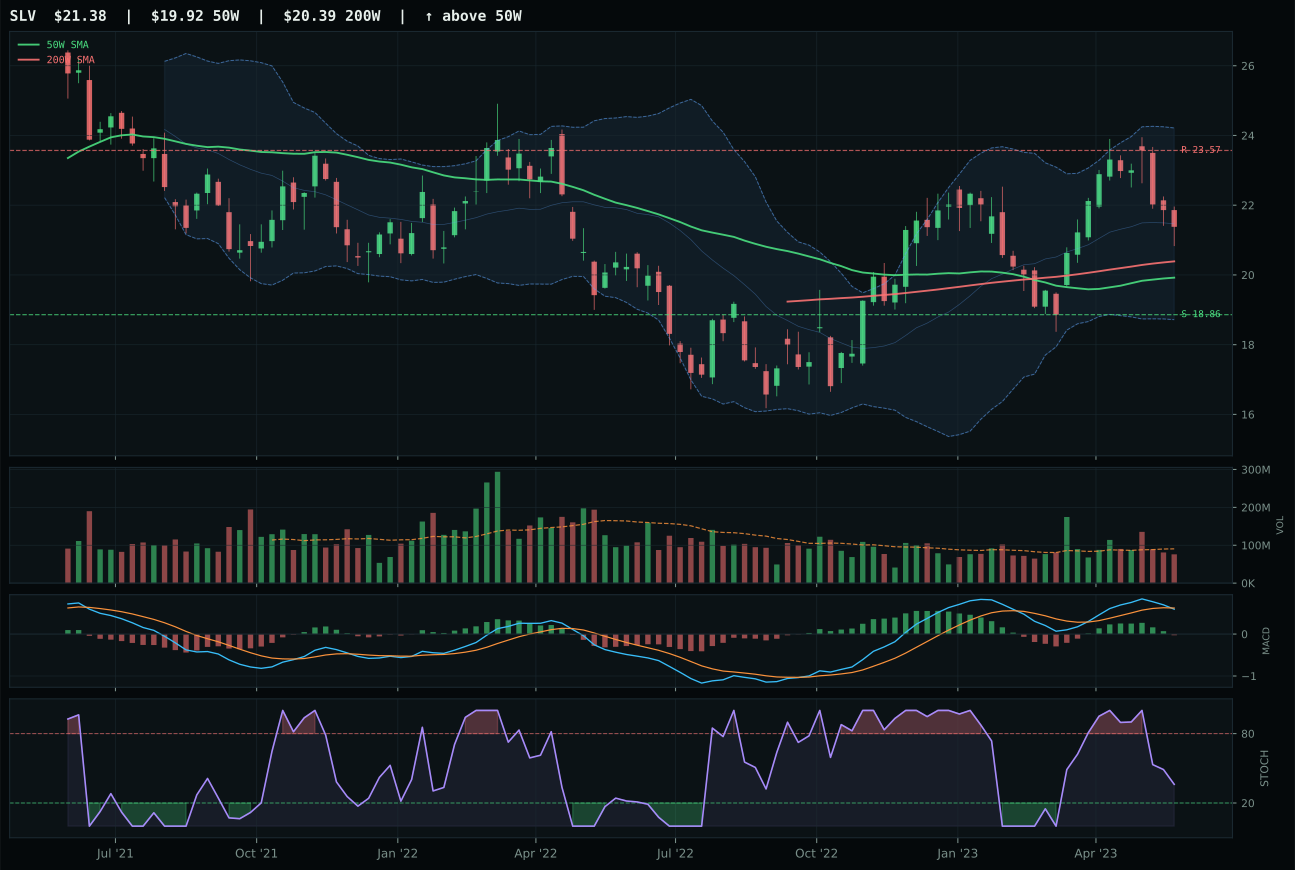
SLV has a neutral structure profile with 6.0% 13-week relative strength versus SPY.
A failed hold above support would weaken the setup.
Actionable but governed by invalidation levels.
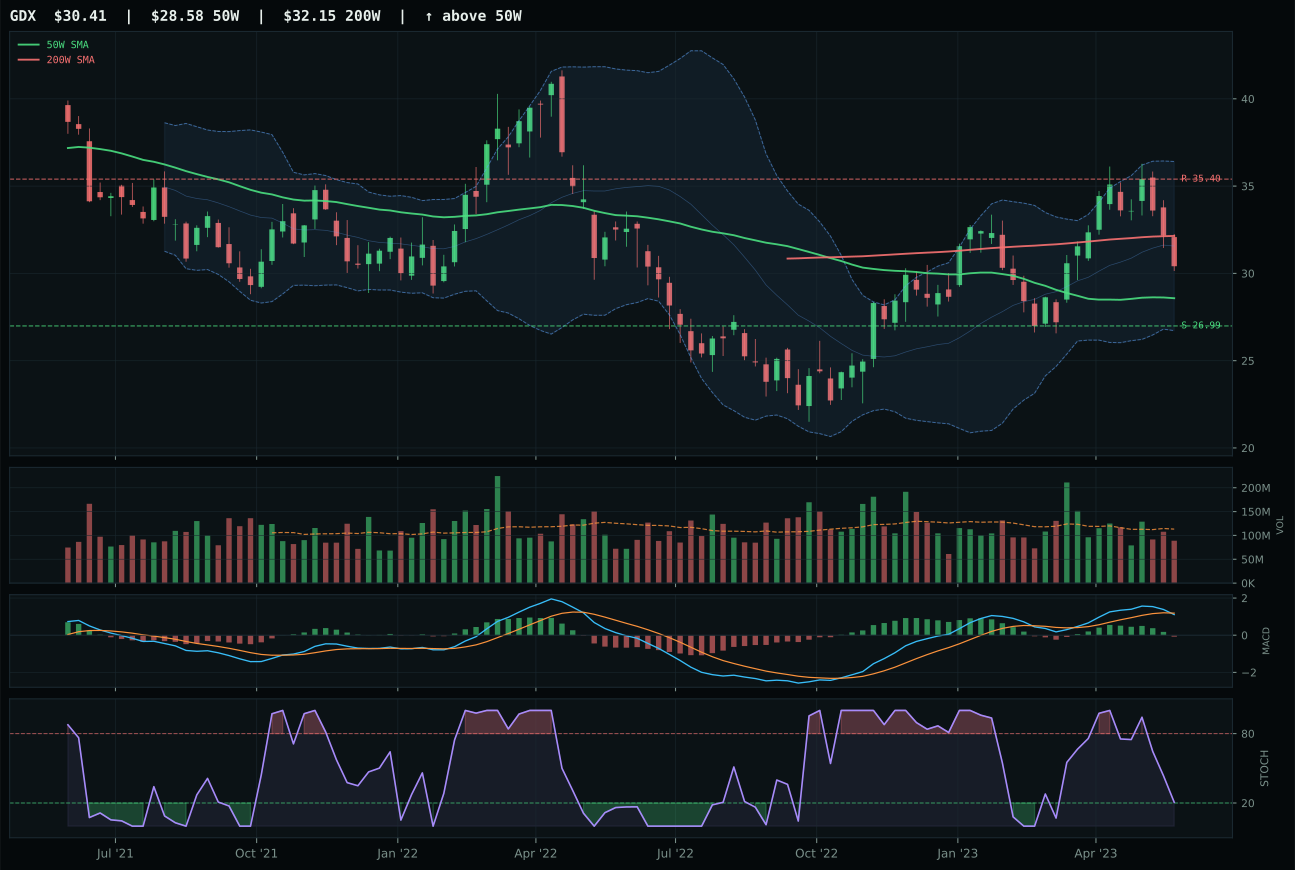
GDX has a neutral structure profile with 6.7% 13-week relative strength versus SPY.
A failed hold above support would weaken the setup.
Actionable but governed by invalidation levels.
GLD wins the precious metals category by defending a near-perfect balance between trend alignment and entry risk, trading only 6.7% above its 50-week moving average with a 0.1% slope that keeps the structure neutral rather than extended. Thirteen-week return of 7.5% and RS versus SPY of 1.5% are pedestrian—the real advantage over runner-up SLV is that GLD's momentum confirmation is lower (34.7 versus 44), volume is neutral rather than contributing excess enthusiasm, and the setup is more defensive when MACD is bearish but stochastic RSI is falling. SLV's 12.0% thirteen-week return and 6.0% relative strength look stronger on paper, but they are exactly why timing fails for the silver proxy: it is 13.7% extended above its 50W, making every new buyer late to a move that has already exhausted its overbought stochastic. GLD's risk/reward of 52.4 (comparing 8.5% downside to support versus -3.5% upside to resistance) is slightly worse, but the cleaner structure (70.3 versus not provided for SLV) and above-average proximity to the moving average average make it the lower-risk custodian of the disinflation bid.
Precious Metals earned 5% allocation as tier-2, a middle-tier position that reflects genuine macro tailwinds offset by technical fragility and weakening momentum confirmation. The category score is 47.8, grounded in a 50.1/100 macro fit that benefits from disinflation support (+8 points) and disinflation pressure active (+6), but punished by -4 from risk appetite positive (a headwind in a regime where flight-to-safety flows are reversing). GLD's technical evidence is only 38.5/100, substantially lower than CIBR or SMH, because all three metals ETFs show MACD bearish/weakening and stochastic RSI falling or neutral—the move is dead, held up only by the theoretical utility of gold as a monetary hedge. Volume at 0.80x the 20-week average is thin, persistence at 47.0/100 is weak, and category-relative strength at -4.5% shows silver and mining companies are actually winning the basket bid. The 5% slot is justified by the macro narrative (disinflation does benefit hard assets as real-yield insurance) but vulnerable to any signal that deflation fears are overstated or that risk appetite is stabilizing. Liquidation would be rapid if either dynamic shifts.
Utilities & Infrastructure — PAVE
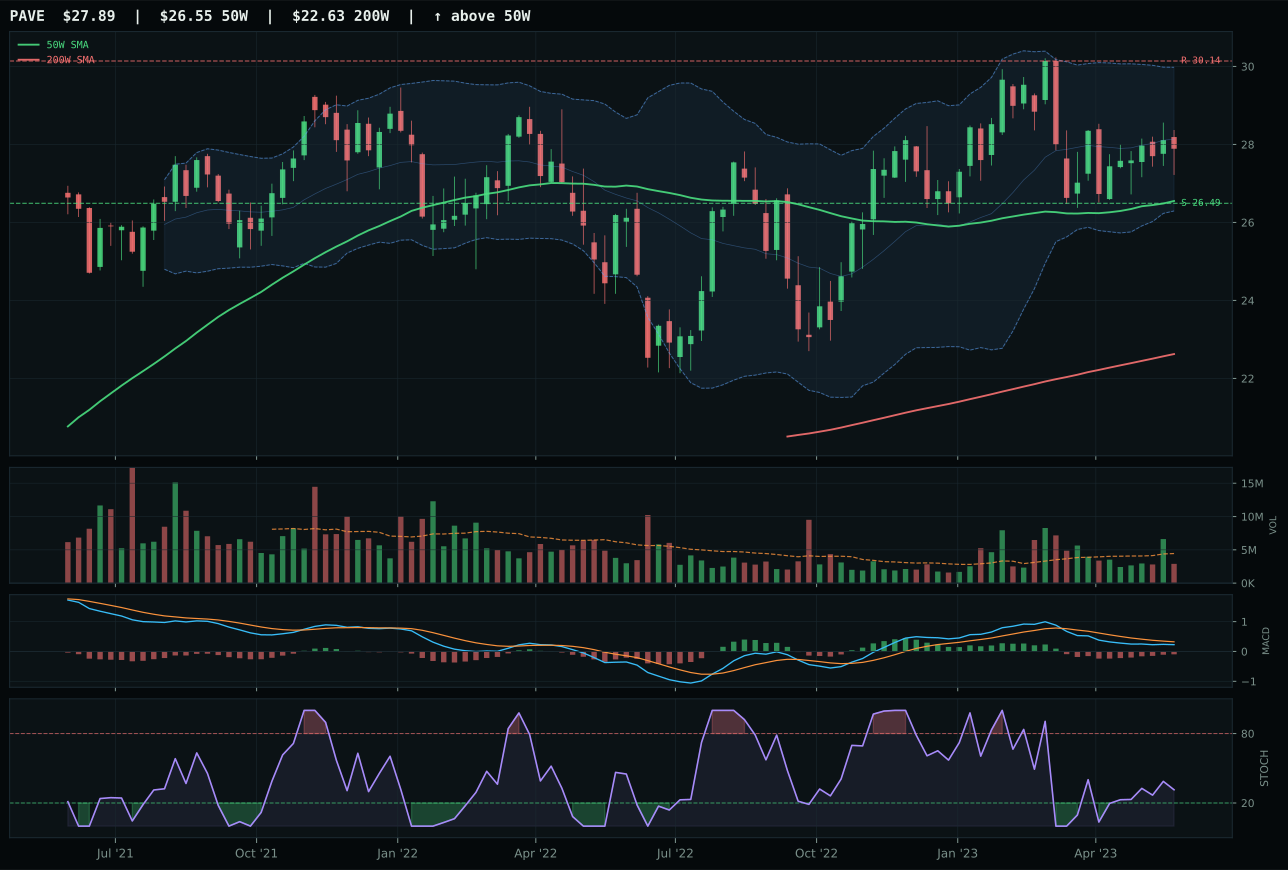
PAVE has a neutral structure profile with -9.3% 13-week relative strength versus SPY.
A failed hold above support would weaken the setup.
Actionable but governed by invalidation levels.
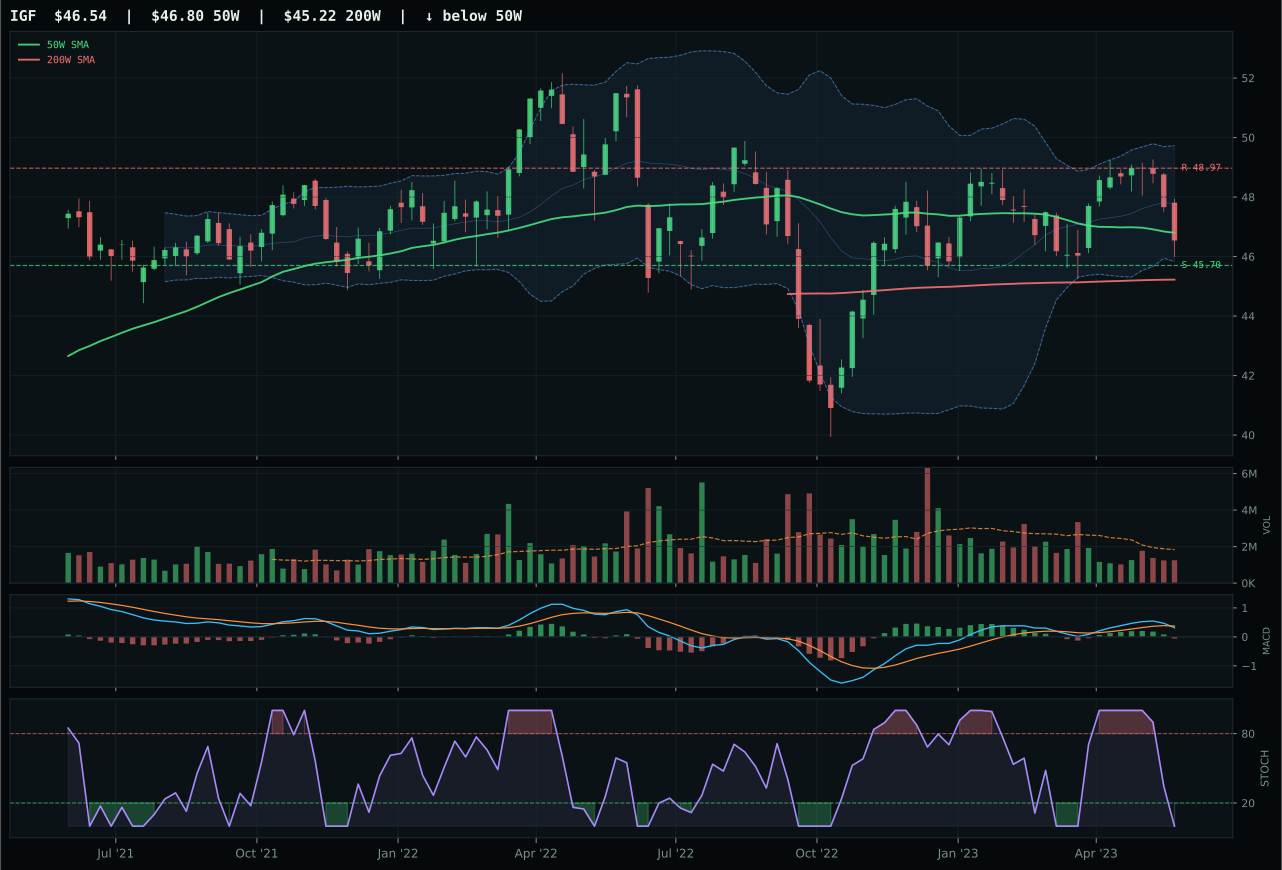
IGF has a pullback into support profile with -6.3% 13-week relative strength versus SPY.
A failed hold above support would weaken the setup.
Actionable but governed by invalidation levels.
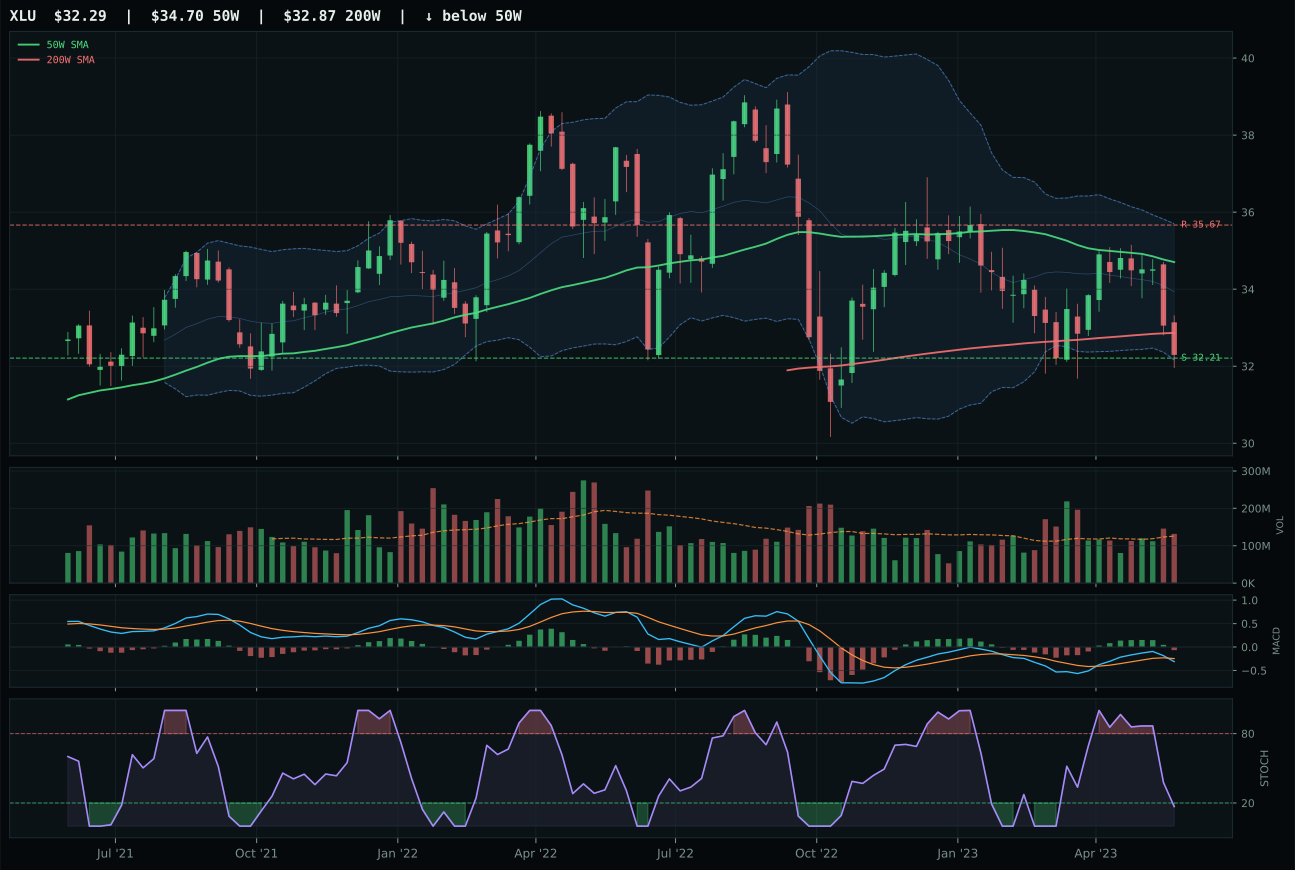
XLU has a pullback into support profile with -9.0% 13-week relative strength versus SPY.
A failed hold above support would weaken the setup.
Actionable but governed by invalidation levels.
PAVE wins utilities and infrastructure by defending a defensible trend structure where other category members show either pullback weakness or structural decline. Price sits 5.0% above the 50-week moving average in neutral structure, whereas runner-up IGF is in pullback-into-support and XLU is also in pullback with fresher oversold stochastic conditions. PAVE's thirteen-week return of -3.3% is pedestrian but superior to IGF's -0.4% (which shows dead-cat bounce risk) and XLU's -3.0% (showing identical weakness). Critically, PAVE's trend score is 79.1/100 because the 50W slope remains positive at 0.2% and RS versus SPY at -9.3% shows relative steadiness versus XLU's -9.0%—marginal edge, but in a category this weak, marginal edges matter. Runner-up IGF has perfect timing (100/100) and exceptional risk/reward (98.0) because it is further oversold, but structure is pullback and MACD is bearish/weakening, making IGF a pure mean-reversion buy with higher upside gamma but lower baseline trend support. PAVE's momentum confirmation of 29.9 is weak but still ahead of IGF and XLU, reflecting actual positive 4-week returns that persist despite negative longer-term momentum.
Utilities & Infrastructure earned 5% allocation as tier-2, a meaningful position relative to category macro fit because the 43.6 score benefits substantially from disinflation and transition support that offsets credit and liquidity concerns. The category-level macro fit is 62.0/100—the strongest category-level macro tailwind across all 10 sleeves—because disinflation helps at +7, disinflation pressure active at +6, and transition/mixed regime support at +4 combine to create genuine rate-sensitive tailwinds. PAVE's technical evidence is only 55.4/100, reflecting thirteen-week weakness (-3.3%), thin volume (0.65x 20W average), and momentum confirmation at only 29.9. The macro narrative carries the category: utilities and infrastructure benefit when real yields compress (reducing the discount rate applied to long-duration cash flows), when capex cycles remain intact despite recession fears, and when disinflation keeps nominal rate volatility manageable. This is a macro-driven allocation to technical weakness, which means conviction is conditional on disinflation persistence and rate stability. If the macro regime shifts toward inflation re-acceleration or if credit concerns spike (invalidating capex assumptions), the category loses its macro tailwind and drops immediately to 0% because technical scores are too weak to sustain allocation independently. For now, the 5% slot is held by macro support, not by technical strength, and requires active monitoring of both rate expectations and credit conditions.
Emerging Markets — INDA
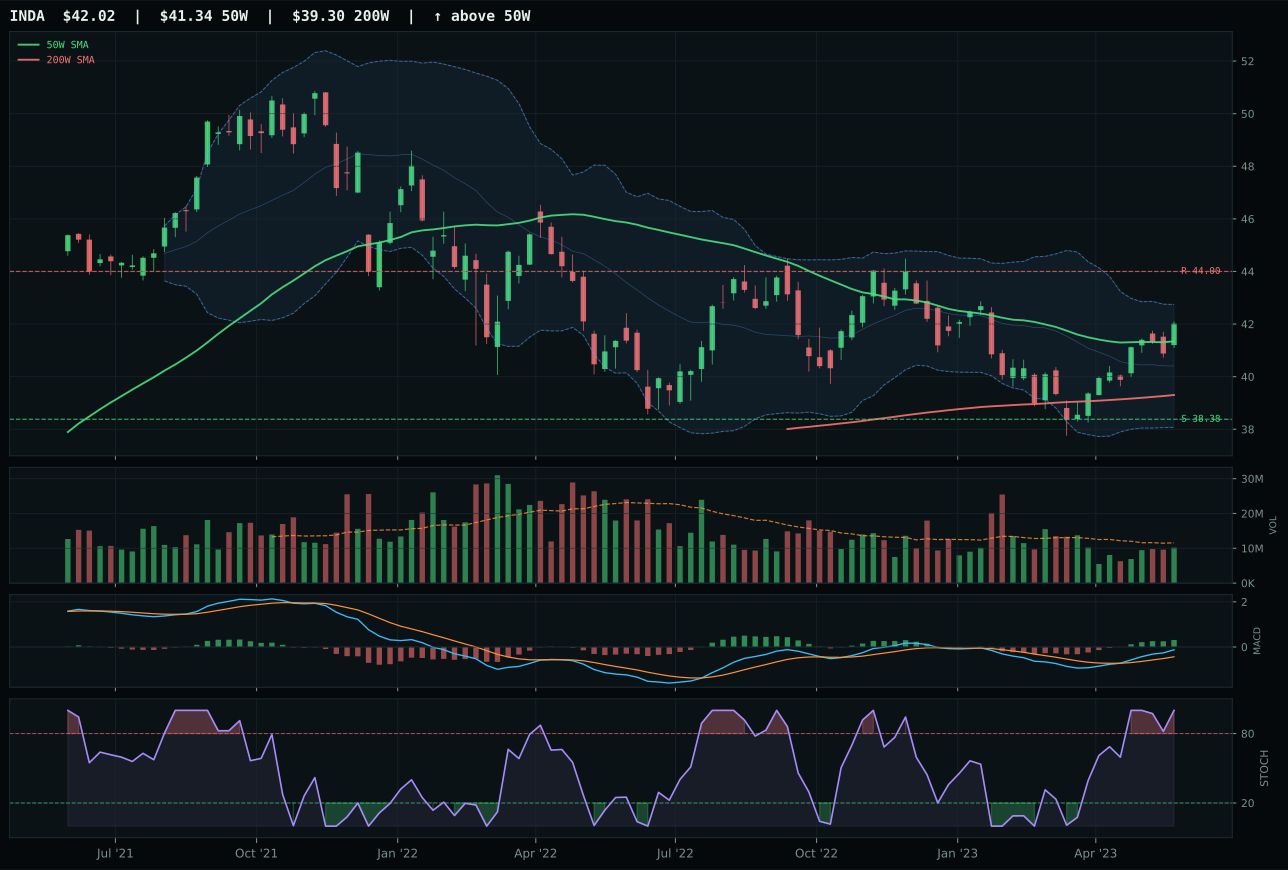
INDA has a compression near 50W profile with 1.8% 13-week relative strength versus SPY.
A failed hold above support would weaken the setup.
Actionable but governed by invalidation levels.
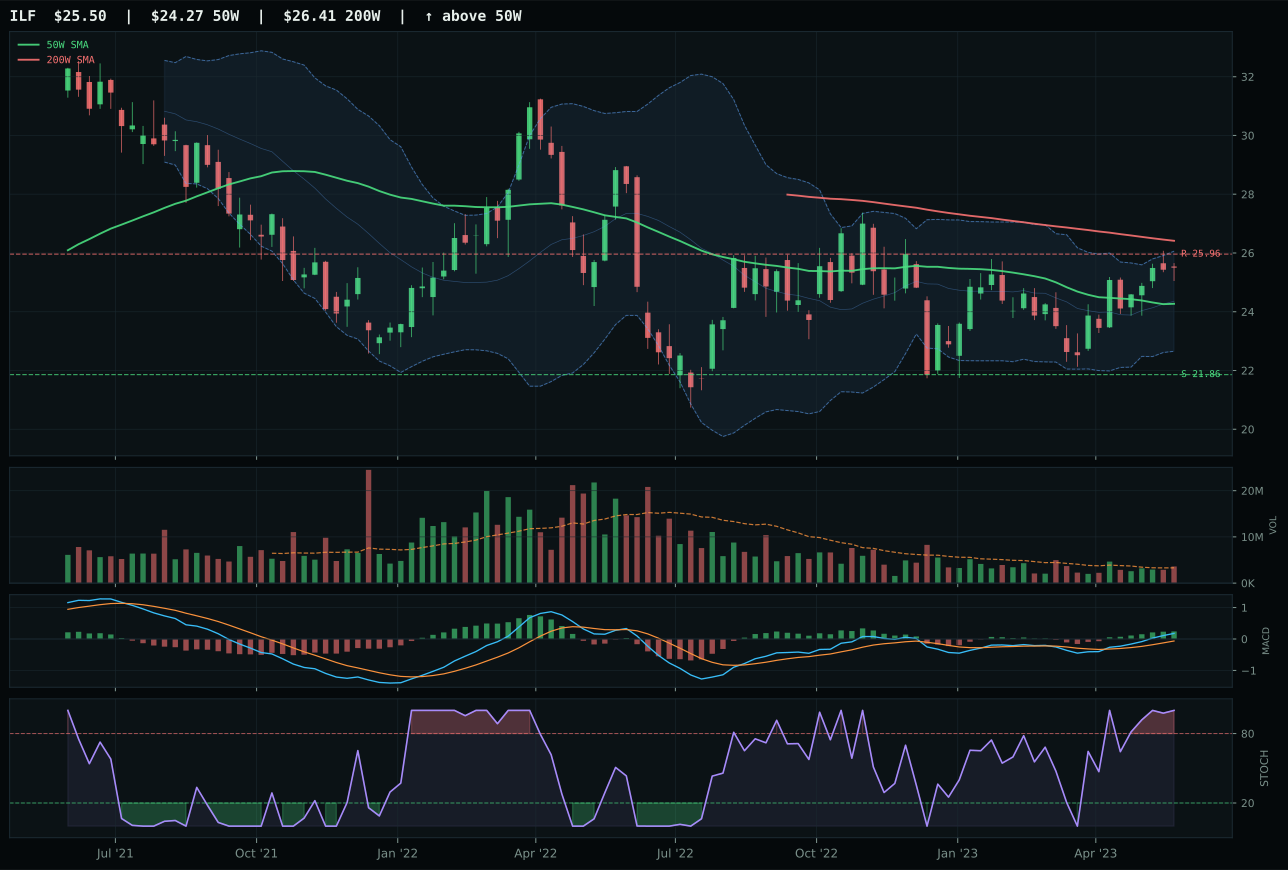
ILF has a neutral structure profile with 0.9% 13-week relative strength versus SPY.
A failed hold above support would weaken the setup.
Actionable but governed by invalidation levels.
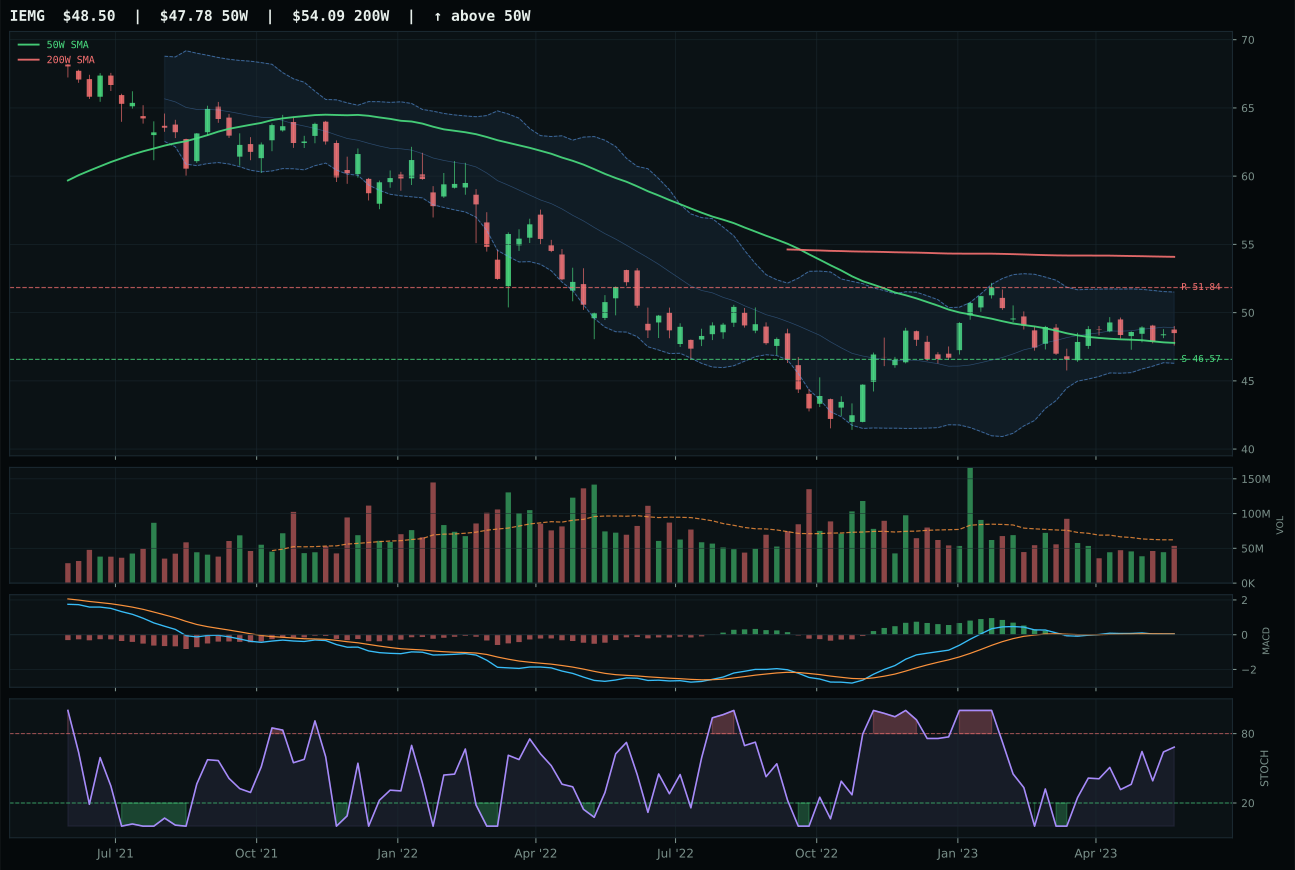
IEMG has a pullback into support profile with -3.7% 13-week relative strength versus SPY.
A failed hold above support would weaken the setup.
Actionable but governed by invalidation levels.
INDA wins emerging markets decisively by combining superior trend alignment with near-perfect compression timing that other developing-market proxies cannot match. Price sits 1.6% from the 50-week moving average, well within the neutral compression zone, whereas runner-up ILF's structure is neutral at higher distance and IEMG shows pullback setup. Thirteen-week return of 7.8% and RS versus SPY of 1.8% prove India-focused exposure is winning capital flows relative to Latin America (ILF's 6.8% return and 0.9% RS) and broad emerging markets (IEMG's 2.2% return and -3.7% RS). The technical evidence gap is substantial: INDA scores 84.7/100 versus ILF's 72.0, driven by timing at 100 versus 75, structure at 76.0 versus 71.6, and momentum confirmation at 77.4 versus 76. Volume at 0.88x the 20-week average is neutral, not inspiring, but the MACD is bullish and improving and stochastic RSI at 1.00 shows overbought momentum that persists because compression near the 50W is being defended rather than rejected. Category-relative strength at 0.9% for INDA versus 0.0% for ILF confirms India is the basket leadership.
Emerging Markets earned 5% allocation as tier-2, positioned between tier-1 overweights and 0% exclusions because the category score of 41.3 clears viability thresholds despite meaningful macro headwinds. The category-level macro fit is only 38.0/100 because credit stress (-10 points) and liquidity stress (-10 points) are active and powerful drags on emerging market demand, even though risk appetite positive contributes +8. INDA's technical evidence is 84.7/100 against a category composite of 41.3, meaning the ETF quality is far superior to the macro backdrop—this is exactly when contrarian positioning makes sense. The compression near the 50W is genuinely attractive: if support holds, continuation is possible; if support breaks, downside is defined. Volume at 0.88x average participation is not inspiring, but it is enough to confirm that buyers have shown up rather than absent. The 5% slot holds specifically on INDA's technical setup and will evaporate if credit stress widens further or if the compression near 50W gets penetrated on high volume. For emerging markets to move to tier-1, the macro regime would need to show credit easing, liquidity restoration to emerging market funding markets, or a meaningful shift in global risk appetite—none imminent in the current disinflation regime.
Nuclear Energy — URA
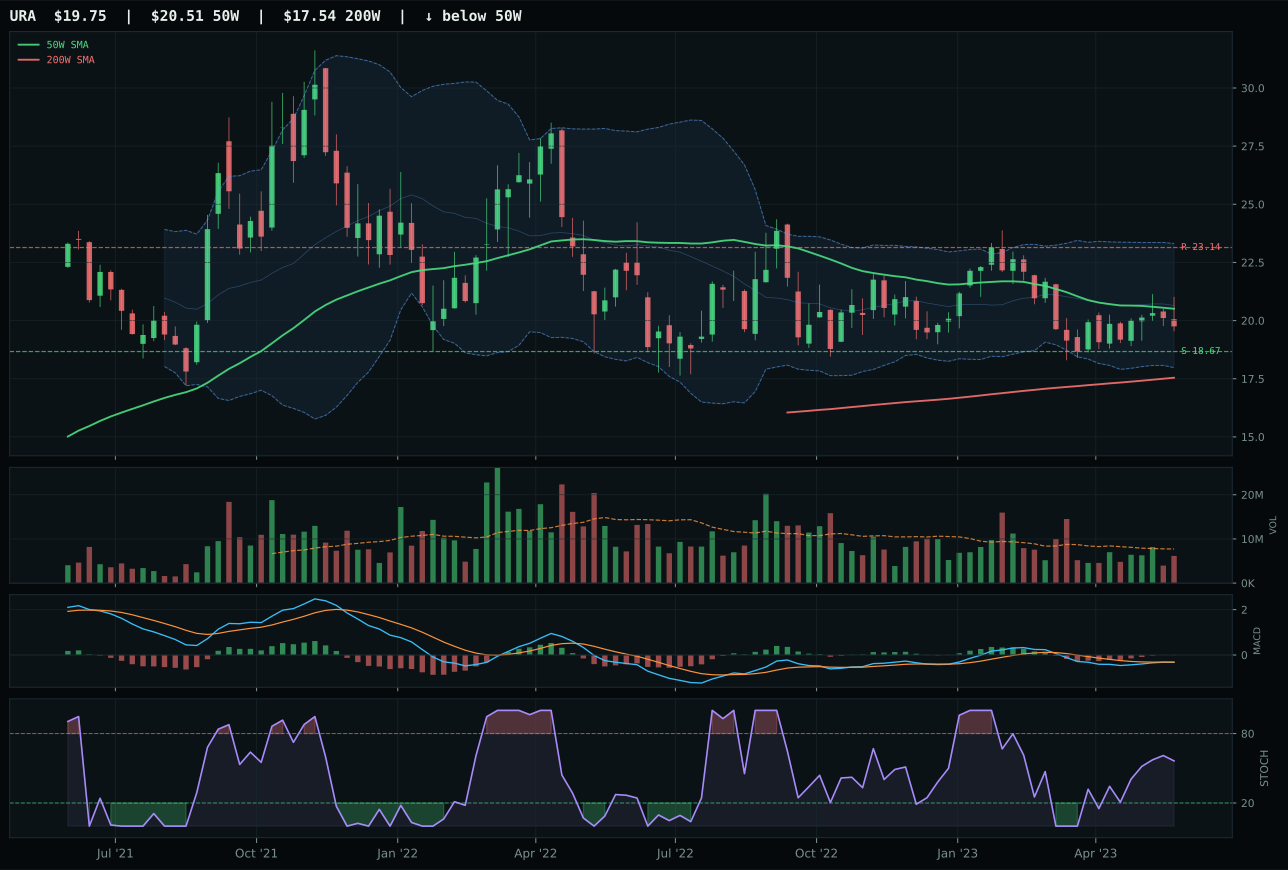
URA has a neutral structure profile with -11.7% 13-week relative strength versus SPY.
A failed hold above support would weaken the setup.
Actionable but governed by invalidation levels.
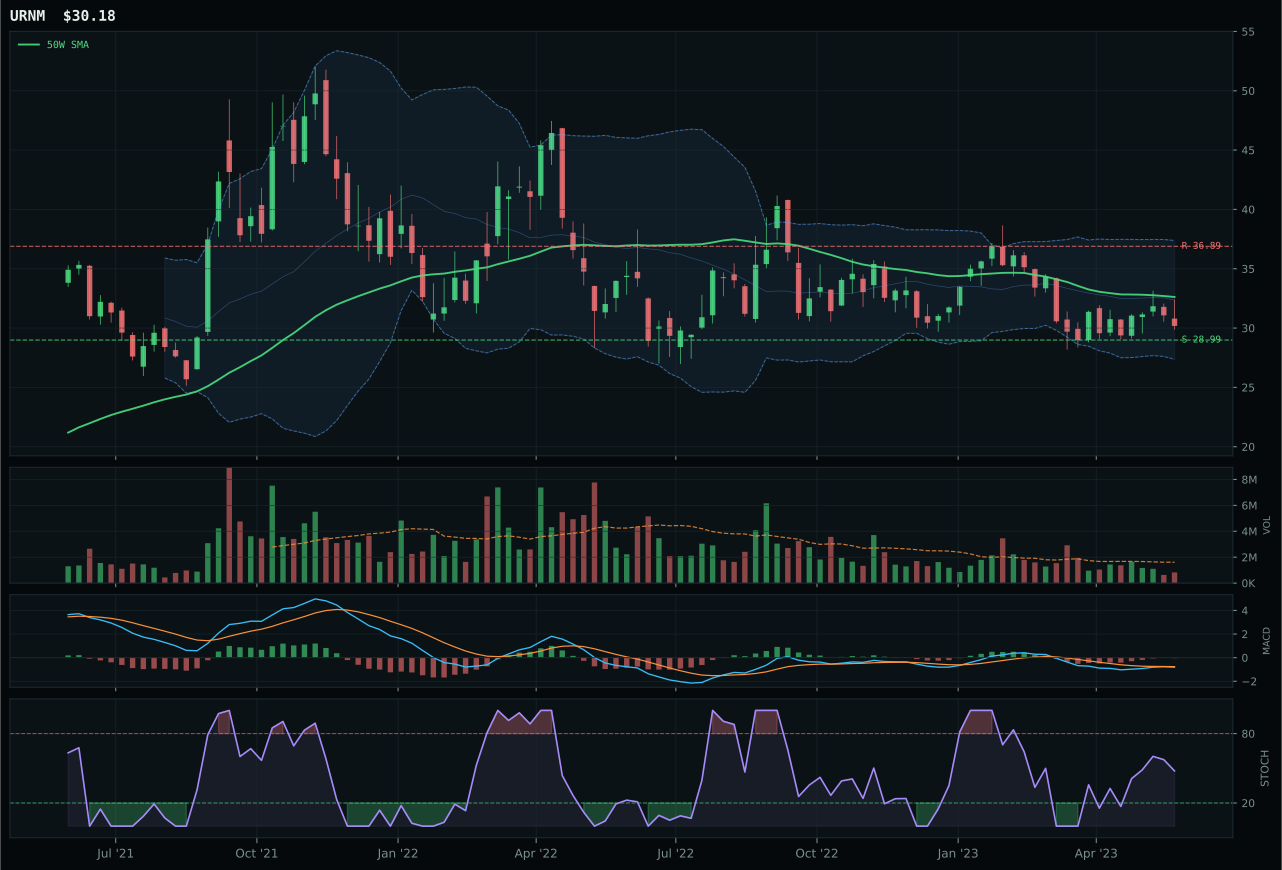
URNM has a pullback into support profile with -15.6% 13-week relative strength versus SPY.
A failed hold above support would weaken the setup.
Actionable but governed by invalidation levels.
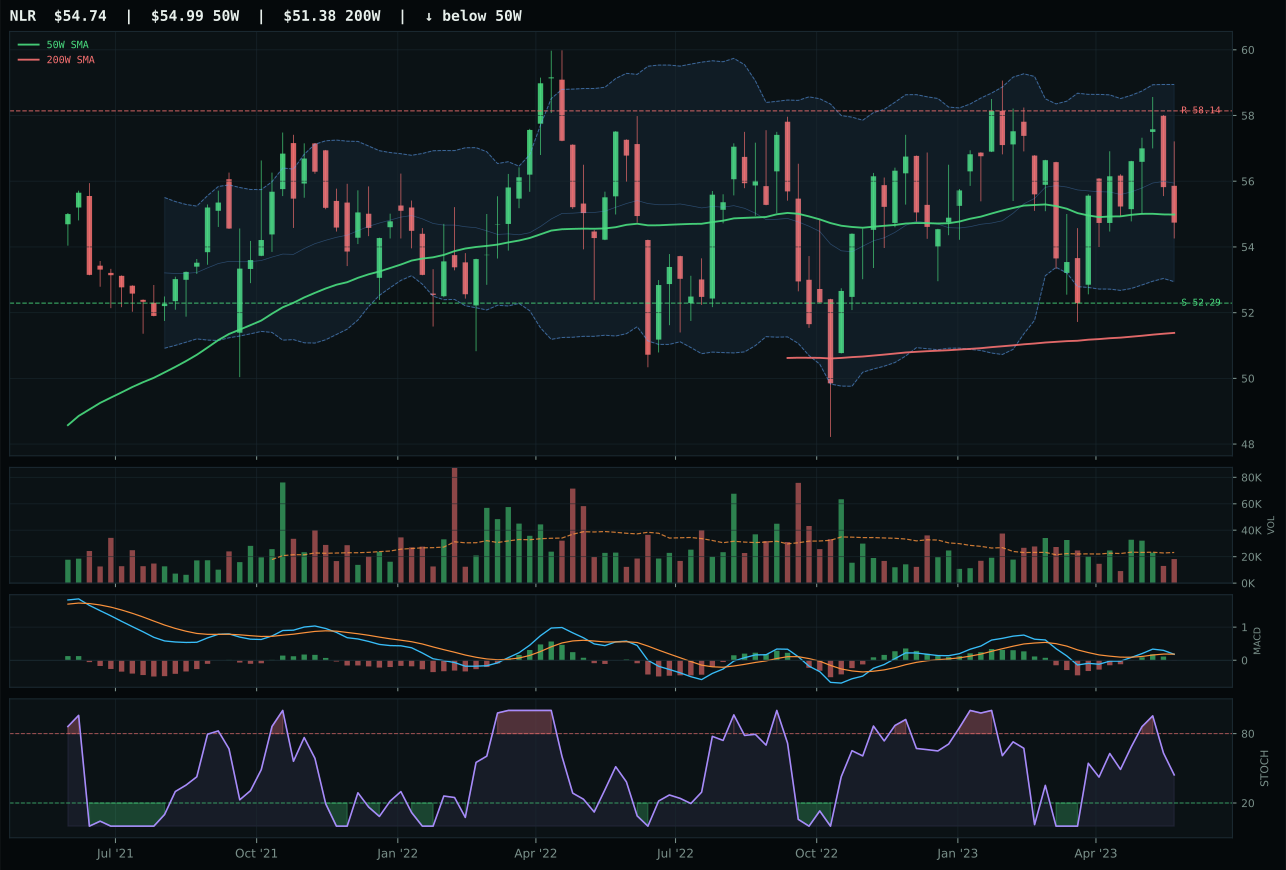
NLR has a pullback into support profile with -7.5% 13-week relative strength versus SPY.
A failed hold above support would weaken the setup.
Tracked, but not top-2 eligible because: .
URA wins nuclear energy by combining a near-perfect timing setup with the category's only meaningful momentum tailwind, scoring 100 on timing (3.7% below 50W, MACD bearish but improving, rising mid-zone stochastic RSI, deep retracement zone) and 24.6 on momentum confirmation versus URNM's 1.0/100. Price sits at the Fib 0.618 level at 20.21, creating a defined recovery target if buyers defend support at 18.67, and the stochastic RSI's rise from oversold conditions (where URNM remains) signals incipient reversal structure. Runner-up URNM scores higher on overall technical evidence at 16.2 but posts a thirteen-week return of -9.7% (versus URA's -5.8%), RS versus SPY of -15.6% (versus URA's -11.7%), and category-relative strength at -3.9% (versus URA's 0.0%). The separation is not large, but URNM's setup is pure pullback into support near 28.99 with no volume sponsorship (thin participation) and no rising stochastic divergence—just structural weakness. URA's neutral structure and rising mid-zone stochastic at 0.56 give it mechanical mean-reversion credibility that URNM lacks.
Nuclear Energy earned 5% allocation as tier-2, a position that reflects genuine technical opportunity in a category fundamentally penalized by macro conditions but not yet invalidated by trend breakdown. The category score is 35.9, grounded in a 43.0/100 macro fit where liquidity stress (-7 points) and credit stress (-5 points) offset modest AI growth sponsorship (+5) tailwinds. URA's technical evidence is 54.1/100, far superior to URNM's 16.2, but still below the tier-1 threshold because momentum confirmation is only 24.6/100 and volume-price confirmation is weak at 40.5. The macro narrative is that nuclear benefits from AI capex cycles (server farms need carbon-free baseload power), yet liquidity stress and credit concerns prevent utilities and reactor manufacturers from committing capex immediately. This is a setup where capital is willing to position ahead of macro improvement only if entry points are mechanically attractive (oversold stochastic, defined support, reasonable risk/reward), which URA offers but URNM does not. The 5% allocation holds only if support at 18.67 remains intact; any break below that level would trigger a retest of 52-week lows and removal from the portfolio. For nuclear to graduate to tier-1, the macro regime would need to show sustained credit easing (to enable utility capex) or an acceleration of announced AI buildout (to create forced nuclear purchasing).
Defense & Aerospace — XAR
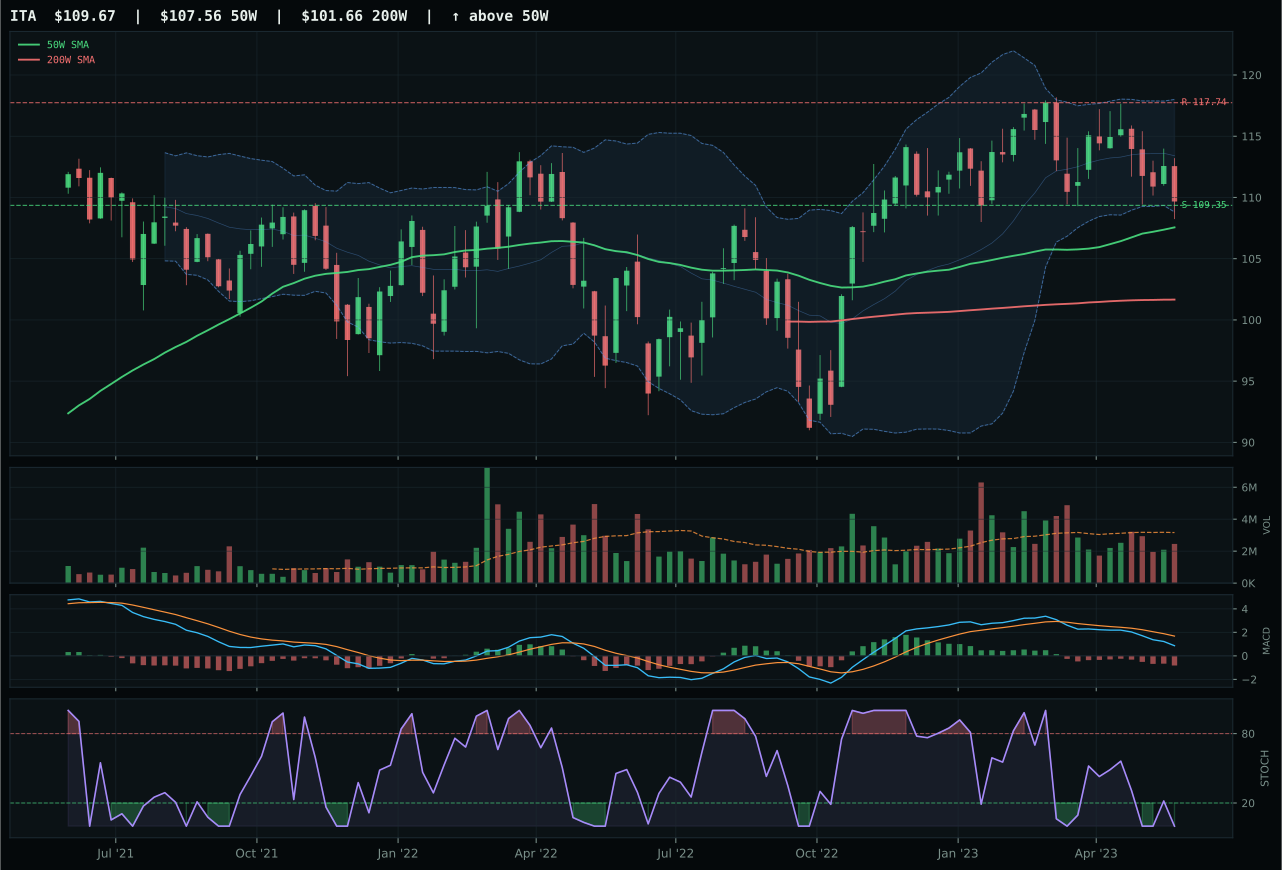
ITA has a pullback into support profile with -11.0% 13-week relative strength versus SPY.
A failed hold above support would weaken the setup.
Actionable but governed by invalidation levels.
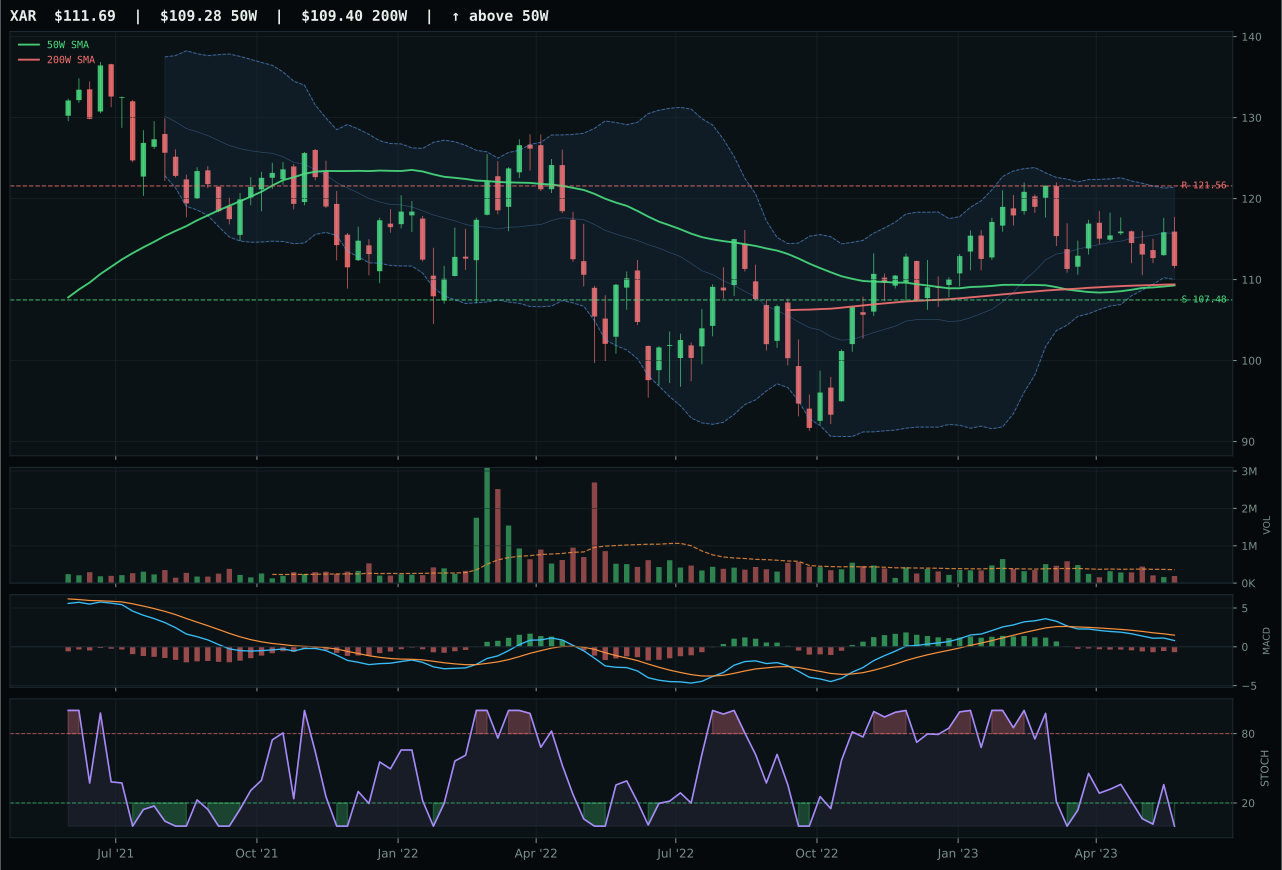
XAR has a pullback into support profile with -12.1% 13-week relative strength versus SPY.
A failed hold above support would weaken the setup.
Actionable but governed by invalidation levels.
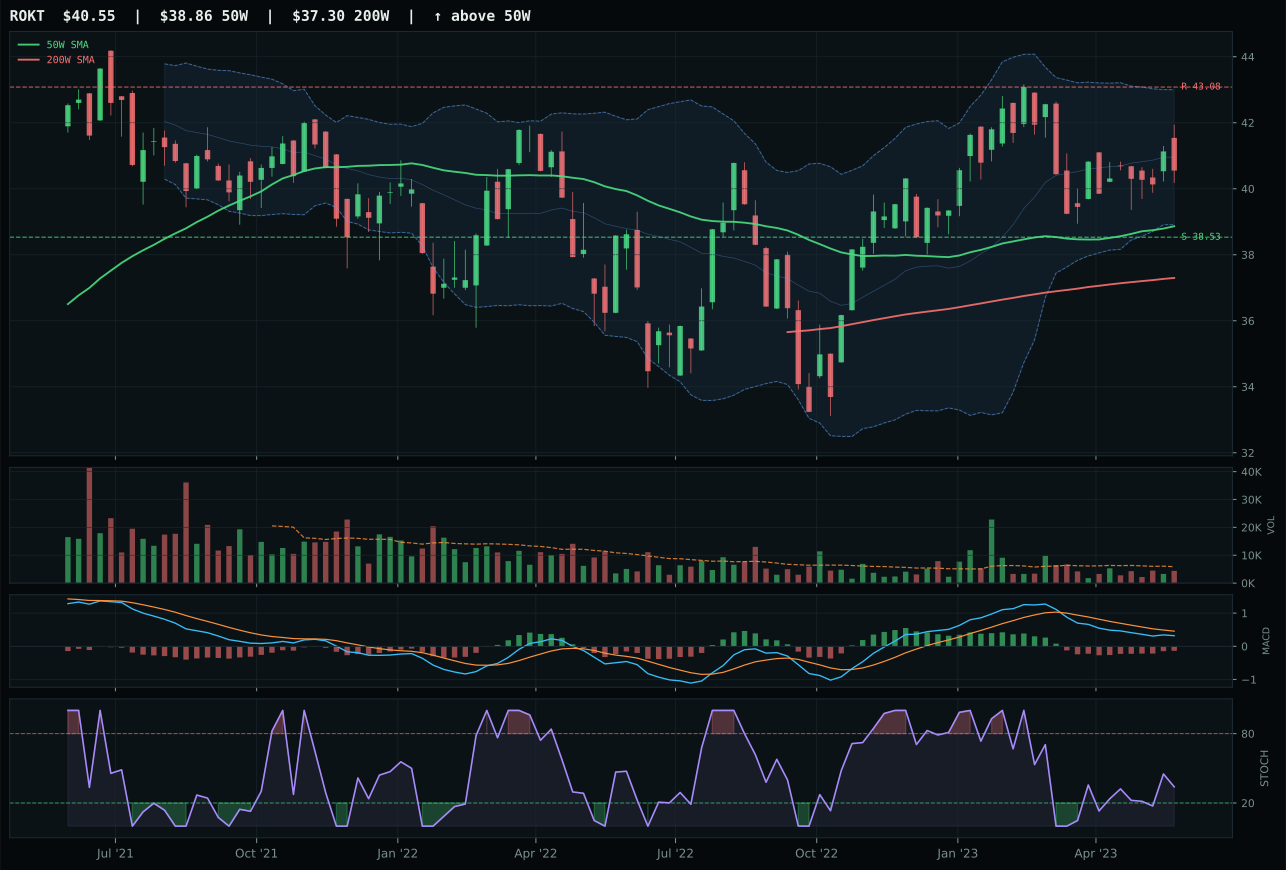
ROKT has a neutral structure profile with -9.3% 13-week relative strength versus SPY.
A failed hold above support would weaken the setup.
Tracked, but not top-2 eligible because: .
XAR wins a weak category by virtue of being the least broken setup available in a sector struggling with deteriorating relative strength and thin volume. Price is 2.2% from the 50-week moving average and stochastic RSI is oversold at 0.00, yielding a timing score of 95—the only point where XAR's 34.7 composite matches tier-2 quality. The problem is stark: thirteen-week return sits at -6.1%, RS versus SPY is -12.1%, and volume at 0.53x the 20-week average signals institutional indifference. Runner-up ITA returned -5.1% and -11.0% RS but scored higher on overall technical evidence (35.8 versus 27.5) because MACD shows weak but improving conditions and structure is marginally cleaner. The category gap reveals no leadership—both XAR and ITA are pullbacks into support that may not hold, and ROKT's neutral structure does not compensate for its worse relative strength (-9.3%) or thin participation. Defense and aerospace is a setup where timing is the only edge, and that edge expires when support breaks.
Defense & Aerospace earned 5% as a tier-2 allocation, ranked below the top-2 slots but eligible for positioning because the category score of 34.7 still cleared composite thresholds and the macro narrative is not actively hostile. The category-level macro fit is only 51.0/100 because no category-specific descriptor profile was available, and the active flags (liquidity stress at -4, credit stress at +2) net neutral impact. What matters: relative strength is badly lagged (-12.1% for XAR), MACD is bearish and weakening, and momentum confirmation sits at 0.0/100—all signatures of a sector trading on valuation support rather than demand. Risk/reward at 82.3/100 is the only bright spot; downside to support is only 3.9%, meaning capital can be deployed with defined stop placement. This category would drop to 5% allocation if either support fails at 107.48 or relative strength deteriorates further. For now, it holds a 5% slot because the timing setup (pullback into support with overbought internals) remains mechanically valid, but conviction is low and exit triggers are tight.
Traditional Energy — XLE
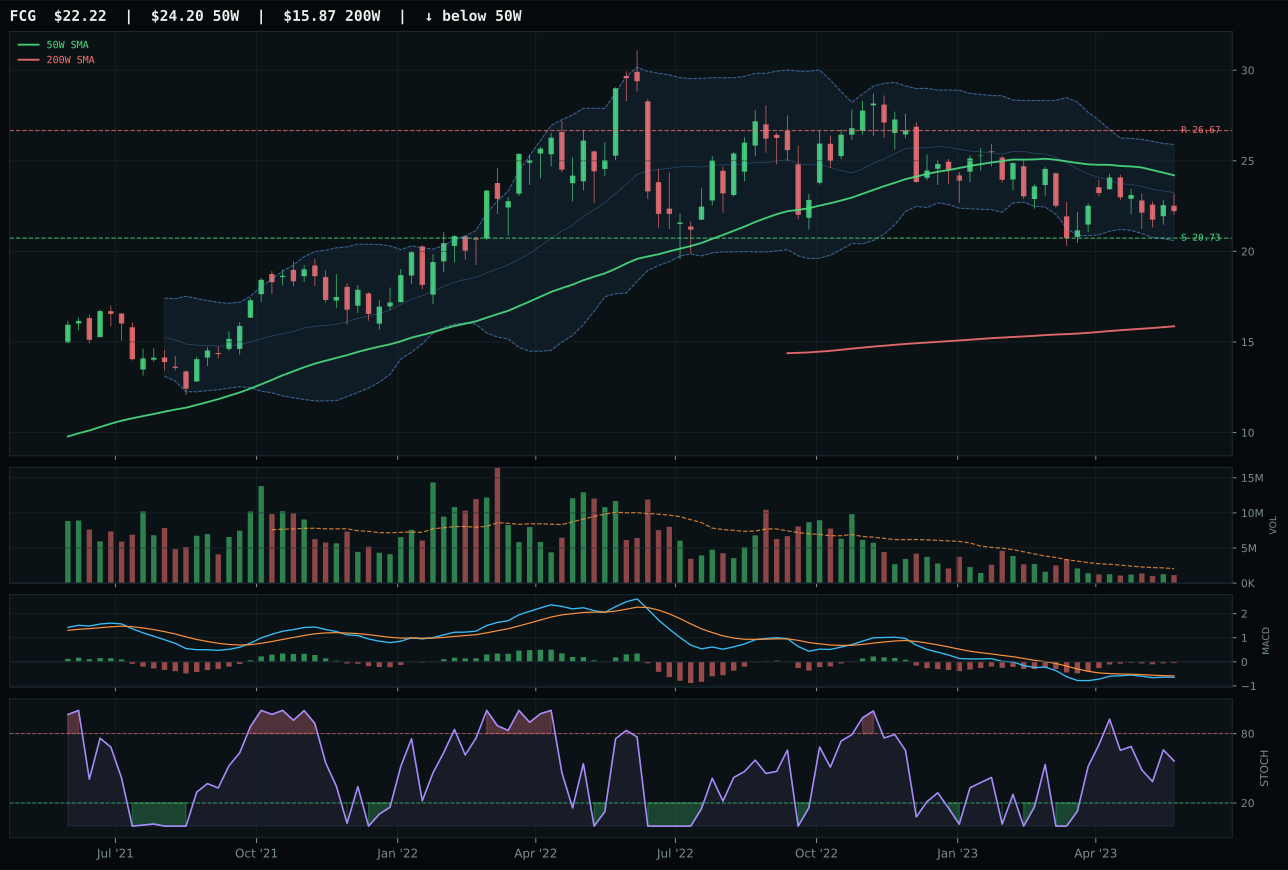
FCG has a neutral structure profile with -11.8% 13-week relative strength versus SPY.
A failed hold above support would weaken the setup.
Actionable but governed by invalidation levels.
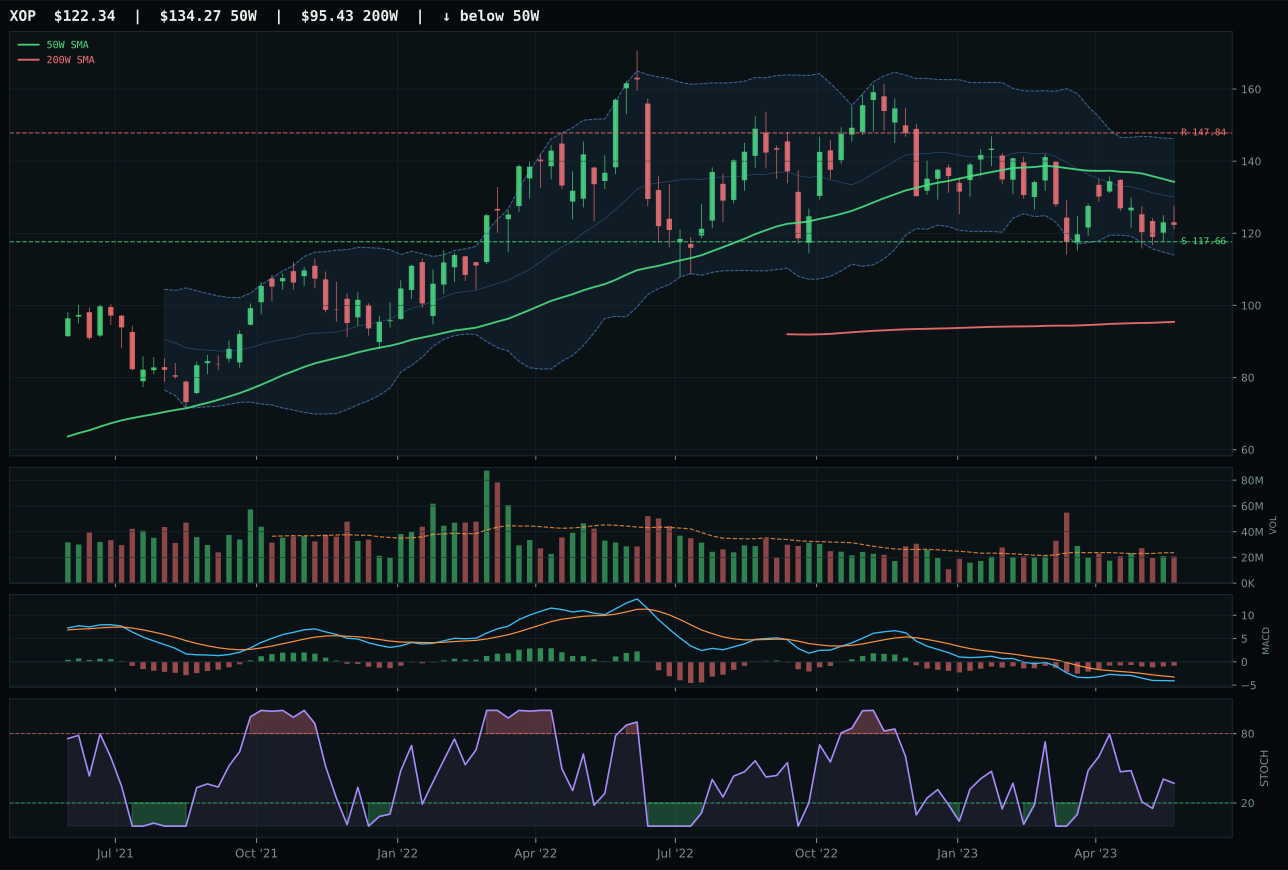
XOP has a pullback into support profile with -14.8% 13-week relative strength versus SPY.
A failed hold above support would weaken the setup.
Actionable but governed by invalidation levels.
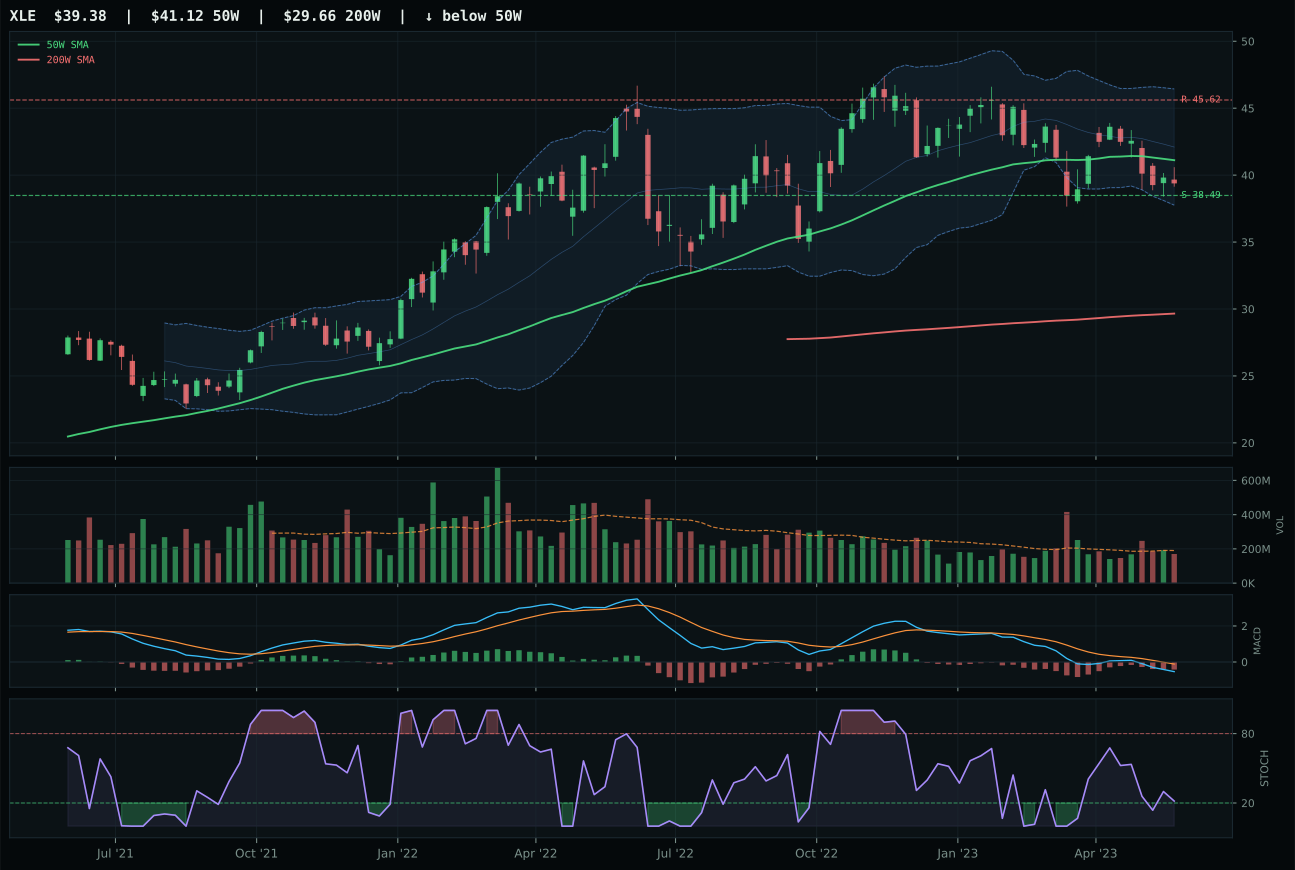
XLE has a pullback into support profile with -12.9% 13-week relative strength versus SPY.
A failed hold above support would weaken the setup.
Actionable but governed by invalidation levels.
XLE wins traditional energy by presenting the most favorable risk-reward architecture among three ETFs all showing deteriorated relative strength and bearish MACD conditions. Price sits 4.2% below the 50-week moving average (compared to FCG's neutral structure and XOP's undefined pullback), stochastic RSI is falling/neutral at 0.22 (less oversold than FCG's rising mid-zone but more neutral than XOP), and timing scores a perfect 100 for both XLE and XOP but risk/reward tips in XLE's favor at 98.0 versus 90.0 for XOP. Volume at 0.89x the 20-week average is neutral participation—thin enough to raise concerns about follow-through but thick enough to avoid the institutional desperation signal of near-zero volume. Thirteen-week return at -7.0% and RS versus SPY at -12.9% are ugly, yet XLE's structure (pullback into support at 38.49) gives defined exit placement where FCG's neutral structure and MACD rising mid-zone signal that the bottom may still be forming. Runner-up FCG has identical trend weakness but timing of only 78 and risk/reward of 86.8 because stochastic RSI is rising mid-zone, making reversal timing less certain.
Traditional Energy earned 5% allocation as tier-2, yet the category scored 0.0 after testing, making this a mechanical allocation to a fundamentally broken setup rather than a conviction position. The category-level macro fit is only 16.0/100—disinflation hurts this exposure by 10 points as falling energy costs reduce commodity complexity premiums, and both disinflation pressure (-10) and credit stress (-7) and liquidity stress (-7) gang up on demand assumptions. XLE's technical evidence is only 29.4/100, with momentum confirmation at 0.0 and volume-price confirmation at just 25.1, reflecting universal energy sector capitulation across the basket. The 5% allocation is purely mechanical: timing scores are perfect (100/100) because stochastic RSI is oversold, support is defined, and mean-reversion algorithms reward entry on extreme dislocation. This is a 'risk-reward setup, not a conviction macro play'—meaning the position is held only if entries remain dislocated and stops remain tight. Any reversal in disinflation expectations or any move above the 50W would invalidate the setup immediately, and the regime would need to shift toward stagflation or supply-shock inflation for energy to earn top-tier allocation. For now, it sits at 5% as a pure mechanical mean-reversion trade with tight exit discipline.
Industrial Metals — COPX
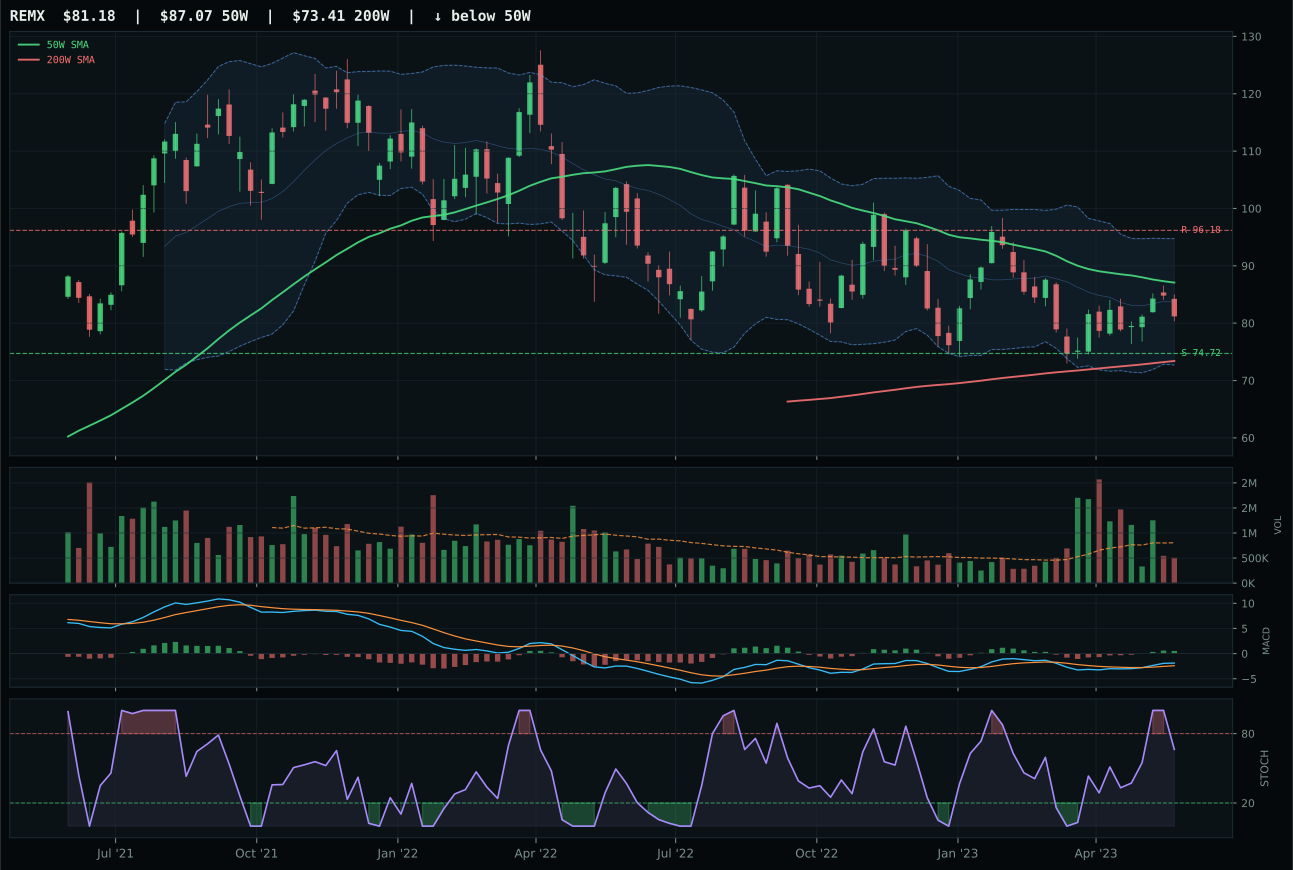
REMX has a neutral structure profile with -9.9% 13-week relative strength versus SPY.
A failed hold above support would weaken the setup.
Actionable but governed by invalidation levels.
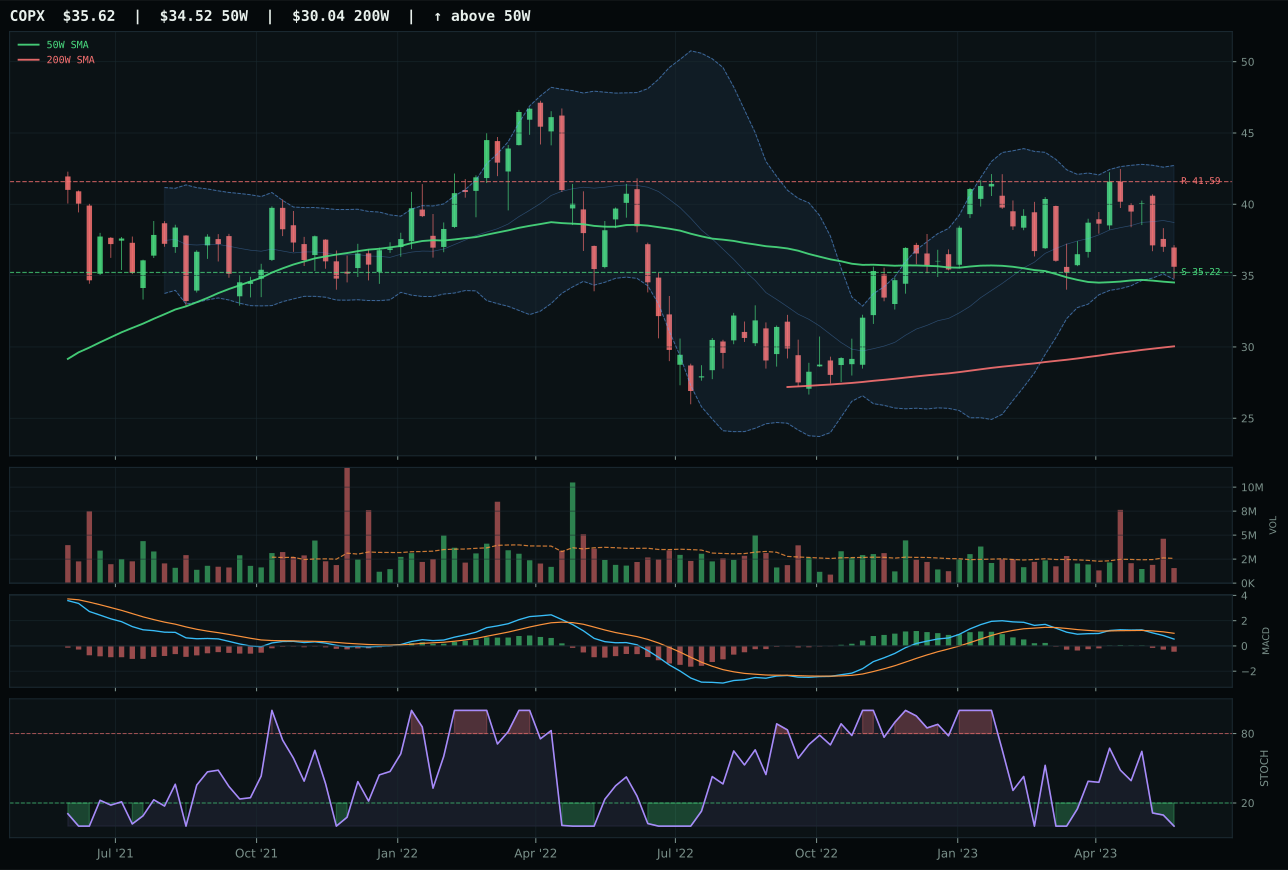
COPX has a pullback into support profile with -9.0% 13-week relative strength versus SPY.
A failed hold above support would weaken the setup.
Actionable but governed by invalidation levels.
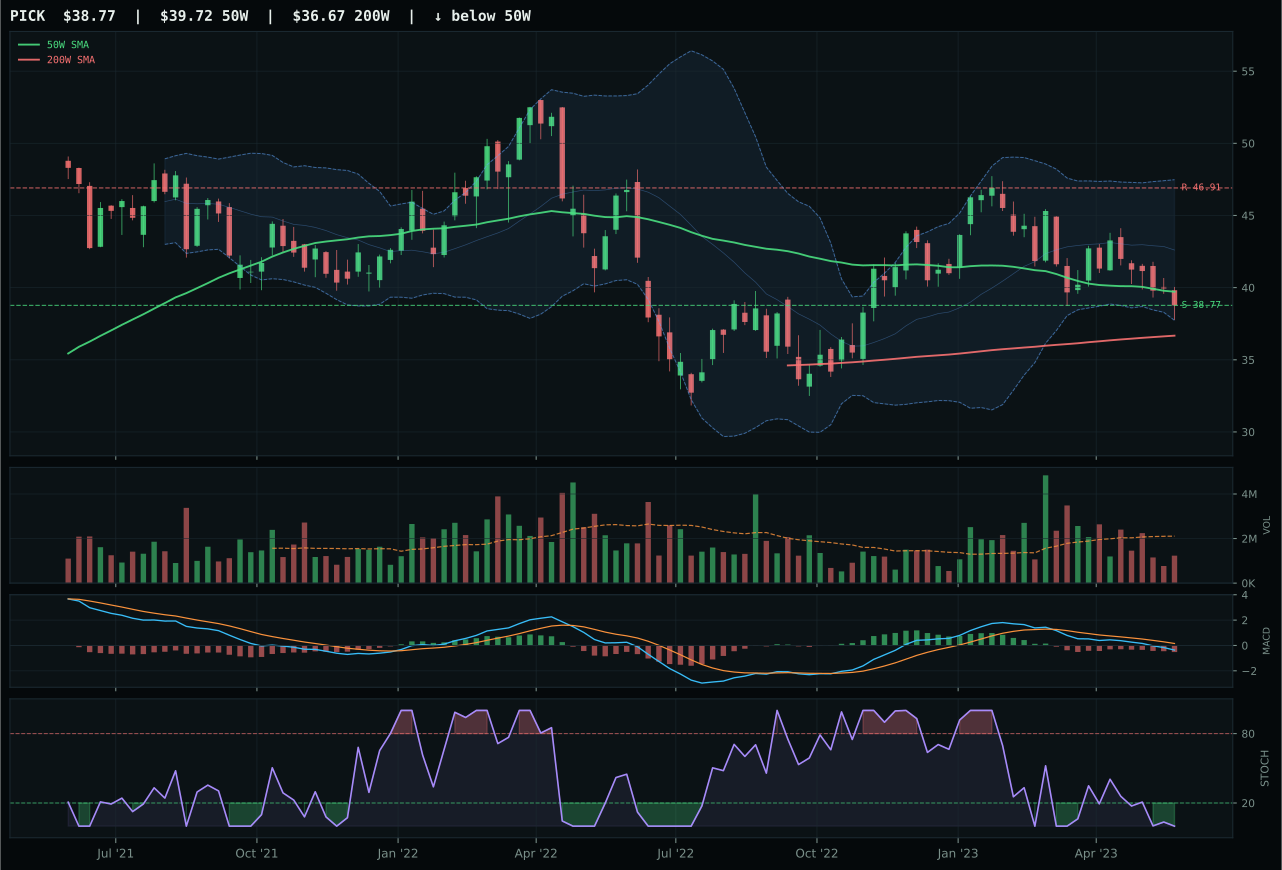
PICK has a pullback into support profile with -13.3% 13-week relative strength versus SPY.
A failed hold above support would weaken the setup.
Actionable but governed by invalidation levels.
COPX wins industrial metals by presenting the cleanest mean-reversion setup available in a category entirely composed of pullback structures all showing deteriorated relative strength and zero momentum confirmation. Price sits 3.2% from the 50-week moving average, stochastic RSI is oversold at 0.00, and timing scores a perfect 100—these are the only technical strengths in a field where thirteen-week returns are universally negative and RS versus SPY is universally worse than -9%. Runner-up REMX has superior technical evidence (64.6 versus 31.7) and shows MACD bullish and improving with rising mid-zone stochastic RSI, yet it loses the category decision because category-relative strength at 0.0% lags COPX's 0.9% and timing score collapses to 90 (versus 100) as the pullback structure is less defined. The thirteen-week return gap is trivial: COPX -3.0% versus REMX -3.9%, and both show RS versus SPY near -9%. COPX's risk/reward of 98.0 is the separator—downside to support is only 1.1%, making it mechanically the best defined reversal candidate.
Industrial Metals earned 0% allocation and ranks 9th or 10th in the category structure, entirely excluded because the final category score collapsed to 13.6 despite the 41.3 initial 3/2/1 basket score. The category-level macro fit is only 35.0/100, dragged down by liquidity stress (-8 points) and credit stress (-7 points)—these are the exact conditions that destroy industrial metal demand as capex cycles roll over and emerging market growth decelerates. COPX's technical evidence of only 31.7/100 reflects the fundamental problem: price is still above the 200W, but momentum confirmation is 0.0 and volume is thin participation. The setup is a mechanical reversal candidate only if buyers actually appear; there is no evidence that they have. For industrial metals to earn allocation, credit stress would need to ease (reducing refinancing risk for miners and end-users), liquidity conditions would need to normalize (to support speculative buying), and risk appetite would need to return (to justify capex spending in emerging markets). The current regime offers none of these. A 5% slot held only by a perfect-timing stochastic RSI setup and an undefined 1.1% support level is a capital trap, not an opportunity.
Agriculture & Livestock — WEAT
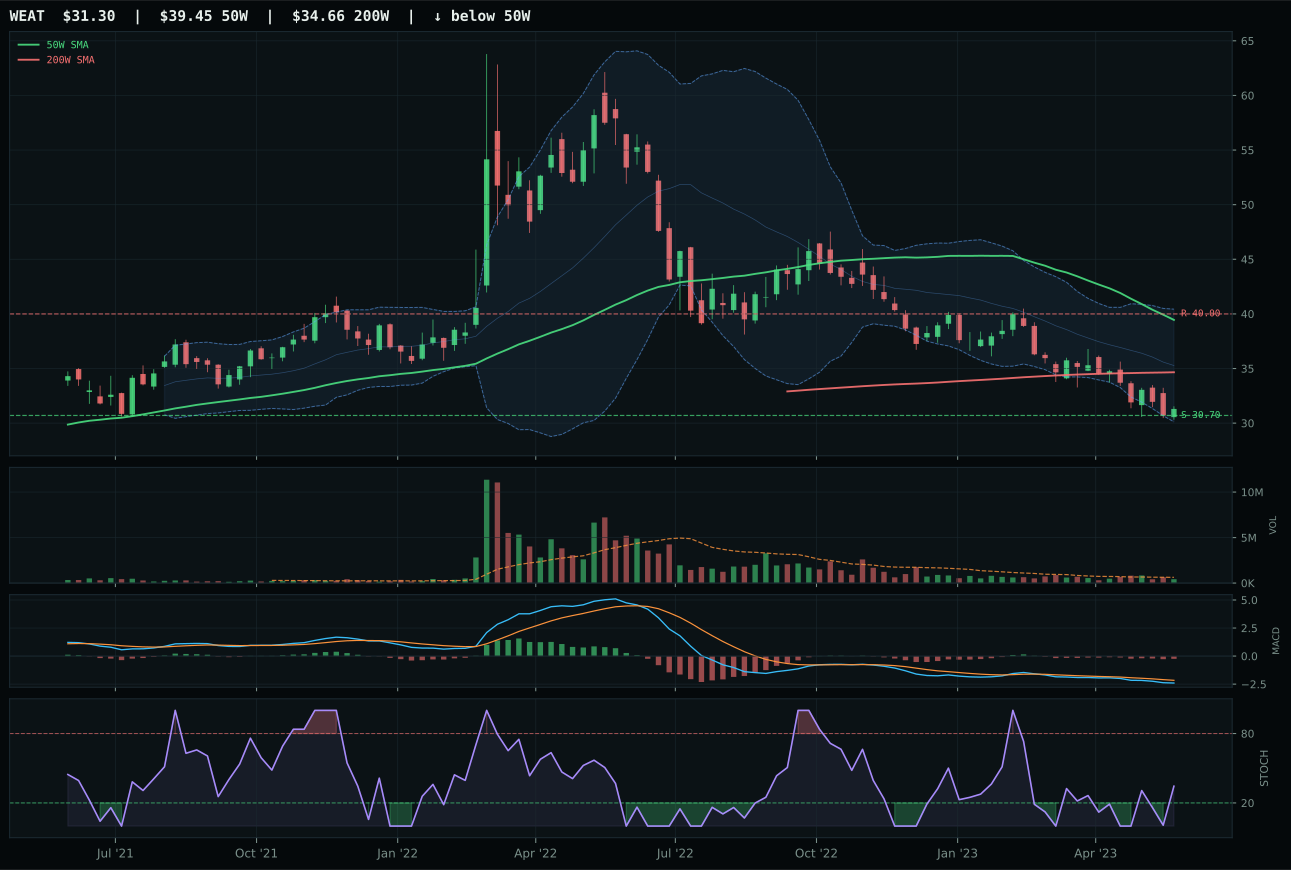
WEAT has a pullback into support profile with -19.7% 13-week relative strength versus SPY.
A failed hold above support would weaken the setup.
Actionable but governed by invalidation levels.
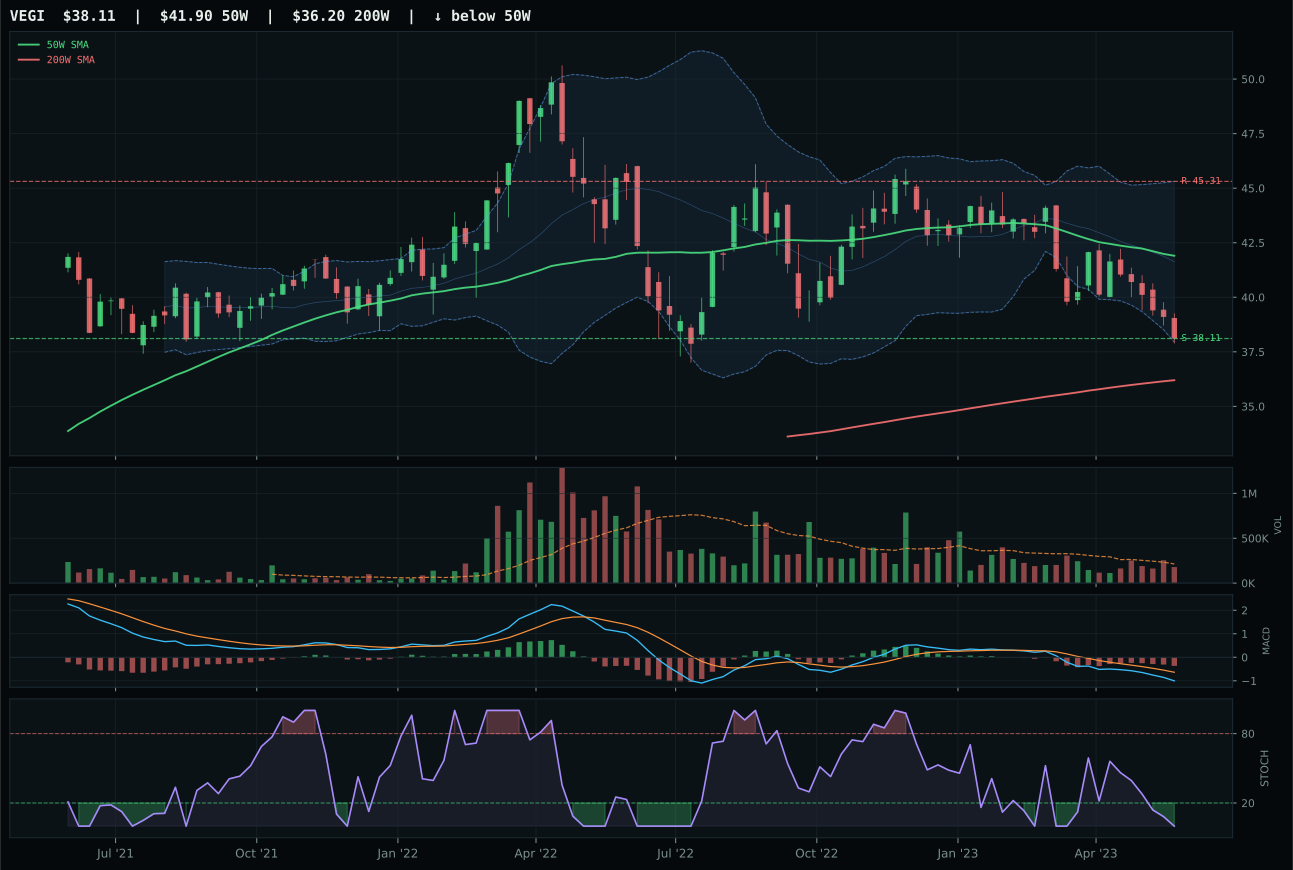
VEGI has a pullback into support profile with -17.3% 13-week relative strength versus SPY.
A failed hold above support would weaken the setup.
Tracked, but not top-2 eligible because: .
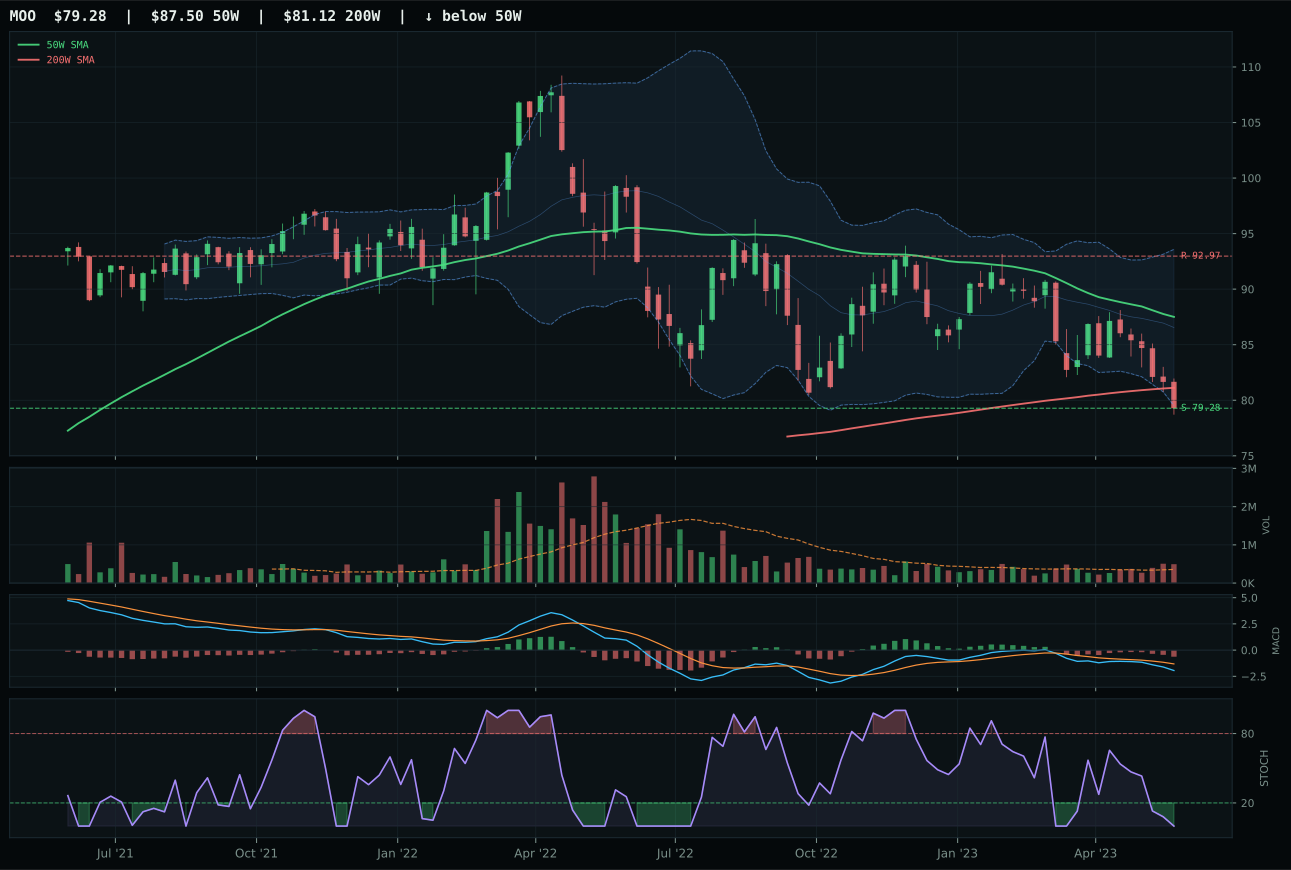
MOO has a pullback into support profile with -16.8% 13-week relative strength versus SPY.
A failed hold above support would weaken the setup.
Actionable but governed by invalidation levels.
WEAT wins a category so weak it earned 0% allocation, posting the least-bad composite of a trio all trading below both major moving averages with zero momentum confirmation. The thirteen-week return of -13.8%, RS versus SPY of -19.7%, and momentum confirmation of 0.0/100 are disqualifying metrics, yet WEAT's risk/reward of 90.0/100 (downside to support is only 2.0%) and rising mid-zone stochastic RSI (0.34) give it a fractionally cleaner recovery setup than VEGI, which is oversold and lacks the positive stochastic divergence. Runner-up VEGI has worse risk/reward (80.8), identical MACD weakness, and is simply further into the drawdown. The 6.6-point gap between WEAT and VEGI is not evidence of strength—it is the difference between 'still broke but with technical recovery potential' versus 'completely broken.' All three ETFs in the category show price below the 50W and 200W, volume thin to neutral, and disinflation pressure reading -8 on the macro side.
Agriculture & Livestock received 0% allocation and ranks 9th or 10th in the category hierarchy, entirely excluded from the portfolio because the final category score collapsed to 0.0 after the reasoner tested the 23.7 initial basket score against macro conditions and setup quality. The category-level macro fit is only 32.0/100—disinflation hurts this exposure by 6 points, disinflation pressure is active at -8 more, and liquidity stress contributes another -4. This is not a close call: agricultural commodities are structural victims of the current macro regime, where falling input costs and global oversupply erode pricing power faster than demand growth can offset. The technical evidence is uniformly poor across all three ETFs; WEAT's 0.0 momentum confirmation and VEGI's -5.8% RS versus SPY are not temporary setbacks but regime-driven repricing. For agriculture to re-enter the allocation, the macro regime would need to shift toward inflation fears, credit easing (to lift commodity demand from emerging markets), or a geopolitical supply shock. None of those conditions are present in the current disinflation landscape.