
2023-05-19
Informational purposes only. The content in this report, including allocations, analysis, and commentary, is provided solely for informational and educational purposes. It does not constitute financial advice, investment advice, trading advice, or any other type of advice. Past performance does not guarantee future results. Always conduct your own research and consult a qualified financial professional before making investment decisions.
Weekly Allocation
| Ticker | Category | Weight | Role |
|---|---|---|---|
| FBTC | 50% | Overlay | |
| GLD | Precious Metals | 10% | Top-2 (10%) |
| PAVE | Utilities & Infrastructure | 10% | Top-2 (10%) |
| SMH | AI | 5% | Tier-2 (5%) |
| XLK | Technology | 5% | Tier-2 (5%) |
| URNM | Nuclear Energy | 5% | Tier-2 (5%) |
| COPX | Industrial Metals | 5% | Tier-2 (5%) |
| XAR | Defense & Aerospace | 5% | Tier-2 (5%) |
| ILF | Emerging Markets | 5% | Tier-2 (5%) |
Trade Instructions — Monday Open
Sell the tranche from 2023-04-21 (completing its 4-week hold). Buy the new tranche. Instructions show net portfolio changes — same-asset positions cancel, weight changes show the delta.
| Action | Ticker | Instruction |
|---|---|---|
| SELL | IGV | Sell entire IGV position (2.50% of portfolio) |
| SELL | XLU | Sell entire XLU position (1.25% of portfolio) |
| SELL | BOTZ | Sell 33% of BOTZ position (reduce 3.75% → 2.50%) |
| SELL | ITA | Sell 50% of ITA position (reduce 2.50% → 1.25%) |
| SELL | URA | Sell 33% of URA position (reduce 3.75% → 2.50%) |
| SELL | VEGI | Sell entire VEGI position (1.25% of portfolio) |
| BUY | XLK | Buy XLK — 14.29% of freed cash (adds 1.25% to portfolio) |
| BUY | ILF | Buy ILF — 14.29% of freed cash (adds 1.25% to portfolio) |
| BUY | PAVE | Buy PAVE — 28.57% of freed cash (adds 2.50% to portfolio) |
| BUY | XAR | Buy XAR — 14.29% of freed cash (adds 1.25% to portfolio) |
| BUY | URNM | Buy URNM — 14.29% of freed cash (adds 1.25% to portfolio) |
| BUY | SMH | Buy SMH — 14.29% of freed cash (adds 1.25% to portfolio) |
Current Portfolio After Trade
Combined holdings across all 4 active tranches. Each tranche is 25% of the portfolio.
| Ticker | % of Portfolio | Weight Bar |
|---|---|---|
| FBTC | 50.00% | |
| GLD | 10.00% | |
| PAVE | 7.50% | |
| COPX | 5.00% | |
| XLK | 5.00% | |
| XAR | 3.75% | |
| BOTZ | 2.50% | |
| URA | 2.50% | |
| IGF | 2.50% | |
| ILF | 2.50% | |
| INDA | 2.50% | |
| URNM | 2.50% | |
| ITA | 1.25% | |
| XLE | 1.25% | |
| SMH | 1.25% |
Macro Regime — Disinflation
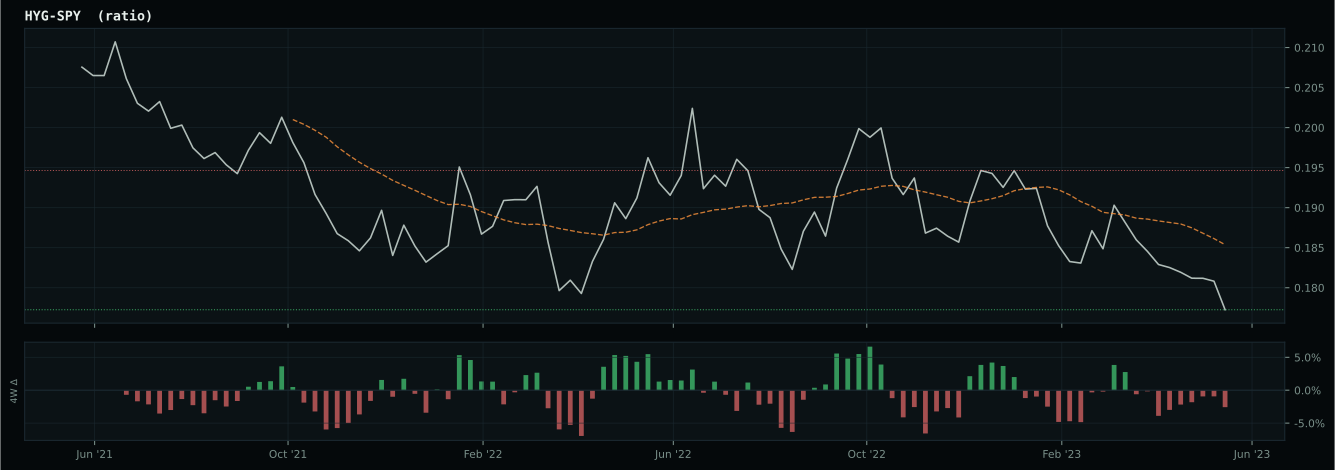
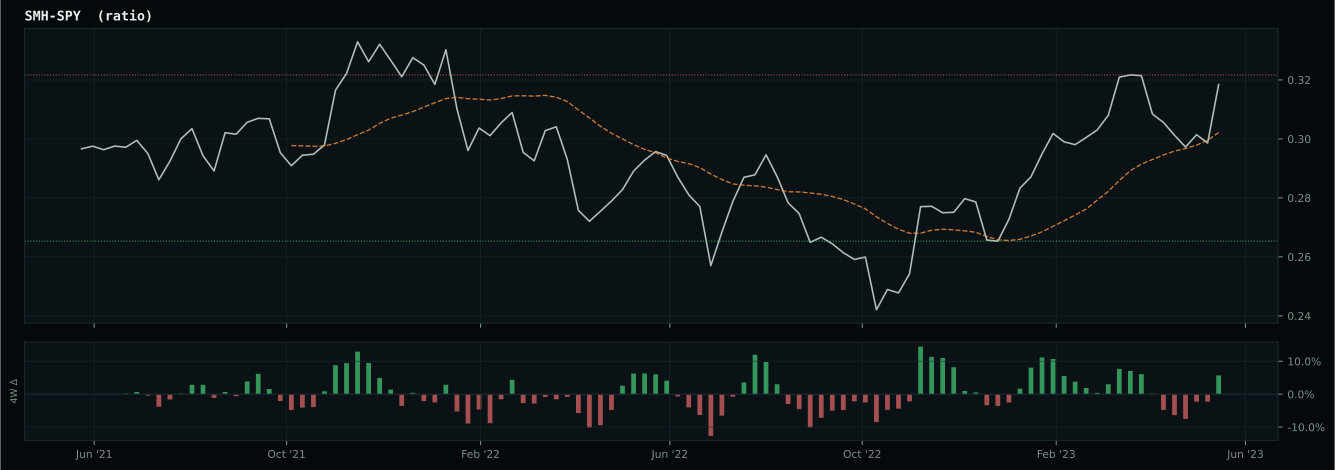
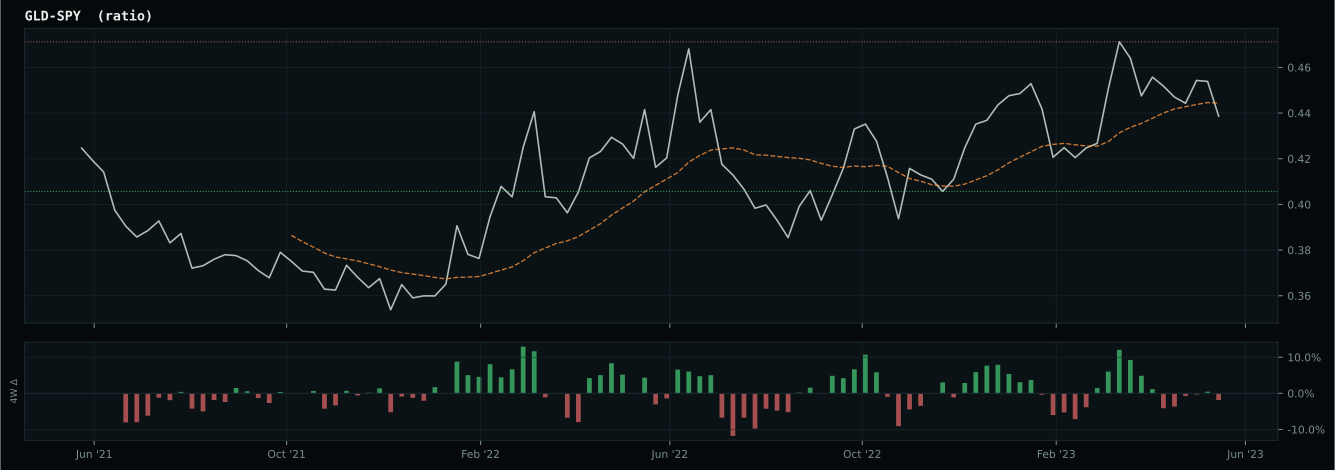
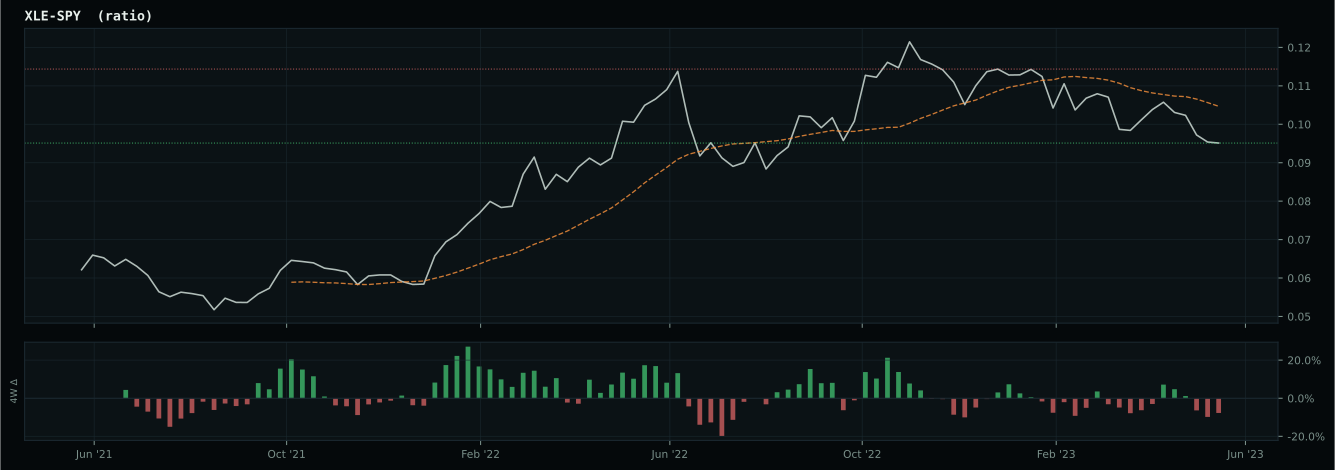
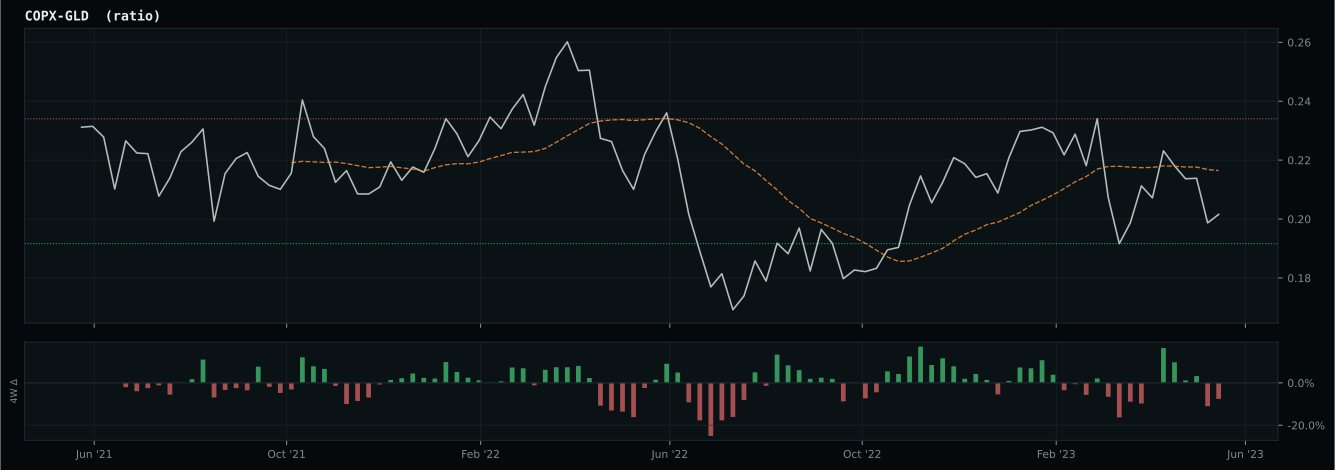
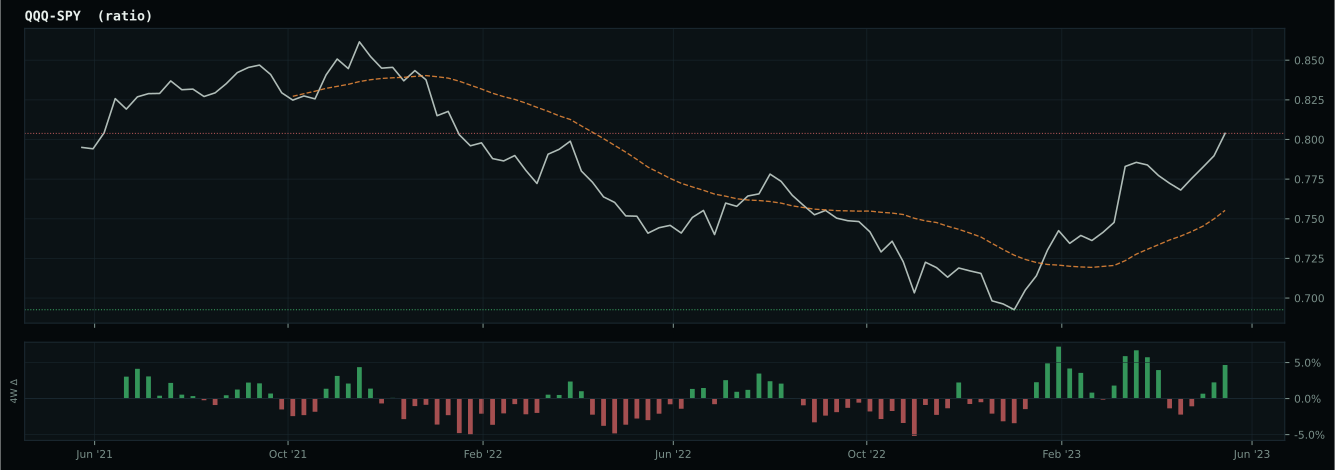
Macro Evidence Charts
Market-implied signals behind the macro regime scores. Each ratio compares two assets; the direction and slope of the ratio is what the macro engine reads.
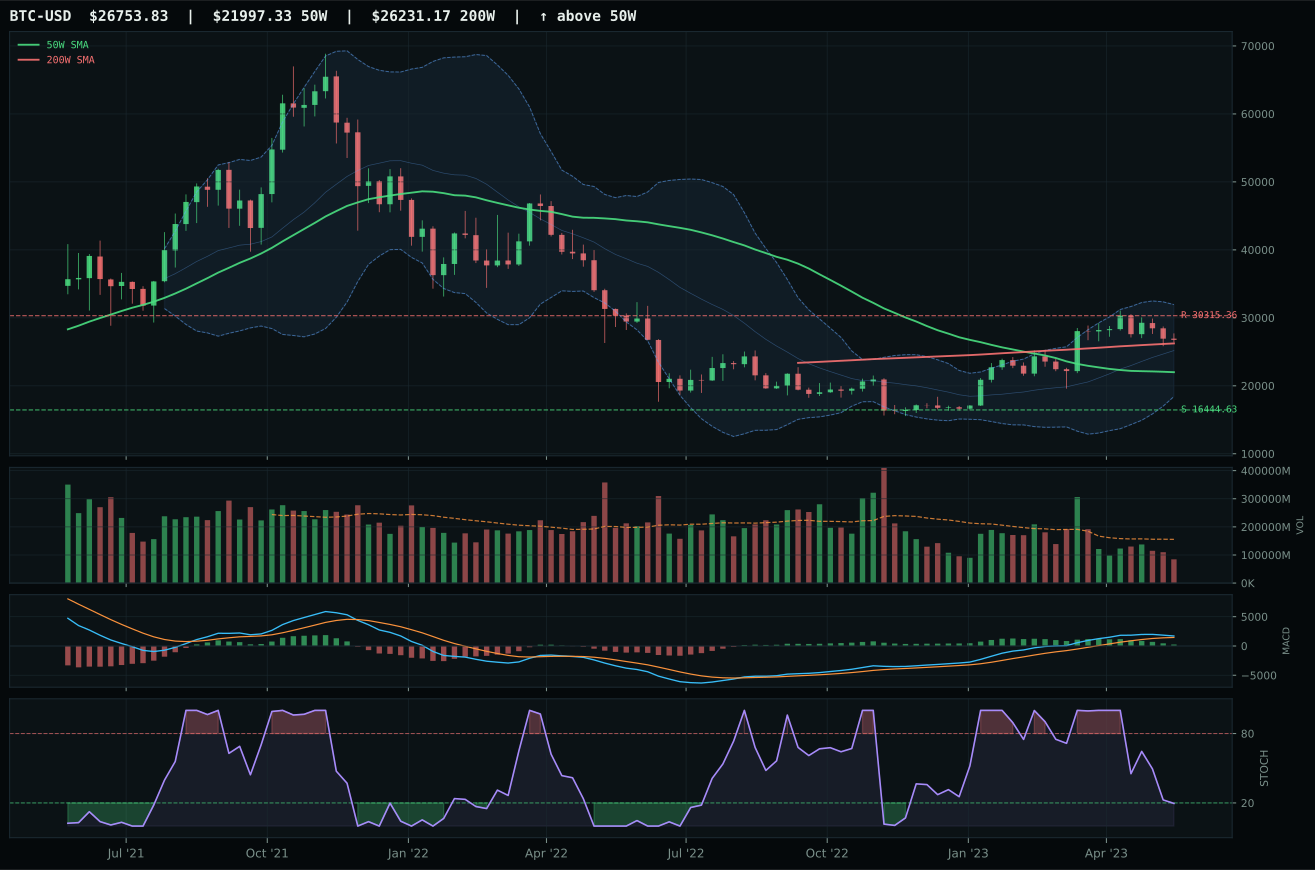
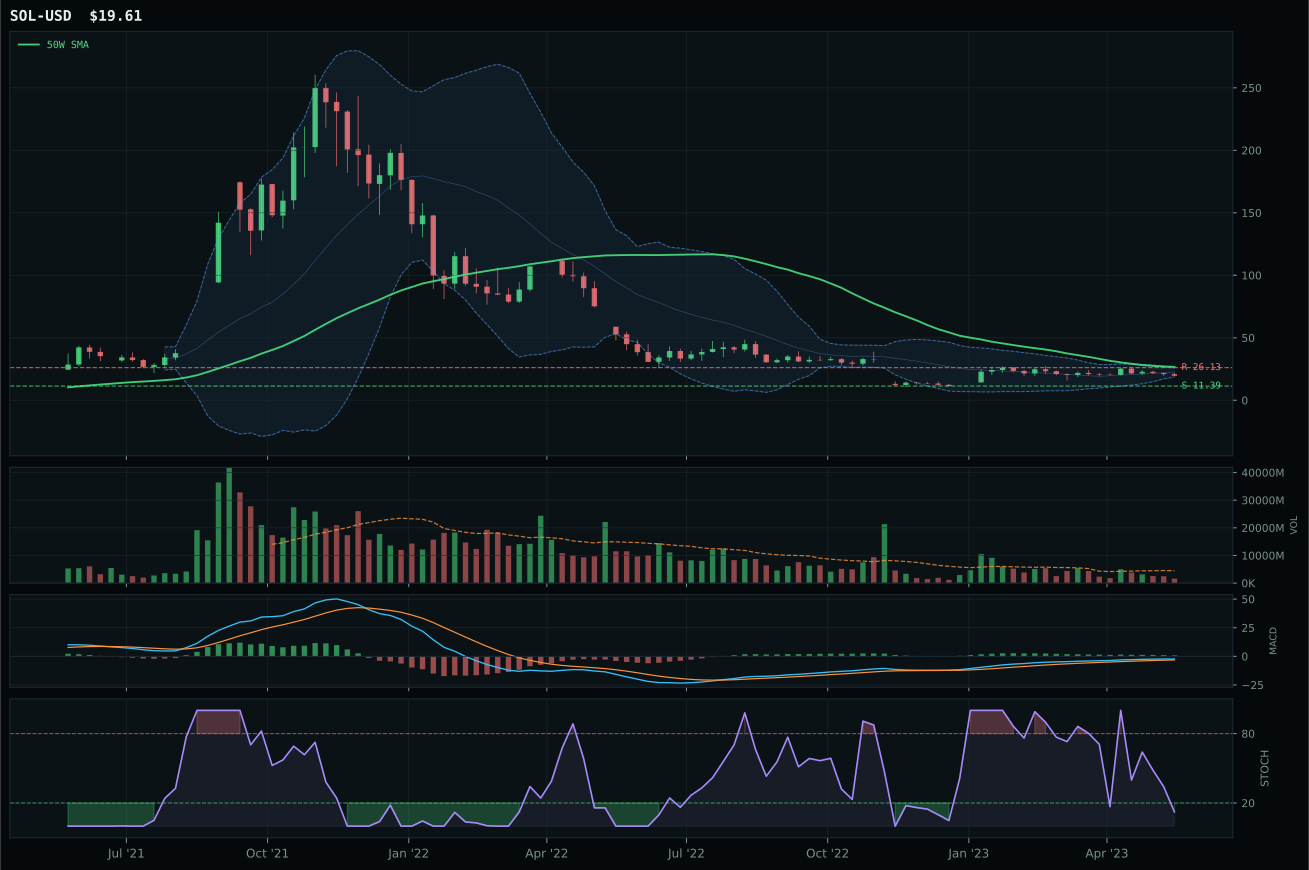
Crypto Regime — ValueBTC
post-touch structure is too wide to count as a range; max/min close ratio is 1.86
TrendBTC not confirmed
one or more available conditions failed
Category Rankings
| Rank | Category | Winner | Score | Alloc | 4W Ret | Peers (4W) |
|---|---|---|---|---|---|---|
| 1 | Precious Metals | GLD | 71.6 | 20% | -1.72% | GDX -3.9% · SLV -2.1% |
| 2 | Utilities & Infrastructure | PAVE | 63.9 | 20% | +6.53% | IGF -1.3% · XLU +0.4% |
| 3 | AI | SMH | 62.1 | 10% | +15.59% | BOTZ +10.8% · AIQ +12.0% |
| 4 | Technology | XLK | 61.6 | 10% | +9.45% | IGV +9.8% · CIBR +8.2% |
| 5 | Nuclear Energy | URNM | 39.1 | 10% | +12.69% | URA +12.2% · NLR +8.9% |
| 6 | Industrial Metals | COPX | 38.6 | 10% | +5.27% | REMX +1.2% · PICK +3.4% |
| 7 | Defense & Aerospace | XAR | 37.3 | 10% | +3.69% | ITA +2.6% · ROKT +3.6% |
| 8 | Emerging Markets | ILF | 27.3 | 10% | +7.83% | INDA +4.6% · IEMG +2.7% |
| 9 | Agriculture & Livestock | MOO | 13.1 | 0% | +0.55% | VEGI +1.6% · WEAT +12.1% |
| 10 | Traditional Energy | FCG | 4.0 | 0% | +2.58% | XOP +2.6% · XLE +0.4% |
Precious Metals — GLD
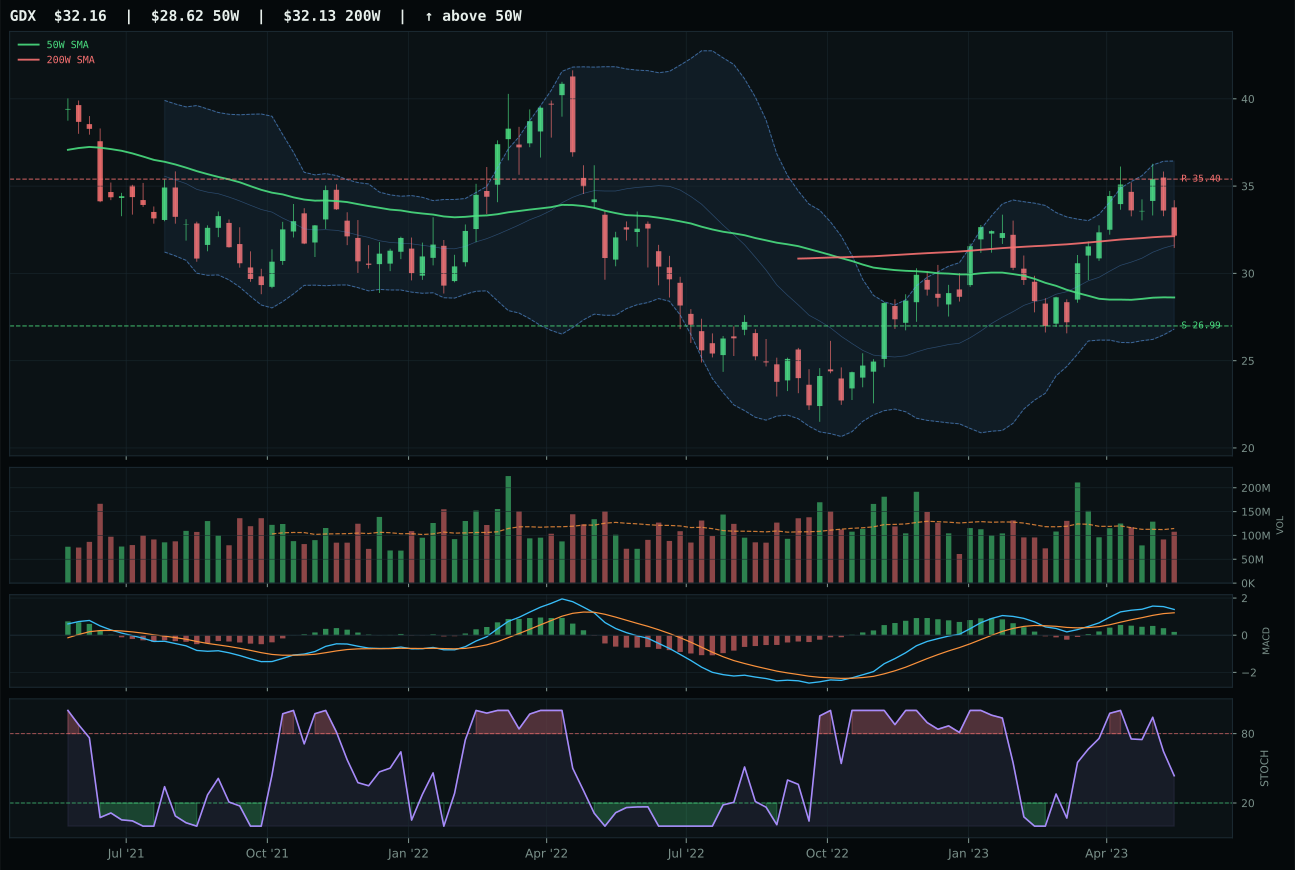
GDX has a neutral structure profile with 10.4% 13-week relative strength versus SPY.
A failed hold above support would weaken the setup.
Actionable but governed by invalidation levels.
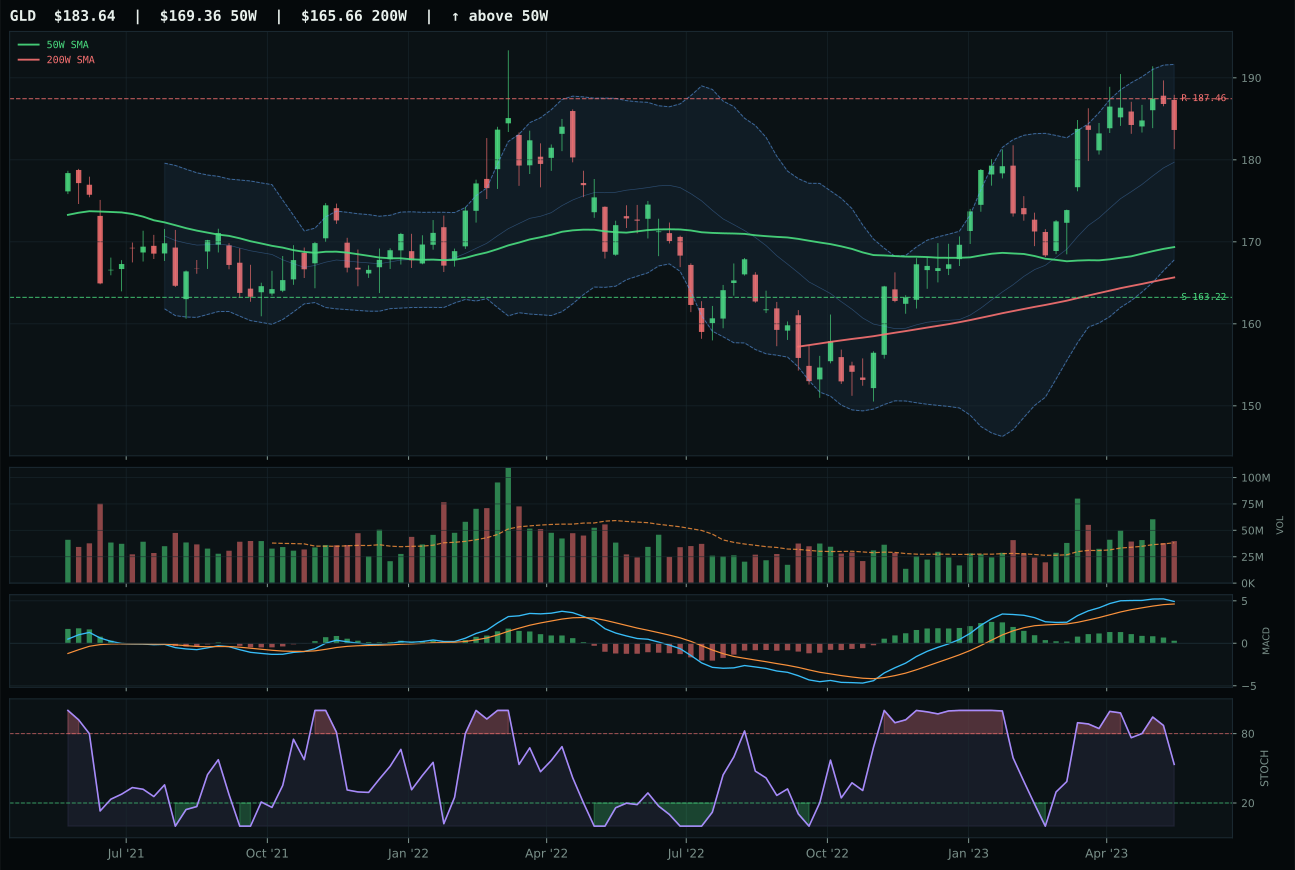
GLD has a neutral structure profile with 4.4% 13-week relative strength versus SPY.
A failed hold above support would weaken the setup.
Actionable but governed by invalidation levels.
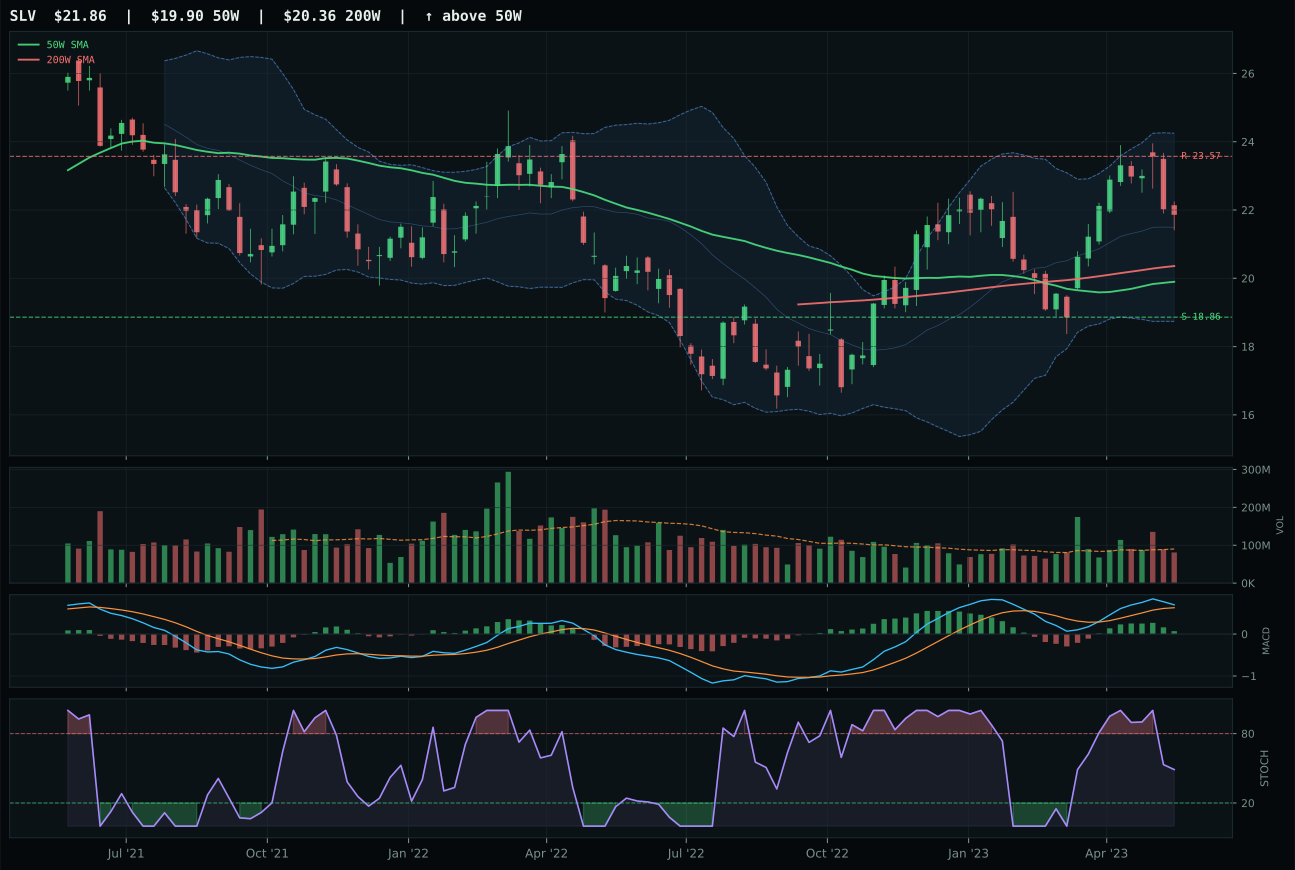
SLV has a neutral structure profile with 6.5% 13-week relative strength versus SPY.
A failed hold above support would weaken the setup.
Actionable but governed by invalidation levels.
GLD clinched top-2 status by posting the highest category score at 71.6 and maintaining a defensive structure ideal for a disinflation regime. Price sits 8.4% above the 50W with a slope holding at 0.1%, neutral volume at 1.04x average, and stochastic RSI falling from overbought—a picture of controlled ascent without panic distribution. The 13W return of 7.2% and 4.4% SPY-relative strength demonstrate real money flow, not just technical reversals. MACD is bullish but flattening at the same level as GDX, forcing the decision onto structure purity: GLD scored 72.8/100 versus GDX's 70.7, a marginal but decisive gap. GDX posted superior technical evidence at 75.2/100 and a sharper 13.2% 13-week return, but macro fit collapsed at 46.0/100 due to liquidity stress at -9 and credit stress at -7, whereas GLD's 68.0/100 macro fit benefited from a +14 monetary hedge bid. The tight race reflects genuine category strength; both structures work.
Precious Metals earned 10% as a top-2 overweight because the category scored 71.6, placing it second only to Utilities & Infrastructure at 63.9 in the allocation hierarchy. The macro case is explicit: monetary hedge bid is active at +14, disinflation pressure adds +8, yet risk appetite positive subtracts -4. The net result is a category that works precisely because it defends against macro stress—rising duration, falling growth expectations, potential credit tension. At a 10% allocation (doubled from the standard 5% tier-2 slot due to the 50% overlay), this represents the highest conviction in real assets and hedges among the nine active categories. GLD's trend structure of 100/100 and pricing stability near resistance at 187.46 suggest limited upside room, but the allocation targets stability and liquidity, not outsized gains. This is capital allocated for portfolio insurance, not excess returns.
Utilities & Infrastructure — PAVE
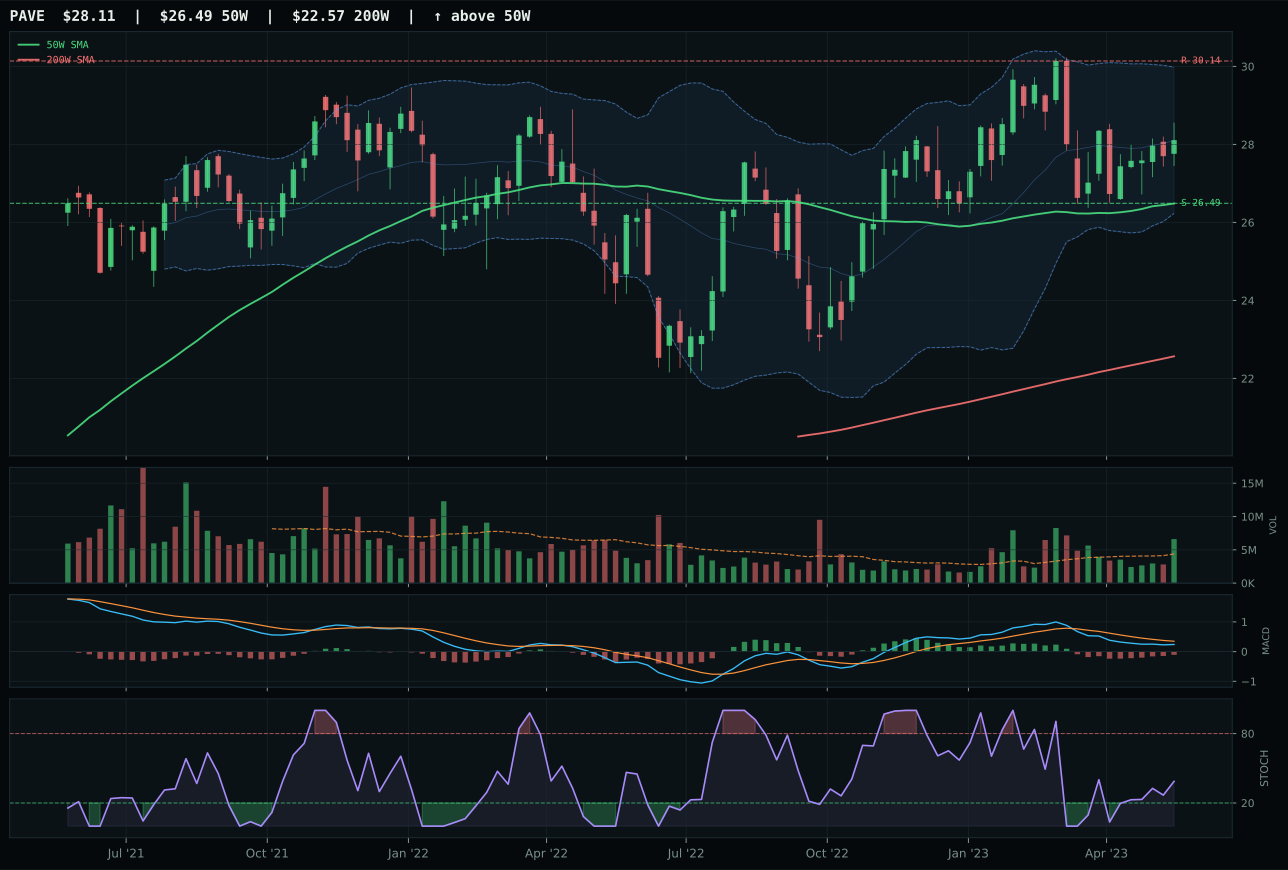
PAVE has a neutral structure profile with -7.6% 13-week relative strength versus SPY.
A failed hold above support would weaken the setup.
Actionable but governed by invalidation levels.
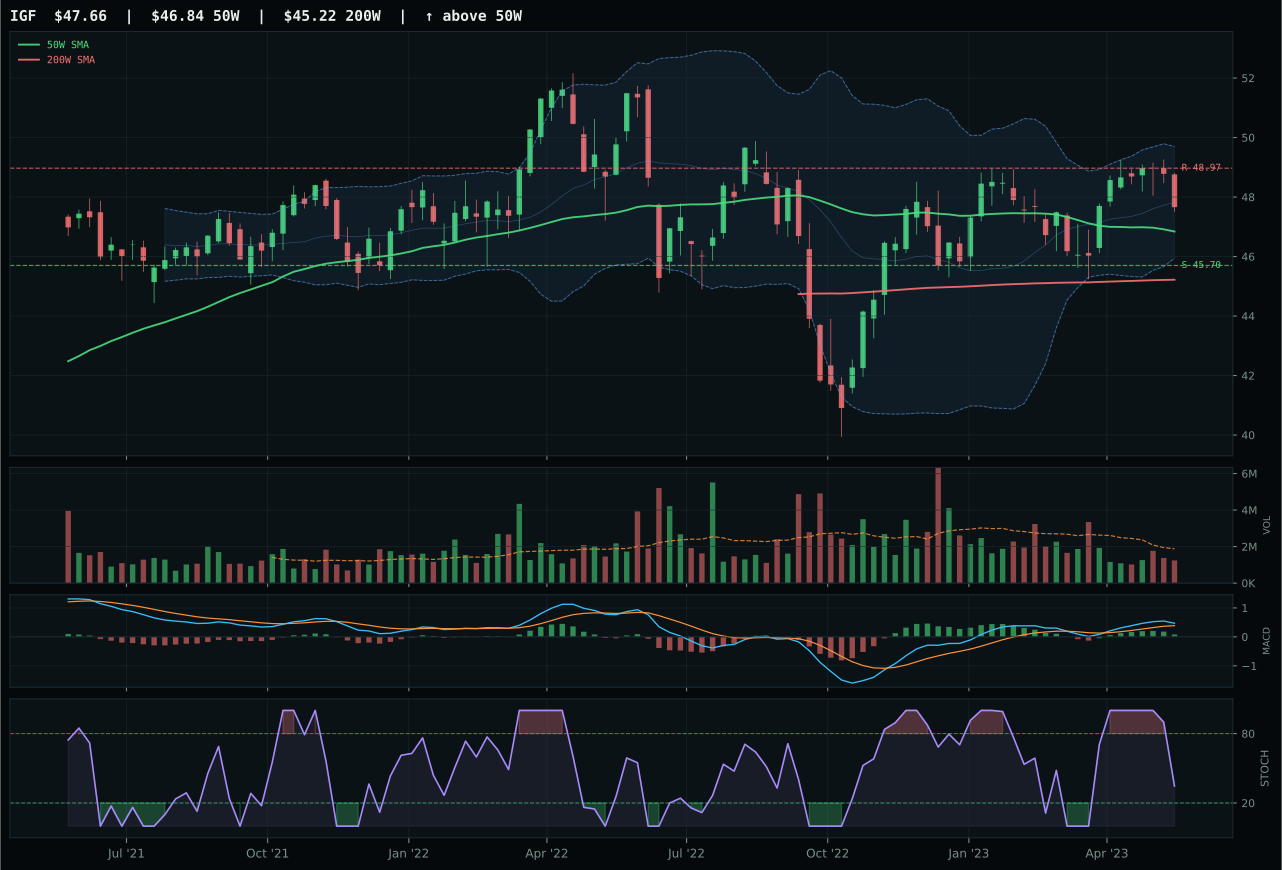
IGF has a pullback into support profile with -2.8% 13-week relative strength versus SPY.
A failed hold above support would weaken the setup.
Actionable but governed by invalidation levels.
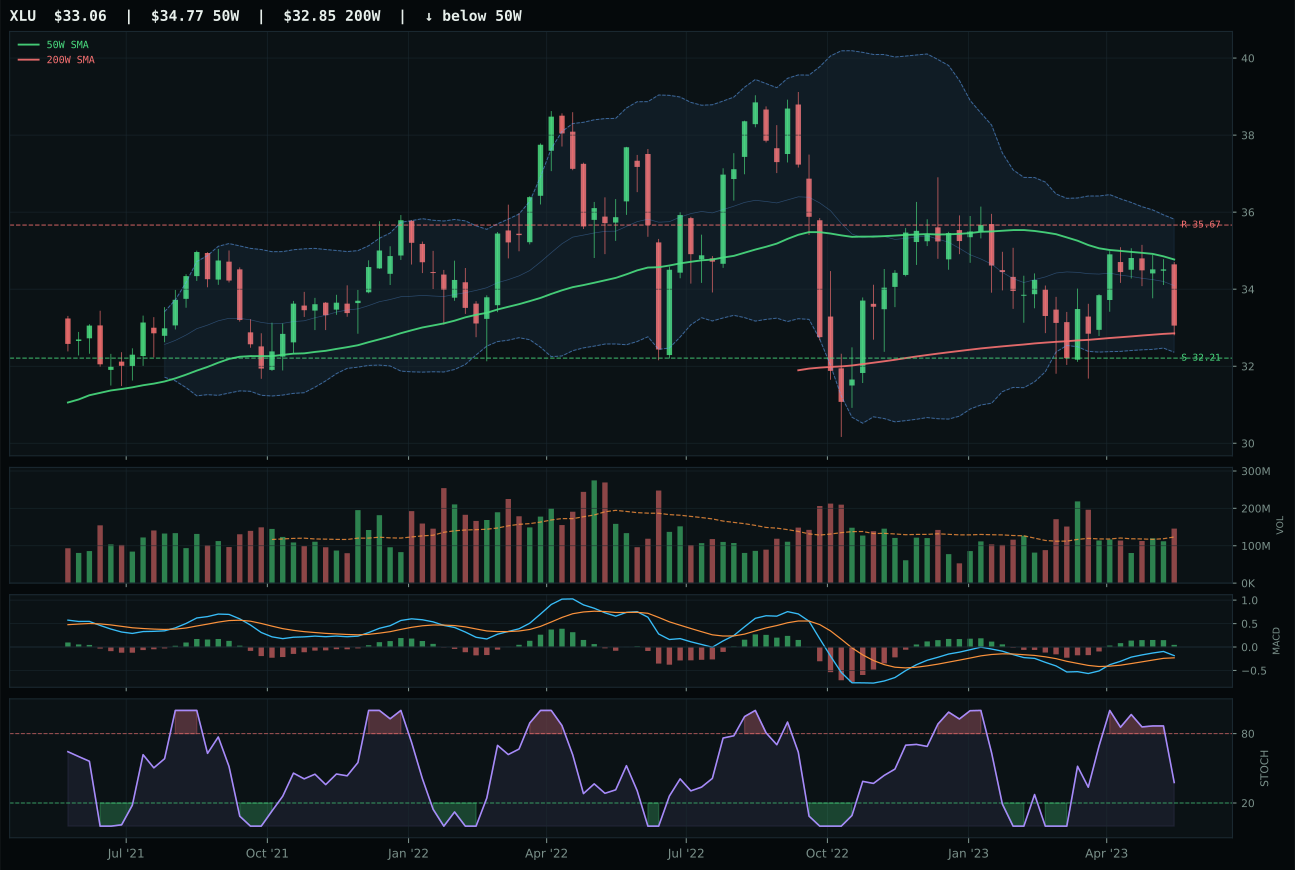
XLU has a pullback into support profile with -6.3% 13-week relative strength versus SPY.
A failed hold above support would weaken the setup.
Actionable but governed by invalidation levels.
PAVE clinched top-2 status by combining disciplined trend structure with volume confirmation that peers could not match. Price sits 6.1% above the 50W with a slope of 0.2%, trend scored 81.6/100, and structure cleanliness registered 66.7 versus IGF's 55.0—a material difference reflecting better chart geometry. Volume-price confirmation of 68.9/100 is buoyed by accumulation at 1.51x average, whereas IGF shows thin participation and IGF's stochastic RSI is falling/neutral compared to PAVE's rising mid-zone at 0.39. Risk-reward of 69.8/100 gives PAVE 6.1% downside to support and only -6.7% upside to resistance, creating balanced asymmetry. MACD is bearish but improving across both names, but PAVE's rising oscillator and heavy volume provide forward momentum confirmation. The 3.0-point margin is comfortable; PAVE is the clear representative.
Utilities & Infrastructure earned 10% as a top-2 overweight with a category score of 63.9, placing it second-highest in the allocation hierarchy. The macro case is explicitly supportive: disinflation helps this exposure at +7 (one of the few positive scoring descriptors this week), and disinflation pressure adds +6. The 62.0/100 macro fit combined with PAVE's technical evidence of 77.7/100 creates a category that is both structurally sound and macro-aligned. Liquidity stress subtracts -3 and risk appetite positive subtracts -2 due to duration sensitivity in a tightening regime, yet these are minor headwinds. At 10% allocation, this represents the portfolio's second-highest conviction positioning, justified by PAVE's volume sponsorship, rising oscillators, and defensive characteristics that suit a disinflation macro. The allocation reflects confidence that infrastructure capex and utility dividends are safe-haven expressions of positive disinflation bias. Further strength would require either a technical extension reset or a shift in relative performance versus financials to justify continued overweight.
AI — SMH
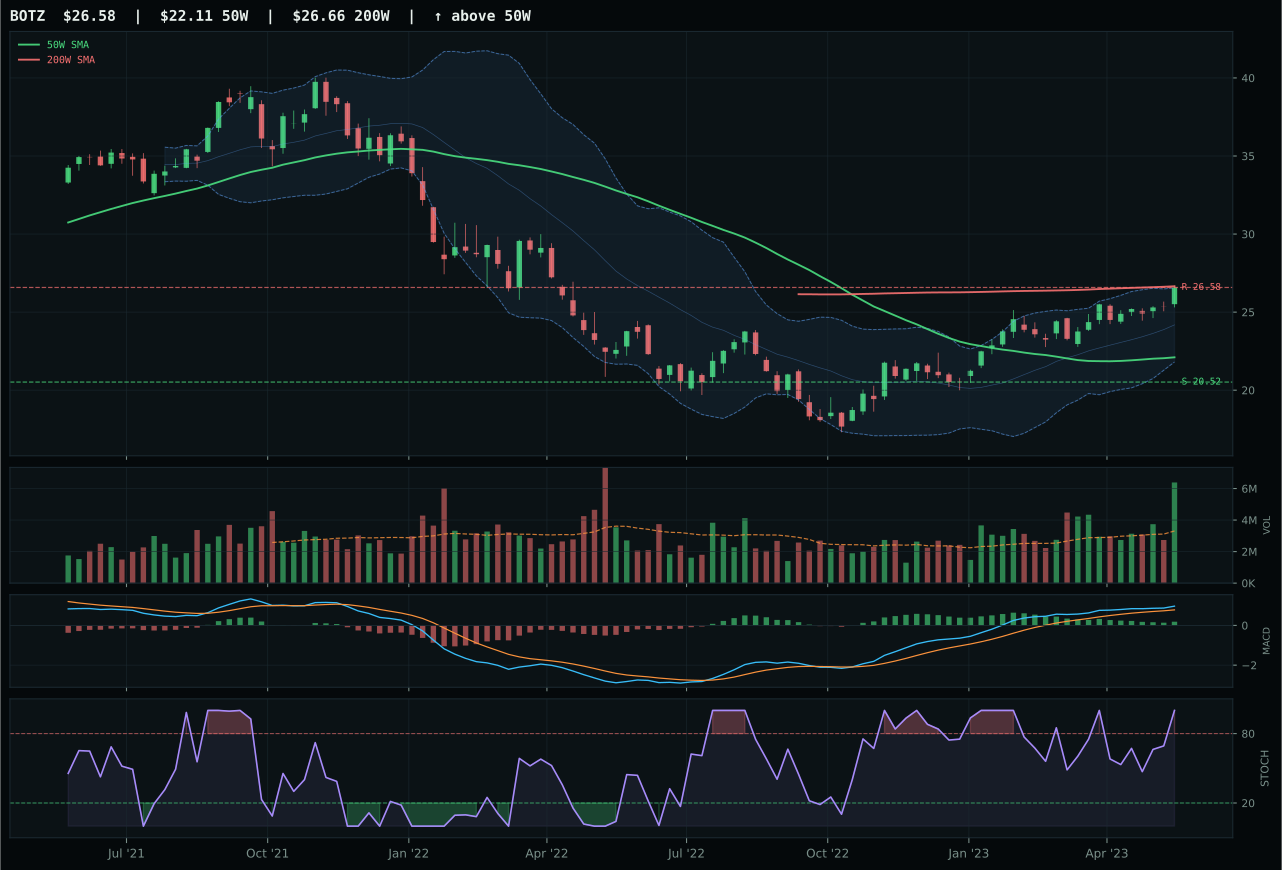
BOTZ has a vertical extension profile with 9.9% 13-week relative strength versus SPY.
A failed hold above support would weaken the setup.
Actionable but governed by invalidation levels.
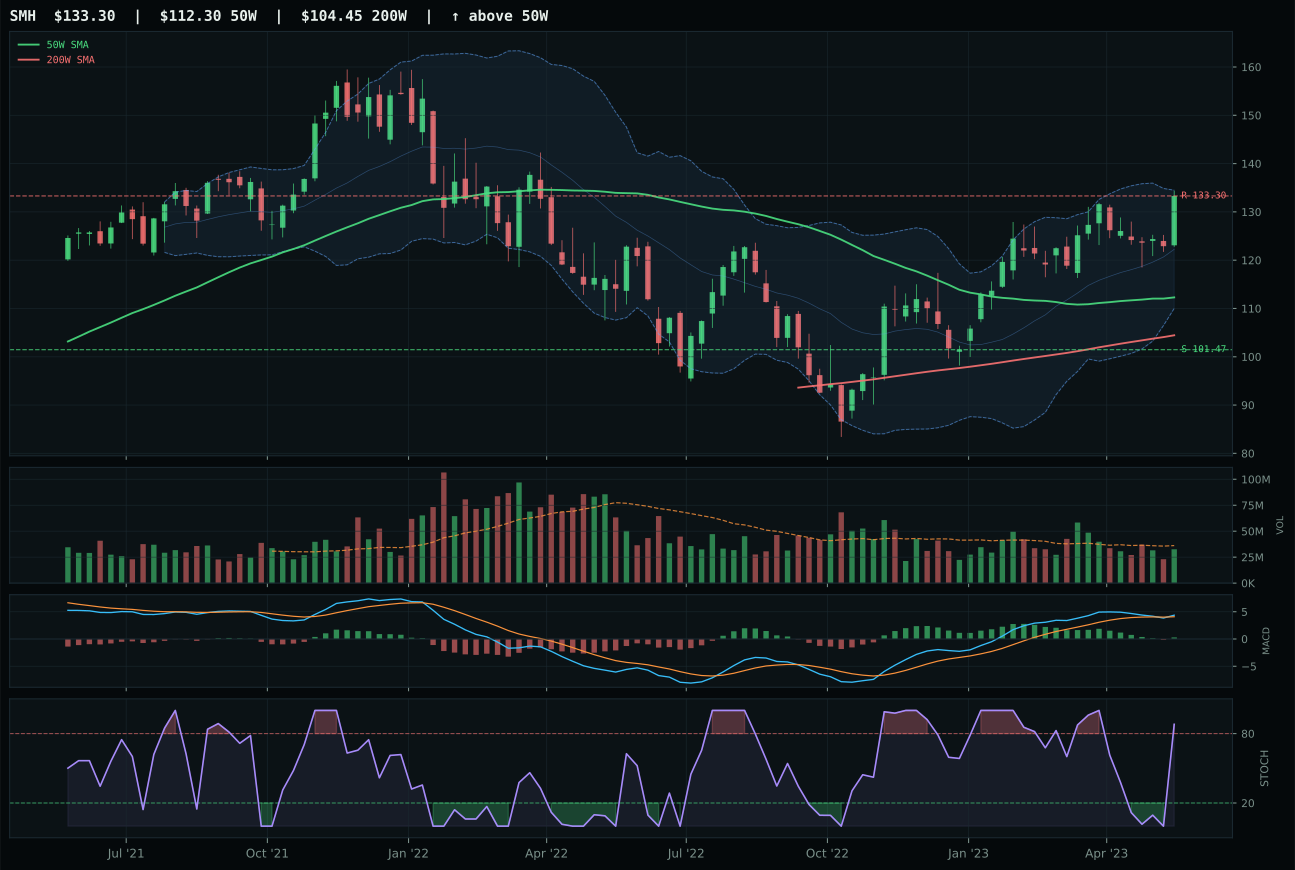
SMH has a vertical extension profile with 7.0% 13-week relative strength versus SPY.
A failed hold above support would weaken the setup.
Actionable but governed by invalidation levels.
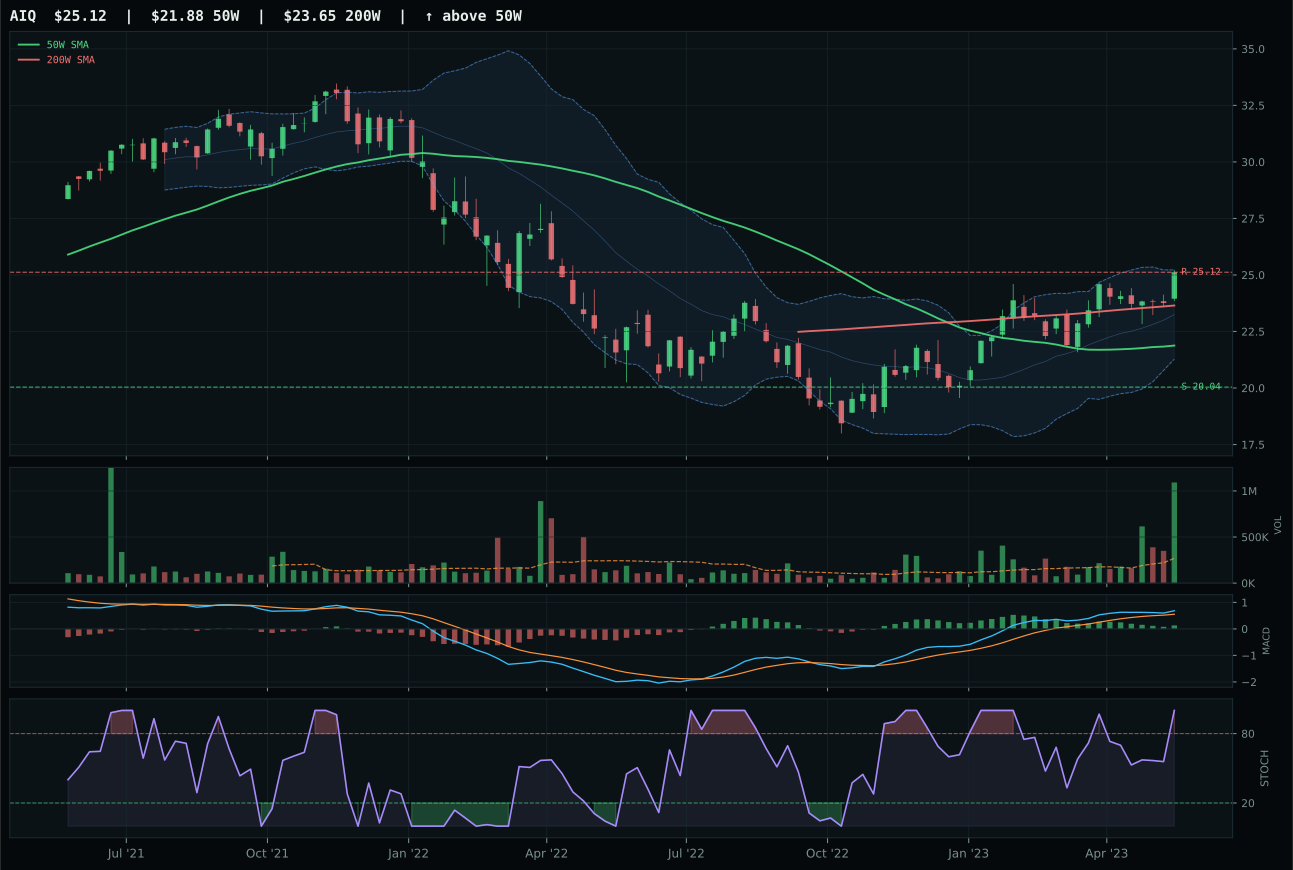
AIQ has a neutral structure profile with 5.5% 13-week relative strength versus SPY.
A failed hold above support would weaken the setup.
Tracked, but not top-2 eligible because: .
SMH won a close margin over BOTZ by securing better aggregate trend and structure mechanics despite BOTZ's sharper 13-week return of 12.7%. SMH's trend score hit 100/100 versus BOTZ's 86, a material gap that reflects price action above both the 50W and 200W with a healthier slope persistence. The 18.7% vertical extension above the 50W does penalize timing at 32/100, but SMH's neutral volume at 0.90x average and flattening MACD preserve sponsorship evidence rather than signaling distribution. BOTZ actually posted a 87.7/100 technical evidence score—higher than SMH's 62.3—but only converted 47.0/100 macro fit versus SMH's 58.0, a structural liability that tipped the broader reasoned ranking. The gap of 1.5 points is narrow enough to flag entry risk; this is no runaway winner, just the lesser evil in a category stretched vertically.
AI received 5% as tier-2 despite a 62.1 category score because Precious Metals and Utilities & Infrastructure both ranked higher in the allocation stack. The category carries strong AI growth sponsorship at +14, yet liquidity stress at -12 and credit stress at -8 create headwinds that depress macro fit to 59.0/100. Risk appetite is active at +10, but that alone cannot overcome the structural macro drag in a disinflation regime where credit tightness penalizes leveraged names and risk-on positioning. SMH's technical evidence of 62.3/100 is respectable but not exceptional; it relies heavily on trend strength rather than new accumulation. To earn top-2 capital, this category would need either a macro shift away from credit stress or a technical reset that clears the extension and rebuilds entry conviction.
Technology — XLK
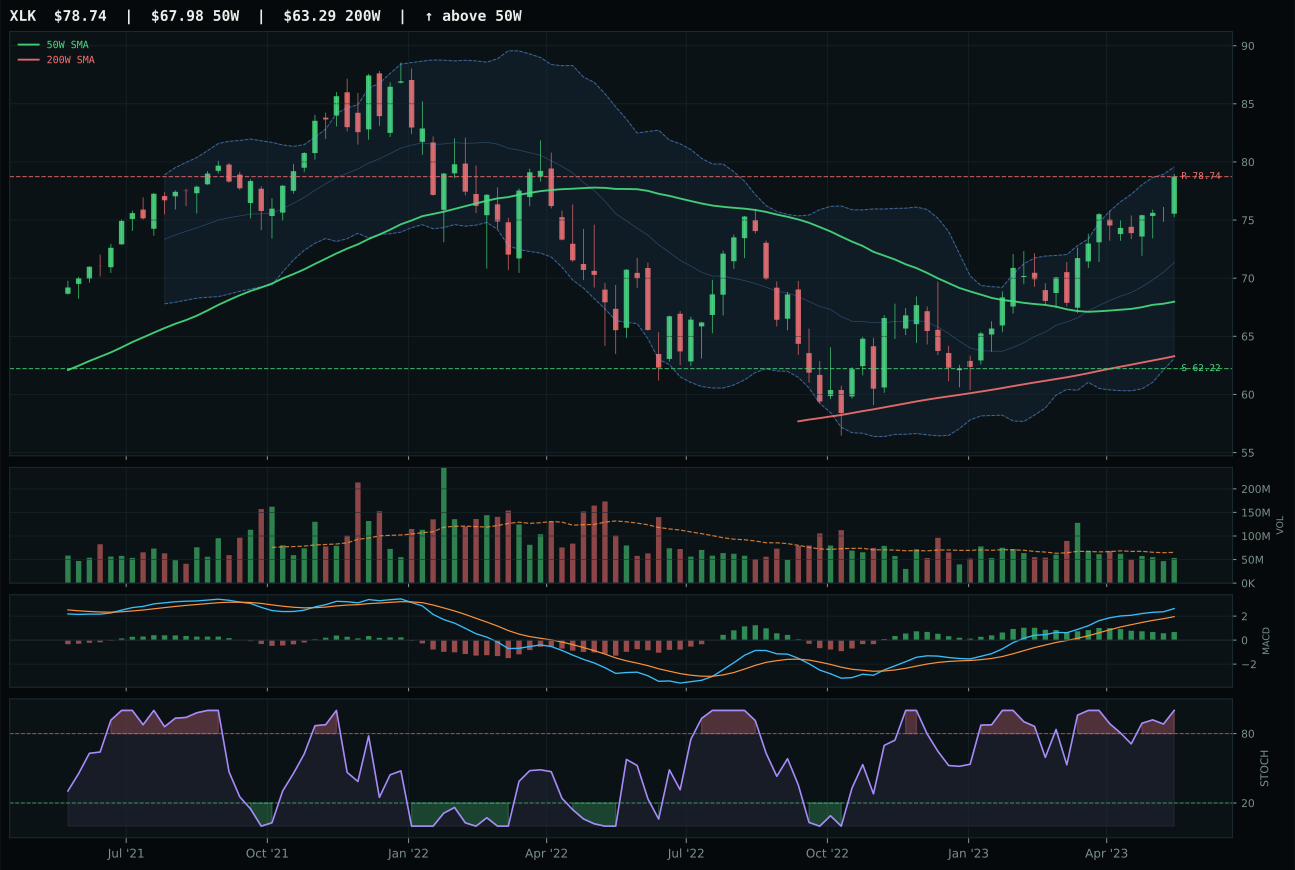
XLK has a vertical extension profile with 9.8% 13-week relative strength versus SPY.
A failed hold above support would weaken the setup.
Actionable but governed by invalidation levels.
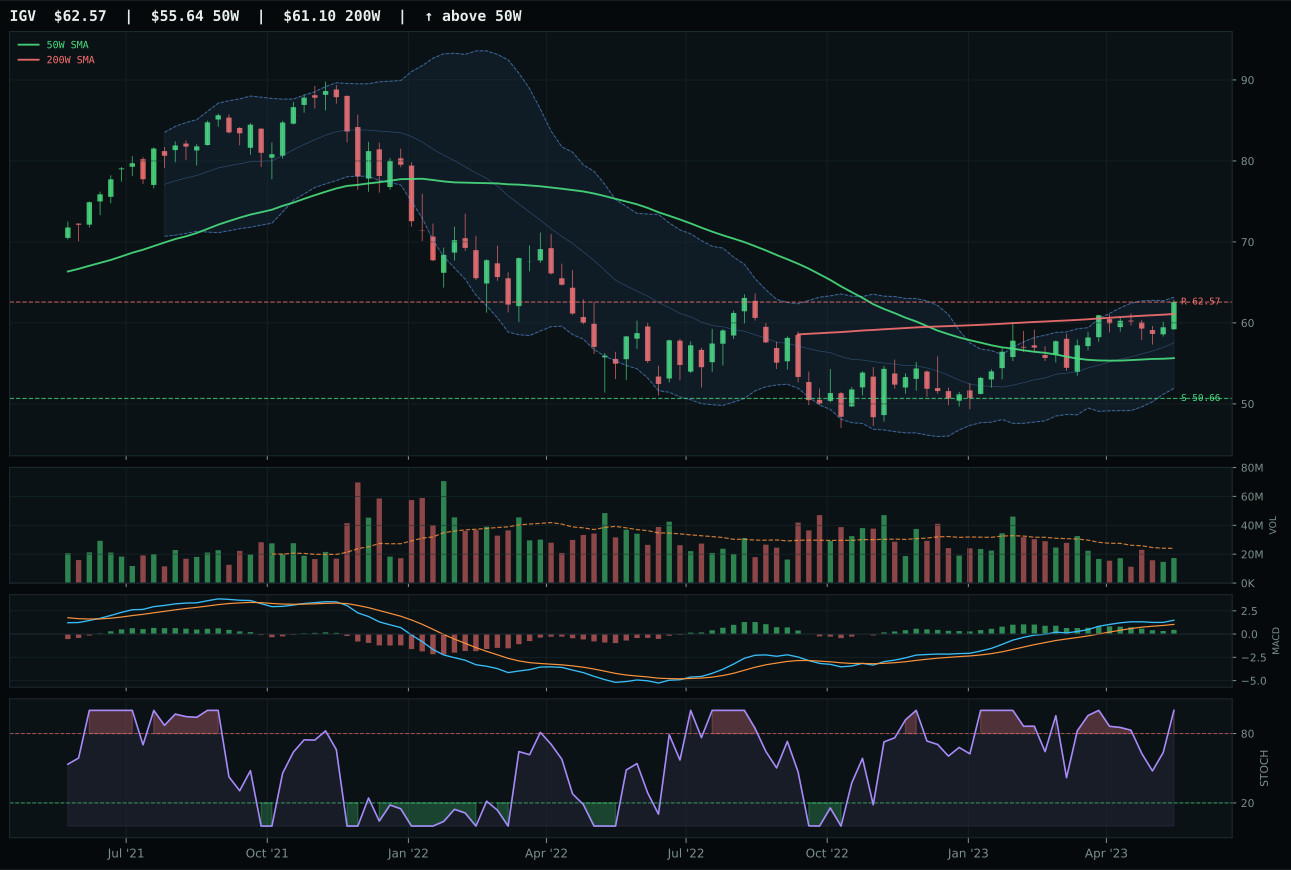
IGV has a neutral structure profile with 7.1% 13-week relative strength versus SPY.
A failed hold above support would weaken the setup.
Actionable but governed by invalidation levels.
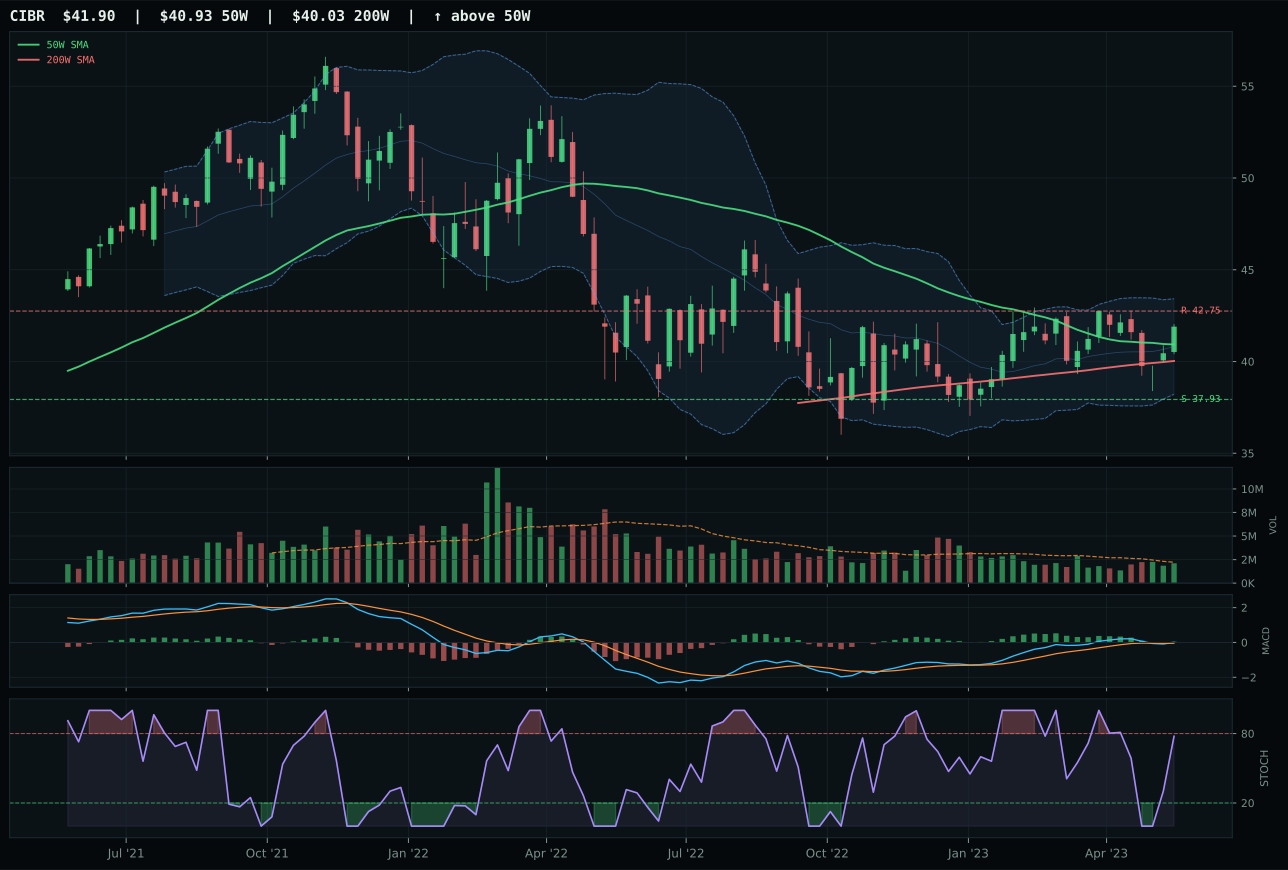
CIBR has a compression near 50W profile with -2.8% 13-week relative strength versus SPY.
A failed hold above support would weaken the setup.
Actionable but governed by invalidation levels.
XLK clinched the category by combining clean uptrend mechanics with measurable relative strength inside its own basket. Price sits 15.8% above the 50-week moving average with a 50W slope holding steady at 0.3%, meaning the advance has not yet rolled over despite the vertical distance. The 13-week return of 12.6% and 2.8% category-relative strength gave XLK enough SPY-relative behavior to justify the selection, even though stochastic RSI is overbought at 1.00 and MACD is flattening—both warning signs that new entry risk is rising. IGV lost to XLK on three technical grounds: structure scored 72.1 versus 74.4, volume confirmation was thin participation rather than neutral, and category-relative strength registered 0.0% compared to XLK's 2.8%. The setup is extended but not broken; the risk is entry timing, not directional conviction.
Technology earned 5% allocation as a tier-2 holding in a week dominated by two higher-scoring categories. Precious Metals and Utilities & Infrastructure ranked above it at 71.6 and 63.9 respectively, pushing Technology into the third tier despite a solid 61.6 category score. The category benefits from active AI growth sponsorship and positive risk appetite, yet disinflation macro conditions offer no particular tailwind—the +5 from disinflation pressure is modest. To graduate to top-2 status, Technology would need either a cleaner structure setup, a stronger macro narrative beyond momentum, or a fresh breakout that resets entry risk. The allocation reflects a holding pattern: conviction exists, but the risk-reward no longer justifies overweight capital.
Nuclear Energy — URNM
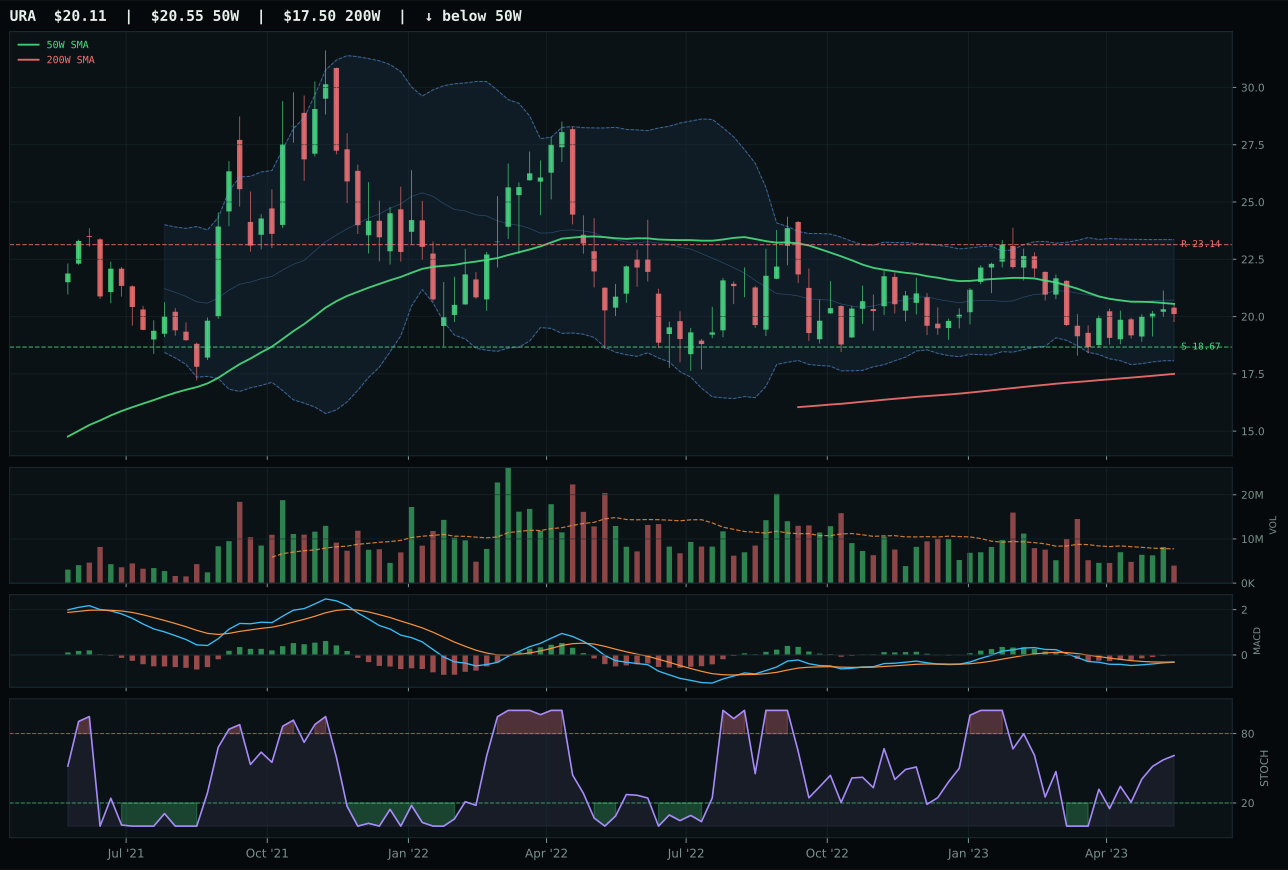
URA has a compression near 50W profile with -11.8% 13-week relative strength versus SPY.
A failed hold above support would weaken the setup.
Actionable but governed by invalidation levels.
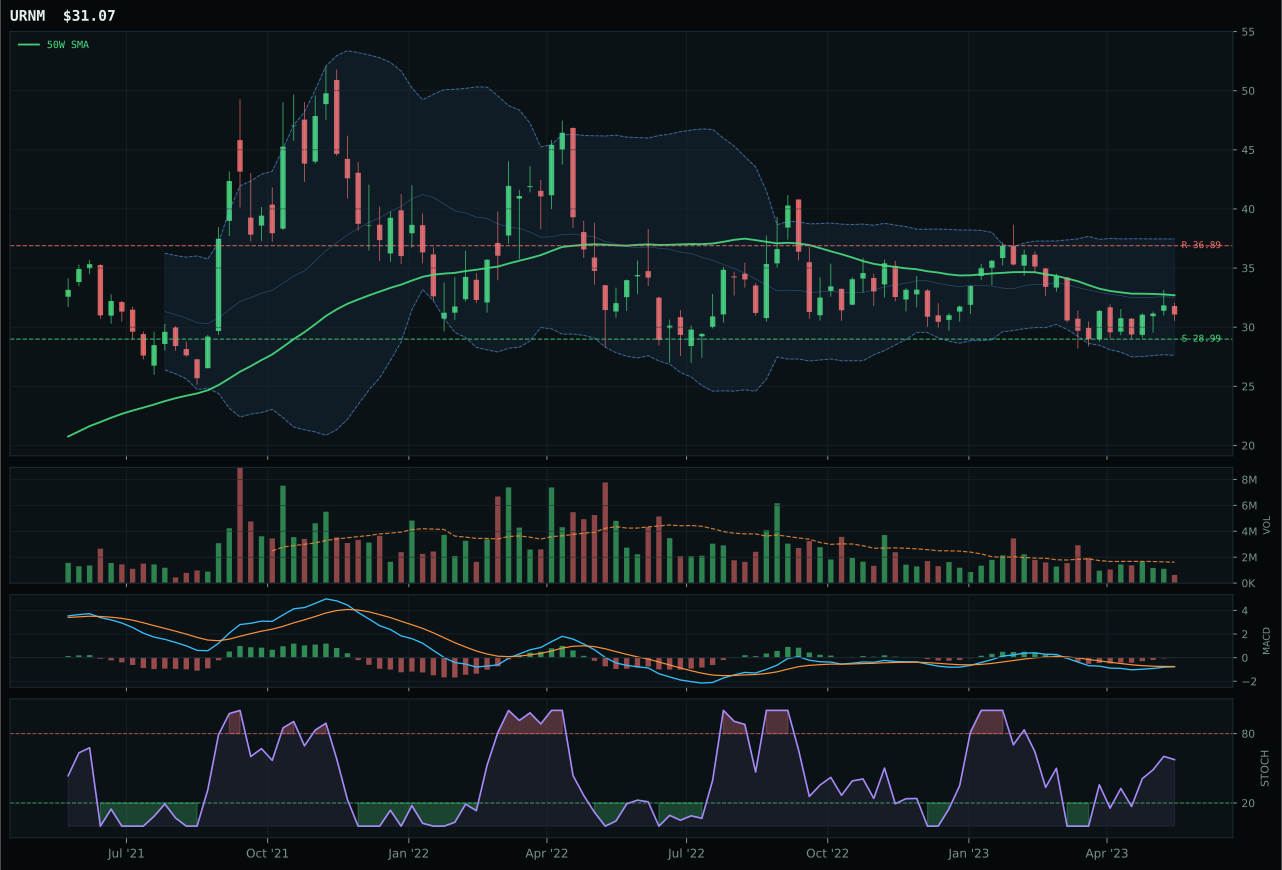
URNM has a neutral structure profile with -14.3% 13-week relative strength versus SPY.
A failed hold above support would weaken the setup.
Actionable but governed by invalidation levels.
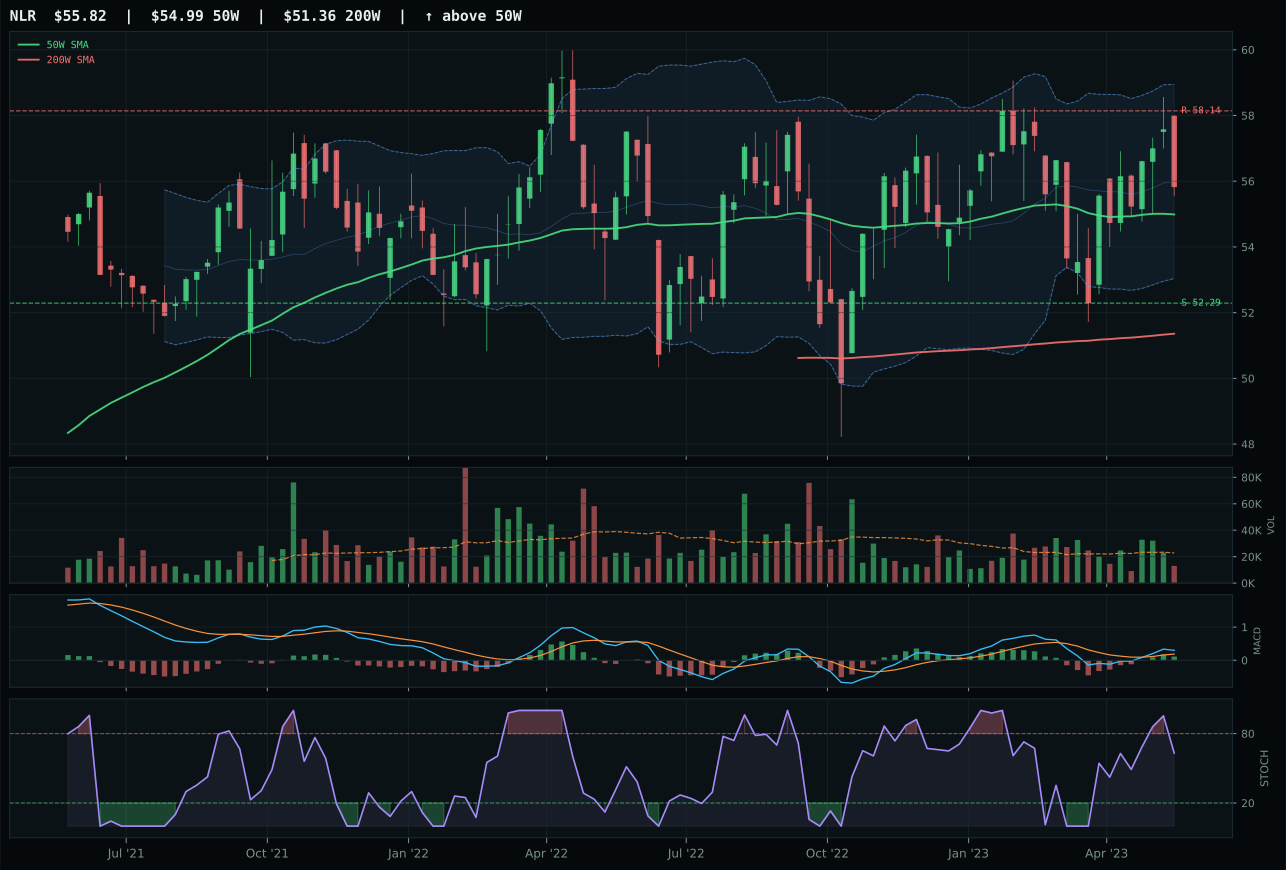
NLR has a compression near 50W profile with -5.5% 13-week relative strength versus SPY.
A failed hold above support would weaken the setup.
Tracked, but not top-2 eligible because: .
URNM won the nuclear category despite a stark technical disadvantage: price is below both the 50W and 200W, trend scores just 23/100, and 13-week returns register -11.6%. The selection hinges on timing and risk-reward: URNM's 98.0/100 timing score reflects a chart 5.0% below the 50W at deep retracement levels (Fib 0.786) where oscillators can snap sharply. Stochastic RSI is rising mid-zone at 0.57, MACD is bearish but improving—a technical repair pattern forming beneath price. The risk-reward of 84.6/100 offers 7.2% downside to support and -15.8% upside to resistance, establishing defined extremes. URA lost on technical evidence grounds despite a higher 44.8/100 versus URNM's 17.0: its compression-near-50W setup and rising stochastic provide better near-term entry geometry, but URNM's worse relative price decay created a category-level averaging effect where the weakest performer became the most extreme oversold candidate.
Nuclear Energy received 5% allocation as tier-2 despite a weak category score of 39.1. Macro fit stands at 50.0/100, neutral across descriptors: real asset sponsorship adds +7, AI growth sponsorship adds +5, but liquidity stress subtracts -7 and credit stress subtracts -5, resulting in a wash. The allocation reflects a conviction that nuclear supply scarcity and energy transition tailwinds are real, yet the current technical setup is too broken to warrant overweight. URNM's -14.3% SPY-relative return and deep-retracement placement signal capitulation pricing, which may represent opportunity, but the absence of confirming volume (0.39x average, thin participation) prevents aggressive positioning. The 5% slot hedges the possibility that nuclear becomes the outsized winner of energy transition while protecting against further technical decay if oscillators fail to confirm a bottom. Escalation to top-2 requires both a stochastic RSI and MACD reversal and some volume confirmation that accumulation is occurring.
Industrial Metals — COPX
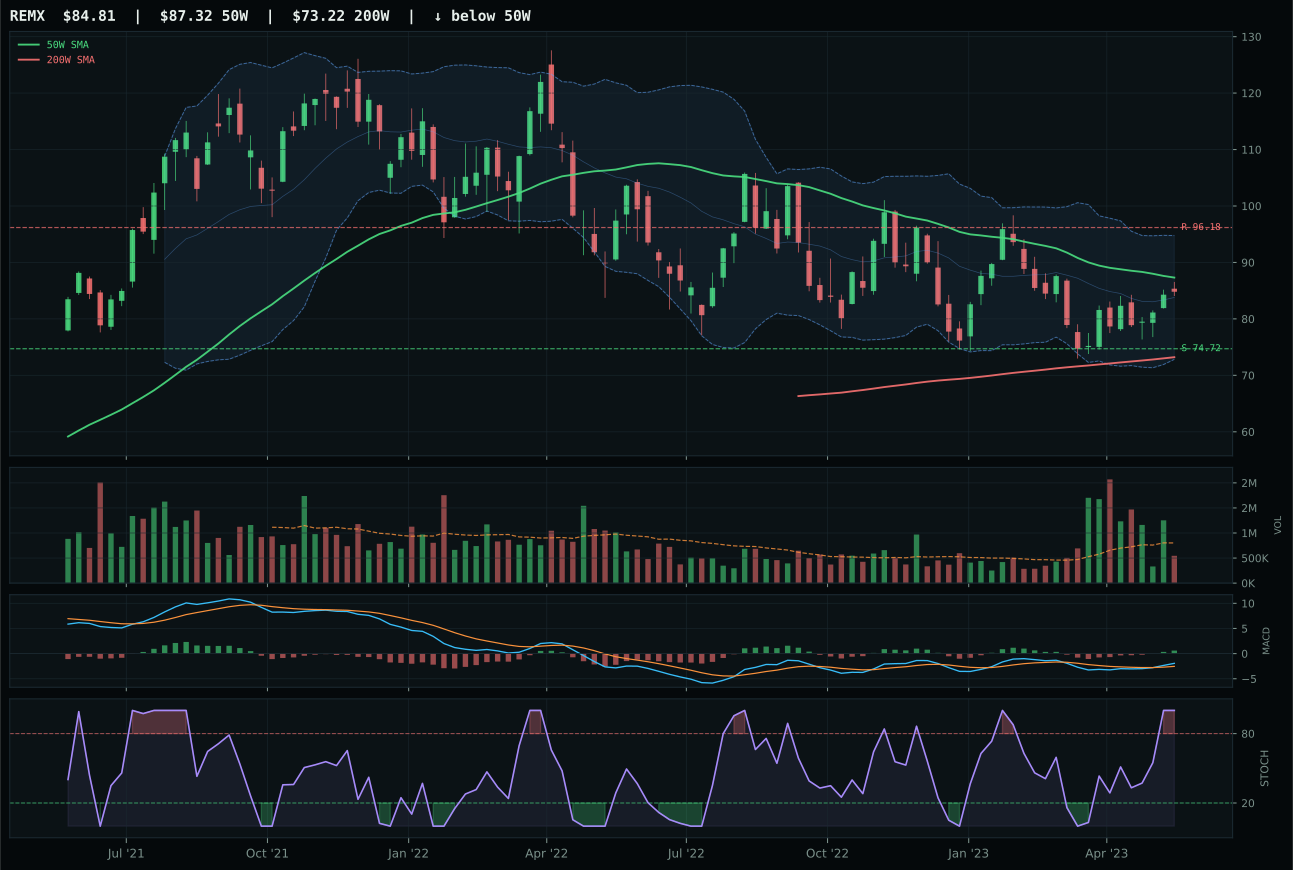
REMX has a compression near 50W profile with -3.6% 13-week relative strength versus SPY.
A failed hold above support would weaken the setup.
Actionable but governed by invalidation levels.
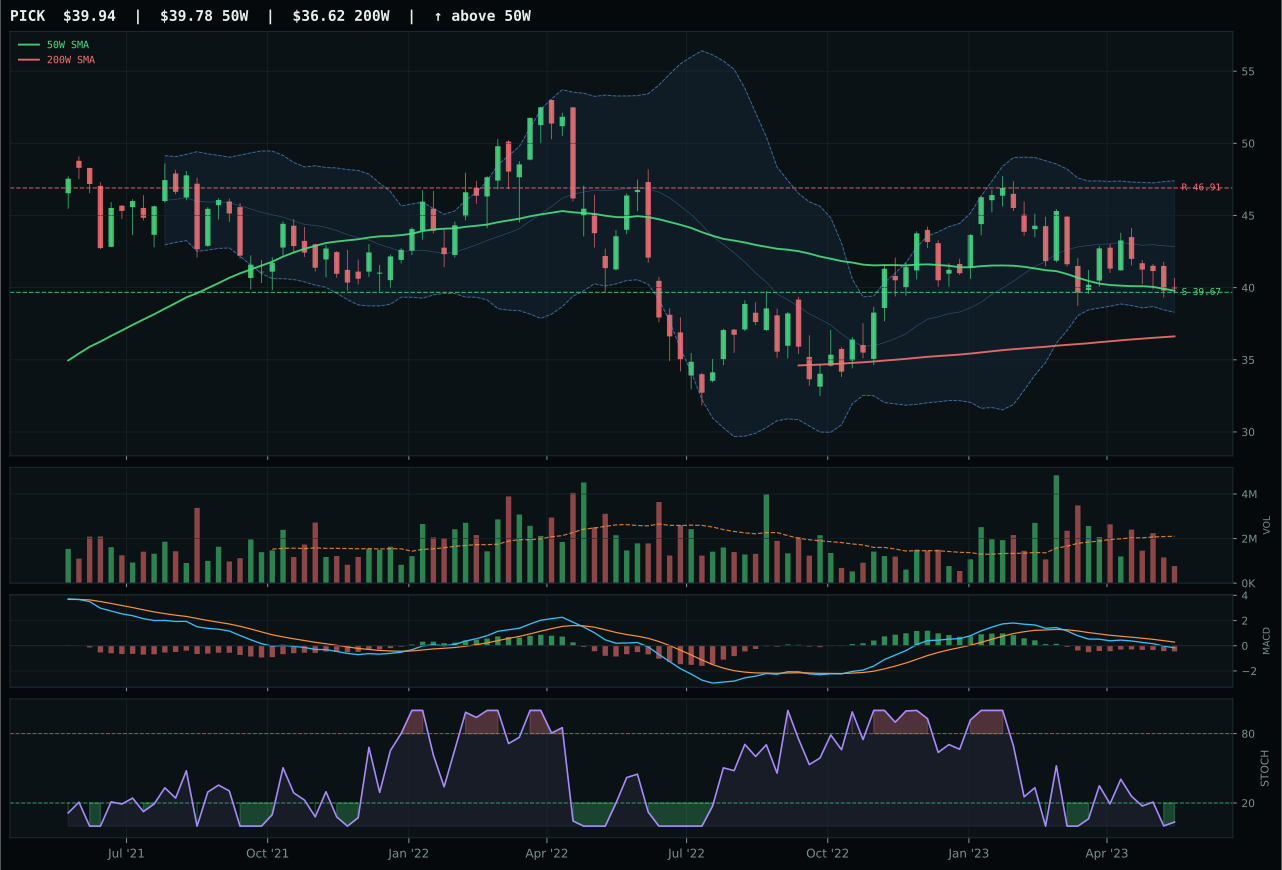
PICK has a pullback into support profile with -12.6% 13-week relative strength versus SPY.
A failed hold above support would weaken the setup.
Actionable but governed by invalidation levels.
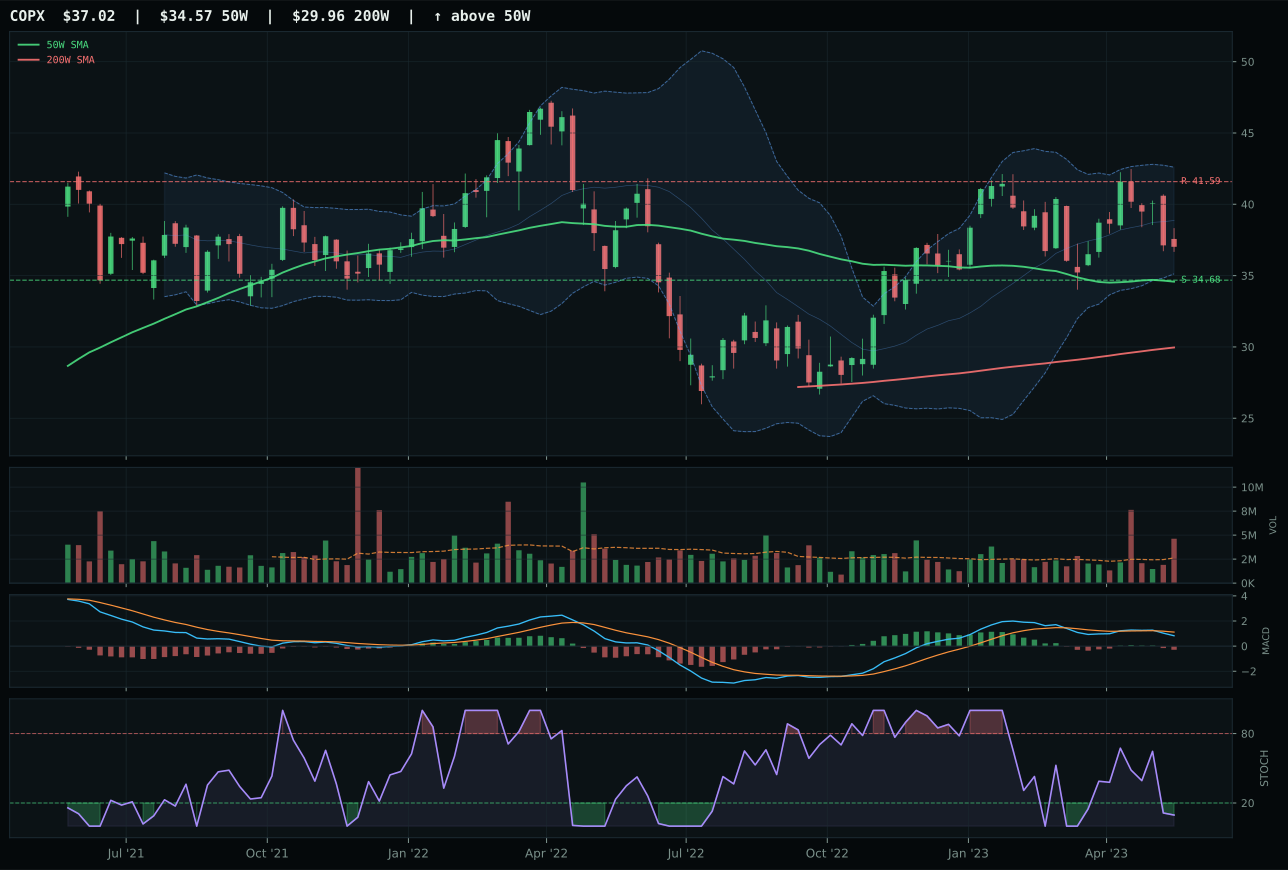
COPX has a neutral structure profile with -8.3% 13-week relative strength versus SPY.
A failed hold above support would weaken the setup.
Actionable but governed by invalidation levels.
COPX won despite massive technical damage, scoring just 47 on composite merit where REMX posted 76 and PICK 56. The decisive factor was category-relative strength: COPX's 0.0% placed it neutral against its peers, whereas both REMX at 4.8% and PICK at -12.6% created a ranking spread where the extremes canceled. COPX's chart is genuinely broken—13W return of -5.5%, RS versus SPY at -8.3%, volume at distribution pressure of 1.76x, MACD bearish/weakening—yet stochastic RSI at 0.10 sits oversold in a zone where momentum oscillators can turn sharply. Timing scored a defensible 70.0/100 based on Fibonacci placement near 0.382 and proximity to support at 34.68. REMX lost despite superior technical strength because its macro fit of 47.0/100 trailed both COPX's 62.0 and benefited less from the active metals scarcity descriptor at +12 versus REMX's +9. The winner here is the macro narrative, not the chart.
Industrial Metals received 5% as tier-2 despite a category score of only 38.6, fourth-lowest among the active allocation tiers. The portfolio holds this exposure because macro fit is 65.0/100, supported by metals scarcity at +14, commodity breadth positive at +10, and real asset sponsorship at +6. Liquidity stress at -8 and credit stress at -7 create headwinds, but the supply-side thesis for copper and rare earths remains intact even in a disinflation regime where cyclical demand is questioned. COPX's distribution pressure and negative momentum are warning signs—the technical setup is not safe—yet the 5% allocation reflects conviction that current weakness is creating opportunity rather than signaling structural breakage. To escalate to top-2 status, this category would need either REMX-like technical stabilization or a directional commodity breadth pickup that rewires the momentum narrative from bearish/weakening to bullish and improving.
Defense & Aerospace — XAR
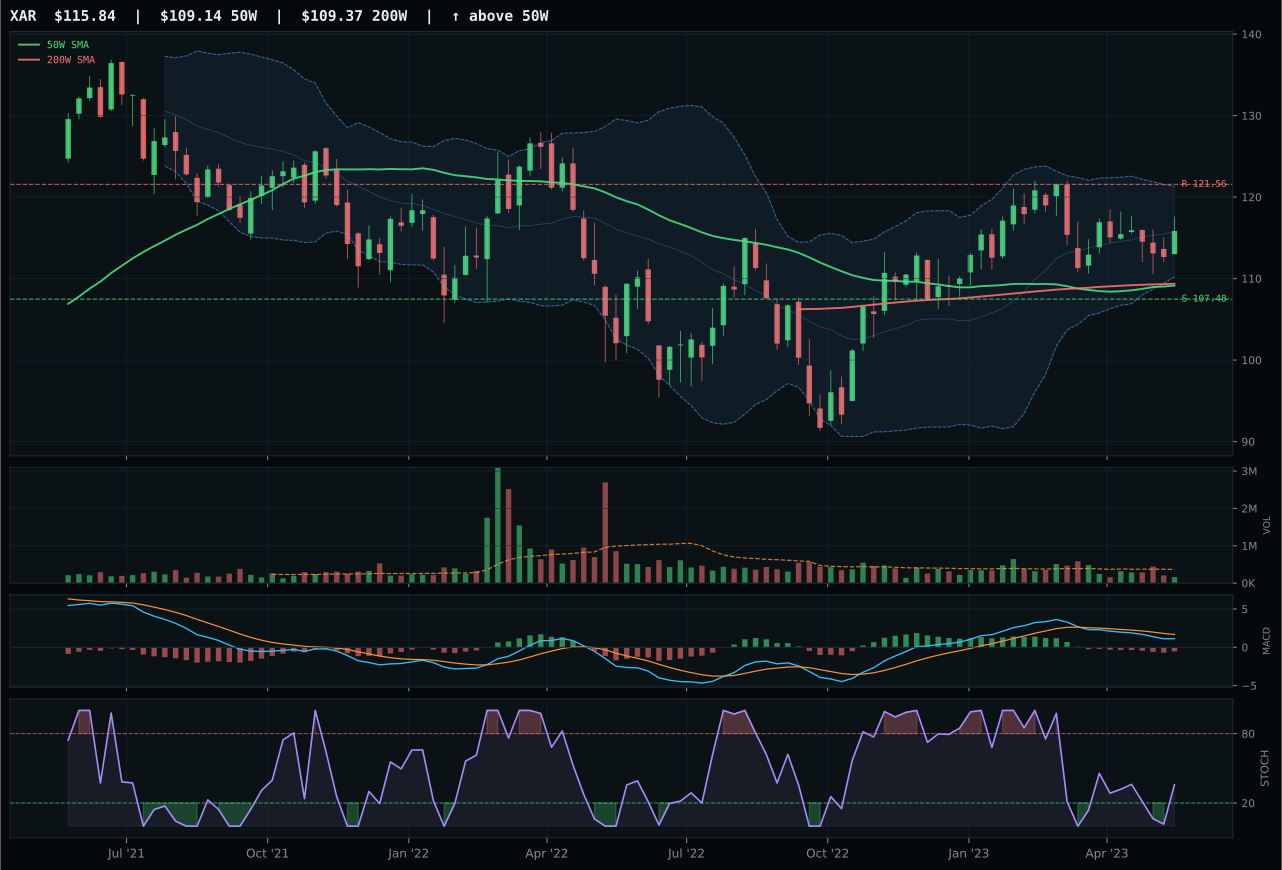
XAR has a neutral structure profile with -6.9% 13-week relative strength versus SPY.
A failed hold above support would weaken the setup.
Actionable but governed by invalidation levels.
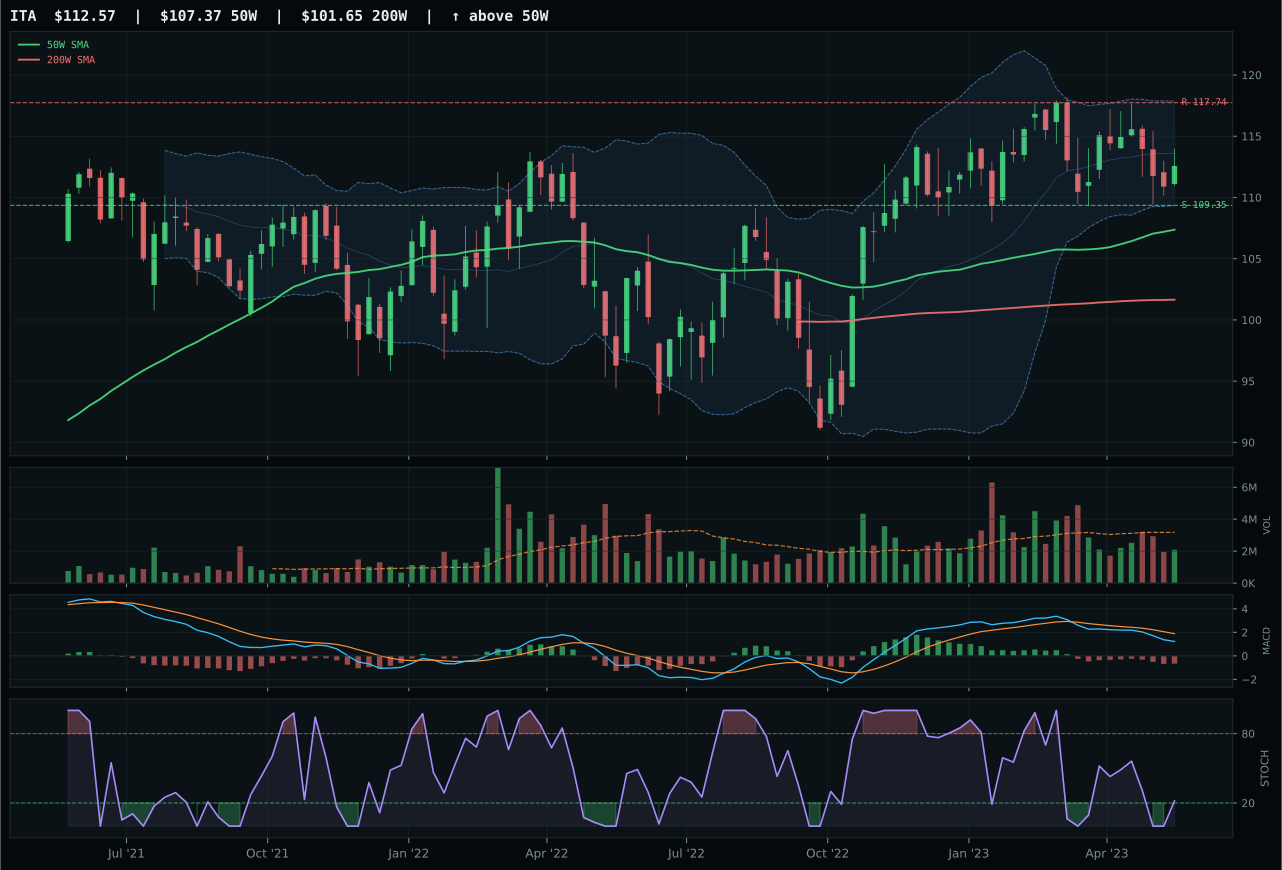
ITA has a pullback into support profile with -6.4% 13-week relative strength versus SPY.
A failed hold above support would weaken the setup.
Actionable but governed by invalidation levels.
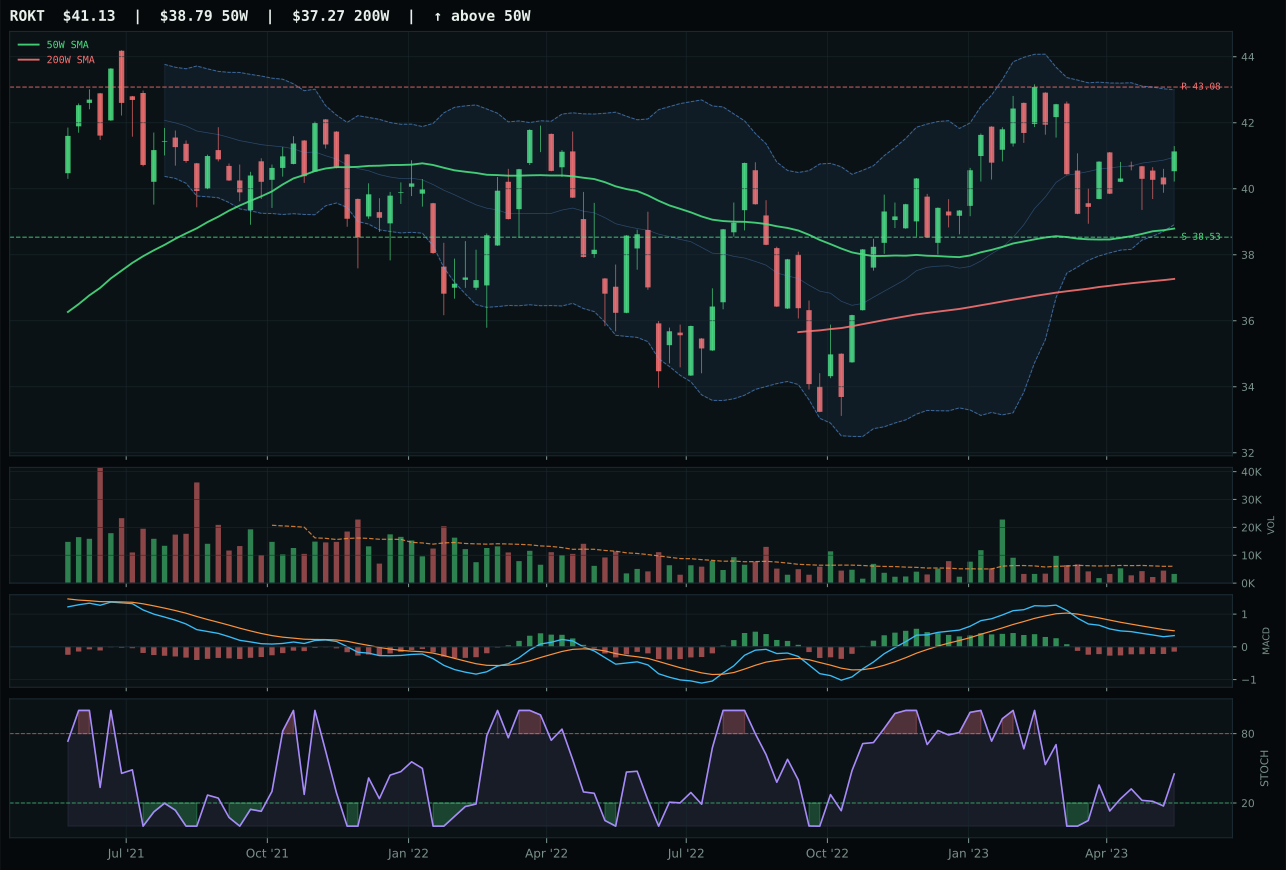
ROKT has a neutral structure profile with -7.3% 13-week relative strength versus SPY.
A failed hold above support would weaken the setup.
Tracked, but not top-2 eligible because: .
XAR won the category defense despite scoring just 37.3, making it the strongest relative choice in a deeply challenged space. Price held above both the 50W and 200W, but the 6.1% proximity to the 50W combined with a -6.9% SPY-relative return left momentum confirmation at a bare 15.4/100. What saved XAR was timing: the 78.0/100 timing score reflects a chart positioned in the upper retracement zone with stochastic RSI rising mid-zone at 0.36, suggesting the worst of the weakness may have been priced. MACD is bearish and weakening, however, which creates a tension between form (rising oscillator) and momentum (declining trend). ITA lost on stochastic timing grounds—its falling/neutral state at the same price level offered less evidence of a potential pivot—even though ITA's 72/100 risk-reward and pullback-into-support structure were technically superior. The category itself is defenseless; this is damage control, not conviction.
Defense & Aerospace earned 5% allocation as tier-2 despite the lowest category score in the 3-8 range at 37.3. The macro case is neutral at best: credit stress offers a small +2 boost, but liquidity stress drains -4, and no category-specific descriptor enrichment exists. Technical evidence averaged only 40.0/100 across the ETF basket, revealing a group where trend is breaking and relative strength has turned negative across the board. XAR's SPY return of -6.9% over 13 weeks tells the story: this sector is underperforming in a risk-on disinflation setup. The 5% slot is a placeholder, retained only because the portfolio requires representation across multiple exposures even when none shine. Improvement requires either a catalyst shift toward geopolitical risk premium or a price stabilization that rebuilds the technical setup from current lows.
Emerging Markets — ILF
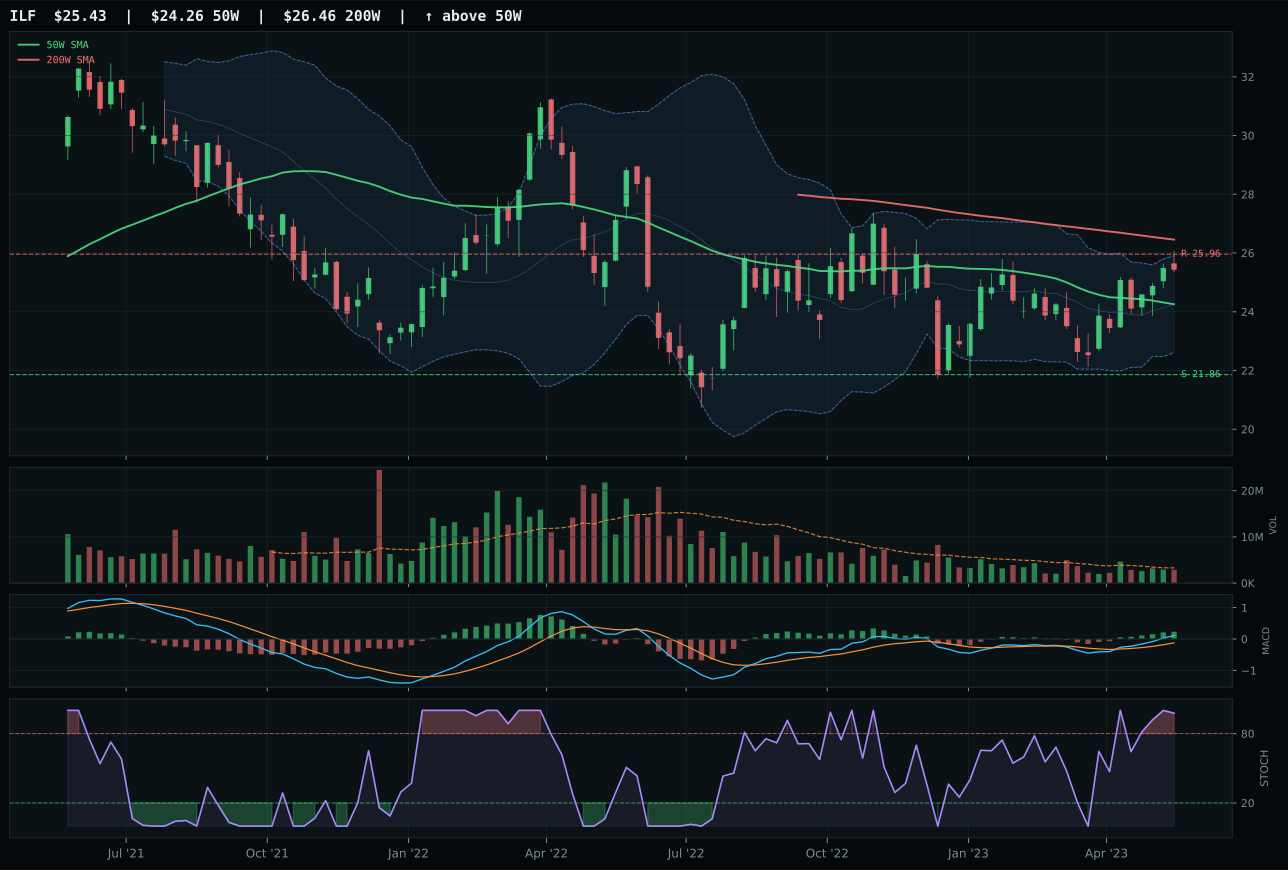
ILF has a neutral structure profile with 0.5% 13-week relative strength versus SPY.
A failed hold above support would weaken the setup.
Actionable but governed by invalidation levels.
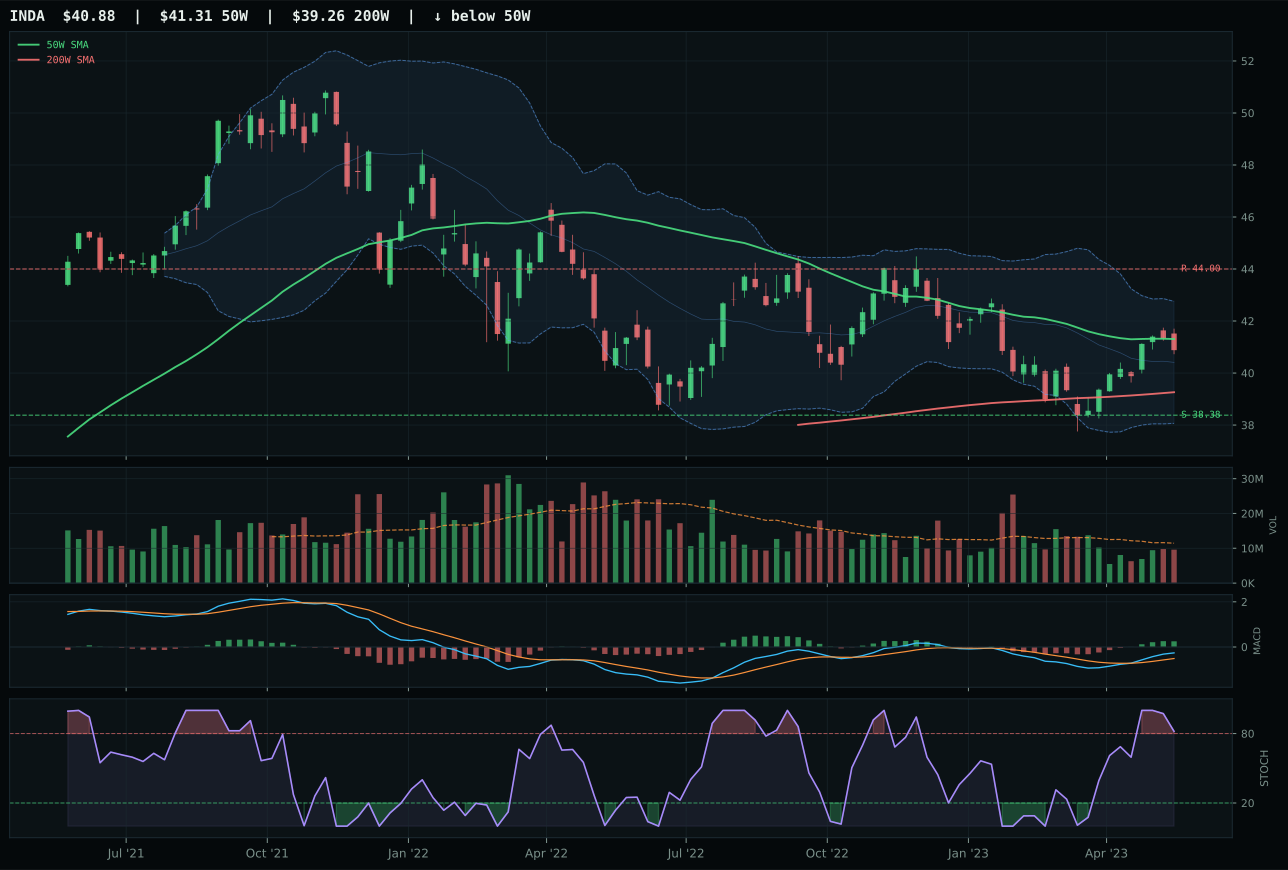
INDA has a compression near 50W profile with -1.4% 13-week relative strength versus SPY.
A failed hold above support would weaken the setup.
Actionable but governed by invalidation levels.
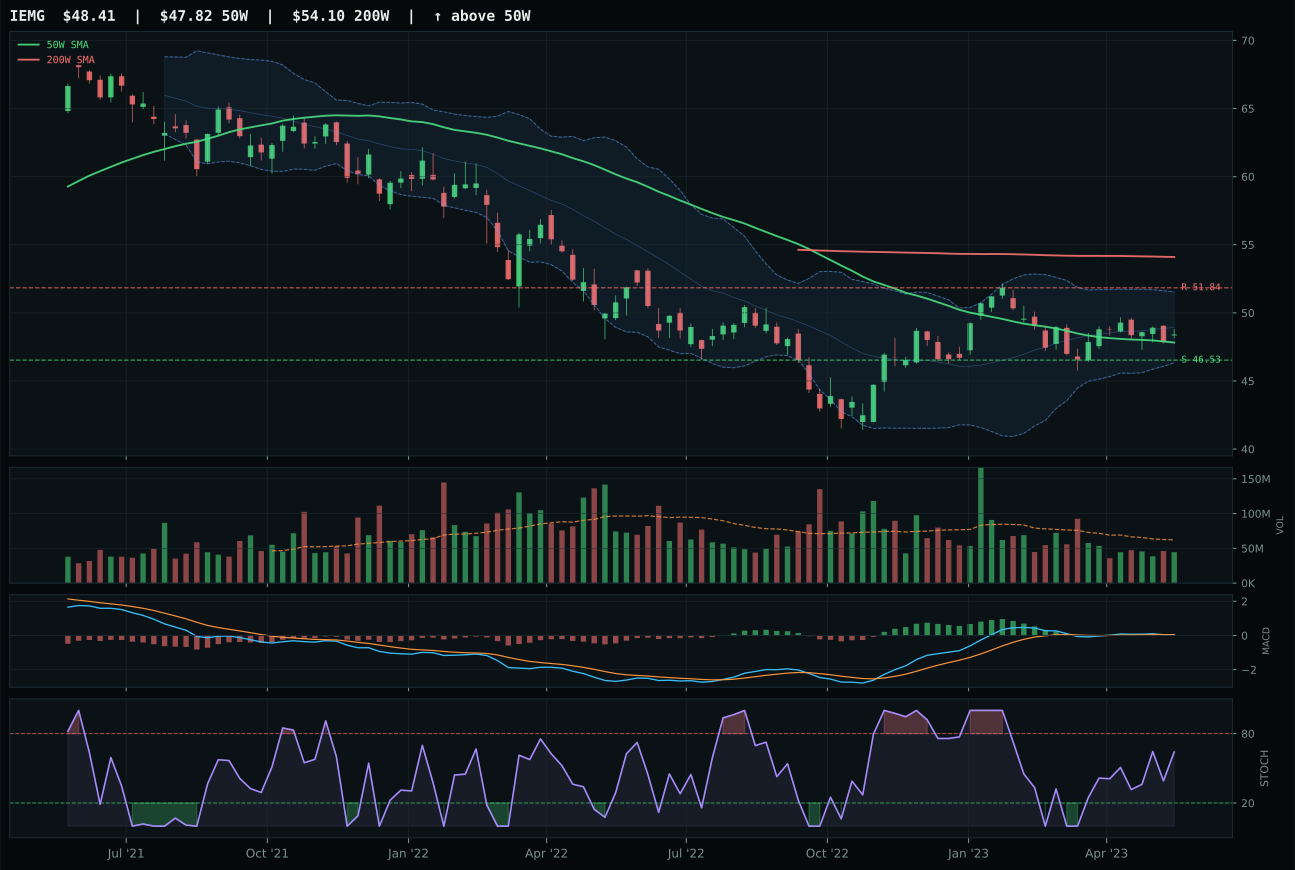
IEMG has a pullback into support profile with -4.1% 13-week relative strength versus SPY.
A failed hold above support would weaken the setup.
Actionable but governed by invalidation levels.
ILF won Emerging Markets by the narrowest margin, edging INDA by just 4.8 points on a category score of 27.3. ILF's decisive advantage lies in timing and momentum: the 90.0/100 timing score combined with a stochastic RSI reading of 0.98 overbought provides a chart that is rolling but not yet broken, and the bullish-and-improving MACD offers forward momentum. The 13W return of 3.3% is modest but positive, category-relative strength of 1.9% edges out INDA's 0.0%, and the above-average participation volume supports the setup. Price is 4.8% above the 50W but below the 200W, a mixed-signal structure, yet compression at 79.7/100 provides orderly price action. INDA scored 73/100 on structure but only 89.0/100 on timing, its stochastic is overbought rolling over rather than rising, and category-relative strength registers flat. The gap is thin; both deserve watching for technical deterioration.
Emerging Markets earned 5% as tier-2 despite a category score of only 27.3, the fourth-lowest allocation in the active tiers. The macro case is a net negative: credit stress subtracts -10, liquidity stress subtracts -10, offset only by risk appetite positive at +8 and commodity breadth positive at +8. ILF's technical evidence of 71.8/100 is solid on trend and momentum, yet the macro tailwind of only 54.0/100 reveals that emerging markets are working despite structural headwinds, not because of them. The 5% position is defensive and opportunity-cost: the portfolio retains emerging market exposure because exclusion would be a binary bet against a regime shift, yet the allocation size reflects skepticism. For ILF to advance to top-2, either credit stress would need to ease (shifting macro fit above 60.0) or technical confirmation would need to prove durable across a three-week hold. Current conviction is insufficient for overweight.
Agriculture & Livestock — MOO
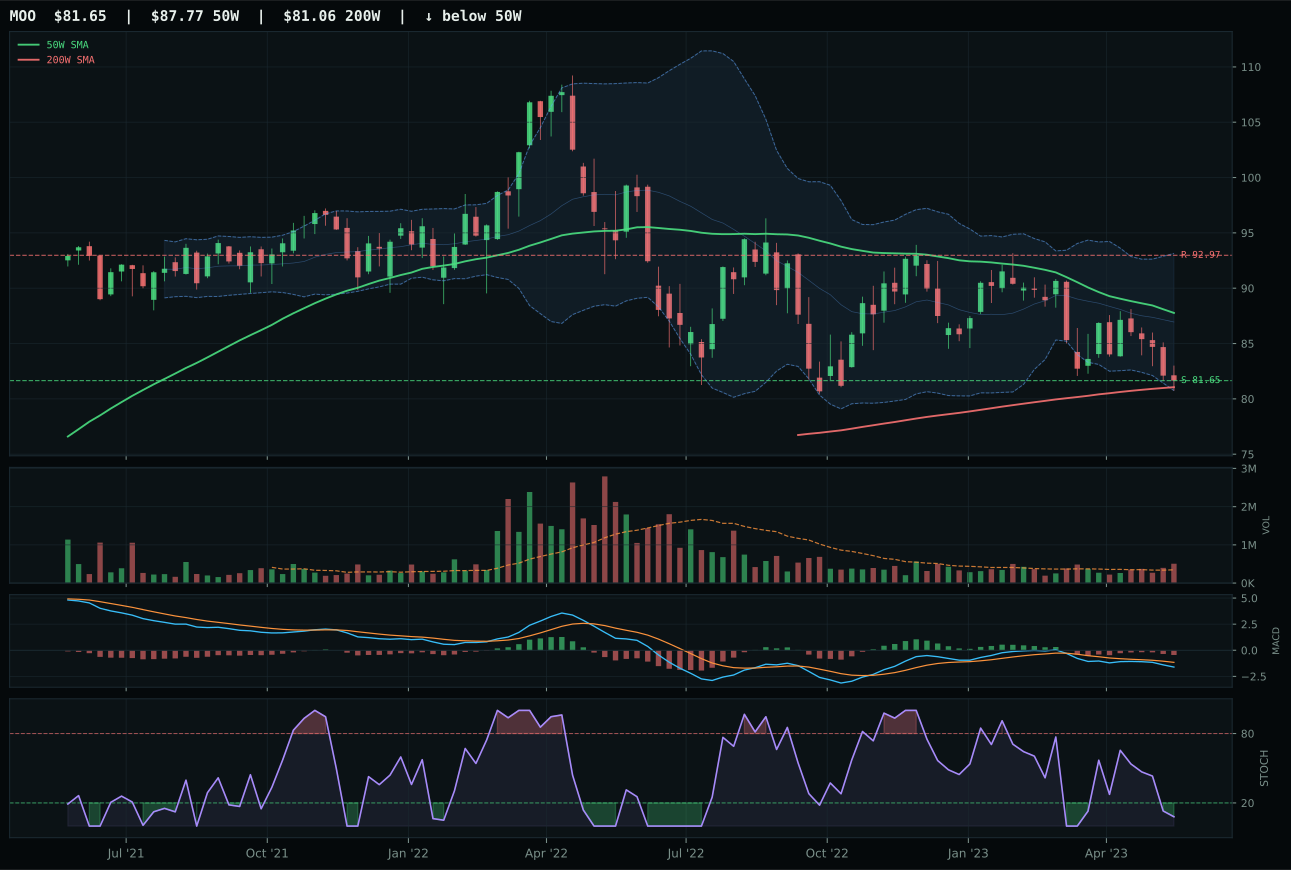
MOO has a pullback into support profile with -11.9% 13-week relative strength versus SPY.
A failed hold above support would weaken the setup.
Actionable but governed by invalidation levels.
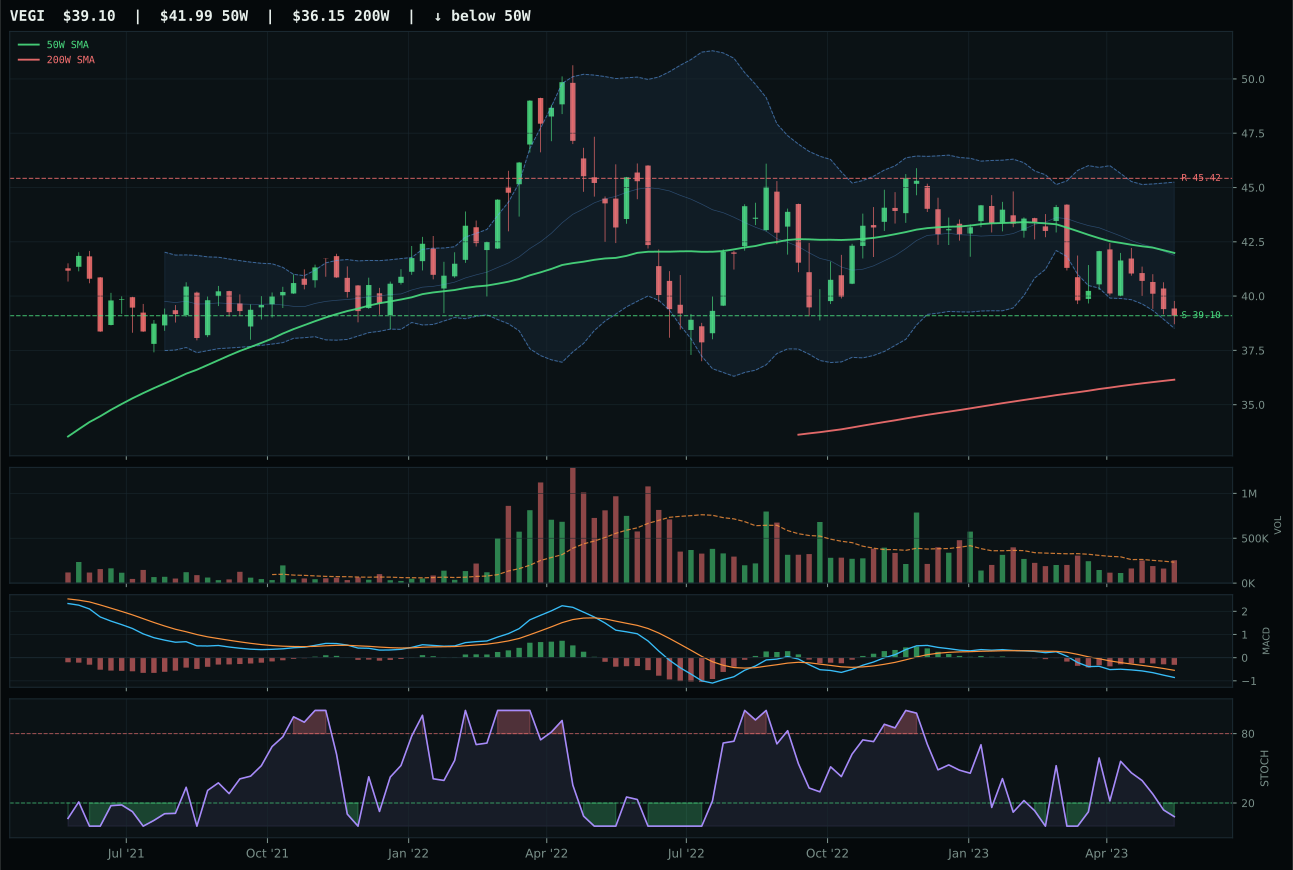
VEGI has a pullback into support profile with -12.7% 13-week relative strength versus SPY.
A failed hold above support would weaken the setup.
Tracked, but not top-2 eligible because: .
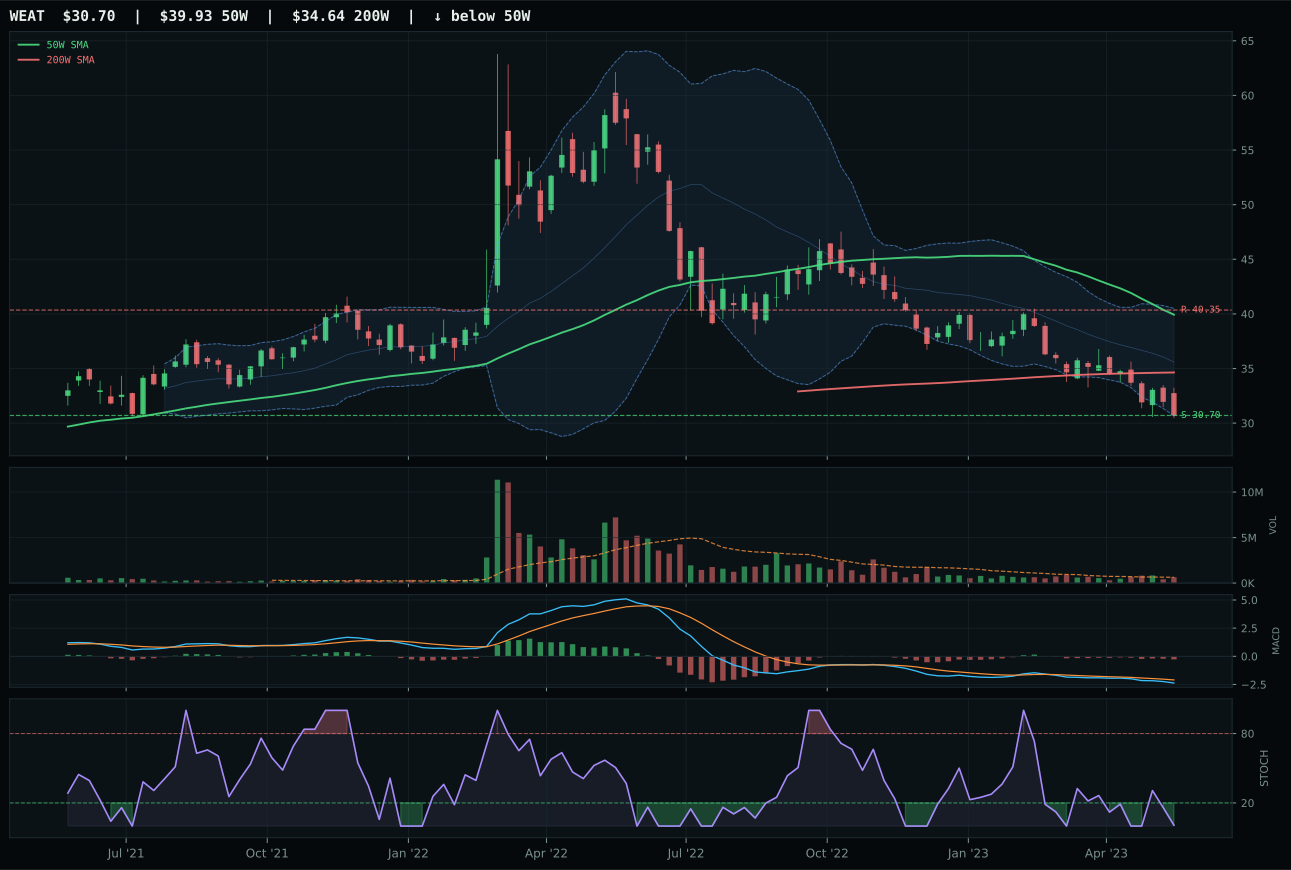
WEAT has a pullback into support profile with -23.9% 13-week relative strength versus SPY.
A failed hold above support would weaken the setup.
Actionable but governed by invalidation levels.
MOO won a commanding category decision despite both runner-ups posting similar setups, because MOO's above-average participation volume at 1.46x the 20W mean provided the only evidence of genuine sponsorship entering the weakness. Price has fallen 7.0% below the 50W but remains above the 200W, establishing a pullback-into-support structure near 81.65. Stochastic RSI is oversold at 0.08, timing scored 80.0/100 based on proximity to support and Fibonacci placement near the 0.786 level, and risk-reward registered a favorable 72.4/100 with limited downside room. Volume-price confirmation remained anemic at 19.0/100 because MACD is bearish/weakening—the chart is broken, not coiling. VEGI lost simply because its neutral volume and 0.0% category-relative strength offered no accumulation signal, rendering the timing setup academic. MOO's 20.5-point gap over VEGI is decisive.
Agriculture & Livestock received 0% allocation this week, ranking ninth or tenth among the ten categories and excluded entirely from the capital stack. The category score of 13.1 reflects severe technical damage: trend is 32/100, momentum confirmation is near-zero at 3.5/100, and 13-week returns show -9.1% losses across the board. Macro macro fit stands at 45.0/100, held up only by real asset sponsorship at +8 and commodity breadth positive at +5, overwhelmed by disinflation pressure at -8 and -6 from liquidity stress. The disinflation regime actively hurts real commodity exposure, which explains the category's orphan status. Positioning below the 50W with oversold oscillators offers a technical bottom possibility, but without a reversal in commodity breadth sponsorship or a dramatic shift in inflation expectations, this category remains dead money. Recovery requires a macro regime change, not just a bounce.
Traditional Energy — FCG
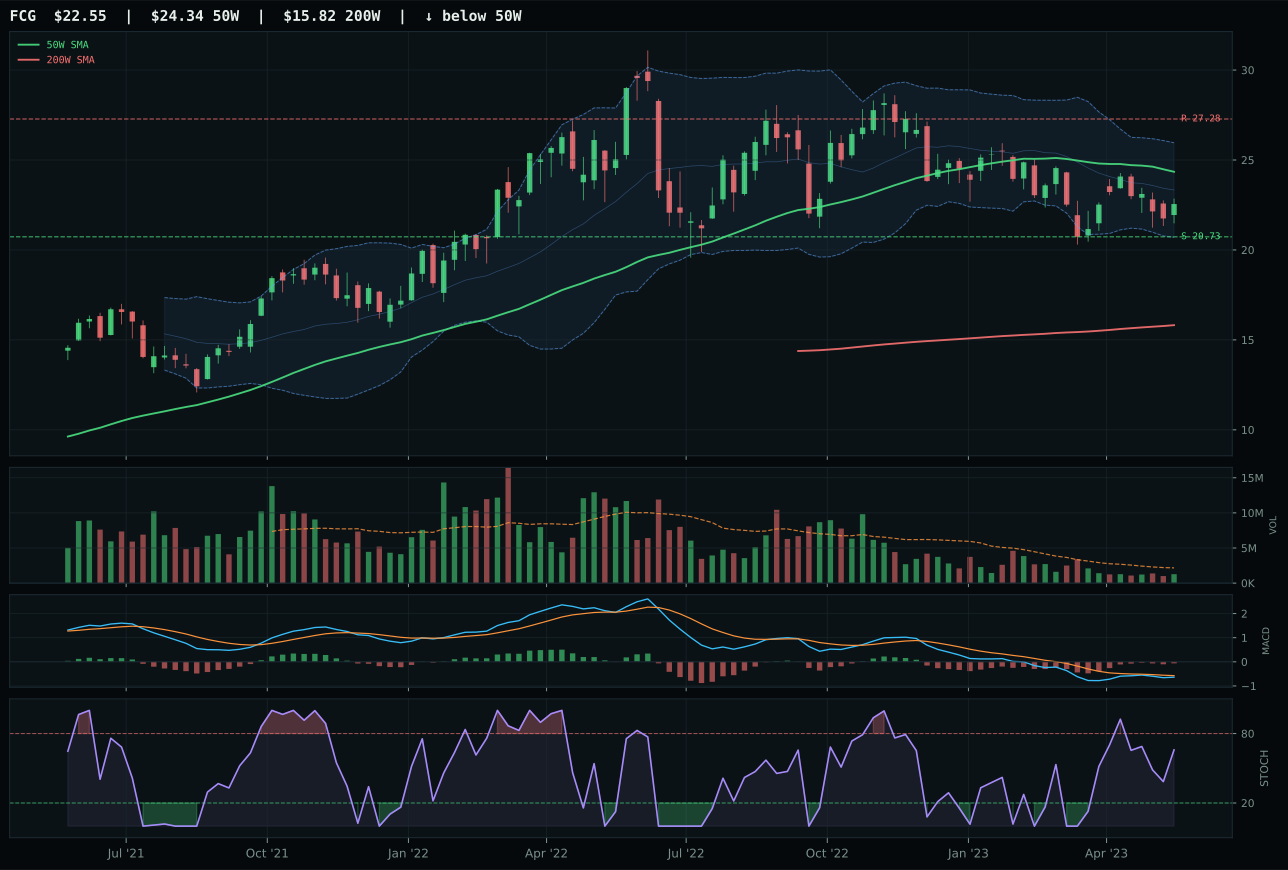
FCG has a neutral structure profile with -4.9% 13-week relative strength versus SPY.
A failed hold above support would weaken the setup.
Actionable but governed by invalidation levels.
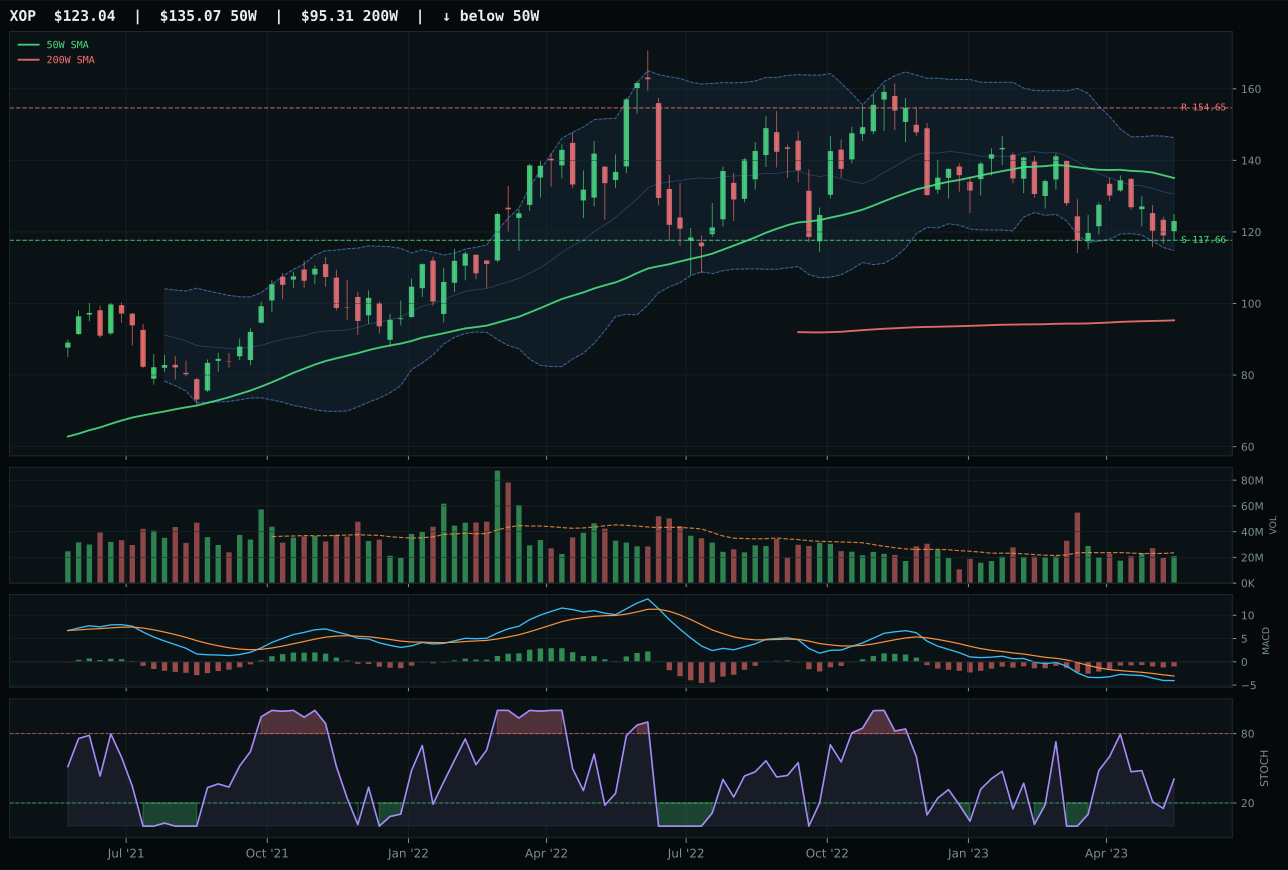
XOP has a pullback into support profile with -8.6% 13-week relative strength versus SPY.
A failed hold above support would weaken the setup.
Actionable but governed by invalidation levels.
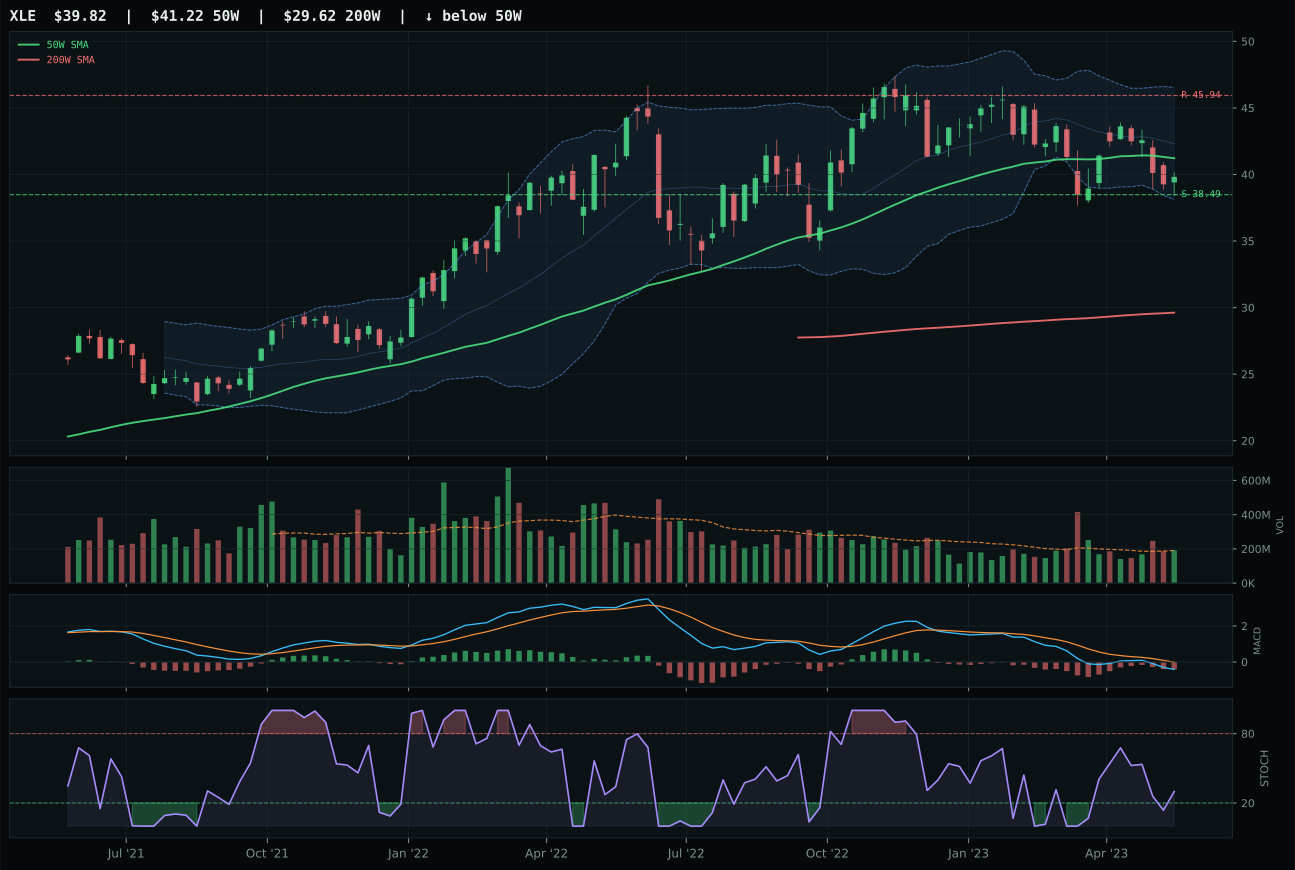
XLE has a pullback into support profile with -8.5% 13-week relative strength versus SPY.
A failed hold above support would weaken the setup.
Actionable but governed by invalidation levels.
FCG won the energy category with a score of just 4.0, rendering this an academic victory in a sector entirely excluded from capital allocation. Price sits 7.4% below the 50W but above the 200W, establishing a reset structure rather than a trend reversal, and the timing score of 82.0/100 reflects deep retracement placement near Fib 0.786 where technical extremes can pivot. Stochastic RSI is falling/neutral, MACD is bearish but improving—the dual signal of a chart scanning for support without yet confirming reversal. The 13W return of -2.1% is the sector's best performer, category-relative strength of 3.6% places it ahead of peers, and risk-reward at 88.5/100 reflects massive downside protection near support. XOP lost because category-relative strength was -0.1%, a decimal-point miss that cost it the marginal title, though XOP's -5.8% 13W return and -8.6% SPY performance reveal why this category is dead money. The category score of 4.0 is the final verdict.
Traditional Energy received 0% allocation, ranked ninth or tenth and entirely excluded from the portfolio. The category score of 4.0 is categorical rejection, driven by a macro fit of only 23.0/100 where disinflation hurts this exposure at -10 and disinflation pressure further penalizes at -10. Real asset sponsorship offers +7, but it is overwhelmed by credit stress at -7 and liquidity stress at -7. In the current regime, energy is anti-convex: upside is capped by disinflation expectations, downside is uncapped if credit stress accelerates. FCG's technical evidence of 57.0/100 is the category's high-water mark, yet it cannot overcome a regime where falling yields and tightening financial conditions undermine both cyclical demand and return on capital. Recovery requires either an inflation reversal or a credit shock that paradoxically makes real assets attractive as liquidity—neither is the base case this week.