
2023-05-12
Informational purposes only. The content in this report, including allocations, analysis, and commentary, is provided solely for informational and educational purposes. It does not constitute financial advice, investment advice, trading advice, or any other type of advice. Past performance does not guarantee future results. Always conduct your own research and consult a qualified financial professional before making investment decisions.
Weekly Allocation
| Ticker | Category | Weight | Role |
|---|---|---|---|
| FBTC | 50% | Overlay | |
| GLD | Precious Metals | 10% | Top-2 (10%) |
| PAVE | Utilities & Infrastructure | 10% | Top-2 (10%) |
| XLK | Technology | 5% | Tier-2 (5%) |
| URNM | Nuclear Energy | 5% | Tier-2 (5%) |
| XAR | Defense & Aerospace | 5% | Tier-2 (5%) |
| COPX | Industrial Metals | 5% | Tier-2 (5%) |
| INDA | Emerging Markets | 5% | Tier-2 (5%) |
| XLE | Traditional Energy | 5% | Tier-2 (5%) |
Trade Instructions — Monday Open
Sell the tranche from 2023-04-14 (completing its 4-week hold). Buy the new tranche. Instructions show net portfolio changes — same-asset positions cancel, weight changes show the delta.
| Action | Ticker | Instruction |
|---|---|---|
| SELL | IGV | Sell 50% of IGV position (reduce 5.00% → 2.50%) |
| SELL | BOTZ | Sell 25% of BOTZ position (reduce 5.00% → 3.75%) |
| SELL | IGF | Sell 33% of IGF position (reduce 3.75% → 2.50%) |
| SELL | ITA | Sell 33% of ITA position (reduce 3.75% → 2.50%) |
| SELL | URA | Sell 25% of URA position (reduce 5.00% → 3.75%) |
| SELL | VEGI | Sell 50% of VEGI position (reduce 2.50% → 1.25%) |
| BUY | XLK | Buy XLK — 14.29% of freed cash (adds 1.25% to portfolio) |
| BUY | PAVE | Buy PAVE — 28.57% of freed cash (adds 2.50% to portfolio) |
| BUY | XAR | Buy XAR — 14.29% of freed cash (adds 1.25% to portfolio) |
| BUY | INDA | Buy INDA — 14.29% of freed cash (adds 1.25% to portfolio) |
| BUY | URNM | Buy URNM — 14.29% of freed cash (adds 1.25% to portfolio) |
| BUY | XLE | Buy XLE — 14.29% of freed cash (adds 1.25% to portfolio) |
Current Portfolio After Trade
Combined holdings across all 4 active tranches. Each tranche is 25% of the portfolio.
| Ticker | % of Portfolio | Weight Bar |
|---|---|---|
| FBTC | 50.00% | |
| GLD | 10.00% | |
| COPX | 5.00% | |
| PAVE | 5.00% | |
| BOTZ | 3.75% | |
| URA | 3.75% | |
| XLK | 3.75% | |
| IGF | 2.50% | |
| ITA | 2.50% | |
| IGV | 2.50% | |
| XAR | 2.50% | |
| INDA | 2.50% | |
| VEGI | 1.25% | |
| XLU | 1.25% | |
| ILF | 1.25% | |
| URNM | 1.25% | |
| XLE | 1.25% |
Macro Regime — Disinflation
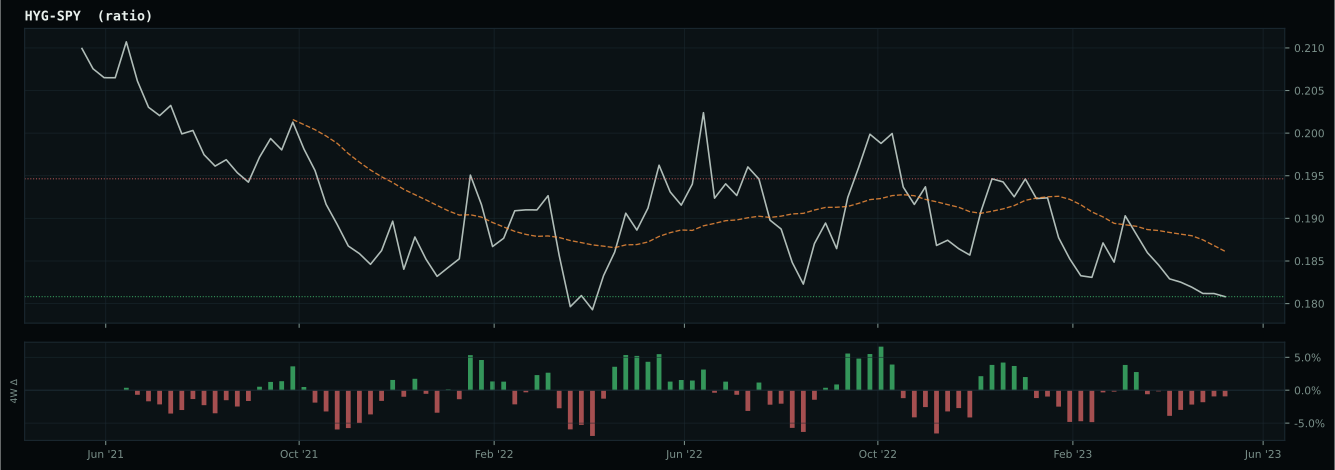
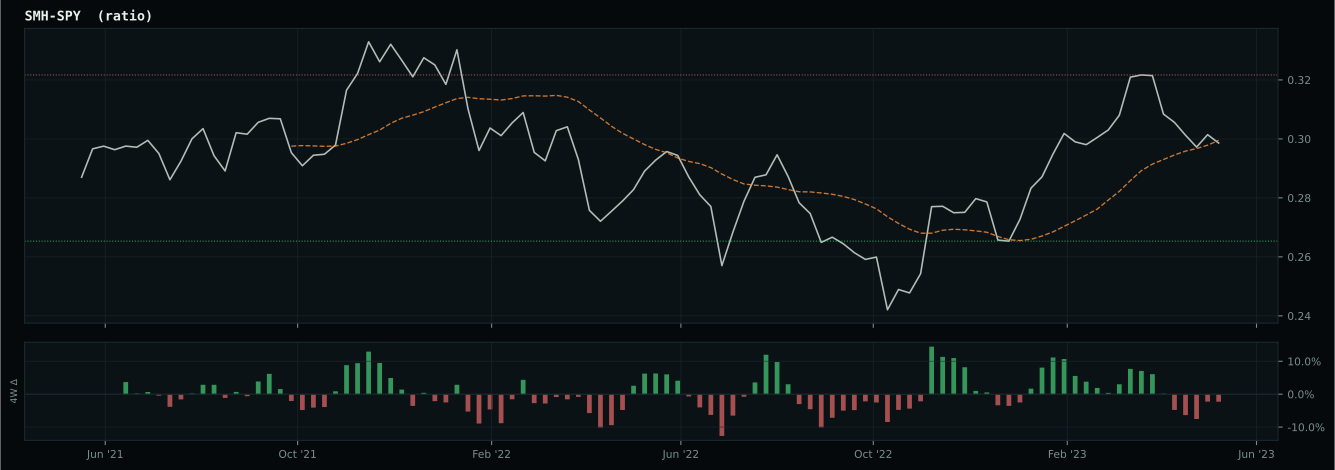
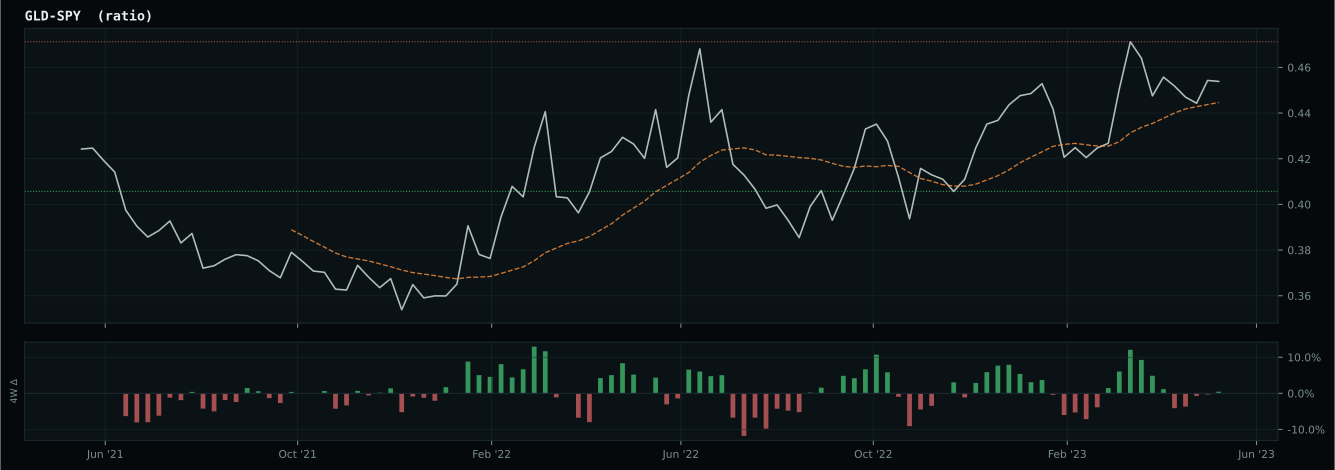
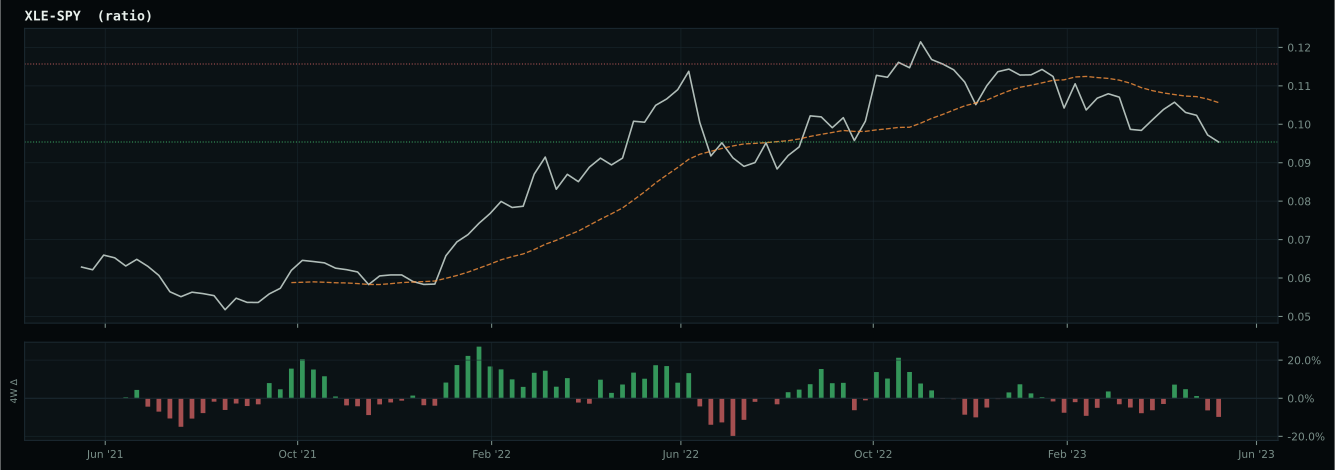
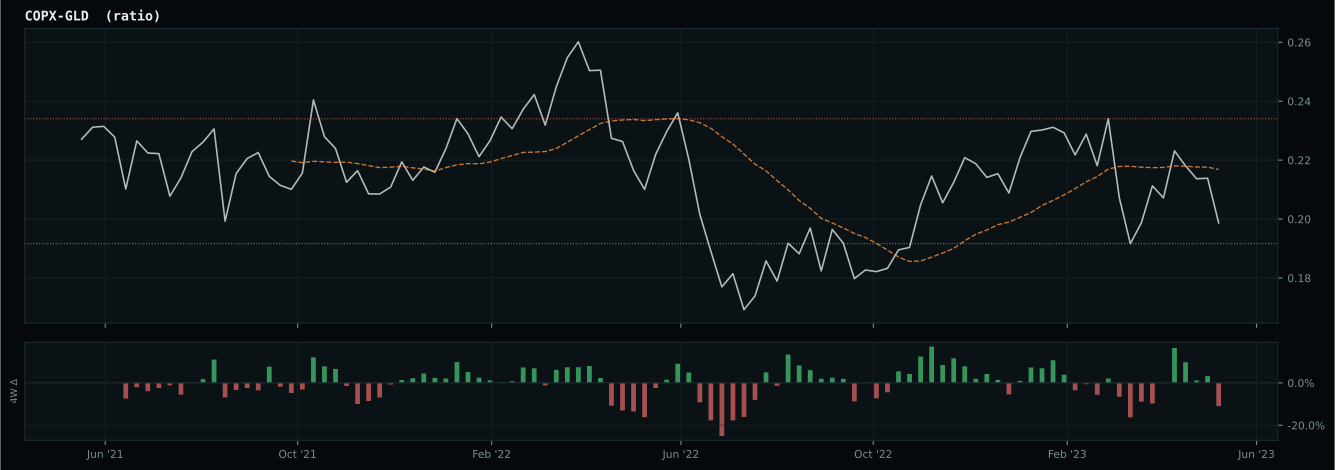
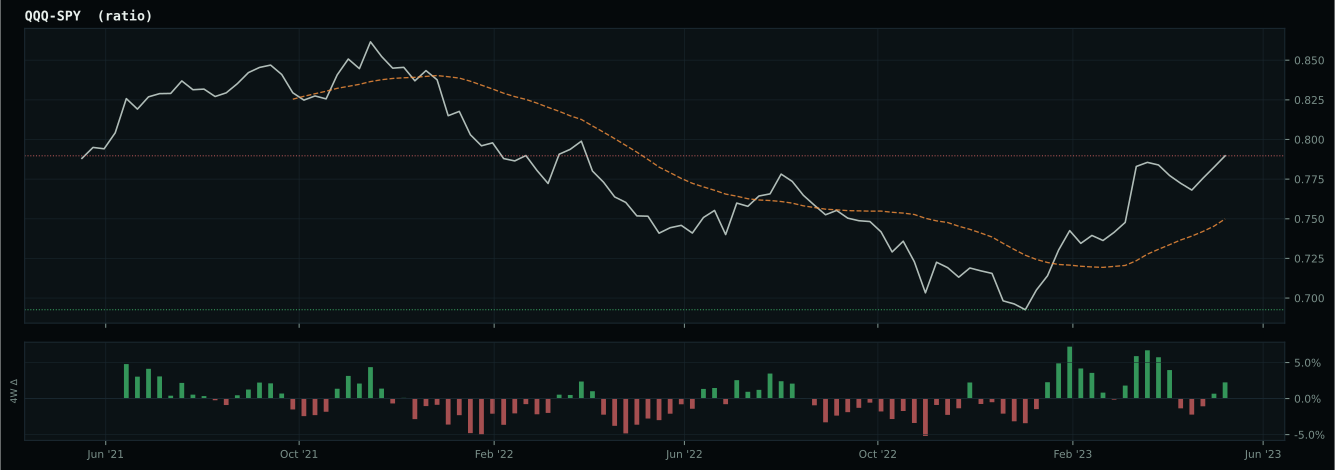
Macro Evidence Charts
Market-implied signals behind the macro regime scores. Each ratio compares two assets; the direction and slope of the ratio is what the macro engine reads.
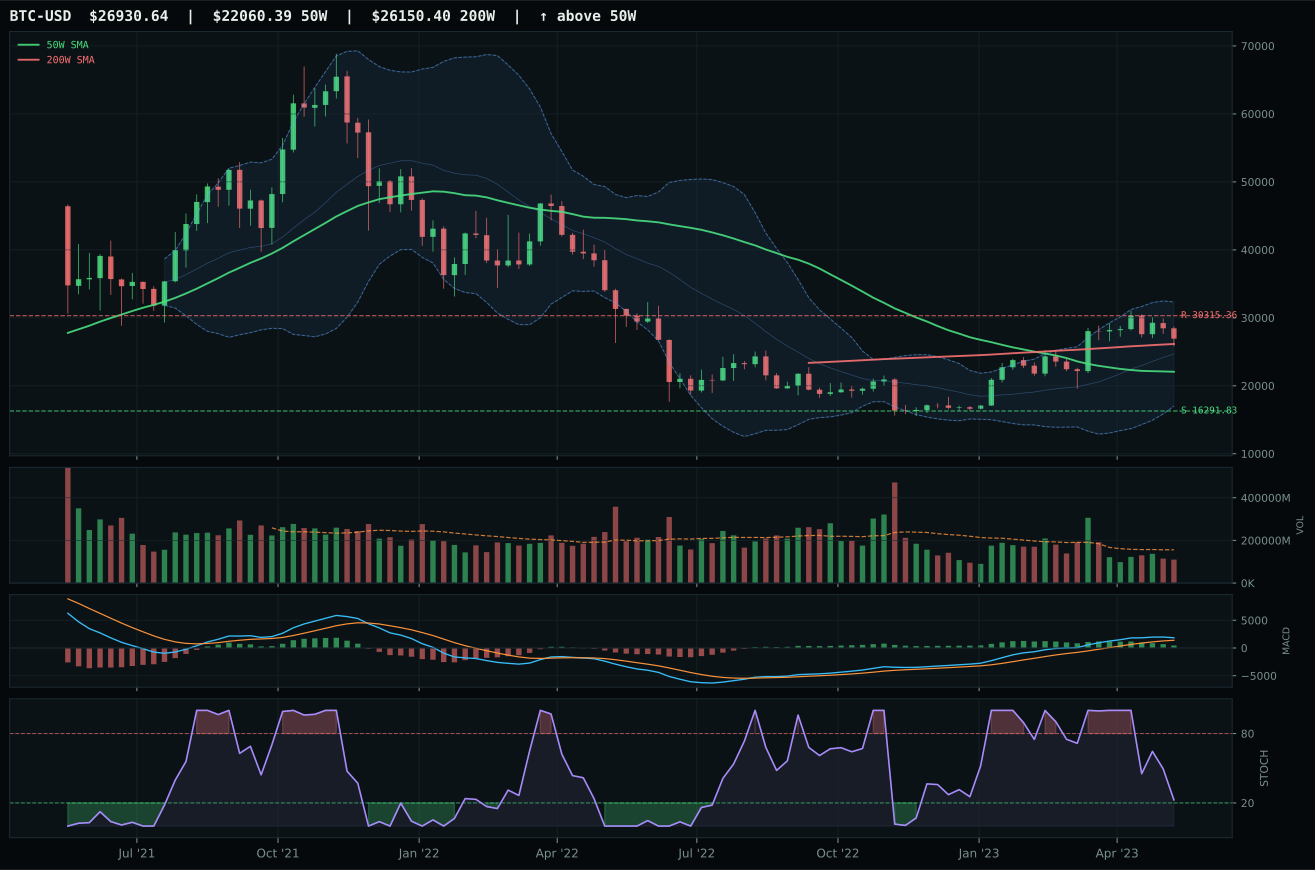
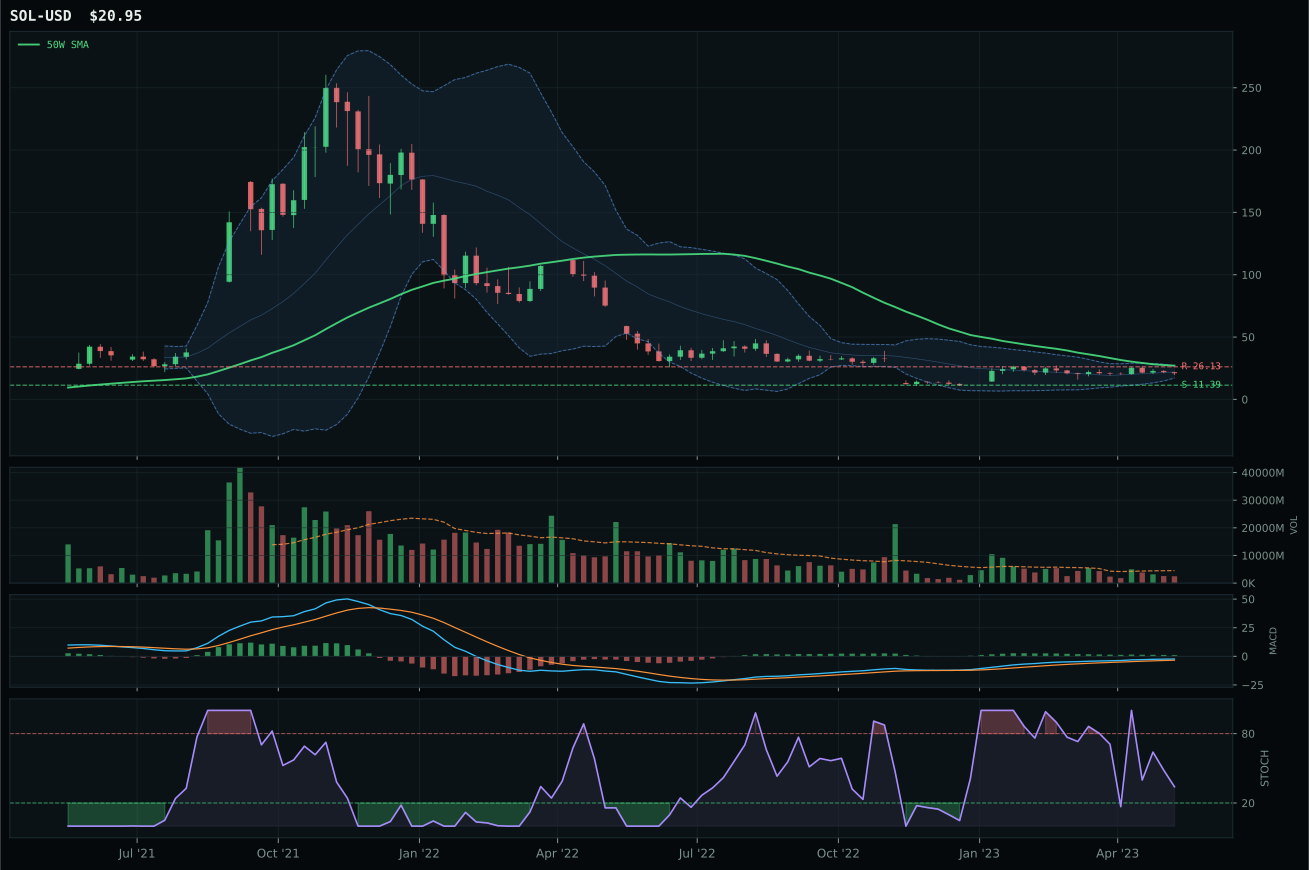
Crypto Regime — ValueBTC
post-touch structure is too wide to count as a range; max/min close ratio is 1.86
TrendBTC not confirmed
one or more available conditions failed
Category Rankings
| Rank | Category | Winner | Score | Alloc | 4W Ret | Peers (4W) |
|---|---|---|---|---|---|---|
| 1 | Precious Metals | GLD | 73.0 | 20% | -2.94% | GDX -8.1% · SLV -0.4% |
| 2 | Utilities & Infrastructure | PAVE | 54.3 | 20% | +5.80% | IGF -4.6% · XLU -4.1% |
| 3 | Technology | XLK | 47.4 | 10% | +10.62% | IGV +12.7% · CIBR +8.4% |
| 4 | Nuclear Energy | URNM | 39.1 | 10% | +6.39% | URA +7.5% · NLR +2.2% |
| 5 | Defense & Aerospace | XAR | 36.9 | 10% | +5.07% | ITA +3.6% · ROKT +4.6% |
| 6 | Industrial Metals | COPX | 33.4 | 10% | -0.29% | REMX -1.6% · PICK -0.4% |
| 7 | Emerging Markets | INDA | 30.8 | 10% | +1.66% | ILF +4.3% · IEMG +2.4% |
| 8 | AI | BOTZ | 26.9 | 10% | +12.19% | SMH +20.7% · AIQ +13.7% |
| 9 | Agriculture & Livestock | MOO | 19.4 | 0% | -2.39% | VEGI -2.3% · WEAT -2.4% |
| 10 | Traditional Energy | XLE | — | 0% | +1.65% | FCG +3.2% · XOP +4.0% |
Precious Metals — GLD
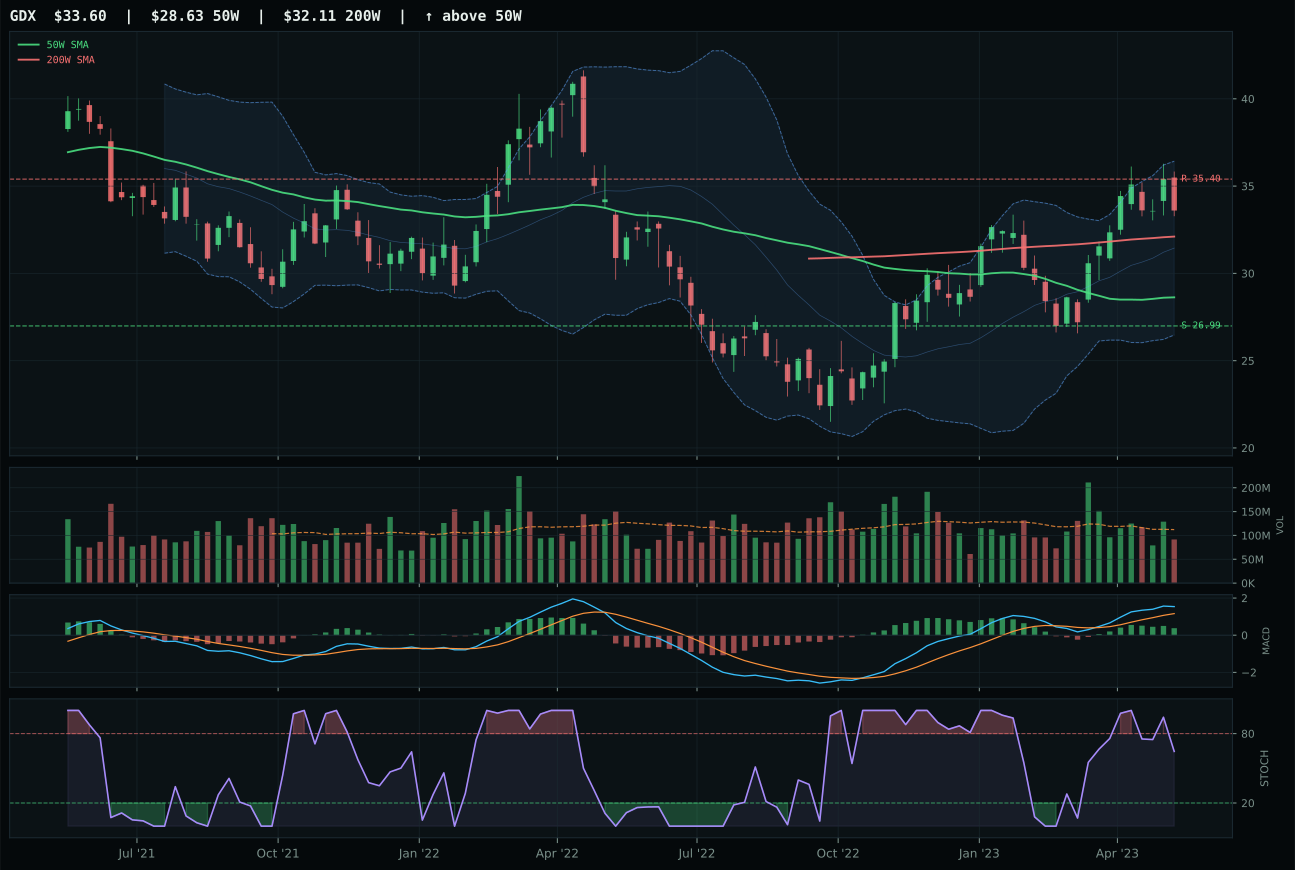
GDX has a vertical extension profile with 12.6% 13-week relative strength versus SPY.
A failed hold above support would weaken the setup.
Actionable but governed by invalidation levels.
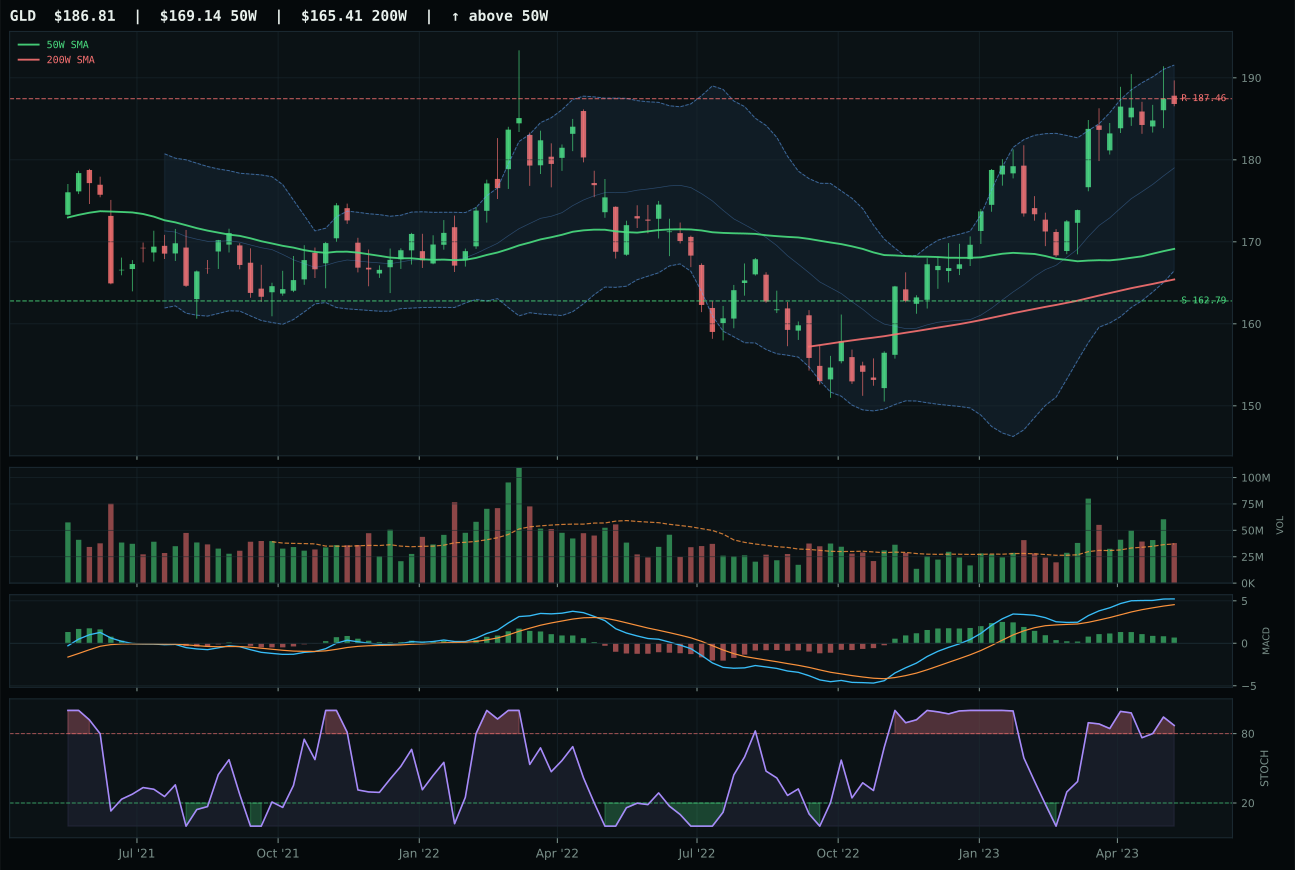
GLD has a neutral structure profile with 6.9% 13-week relative strength versus SPY.
A failed hold above support would weaken the setup.
Actionable but governed by invalidation levels.
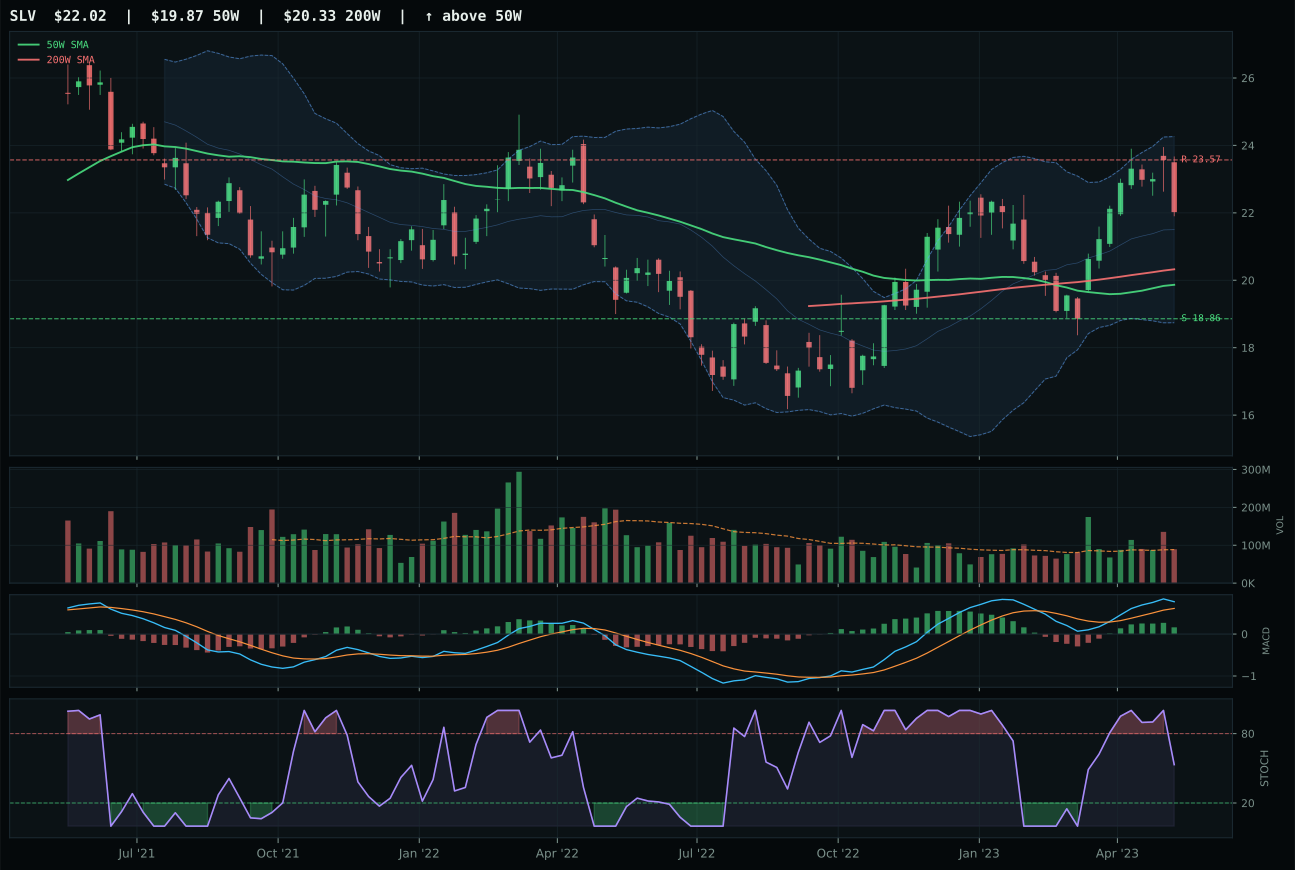
SLV has a neutral structure profile with 7.9% 13-week relative strength versus SPY.
A failed hold above support would weaken the setup.
Actionable but governed by invalidation levels.
GLD wins Precious Metals and earns top-2 overweight allocation with a commanding 73.0 category score anchored on perfect trend confirmation—price above both the 50W and 200W with a clean 0.2% slope and 6.9% relative strength versus SPY. Gold has posted 7.8% thirteen-week returns on neutral volume at 1.02x, creating a rare setup where momentum is confirmed by broad market breadth rather than speculation. The real strength emerges in the macro alignment: monetary hedge bid is active at +14, a descriptor that directly captures central bank buying and the flight-to-safety narrative dominating disinflation scenarios, while disinflation pressure adds another +8 boost. GDX, the runner-up, owns superior thirteen-week returns at 13.4% and higher relative strength at 12.6% but sits 17.4% above the 50W in vertical extension—every new buyer at current prices is chasing, not defending a level. GLD's 10.4% extension is meaningful but sustainable because the structure remains neutral with cleanliness at 50.0 and compression at 86.6; the MACD flattens but has not yet rolled over, and stochastic RSI sits overbought at 0.87 without yet showing the exhaustion that would signal an imminent reversal.
Precious Metals ranks top-2 and receives 10% overweight allocation, its 73.0 final score reflecting powerful macro tailwinds that align with the disinflation regime and active monetary-hedge positioning. The category-level macro fit stands at 78.0/100, the highest in the portfolio, because three strong descriptors are aligned: disinflation helps at +8, monetary hedge bid is active at +14, and disinflation pressure itself adds +6. This is the rare category where macro and technical evidence reinforce rather than contradict—GLD's 70.8/100 technical score combines with 72.0/100 macro fit to create a conviction allocation. The risk is timing: stochastic RSI is already overbought, MACD is flattening, and resistance sits just 0.3% above current price at 187.46; any failure to break above that level triggers immediate pullback pressure toward support at 162.79. GLD must defend the 10.4% extension above the 50W to maintain top-2 status; a close below 181.73 (Fib 0.236) would signal the move is rolling over. Allocation remains fully justified because monetary hedge demand is structural under disinflation, not cyclical, but tactical entry timing would be improved on any near-term pullback toward the 50W.
Utilities & Infrastructure — PAVE
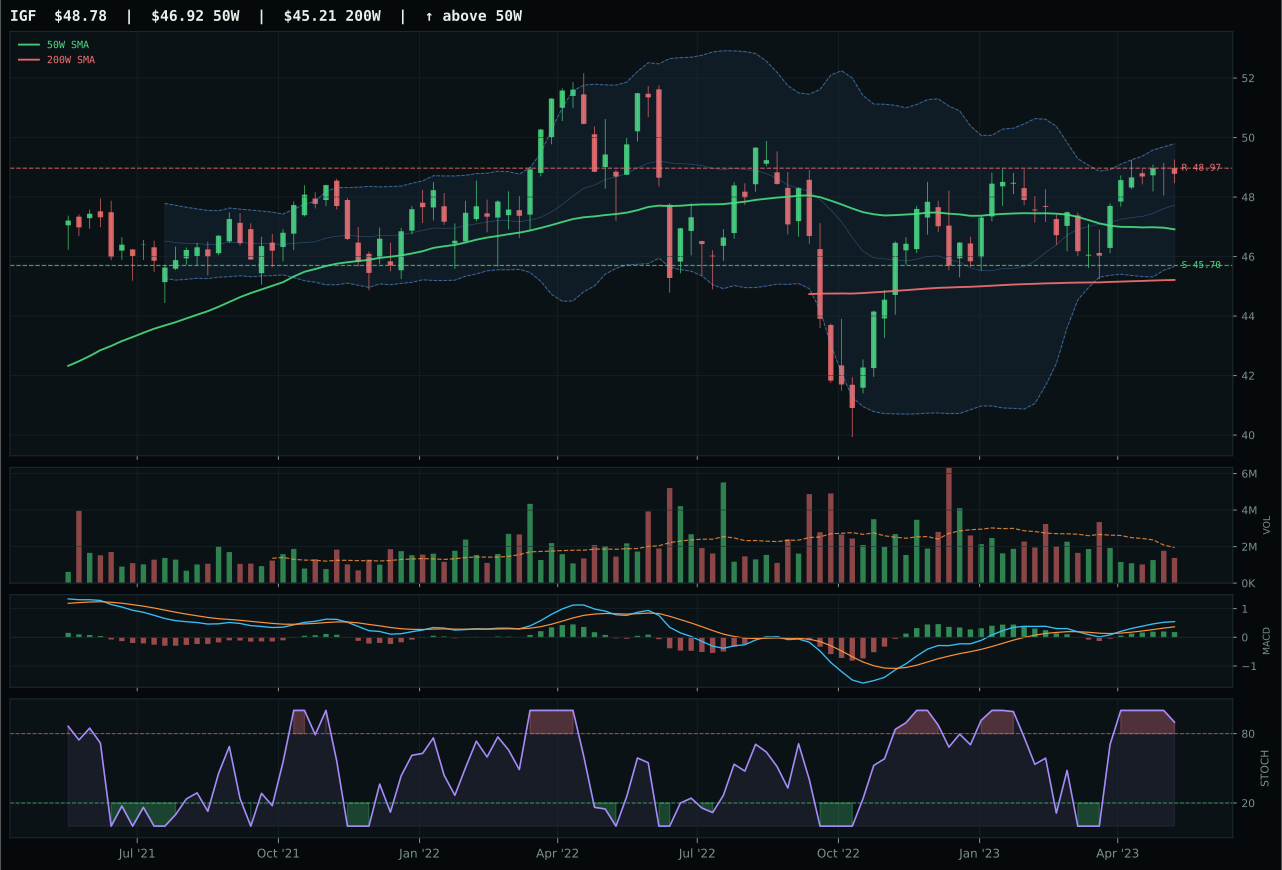
IGF has a neutral structure profile with 1.7% 13-week relative strength versus SPY.
A failed hold above support would weaken the setup.
Actionable but governed by invalidation levels.
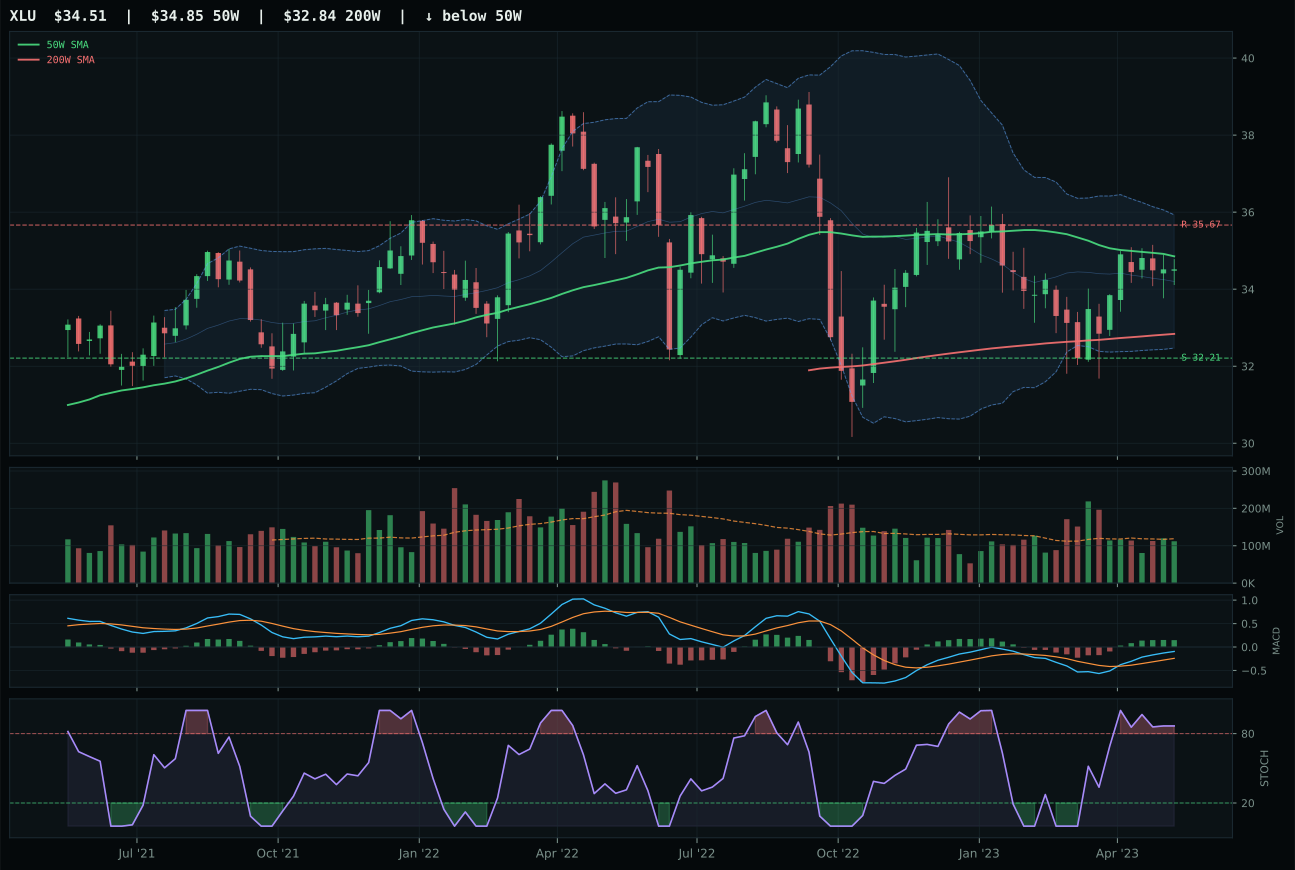
XLU has a compression near 50W profile with 1.1% 13-week relative strength versus SPY.
A failed hold above support would weaken the setup.
Actionable but governed by invalidation levels.
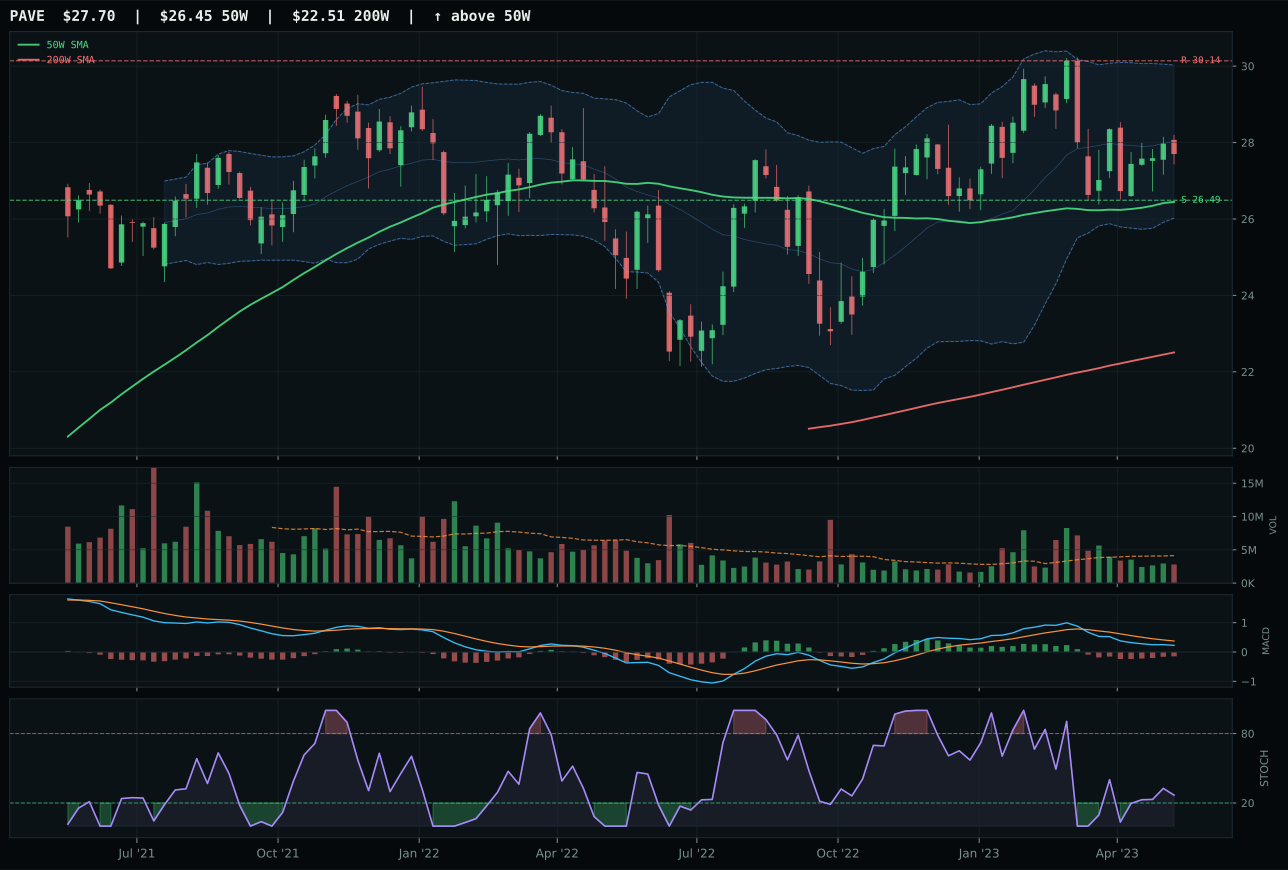
PAVE has a pullback into support profile with -5.3% 13-week relative strength versus SPY.
A failed hold above support would weaken the setup.
Actionable but governed by invalidation levels.
PAVE wins Utilities & Infrastructure and earns top-2 overweight with a 54.3 category score powered by flawless timing at 100.0/100—price sits 4.7% above support at 26.49 in pullback-into-support structure, with MACD bearish but improving and stochastic RSI rising mid-zone at 0.27, creating the exact conditions where defensive capital rotates in ahead of broader market recovery. Trend confirmation at 85.0/100 reflects sustained price position above both 50W and 200W with positive slope at 0.1%, signaling that infrastructure remains above its moving-average anchors despite recent weakness. Risk/reward at 76.9/100 heavily favors the downside (4.6% to support) over the upside (-8.1% to resistance at 30.14), a setup that attracts accumulation when the macro narrative shifts toward defensive positioning. IGF, the runner-up, trades with superior absolute trend at 93.0/100 but lost because its timing is weaker (72.0 vs 100.0)—IGF has already moved into upper retracement and sports overbought stochastic RSI that is rolling over, meaning the setup lacks the coil quality of PAVE's compression structure. Category-relative strength disadvantage of -6.4% versus IGF's +0.6% matters less than the timing edge; PAVE's perfect 100.0 at the 50W near support simply provides clearer entry mechanics.
Utilities & Infrastructure ranks top-2 and receives 10% overweight allocation with a 54.3 final category score, the second-highest in the portfolio, because category-level macro fit at 64.0/100 is strong relative to tier-2 peers and PAVE's technical timing is exceptional. Disinflation helps this category at +7, disinflation pressure adds another +6, and transition/mixed macro regime support contributes +4—a total of +17 points of structural tailwind that aligns perfectly with defensive capital rotation under stress. The macro narrative is straightforward: in disinflation environments, bond proxies and defensive infrastructure outperform as real rates rise and growth slowdown concerns mount; PAVE's 4.7% pullback into support coincides exactly with the inflection point where risk-averse allocators rotate defensively. Liquidity stress at -3 is the only meaningful headwind, far milder than in other categories, and suggests the infrastructure thesis can continue to attract capital inflow. The allocation thesis holds only if support at 26.49 remains intact and MACD continues improving through bullish crossover. A breakdown of support triggers immediate downside cascade to the 200W and removes the defensive rationale. Top-2 ranking is justified because the category offers both strong macro tailwinds and exceptional timing mechanics—rare alignment in a portfolio where most categories must choose between one or the other.
Technology — XLK
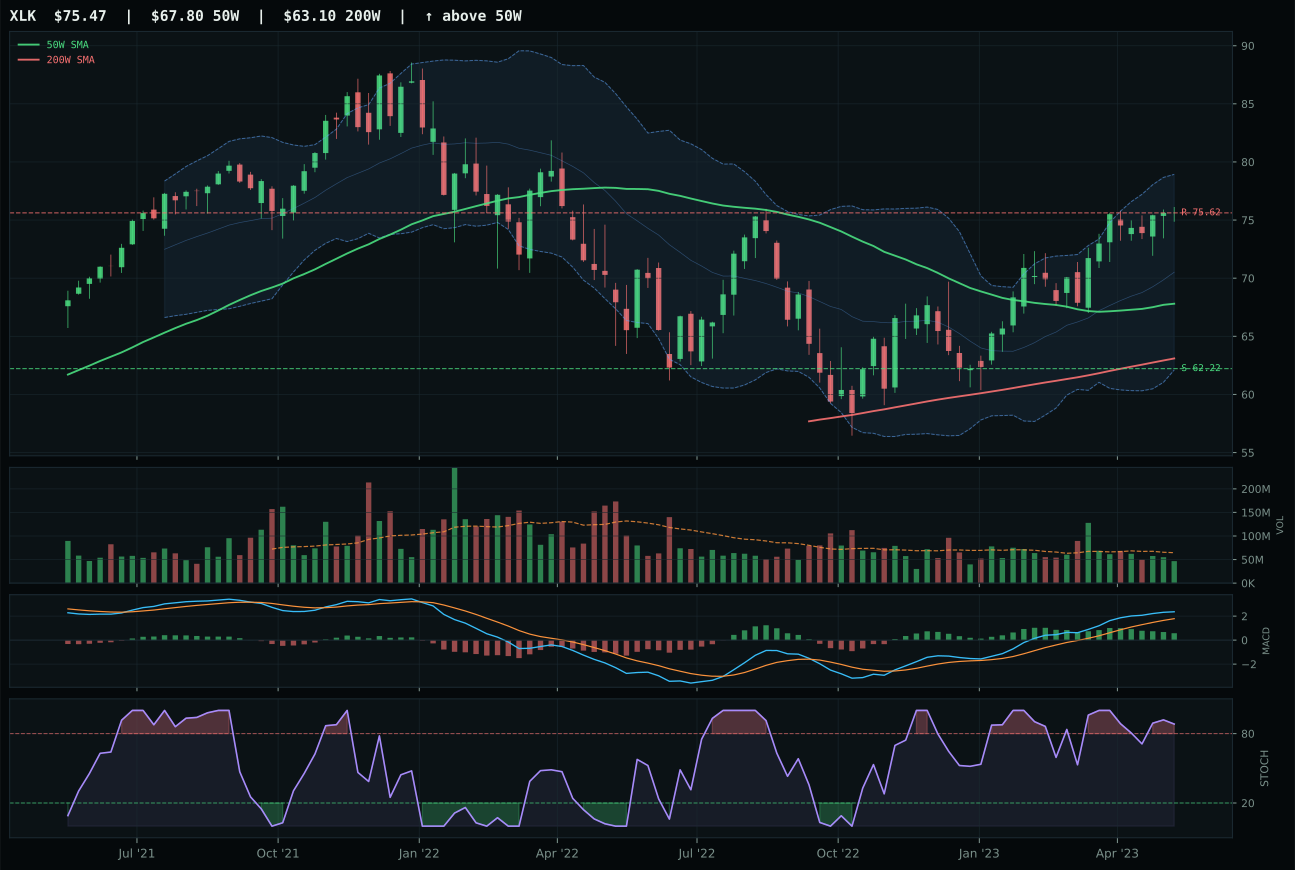
XLK has a neutral structure profile with 6.7% 13-week relative strength versus SPY.
A failed hold above support would weaken the setup.
Actionable but governed by invalidation levels.
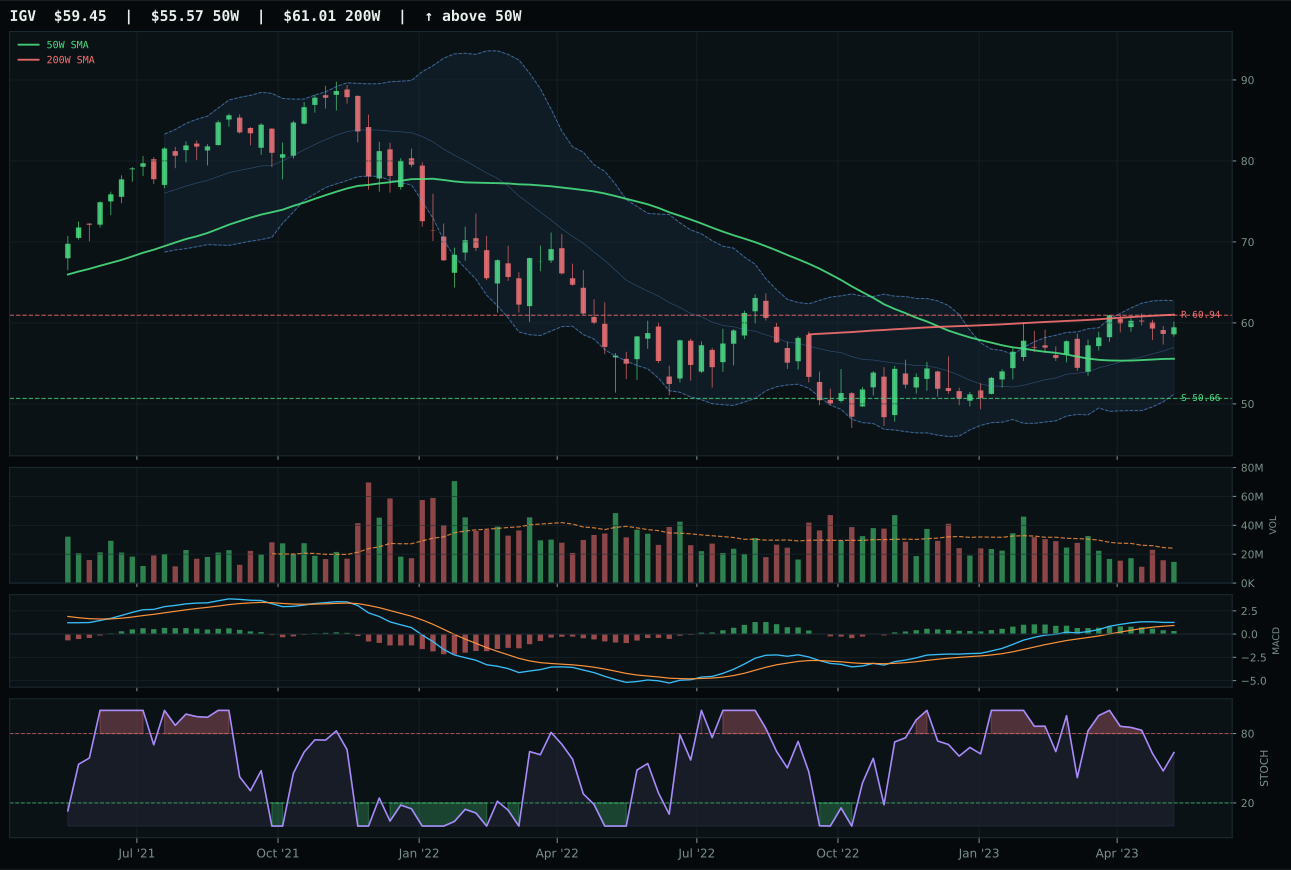
IGV has a neutral structure profile with 3.5% 13-week relative strength versus SPY.
A failed hold above support would weaken the setup.
Actionable but governed by invalidation levels.
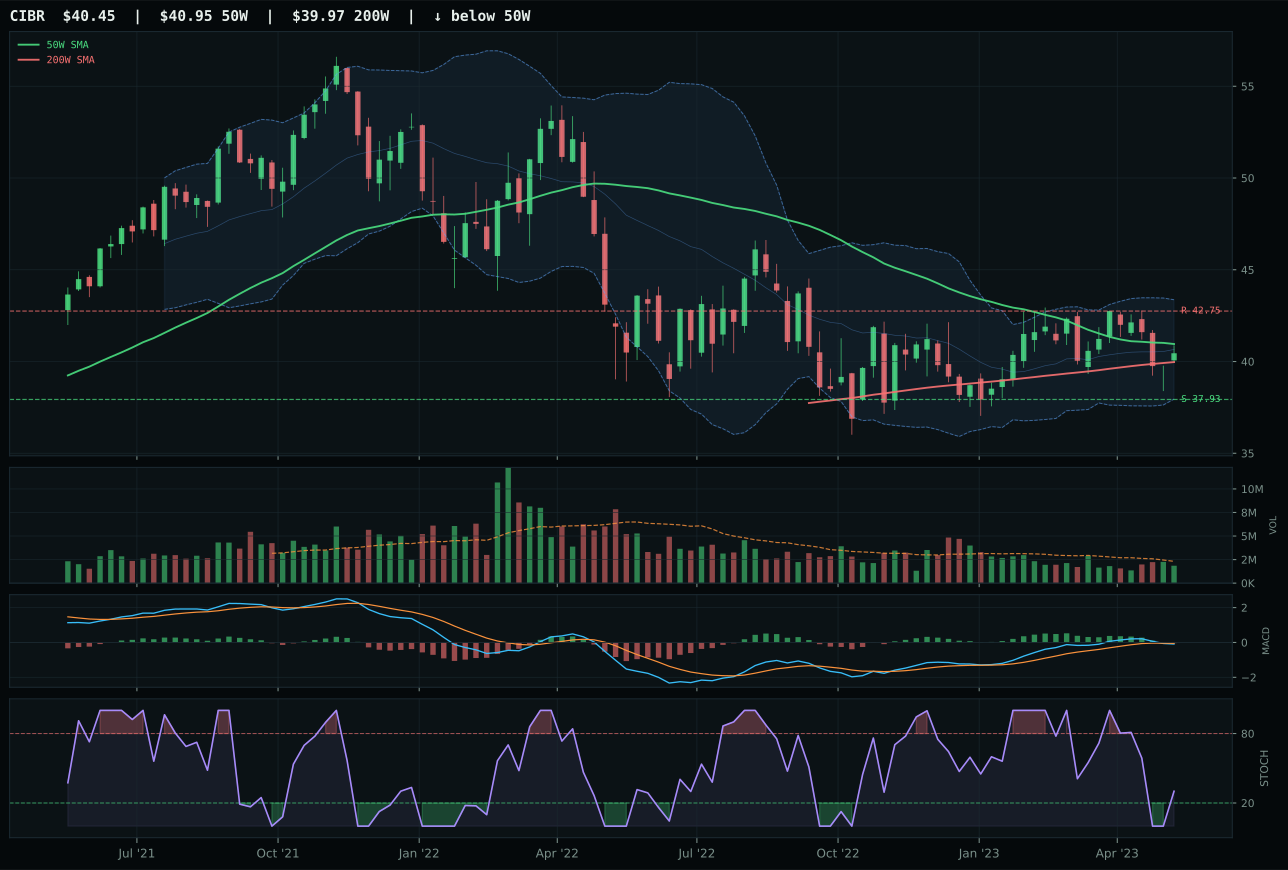
CIBR has a compression near 50W profile with -3.6% 13-week relative strength versus SPY.
A failed hold above support would weaken the setup.
Actionable but governed by invalidation levels.
XLK wins the category with a 6.7-point lead over IGV because it maintains superior relative strength within the basket at 3.1% versus IGV's flat 0.0%, signaling that money is rotating into profitable large-cap names rather than chasing duration-sensitive growth. The chart shows price at 71.46, sitting 11.3% above the 50-day moving average with neutral structure and perfect trend confirmation—above both the 50W and 200W with a 0.1% positive slope—but the technical deterioration matters: MACD is bullish yet flattening while stochastic RSI has already reached overbought momentum at 0.88, meaning the fuel for the move is running out. Volume at 0.72x the 20-week average exposes thin participation, so this advance has been built on capital restraint rather than institutional accumulation, creating asymmetric risk into resistance at 75.62 just 4 cents away. IGV underperformed despite a technically defensible 4.4% thirteen-week return because its enterprise-software positioning carries -6 and -9 macro headwinds from credit and liquidity stress that XLK, as broad profitable tech, better absorbs.
Technology earned 5% allocation as a tier-2 category, ranking outside the top two despite a 47.4 final score that reflects solid technical evidence at 71.1/100 but a muted 35.0/100 macro fit under disinflation. The category faces genuine headwinds: liquidity stress registered at -9 and credit stress at -6, both active descriptors that penalize growth and rate-sensitive exposure when capital becomes scarce and credit conditions tighten. XLK's neutral structure and overbought timing would normally disqualify it for top-2 consideration, but the real problem is the macro regime itself—disinflation benefits this sector only modestly at +7, far below what would be needed to compete with real-asset and monetary-hedge plays sitting in top-2. For Technology to earn top-2 positioning in future weeks, either credit conditions would need to stabilize markedly or the macro narrative would need to shift toward growth acceleration; today it remains a tactical hold anchored to the 50W, with support at 62.22 providing a defined exit if the setup breaks.
Nuclear Energy — URNM
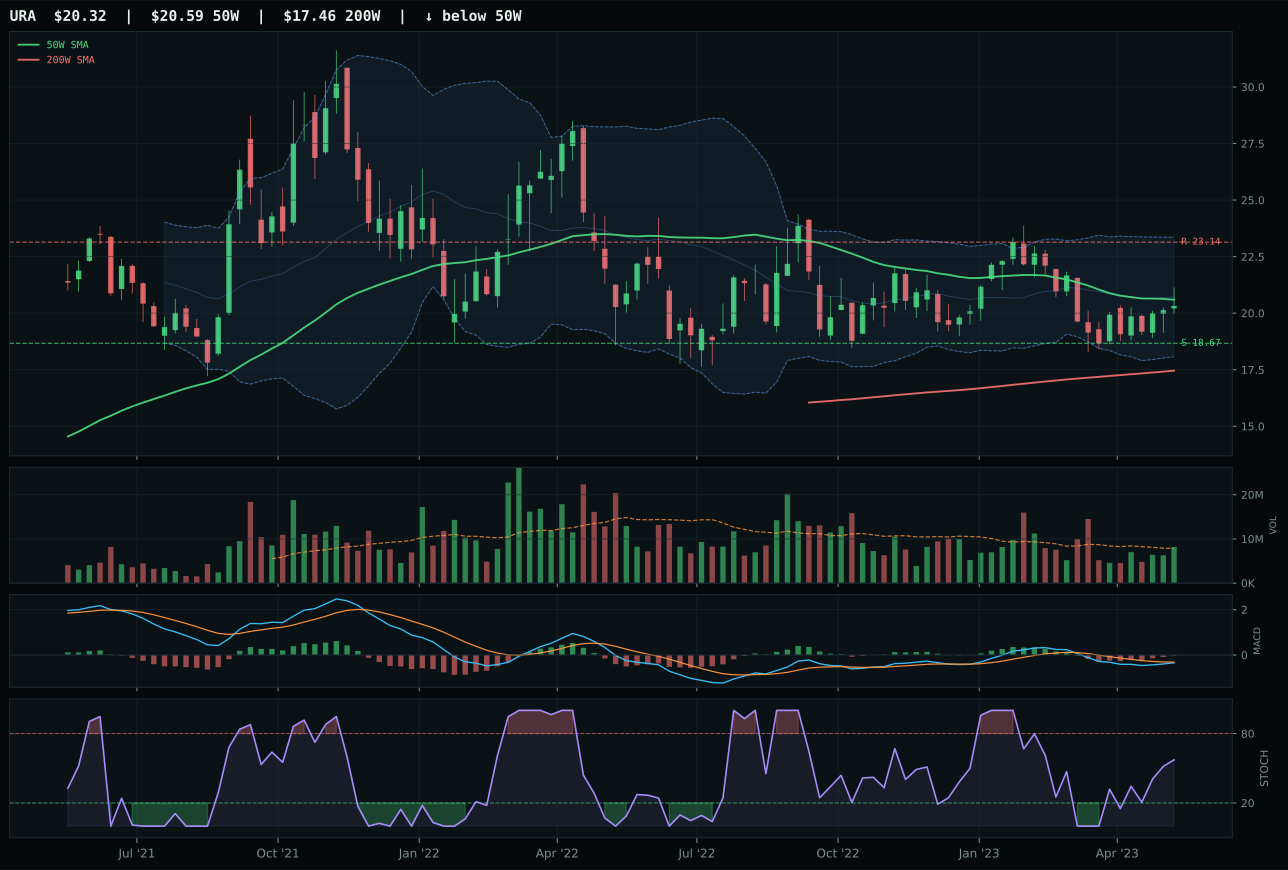
URA has a compression near 50W profile with -11.1% 13-week relative strength versus SPY.
A failed hold above support would weaken the setup.
Actionable but governed by invalidation levels.
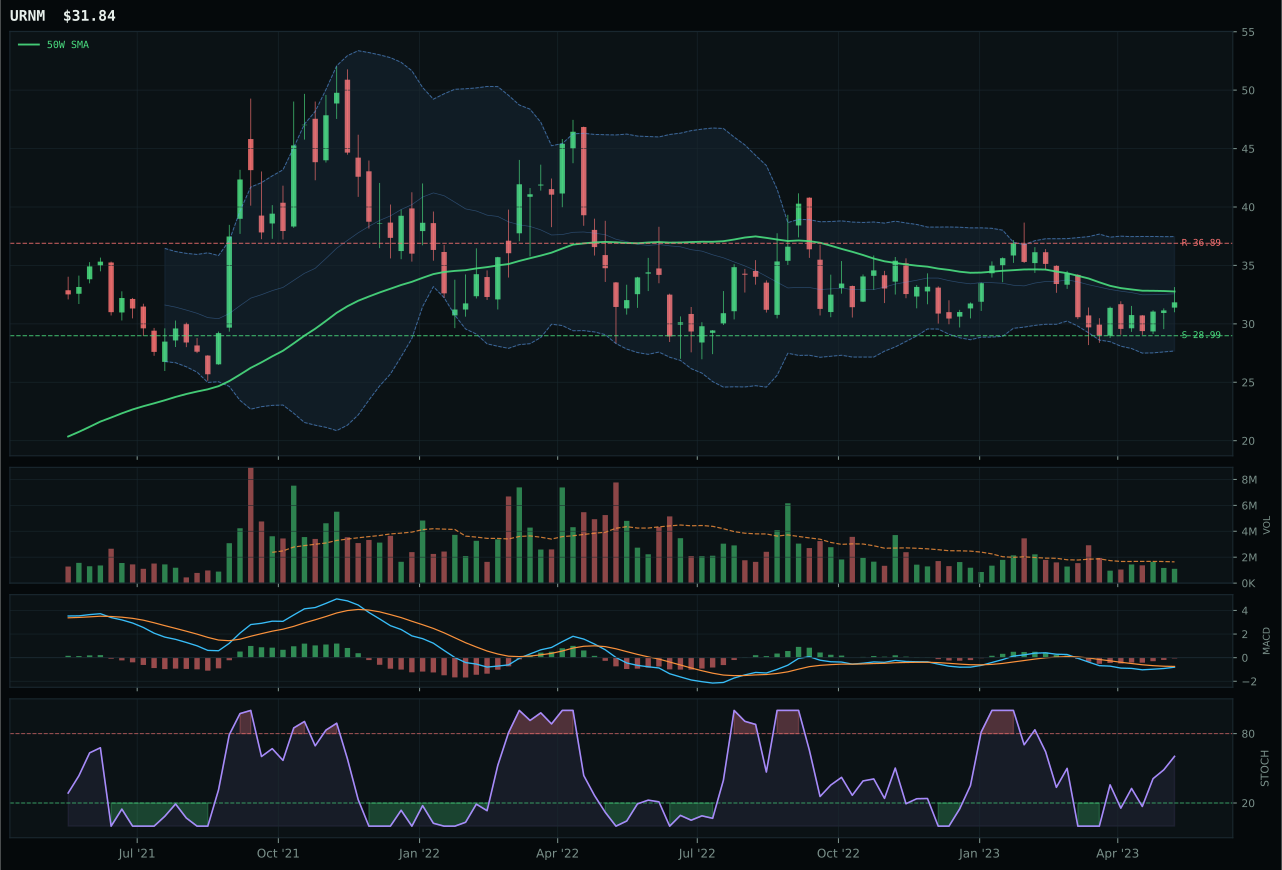
URNM has a compression near 50W profile with -12.7% 13-week relative strength versus SPY.
A failed hold above support would weaken the setup.
Actionable but governed by invalidation levels.
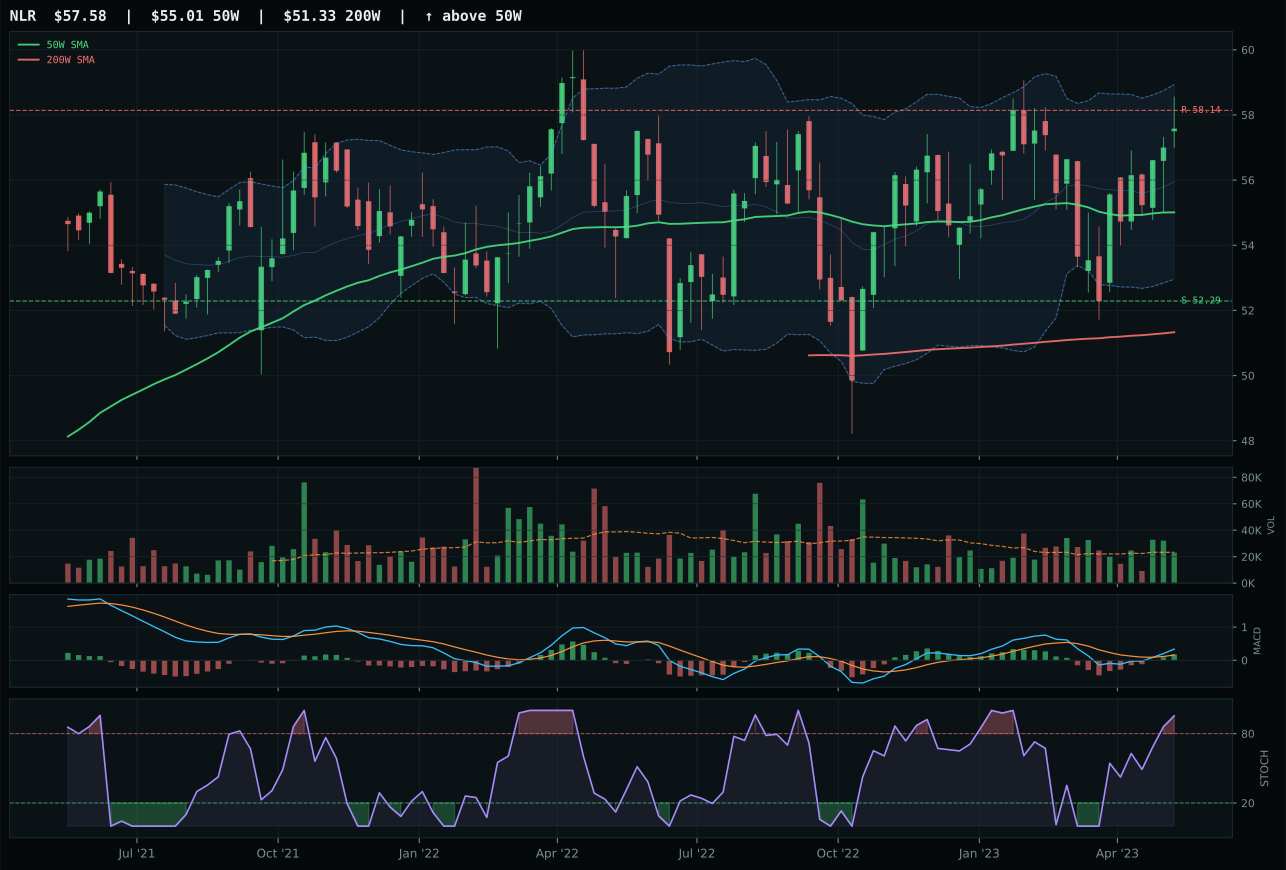
NLR has a neutral structure profile with -0.8% 13-week relative strength versus SPY.
A failed hold above support would weaken the setup.
Tracked, but not top-2 eligible because: .
URNM wins Nuclear Energy despite glaring technical weakness—trend score just 23.0/100 from price below both the 50W and 200W with negative slope—because it owns the cleanest timing setup at 100.0/100 and the best risk/reward at 78.1/100 within its three-ETF basket. Price sits -2.8% below the 50W in compression near support at 28.99, with stochastic RSI rising mid-zone at 0.60 and MACD bearish but improving, creating the exact reversal coil conditions where capitulation buying often emerges. URA, the runner-up, posts superior technical evidence at 53.0/100 with stronger trend confirmation, yet lost because its risk/reward advantage is minimal (77.8 vs 78.1) and the category macro narrative favors any sign of buyer capitulation over slow-and-steady accumulation. The deeper problem is momentum confirmation at just 18.6/100: four-week returns of +3.5% provide a flicker of hope, but thirteen-week returns of -11.9% and negative category-relative strength at -1.6% confirm this is a desperation reversal setup, not genuine new demand. Volume at 0.67x thin participation shows the category has been abandoned by institutional capital; URNM wins by default of weakness rather than strength.
Nuclear Energy receives 5% tier-2 allocation with a 39.1 final score, ranking in the middle tier because macro fit at 45.0/100 provides modest structural support from real asset sponsorship at +7, offsetting liquidity stress at -7 and credit stress at -5. URNM's technical evidence at only 25.1/100 is the constraint; the setup is pure mean reversion play—buyers waiting for the 50W breakdown to flush out the last sellers before accumulating at lower prices. Support at 28.99 represents the line in the sand: a break below triggers immediate downside cascade toward the 200W, invalidating the entire reversal thesis. For Nuclear to maintain tier-2 status through next week, either price must hold the 28.99 support and generate positive weekly closes, or the macro narrative around real asset sponsorship and energy transition must strengthen visibly. Currently, allocation reflects portfolio diversification into the energy-transition thesis rather than near-term conviction; this is a three-to-six-month rotational candidate, not an immediate tactical opportunity. The 5% slot is anchored to the timing score and the belief that oversold uranium-miner scarcity will eventually reverse, but entry risk is elevated given the trend breakdown.
Defense & Aerospace — XAR
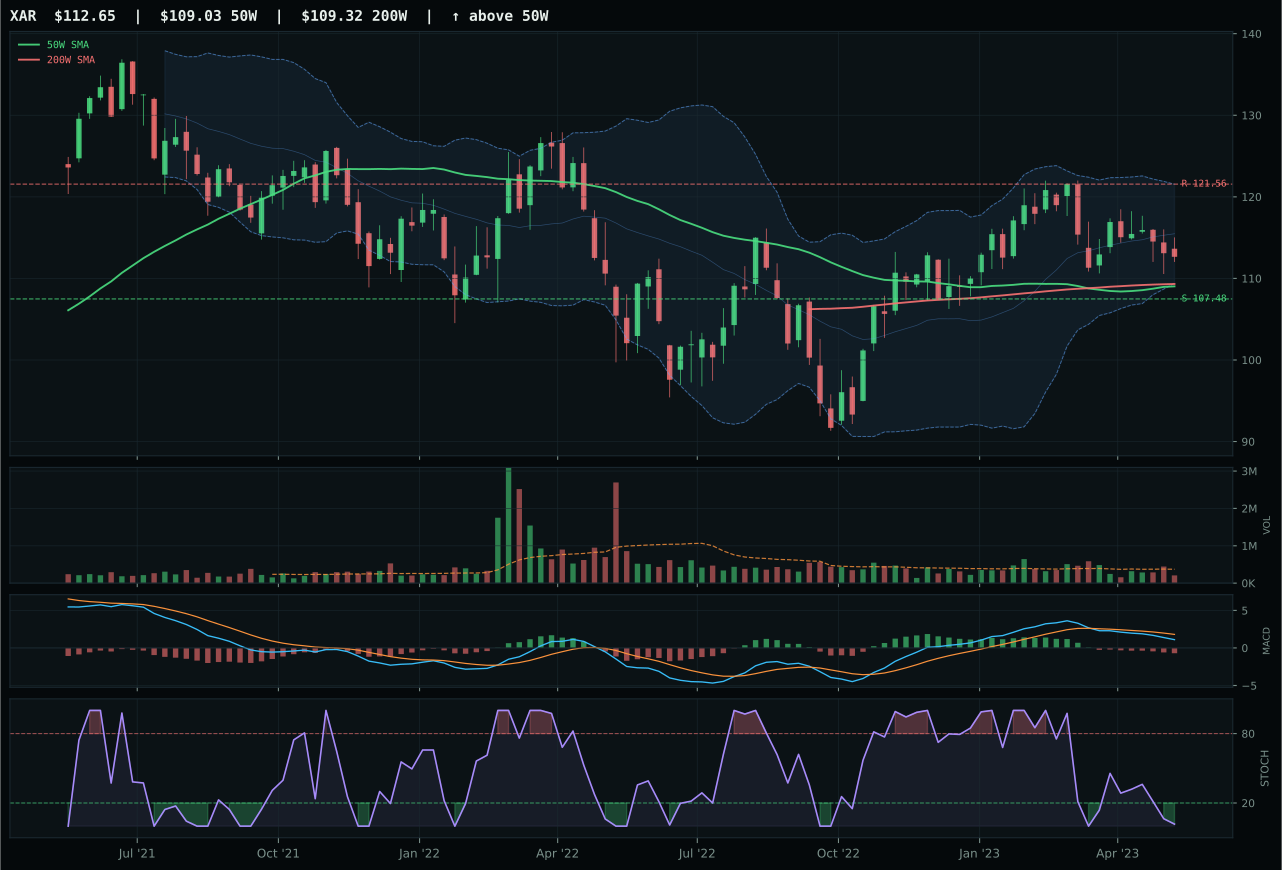
XAR has a pullback into support profile with -5.3% 13-week relative strength versus SPY.
A failed hold above support would weaken the setup.
Actionable but governed by invalidation levels.
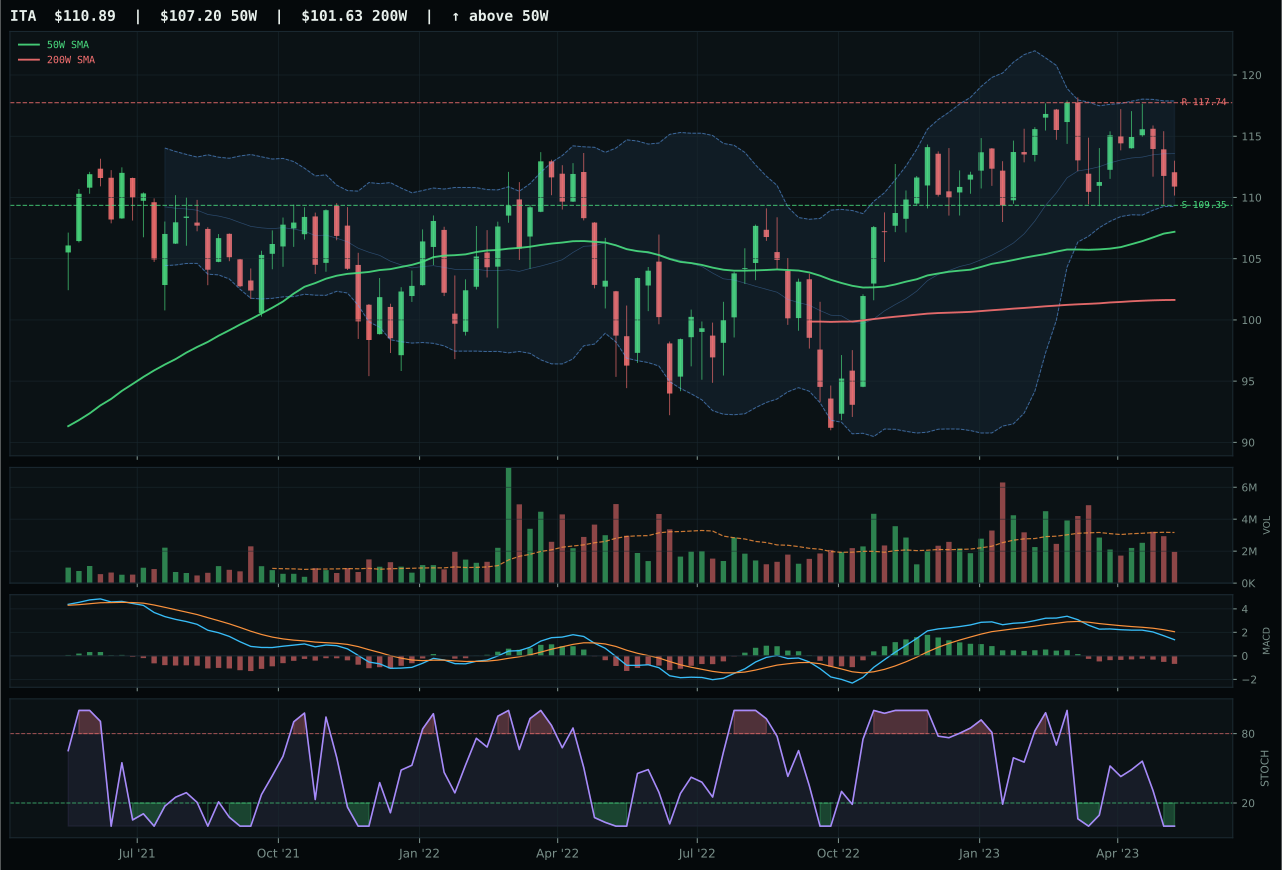
ITA has a pullback into support profile with -4.9% 13-week relative strength versus SPY.
A failed hold above support would weaken the setup.
Actionable but governed by invalidation levels.
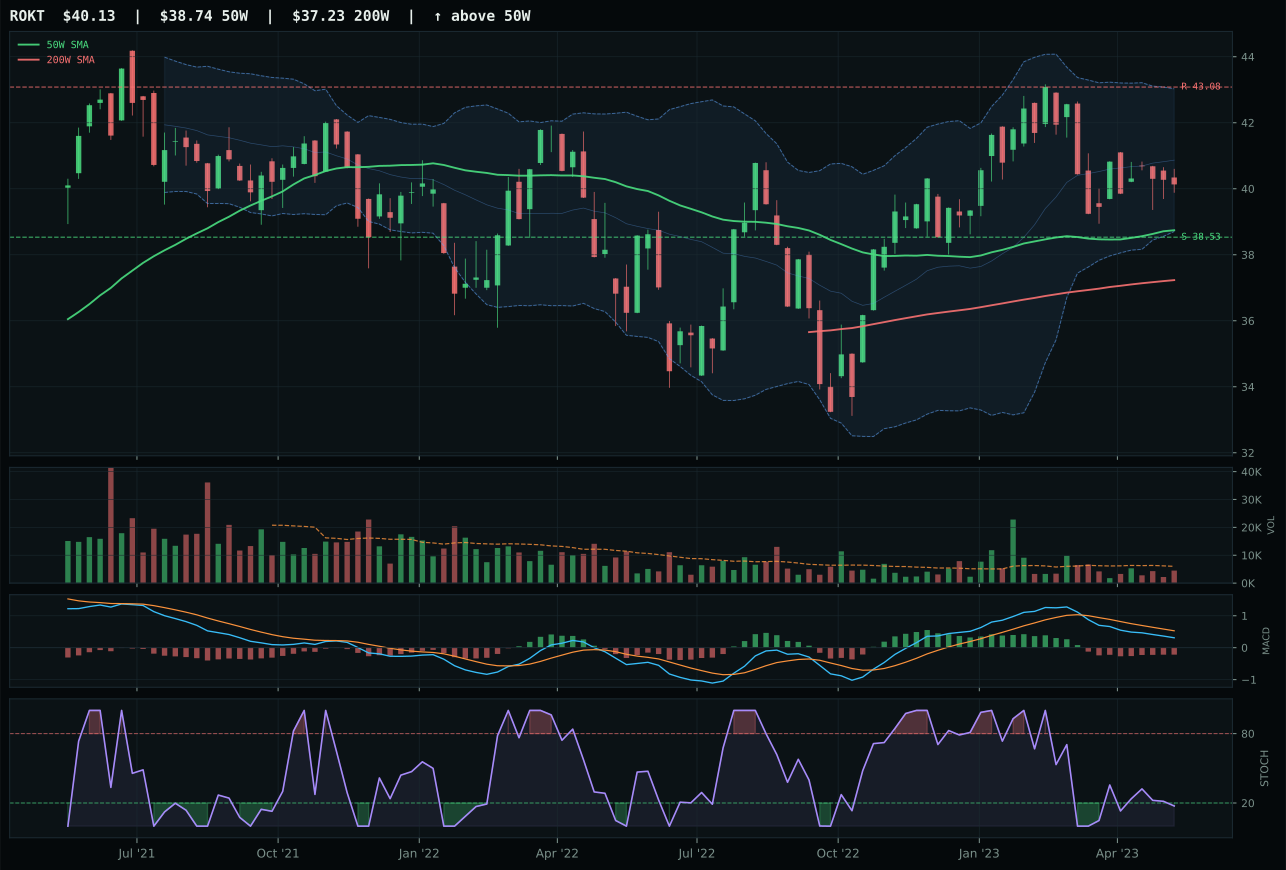
ROKT has a pullback into support profile with -4.6% 13-week relative strength versus SPY.
A failed hold above support would weaken the setup.
Tracked, but not top-2 eligible because: .
XAR wins the Defense category despite objectively weak technical credentials—a 3.3% pullback toward support at 107.48 with bearish MACD and oversold stochastic RSI at 0.02—because it posted the cleanest risk/reward setup and the category's strongest timing score at 95.0/100. Price sits in the upper retracement zone near Fib 0.236 at 114.73 with resistance locked at 121.56 just 5.7% overhead, creating a defined trade structure where the downside-to-support at 4.8% exceeds the upside-to-resistance at -7.3%. ITA, the runner-up, owns a fractionally superior 39.4/100 technical evidence score and identical pullback-into-support structure, but XAR's category-relative strength advantage of -0.4% versus ITA's 0.0% tipped the 3/2/1 weighted basket in its favor. The real story is momentum confirmation at just 12.9/100 for the winner: thirteen-week returns of -4.5% and four-week returns of -2.4% signal this sector has been sold into weakness, making the setup more of a capitulation bounce than a genuine leadership transition. Volume at 0.56x confirms thin participation across the entire category, suggesting few institutions are rotating defensively into aerospace.
Defense & Aerospace earned 5% tier-2 allocation with a 36.9 final score, placing it firmly outside top-2 consideration despite a 51.0/100 category-level macro fit that is actually serviceable. The allocation reflects a neutral-to-modest macro contribution: credit stress registered +2 (helping bond proxies) but liquidity stress is -4, and the broader disinflation regime provides minimal tailwind to industrial capex spending. XAR's technical evidence at only 32.3/100 is the weak link; the 85.0/100 timing score simply reflects how oversold and deep the pullback has become, not conviction that buyers are accumulating. The setup has edge only if support at 107.48 holds—breach that level and the entire category becomes a short, not a hold. What matters for Defense to ascend to top-2 is a visible shift in macro narrative toward either credit stability (removing the -4 liquidity stress headwind) or real-asset acceleration that would attract rotation into defense primes; at current macro weightings, this remains a defensive placeholder rather than a core conviction.
Industrial Metals — COPX
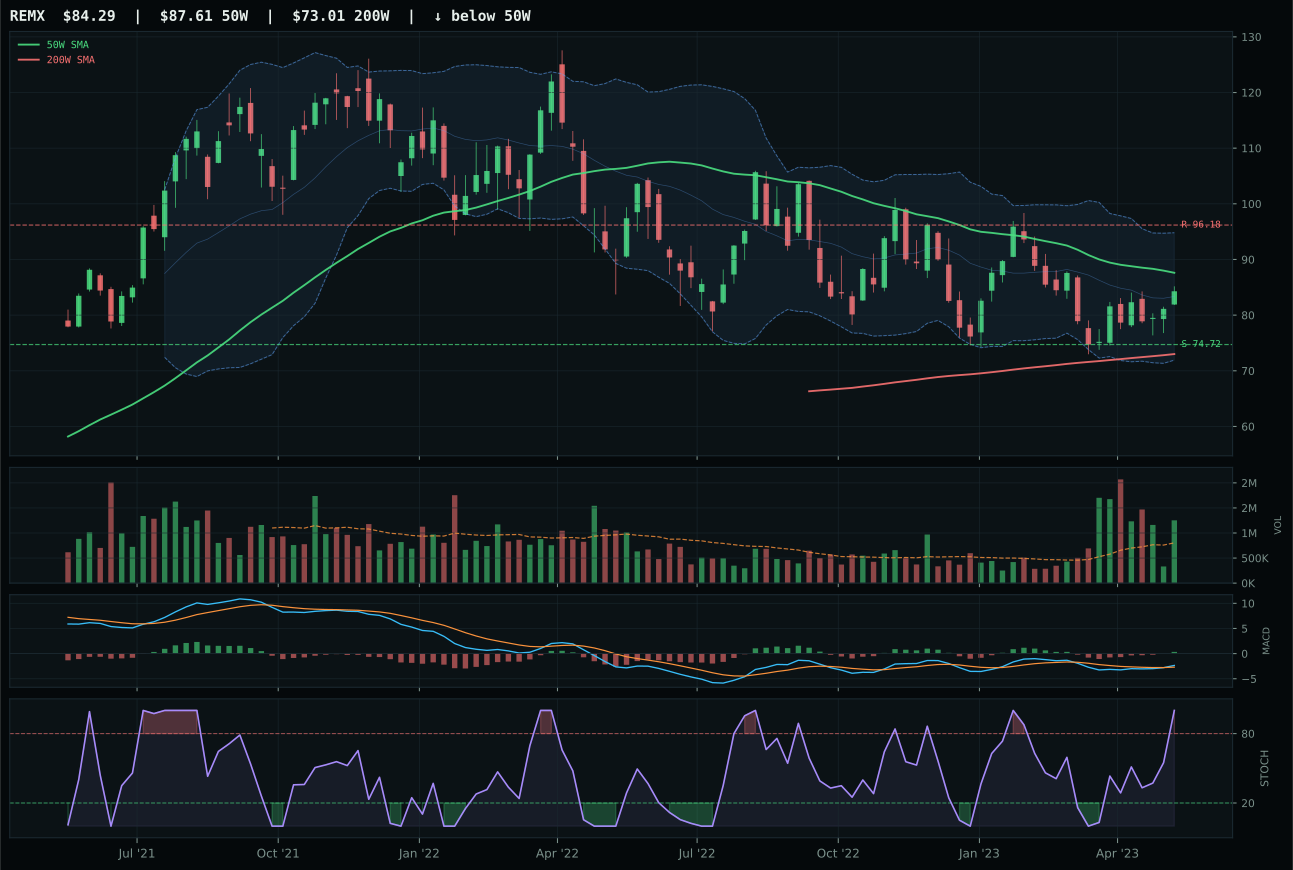
REMX has a neutral structure profile with -6.0% 13-week relative strength versus SPY.
A failed hold above support would weaken the setup.
Actionable but governed by invalidation levels.
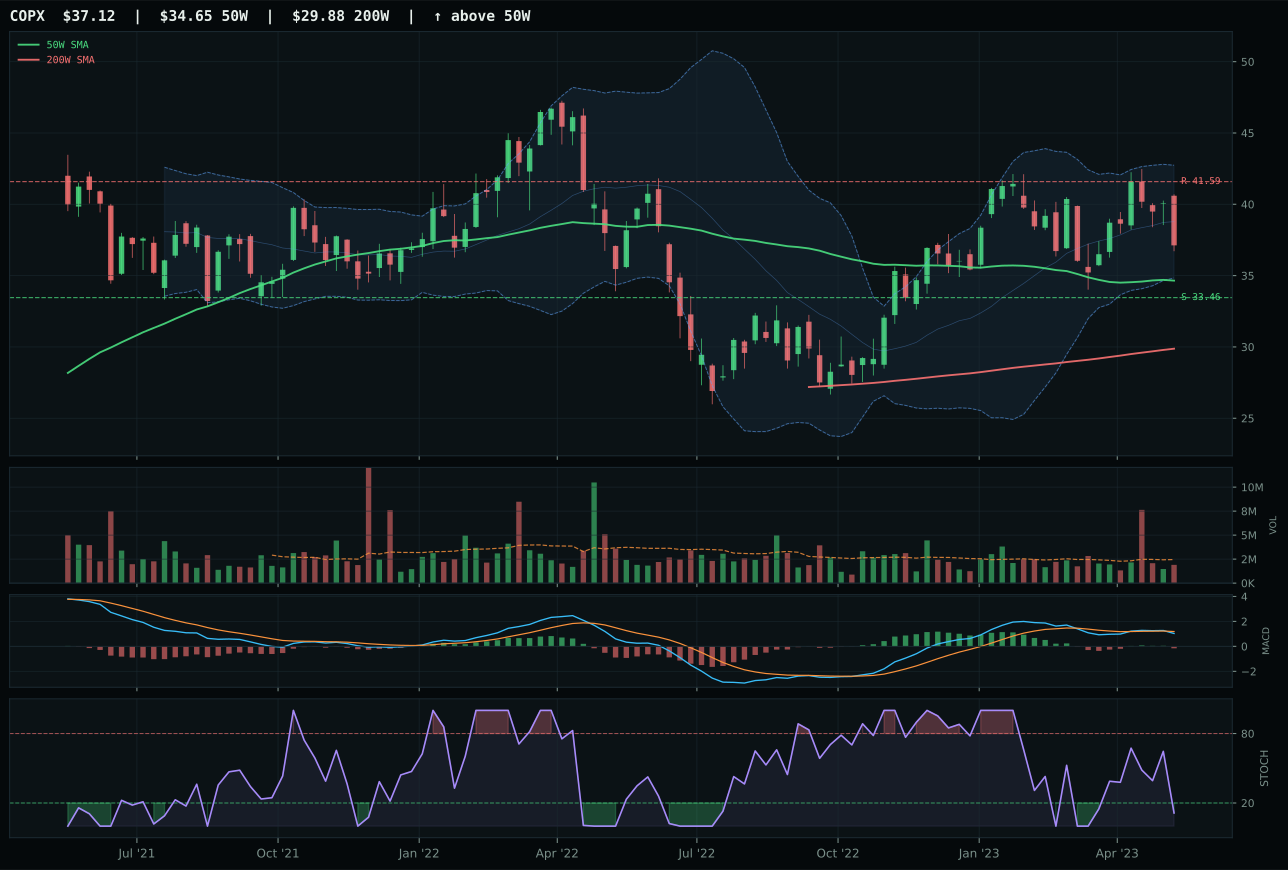
COPX has a neutral structure profile with -4.3% 13-week relative strength versus SPY.
A failed hold above support would weaken the setup.
Actionable but governed by invalidation levels.
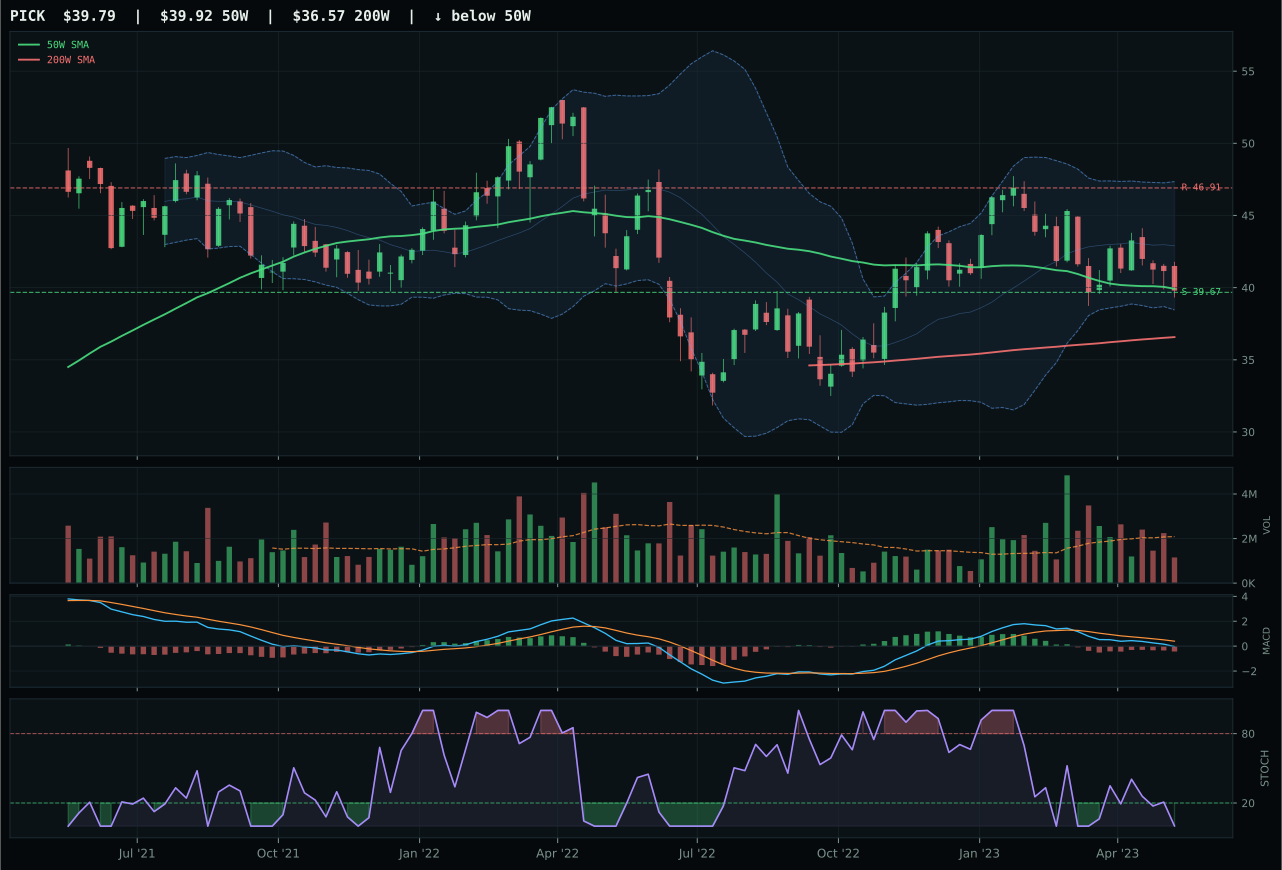
PICK has a pullback into support profile with -10.2% 13-week relative strength versus SPY.
A failed hold above support would weaken the setup.
Actionable but governed by invalidation levels.
COPX wins Industrial Metals with a score of 33.4 despite trailing REMX's superior 71.1/100 technical evidence, a paradox explained entirely by macro fit divergence and category-relative strength. COPX owns only 33.9/100 technical evidence—price sits 7.1% above the 50W with neutral structure but MACD is bearish/weakening and momentum confirmation registers just 8.7/100 from a four-week return of -10.7%. The victory stems from COPX's 1.7% category-relative strength advantage over REMX's flat 0.0%, a thin edge that matters in a weak category. REMX, the runner-up, trades with bullish-and-improving MACD and overbought stochastic RSI at strong participation levels, yet it carries -6.0% relative strength versus SPY and zero relative strength within the category—meaning it is outperforming purely on momentum rollover, not institutional accumulation. The deeper issue is that copper scarcity (COPX's narrative) requires industrial demand to materialize, while rare earths (REMX) benefit from the energy-transition thesis; in a disinflation regime, the latter should dominate, yet it doesn't because liquidity stress at -9 and credit stress at -7 are choking even transition capex.
Industrial Metals receives 5% tier-2 allocation with a 33.4 category score, ranking outside top-2 because technical and macro conditions remain misaligned. Commodity breadth positive is active at +10 and real asset sponsorship at +6, providing +16 points of macro support, yet liquidity stress at -8 and credit stress at -7 create a net macro environment of only 51.0/100 fit. COPX's 33.9/100 technical evidence is the constraint: bearish MACD, oversold stochastic RSI, and negative momentum confirmation mean the setup requires a decisive buyer entry to validate the category-relative strength advantage. Support sits at 33.46 with 10.9% downside and resistance at 41.59 offering only -10.7% upside—a poor risk/reward that reflects the macro bind. For Industrial Metals to ascend to top-2, either commodity breadth would need to accelerate sharply into broad inflationary pressure (pushing disinflation into the rearview), or credit conditions would need to stabilize enough to unlock transition capex spending. Currently, the category is a catch-falling-knife candidate; allocating 5% is prudent portfolio diversification rather than conviction, with the understanding that this slot could flip to 0% if support breaks.
Emerging Markets — INDA
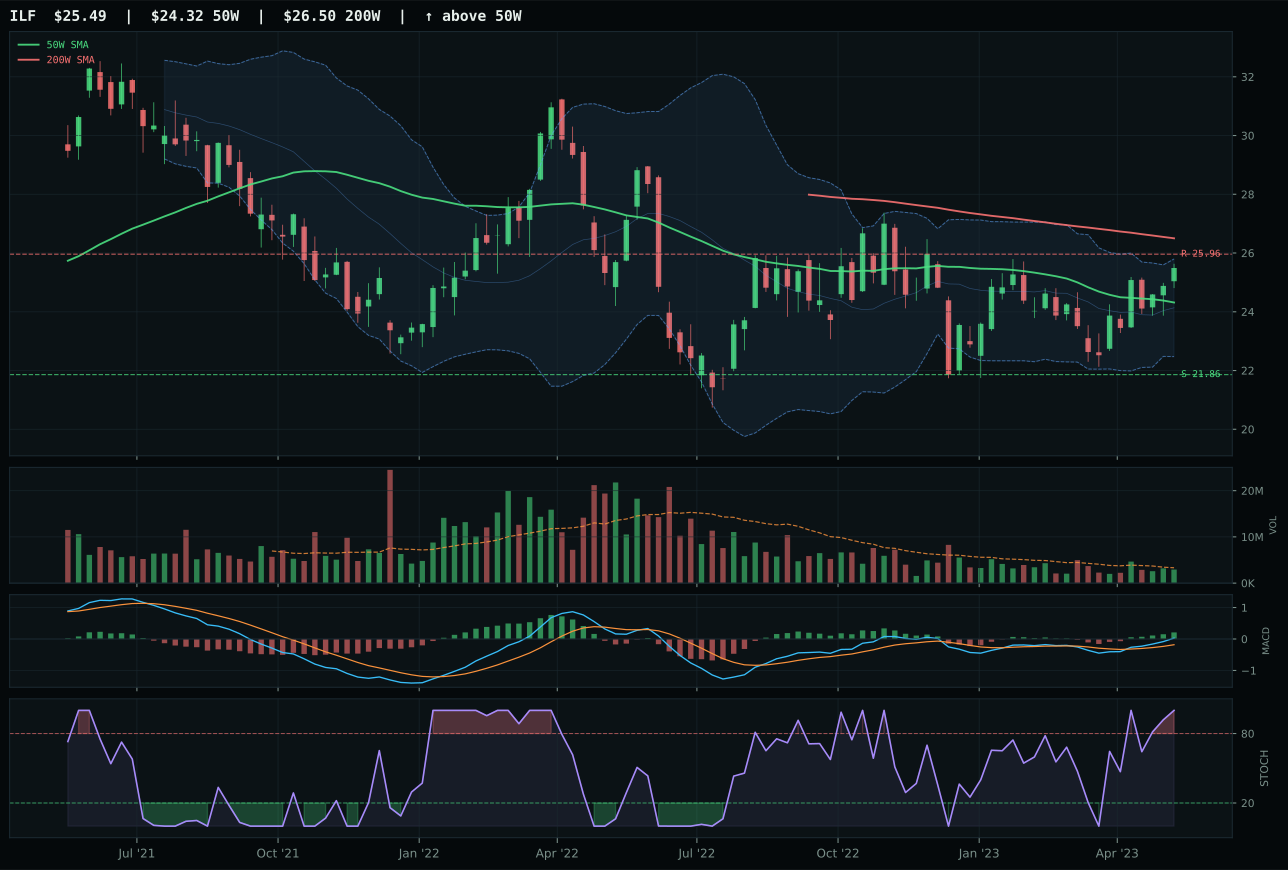
ILF has a neutral structure profile with 5.2% 13-week relative strength versus SPY.
A failed hold above support would weaken the setup.
Actionable but governed by invalidation levels.
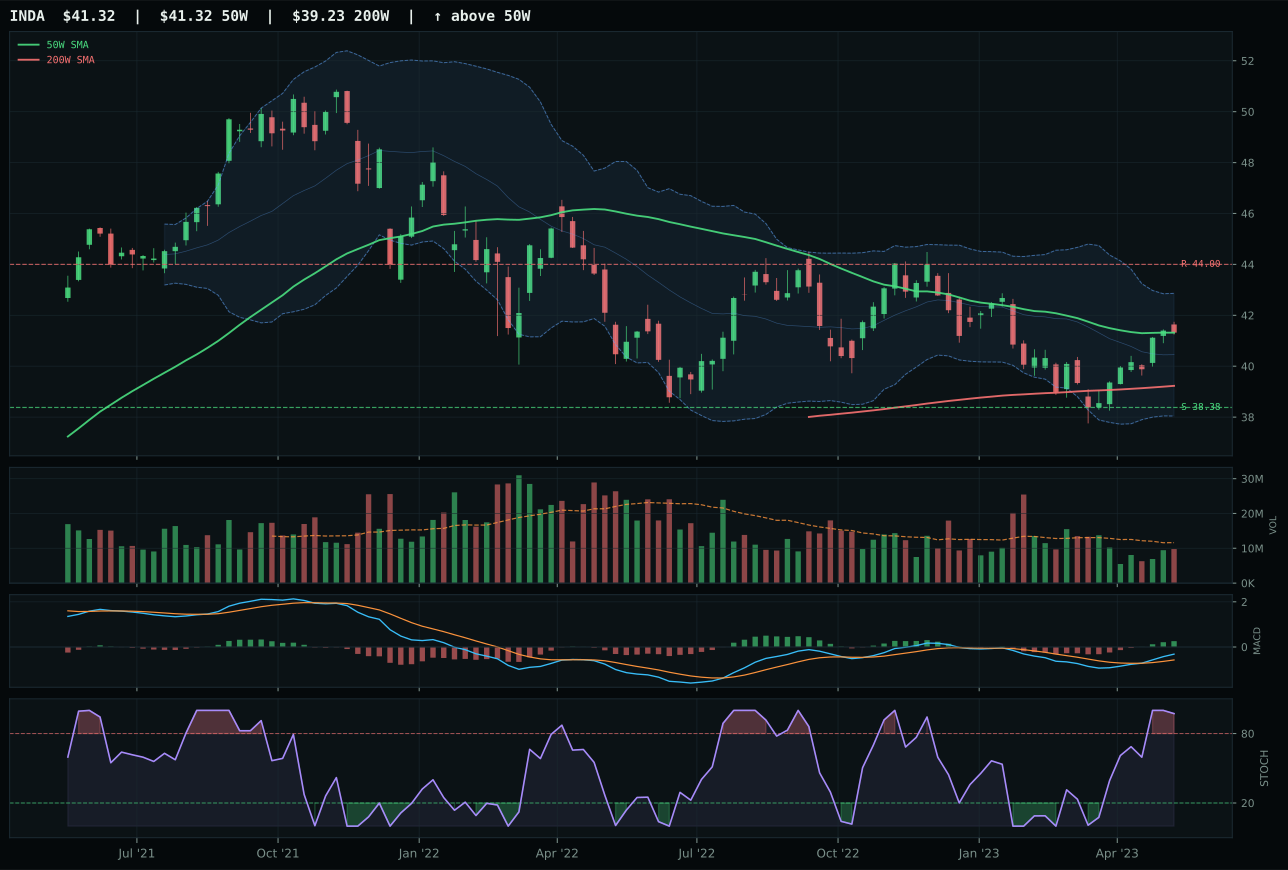
INDA has a compression near 50W profile with 1.6% 13-week relative strength versus SPY.
A failed hold above support would weaken the setup.
Actionable but governed by invalidation levels.
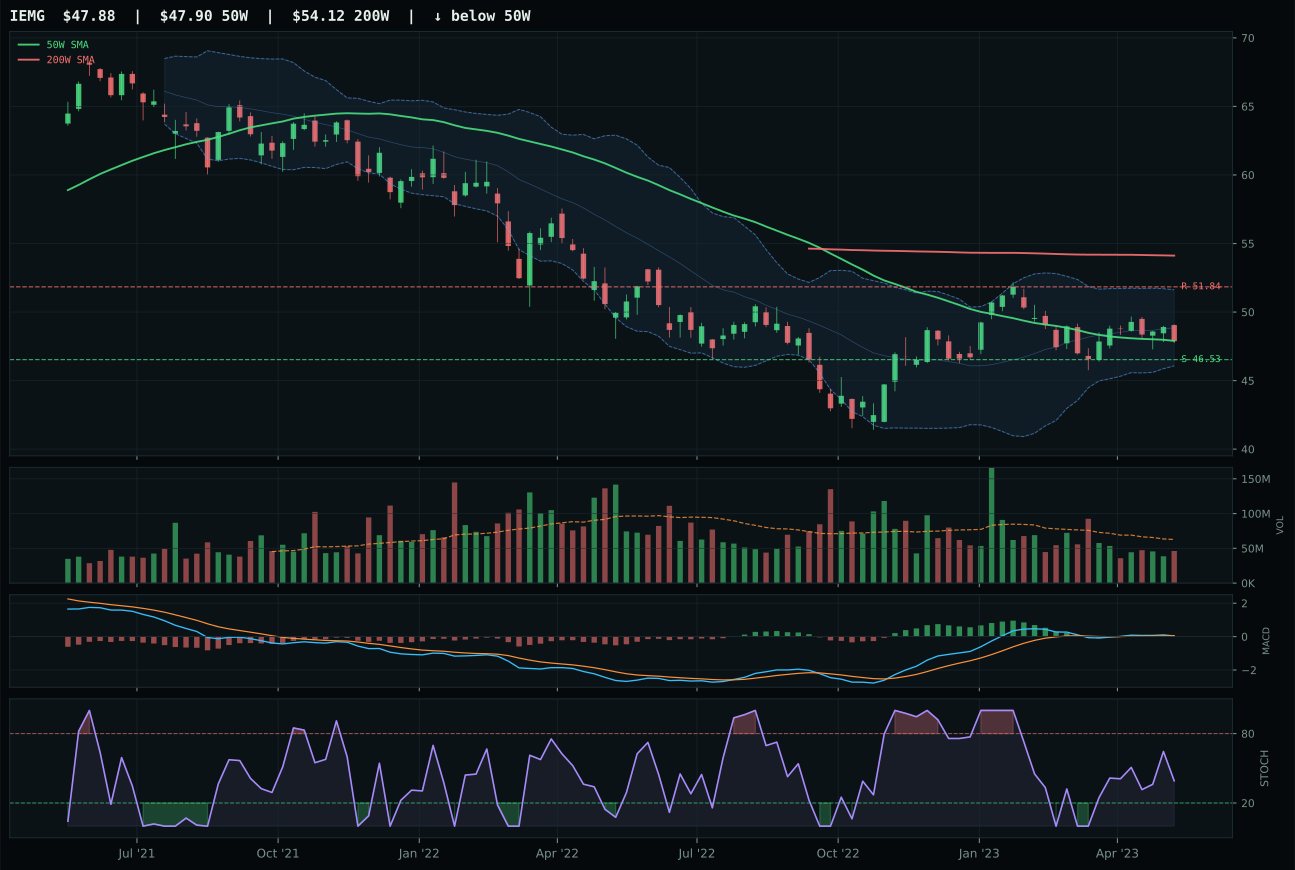
IEMG has a pullback into support profile with -4.3% 13-week relative strength versus SPY.
Extension and support failure are the main tactical risks.
Tracked, but not top-2 eligible because: structurally broken.
INDA wins Emerging Markets with a 30.8 category score anchored on flawless timing at 100.0/100—price sits exactly at the 50W moving average with compression near 88.7% and MACD bullish and improving, while stochastic RSI overbought at 0.97 signals momentum without yet showing exhaustion. Structure registers 76.0/100 from compression setup with defined support at 38.38 and resistance at 44.00, creating a balanced risk/reward at 67.3/100. INDA's technical evidence of 76.5/100 is the highest in the category, supported by trend confirmation at 82.3/100 and momentum at 72.0/100 from four-week returns of 2.9% and thirteen-week returns of 2.4%. ILF, the runner-up, owns competitive trend strength at 68.0/100 but failed because timing is weaker (90.0 vs 100.0)—ILF has already moved away from the 50W and trades in neutral structure, meaning the setup lacks the trigger-point clarity that INDA's exact-at-50W compression provides. Category-relative strength is even at 0.0%, so the decision came down purely to chart structure and timing quality.
Emerging Markets receives 5% tier-2 allocation with a 30.8 category score, despite solid technical evidence at 76.5/100 for the winner, because category-level macro fit stands at only 30.0/100—the lowest among allocated categories. Credit stress is active at -10 and liquidity stress is active at -10, creating a -20 net macro headwind that severely constrains the allocation despite INDA's perfect timing setup. INDA's compression near the 50W offers tactical opportunity if the market holds this inflection, but the macro environment is hostile: credit stress penalizes emerging-market carry and liquidity stress strangles the equity flows that drive EM rallies. The 5% allocation reflects a tactical consolidation hold rather than a conviction entry; this is portfolio maintenance, not conviction rotation. For Emerging Markets to earn top-2 consideration, either credit conditions would need to stabilize visibly (reducing the -10 headwind) or the disinflation narrative would need to reverse into real-asset inflation that favors commodity-producing EM markets. At current macro weightings, EM is a secondary position where tactical entry timing matters enormously—and INDA at the 50W offers reasonable entry mechanics if buyers defend the level. A close below support at 38.38 removes allocation entirely.
Traditional Energy — XLE
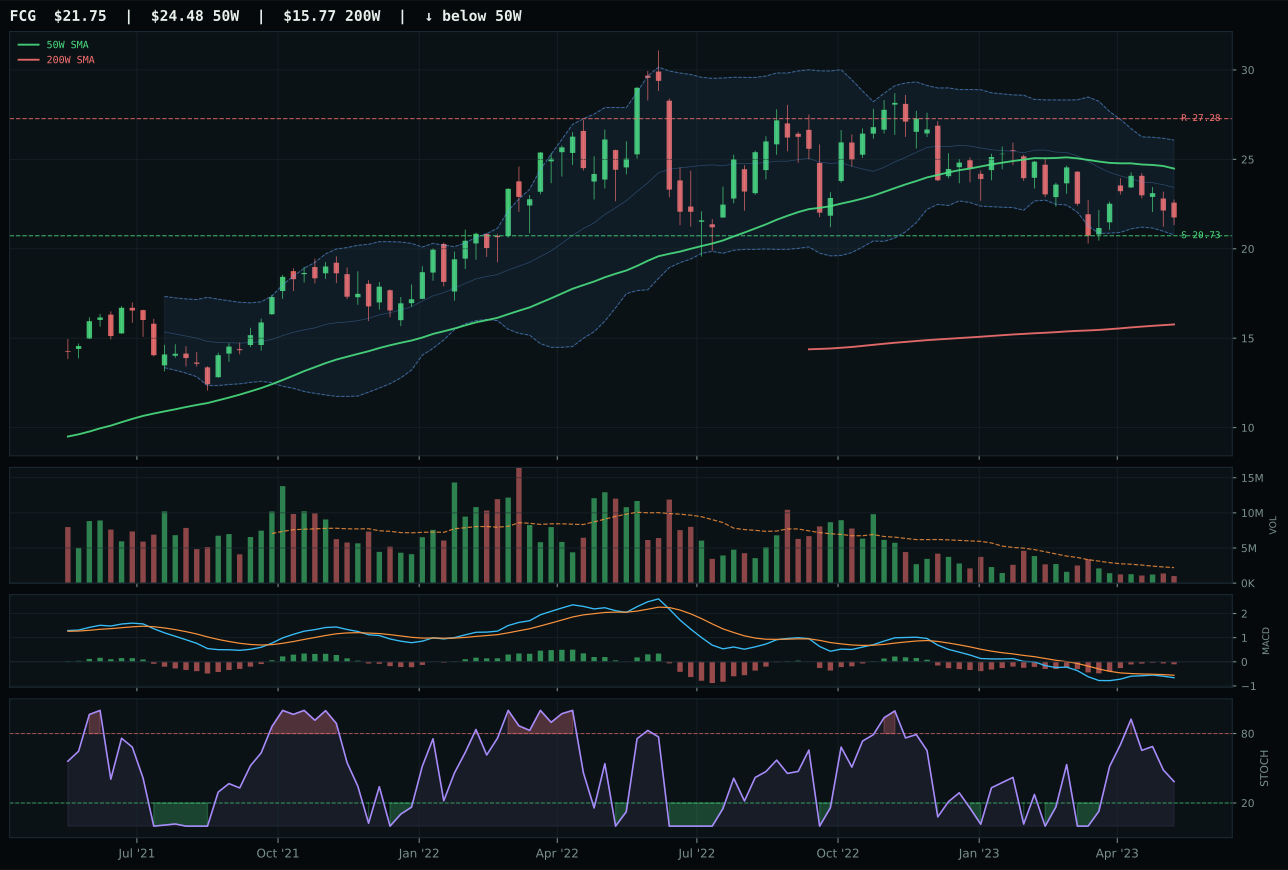
FCG has a pullback into support profile with -13.4% 13-week relative strength versus SPY.
A failed hold above support would weaken the setup.
Actionable but governed by invalidation levels.
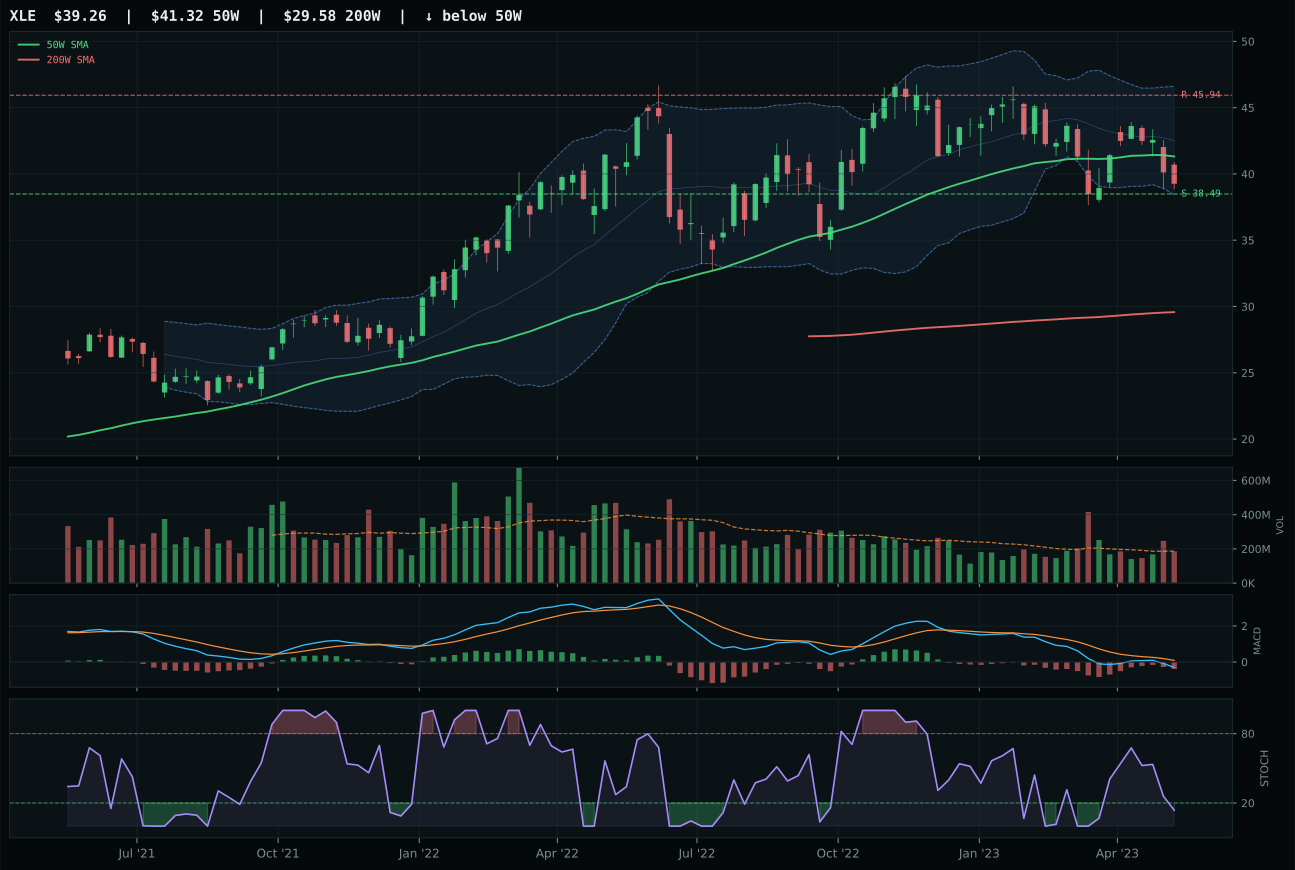
XLE has a pullback into support profile with -13.8% 13-week relative strength versus SPY.
A failed hold above support would weaken the setup.
Actionable but governed by invalidation levels.
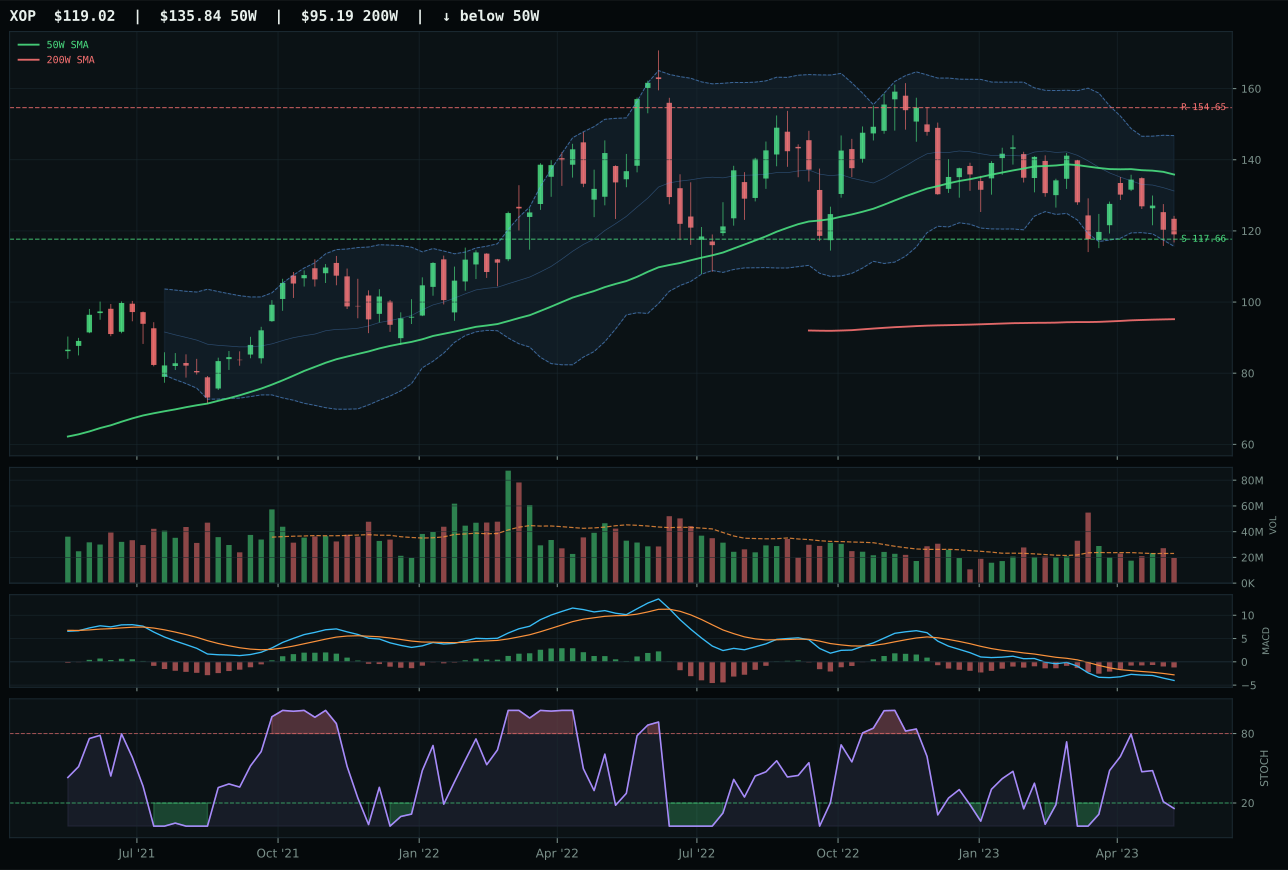
XOP has a pullback into support profile with -16.3% 13-week relative strength versus SPY.
A failed hold above support would weaken the setup.
Actionable but governed by invalidation levels.
XLE wins Traditional Energy with a final category score of 0.0, a paradoxical outcome explained by the allocator's macro regime constraint: disinflation hurts energy at -10, disinflation pressure registers -10, credit stress adds -7, and liquidity stress contributes -7, creating a net macro headwind so severe that even a perfect technical setup cannot earn allocation. XLE itself presents a credible timing setup: price sits -5.0% below the 50W in pullback structure at Fib 0.500 (middle retracement / decision zone) with perfect timing score at 100.0/100 and extraordinary risk/reward at 98.0/100—upside to resistance at -14.5% and downside to support just 2.0%. Stochastic RSI sits oversold at 0.14 with MACD bearish/weakening, creating the exact capitulation conditions where reversal typically occurs. FCG, the runner-up, owns superior MACD (bearish but improving) and less severe undershooting, yet lost the category decision due to weaker timing (65.0 vs 100.0) and risk/reward (90.0 vs 98.0). The truth is XLE's 28.7/100 technical evidence cannot overcome the -24 net macro weight (disinflation -10, pressure -10, credit -7, liquidity -7); momentum confirmation registers a dead 0.0/100 because thirteen-week returns are -13.0% and all relative strength metrics are negative.
Traditional Energy receives 5% tier-2 allocation despite a 0.0 final category score, a status that reflects the allocator's decision to include the category representative anyway because technical setup quality deserves portfolio slot even when macro conditions are deeply unfavorable. The category-level macro fit of 23.0/100 is the lowest outside the 0% cohort, driven by active disinflation pressure at -10 and the regime's core disinflation hurt of -10—a structural headwind that cannot be overcome by single-name technicals alone. XLE trades on default allocation logic: as long as support at 38.49 holds, the risk/reward merits tier-2 consideration for any investor willing to bet on mean reversion from deep underperformance. The bet fails if price closes below support, triggering immediate stop loss. For Traditional Energy to earn top-2 consideration, the macro narrative would need to reverse entirely—away from disinflation and into inflation or supply-shock scenarios—or commodity breadth positive would need to expand from its current +7 contribution into genuine broad-based real-asset sponsorship. As structured, this is a tactical short-term hold driven by exhaustion and Fibonacci levels, not a conviction position in an energy recovery.
AI — BOTZ
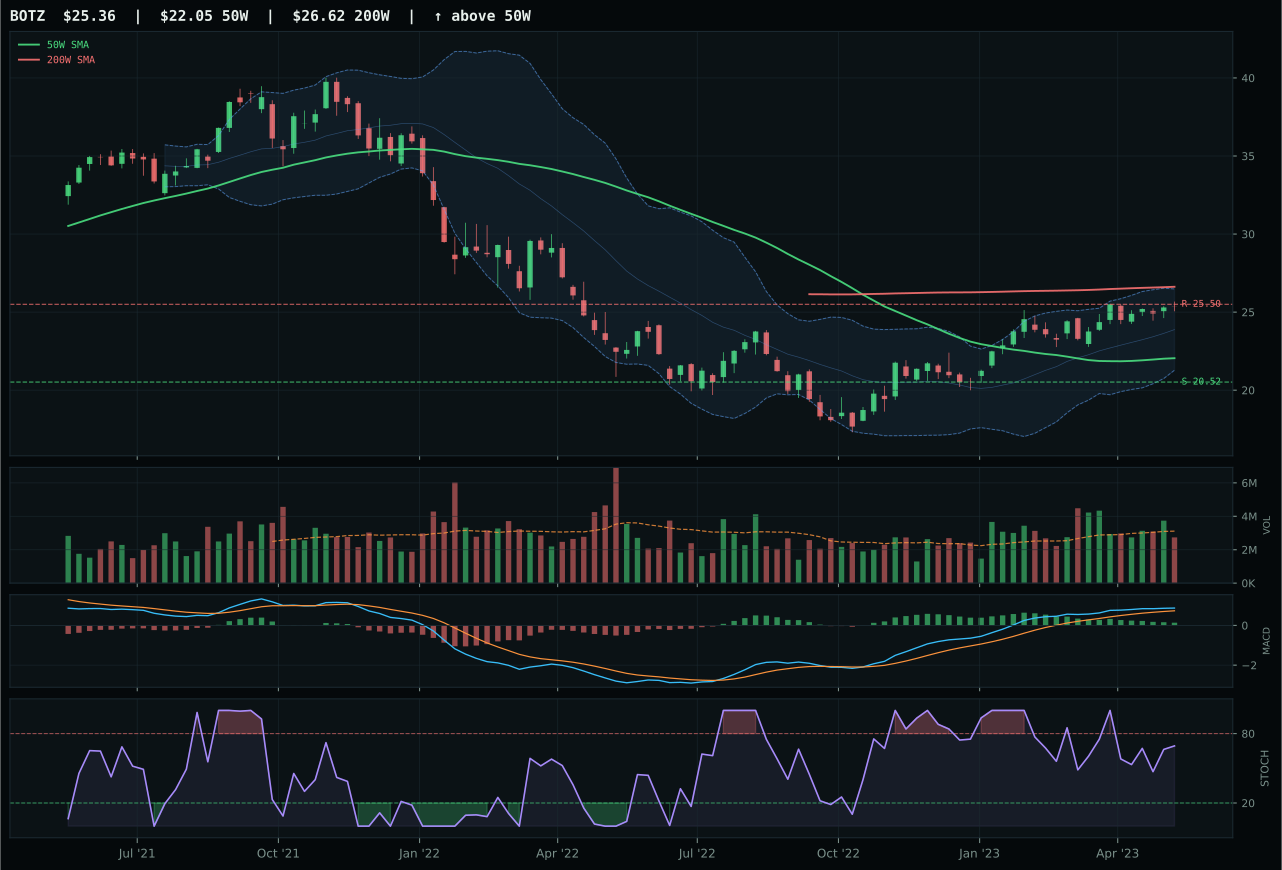
BOTZ has a vertical extension profile with 5.4% 13-week relative strength versus SPY.
A failed hold above support would weaken the setup.
Actionable but governed by invalidation levels.
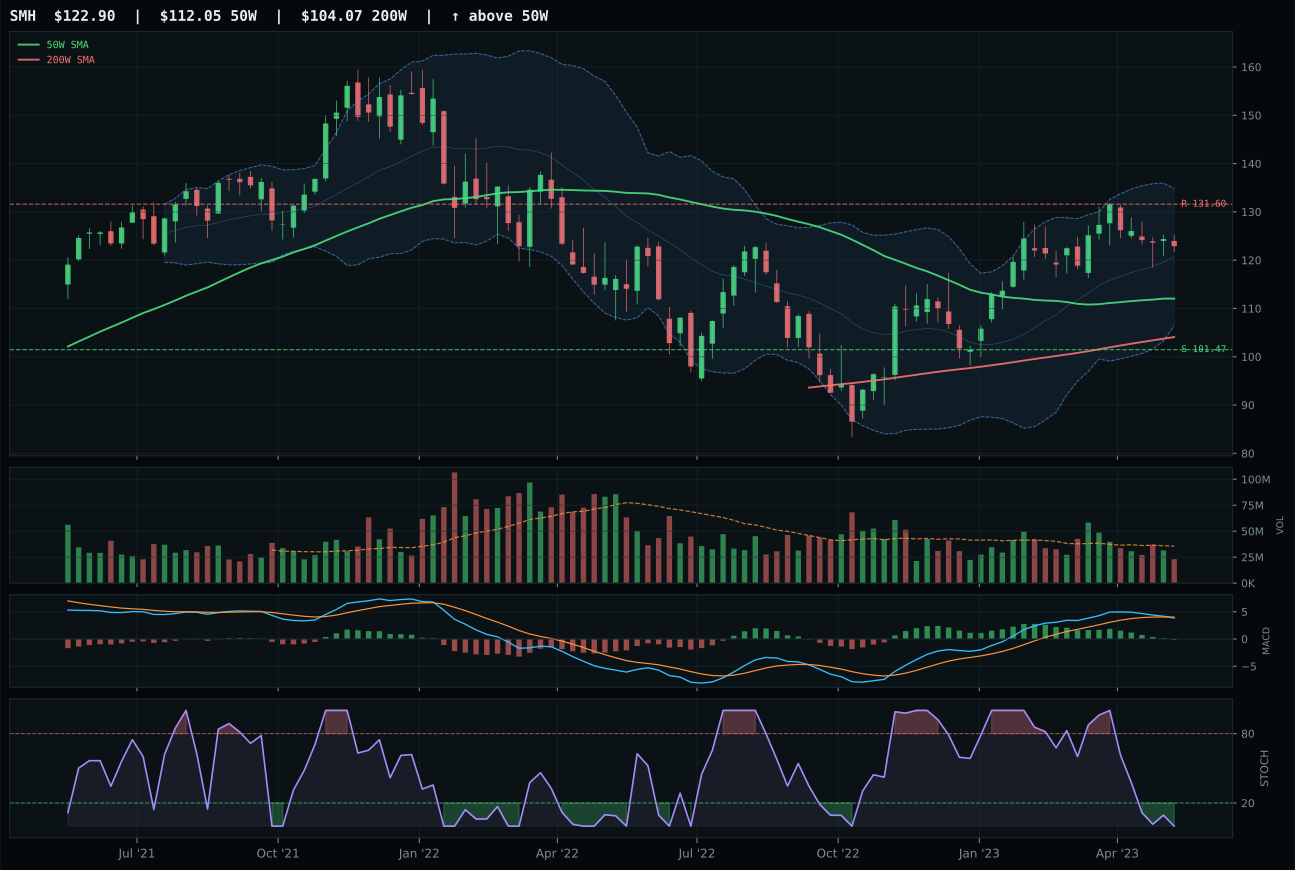
SMH has a neutral structure profile with -0.1% 13-week relative strength versus SPY.
A failed hold above support would weaken the setup.
Actionable but governed by invalidation levels.
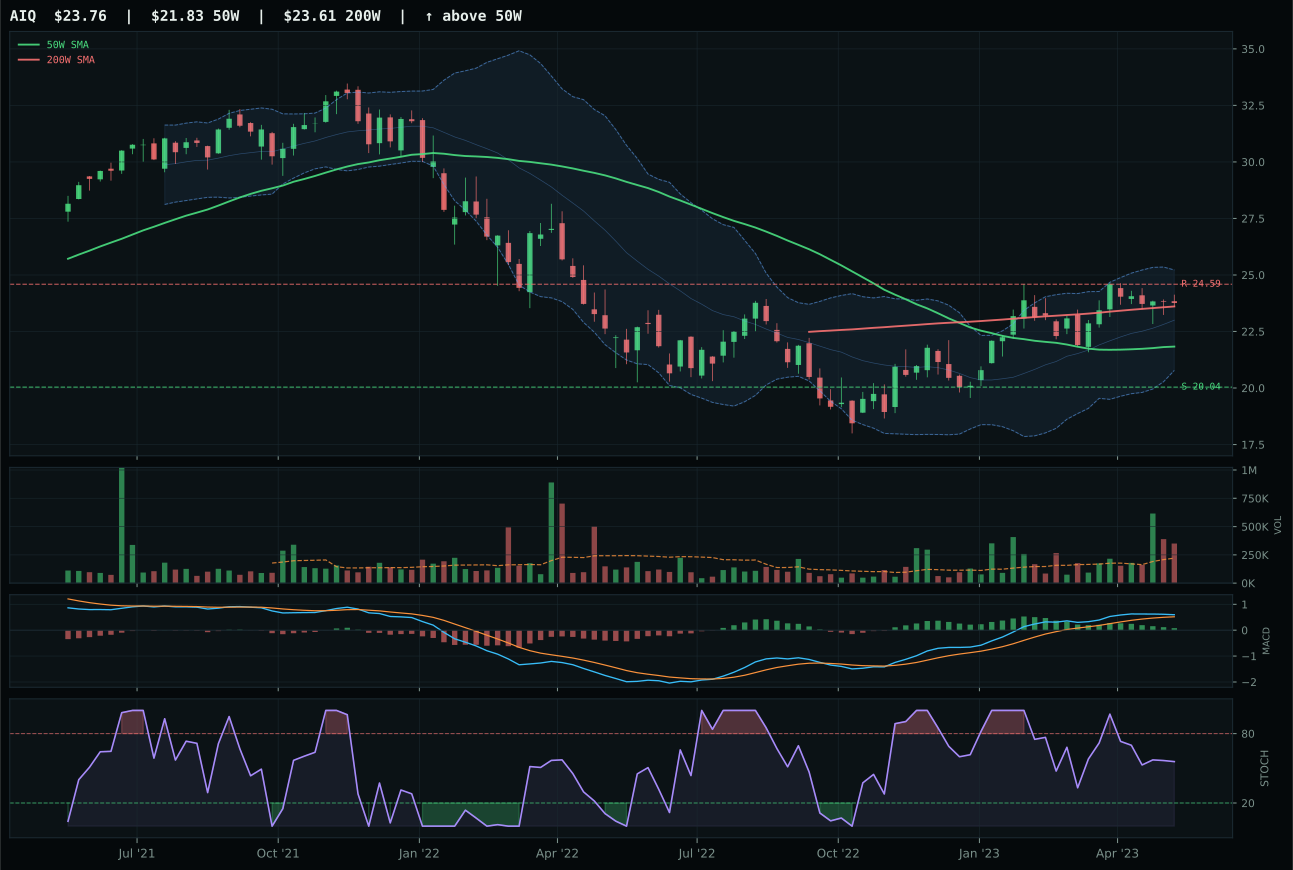
AIQ has a neutral structure profile with 1.9% 13-week relative strength versus SPY.
A failed hold above support would weaken the setup.
Tracked, but not top-2 eligible because: .
BOTZ wins the AI category with a 2.0-point margin over SMH by combining vertical extension structure with the most credible bullish MACD confirmation among peers, yet this victory masks a deeper problem: the entire category scored 26.9 out of 100, the lowest in the portfolio. BOTZ sits 15.0% above the 50-day moving average with a bullish-but-flattening MACD and neutral volume at 0.88x, positioning it as an extended runner rather than a coiled spring ready to break out. Its 6.2% thirteen-week return and 5.4% relative strength versus SPY are respectable on surface, but the momentum confirmation score of 80.4 reflects past strength, not current sponsorship. SMH lost ground despite maintaining a stronger trend composite because its MACD deteriorated to bearish/weakening and stochastic RSI fell into oversold territory at precisely the wrong moment—when buyers could have stepped in, the chart instead signaled distribution. Neither BOTZ's rising mid-zone stochastic nor its neutral volume participation justifies conviction at these levels; the category's ranking failure stems from liquidity stress at -12 and the broad absence of volume-price confirmation that would signal accumulation rather than bounce.
AI receives 0% allocation this week, ranked 9th or 10th outside the eligible set entirely. The 26.9 category score resulted from technical evidence at only 62.8/100 for the winner and a macro fit of 35.0/100 that could not overcome structural headwinds: disinflation hurts cyclical AI capex spending while active liquidity stress at -12 and credit stress at -8 choke the equity funding flows that drive semiconductor and robotics demand. BOTZ, despite winning the category, carries only 2.5% thirteen-week momentum strength and must defend support at 20.52 to remain eligible—a level only 23.6% below current price in an environment where thin participation and MACD flattening suggest the move lacks institutional follow-through. For AI to earn even a tier-2 slot in coming weeks, the category would need either a visible capitulation in price (resetting timing and risk/reward) or a substantive macro pivot toward real-asset sponsorship and commodity breadth that would pull capital away from the defensive playbook currently dominating the allocation strategy.
Agriculture & Livestock — MOO
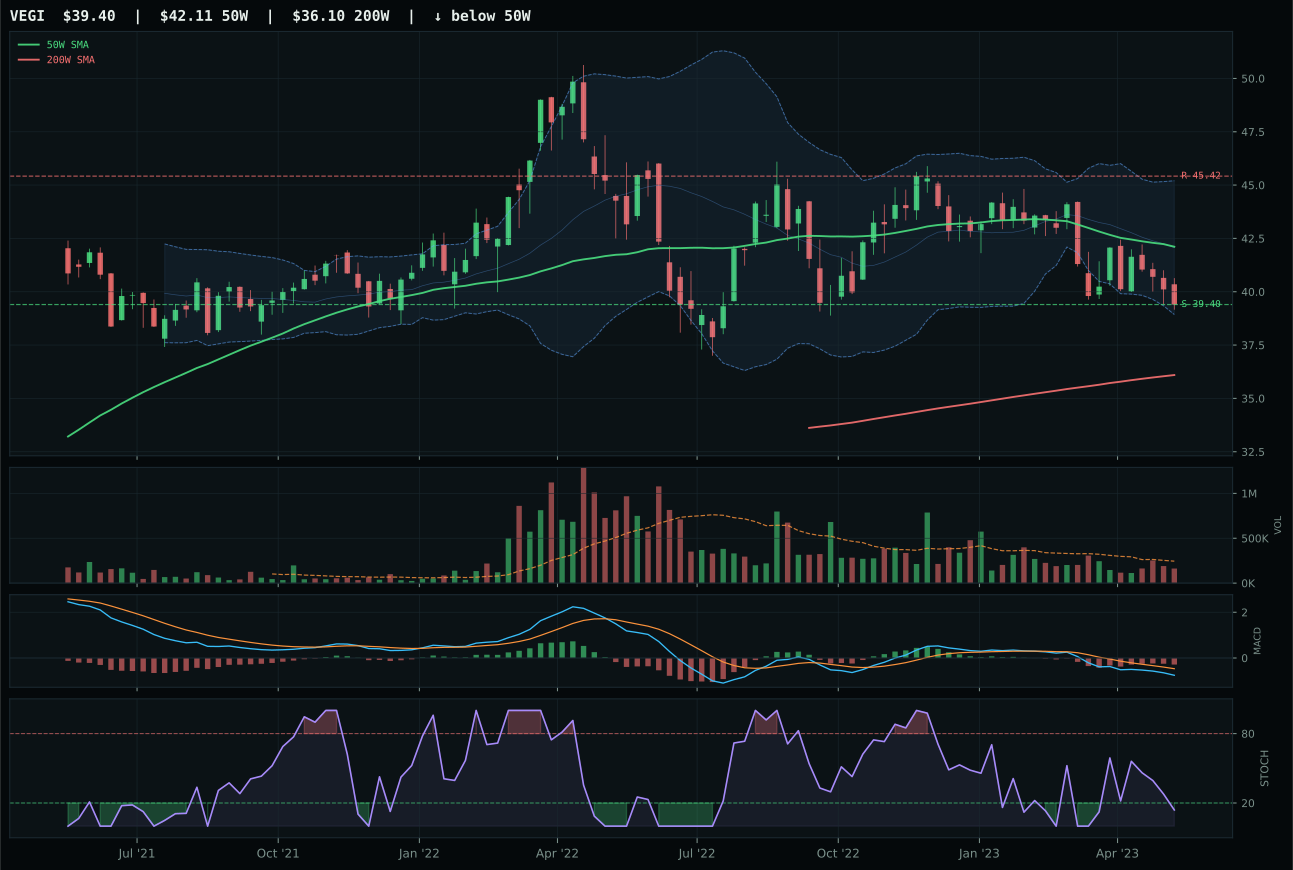
VEGI has a pullback into support profile with -10.4% 13-week relative strength versus SPY.
A failed hold above support would weaken the setup.
Actionable but governed by invalidation levels.
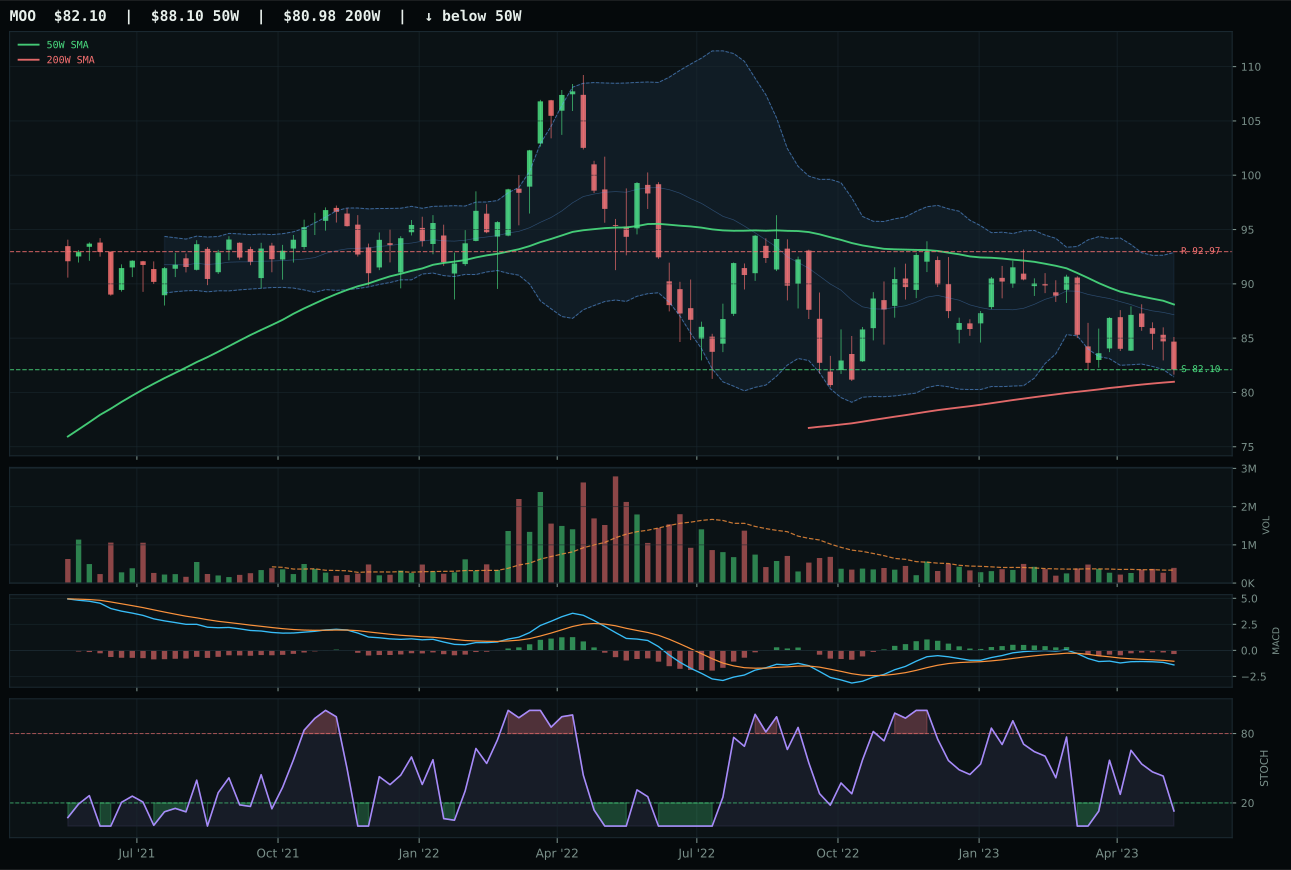
MOO has a pullback into support profile with -9.7% 13-week relative strength versus SPY.
A failed hold above support would weaken the setup.
Actionable but governed by invalidation levels.
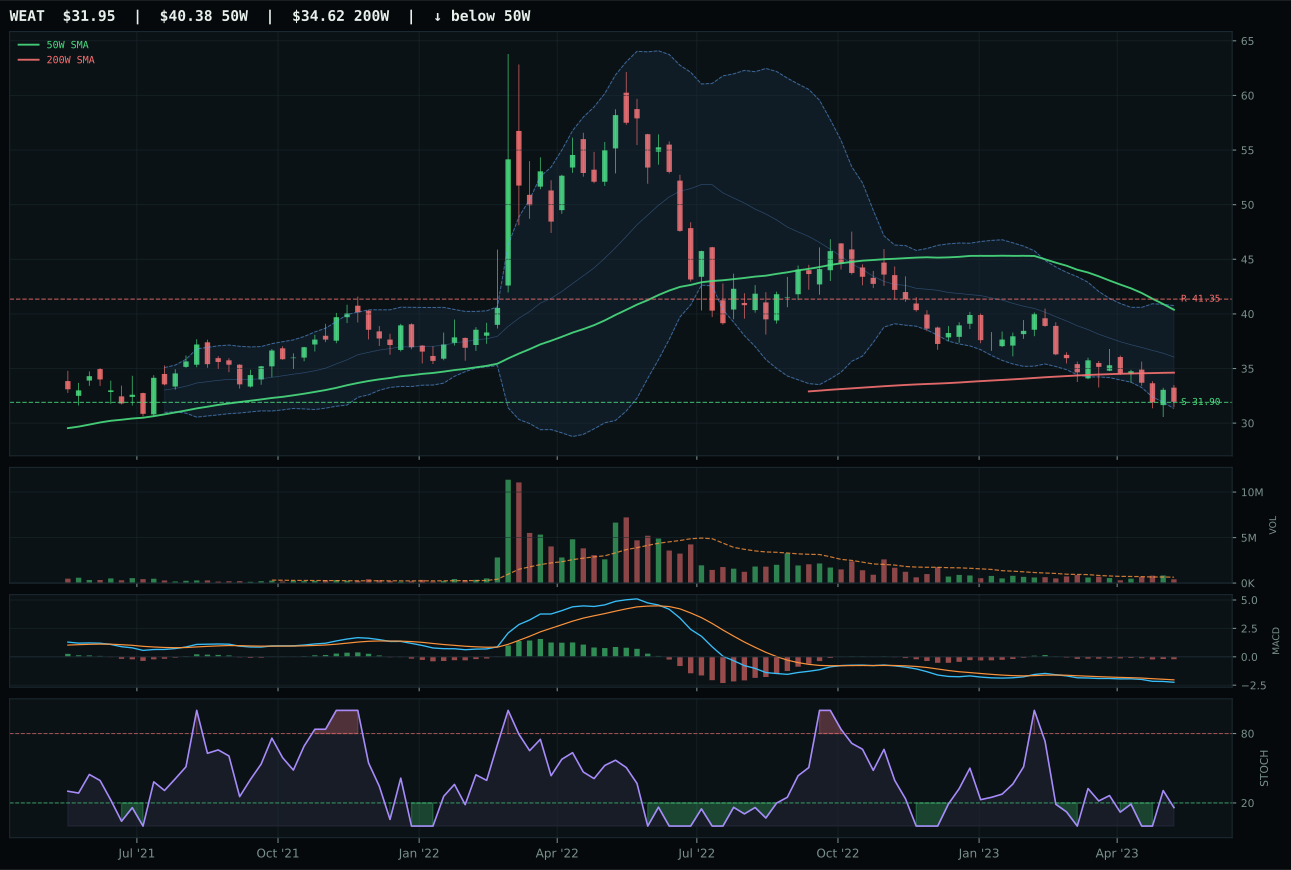
WEAT has a pullback into support profile with -21.0% 13-week relative strength versus SPY.
A failed hold above support would weaken the setup.
Actionable but governed by invalidation levels.
MOO wins Agriculture despite being the technically weakest link in its own three-ETF basket, scoring only 24.9/100 on technical evidence compared to VEGI's stronger 44.1/100. The victory came down to pure structural advantage: MOO pulled directly into support at 82.10 while maintaining -6.8% distance to the 50W, creating the ideal reset setup where oversold stochastic RSI at 0.13 pairs with above-average volume at 1.17x, signaling potential capitulation accumulation rather than institutional abandonment. VEGI, by contrast, owns a cleaner structure at 64.7/100 and superior MACD (bearish but improving versus MOO's bearish/weakening), yet it trades with thin volume participation and no relative strength advantage within the category—zero category-relative strength versus MOO's 0.7% edge. The thirteen-week returns are deeply negative across the board: MOO at -8.8%, VEGI at -9.6%, WEAT at -20.1%. MOO's win is a Pyrrhic victory; the timing score of 80.0/100 reflects how far the sector has already fallen into the Fib 0.786 repair zone near 84.72, not any conviction that farmers are rallying.
Agriculture & Livestock receives 0% allocation, ranking 9th or 10th in the portfolio entirely due to a 19.4 category score poisoned by macro headwinds that overwhelm any technical edge MOO might offer. Real asset sponsorship is active at +8 and commodity breadth positive at +5, providing modest support, but disinflation pressure of -8 and direct disinflation hurt of -6 create a net macro fit of just 45.0/100—insufficient to compete when liquidity stress is active at -4 and the sector remains structurally broken. MOO's risk/reward at 71.3/100 is misleading because it assumes support holds; a break below 82.10 creates a cascade toward the 200W and invalidates the entire setup. For Agriculture to earn a tier-2 slot, either commodity breadth would need to accelerate meaningfully into broad inflationary pressure, or disinflation would need to reverse into reflation—neither likely under the current regime. The category sits in a value trap: cheap on absolute metrics but uninhabitable given the macro narrative around food demand destruction and input cost deflation.