
2023-05-05
Informational purposes only. The content in this report, including allocations, analysis, and commentary, is provided solely for informational and educational purposes. It does not constitute financial advice, investment advice, trading advice, or any other type of advice. Past performance does not guarantee future results. Always conduct your own research and consult a qualified financial professional before making investment decisions.
Weekly Allocation
| Ticker | Category | Weight | Role |
|---|---|---|---|
| FBTC | 50% | Overlay | |
| GLD | Precious Metals | 10% | Top-2 (10%) |
| PAVE | Utilities & Infrastructure | 10% | Top-2 (10%) |
| COPX | Industrial Metals | 5% | Tier-2 (5%) |
| XLK | Technology | 5% | Tier-2 (5%) |
| XAR | Defense & Aerospace | 5% | Tier-2 (5%) |
| URA | Nuclear Energy | 5% | Tier-2 (5%) |
| BOTZ | AI | 5% | Tier-2 (5%) |
| INDA | Emerging Markets | 5% | Tier-2 (5%) |
Trade Instructions — Monday Open
Sell the tranche from 2023-04-07 (completing its 4-week hold). Buy the new tranche. Instructions show net portfolio changes — same-asset positions cancel, weight changes show the delta.
| Action | Ticker | Instruction |
|---|---|---|
| SELL | IGV | Sell 33% of IGV position (reduce 7.50% → 5.00%) |
| SELL | SMH | Sell entire SMH position (1.25% of portfolio) |
| SELL | XLU | Sell 50% of XLU position (reduce 2.50% → 1.25%) |
| SELL | IEMG | Sell entire IEMG position (1.25% of portfolio) |
| SELL | ITA | Sell 25% of ITA position (reduce 5.00% → 3.75%) |
| BUY | BOTZ | Buy BOTZ — 16.67% of freed cash (adds 1.25% to portfolio) |
| BUY | XLK | Buy XLK — 16.67% of freed cash (adds 1.25% to portfolio) |
| BUY | PAVE | Buy PAVE — 33.33% of freed cash (adds 2.50% to portfolio) |
| BUY | XAR | Buy XAR — 16.67% of freed cash (adds 1.25% to portfolio) |
| BUY | INDA | Buy INDA — 16.67% of freed cash (adds 1.25% to portfolio) |
Current Portfolio After Trade
Combined holdings across all 4 active tranches. Each tranche is 25% of the portfolio.
| Ticker | % of Portfolio | Weight Bar |
|---|---|---|
| FBTC | 50.00% | |
| GLD | 10.00% | |
| IGV | 5.00% | |
| COPX | 5.00% | |
| URA | 5.00% | |
| BOTZ | 5.00% | |
| ITA | 3.75% | |
| IGF | 3.75% | |
| VEGI | 2.50% | |
| XLK | 2.50% | |
| PAVE | 2.50% | |
| XLU | 1.25% | |
| ILF | 1.25% | |
| XAR | 1.25% | |
| INDA | 1.25% |
Macro Regime — Disinflation
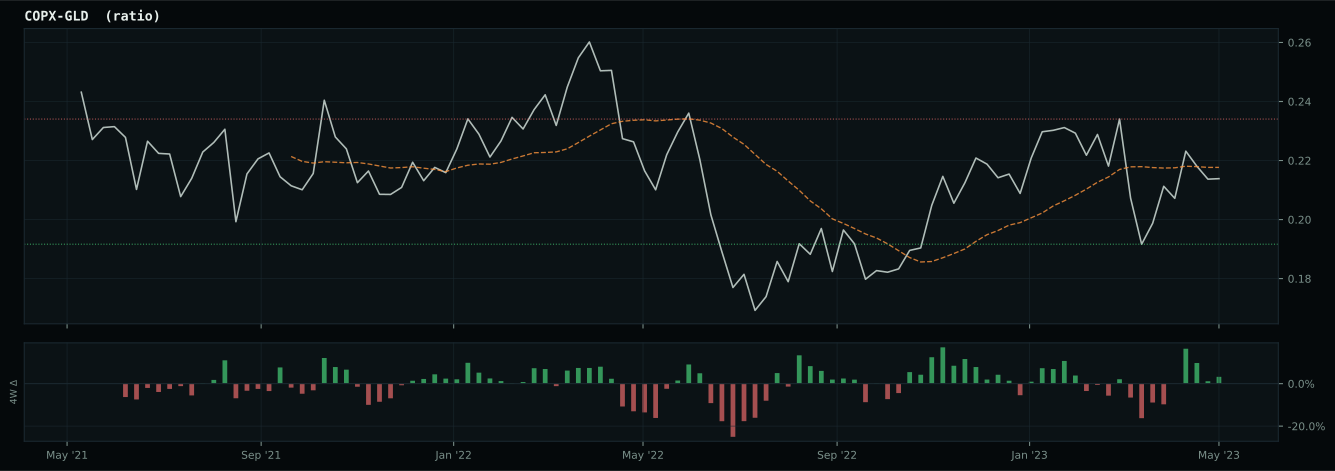
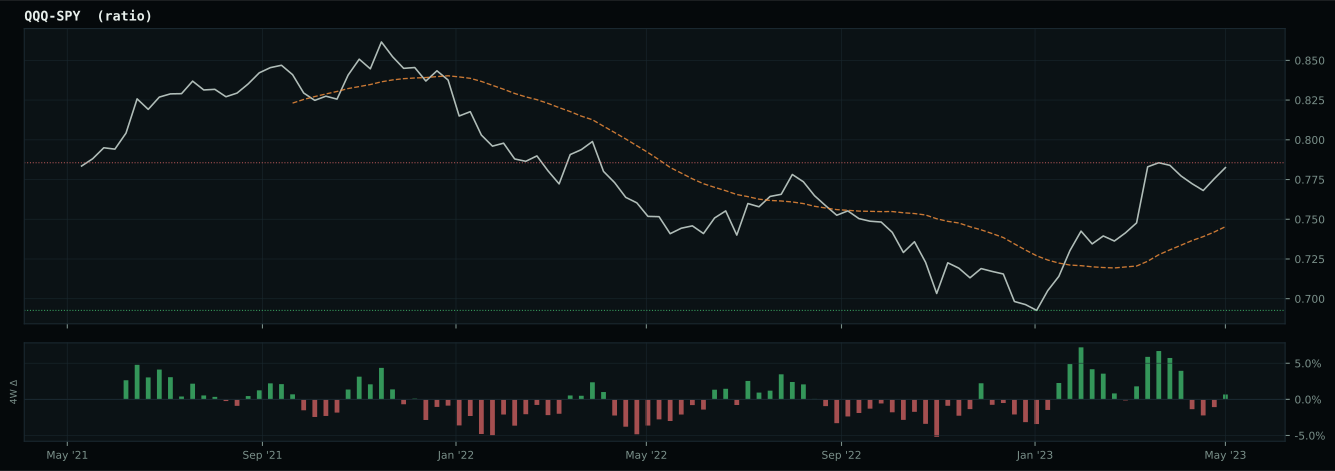
Macro Evidence Charts
Market-implied signals behind the macro regime scores. Each ratio compares two assets; the direction and slope of the ratio is what the macro engine reads.
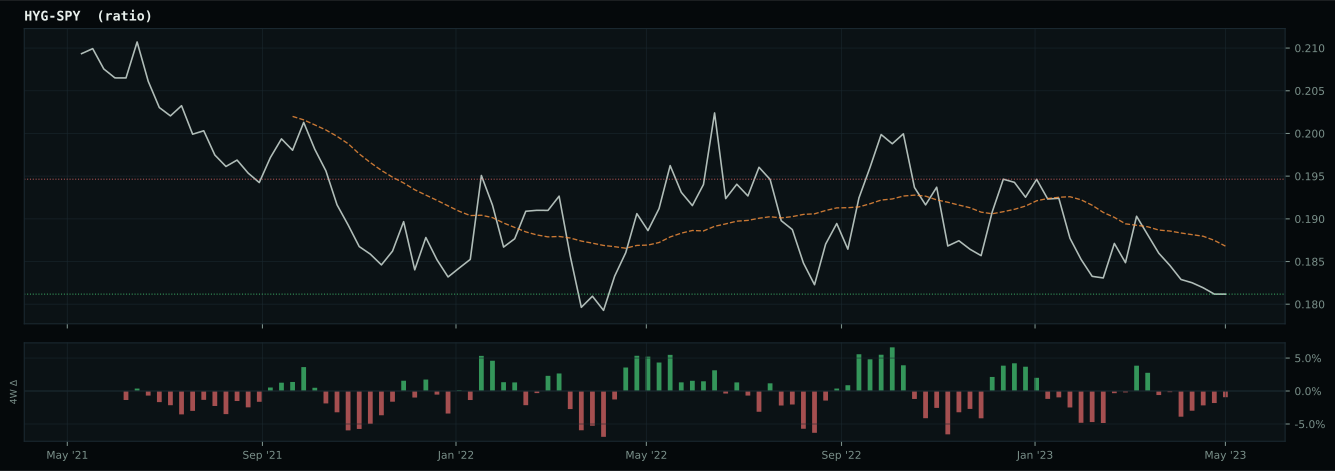
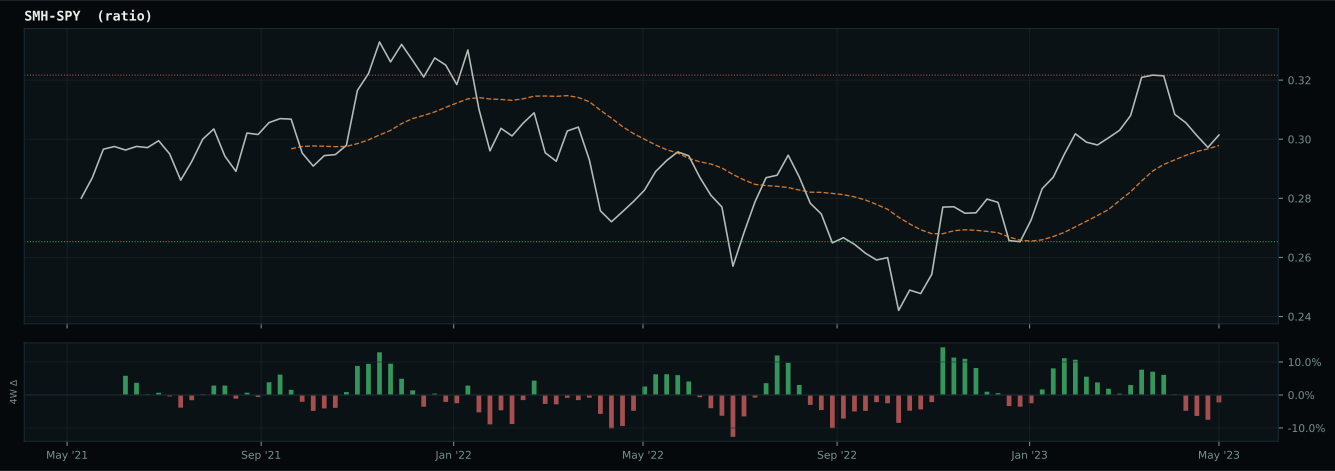
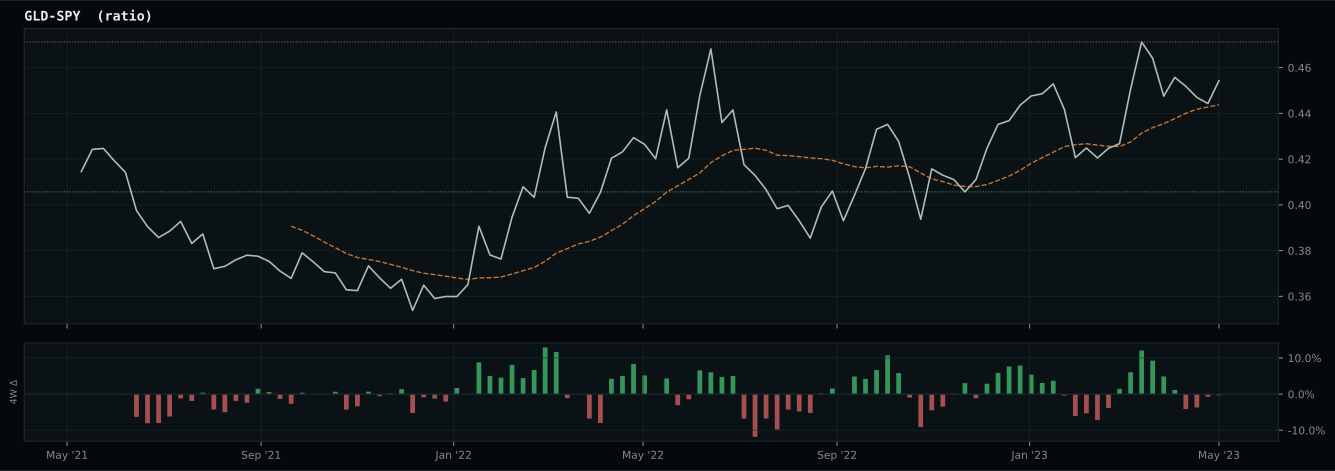
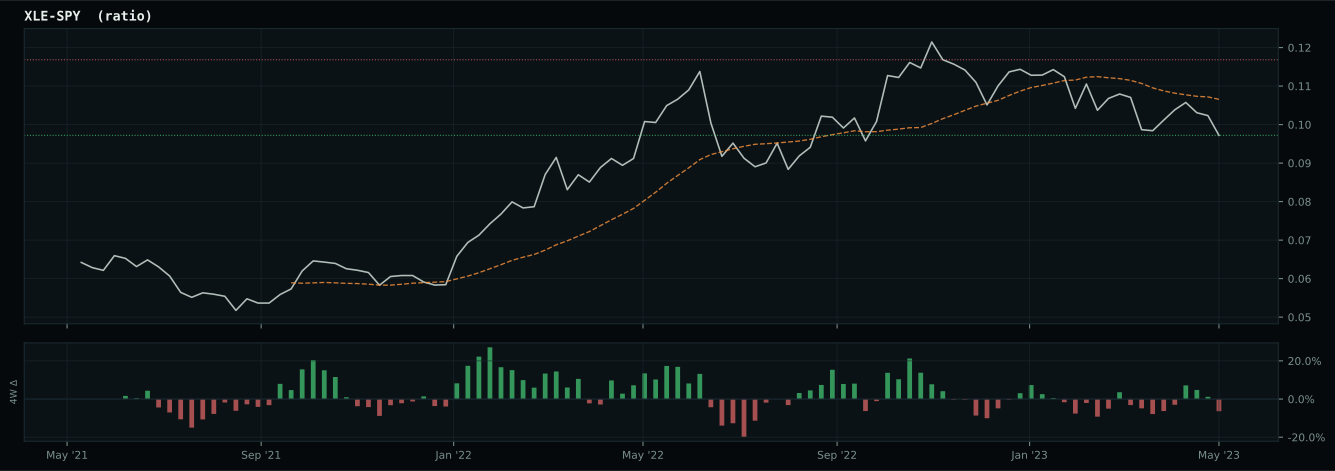
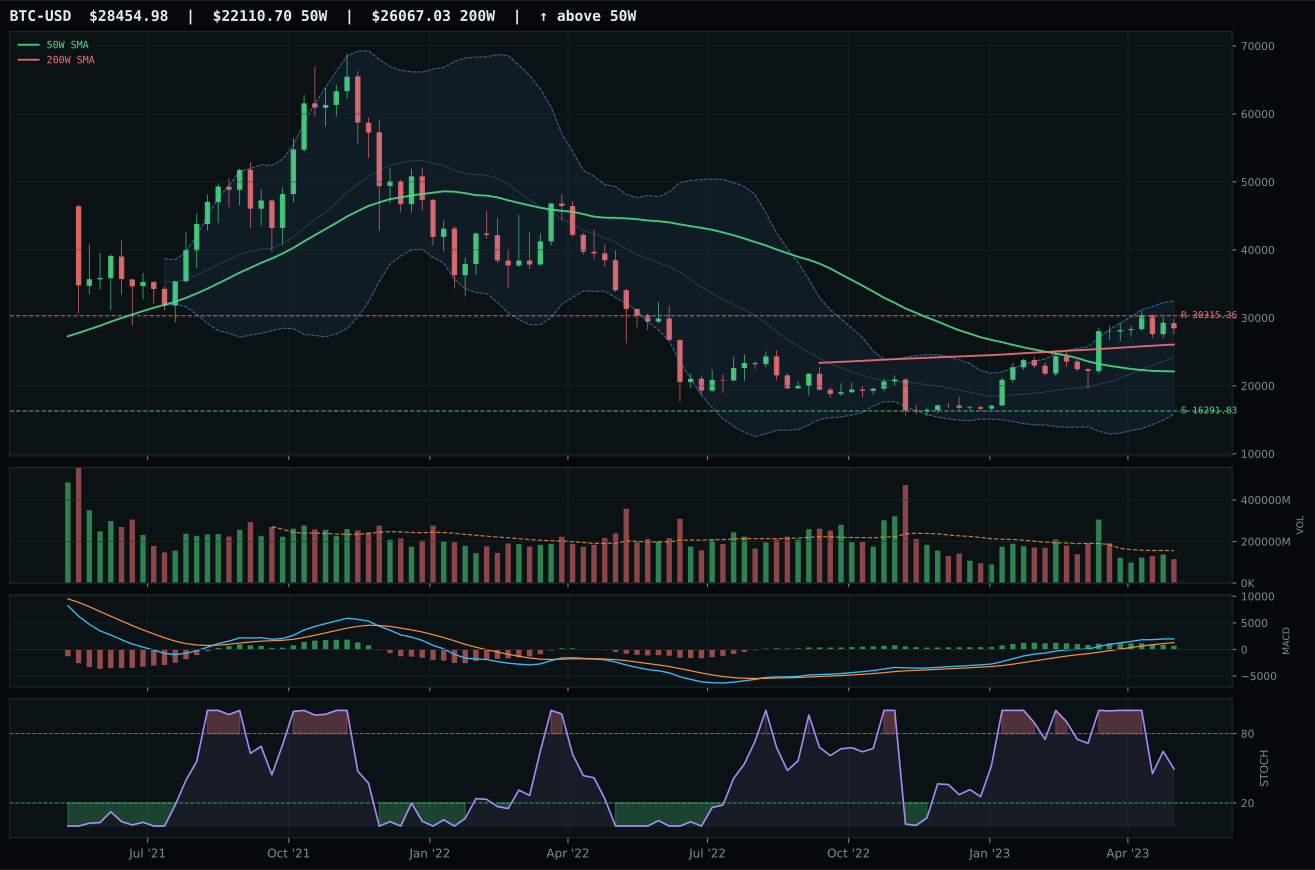
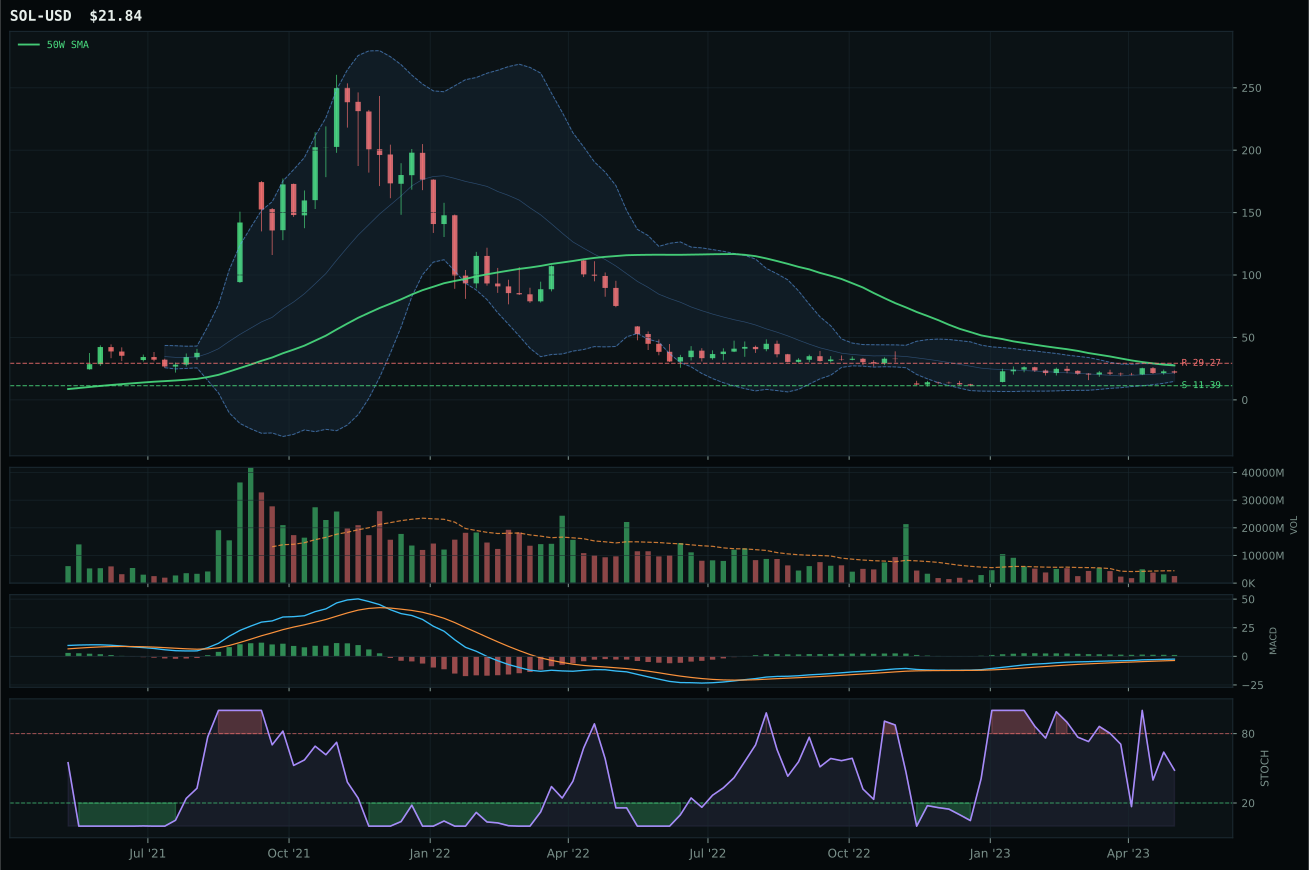
Crypto Regime — ValueBTC
post-touch structure is too wide to count as a range; max/min close ratio is 1.86
TrendBTC not confirmed
one or more available conditions failed
Category Rankings
| Rank | Category | Winner | Score | Alloc | 4W Ret | Peers (4W) |
|---|---|---|---|---|---|---|
| 1 | Precious Metals | GLD | 84.0 | 20% | -3.74% | SLV -8.4% · GDX -11.9% |
| 2 | Utilities & Infrastructure | PAVE | 66.3 | 20% | +2.28% | XLU -5.4% · IGF -4.0% |
| 3 | Industrial Metals | COPX | 51.5 | 10% | -8.40% | PICK -3.1% · REMX +2.0% |
| 4 | Technology | XLK | 47.1 | 10% | +10.50% | IGV +12.5% · CIBR +10.0% |
| 5 | Defense & Aerospace | XAR | 41.2 | 10% | +1.75% | ITA +0.8% · ROKT +2.5% |
| 6 | Nuclear Energy | URA | 39.3 | 10% | +5.64% | URNM +5.3% · NLR +0.6% |
| 7 | AI | BOTZ | 32.7 | 10% | +11.82% | SMH +17.2% · AIQ +12.0% |
| 8 | Emerging Markets | INDA | 29.0 | 10% | +1.15% | ILF +3.7% · IEMG +0.0% |
| 9 | Agriculture & Livestock | VEGI | 25.5 | 0% | -4.86% | MOO -5.7% · WEAT -5.3% |
| 10 | Traditional Energy | XLE | 6.6 | 0% | -0.41% | FCG +1.6% · XOP +2.3% |
Precious Metals — GLD
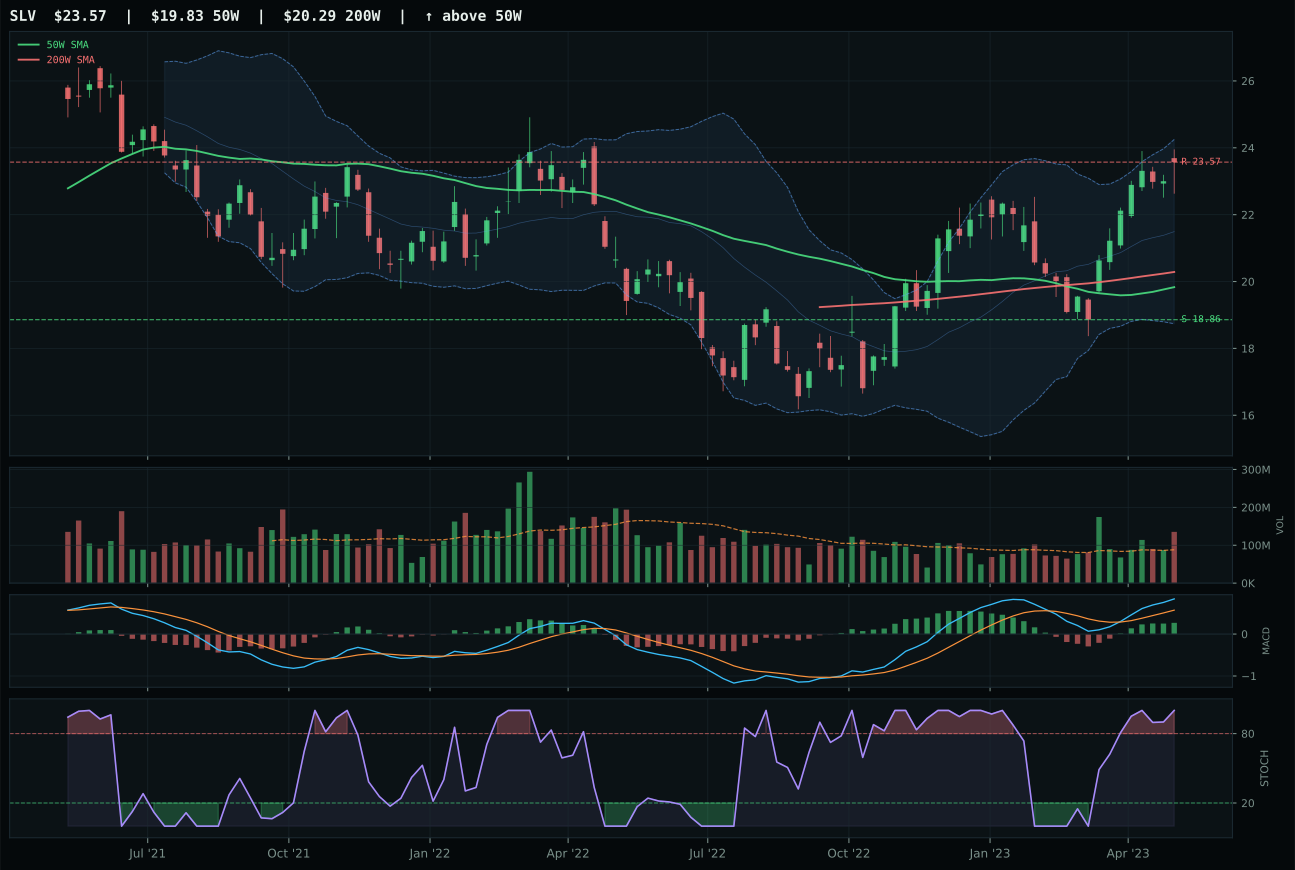
SLV has a vertical extension profile with 14.5% 13-week relative strength versus SPY.
A failed hold above support would weaken the setup.
Actionable but governed by invalidation levels.
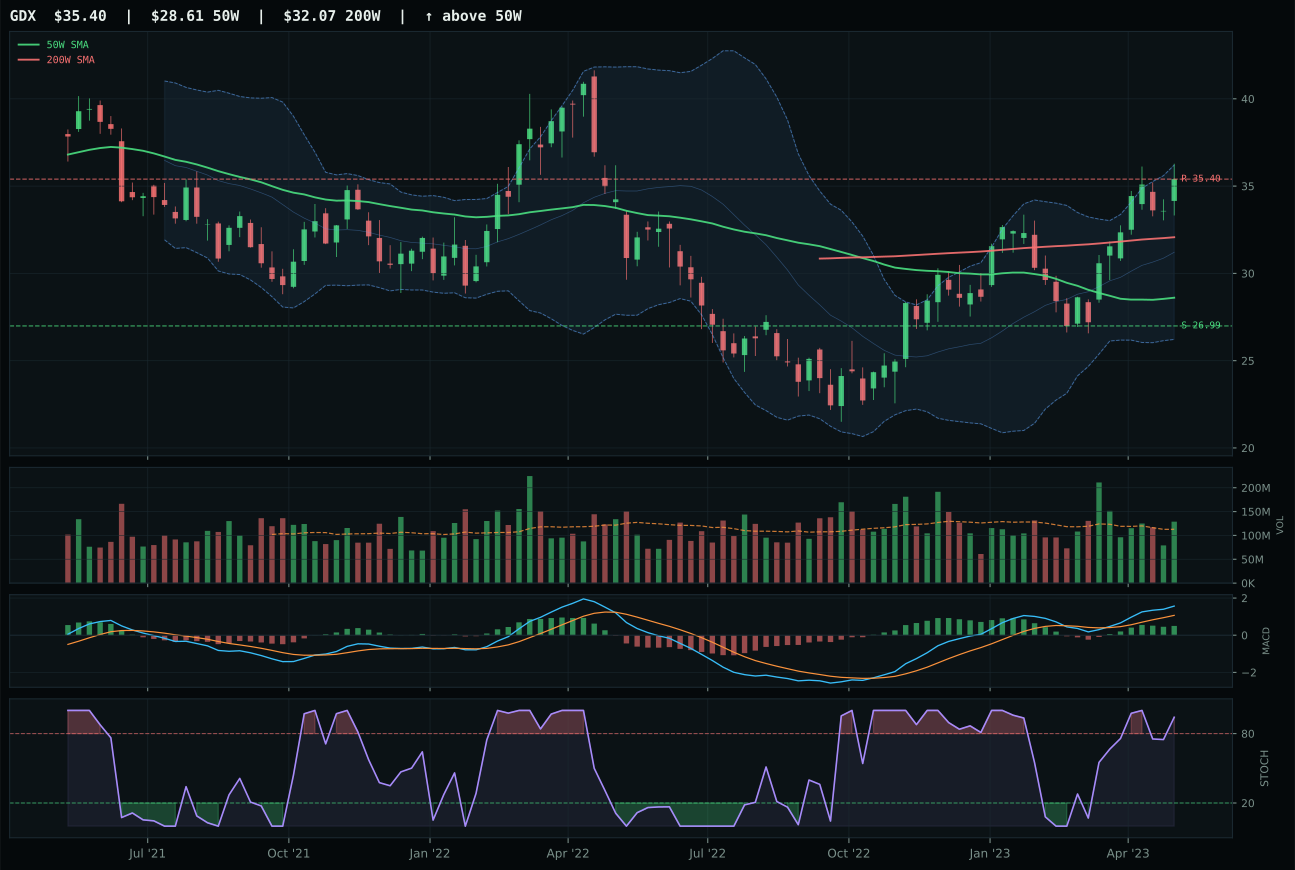
GDX has a vertical extension profile with 16.7% 13-week relative strength versus SPY.
A failed hold above support would weaken the setup.
Actionable but governed by invalidation levels.
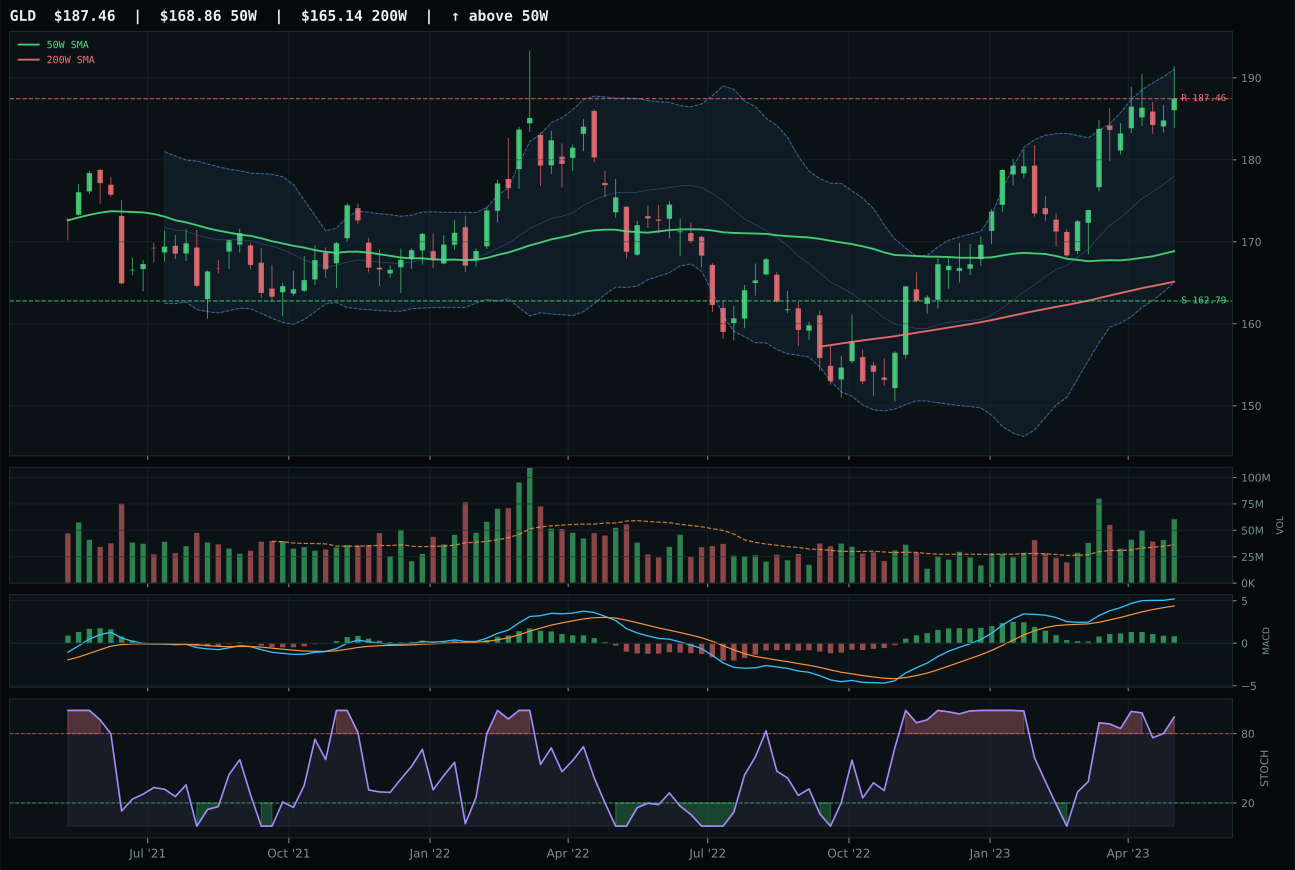
GLD has a neutral structure profile with 8.0% 13-week relative strength versus SPY.
A failed hold above support would weaken the setup.
Actionable but governed by invalidation levels.
GLD wins the Precious Metals category with an 84.0 final score and claims a top-2 overweight at 10% allocation because it combines perfect trend confirmation (100.0 trend score) with a 78.0 macro/narrative fit that is the strongest in the entire portfolio. Price is above both the 50W and 200W with a 0.2% slope continuation, and the 8.0% relative strength versus SPY confirms that new money is entering, not just bouncing. The 1.66x accumulation-level volume participation—the highest confirmation in the category—validates that the MACD bullish setup is real institutional buying. SLV trails by 2.1 points despite superior technical evidence (96.4) because it is more extended from the 50W at 18.8% versus GLD's 11.0%, and its stochastic RSI overbought momentum versus GLD's overbought rolling-over suggests GLD has more runway ahead before distribution begins. GLD's 69.0 momentum confirmation and 78.8 persistence reflect a setup where the 8.1% 13W return is steady accumulation, not a spike on thin participation.
Precious Metals earned a top-2 overweight at 10% because the 84.0 final score ranks second-highest among all 10 categories this week, claiming one of the dual 10% slots. The 85.0 category-level macro fit is the strongest in the portfolio, driven by monetary hedge bid (+14), defensive rotation (+7), disinflation pressure (+6), and disinflation help (+8)—a rare convergence where technical strength and macro regime are perfectly aligned. In a disinflation environment with credit stress and liquidity stress active, gold is the natural bid because it is both a monetary hedge and a safe-haven asset. GLD's 69.5 technical evidence combined with the macro tailwind creates conviction-level allocation. The chart shows a setup that is extended but not overbought in a way that suggests distribution; the volume is accumulative; and the regime backdrop is explicitly favorable. At 10% of the 50% overlay-adjusted portfolio, this is an overweight bet that metals will continue higher as real rates compress further into disinflation.
Utilities & Infrastructure — PAVE
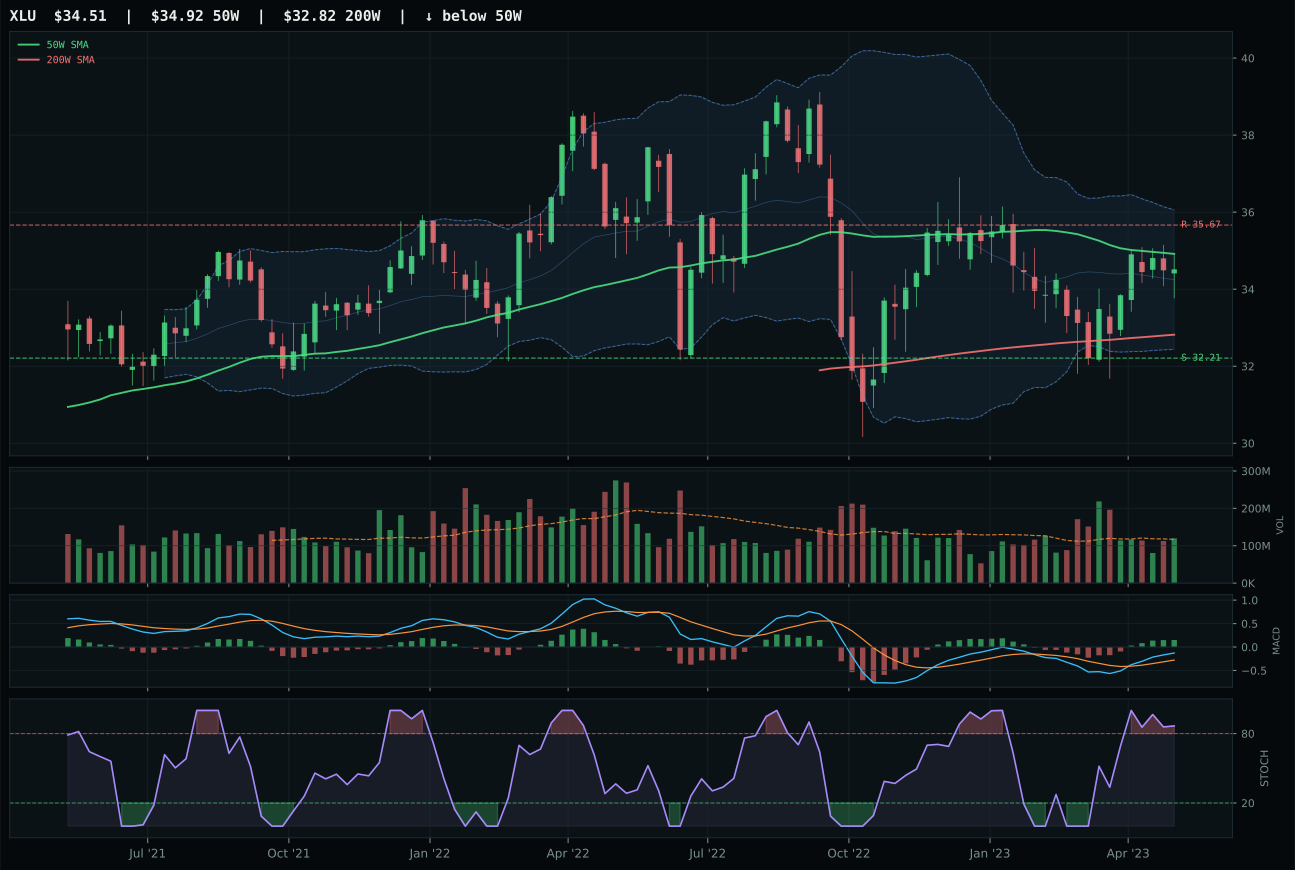
XLU has a compression near 50W profile with 1.6% 13-week relative strength versus SPY.
A failed hold above support would weaken the setup.
Actionable but governed by invalidation levels.
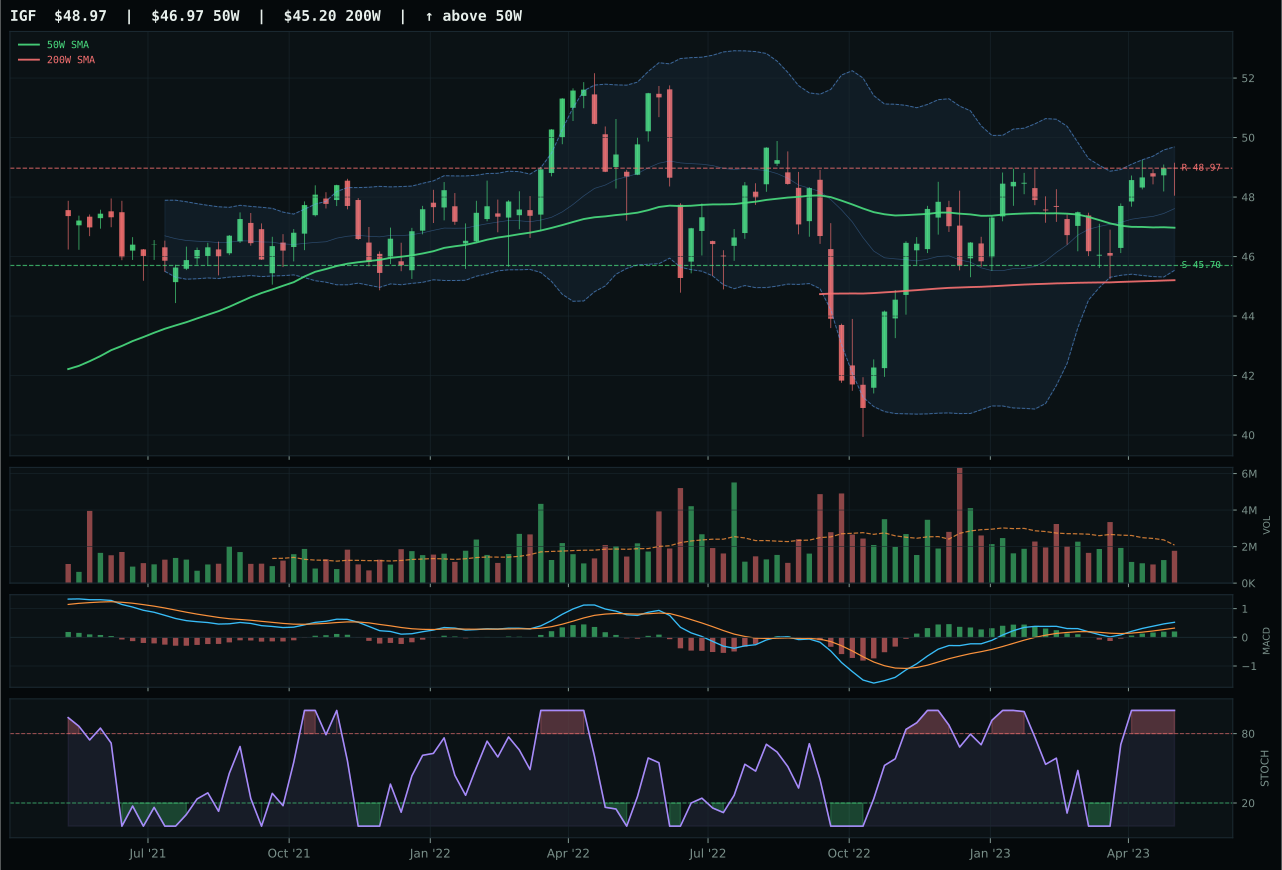
IGF has a neutral structure profile with 2.2% 13-week relative strength versus SPY.
A failed hold above support would weaken the setup.
Actionable but governed by invalidation levels.
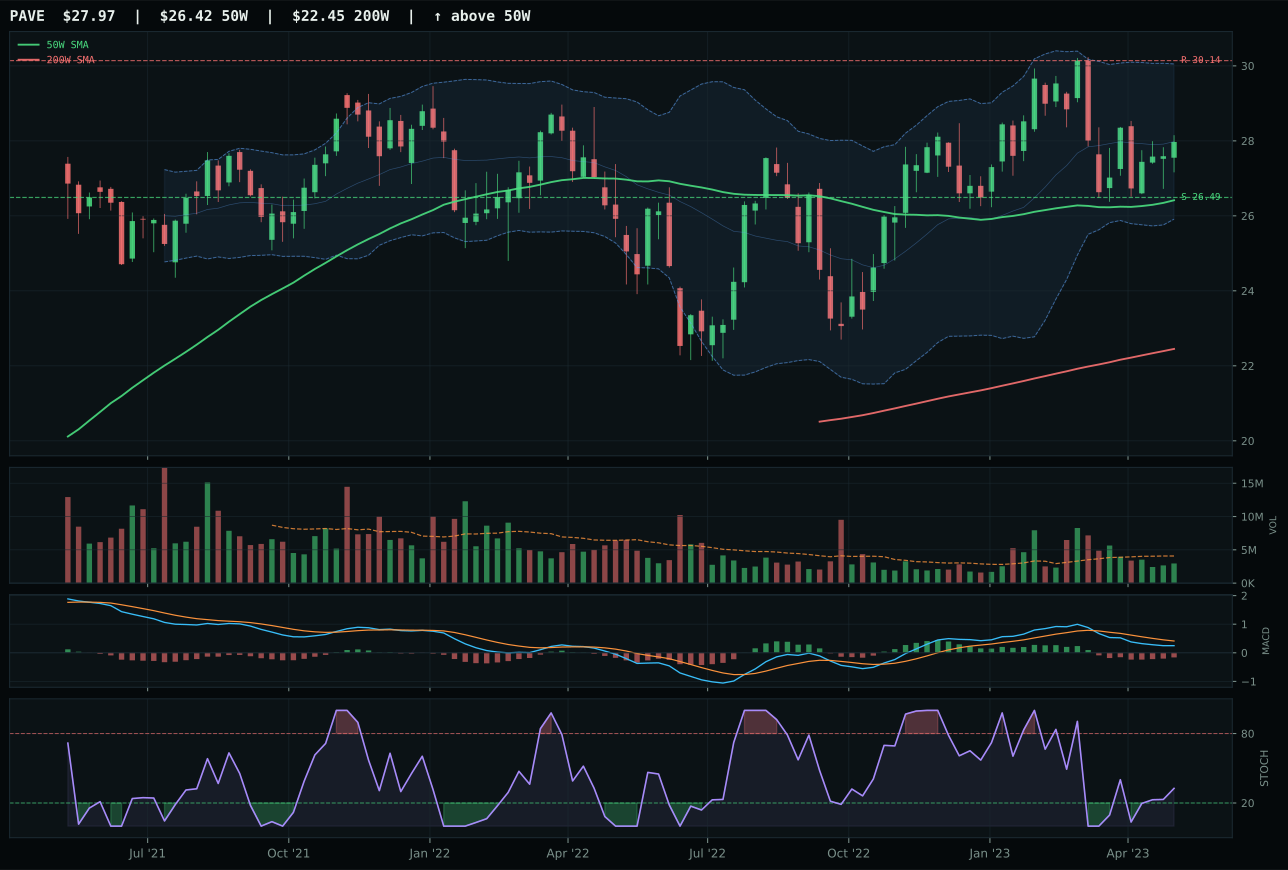
PAVE has a neutral structure profile with -5.8% 13-week relative strength versus SPY.
A failed hold above support would weaken the setup.
Actionable but governed by invalidation levels.
PAVE wins Utilities & Infrastructure with a 66.3 final score and a top-2 overweight allocation at 10% because the category-level macro fit of 76.0 is the second-strongest in the portfolio, and PAVE captures a domestic capex bid that XLU's utility defensiveness cannot match. PAVE sits 5.9% above the 50W in neutral structure with MACD bearish but improving and stochastic RSI rising mid-zone at 0.33—the earliest stage of a reversal setup. The 83.0 timing score reflects the inflection point, and the 68.2 risk/reward shows 5.6% downside to support and −7.2% upside to resistance, defining a small-range setup ready to expand. XLU trails by 5.9 points despite superior technical evidence (71.2) and stronger momentum (1.6% 13W) because its stochastic RSI is overbought momentum, its macro fit is 68.0 versus PAVE's 43.0, and it represents defensive regulation rather than capex expansion. PAVE's −7.3% category-relative strength means it is the laggard, yet its early-reversal timing makes it the ETF most likely to lead the breakout.
Utilities & Infrastructure earned a top-2 overweight at 10% because the 66.3 final score ranks it second-highest among all 10 categories, tied with Precious Metals at 10% allocation. The category-level macro fit of 76.0 is second-best in the portfolio, driven by defensive rotation (+12), disinflation help (+7), and disinflation pressure (+6), which signal that the market is rotating from growth to duration and defensive capex. Transition/mixed macro (+4) adds nuance: the infrastructure bet is not purely defensive but reflects a secular shift toward domestic capex spending and energy transition. PAVE's 50.6 technical evidence is the weakest among top-2 categories, revealing that the chart does not show classic momentum, but rather early-reversal setup at the exact moment when macro is pivoting toward defensive allocation. The 10% overweight is justified not by charting excellence but by macro fit: disinflation rewards defensive duration assets, and infrastructure capex benefits from low real rates and government spending; PAVE's lagging relative strength (−7.3% category-relative) makes it contrarian, not consensus.
Industrial Metals — COPX
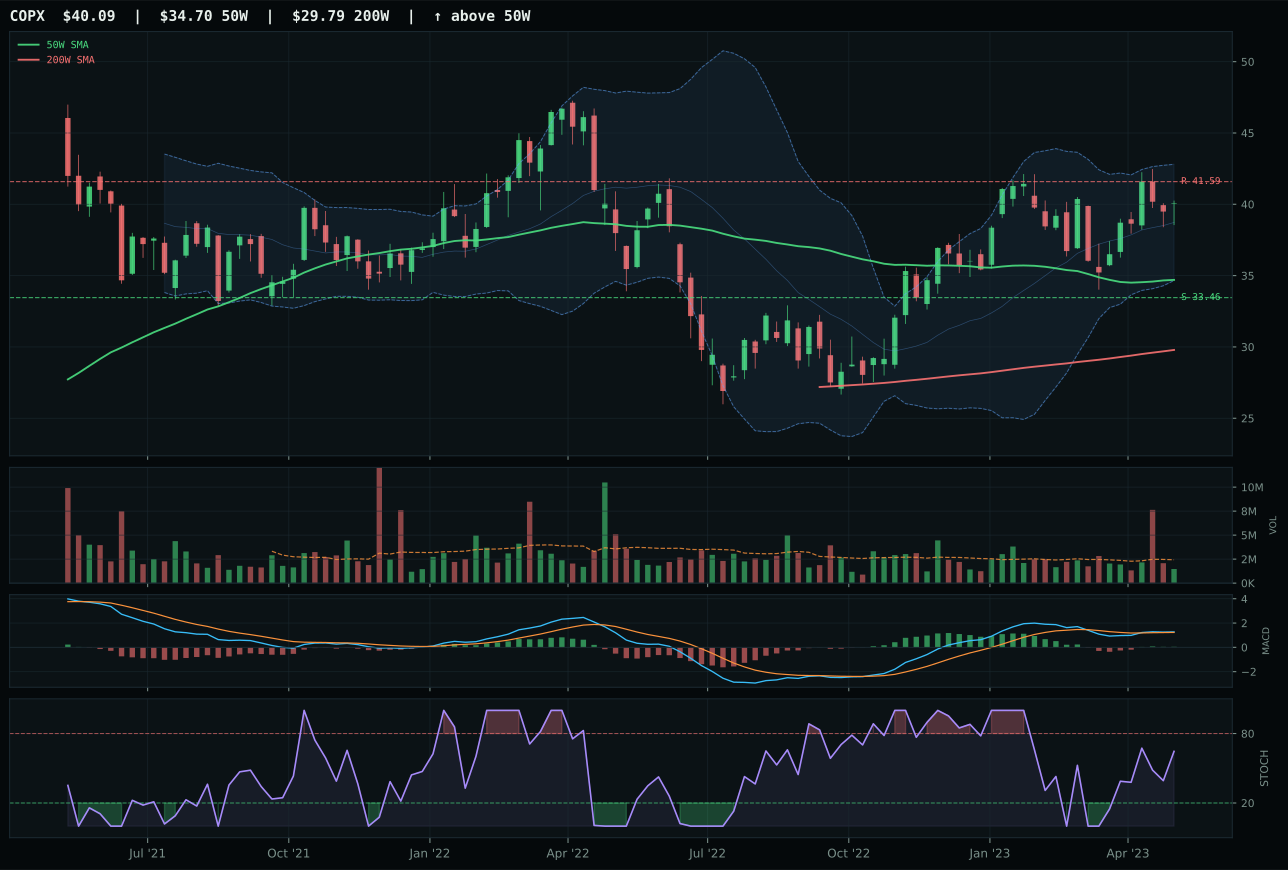
COPX has a vertical extension profile with 0.7% 13-week relative strength versus SPY.
A failed hold above support would weaken the setup.
Actionable but governed by invalidation levels.
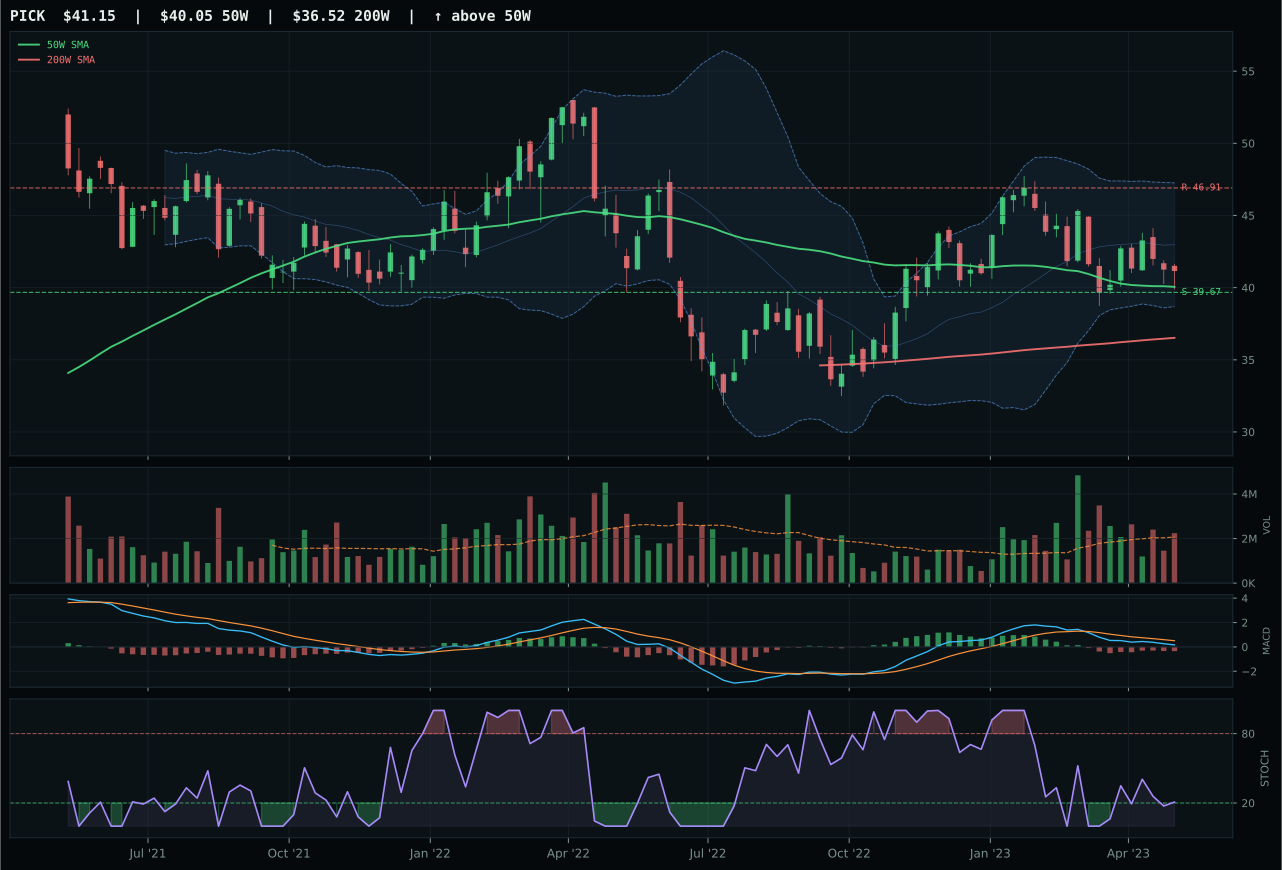
PICK has a pullback into support profile with -9.7% 13-week relative strength versus SPY.
A failed hold above support would weaken the setup.
Actionable but governed by invalidation levels.
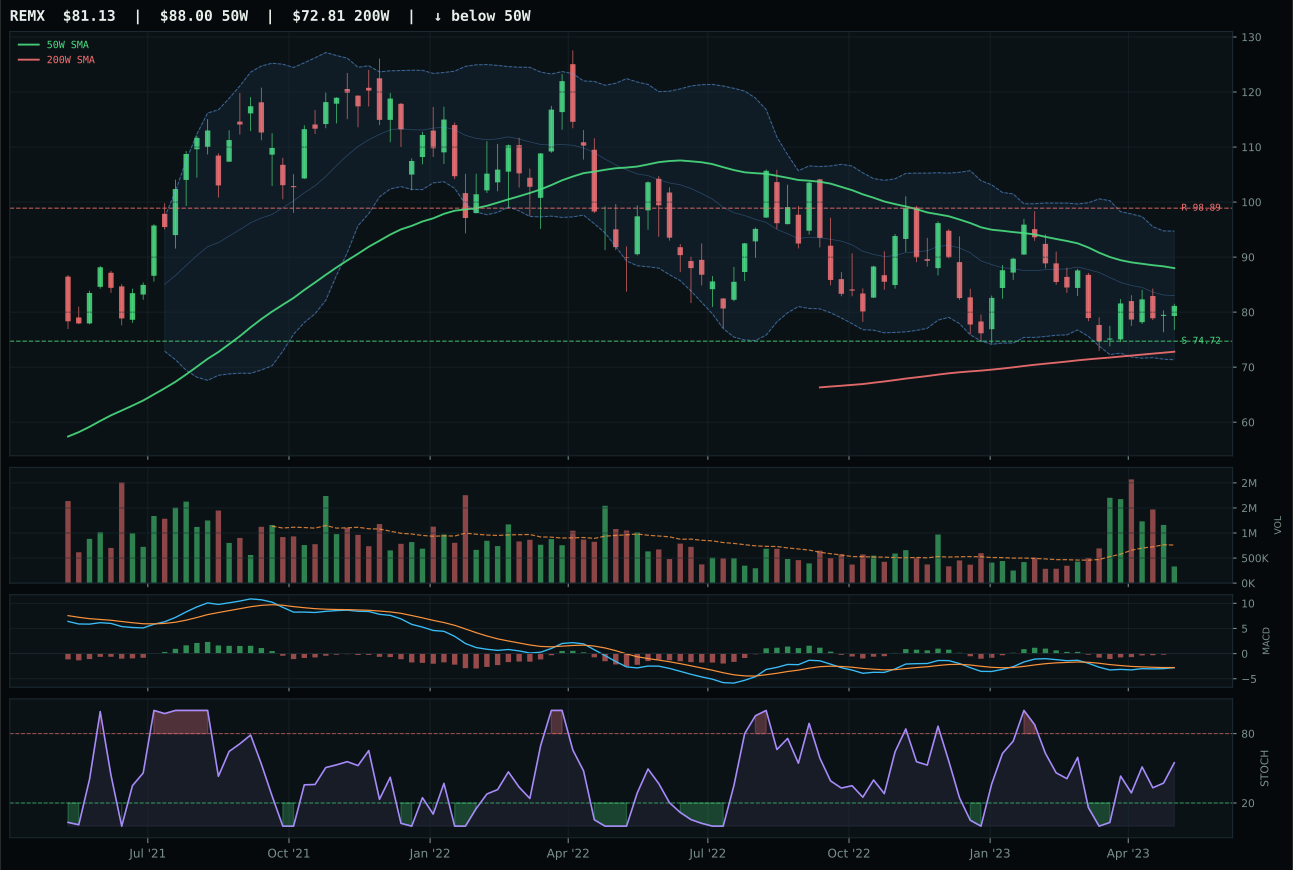
REMX has a neutral structure profile with -13.4% 13-week relative strength versus SPY.
A failed hold above support would weaken the setup.
Actionable but governed by invalidation levels.
COPX wins Industrial Metals with a 51.5 score because it is the only ETF in the category trading above both moving averages with a perfect 100.0 trend score and a bullish-and-improving MACD. Price sits 15.5% above the 50W in a vertical extension, which cuts the risk/reward score to 48.3—every new buyer is late—but the 81.3 momentum confirmation and 10.4% category-relative strength reveal that COPX is the only ETF in the basket that has momentum leaders accumulated. PICK trails by 4.6 points because it sits in a pullback-into-support setup with bearish-but-improving MACD and −9.7% 13W return, making it a value candidate rather than a momentum trade. COPX's 0.60x thin participation volume is a weakness, but the bullish MACD and 10.4% category-relative outperformance suggest that even without volume confirmation, the price action is commanding.
Industrial Metals earned 5% tier-2 allocation because the 51.5 final score ranks it 3rd or 4th among the 10 categories. The category-level macro fit of 65.0 is solid, driven by metals scarcity (+14), commodity breadth positive (+10), and real asset sponsorship (+6), which together outweigh liquidity stress (−8) and credit stress (−7). In disinflation, scarcity-driven real assets tend to hold value, and COPX's 62.0 macro/narrative fit shows that the category has genuine tailwind. However, COPX's extension from the 50W at 15.5% creates a timing problem: the setup is extended, thin participation means momentum could snap, and the risk/reward is only 48.3. To earn a top-2 slot, Industrial Metals would need either a pullback-bounce pattern that tightens the entry (drawing PICK into contention) or a second phase of volume accumulation that confirms COPX's breakout; as it stands, 5% reflects a solid real-asset hedge within a disinflation regime, but not one so compelling that it deserves overweight.
Technology — XLK
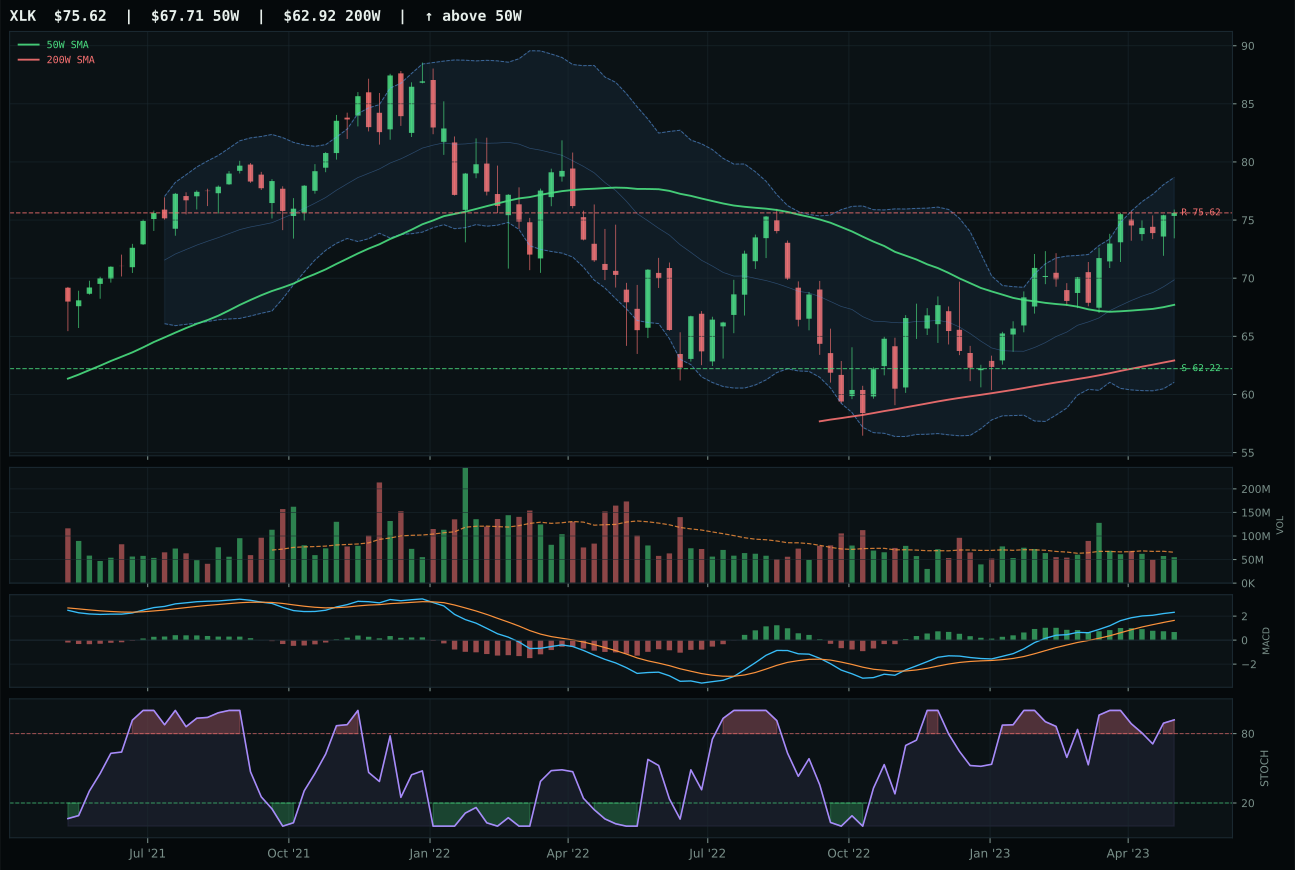
XLK has a neutral structure profile with 6.6% 13-week relative strength versus SPY.
A failed hold above support would weaken the setup.
Actionable but governed by invalidation levels.
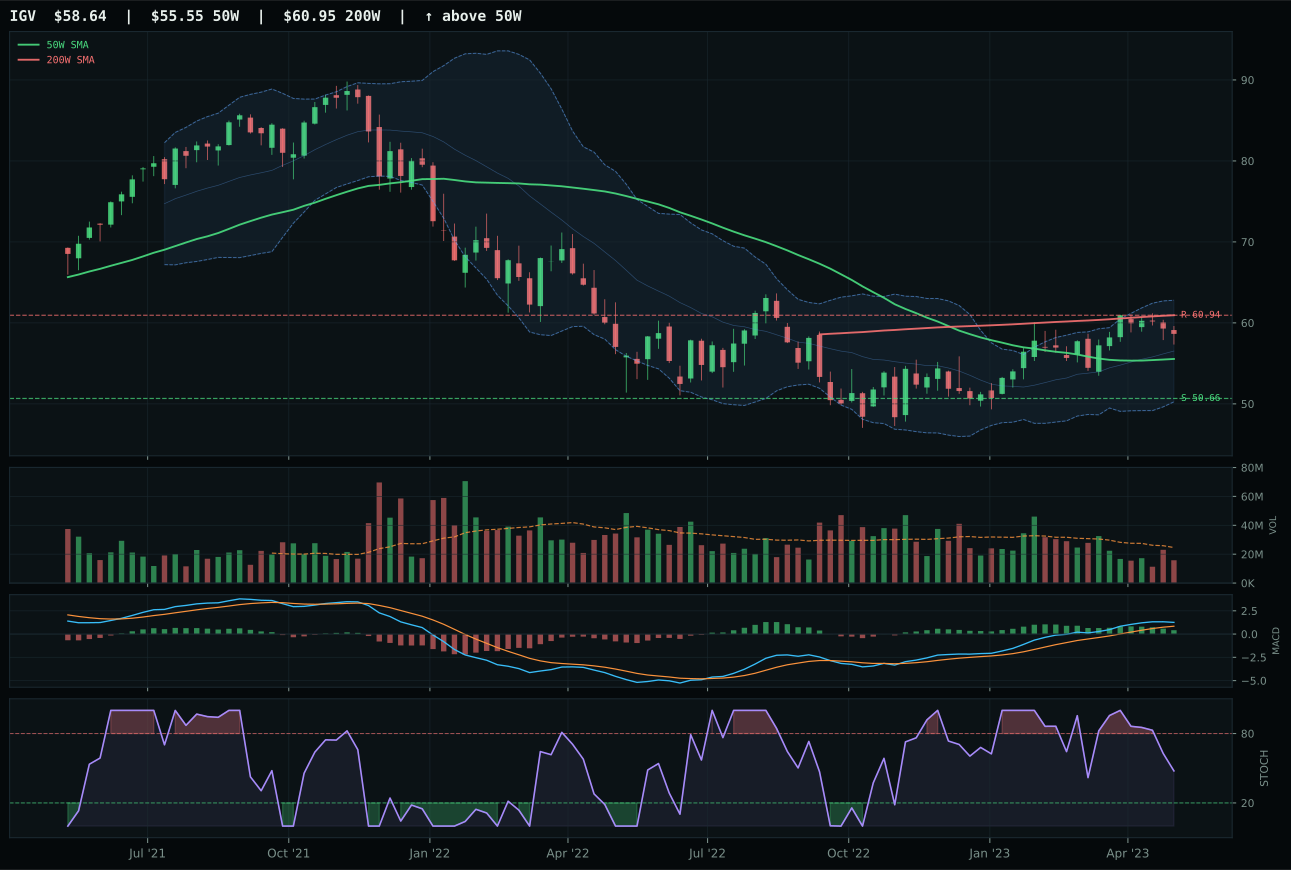
IGV has a neutral structure profile with 1.4% 13-week relative strength versus SPY.
A failed hold above support would weaken the setup.
Actionable but governed by invalidation levels.
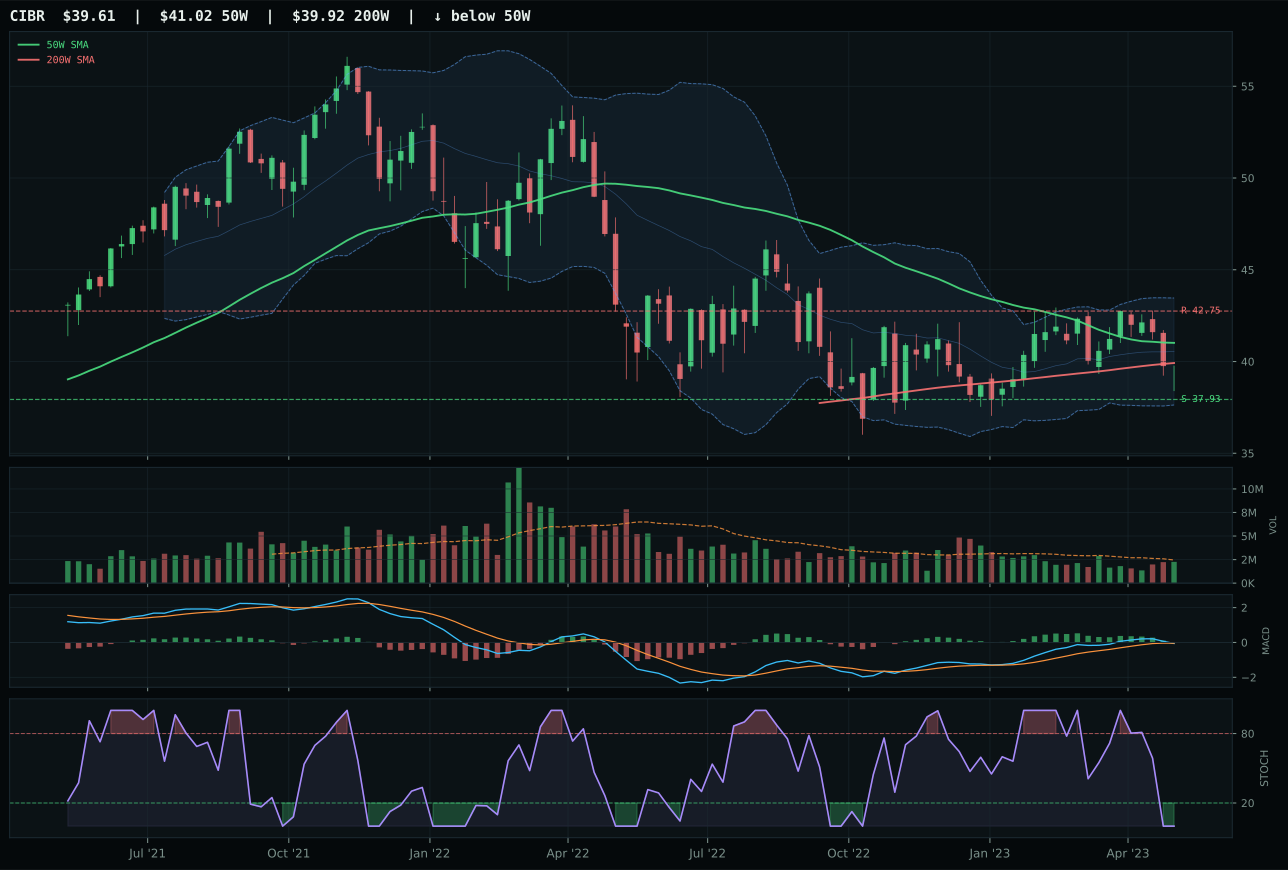
CIBR has a pullback into support profile with -4.6% 13-week relative strength versus SPY.
A failed hold above support would weaken the setup.
Actionable but governed by invalidation levels.
XLK wins the category with a 47.1 score because it is the only ETF in the basket trading above both the 50W and 200W moving averages with a non-deteriorating uptrend slope of 0.3%. The 6.6% relative strength versus SPY and 5.2% category-relative strength confirm that new buyers are participating, not just bouncing off support. IGV, the runner-up, trails by 11 points despite a bullish MACD because its structure is less clean, category-relative strength sits at zero percent, and volume participation is thin—a combination that signals the MACD rally lacks breadth sponsorship. XLK's 84.7 momentum confirmation score and 75.5 volume-price confirmation reflect a setup where accumulated buying is visible in the price action and the 1.66x 20W average volume confirms this is accumulation, not distribution. The setup is neutral structure, price sits 11.7% above the 50W near the 0.236 Fibonacci extension, and the 67% return over the past 26 weeks places it in the upper half of a long cycle.
Technology earned a 5% allocation as a tier-2 category, not a top-2 overweight, because two higher-scoring categories claimed the dual 10% slots this week. The 47.1 final score ranks below both Precious Metals (84.0) and Utilities & Infrastructure (66.3), placing it in the middle tier of the portfolio. Disinflation as the macro regime offers modest tailwinds for profitable tech leadership, yet liquidity stress and credit stress—both active descriptors—drag down the category-level macro fit to just 45.0 out of 100. XLK's technical evidence of 74.7 carries the weight, but the 35.0 macro/narrative fit reveals the tension: the chart looks good in isolation, but the broader economic backdrop of tightening financial conditions limits the category's risk-adjusted appeal. To earn a top-2 slot next week, Technology would need either a clearer macro pivot away from credit stress or a second ETF in the basket to gain category-relative breadth; currently, the 11-point gap to IGV means XLK is winning a tight race rather than leading by conviction.
Defense & Aerospace — XAR
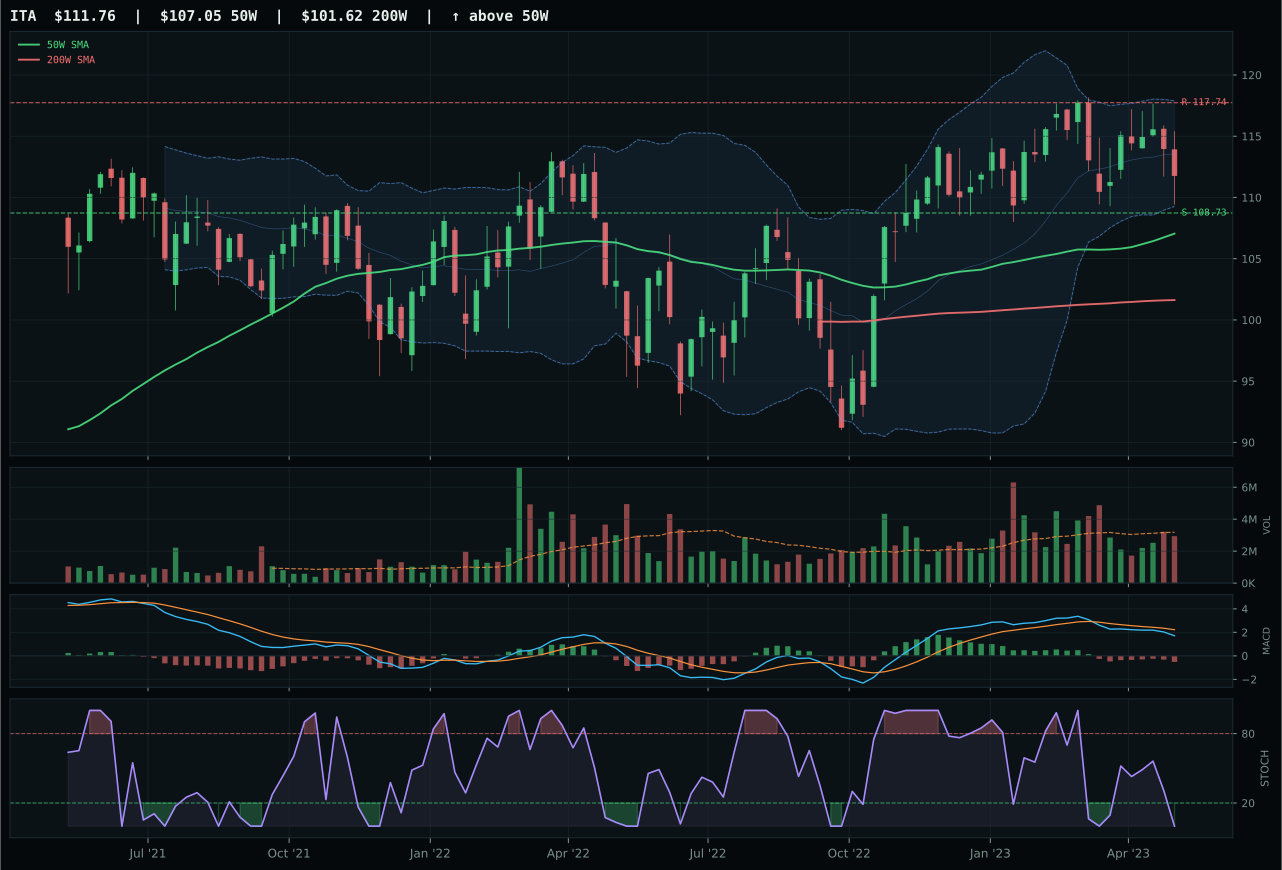
ITA has a pullback into support profile with -1.6% 13-week relative strength versus SPY.
A failed hold above support would weaken the setup.
Actionable but governed by invalidation levels.
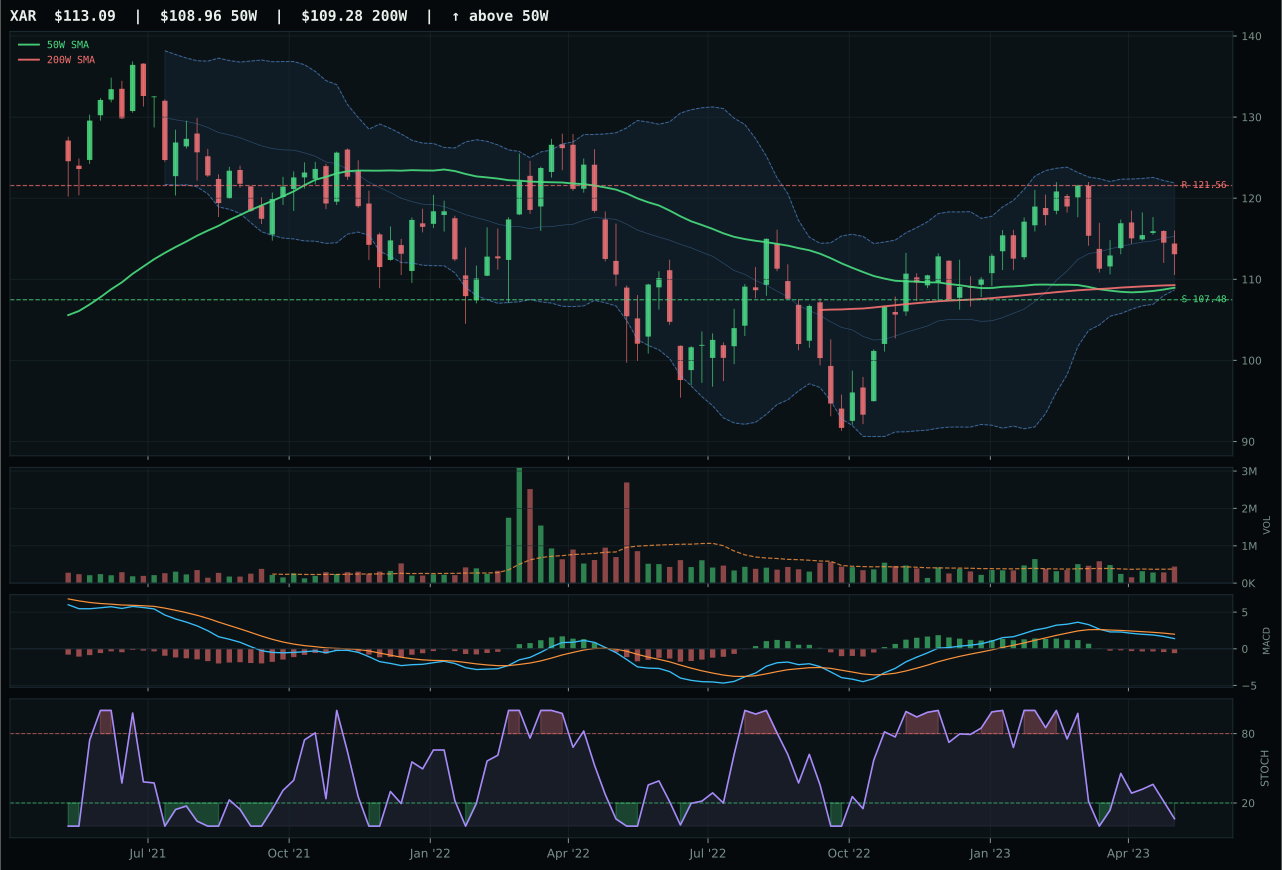
XAR has a neutral structure profile with -5.0% 13-week relative strength versus SPY.
A failed hold above support would weaken the setup.
Actionable but governed by invalidation levels.
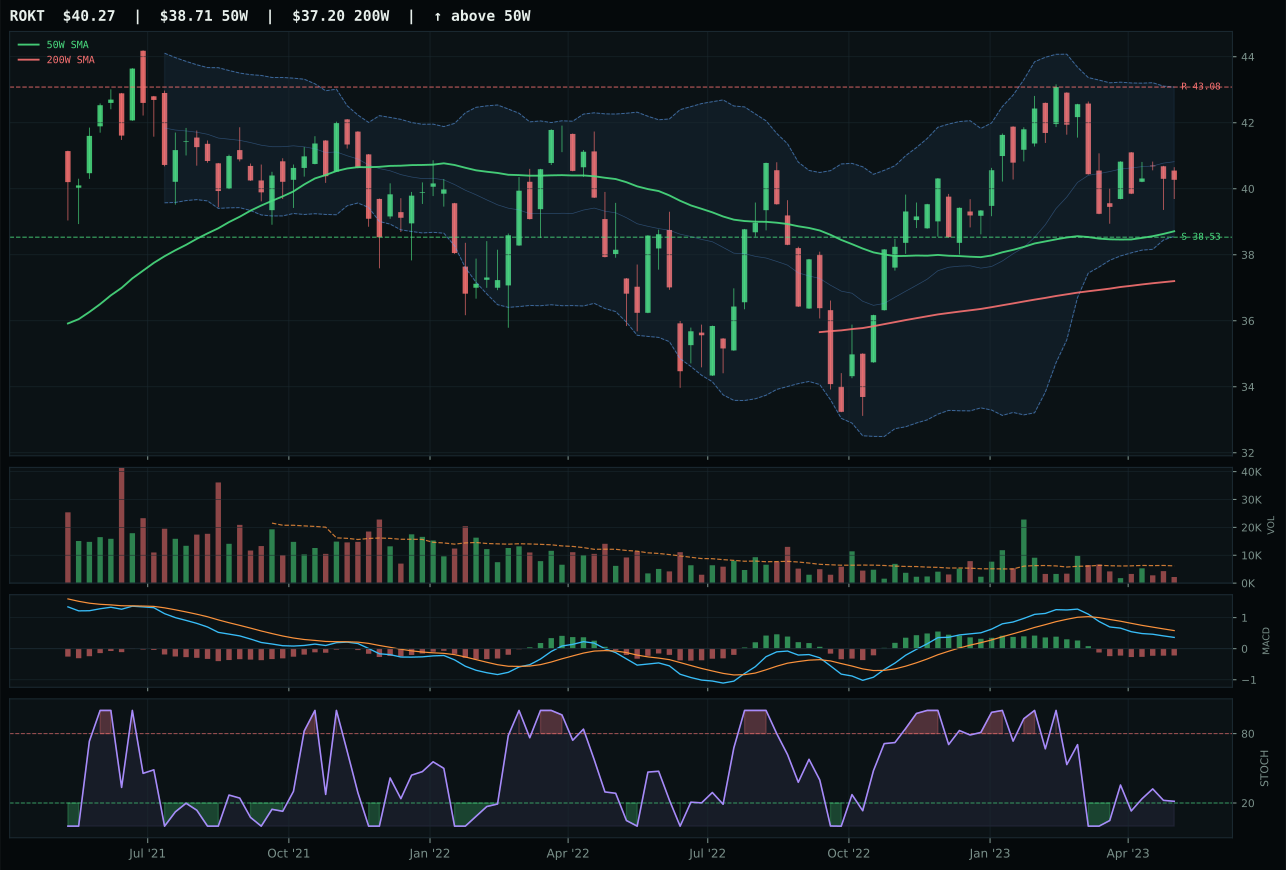
ROKT has a pullback into support profile with -5.2% 13-week relative strength versus SPY.
A failed hold above support would weaken the setup.
Tracked, but not top-2 eligible because: .
XAR wins the category despite a 12.6-point gap to ITA because the scoring methodology reflects XAR's neutral structure over ITA's pullback-into-support setup, combined with above-average volume participation that ITA lacks. XAR sits 3.8% from the 50W with stochastic RSI oversold and MACD bearish/weakening, which yields a perfect 85.0 timing score—the chart is sitting at an inflection point. The 69.0 risk/reward score and 5.2% downside to support show defined invalidation, while ITA's structure is rated 72.3 versus 74.5, a marginal miss. What distinguishes XAR is the 1.18x above-average volume at an oversold moment, signaling potential for a squeeze higher if buyers defend the level, whereas ITA's neutral volume leaves the reversal uncertain. The −5.0% 13W return shows momentum is absent, but that weakness combined with oversold technicals and above-average volume creates the kind of setup that works in contrarian rotations.
Defense & Aerospace earned 5% allocation in tier-2 because its 41.2 final score ranks below the two top-2 categories but above the excluded tier. The category benefits from a strong 59.0 macro/narrative fit—the highest among tier-2 categories—because defensive rotation is active at +8 and transition/mixed macro regimes (+3) offset liquidity stress (−4). In a disinflation regime with credit stress still a headwind, defensive positioning is rational, and the XAR setup of oversold technicals with contained risk/reward (69.0) fits that thesis. However, the 38.0 technical evidence score reveals the issue: momentum is genuinely broken, with −5.0% 13W return and zero category-relative strength. XAR is winning not because it is leading, but because the entire category is defensive and mean-reversion setups are the best opportunity available. To earn a top-2 slot, the category would need either a clear relative strength leader (no −5% trailing SPY) or a second ETF in the basket to diversify the category bet; as it stands, tier-2 at 5% appropriately reflects that this is insurance, not conviction.
Nuclear Energy — URA
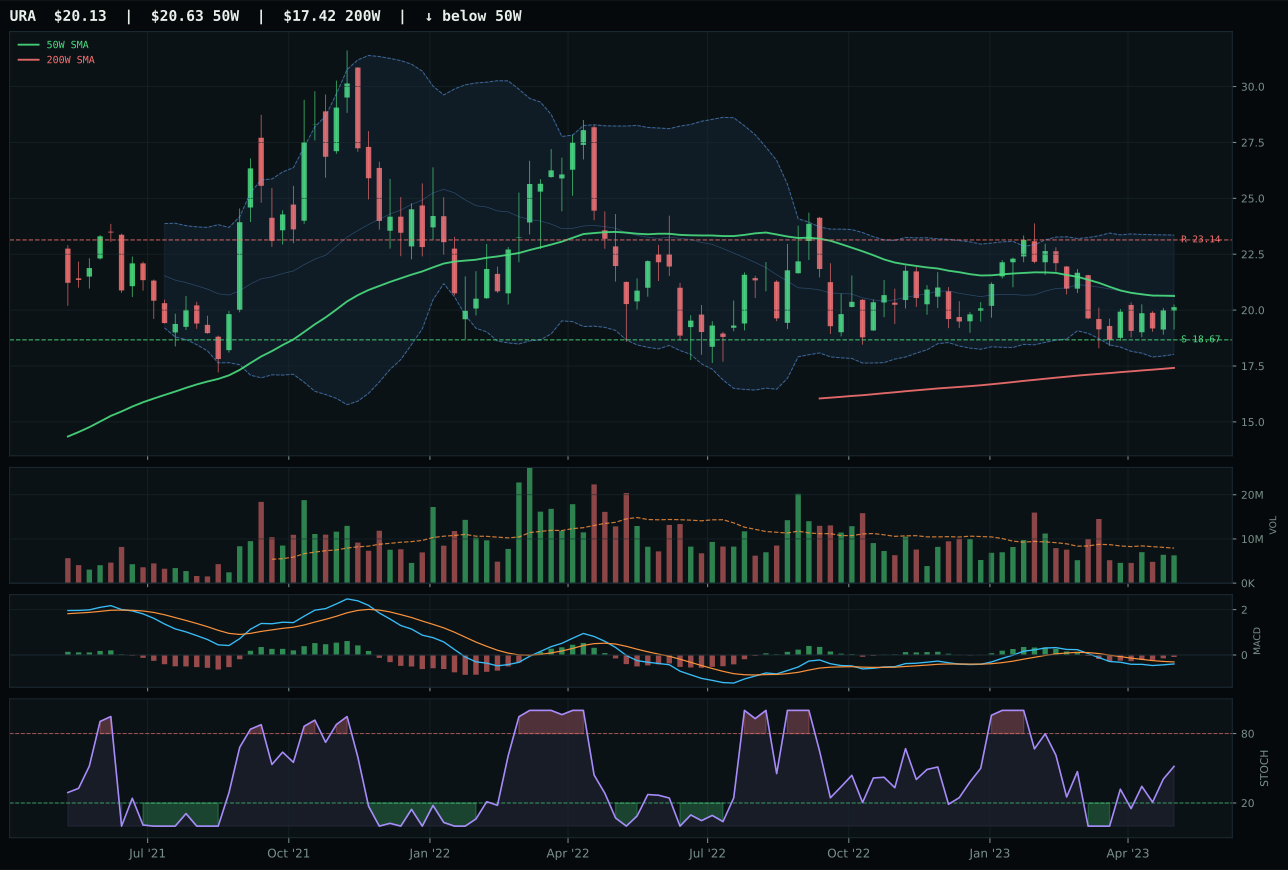
URA has a compression near 50W profile with -9.2% 13-week relative strength versus SPY.
A failed hold above support would weaken the setup.
Actionable but governed by invalidation levels.
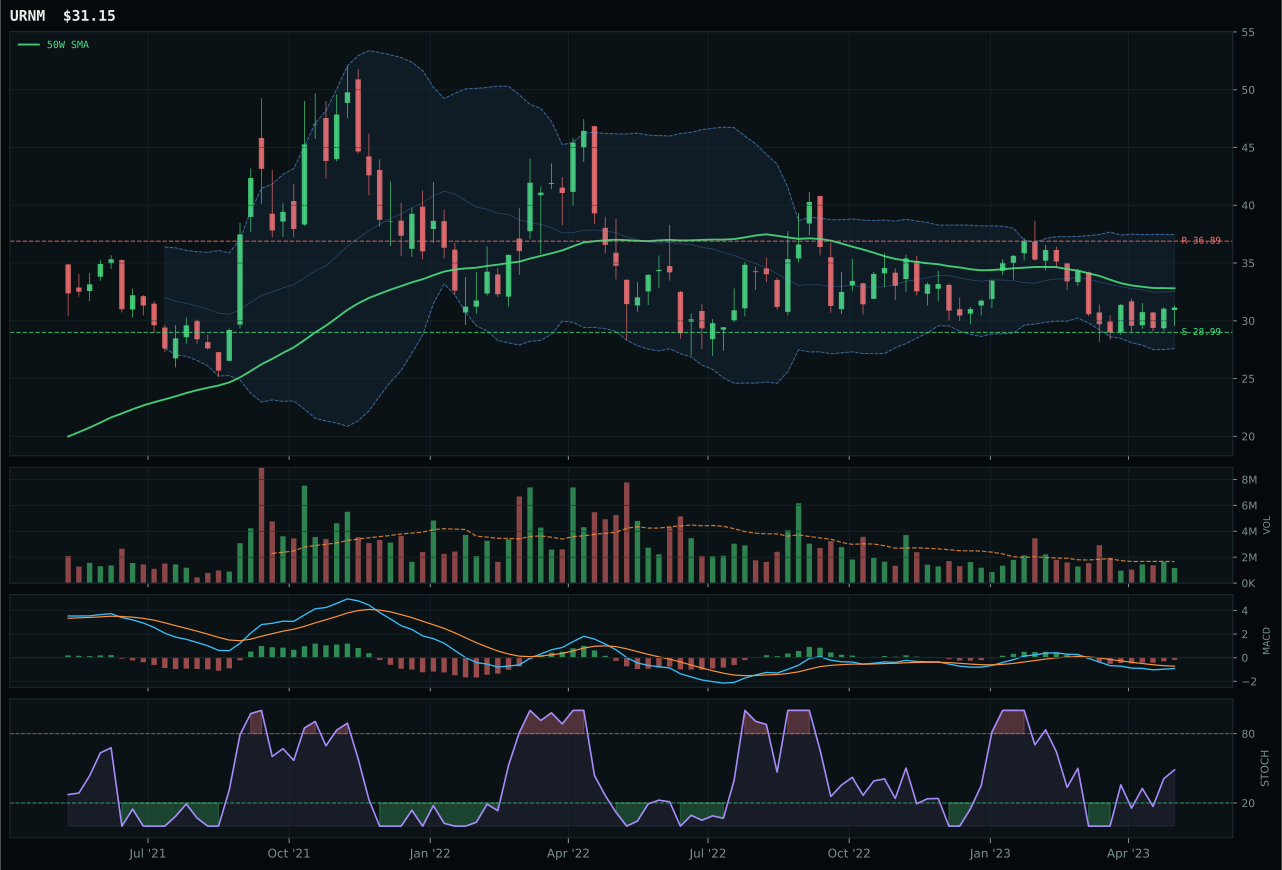
URNM has a neutral structure profile with -11.8% 13-week relative strength versus SPY.
A failed hold above support would weaken the setup.
Actionable but governed by invalidation levels.
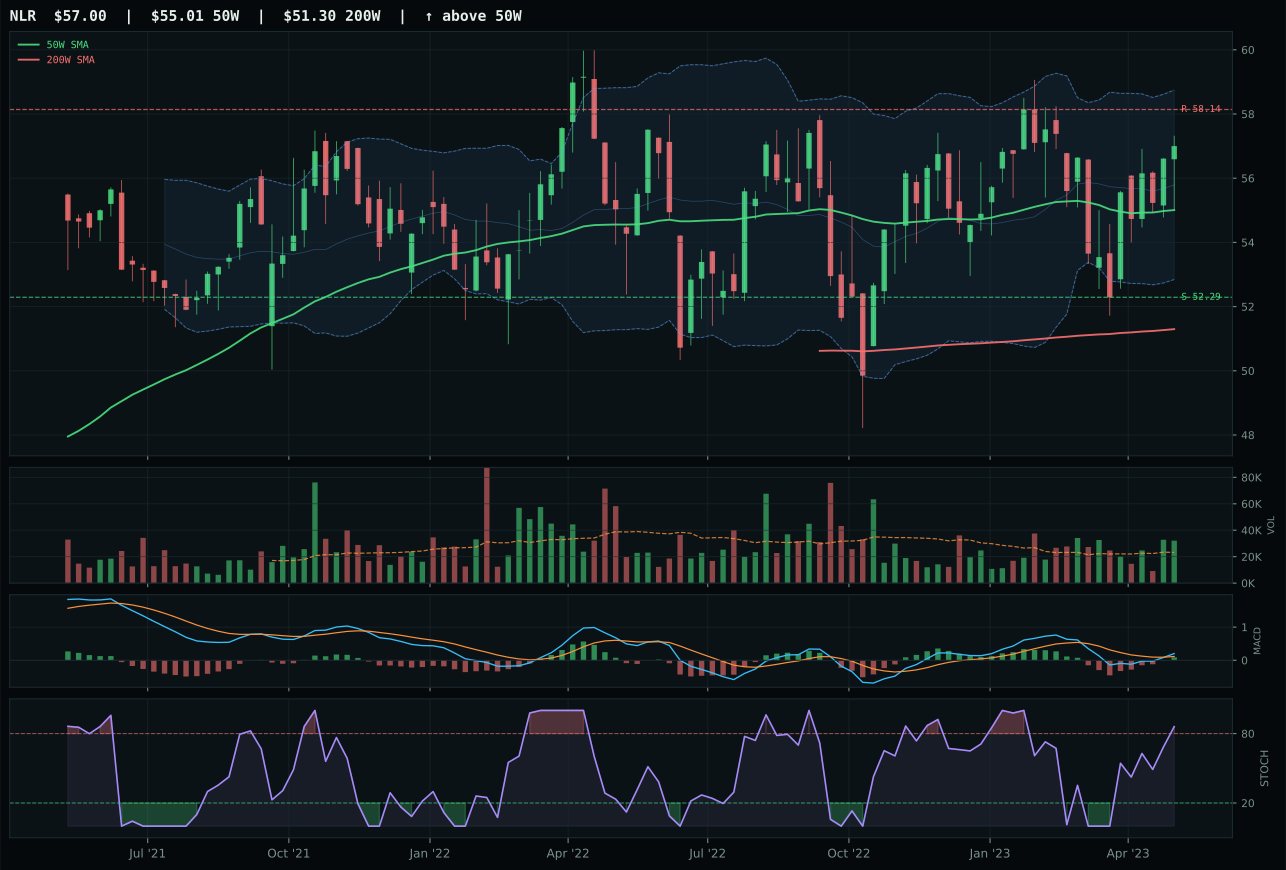
NLR has a neutral structure profile with -0.2% 13-week relative strength versus SPY.
A failed hold above support would weaken the setup.
Tracked, but not top-2 eligible because: .
URA wins Nuclear Energy with a 39.3 final score because it offers the best combination of timing and risk/reward in a category where all three ETFs are trading in pullback-into-value territory. Price sits −2.4% from the 50W with compression structure, MACD bearish but improving, and stochastic RSI rising mid-zone at 0.52, creating a perfect 100.0 timing score. The 82.9 risk/reward score reflects −13.0% upside to resistance and 7.8% downside to support, defining a mean-reversion setup with contained downside. URNM trails by 28.5 points despite a similar macro setup because its 13W return of −11.8% shows accelerating weakness, its stochastic RSI is also rising mid-zone but MACD is still bearish, and volume is thin participation—all signs that accumulation has not yet begun. URA's compression structure near the 50W suggests potential expansion if buyers defend, whereas URNM is still in free-fall.
Nuclear Energy earned 5% tier-2 allocation because the 39.3 final score ranks it in the middle tier, neither top-2 nor excluded. The 45.0 category-level macro fit shows neutral standing because real asset sponsorship (+7) is offset by liquidity stress (−7) and credit stress (−5). URA's 55.8 technical evidence is respectable but not dominant, and the 50.0 macro/narrative fit shows that the category benefits from real-asset tailwinds but lacks clear macro conviction. Nuclear is being held for its scarcity and energy-transition credentials, not for momentum. To earn a top-2 slot, Nuclear would need either a stronger technical relative strength leader (URNM currently trails by −11.8% 13W) or a clear macro pivot toward energy-scarcity bidding; as it stands, 5% reflects a tactical real-asset allocation within a disinflation regime, held primarily because liquidity stress and credit stress mean defensive positioning is rational, not because the category is leading.
AI — BOTZ
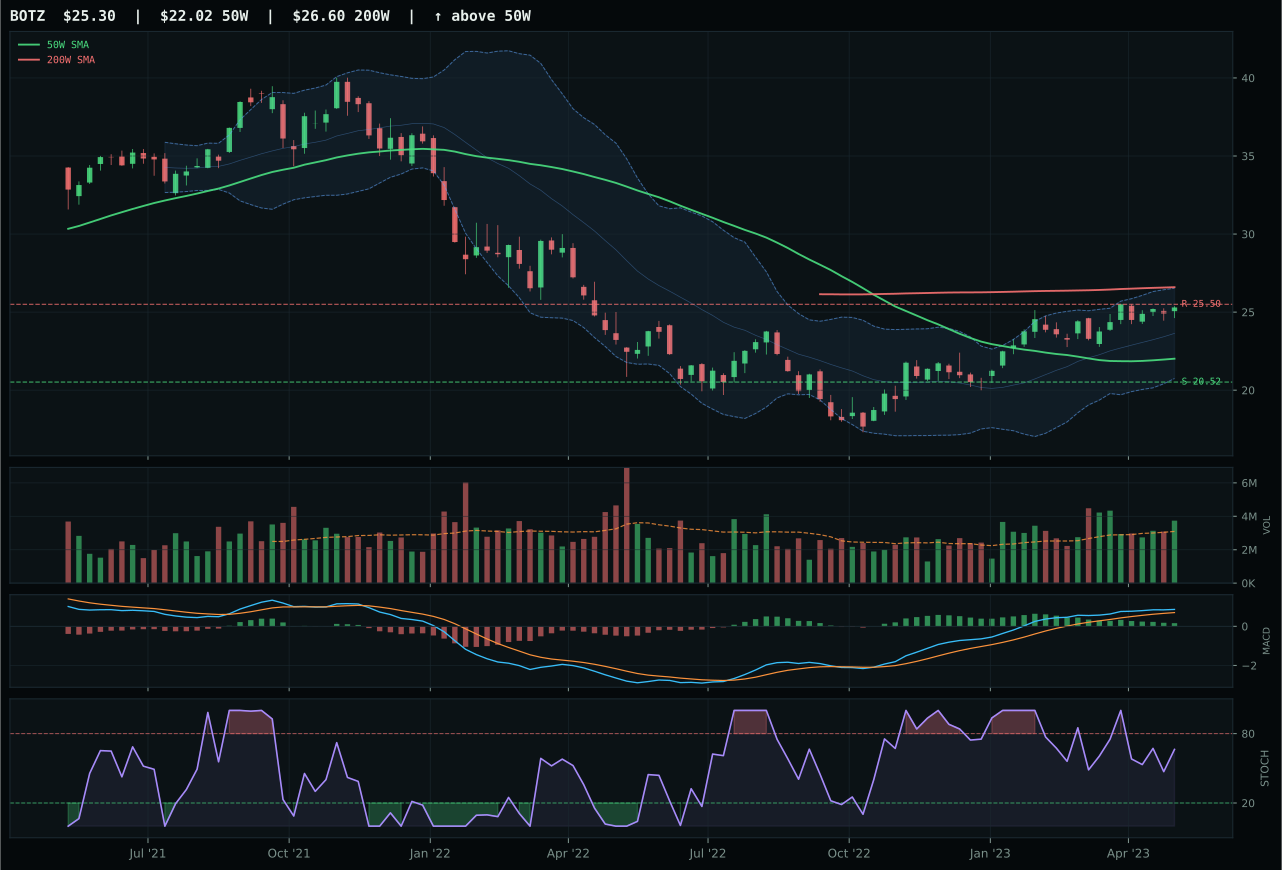
BOTZ has a neutral structure profile with 3.0% 13-week relative strength versus SPY.
A failed hold above support would weaken the setup.
Actionable but governed by invalidation levels.
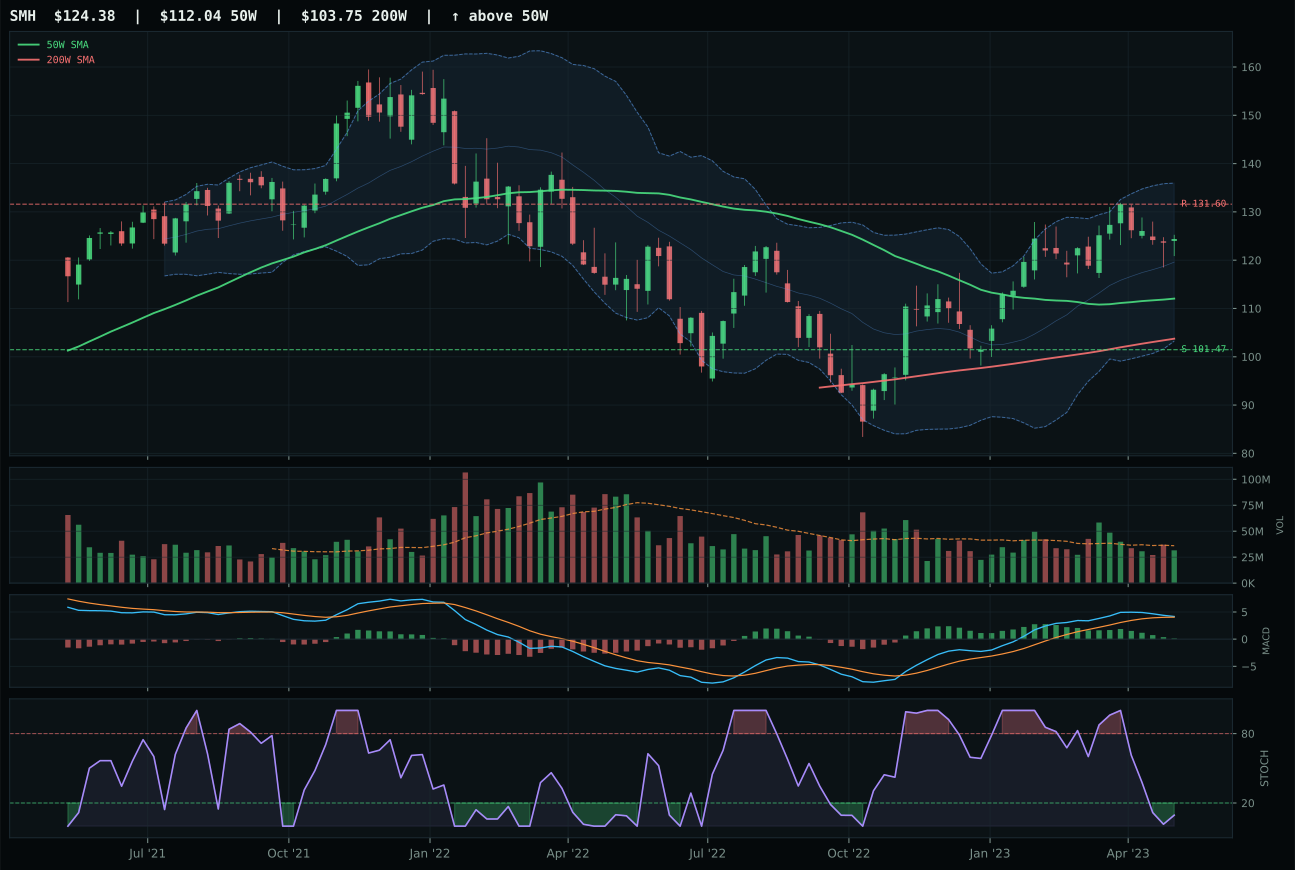
SMH has a neutral structure profile with -0.1% 13-week relative strength versus SPY.
A failed hold above support would weaken the setup.
Actionable but governed by invalidation levels.
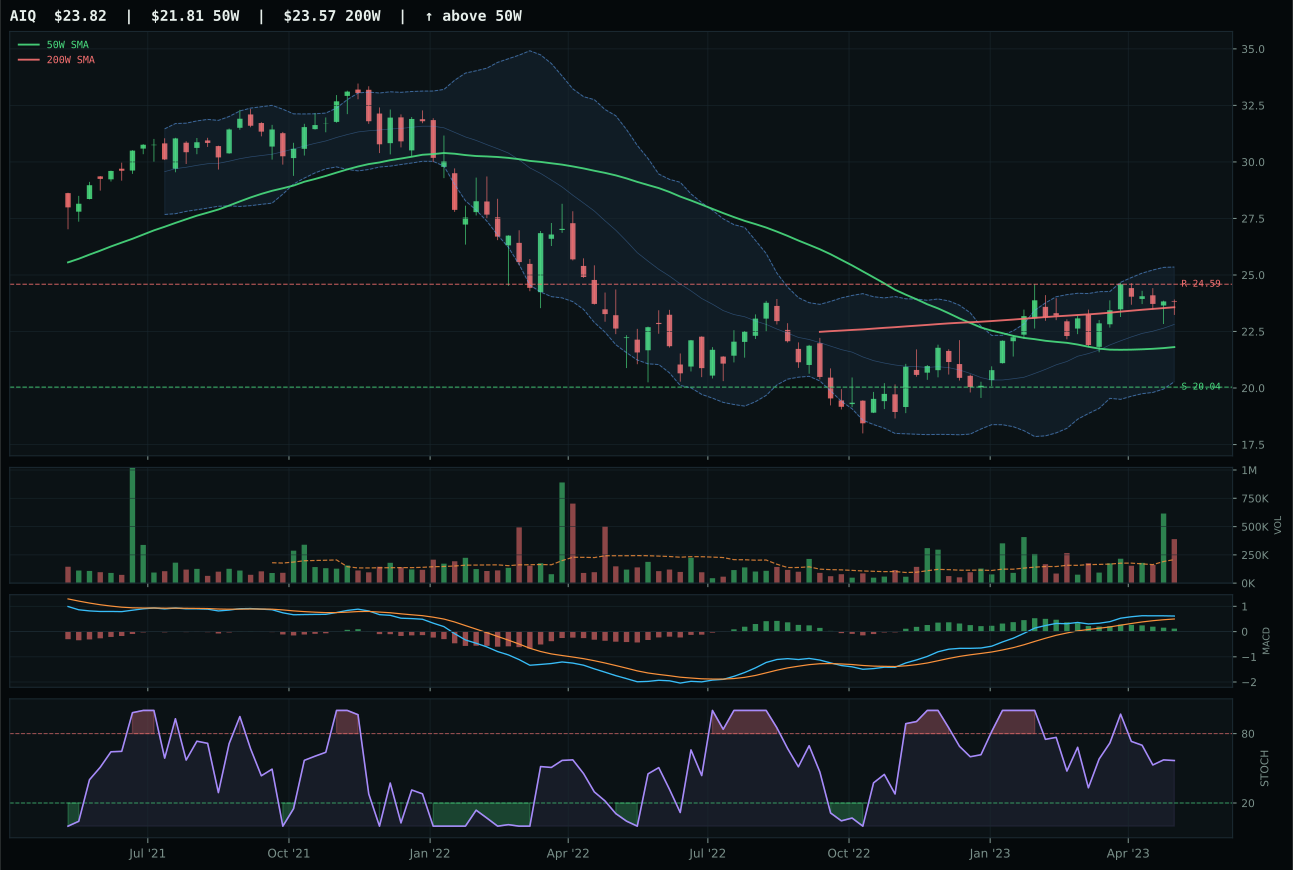
AIQ has a neutral structure profile with -0.3% 13-week relative strength versus SPY.
A failed hold above support would weaken the setup.
Tracked, but not top-2 eligible because: .
BOTZ wins with a 32.7 score on a narrow margin: SMH trails by just 1.2 points, making this a close category decision driven by execution rather than dominance. BOTZ holds a 3.0% relative strength versus SPY and matching 3.1% category-relative strength, both of which are modest but sufficient to justify selection. SMH's stochastic RSI sits oversold while BOTZ's is rising mid-zone at 0.66, a critical timing difference in a pullback setup where price is 14.9% above the 50W but below the 200W. The 1.21x above-average volume participation in BOTZ confirms that the MACD bullish setup has real accumulation behind it, whereas SMH's neutral volume leaves the question of sponsorship unanswered. BOTZ's momentum confirmation score of 79.4 reflects the 3.1% 13W return paired with visible buying pressure, even though neither ETF has escaped the macro weight of liquidity and credit stress crushing the entire category.
AI received a 5% tier-2 allocation despite a final score of just 32.7 because the portfolio's 50% overlay requires all category sleeves to be cut in half, and the absolute score still qualifies for a position. The category itself ranks well below Precious Metals and Utilities & Infrastructure because the 35.0 category-level macro fit is dragged down by active liquidity stress (−12) and active credit stress (−8), which outweigh the modest disinflation tailwind of +5. Cyclical robotics and AI compute are sensitive to financial conditions, and the current regime penalizes both. BOTZ's technical evidence of 77.3 is solid, but the 36.0 macro/narrative fit reveals a setup that works on the chart but sits athwart the macro headwinds. For AI to move into tier-1, either credit stress or liquidity stress would need to reverse, or the category's three-ETF basket would need to generate cleaner relative strength leadership; at present, 3% trailing SPY is just enough to hold the slot, not enough to justify overweight.
Emerging Markets — INDA
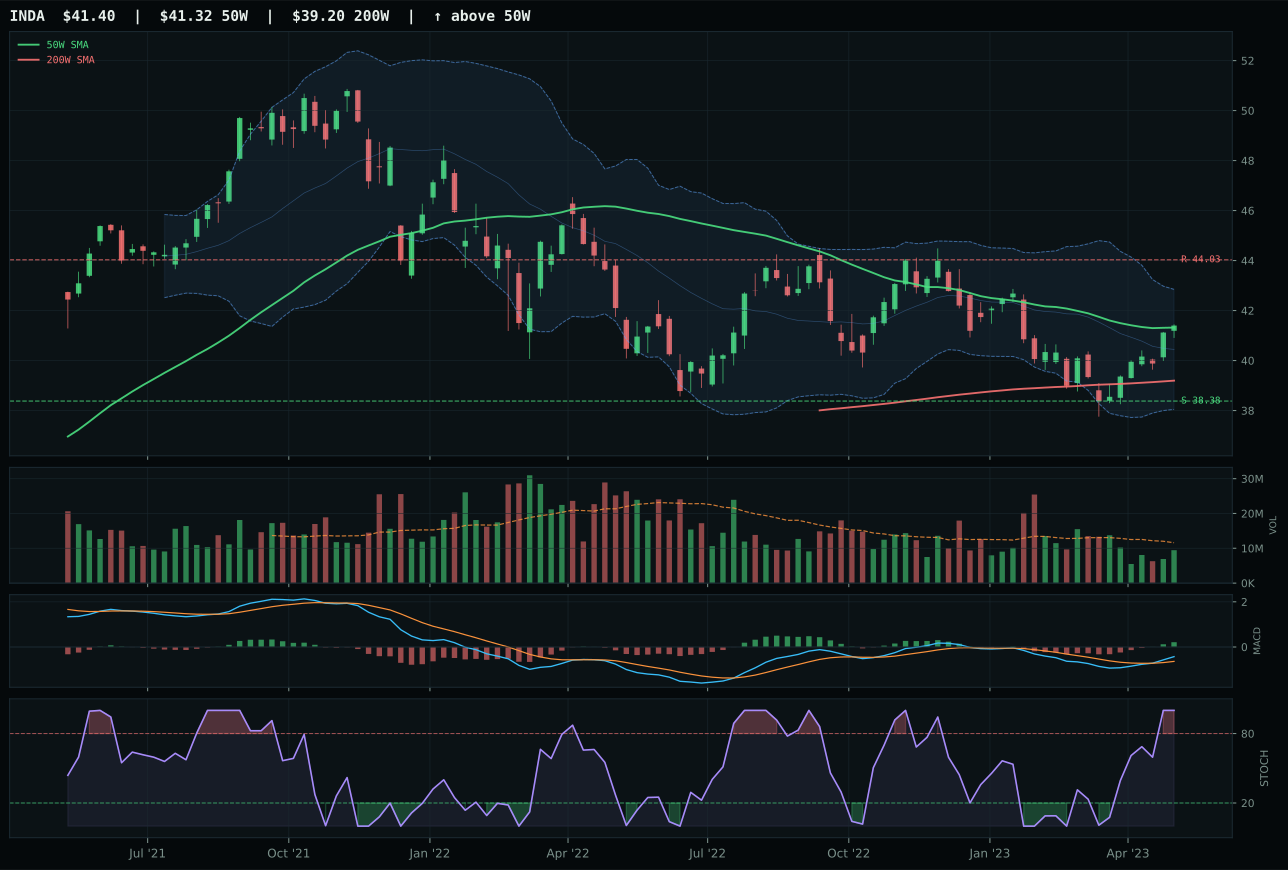
INDA has a compression near 50W profile with 3.3% 13-week relative strength versus SPY.
A failed hold above support would weaken the setup.
Actionable but governed by invalidation levels.
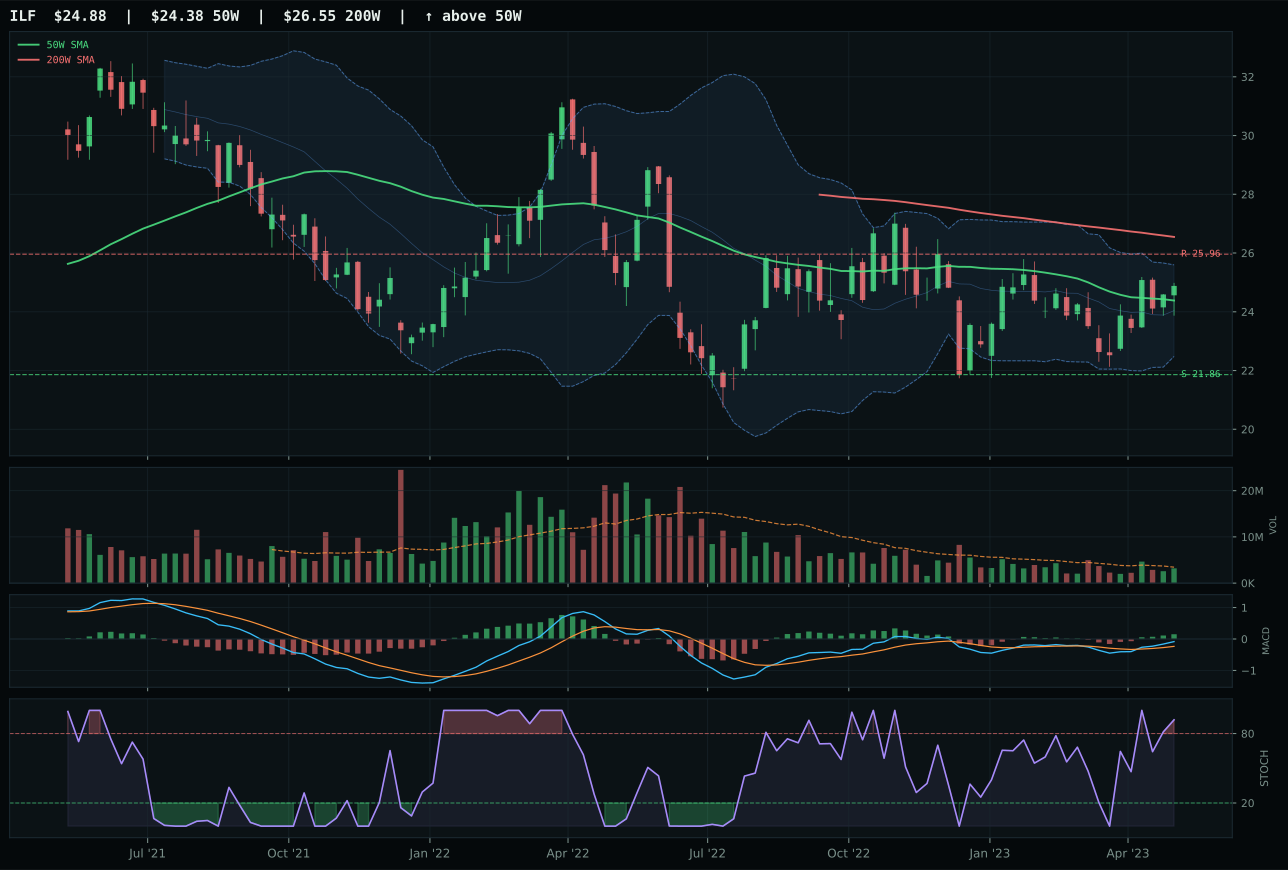
ILF has a compression near 50W profile with 2.0% 13-week relative strength versus SPY.
A failed hold above support would weaken the setup.
Actionable but governed by invalidation levels.
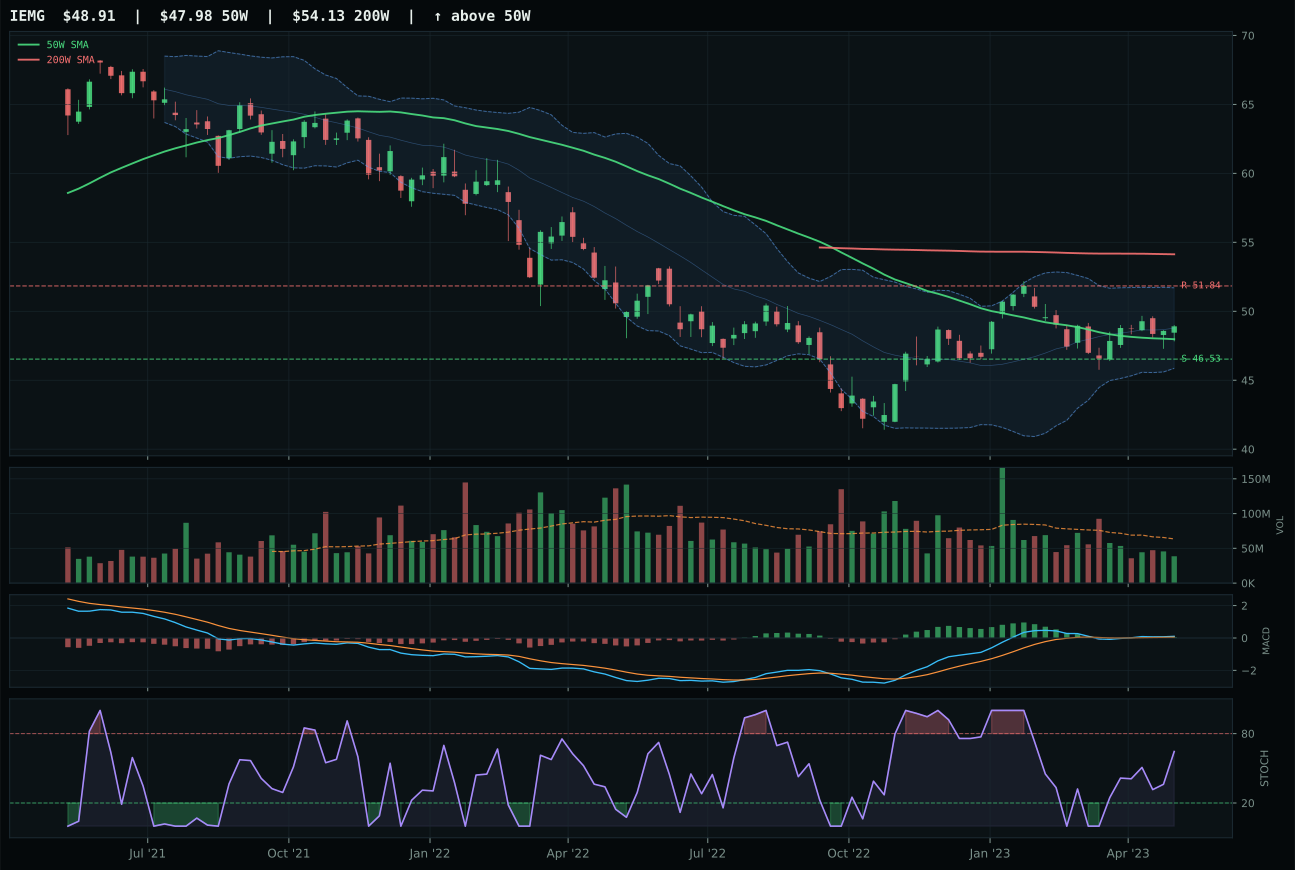
IEMG has a compression near 50W profile with -2.9% 13-week relative strength versus SPY.
A failed hold above support would weaken the setup.
Actionable but governed by invalidation levels.
INDA wins Emerging Markets with a 29.0 final score because it combines the strongest technical evidence (86.5) in a category of three pullback-and-accumulation setups. INDA trades 0.2% from the 50W with compression structure and bullish-and-improving MACD, yielding a perfect 100.0 timing score that no peer can match. The 3.3% relative strength versus SPY is modest but the 1.3% category-relative strength confirms INDA is the only ETF in the basket with positive breadth. Stochastic RSI is overbought momentum at 1.00, paired with 79.1 momentum confirmation from a 3.3% 13W return, showing that the MACD rally has legs. ILF trails by 17.4 points because its timing score is 82.0 versus INDA's 100.0, its stochastic RSI is overbought rolling over rather than rising, and its category-relative strength is 0.0%, placing it in a tie for second.
Emerging Markets earned 5% tier-2 allocation despite a 29.0 final score because the portfolio's tier-2 minimum is tier-3 (0%), and the category's technical evidence of 86.5 for INDA justifies holding. The 30.0 category-level macro fit reveals the core tension: credit stress (−10) and liquidity stress (−10) are severe drags on emerging-market sentiment. INDA's 40.0 macro/narrative fit shows it is fighting the regime, yet the chart's compression-near-50W setup with bullish MACD is precisely the kind of quiet accumulation that works before macro turns. Emerging markets earned inclusion not because the macro backdrop is supportive, but because INDA's technical setup—tightest proximity to the 50W, cleanest MACD, best timing—offers a low-risk entry into a category that will likely outperform once liquidity or credit stress reverses. To move to top-2, Emerging Markets would need a clear macro pivot away from credit/liquidity stress, or 3% relative strength to accelerate into 5-10% range; as it stands, 5% is a position-building allocation for an environment where the regime is still hostile but the chart is ready.
Agriculture & Livestock — VEGI
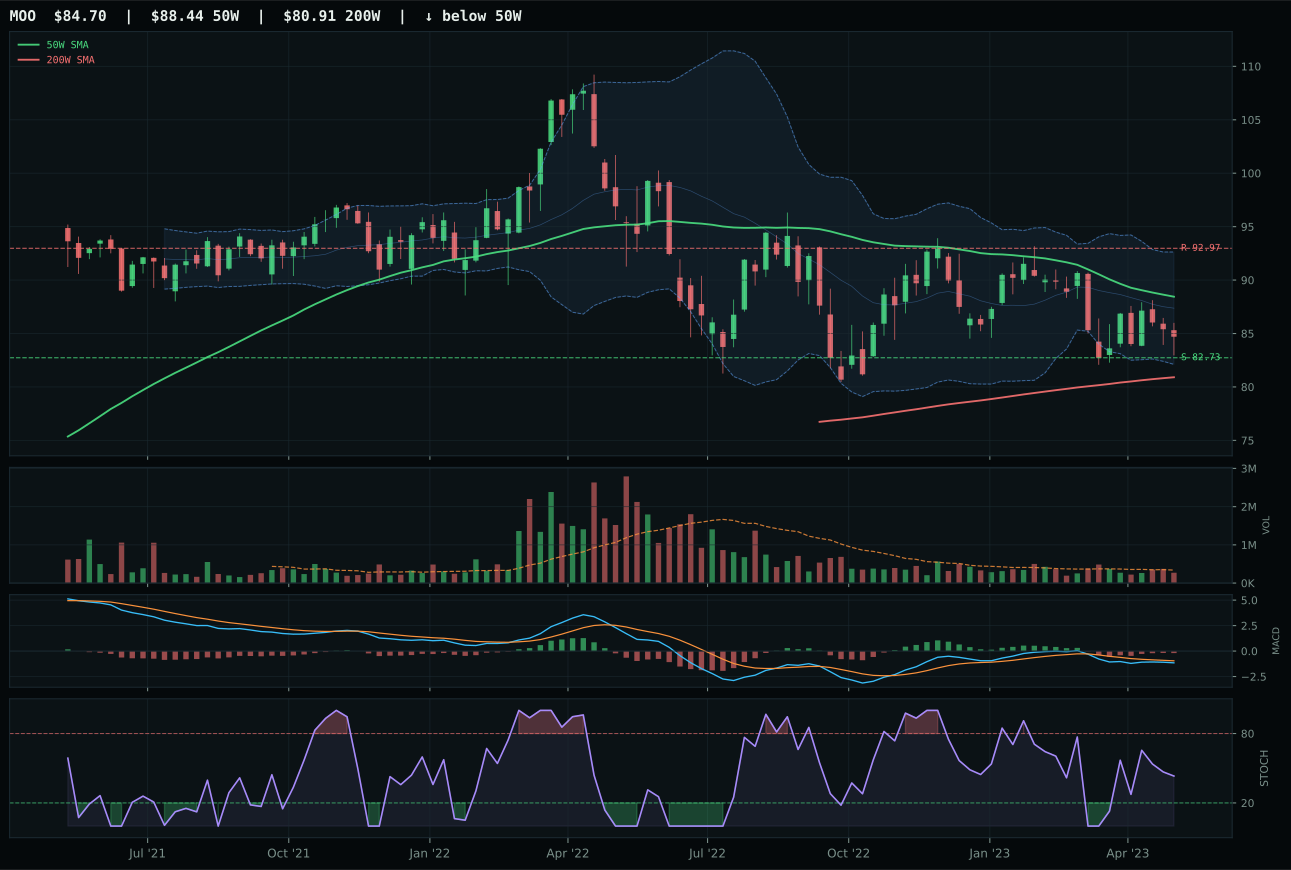
MOO has a pullback into support profile with -6.4% 13-week relative strength versus SPY.
A failed hold above support would weaken the setup.
Actionable but governed by invalidation levels.
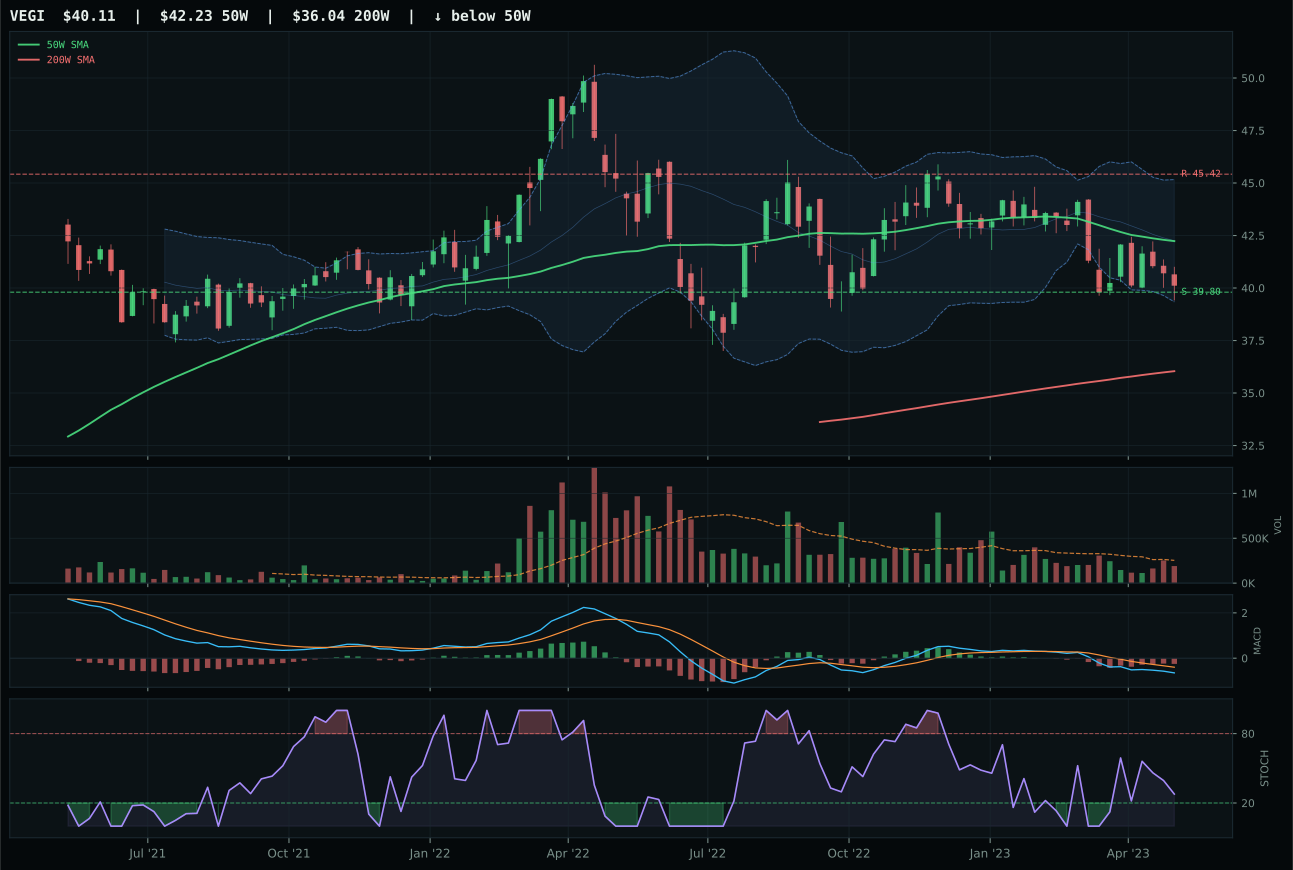
VEGI has a pullback into support profile with -7.5% 13-week relative strength versus SPY.
A failed hold above support would weaken the setup.
Actionable but governed by invalidation levels.
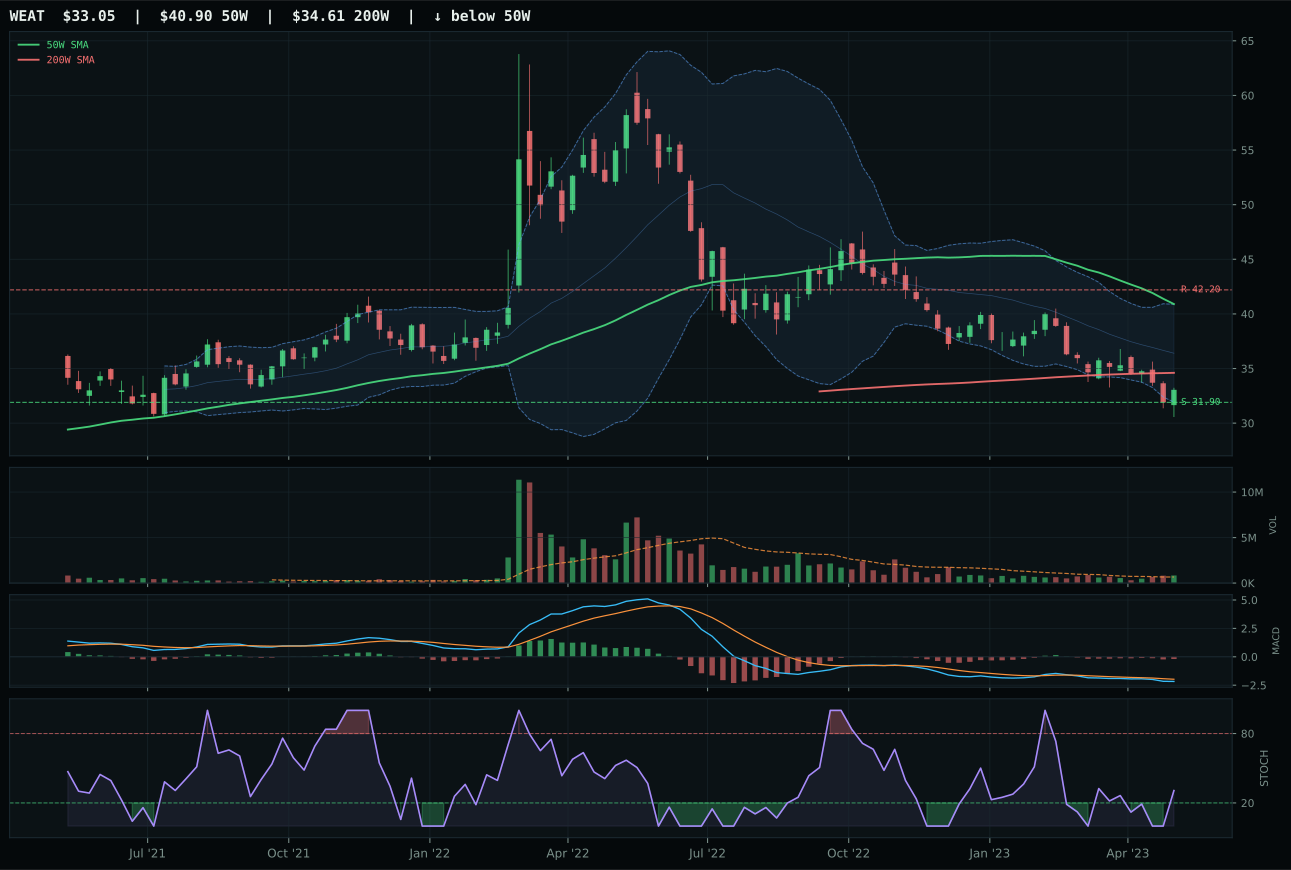
WEAT has a pullback into support profile with -14.1% 13-week relative strength versus SPY.
A failed hold above support would weaken the setup.
Actionable but governed by invalidation levels.
VEGI wins the Agriculture category with a 25.5 final score on the strength of a 98.0 risk/reward score—the highest in the category—paired with a pullback-into-support setup that provides defined invalidation. Price is −5.0% from the 50W, sitting near the 0.618 Fibonacci zone, and the 0.8% downside to the 39.80 support level creates asymmetry: the upside to 45.42 resistance is −11.7%, but the downside is nearly risk-free. VEGI's MACD is bearish but improving and stochastic RSI is falling/neutral at 0.28, classic early-reversal timing with a 92.0 timing score. MOO trails by just 1.6 points because its risk/reward is 90.0 versus VEGI's 98.0—a marginal difference in a category where both ETFs are essentially pullback bottoming trades waiting for volume confirmation.
Agriculture & Livestock is excluded entirely from the allocation this week, receiving 0%, because the 25.5 final score ranks it 9th or 10th among the 10 categories eligible for placement. Disinflation—the selected macro regime—actively hurts this category (−6), and the active disinflation pressure descriptor adds another −8, meaning the macro regime is genuinely hostile to real assets and agricultural exposure. Commodity breadth positive (+5) and real asset sponsorship (+8) are present but insufficient to overcome the headwind. VEGI's 52.3 technical evidence is respectable and the timing setup is clean, but the 47.0 macro/narrative fit shows that the category is fighting the regime. To earn a 5% tier-2 allocation next week, Agriculture would need either a macro shift away from disinflation (toward inflation or stagflation) or demonstrated relative strength leadership versus SPY; currently, −7.5% 13W return confirms the category is being sold, not accumulated, and no reversal pattern is strong enough to override the macro headwind.
Traditional Energy — XLE
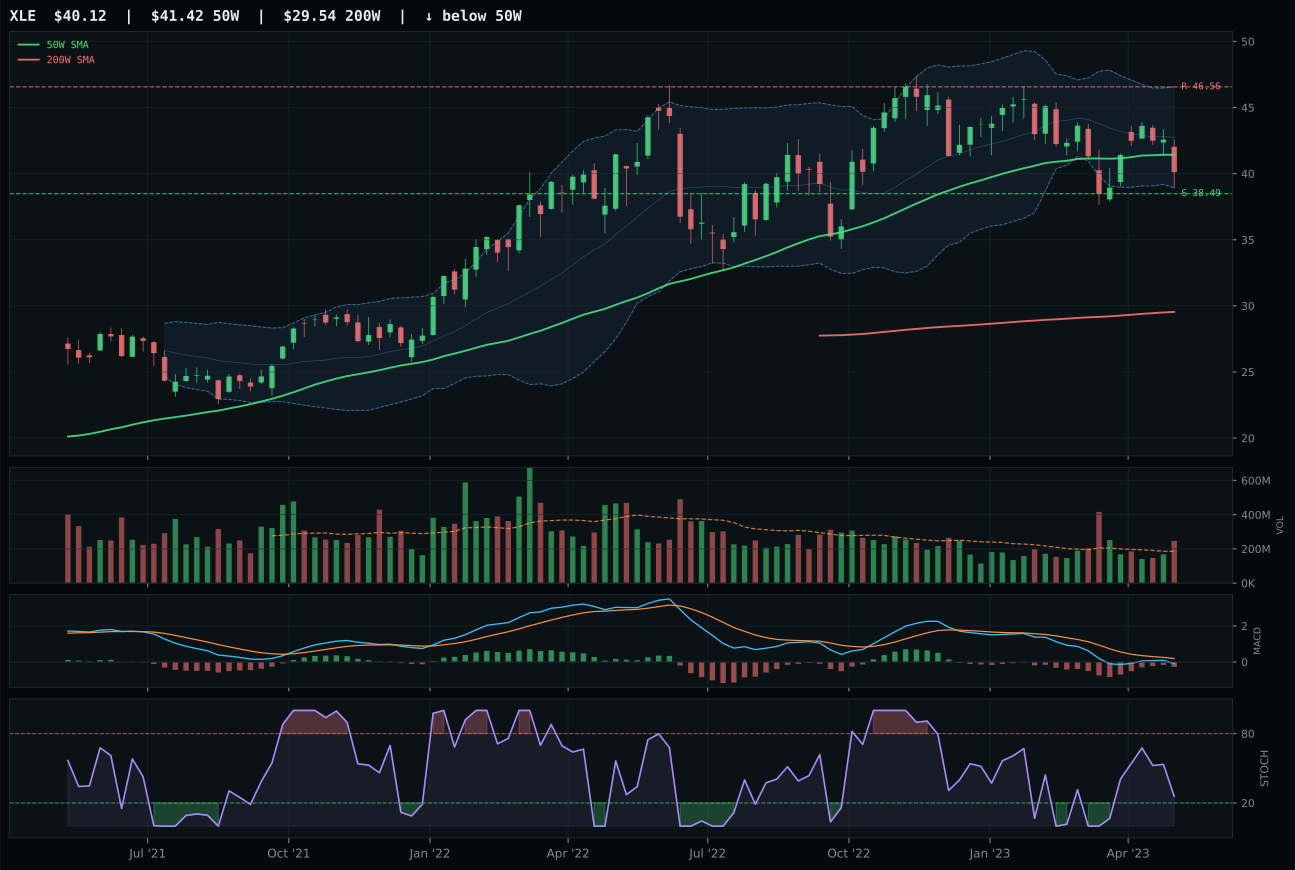
XLE has a pullback into support profile with -6.7% 13-week relative strength versus SPY.
A failed hold above support would weaken the setup.
Actionable but governed by invalidation levels.
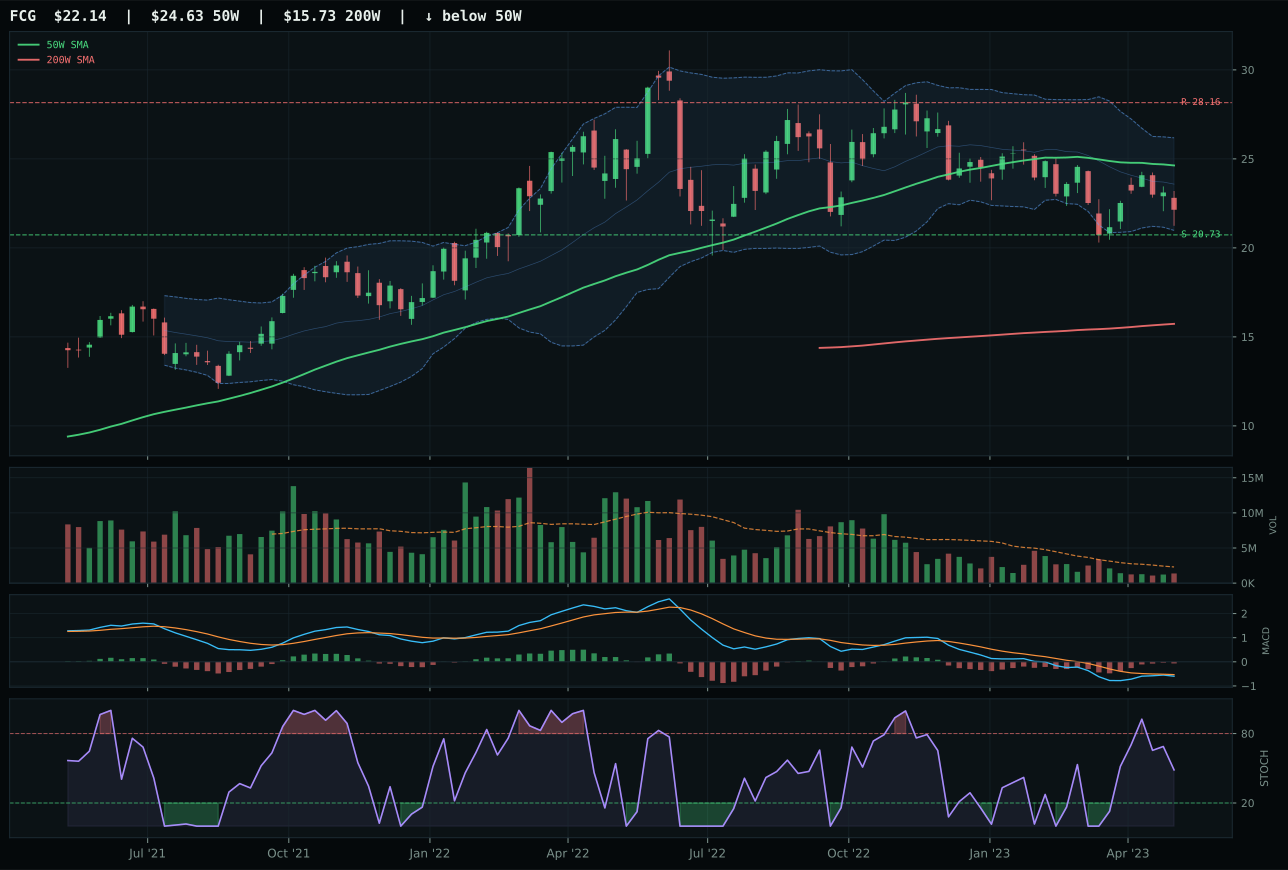
FCG has a neutral structure profile with -7.6% 13-week relative strength versus SPY.
A failed hold above support would weaken the setup.
Actionable but governed by invalidation levels.
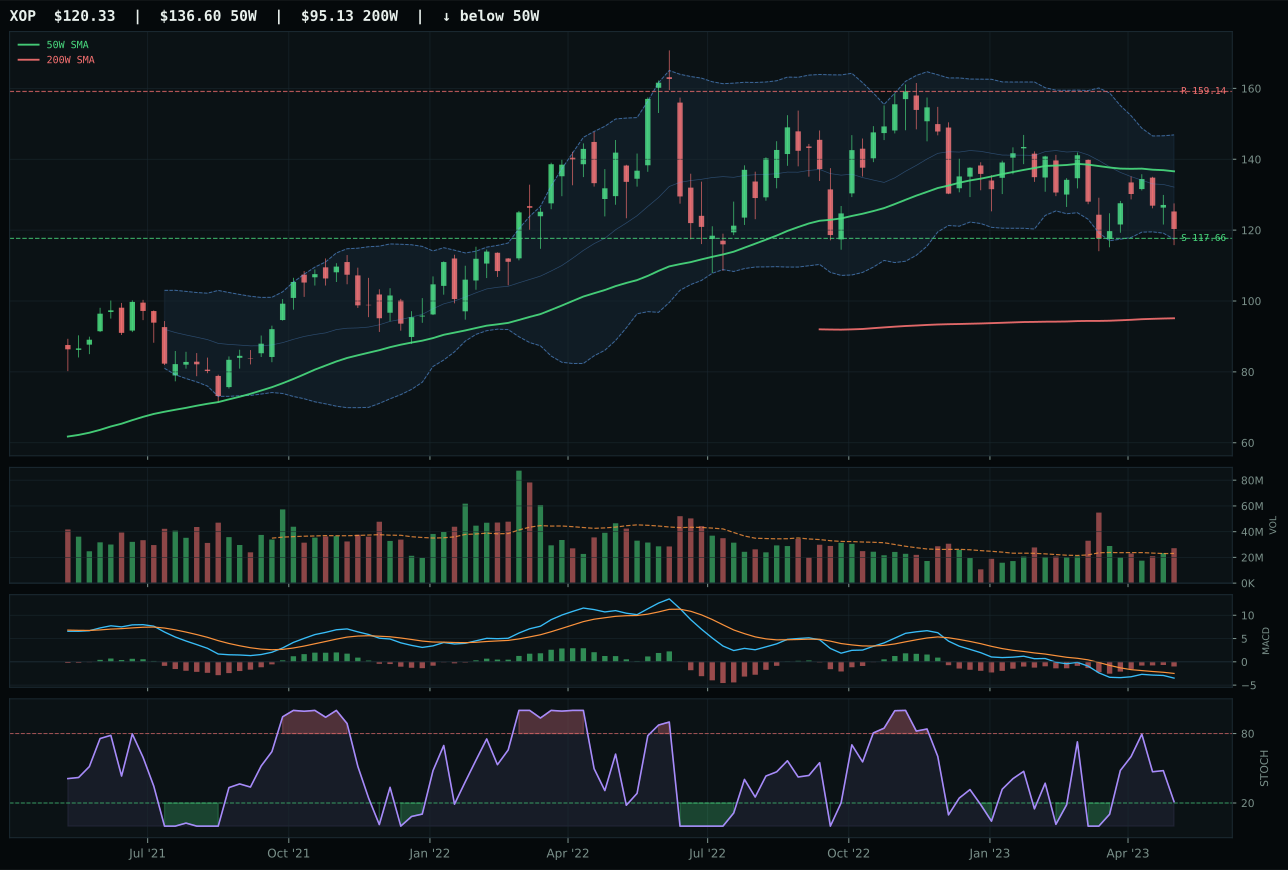
XOP has a pullback into support profile with -10.9% 13-week relative strength versus SPY.
A failed hold above support would weaken the setup.
Actionable but governed by invalidation levels.
XLE wins Traditional Energy with a 6.6 final score—the lowest in the portfolio—because the category is being actively suppressed by macro, yet XLE's chart offers the cleanest entry point among the three ETFs. Price sits −3.1% from the 50W in a pullback-into-support setup with perfect 100.0 timing score, MACD bearish but improving, and stochastic RSI falling/neutral at 0.26. The 98.0 risk/reward score reflects −13.9% upside to resistance and only 4.2% downside to support, a setup with high conviction on the downside. XLE's 1.33x above-average volume participation at an oversold moment suggests accumulation is beginning, even as 13W momentum shows −6.7% trailing SPY. FCG trails by 23.1 points because its structure is less clean, timing is weaker (55.0 vs 100.0), volume is thin participation, and relative strength is zero.
Traditional Energy is excluded entirely from the allocation this week, receiving 0%, because the 6.6 final score ranks it last or second-to-last among all 10 categories. The disinflation macro regime actively hurts energy (−10), and the active disinflation pressure descriptor compounds the damage (−10). Only real asset sponsorship (+7) provides offset, but it is overwhelmed by the regime headwind. XLE's 54.5 technical evidence is respectable—the chart does show early-reversal setup potential—but the 47.0 macro/narrative fit reveals that oversold technicals cannot overcome a macro regime that is explicitly hostile to fossil fuel demand. Energy would need either a macro pivot toward inflation or stagflation, or a demonstrated break in the −6.7% 13W relative weakness trend, to earn a tier-2 slot. At present, 0% is correct because the portfolio is rotating away from commodities into monetary hedges (GLD) and real-asset inflation plays (metals, infrastructure); energy's pullback setup will only become interesting if disinflation reverses.