
2023-04-28
Informational purposes only. The content in this report, including allocations, analysis, and commentary, is provided solely for informational and educational purposes. It does not constitute financial advice, investment advice, trading advice, or any other type of advice. Past performance does not guarantee future results. Always conduct your own research and consult a qualified financial professional before making investment decisions.
Weekly Allocation
| Ticker | Category | Weight | Role |
|---|---|---|---|
| FBTC | 50% | Overlay | |
| GLD | Precious Metals | 10% | Top-2 (10%) |
| IGF | Utilities & Infrastructure | 10% | Top-2 (10%) |
| XLK | Technology | 5% | Tier-2 (5%) |
| COPX | Industrial Metals | 5% | Tier-2 (5%) |
| ITA | Defense & Aerospace | 5% | Tier-2 (5%) |
| URA | Nuclear Energy | 5% | Tier-2 (5%) |
| BOTZ | AI | 5% | Tier-2 (5%) |
| ILF | Emerging Markets | 5% | Tier-2 (5%) |
Trade Instructions — Monday Open
Sell the tranche from 2023-03-31 (completing its 4-week hold). Buy the new tranche. Instructions show net portfolio changes — same-asset positions cancel, weight changes show the delta.
| Action | Ticker | Instruction |
|---|---|---|
| SELL | XLK | Sell 50% of XLK position (reduce 2.50% → 1.25%) |
| SELL | SMH | Sell 67% of SMH position (reduce 3.75% → 1.25%) |
| SELL | IEMG | Sell 50% of IEMG position (reduce 2.50% → 1.25%) |
| SELL | XLU | Sell 33% of XLU position (reduce 3.75% → 2.50%) |
| BUY | GLD | Buy GLD — 20.00% of freed cash (adds 1.25% to portfolio) |
| BUY | BOTZ | Buy BOTZ — 20.00% of freed cash (adds 1.25% to portfolio) |
| BUY | IGF | Buy IGF — 40.00% of freed cash (adds 2.50% to portfolio) |
| BUY | ILF | Buy ILF — 20.00% of freed cash (adds 1.25% to portfolio) |
Current Portfolio After Trade
Combined holdings across all 4 active tranches. Each tranche is 25% of the portfolio.
| Ticker | % of Portfolio | Weight Bar |
|---|---|---|
| FBTC | 50.00% | |
| GLD | 10.00% | |
| IGV | 7.50% | |
| COPX | 5.00% | |
| ITA | 5.00% | |
| URA | 5.00% | |
| BOTZ | 3.75% | |
| IGF | 3.75% | |
| XLU | 2.50% | |
| VEGI | 2.50% | |
| SMH | 1.25% | |
| IEMG | 1.25% | |
| XLK | 1.25% | |
| ILF | 1.25% |
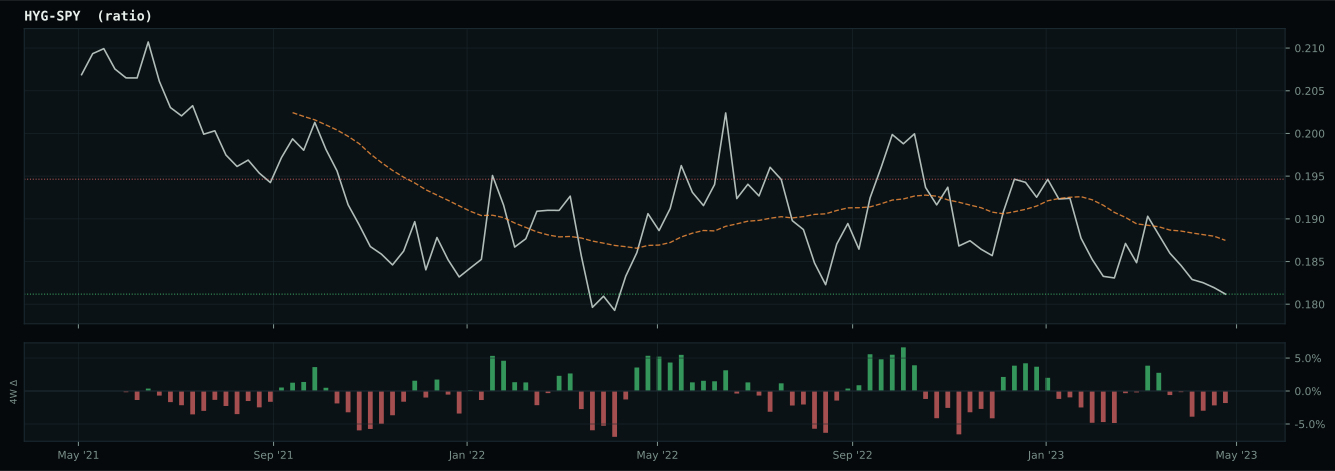
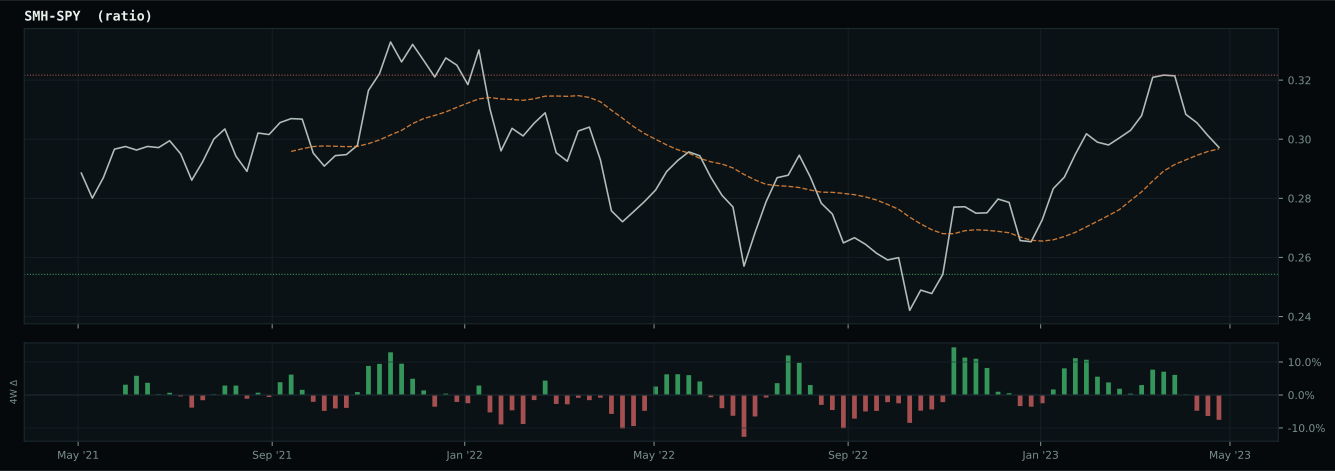
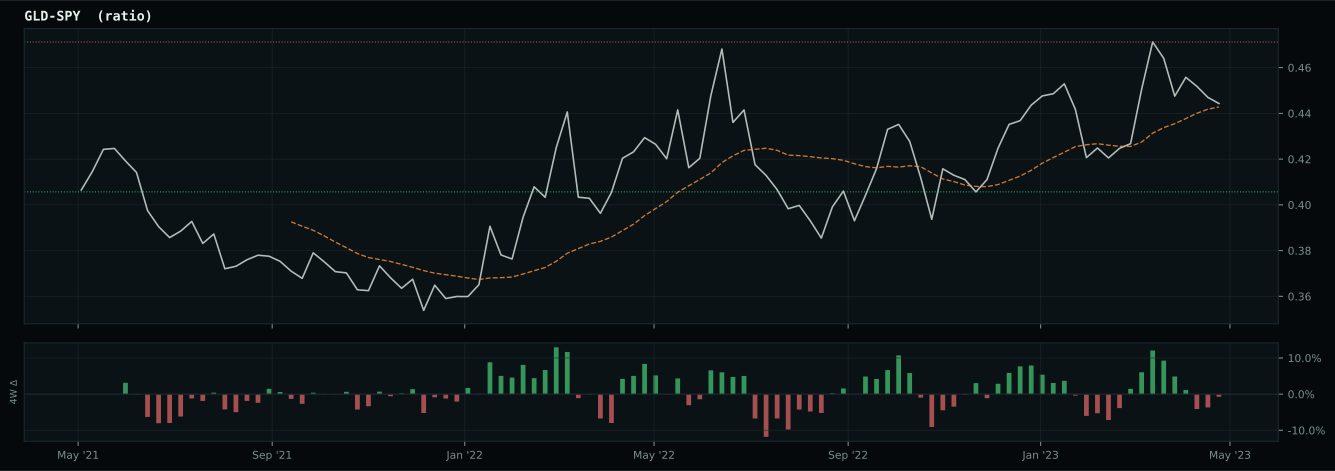
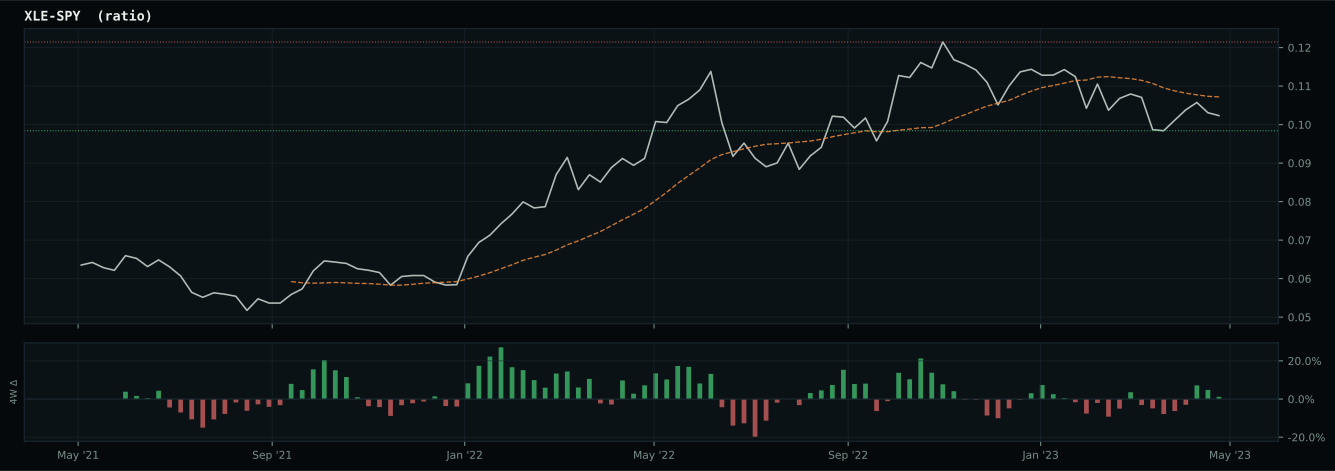
Macro Regime — Disinflation
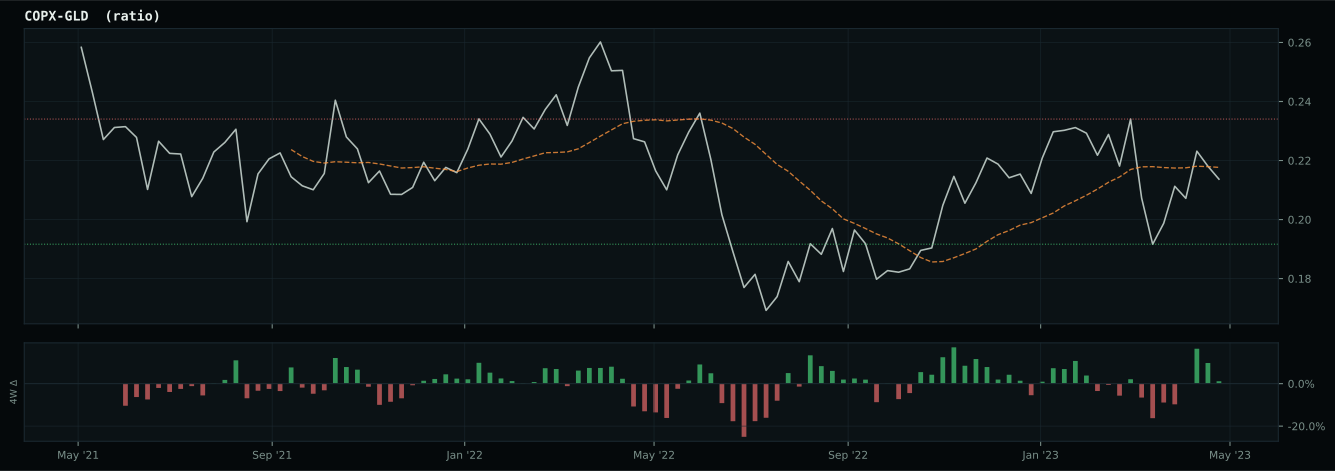
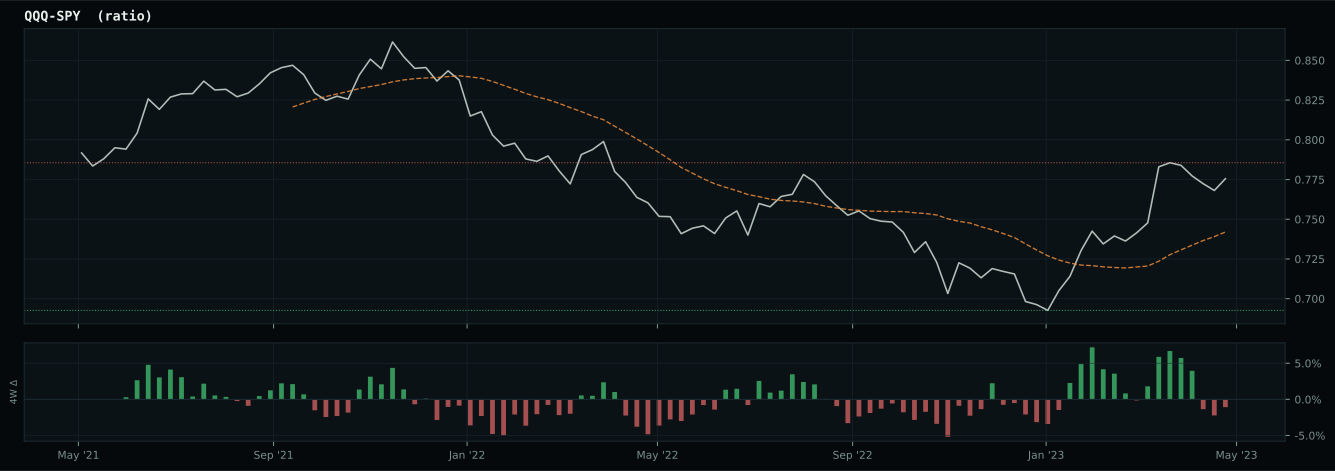
Macro Evidence Charts
Market-implied signals behind the macro regime scores. Each ratio compares two assets; the direction and slope of the ratio is what the macro engine reads.
Crypto Regime — ValueBTC
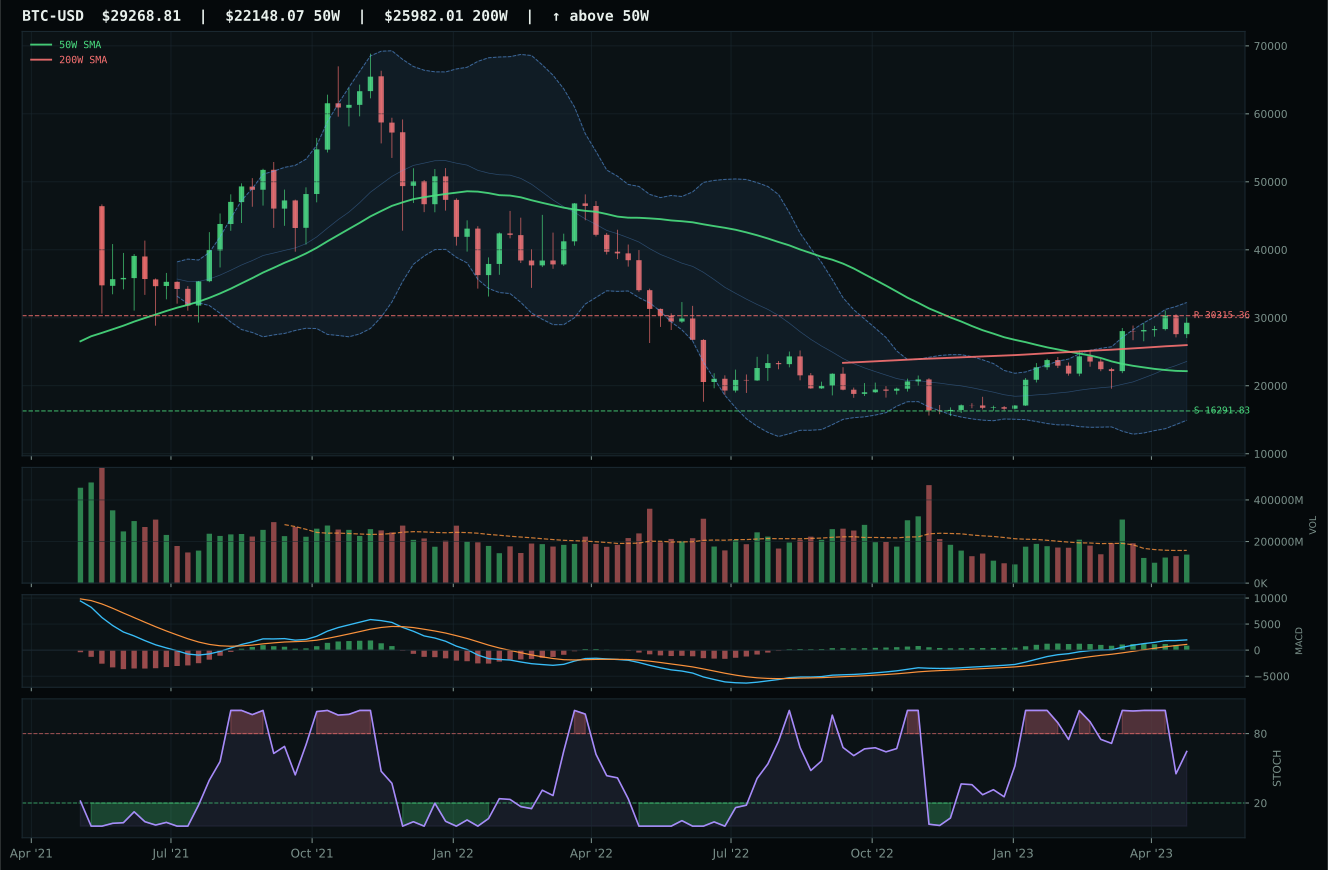
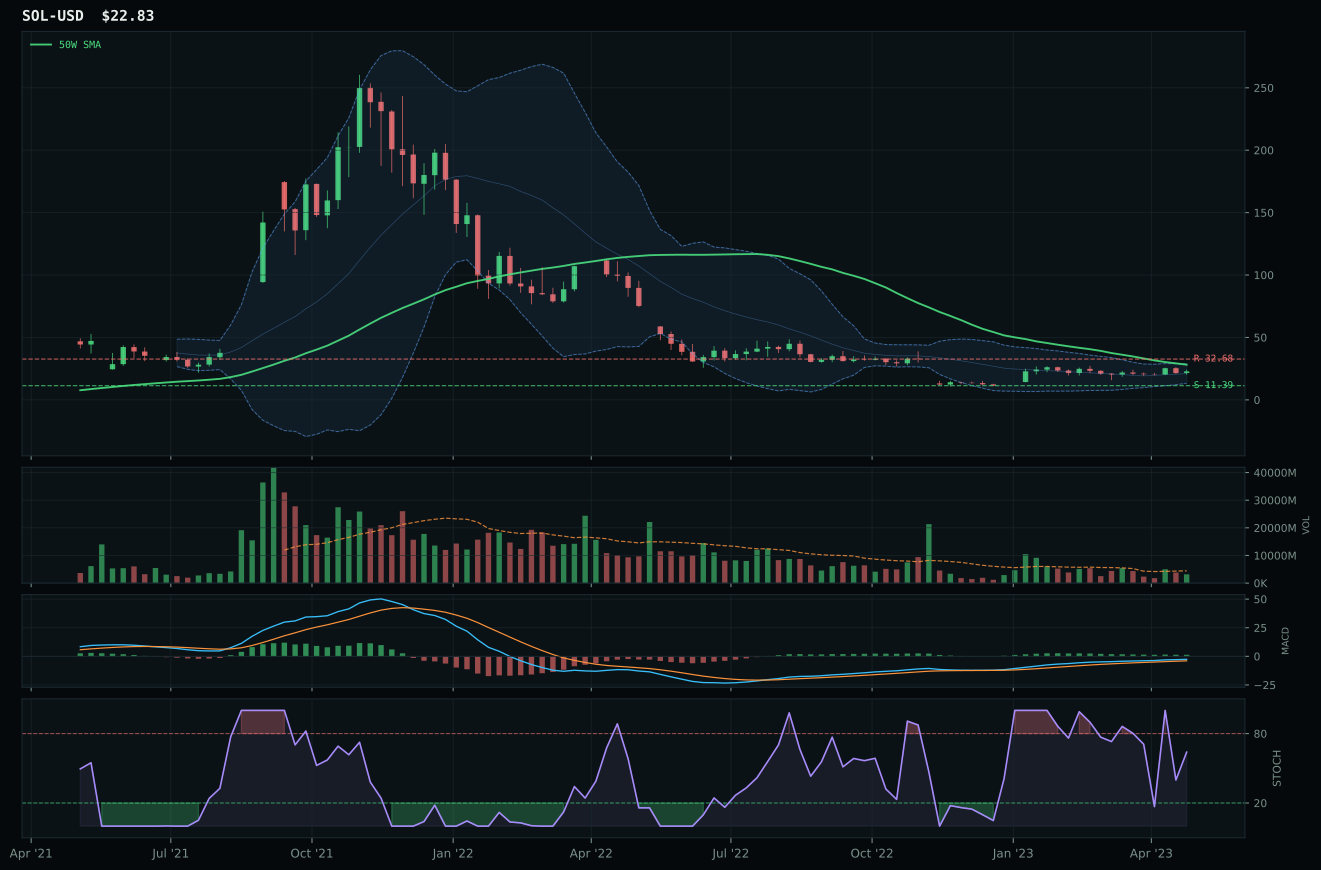
post-touch structure is too wide to count as a range; max/min close ratio is 1.86
TrendBTC not confirmed
one or more available conditions failed
Category Rankings
| Rank | Category | Winner | Score | Alloc | 4W Ret | Peers (4W) |
|---|---|---|---|---|---|---|
| 1 | Precious Metals | GLD | 55.4 | 20% | -2.33% | SLV -10.3% · GDX -10.8% |
| 2 | Utilities & Infrastructure | IGF | 52.2 | 20% | -5.23% | XLU -6.0% · PAVE +1.3% |
| 3 | Technology | XLK | 50.3 | 10% | +10.94% | IGV +11.3% · CIBR +11.6% |
| 4 | Industrial Metals | COPX | 47.5 | 10% | -11.36% | REMX +2.1% · PICK -6.6% |
| 5 | Defense & Aerospace | ITA | 43.0 | 10% | -3.55% | XAR -2.2% · ROKT +0.5% |
| 6 | Nuclear Energy | URA | 37.3 | 10% | -1.80% | URNM -3.5% · NLR -4.2% |
| 7 | AI | BOTZ | 32.6 | 10% | +11.09% | SMH +21.5% · AIQ +10.9% |
| 8 | Emerging Markets | ILF | 26.0 | 10% | +3.09% | INDA +2.1% · IEMG -0.1% |
| 9 | Agriculture & Livestock | VEGI | 24.8 | 0% | -6.64% | MOO -7.3% · WEAT -3.3% |
| 10 | Traditional Energy | XLE | 8.4 | 0% | -7.92% | FCG -4.1% · XOP -4.0% |
Precious Metals — GLD
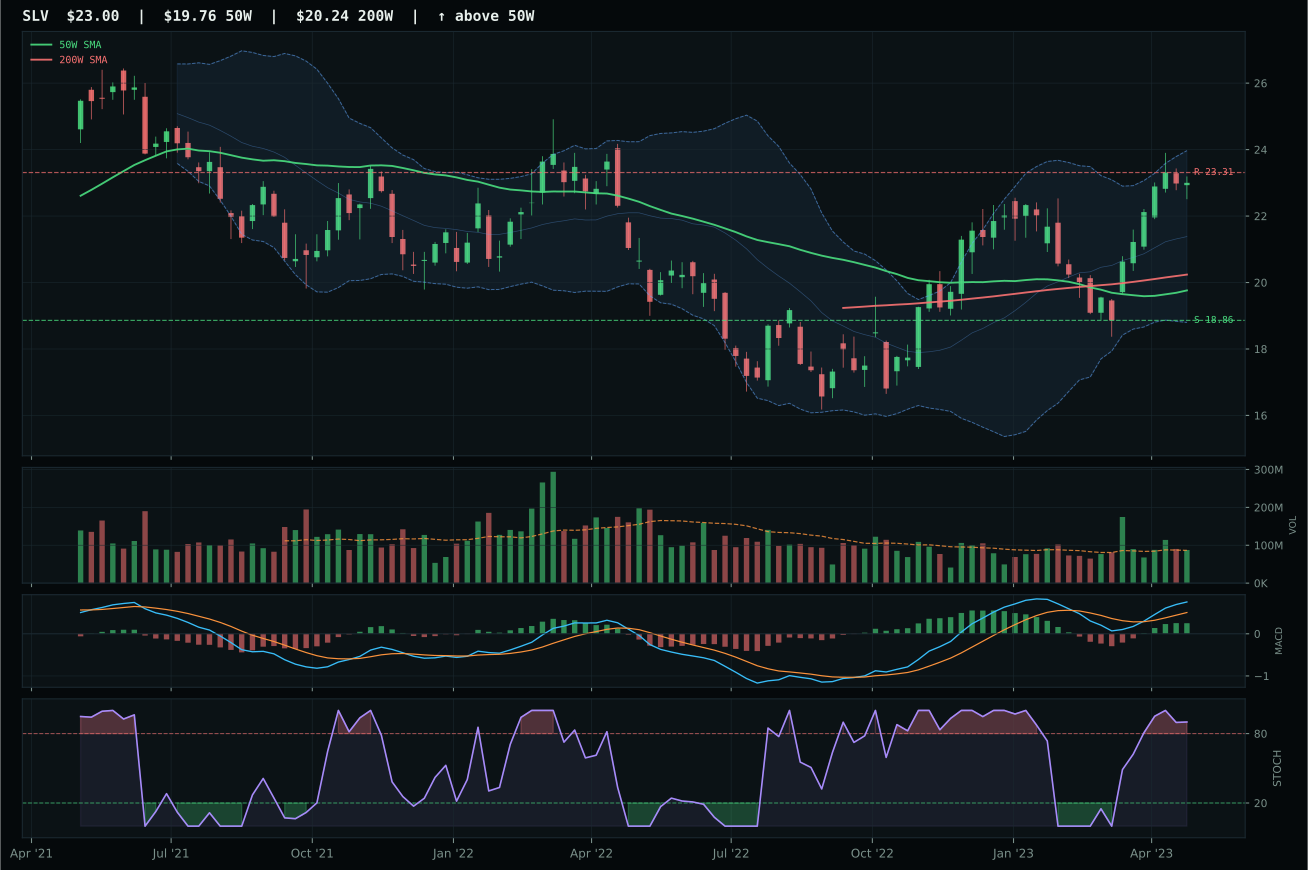
SLV has a vertical extension profile with 3.6% 13-week relative strength versus SPY.
A failed hold above support would weaken the setup.
Actionable but governed by invalidation levels.
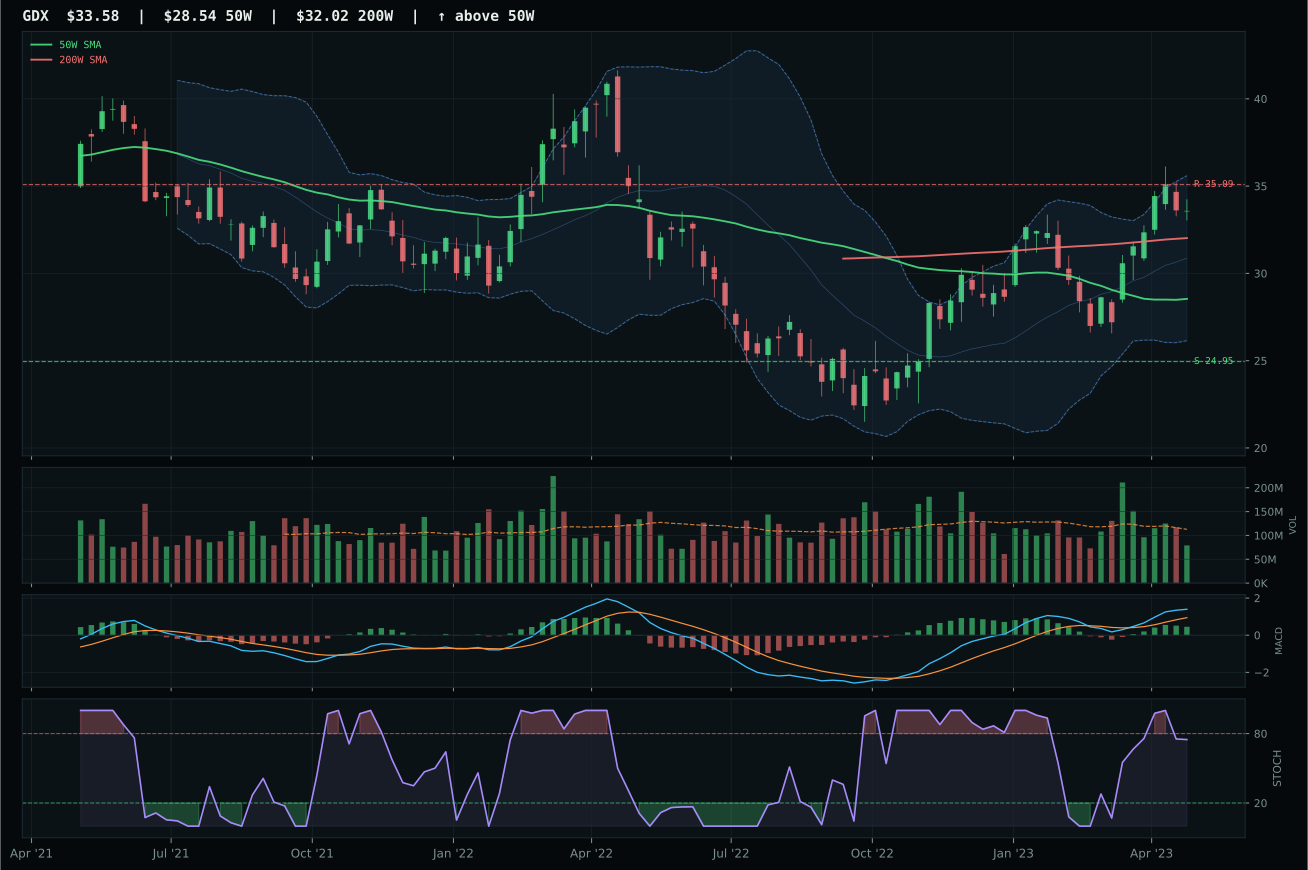
GDX has a vertical extension profile with 1.4% 13-week relative strength versus SPY.
A failed hold above support would weaken the setup.
Actionable but governed by invalidation levels.
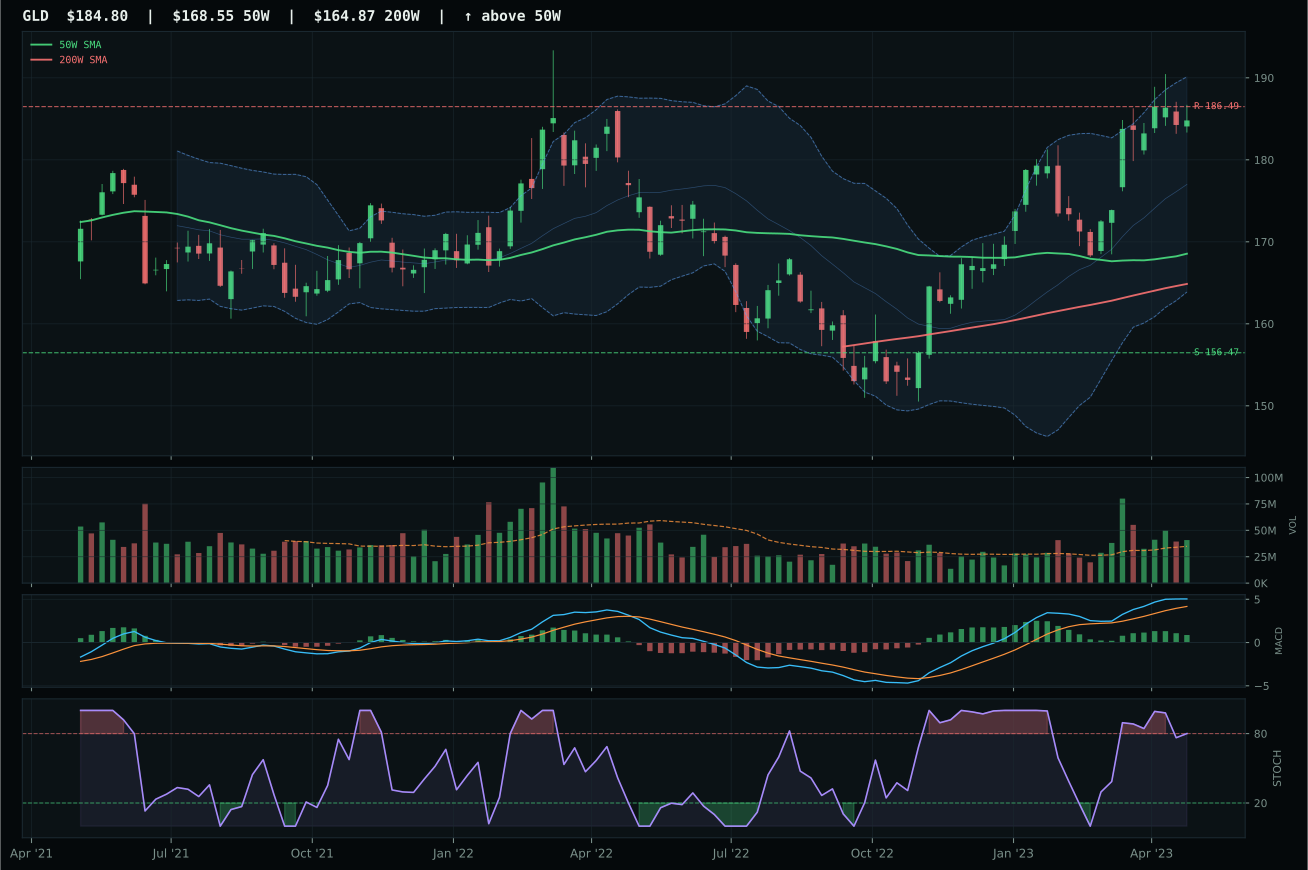
GLD has a neutral structure profile with 0.6% 13-week relative strength versus SPY.
A failed hold above support would weaken the setup.
Actionable but governed by invalidation levels.
GLD wins the precious metals category and earns top-2 recognition by combining the strongest technical foundation (trend 96.9/100, structure 73.2) with the only above-average volume confirmation in the basket at 1.17x the 20W average. Price sits 9.6% above the 50W with MACD bullish but flattening and stochastic RSI overbought at 0.80—textbook late-stage strength. What distinguishes GLD from runner-up SLV is not momentum (both are overbought) but the quality of sponsorship: GLD's above-average volume says institutions are still accumulating, while SLV's neutral volume combined with vertical extension (16.4% from the 50W) and weak MACD (bullish and improving but stretched) signals top-of-range speculation. The 0.6% SPY-relative strength is modest, but it is positive versus SLV's 3.6%, and in a late-bull setup that modesty is credibility.
Precious Metals is allocated 10%, joining GLD as a top-2 overweight category with a final score of 55.4. The sector's macro fit of 64.0/100 is the highest in the portfolio: disinflation helps this exposure by 8 basis points and disinflation pressure active adds 6 more, because falling nominal growth and real yields make gold's zero-yield carry more attractive and restore its monetary hedge role. Liquidity stress subtracts 5 but is overwhelmed by the structural disinflation support. The reasoned ETF proof order placed GDX first and SLV second based on technical evidence, but the category representative selected GLD because it holds the trend with institutional volume confirmation. This is a calculated bet that disinflation persists, credit stress does not spiral, and central banks remain accommodative—a risk-on positioning within a defensive-looking allocation. If credit stress accelerates sharply or real yields spike, GLD will hold, but the top-2 ranking assumes the disinflation regime holds.
Utilities & Infrastructure — IGF
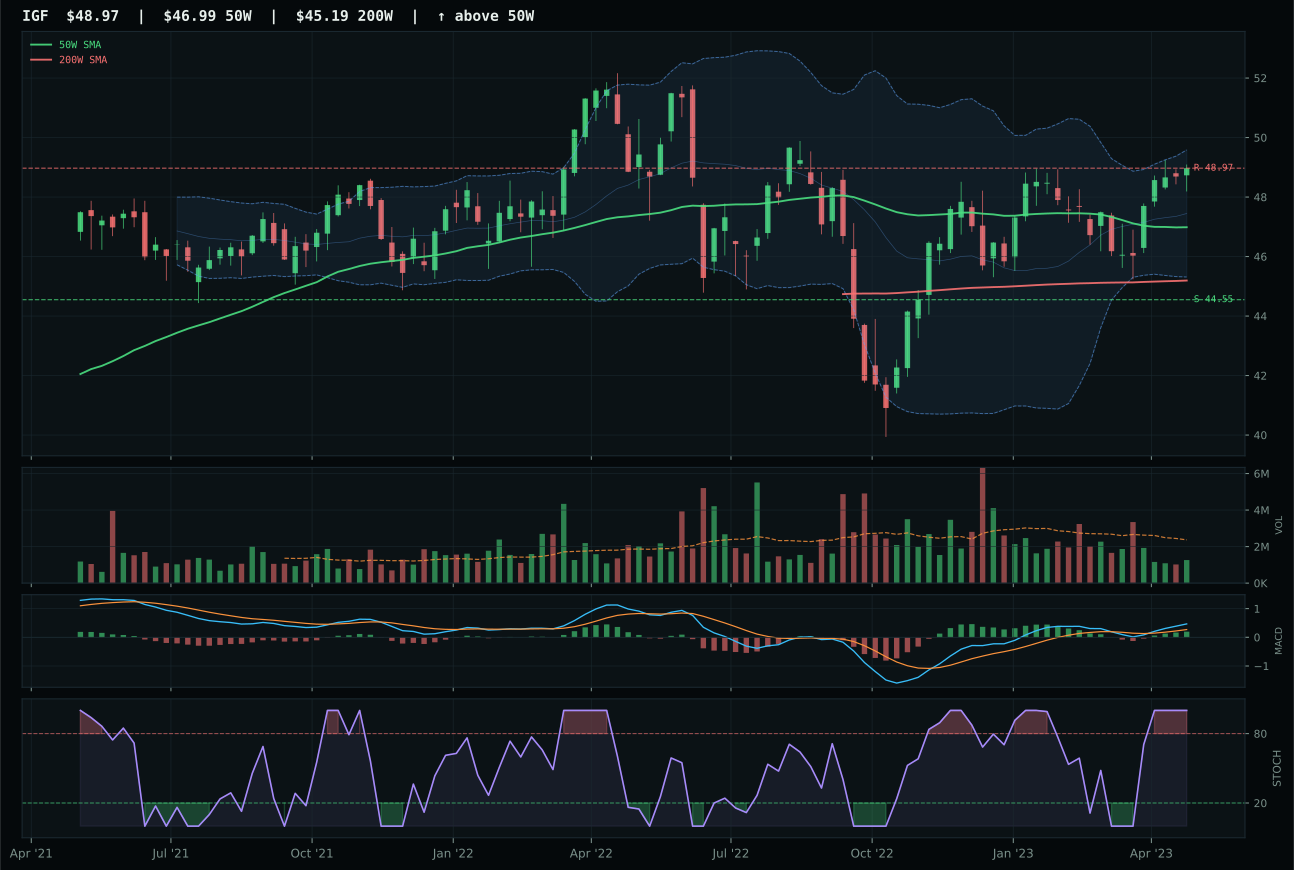
IGF has a neutral structure profile with -1.5% 13-week relative strength versus SPY.
A failed hold above support would weaken the setup.
Actionable but governed by invalidation levels.
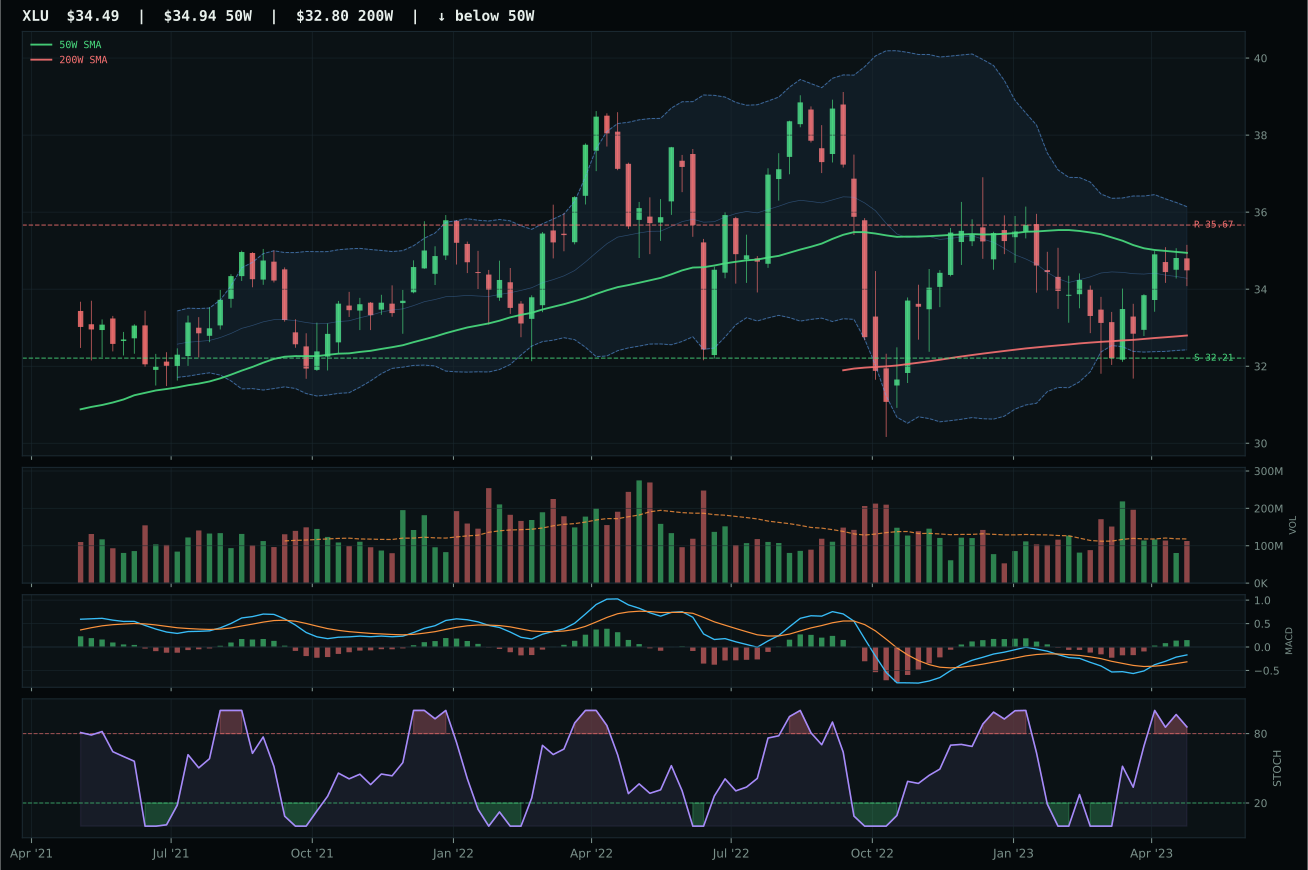
XLU has a compression near 50W profile with -2.4% 13-week relative strength versus SPY.
A failed hold above support would weaken the setup.
Actionable but governed by invalidation levels.
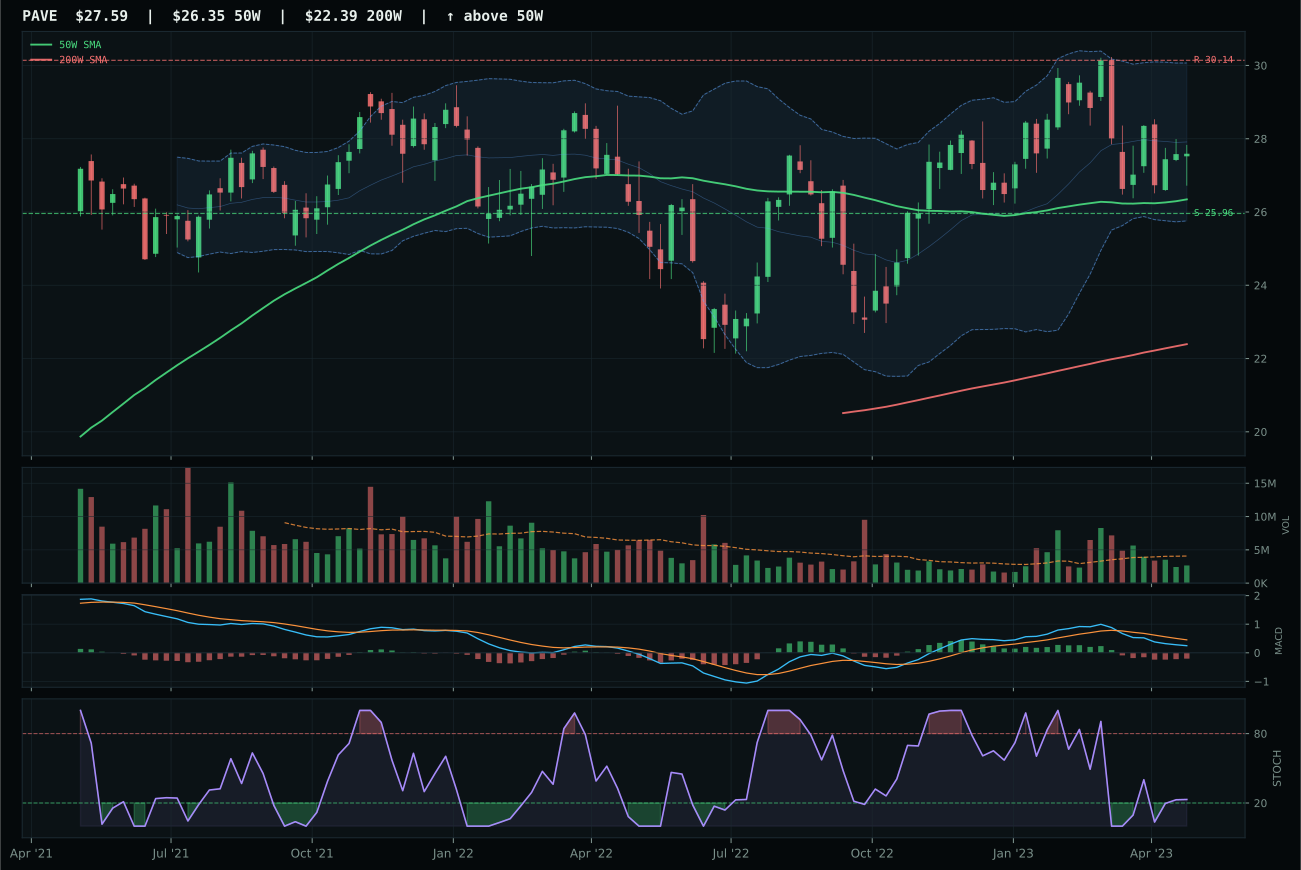
PAVE has a neutral structure profile with -5.8% 13-week relative strength versus SPY.
A failed hold above support would weaken the setup.
Actionable but governed by invalidation levels.
IGF wins the utilities category and earns top-2 recognition by combining near-perfect trend (97.7/100) with best-in-category timing (90.0/100) and superior structure at 74.1 versus XLU's 69.3. Price is only 4.2% above the 50W with a flat 0.0% slope and MACD bullish and improving, signaling early-stage strength rather than late-cycle extension. Stochastic RSI sits at maximum overbought (1.00), but the flat slope and improving MACD prevent this from being topping action. What separates IGF from XLU is category-relative strength of 0.9% versus 0.0%, a marginal difference that reflects IGF's global infrastructure exposure capturing geopolitical and climate infrastructure allocation that domestic utilities (XLU) do not. Thin volume at 0.53x the 20W average is a weakness both share, but IGF's 1.0% 13-week return proves institutions are not exiting.
Utilities & Infrastructure is allocated 10%, tying precious metals as a top-2 overweight category with a final score of 52.2. The sector's macro fit is strong at 64.0/100: disinflation helps this exposure by 7 basis points and disinflation pressure active adds 6, because falling nominal rates compress required returns on regulated, utility-like cash flows while climate infrastructure spending is a secular countercyclical lever. Liquidity stress subtracts 3, a minimal headwind. IGF's composition as global infrastructure income (toll roads, pipelines, airports) rather than domestic utilities makes it the institutional vehicle because it captures energy transition CapEx and demographic infrastructure needs across developed and emerging markets. This is the portfolio's most defensive top-2 allocation: it does not require corporate margin expansion or multiple expansion, only rate stability and the continuation of ESG-driven capital flows. The allocation assumes disinflation persists, credit stress does not spiral, and central banks remain patient.
Technology — XLK
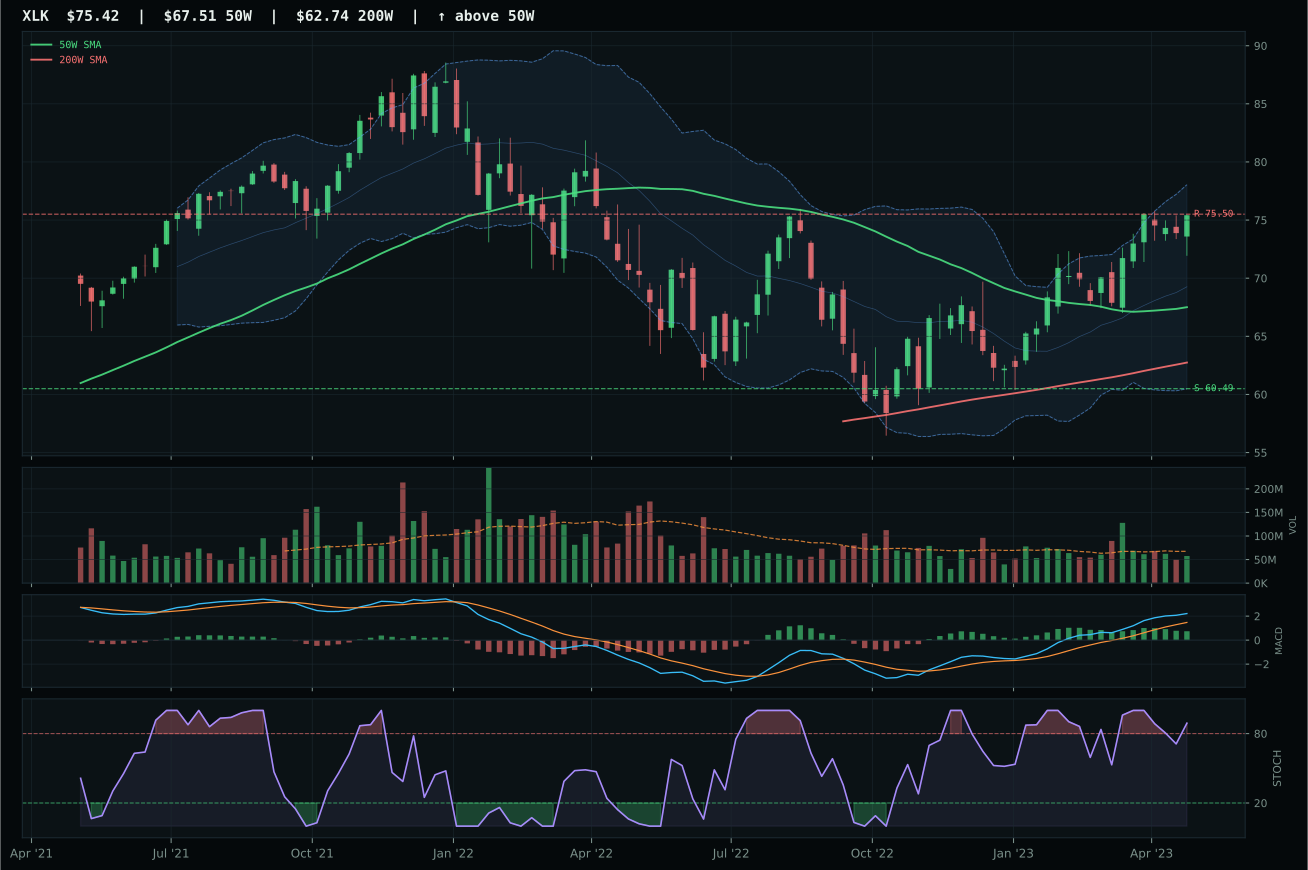
XLK has a neutral structure profile with 7.8% 13-week relative strength versus SPY.
A failed hold above support would weaken the setup.
Actionable but governed by invalidation levels.
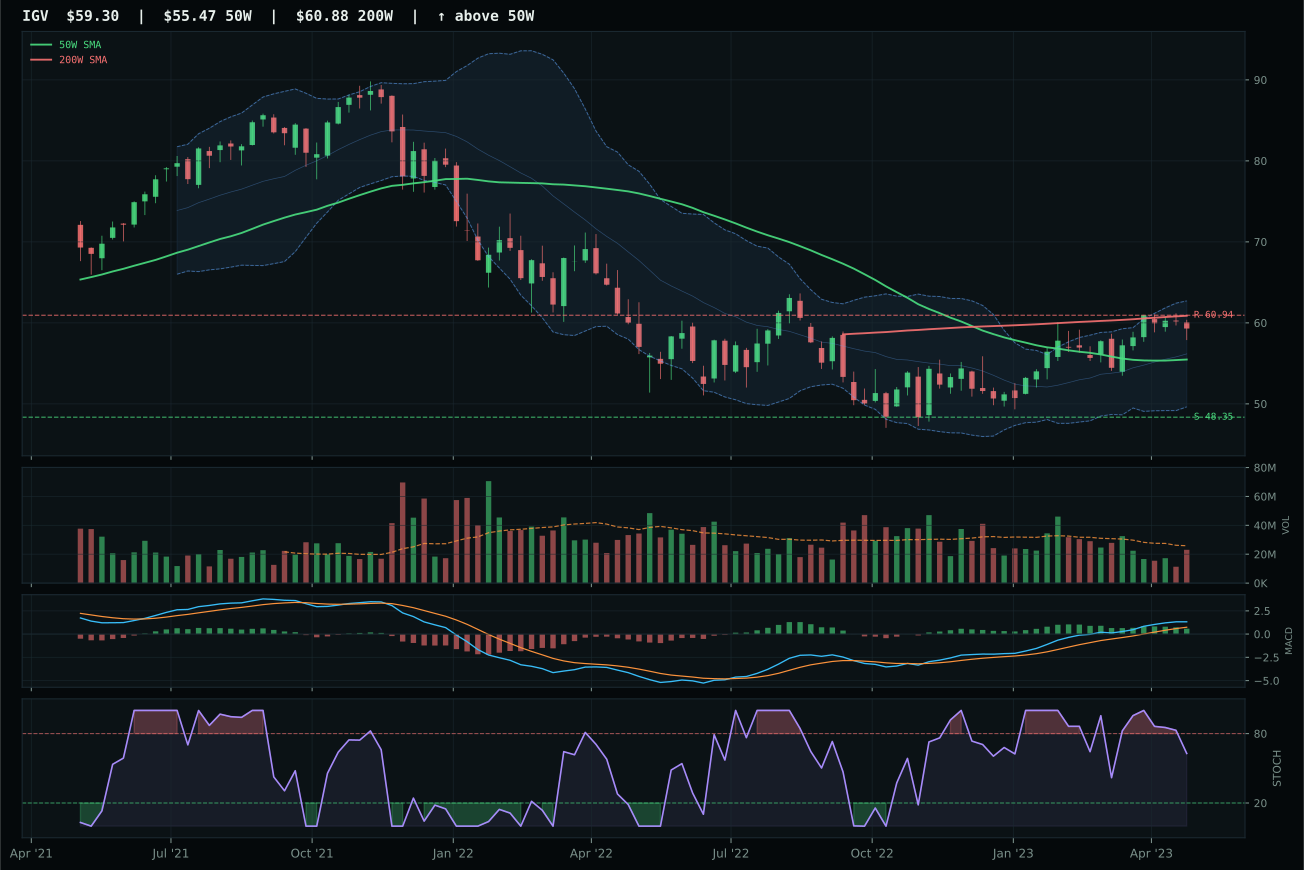
IGV has a neutral structure profile with 2.5% 13-week relative strength versus SPY.
A failed hold above support would weaken the setup.
Actionable but governed by invalidation levels.
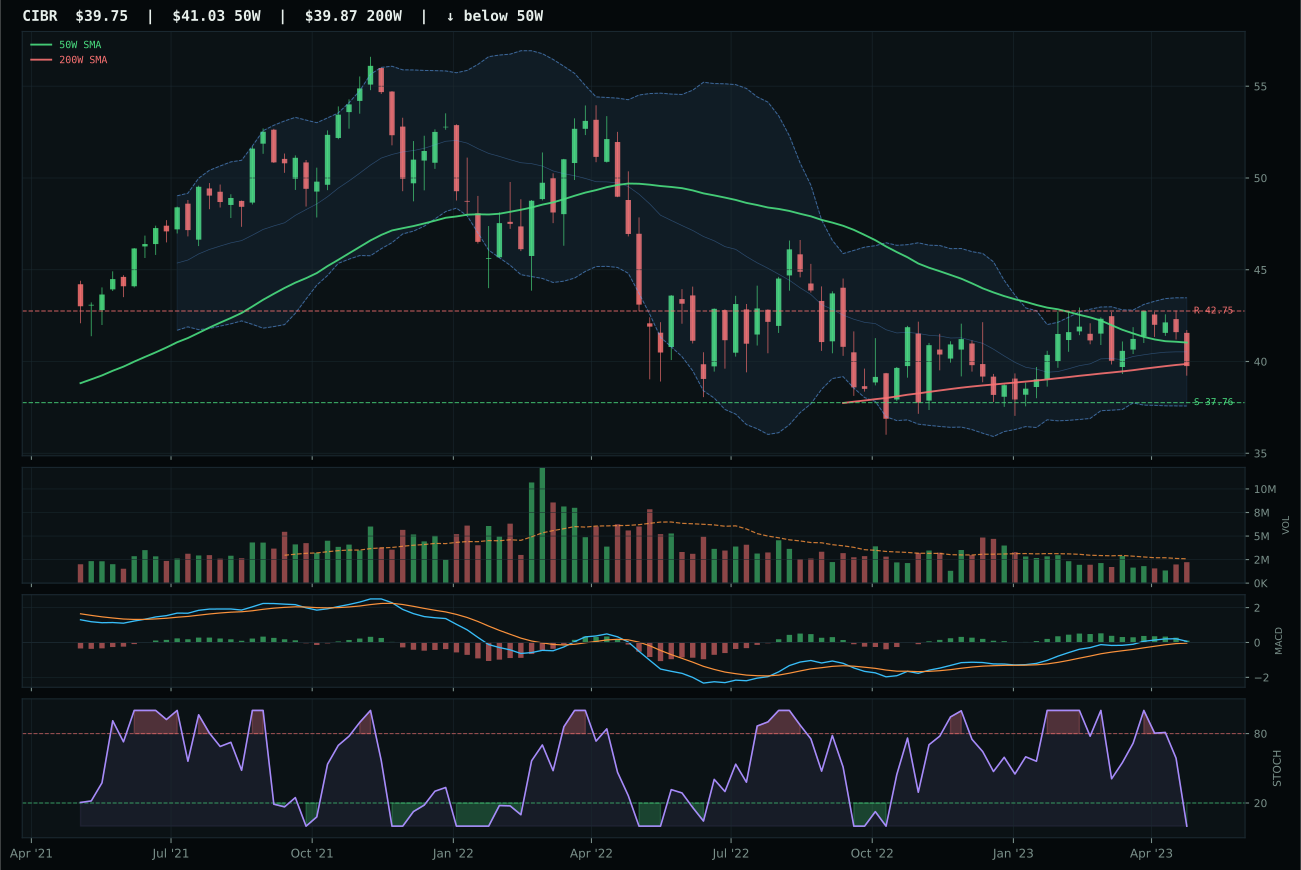
CIBR has a neutral structure profile with -4.0% 13-week relative strength versus SPY.
A failed hold above support would weaken the setup.
Actionable but governed by invalidation levels.
XLK wins because it holds the trend—price above both the 50W and 200W with a flat 0.2% slope—and backs that up with 7.8% relative strength versus SPY and 5.3% category-relative strength that IGV cannot match. The 13-week return of 10.3% combined with neutral volume at 0.85x the 20W average suggests accumulation rather than capitulation, even as the stochastic RSI sits overbought at 0.89 and MACD flattens from bullish. Structure is clean enough at 68.8/100, and the 11.7% distance from the 50W puts price neither stale nor oversold. IGV stumbled on the exact same neutral structure but generated only 2.5% SPY-relative strength and 0.0% category-relative strength, revealing that when setups are identical, the winner is the one with proof of institutional accumulation.
Technology earns 5% allocation as a tier-2 category, ranked third through eighth among the ten. The final score of 50.3 reflects a technically sound but macro-constrained environment: XLK's trend is nearly perfect at 100/100, yet disinflation and active liquidity stress drag the category macro fit down to 45.0/100. Disinflation itself adds 7 basis points to category appeal, but liquidity stress subtracts 10 and credit stress subtracts 7, creating a headwind that prevents this category from competing with precious metals or infrastructure for top-2 standing. The portfolio needs Tech's productivity exposure, but at current technicals it does not deserve the growth capital that would elevate it into the 5% sleeve. This tier-2 holding acts as a defensive ballast—a place to park capital when momentum is proven but macro tailwinds are absent.
Industrial Metals — COPX
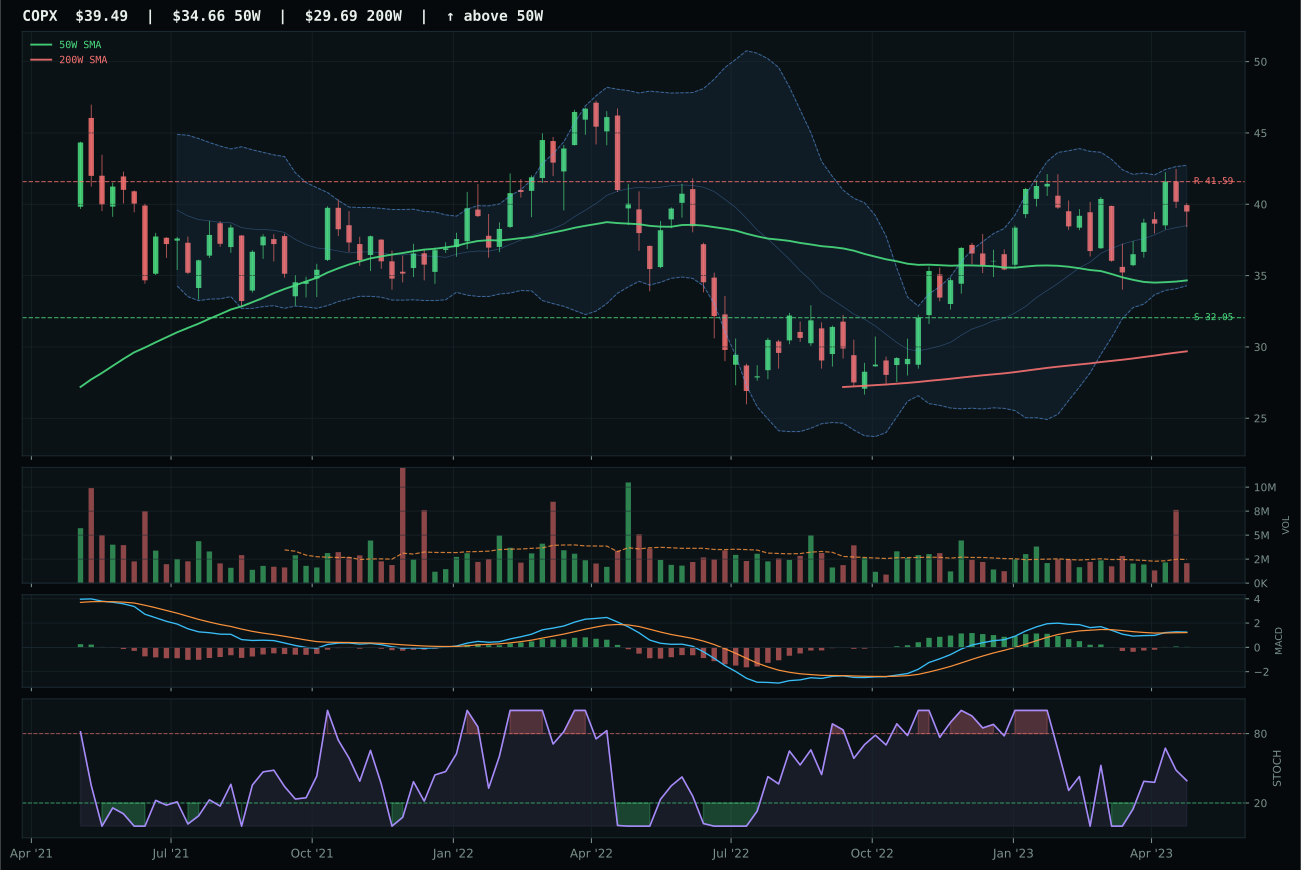
COPX has a neutral structure profile with -7.2% 13-week relative strength versus SPY.
A failed hold above support would weaken the setup.
Actionable but governed by invalidation levels.
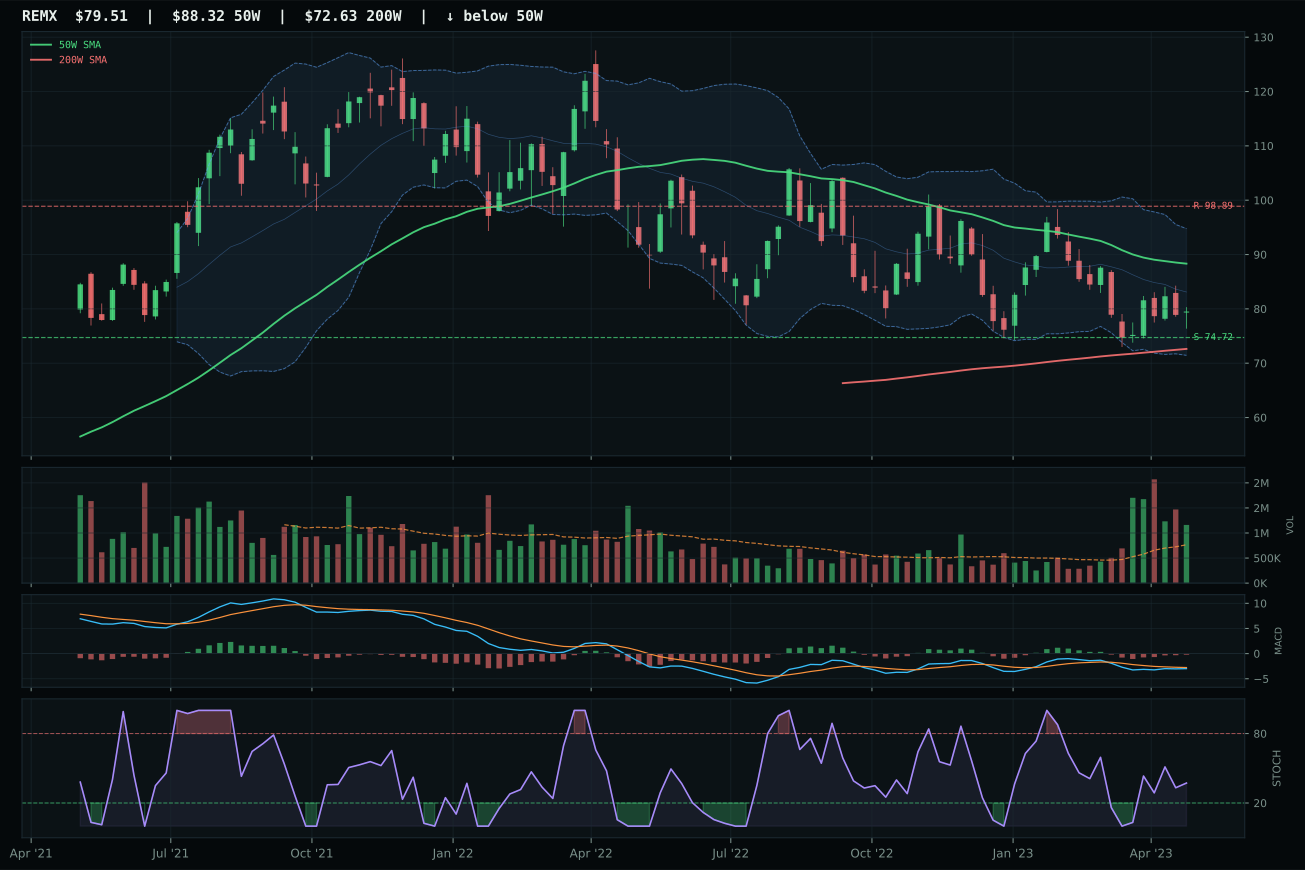
REMX has a neutral structure profile with -19.6% 13-week relative strength versus SPY.
A failed hold above support would weaken the setup.
Actionable but governed by invalidation levels.
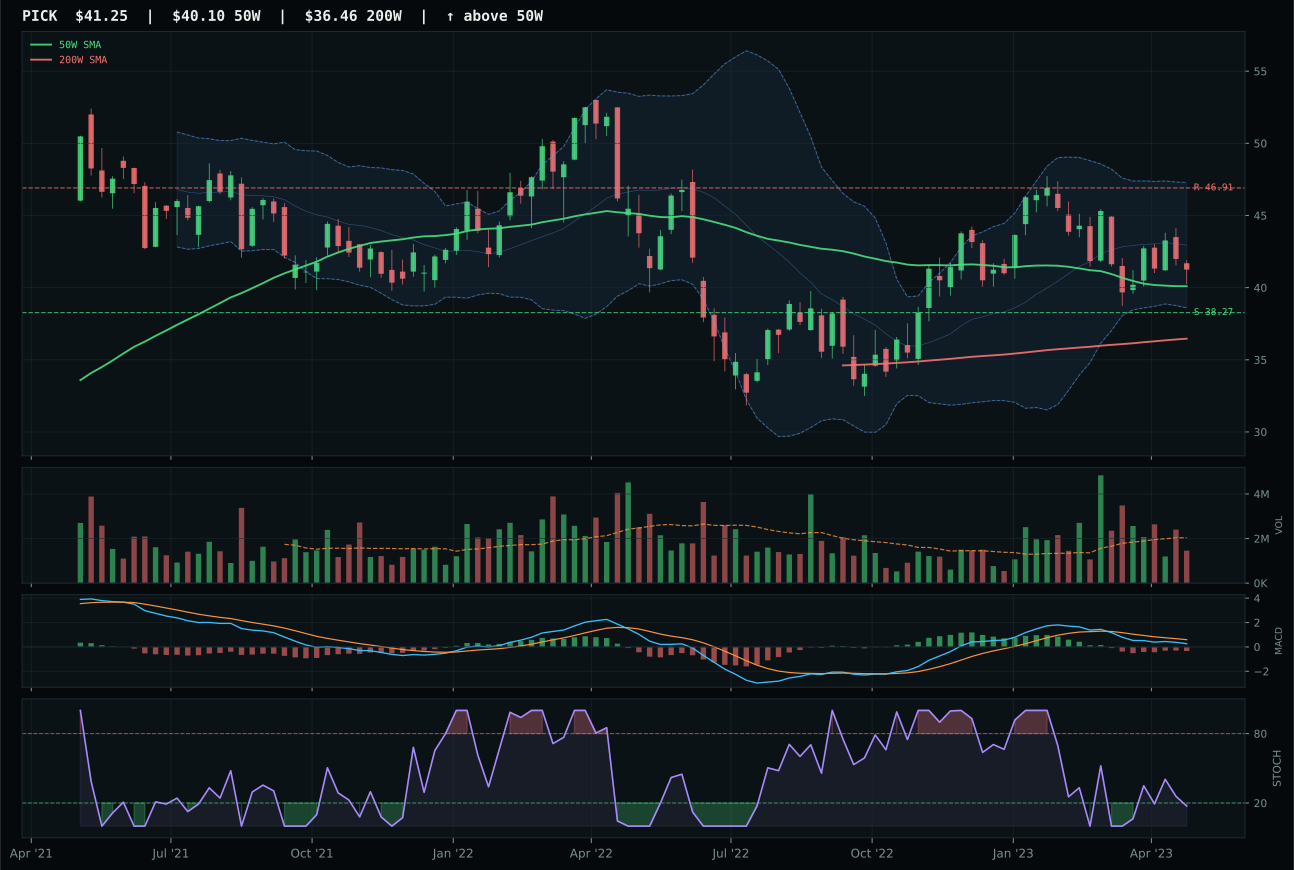
PICK has a compression near 50W profile with -14.6% 13-week relative strength versus SPY.
A failed hold above support would weaken the setup.
Actionable but governed by invalidation levels.
COPX wins decisively with a 25.9-point gap over REMX because it displays bullish and improving MACD and rising mid-zone stochastic RSI, proving that price is healing from oversold conditions with institutional sponsorship. At 13.9% above the 50W with a positive 0.2% slope and rising momentum, COPX is in early-stage recovery mode rather than speculative extension. The category-relative strength of 7.4% proves copper is the institutional choice in this metals complex; meanwhile, REMX suffers from bearish but improving MACD and a catastrophic -19.6% SPY-relative strength, signaling that rare earths remain in structural disinterest. What clinches COPX's win is that despite a -4.7% 13-week return, the 4-week return is positive 2.0% and MACD is improving, telegraphing a reset rather than a collapse.
Industrial Metals is allocated 5% as tier-2, its 47.5 score buoyed by exceptional macro fit at 65.0/100. Metals scarcity is active plus 14—the highest single-descriptor score in the portfolio—reflecting supply-side fears in copper, aluminum, and specialty metals that transcend near-term demand cycles. Commodity breadth positive adds 10, real asset sponsorship adds 6, and these outweigh liquidity stress minus 8 and credit stress minus 7. In a disinflation environment, industrial metals appear counterintuitive, but the setup works because COPX's recovery from oversold suggests early-cycle recovery in China and EM is beginning. The allocator is betting that scarcity premiums and energy transition demand (copper for EV and grid) will decouple from macro weakness. COPX must maintain above the 50W and hold MACD improvement for this thesis to hold; if REMX's decline accelerates or breadth cracks, industrial metals will drop to zero.
Defense & Aerospace — ITA
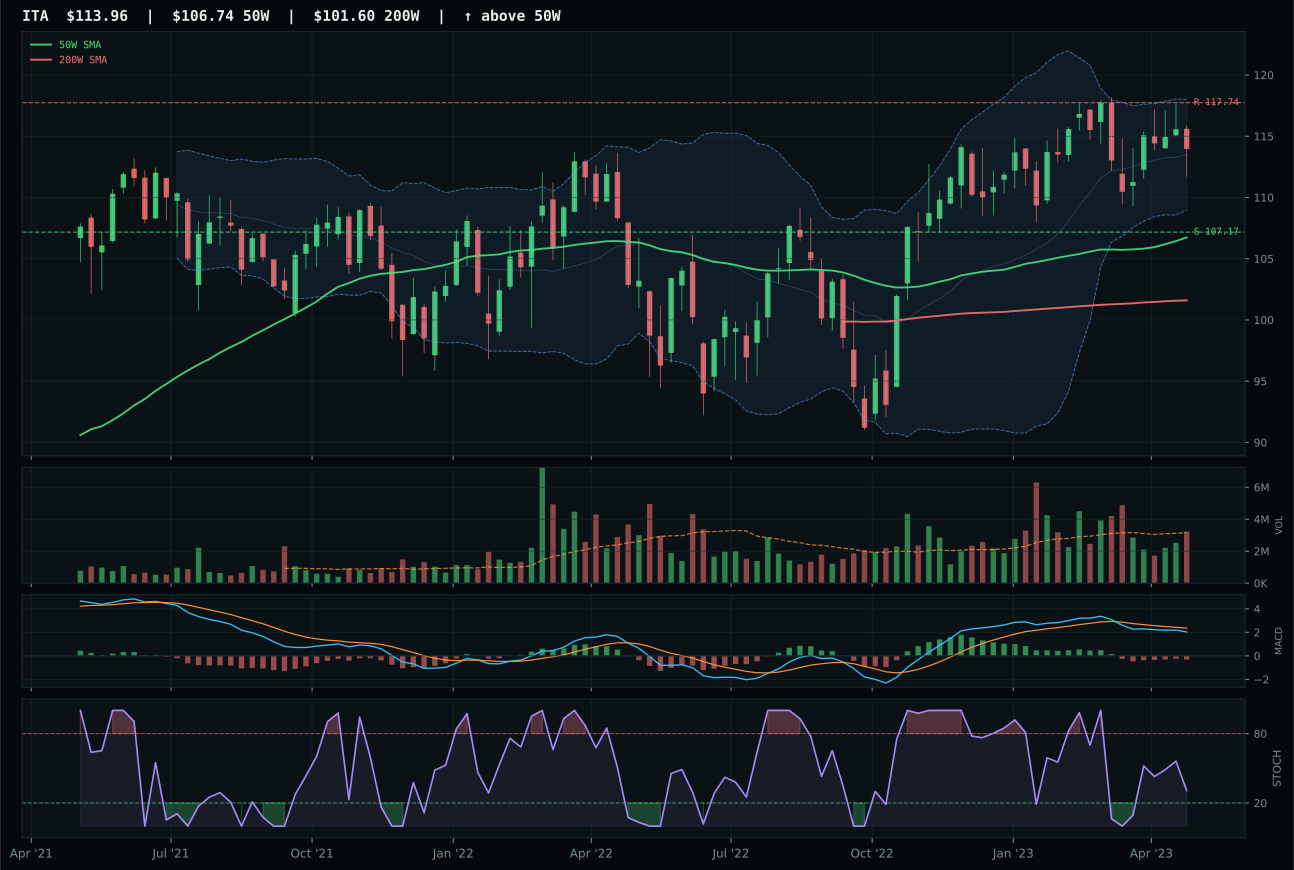
ITA has a neutral structure profile with -2.3% 13-week relative strength versus SPY.
A failed hold above support would weaken the setup.
Actionable but governed by invalidation levels.
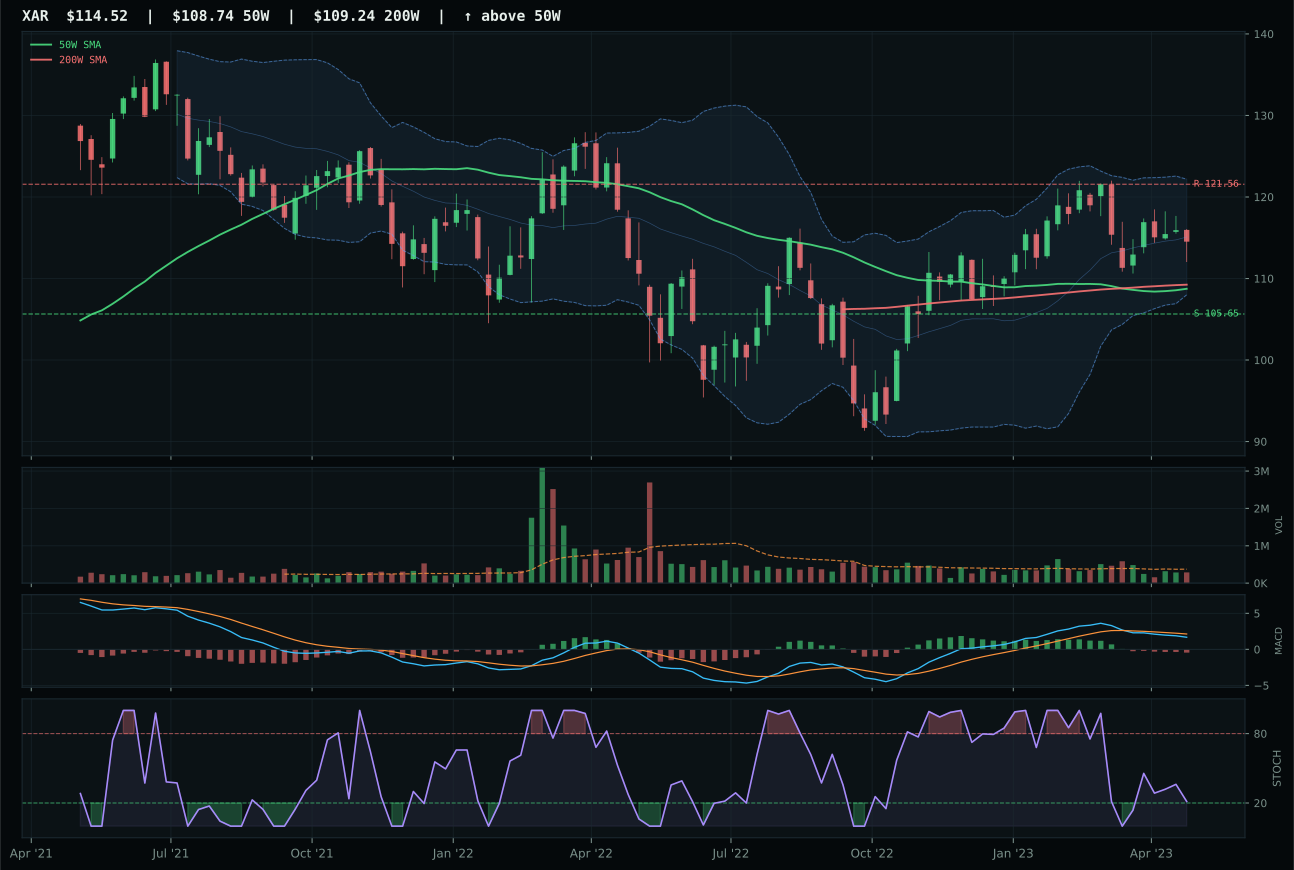
XAR has a neutral structure profile with -4.7% 13-week relative strength versus SPY.
A failed hold above support would weaken the setup.
Actionable but governed by invalidation levels.
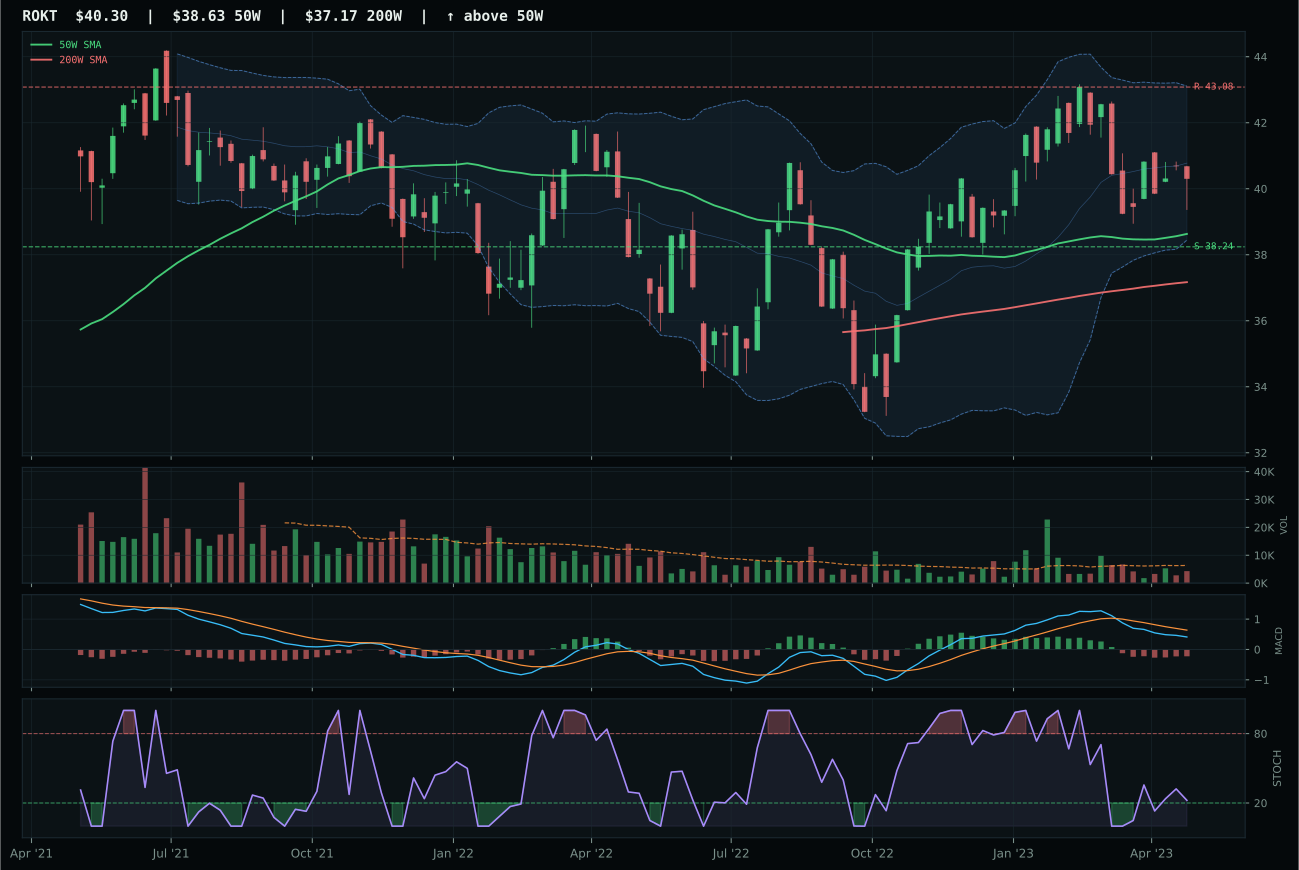
ROKT has a neutral structure profile with -6.1% 13-week relative strength versus SPY.
A failed hold above support would weaken the setup.
Tracked, but not top-2 eligible because: .
ITA wins cleanly with a 12.9-point gap over XAR because it combines the strongest trend (89.5/100) with the best timing (75.0 vs 70.0) and structure cleanliness (74.9 vs 71.9). Price is 6.8% above the 50W with a 0.3% positive slope, MACD is bearish but improving, and stochastic RSI sits neutral at 0.31—a setup that invites neither panic sellers nor momentum chasers. The category-relative strength of 2.4% proves ITA is the institutional vehicle in a sector where XAR is deteriorating (bearish and weakening MACD, -4.7% SPY-relative strength). What makes ITA the clear winner is that it does the job with less speculative energy: a 0.2% 13-week return paired with neutral volume suggests durability over surprise profit-taking.
Defense & Aerospace is allocated 5% as tier-2, its 43.0 category score reflective of a mixed macro backdrop. The sector macro fit stands at 51.0/100 because liquidity stress subtracts 4, but credit stress actually adds 2 and the broader 'Transition / Mixed' regime adds 3. Unlike pure growth sectors, defense and aerospace have secular tailwinds (military spending, geopolitical tension) that disinflation does not destroy; however, liquidity-stressed credit markets can still stall procurement cycles and defense contractor working capital needs. ITA's institutional accumulation pattern and defensive positioning within durables make it worthy of holding capital here, but the category will only graduate to top-2 if macro risk-off trades accelerate and credit stress eases, turning disinflation into a reallocation benefit rather than a neutral backdrop.
Nuclear Energy — URA
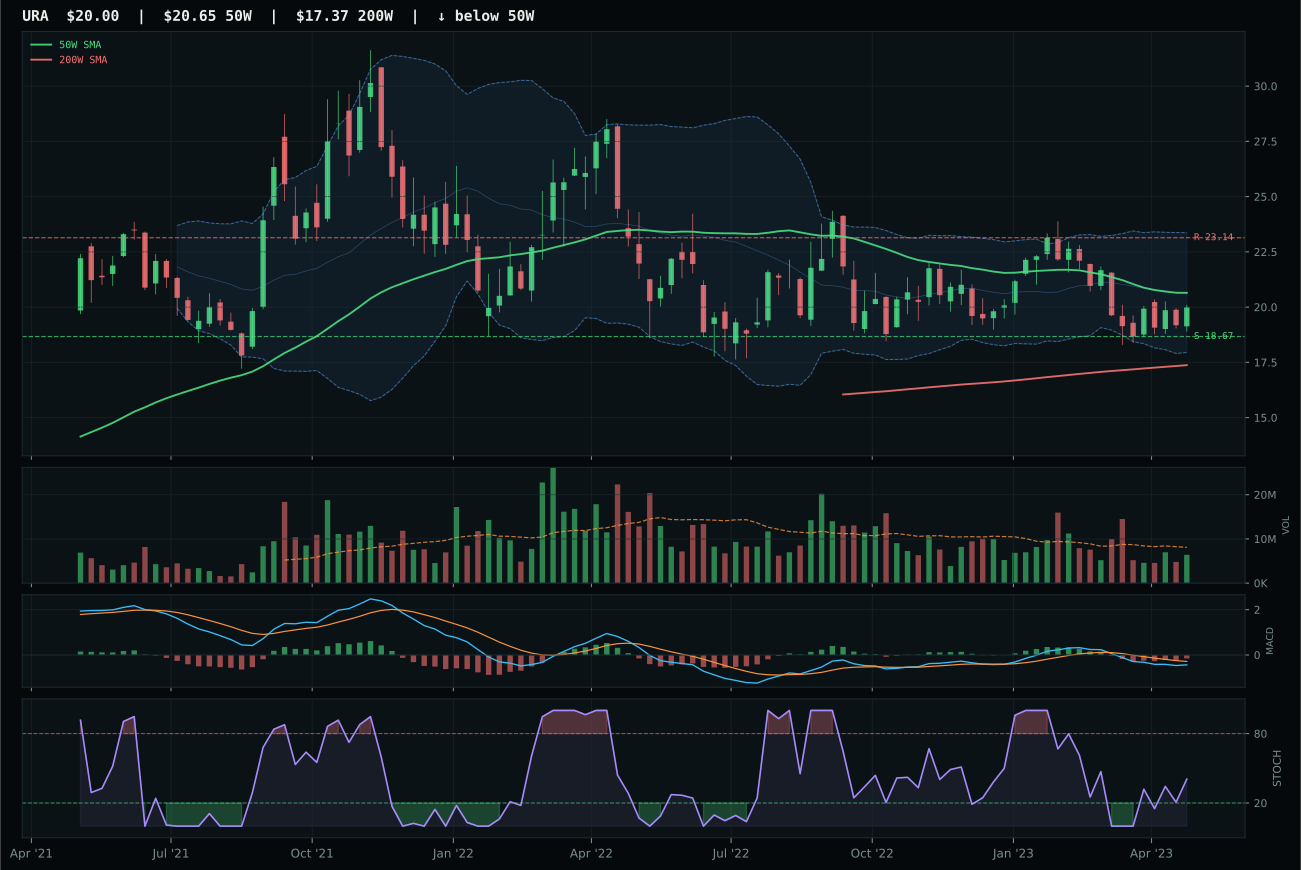
URA has a neutral structure profile with -16.1% 13-week relative strength versus SPY.
A failed hold above support would weaken the setup.
Actionable but governed by invalidation levels.
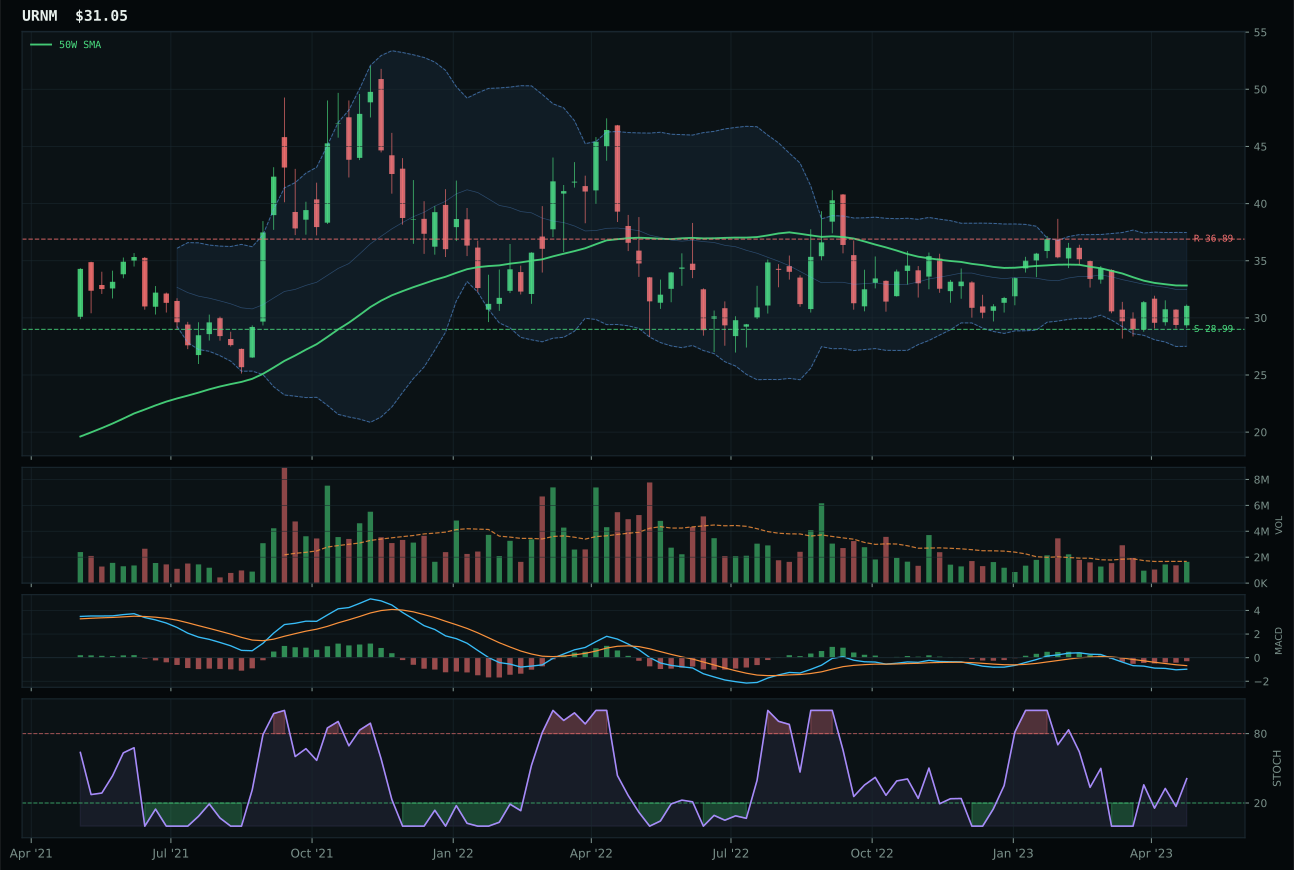
URNM has a neutral structure profile with -18.4% 13-week relative strength versus SPY.
A failed hold above support would weaken the setup.
Actionable but governed by invalidation levels.
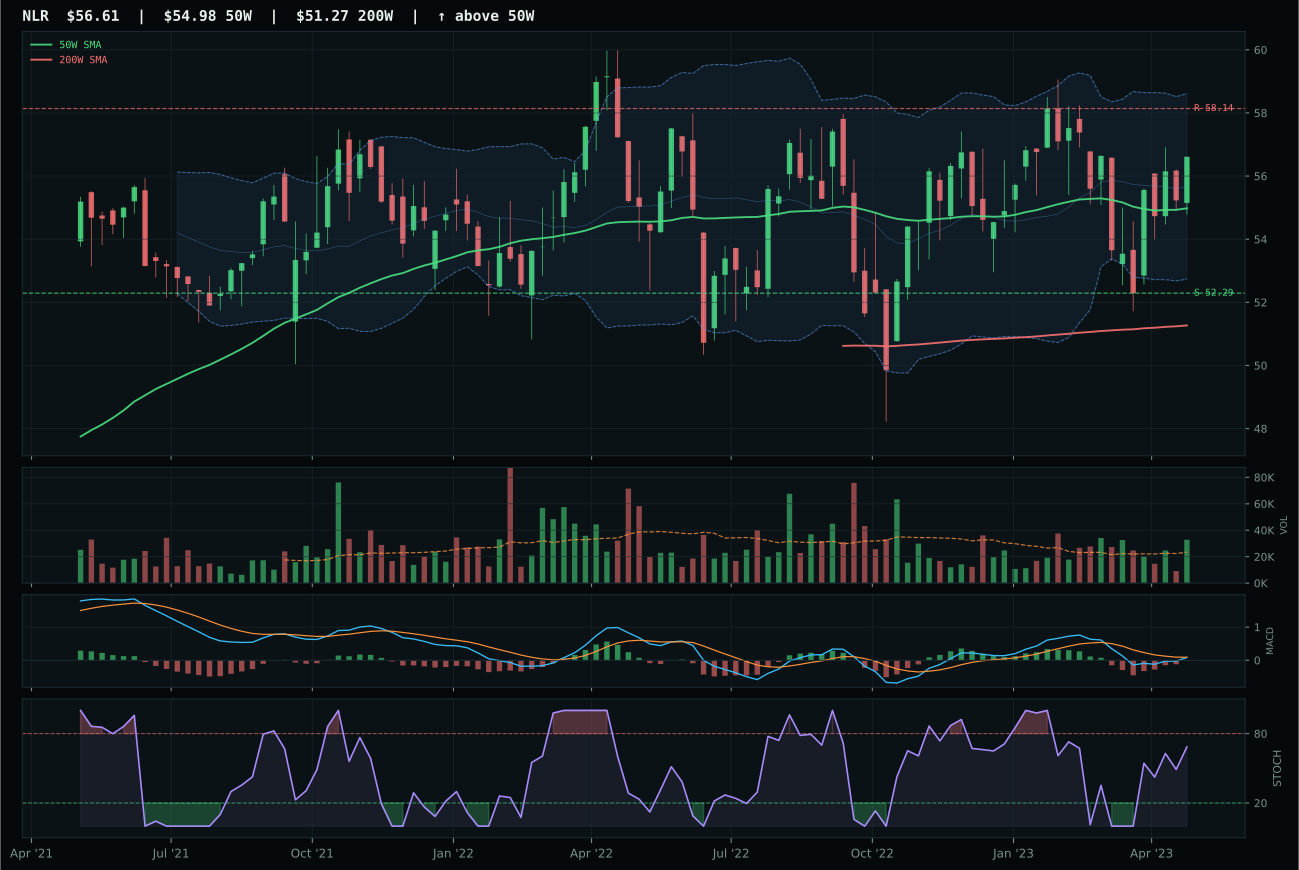
NLR has a compression near 50W profile with -5.2% 13-week relative strength versus SPY.
A failed hold above support would weaken the setup.
Tracked, but not top-2 eligible because: .
URA wins despite a 43.0 trend score—the weakest among the three holdings—because it commands the superior risk/reward profile (87.3/100) and perfect timing (100/100) that define a pullback-into-support setup with defined downside. At 3.1% below the 50W and sitting at the 0.618 Fibonacci retracement zone with MACD bearish but improving and stochastic RSI rising mid-zone, URA is pricing in the highest probability of reversal. The 13-week return of -13.6% is punitive, but the -3.1% distance from the 50W and the 7.1% downside-to-support give buyers a clear invalidation level and thus clear conviction. URNM's timing is 83 (weaker) and its risk/reward is 85.1 (weaker), revealing that while URNM is more extended from oversold, URA is the true mean-reversion candidate.
Nuclear Energy is allocated 5% as tier-2, its 37.3 category score reflecting neutral macro fit at 45.0/100 with no category-specific descriptor profile to support or damage the outlook. Real asset sponsorship adds 7, consistent with views that nuclear supports decarbonization and energy independence, but liquidity stress subtracts 7 and credit stress subtracts 5, creating a perfect offset. The portfolio is holding this position not because macro is favorable but because the technical setup—pullback into support with improving MACD and perfect timing—offers asymmetric risk/reward. This is a mean-reversion allocation, not a conviction call. URA must hold above support at 18.67 and show volume-price confirmation on the next test; if that support breaks, the category moves to zero. The thesis depends on uranium demand from AI-driven electricity needs and decarbonization offsetting the immediate oversupply from Kazakhstan and lack of new nuclear in the West.
AI — BOTZ
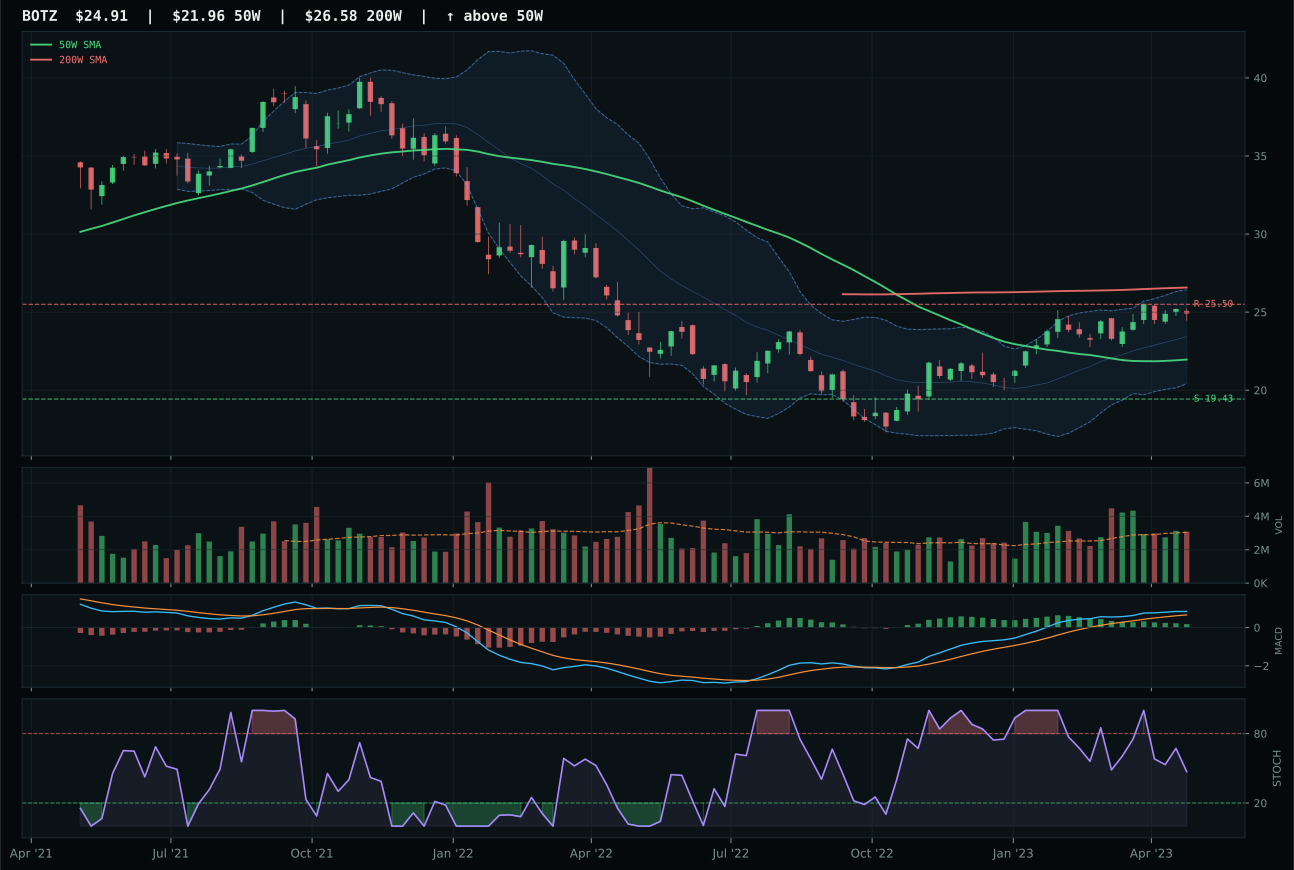
BOTZ has a neutral structure profile with 2.3% 13-week relative strength versus SPY.
A failed hold above support would weaken the setup.
Actionable but governed by invalidation levels.
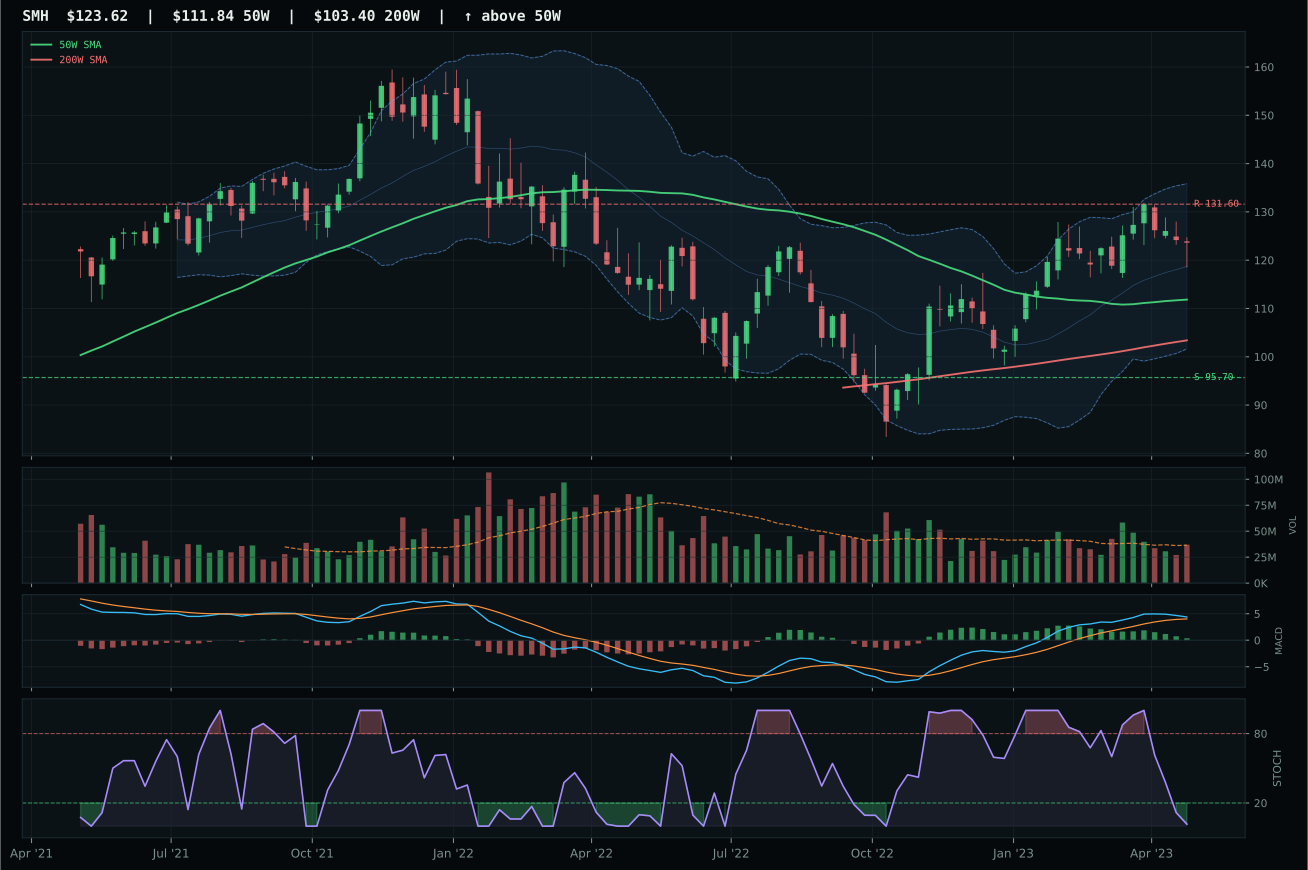
SMH has a neutral structure profile with 0.8% 13-week relative strength versus SPY.
A failed hold above support would weaken the setup.
Actionable but governed by invalidation levels.
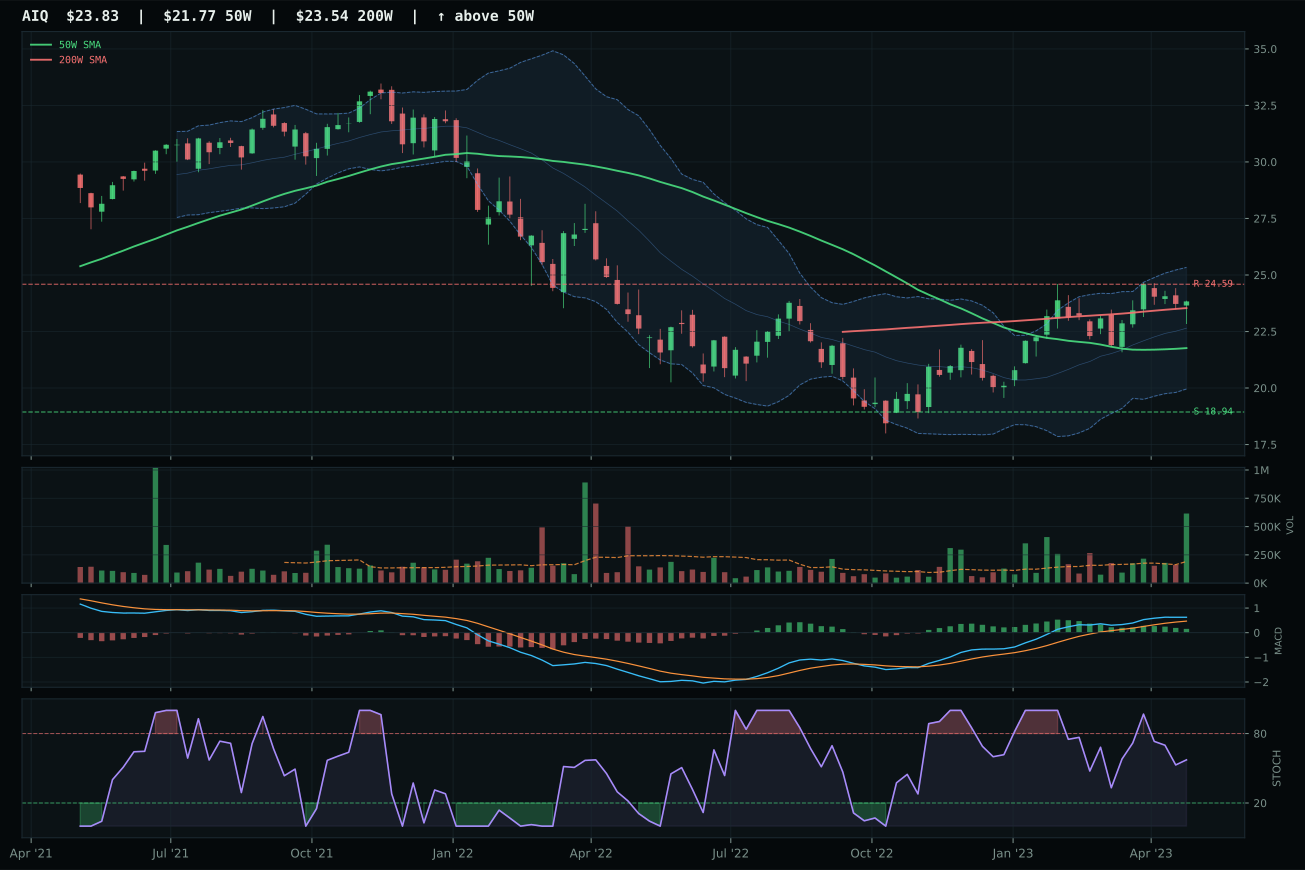
AIQ has a neutral structure profile with 0.3% 13-week relative strength versus SPY.
A failed hold above support would weaken the setup.
Tracked, but not top-2 eligible because: .
BOTZ wins despite a softer composite score than SMH because it delivers superior structure cleanliness (71.3 vs 64.9) and category-relative strength (1.5% vs 0.0%), the twin pillars that separate leading bids from noise. Price sits below the 200W while above the 50W—a mild pullback setup—and BOTZ's stochastic RSI at 0.47 is falling neutral, suggesting neither momentum exhaustion nor fresh entry. The 13-week return of 4.8% is pedestrian and SPY-relative strength at only 2.3% says this is a lagging sector, yet the score gap of 5.4 points against SMH is decisive because structure matters when momentum is weak. SMH's oversold stochastic and superior trend score of 97 could tempt a mean-reversion trader, but the allocator is asking for relative strength and breadth confirmation first—and SMH cannot provide them.
AI receives 5% as a tier-2 category, its final score of 32.6 too weak for top-2 consideration. The reasoning is stark: the category macro fit is only 35.0/100 because liquidity stress is active minus 12 and credit stress active minus 8, two headwinds that outweigh the modest disinflation tailwind of plus 5. A disinflation regime should support AI's nominal growth narrative, but current financial conditions are choking liquidity and credit availability—the exact conditions that cull unprofitable or highly-leveraged AI compute and robotics names. BOTZ's robotics and physical AI angle has less duration risk than SMH's semiconductor leverage, which is why it won the category, but the category itself remains a residual allocation pending proof that credit conditions stabilize.
Emerging Markets — ILF
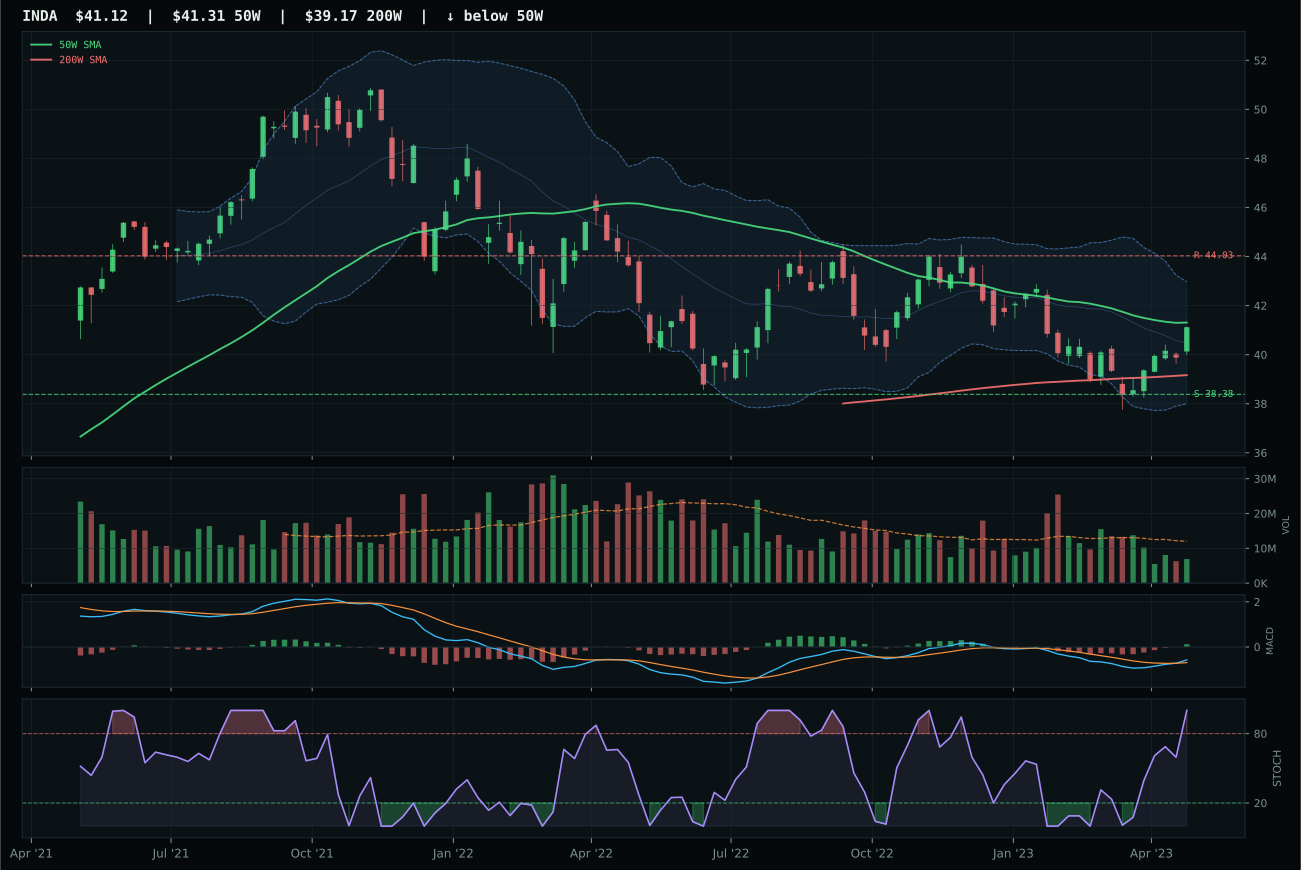
INDA has a compression near 50W profile with -1.9% 13-week relative strength versus SPY.
A failed hold above support would weaken the setup.
Actionable but governed by invalidation levels.
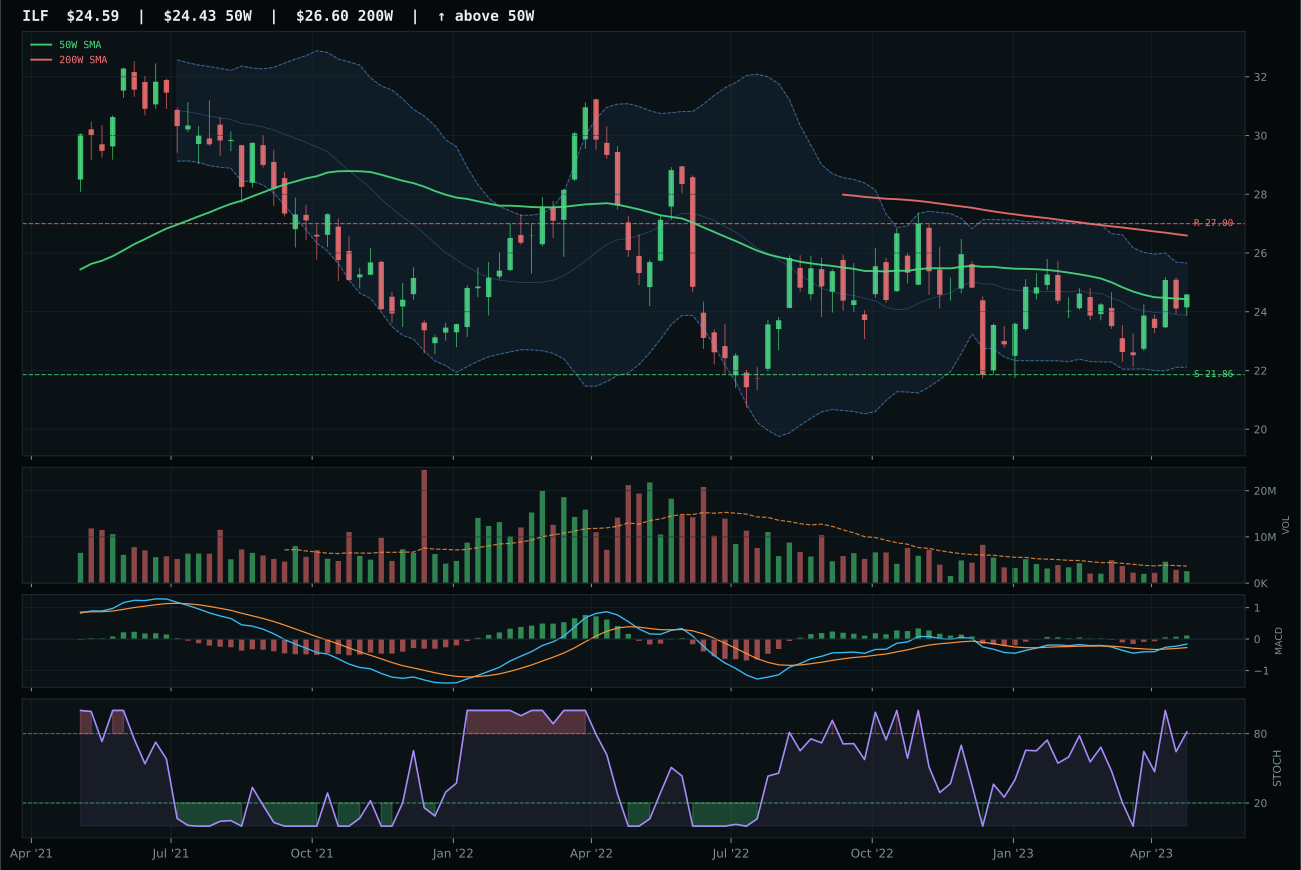
ILF has a compression near 50W profile with -5.2% 13-week relative strength versus SPY.
A failed hold above support would weaken the setup.
Actionable but governed by invalidation levels.
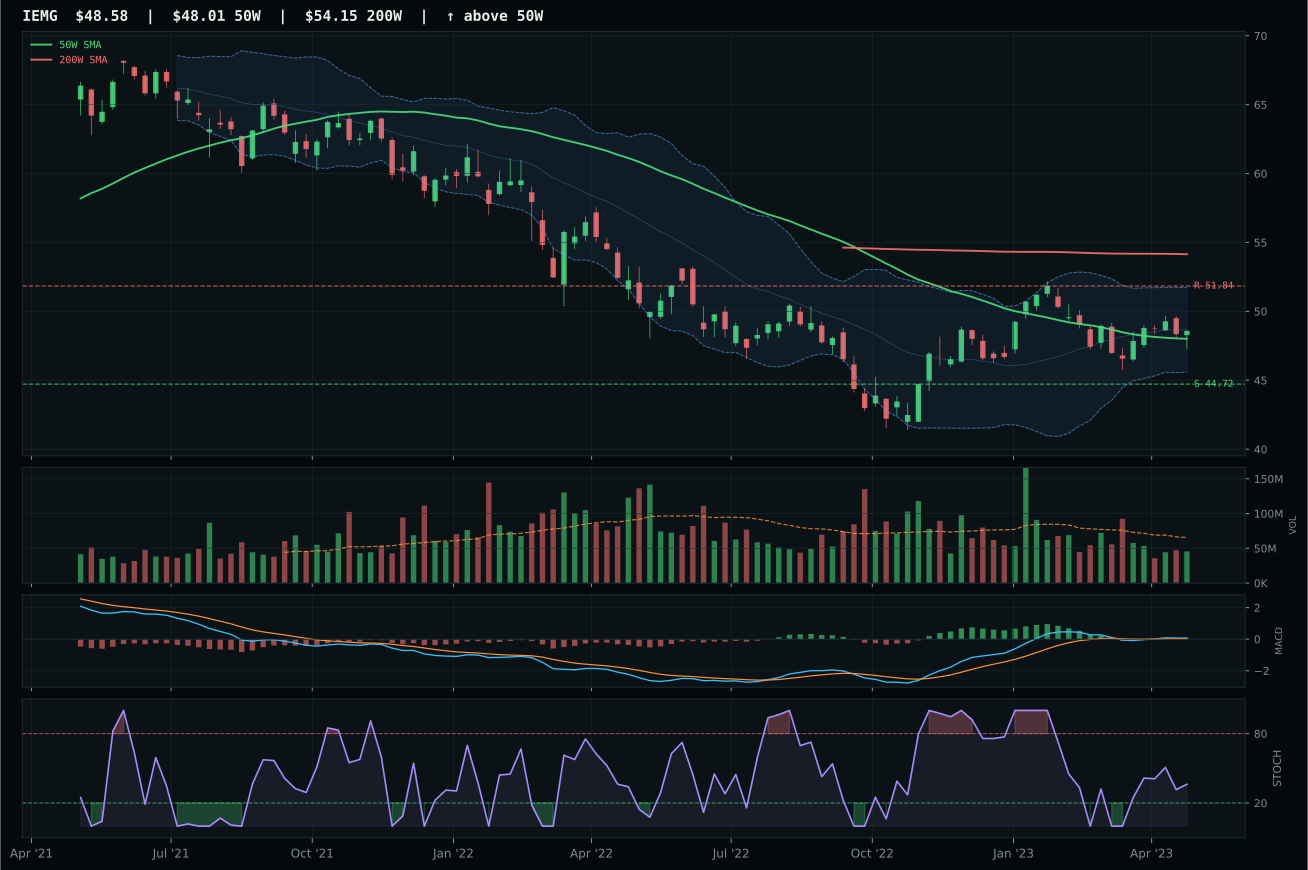
IEMG has a compression near 50W profile with -8.8% 13-week relative strength versus SPY.
A failed hold above support would weaken the setup.
Actionable but governed by invalidation levels.
ILF wins over runner-up INDA by posting superior risk/reward (65.9 vs 70, but INDA's is illusory given thin participation) and marginally better structure at 66.9/100, though the true margin is INDA's weaker macro fit: ILF captures commodity breadth positive plus 8 and metals scarcity plus 5, while INDA relies on growth narratives that are credit-constrained. Both sit in compression near the 50W with perfect timing (100/100), MACD bullish and improving, and stochastic RSI overbought at 0.81. ILF's -5.2% SPY-relative strength is worse than INDA's -1.9%, but the allocator favors the commodity-linked Latin America exposure in a disinflation regime because falling input costs help commodity exporters more than growth. Thin participation at 0.70x the 20W average is the same for both, so the tiebreaker is macro alignment: INDA is credit-stressed (-5), while ILF is commodity-supported (+8 net from scarcity and breadth).
Emerging Markets is allocated 5% as tier-2, its 26.0 category score placing it near the bottom tier because macro fit is only 30.0/100. Credit stress active subtracts 10 and liquidity stress active subtracts 10, creating a 20-basis-point headwind that nearly cancels out the commodity and real asset sponsorship tailwinds. The reasoned ETF proof order placed INDA first (59.9) because of superior technical composite scores and trend, but the portfolio selected ILF as the representative because it has better macro fit and ILF's commodity beta outweighs INDA's growth exposure when credit is tightening. This is a grudging allocation—ILF is held primarily for its optionality on a soft-landing scenario where commodity demand stabilizes and Chinese growth resumes. If credit stress accelerates and emerging market currencies weaken, ILF will be vulnerable; the category will drop to zero if ILF loses the 50W and momentum confirmation breaks.
Agriculture & Livestock — VEGI
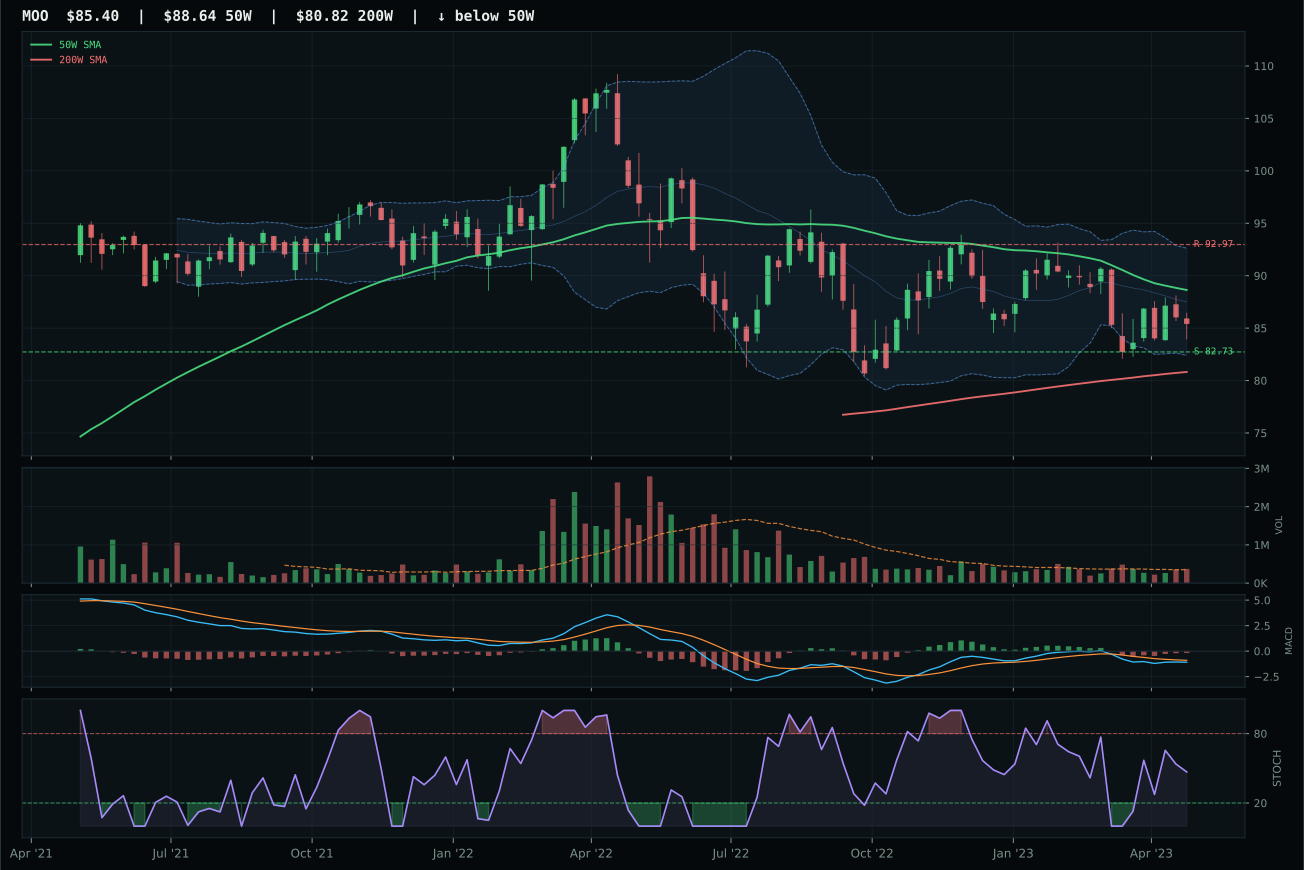
MOO has a pullback into support profile with -9.2% 13-week relative strength versus SPY.
A failed hold above support would weaken the setup.
Actionable but governed by invalidation levels.
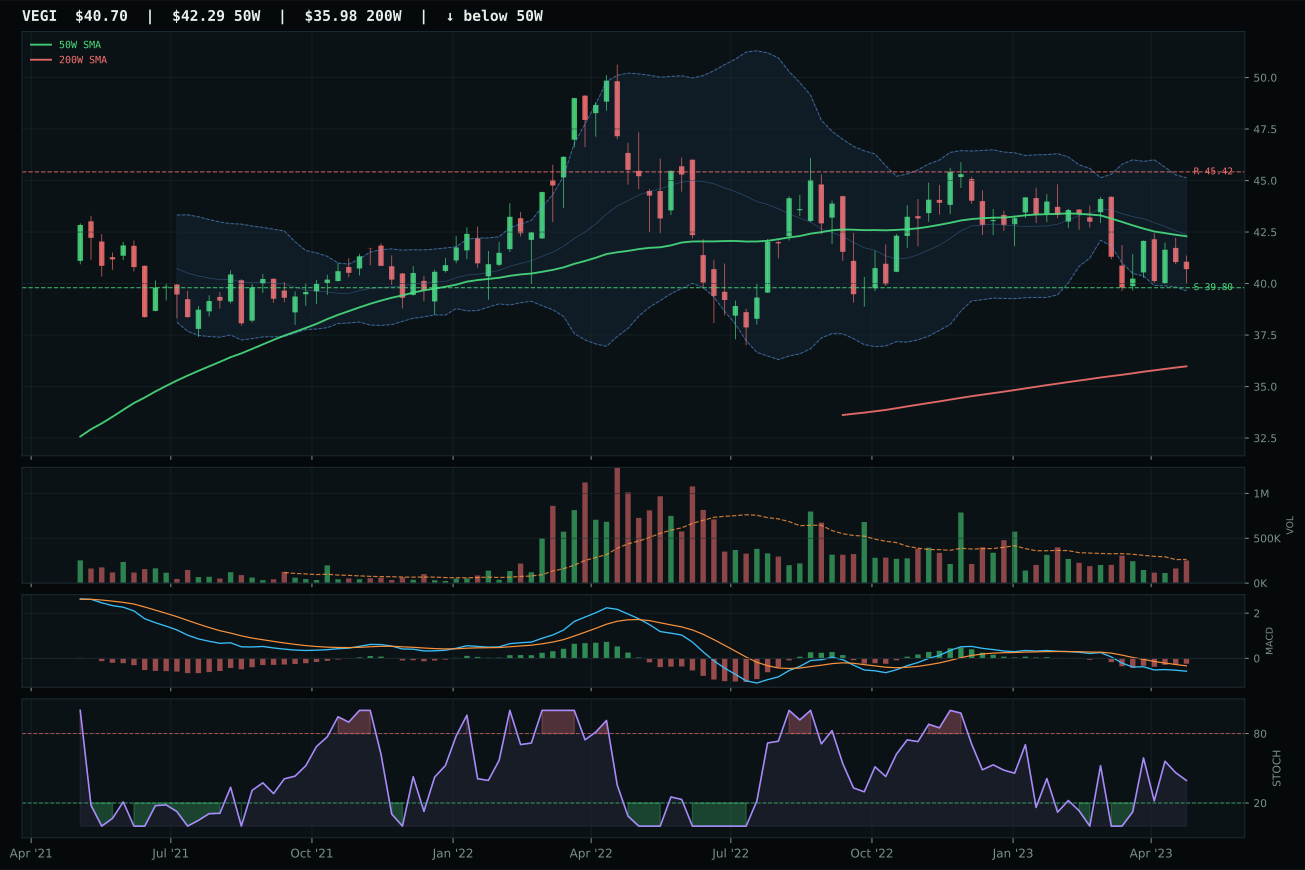
VEGI has a pullback into support profile with -10.0% 13-week relative strength versus SPY.
A failed hold above support would weaken the setup.
Actionable but governed by invalidation levels.
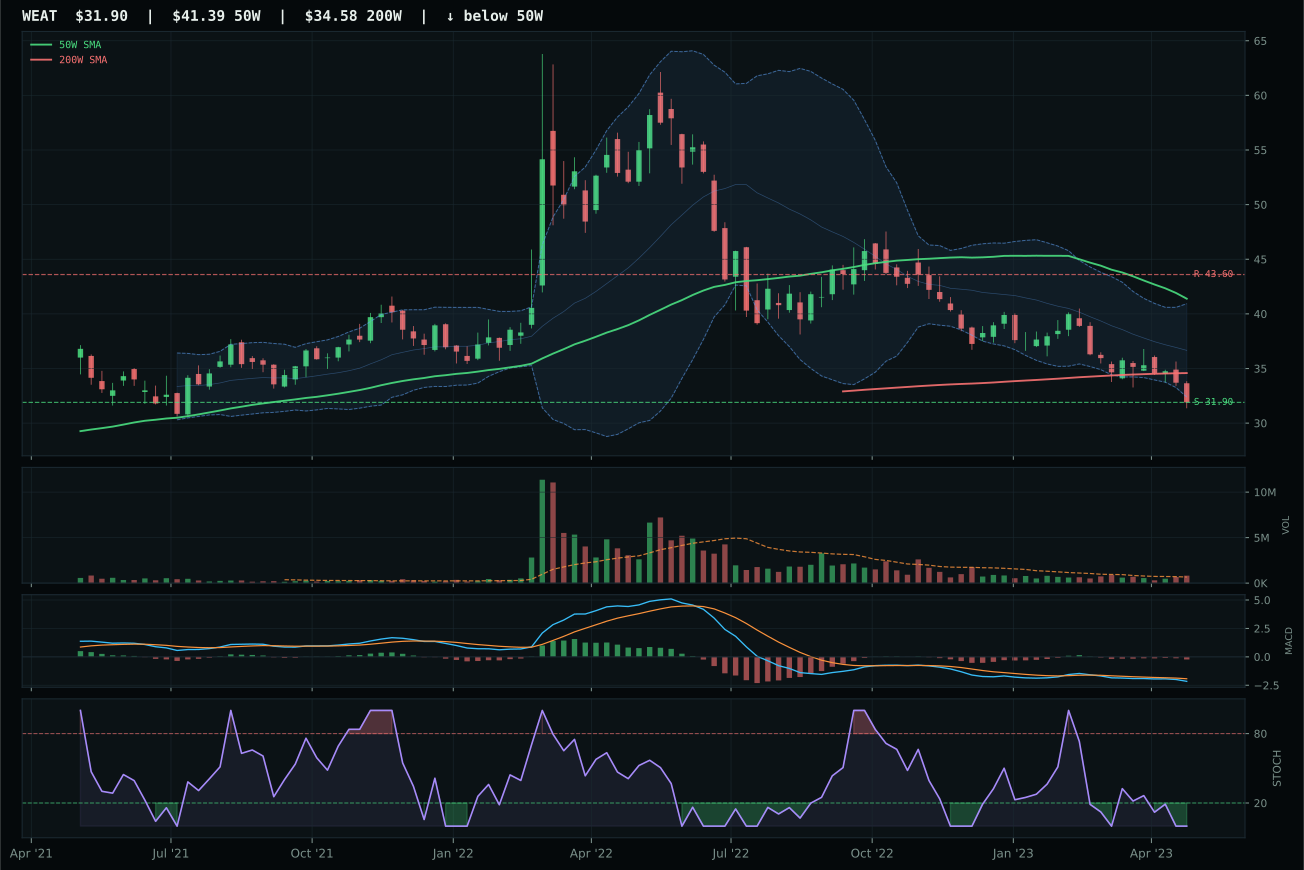
WEAT has a pullback into support profile with -18.5% 13-week relative strength versus SPY.
A failed hold above support would weaken the setup.
Actionable but governed by invalidation levels.
VEGI wins a tight race over MOO by 1.3 points despite both residing in pullback-into-support setups with identical Fibonacci timing (100/100). The victory margin comes from superior risk/reward (98.0 vs 90.0) and marginally cleaner structure (69.1 vs 67.1), but the real story is that both funds are weak: negative 7.5% and negative 6.7% 13-week returns with category-relative strength near 0.0% signal sellers still in control. VEGI edges ahead because it sits 3.8% below the 50W rather than MOO's 2.0% clip, providing a deeper invalidation zone and thus a more honest reward-to-risk trade. Stochastic RSI is rising mid-zone at 0.39 for VEGI, suggesting oversold conditions may be bottoming. This is not a buy signal; it is recognition that if buyers are coming, VEGI will show it first.
Agriculture & Livestock receives 0% allocation this week, excluded from the portfolio entirely despite VEGI winning its internal category. The final score of 24.8 ranks this category 9th or 10th, crushed by macro headwinds: disinflation pressure active minus 8 subtracts more than commodity breadth positive plus 5 can recoup. Real asset sponsorship adds 8 basis points, but it is overwhelmed by the fact that falling prices for grains, livestock, and agricultural inputs reduce farmer margins and input-maker revenues in a disinflation regime. Volume participation is thin, structures are weak, and the 13-week returns are sharply negative across all three holdings. For this category to earn reallocation, commodity prices need to stabilize and show accumulation at support, liquidity stress needs to ease, and disinflation pressure needs to reverse or moderate into neutral. Until then, capital is better deployed in sectors where the macro wind is at your back.
Traditional Energy — XLE
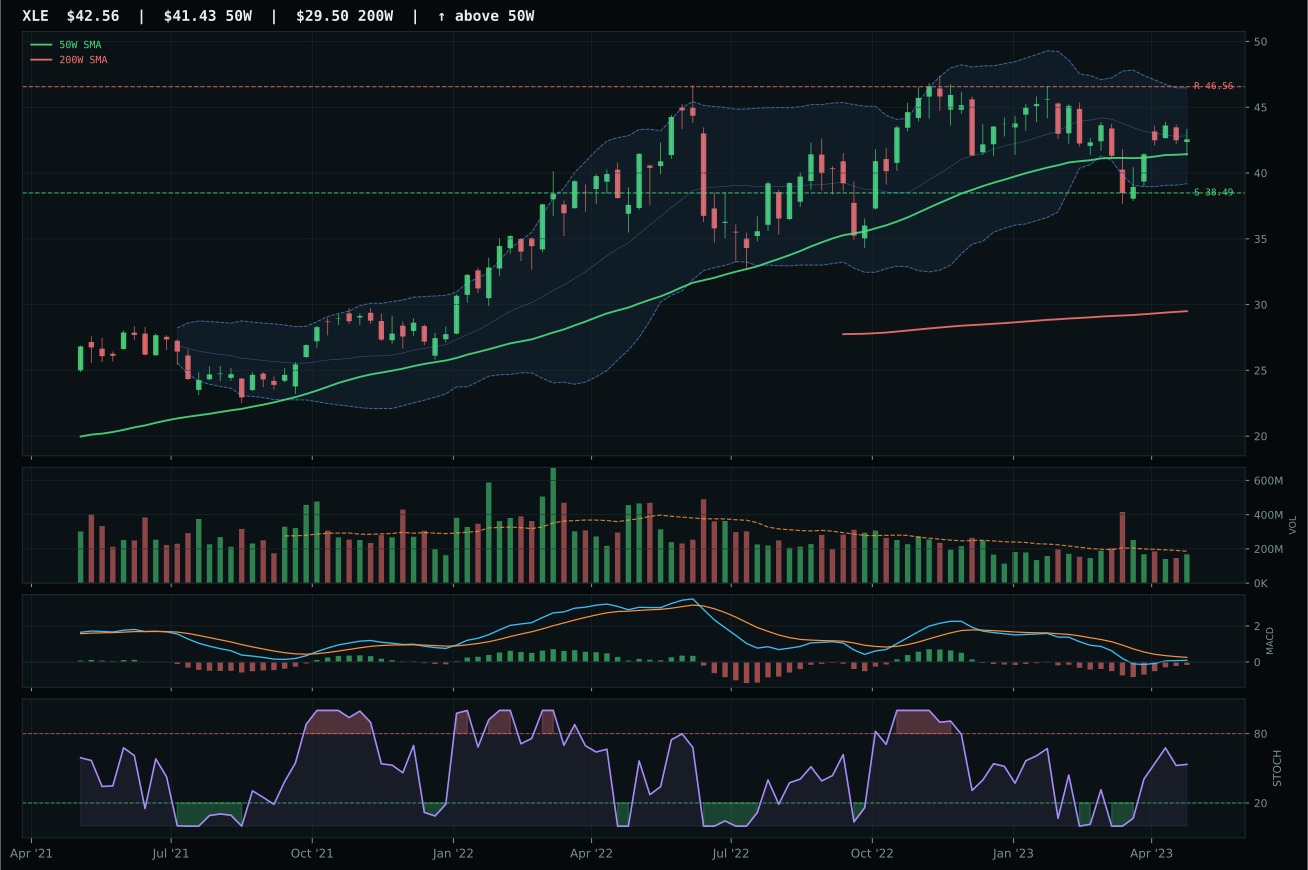
XLE has a compression near 50W profile with -9.2% 13-week relative strength versus SPY.
A failed hold above support would weaken the setup.
Actionable but governed by invalidation levels.
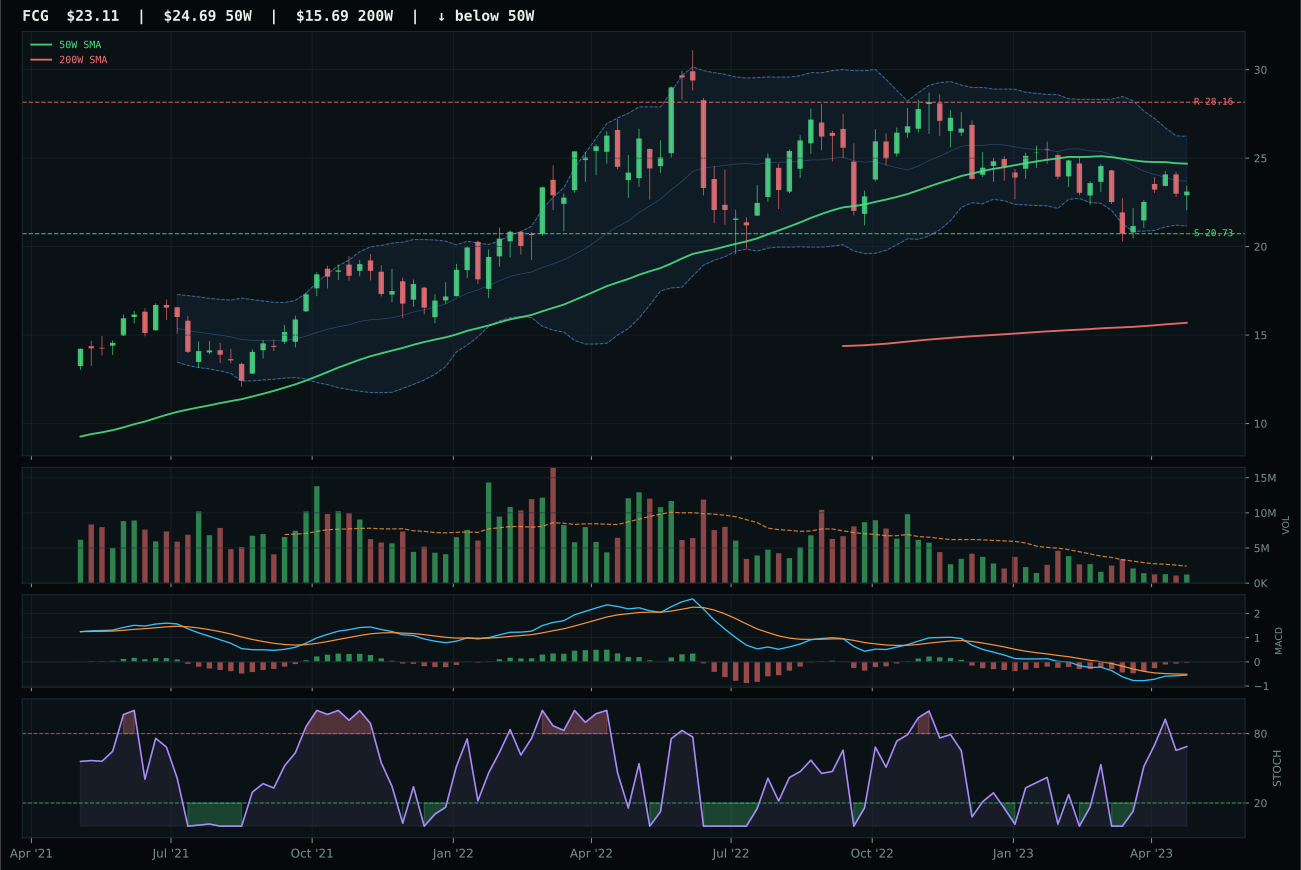
FCG has a neutral structure profile with -11.8% 13-week relative strength versus SPY.
A failed hold above support would weaken the setup.
Actionable but governed by invalidation levels.
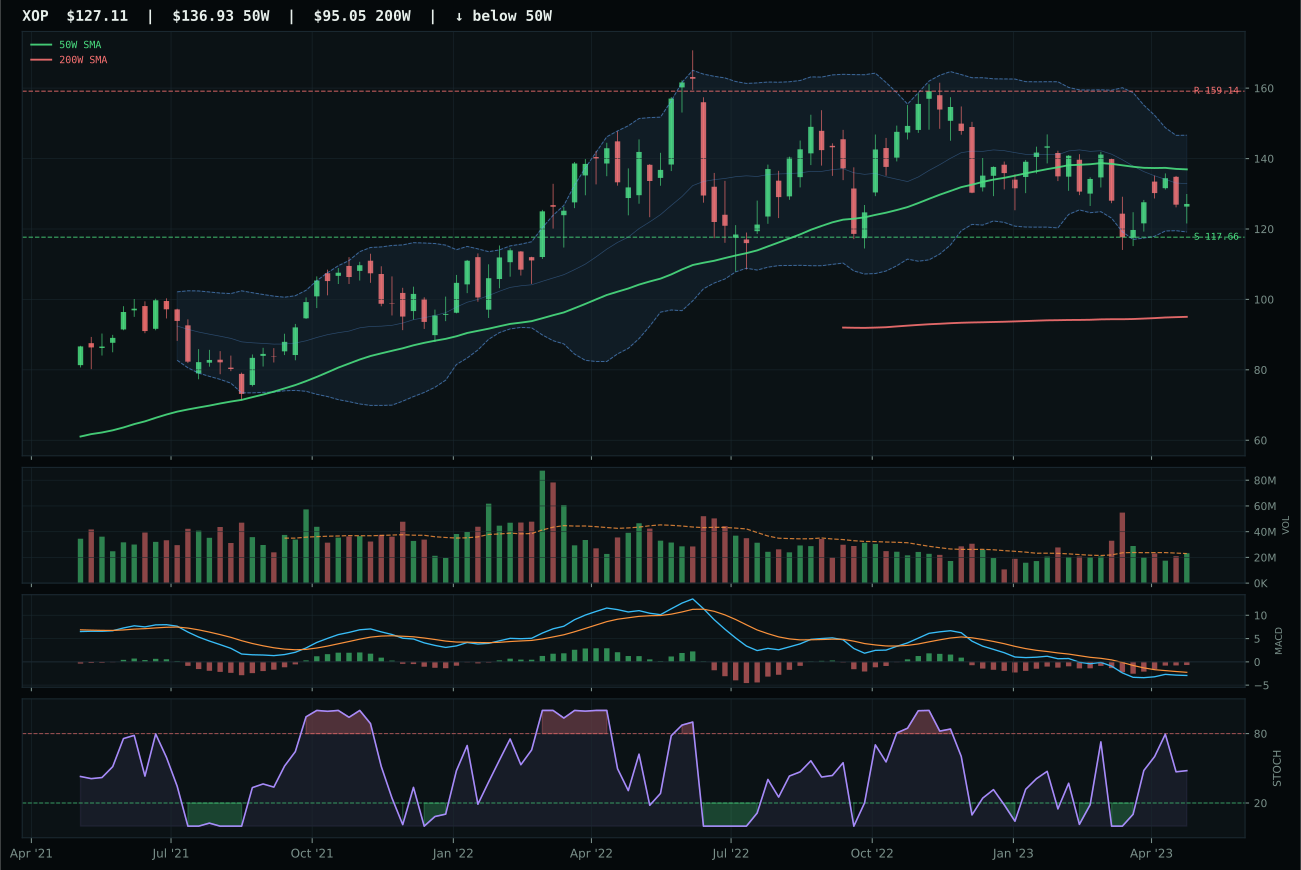
XOP has a neutral structure profile with -13.9% 13-week relative strength versus SPY.
A failed hold above support would weaken the setup.
Actionable but governed by invalidation levels.
XLE wins a weak category by posting the only neutral compression setup (2.7% from the 50W) and a perfect timing score of 100/100, but the victory masks deeper trouble. Price is above both moving averages yet MACD is bearish but improving and the 13-week return is -6.7%, meaning XLE is not recovering—it is stabilizing at damaged levels. XLE's category-relative strength of 2.6% beats FCG's 0.0% marginally, and its structure cleanliness of 74.8 beats FCG's neutral standing, but these are victories in a collapsing kingdom. The score gap of 16.0 points against FCG is significant, yet both ETFs register negative 13-week returns and both are priced in the lower Fibonacci zones, suggesting mean reversion rather than new upside.
Traditional Energy is allocated 0%, excluded from the portfolio as a 9th or 10th ranked category with a final score of only 8.4. The sector's macro fit is a disastrous 23.0/100 because disinflation pressure active subtracts 10, disinflation hurts this exposure by 10 additional basis points, and credit stress subtracts 7. Even real asset sponsorship plus 7 cannot offset the headwind that falling inflation expectations create for commodities with no intrinsic yield and no monetary hedge properties. XLE's compression setup offers a technical rebound opportunity, but the allocator does not bet portfolio capital on sector recoveries when macro winds are structurally adverse. Traditional energy requires either an inflation shock, credit stress severe enough to create supply destruction, or a geopolitical crisis that forces supply offline. None of those have sufficient probability in a disinflation regime, so this capital is reallocated to metals that retain monetary properties and utilities that benefit from falling input costs.