
2023-04-21
Informational purposes only. The content in this report, including allocations, analysis, and commentary, is provided solely for informational and educational purposes. It does not constitute financial advice, investment advice, trading advice, or any other type of advice. Past performance does not guarantee future results. Always conduct your own research and consult a qualified financial professional before making investment decisions.
Weekly Allocation
| Ticker | Category | Weight | Role |
|---|---|---|---|
| FBTC | 50% | Overlay | |
| GLD | Precious Metals | 10% | Top-2 (10%) |
| IGV | Technology | 10% | Top-2 (10%) |
| XLU | Utilities & Infrastructure | 5% | Tier-2 (5%) |
| BOTZ | AI | 5% | Tier-2 (5%) |
| ITA | Defense & Aerospace | 5% | Tier-2 (5%) |
| COPX | Industrial Metals | 5% | Tier-2 (5%) |
| URA | Nuclear Energy | 5% | Tier-2 (5%) |
| VEGI | Agriculture & Livestock | 5% | Tier-2 (5%) |
Trade Instructions — Monday Open
Sell the tranche from 2023-03-24 (completing its 4-week hold). Buy the new tranche. Instructions show net portfolio changes — same-asset positions cancel, weight changes show the delta.
| Action | Ticker | Instruction |
|---|---|---|
| SELL | SMH | Sell 40% of SMH position (reduce 6.25% → 3.75%) |
| SELL | XLK | Sell 50% of XLK position (reduce 5.00% → 2.50%) |
| SELL | GDX | Sell entire GDX position (1.25% of portfolio) |
| SELL | INDA | Sell entire INDA position (1.25% of portfolio) |
| BUY | GLD | Buy GLD — 33.33% of freed cash (adds 2.50% to portfolio) |
| BUY | IGV | Buy IGV — 33.33% of freed cash (adds 2.50% to portfolio) |
| BUY | BOTZ | Buy BOTZ — 16.67% of freed cash (adds 1.25% to portfolio) |
| BUY | VEGI | Buy VEGI — 16.67% of freed cash (adds 1.25% to portfolio) |
Current Portfolio After Trade
Combined holdings across all 4 active tranches. Each tranche is 25% of the portfolio.
| Ticker | % of Portfolio | Weight Bar |
|---|---|---|
| FBTC | 50.00% | |
| GLD | 8.75% | |
| IGV | 7.50% | |
| ITA | 5.00% | |
| COPX | 5.00% | |
| URA | 5.00% | |
| XLU | 3.75% | |
| SMH | 3.75% | |
| XLK | 2.50% | |
| IEMG | 2.50% | |
| BOTZ | 2.50% | |
| VEGI | 2.50% | |
| IGF | 1.25% |
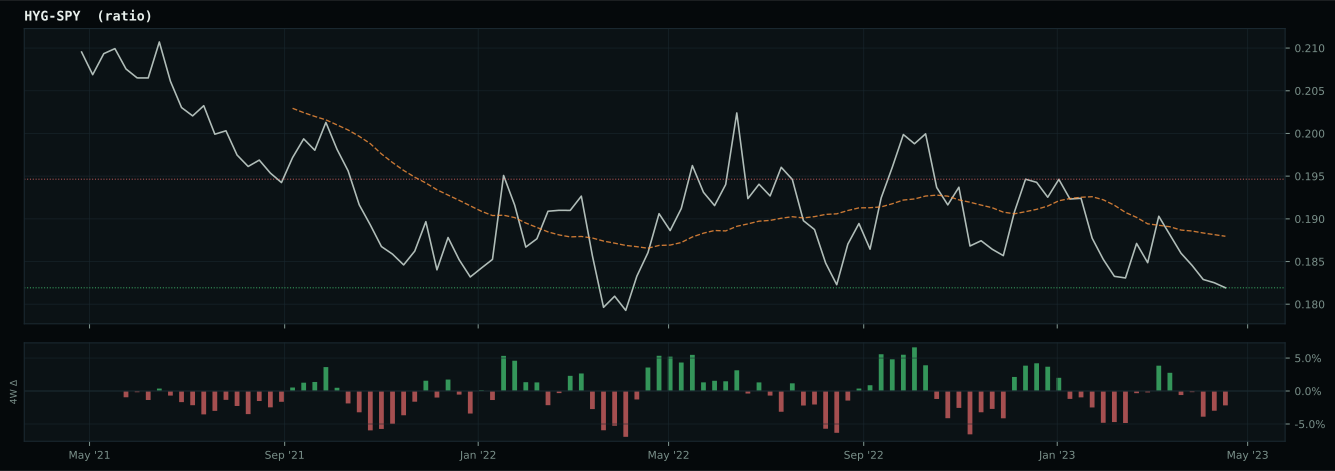
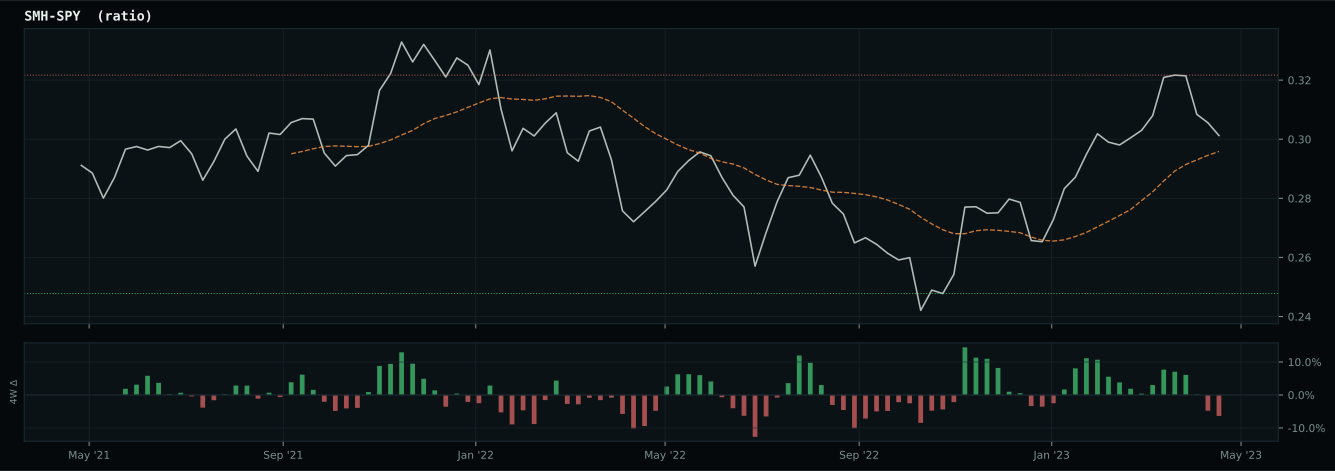
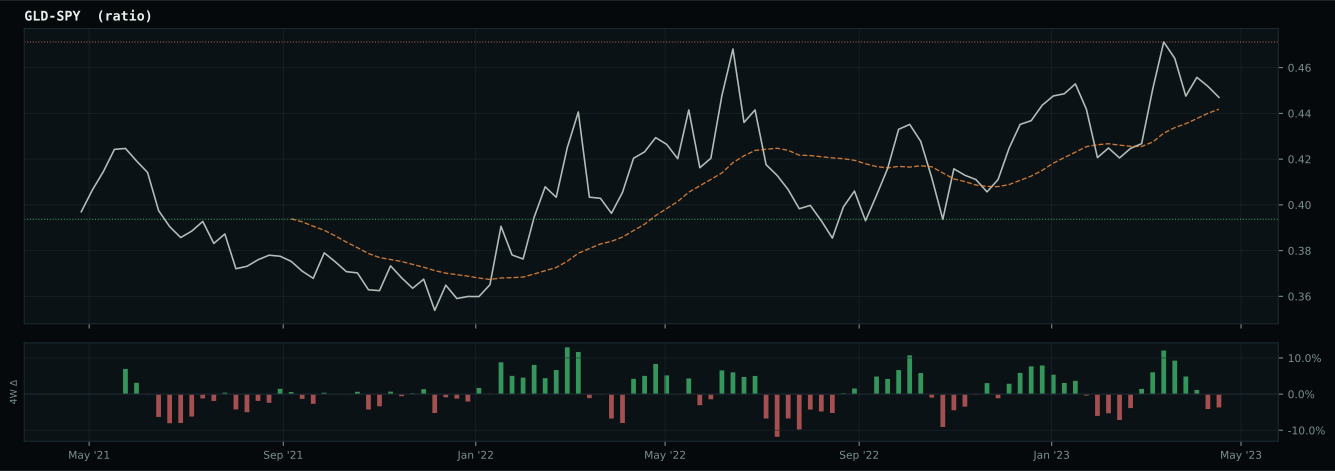
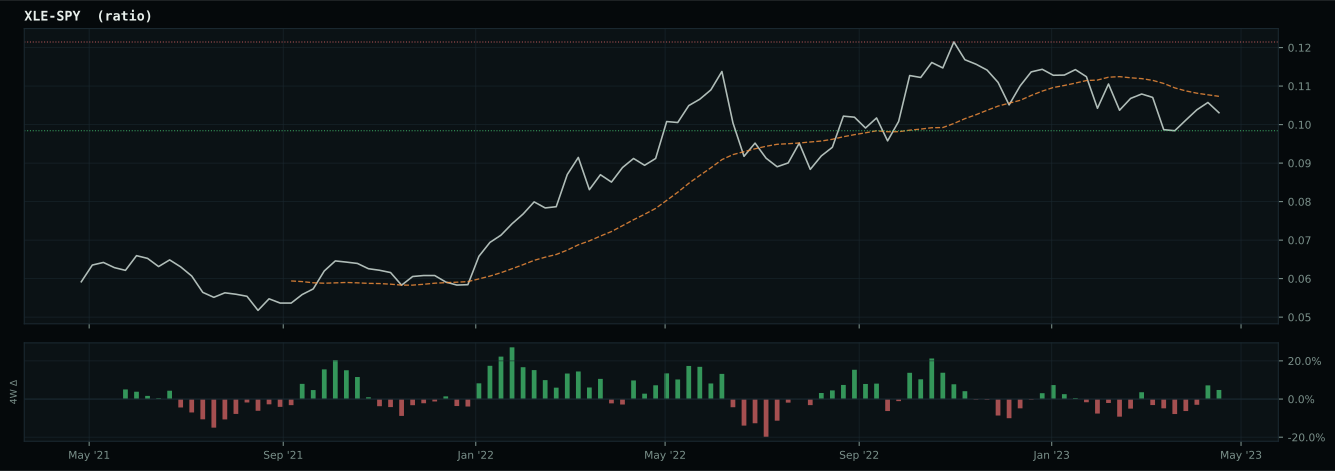
Macro Regime — Disinflation
Macro Evidence Charts
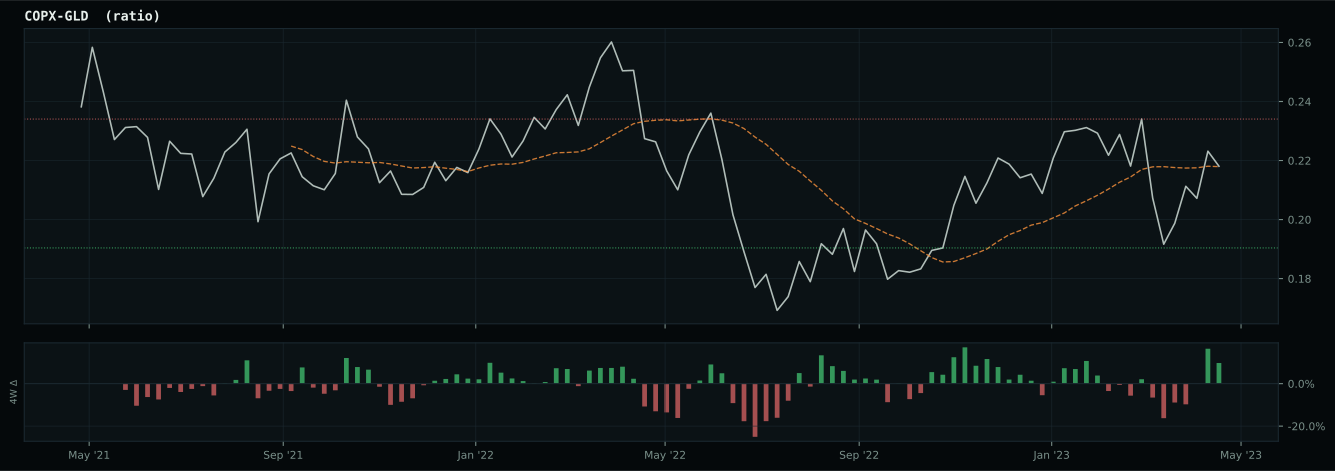
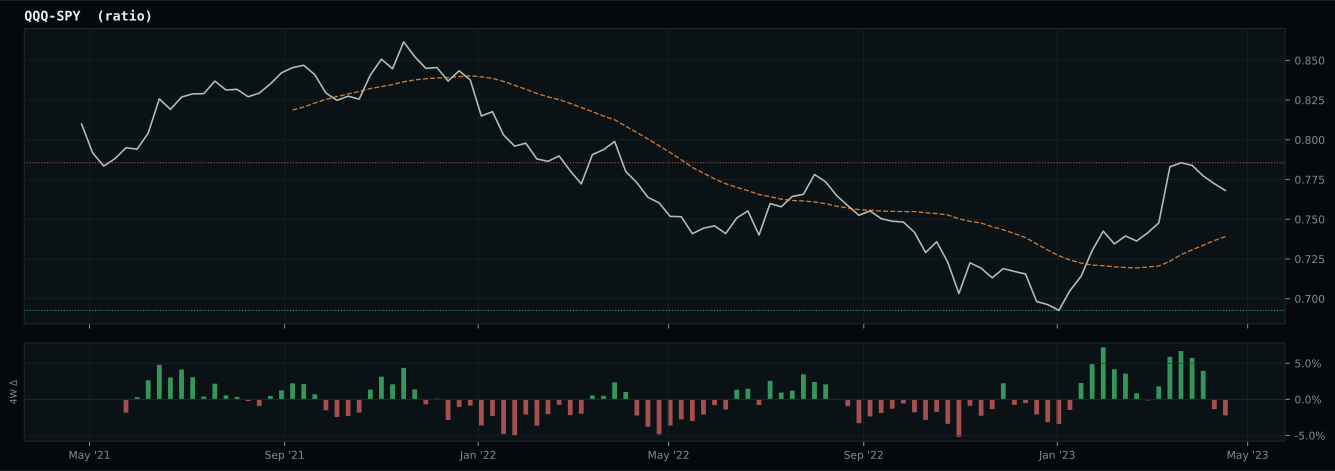
Market-implied signals behind the macro regime scores. Each ratio compares two assets; the direction and slope of the ratio is what the macro engine reads.
Crypto Regime — ValueBTC
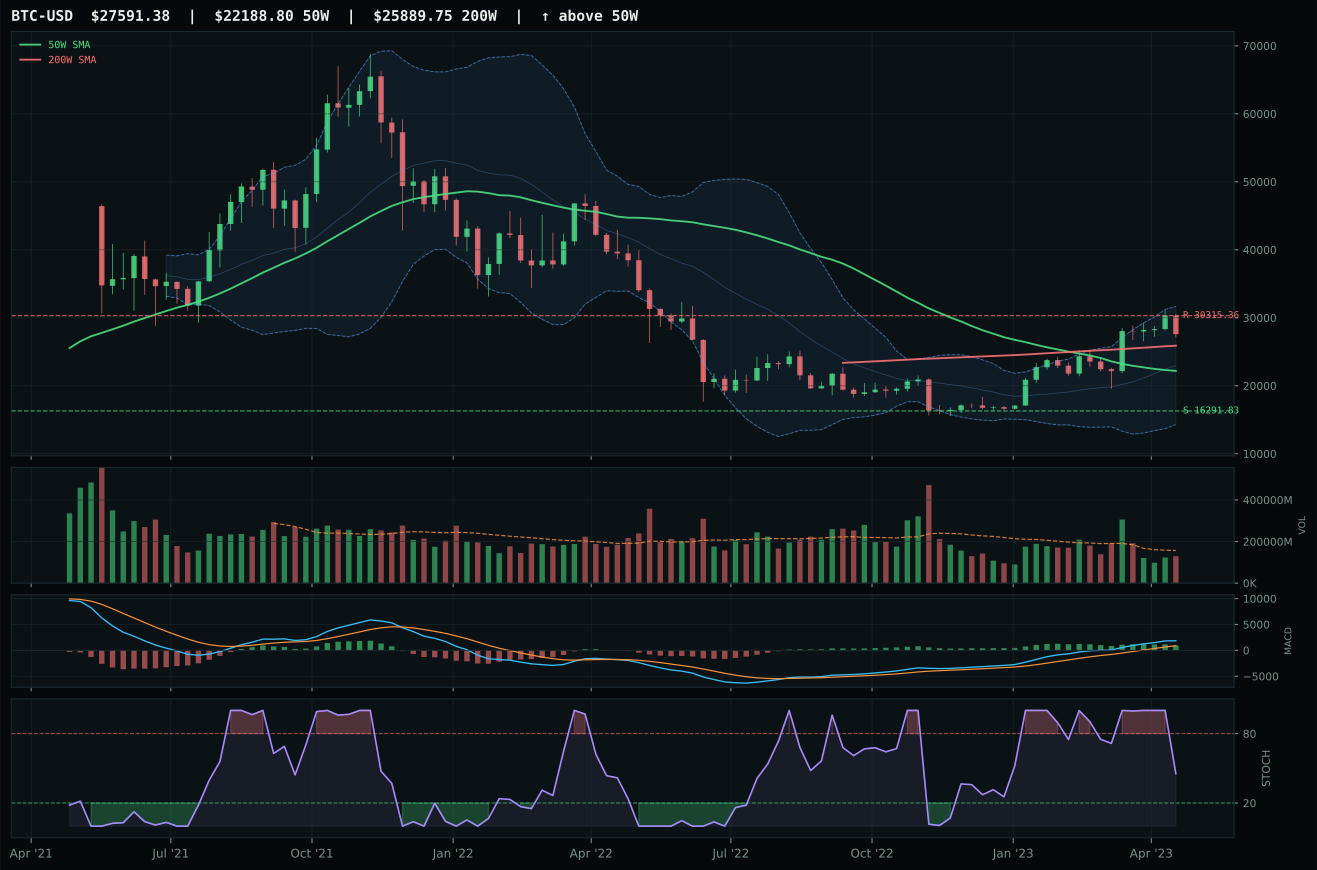
post-touch structure is too wide to count as a range; max/min close ratio is 1.86
TrendBTC not confirmed
one or more available conditions failed
Category Rankings
| Rank | Category | Winner | Score | Alloc | 4W Ret | Peers (4W) |
|---|---|---|---|---|---|---|
| 1 | Precious Metals | GLD | 64.8 | 20% | -0.46% | SLV -4.7% · GDX -4.4% |
| 2 | Technology | IGV | 62.9 | 20% | +4.38% | XLK +6.7% · CIBR +1.0% |
| 3 | Utilities & Infrastructure | XLU | 57.8 | 10% | -4.77% | IGF -1.9% · PAVE +2.4% |
| 4 | AI | BOTZ | 56.6 | 10% | +5.98% | SMH +6.7% · AIQ +6.4% |
| 5 | Defense & Aerospace | ITA | 46.8 | 10% | -2.64% | XAR -0.0% · ROKT +2.1% |
| 6 | Industrial Metals | COPX | 43.7 | 10% | -7.44% | PICK -4.5% · REMX +6.2% |
| 7 | Nuclear Energy | URA | 33.6 | 10% | +4.86% | URNM +4.9% · NLR +1.3% |
| 8 | Agriculture & Livestock | VEGI | 26.8 | 10% | -4.90% | MOO -5.0% · WEAT -9.2% |
| 9 | Emerging Markets | IEMG | 19.5 | 0% | +0.99% | INDA +2.7% · ILF +5.8% |
| 10 | Traditional Energy | XLE | 8.8 | 0% | -6.34% | FCG -1.7% · XOP -2.6% |
Precious Metals — GLD
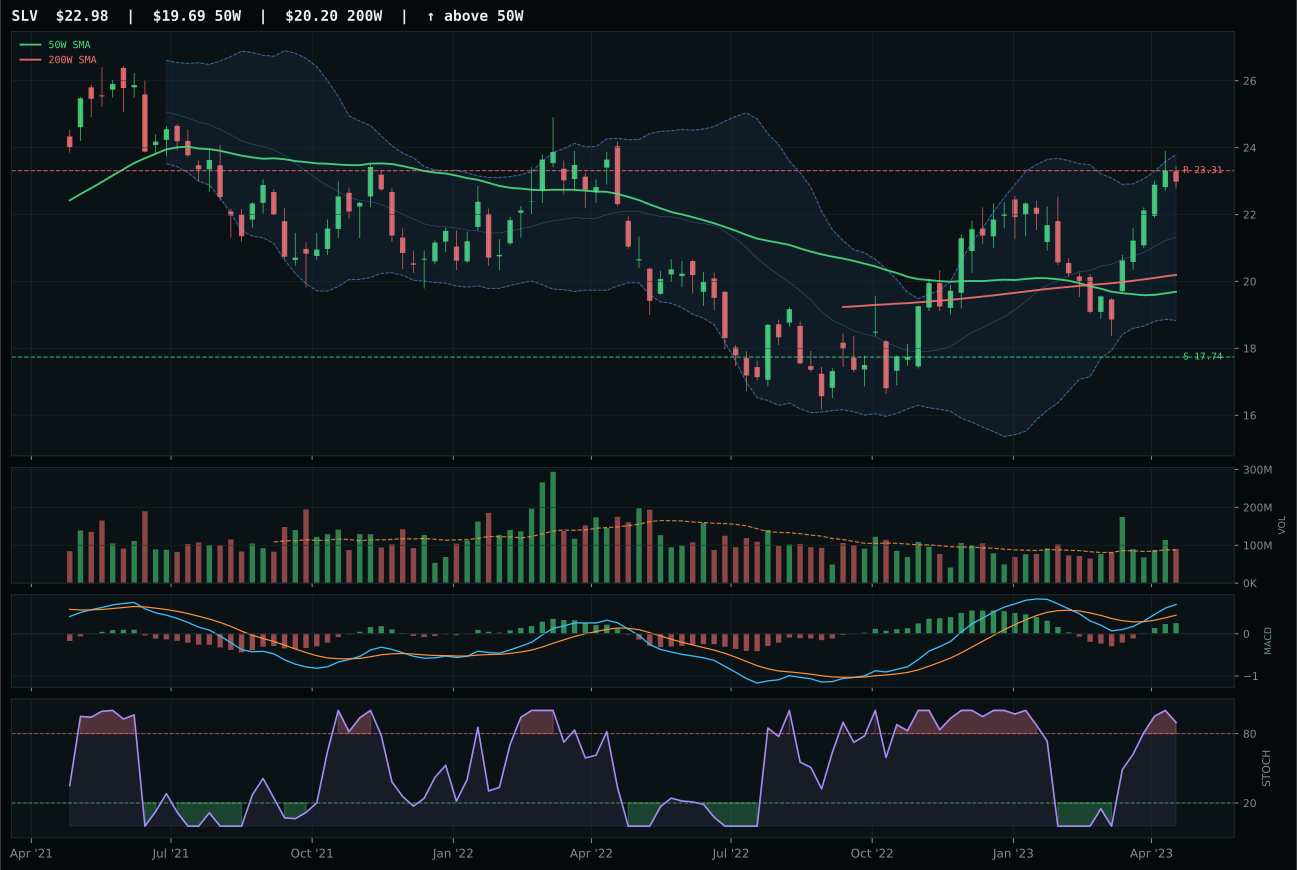
SLV has a vertical extension profile with 0.2% 13-week relative strength versus SPY.
A failed hold above support would weaken the setup.
Actionable but governed by invalidation levels.
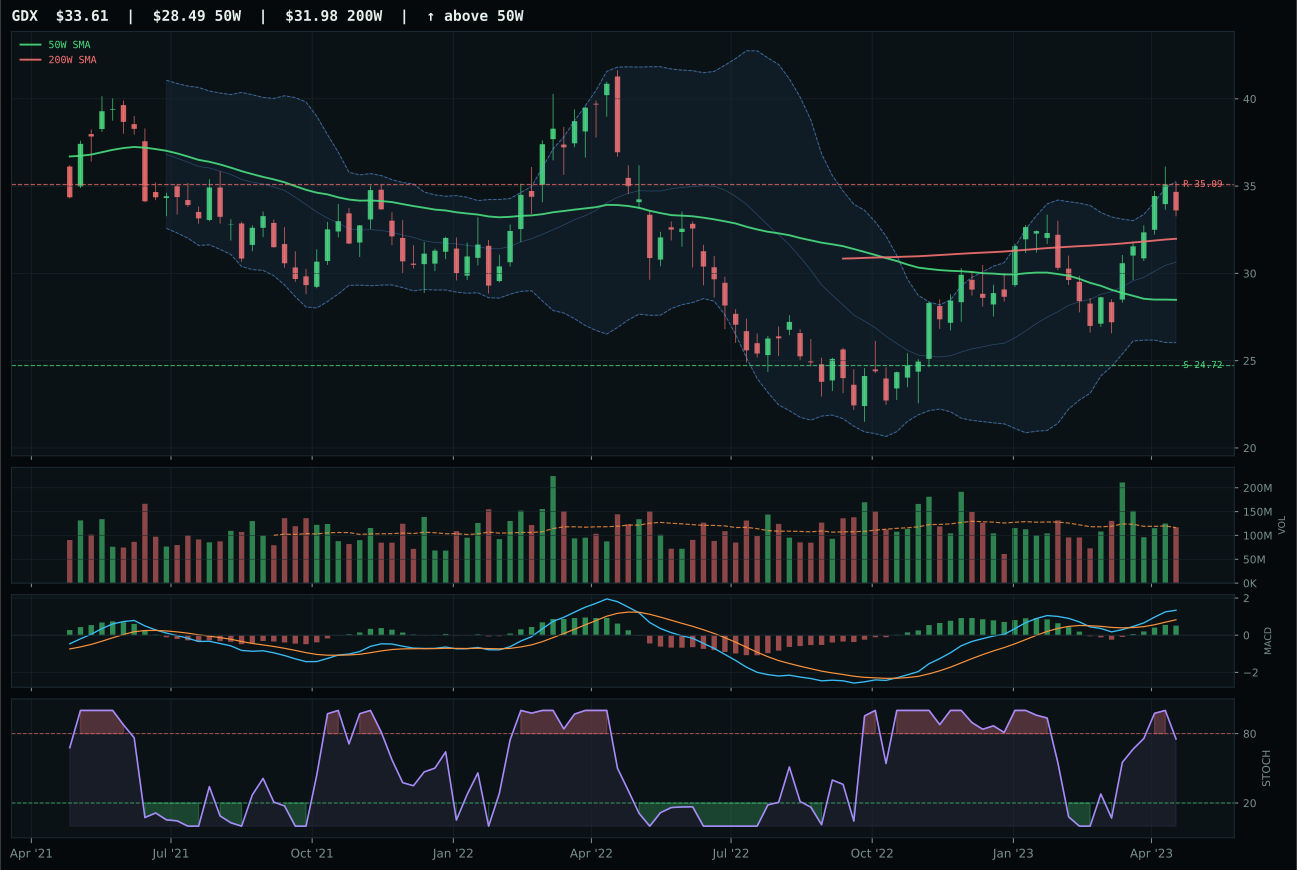
GDX has a vertical extension profile with -0.5% 13-week relative strength versus SPY.
A failed hold above support would weaken the setup.
Actionable but governed by invalidation levels.
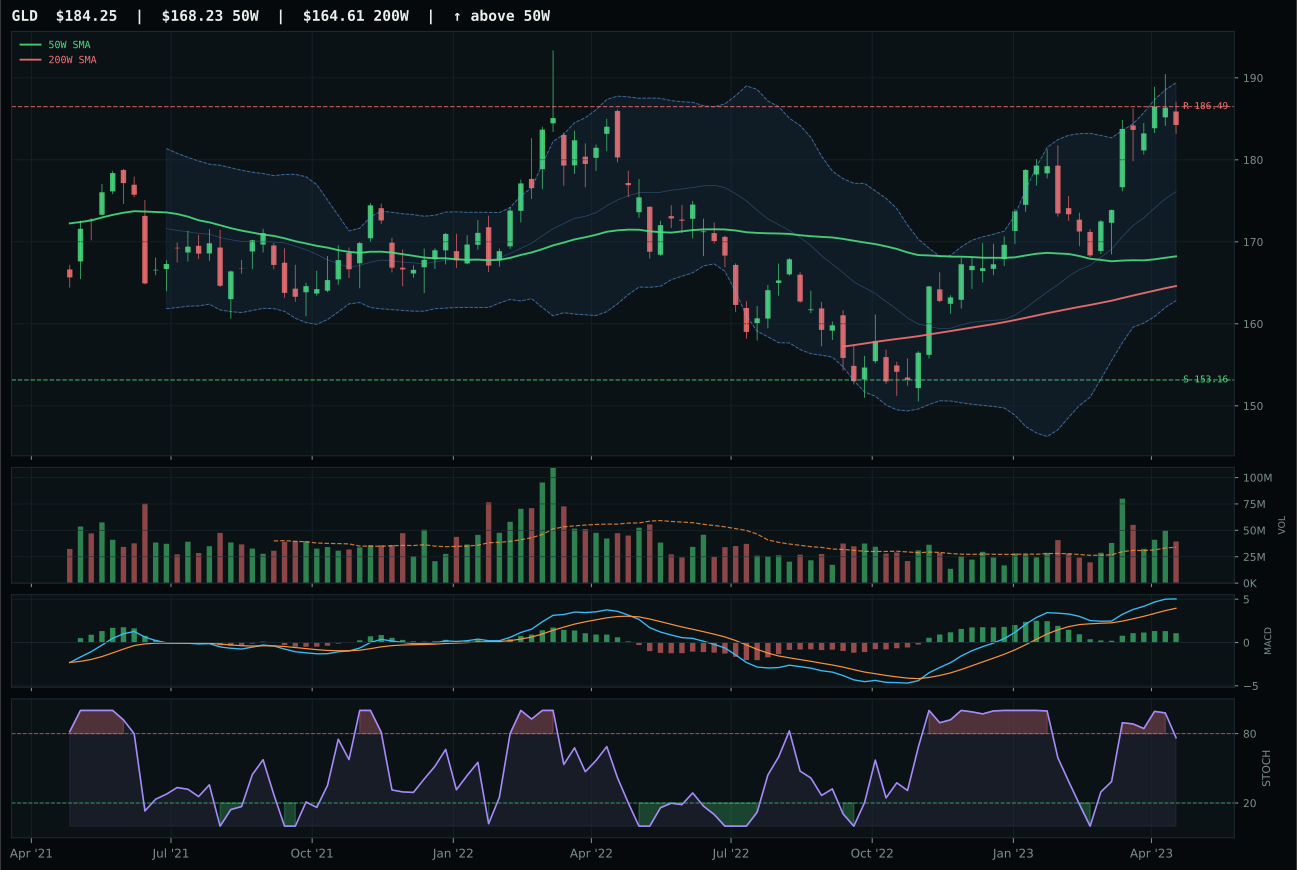
GLD has a neutral structure profile with -1.4% 13-week relative strength versus SPY.
A failed hold above support would weaken the setup.
Actionable but governed by invalidation levels.
GLD wins the top-2 slot because it pairs clean structure with the highest volume confirmation in the category: 1.16x the 20-day average proves buyers are willing to step in at this level, while SLV's neutral volume fails to validate its overbought stochastic RSI momentum. The 9.5% distance to the 50W keeps GLD's risk/reward at 46.1 (tight but manageable), whereas SLV's 16.7% extension pushes buyers into pure momentum territory where late comers cannot exit cleanly. MACD bullish but flattening is defensive positioning: it acknowledges strength without betting on acceleration, exactly the tone a disinflation portfolio needs. Category-relative strength of -0.9% reveals GLD is the defensive pick within metals, a tell that institutional flows favor monetary reserve value over industrial speculation.
Precious Metals earned 10% allocation as the second-highest-ranked category at 64.8 score, paired with Technology to form the core of the portfolio. Disinflation environment strongly supports this positioning: the active macro descriptor 'disinflation pressure' contributes +8 points, while risk appetite is -4, creating a regime where defensive real assets attract capital. Category-level macro fit of 60.0/100 is the strongest foundation for any holding, reflecting alignment between technical evidence and macro narrative. GLD's above-average volume provides liquidity during volatility spikes, essential for a 10% position in a portfolio under stress. The portfolio is not betting on gold rally; it is positioning defensive capital in an asset class that benefits from liquidity tightening and credit stress, both active descriptors. SLV's more extended setup would have created entry risk. This allocation reflects macro clarity, not technical excitement.
Technology — IGV
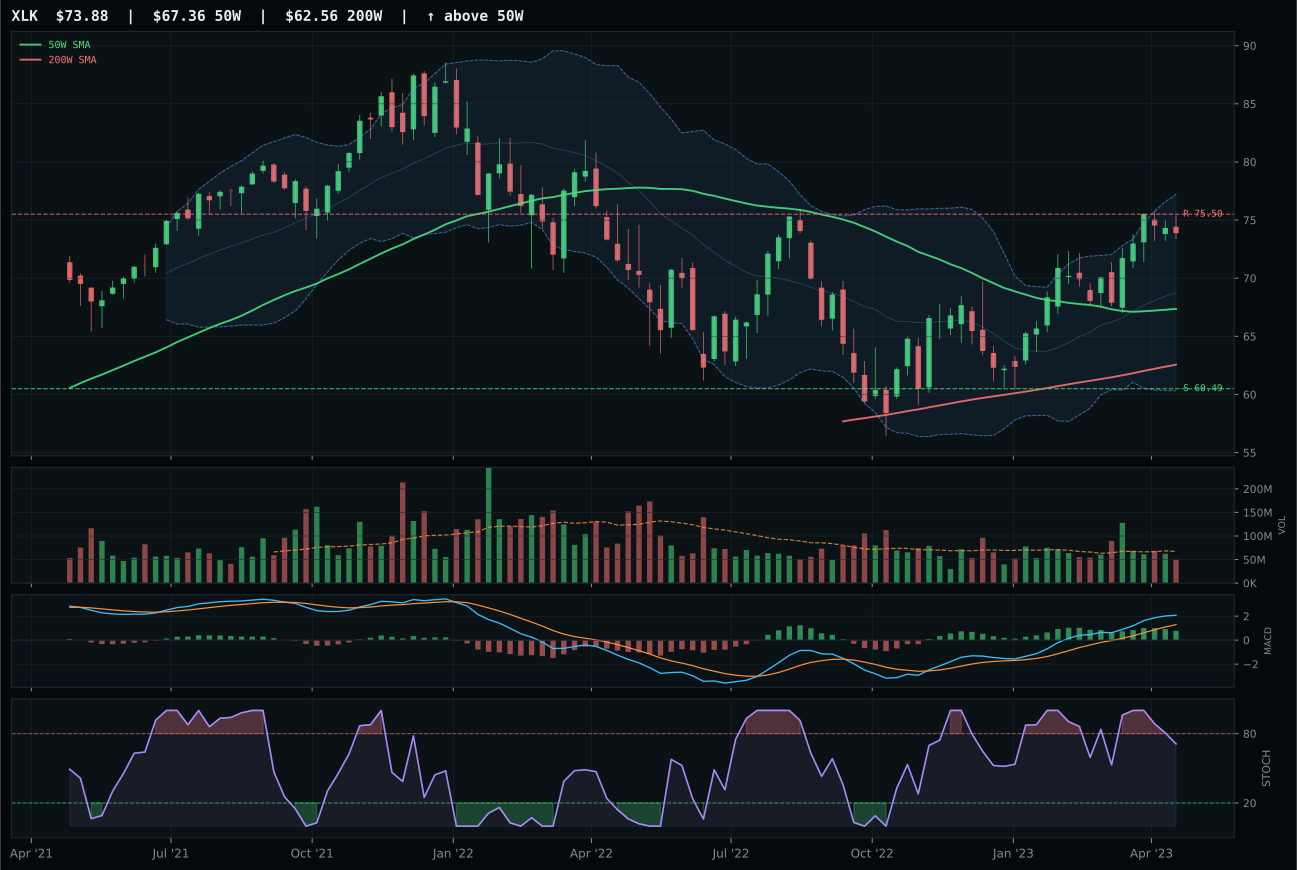
XLK has a neutral structure profile with 8.4% 13-week relative strength versus SPY.
A failed hold above support would weaken the setup.
Actionable but governed by invalidation levels.
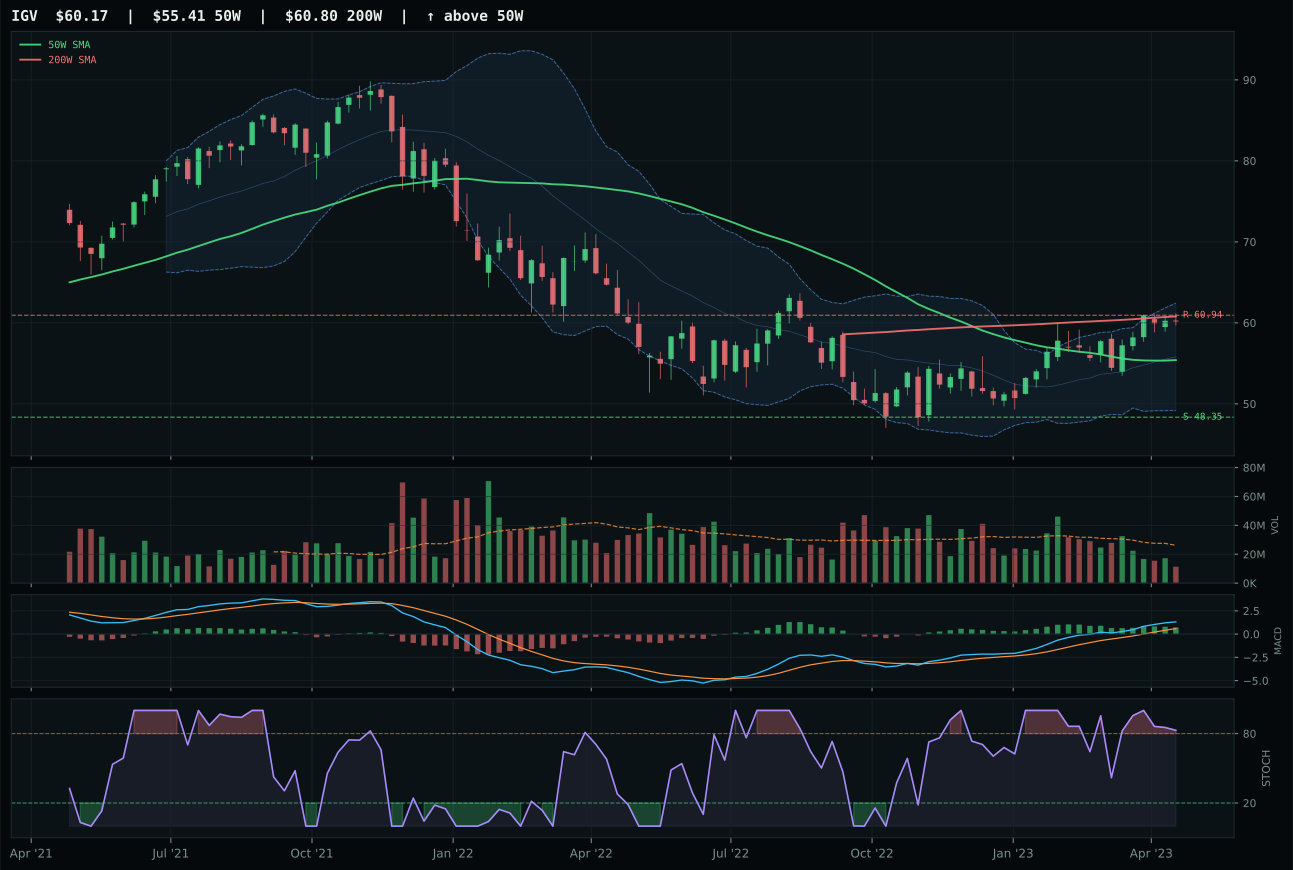
IGV has a neutral structure profile with 7.3% 13-week relative strength versus SPY.
A failed hold above support would weaken the setup.
Actionable but governed by invalidation levels.
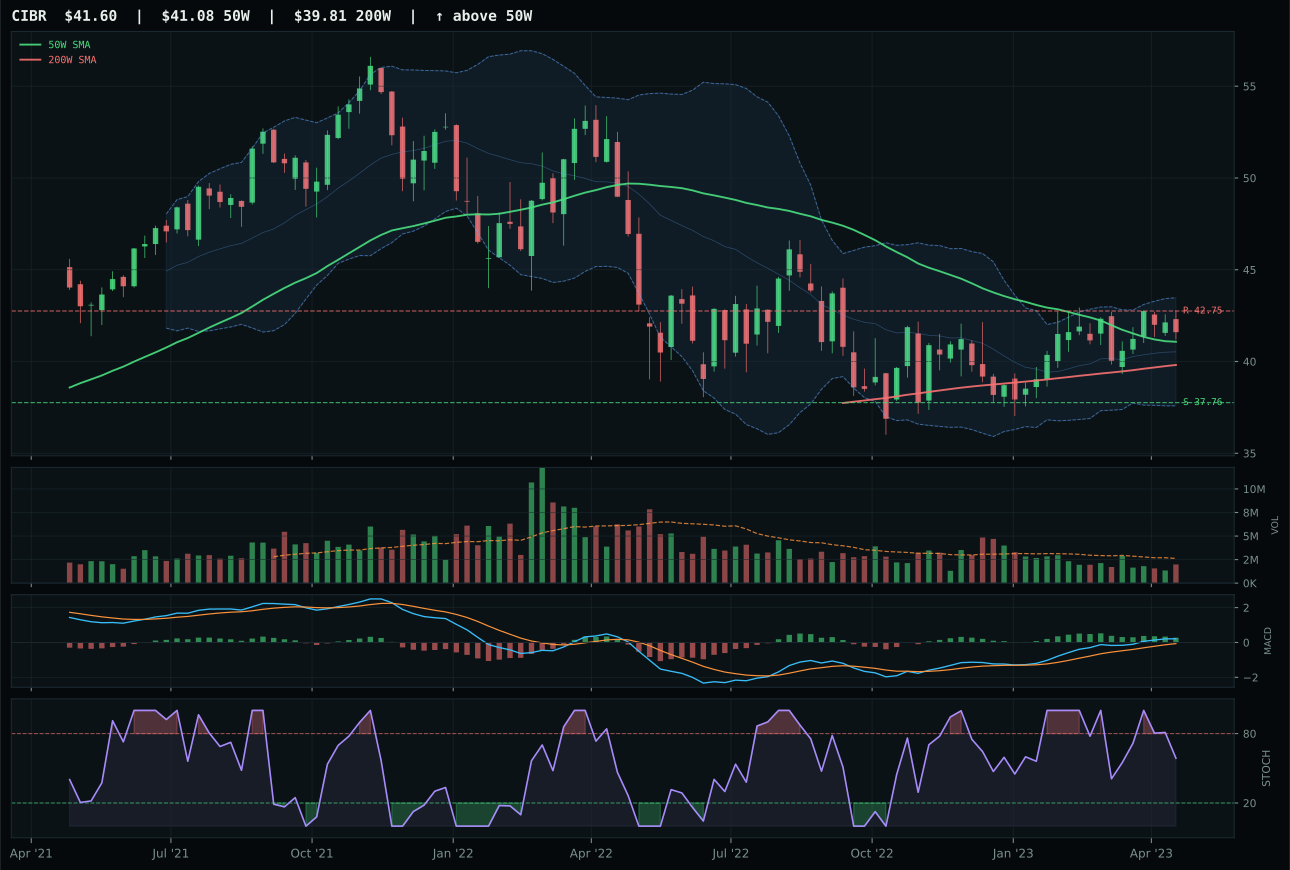
CIBR has a compression near 50W profile with 2.5% 13-week relative strength versus SPY.
A failed hold above support would weaken the setup.
Actionable but governed by invalidation levels.
IGV wins the category because its MACD is bullish and improving while stochastic RSI rolls over from overbought, a setup that flags late entry risk but confirms momentum persistence. The 7.3% relative strength versus SPY tells you institutional buyers are still accumulating duration-sensitive growth despite a 67% extension above the 50W—a crowded signal. XLK lost on technical cleanliness alone: its MACD is bullish but flattening (momentum decay) while its stochastic RSI falls into neutral territory, signaling exhaustion before IGV's chart showed it. At 8.6% above the 50W, IGV is tight to trend with volume at 0.43x the 20-day average, which means this breakout was funded with light participation—each new buyer is fighting thinner order flow, but the existing holders haven't sold.
Technology earned 10% because it ranked among the top-two eligible categories this week, securing a position at 10% allocation. The category score of 62.9 reflects disinflation tailwinds that favor duration-sensitive equity at a time when credit stress is active; risk appetite remains positive, offsetting liquidity stress headwinds. IGV's neutral structure and bullish MACD give the portfolio real-time downside definition (support at 48.35) while keeping upside optionality intact if the setup sustains. This is not a chase—it is a disciplined entry into an already-extended segment during a macro regime that rewards patient capital. The core tension is visible: XLK actually posted stronger technical evidence (73.7/100 vs. 64.4/100) but failed on macro fit, proving this category wins on breadth sponsorship rather than single-name momentum.
Utilities & Infrastructure — XLU
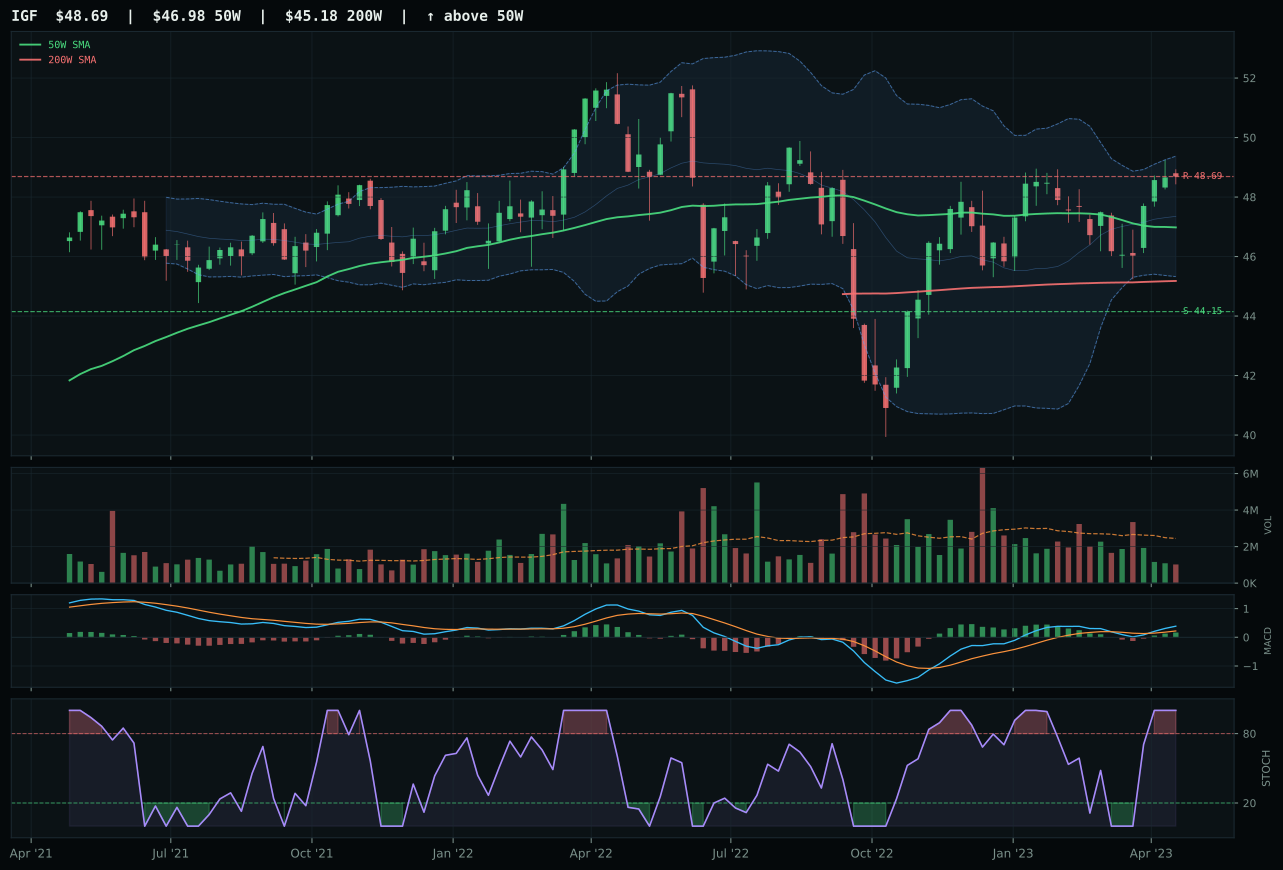
IGF has a neutral structure profile with -3.8% 13-week relative strength versus SPY.
A failed hold above support would weaken the setup.
Actionable but governed by invalidation levels.
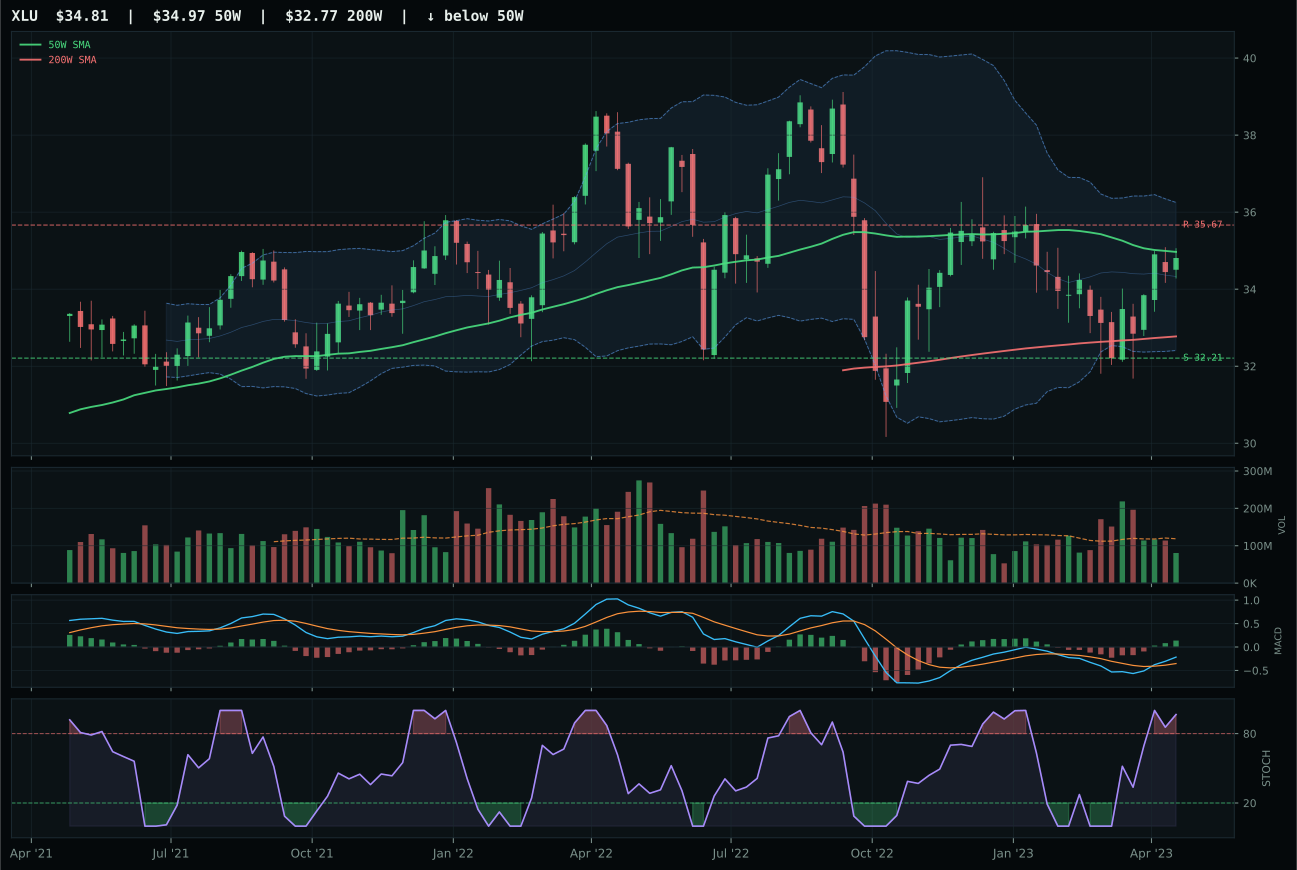
XLU has a compression near 50W profile with -3.6% 13-week relative strength versus SPY.
A failed hold above support would weaken the setup.
Actionable but governed by invalidation levels.
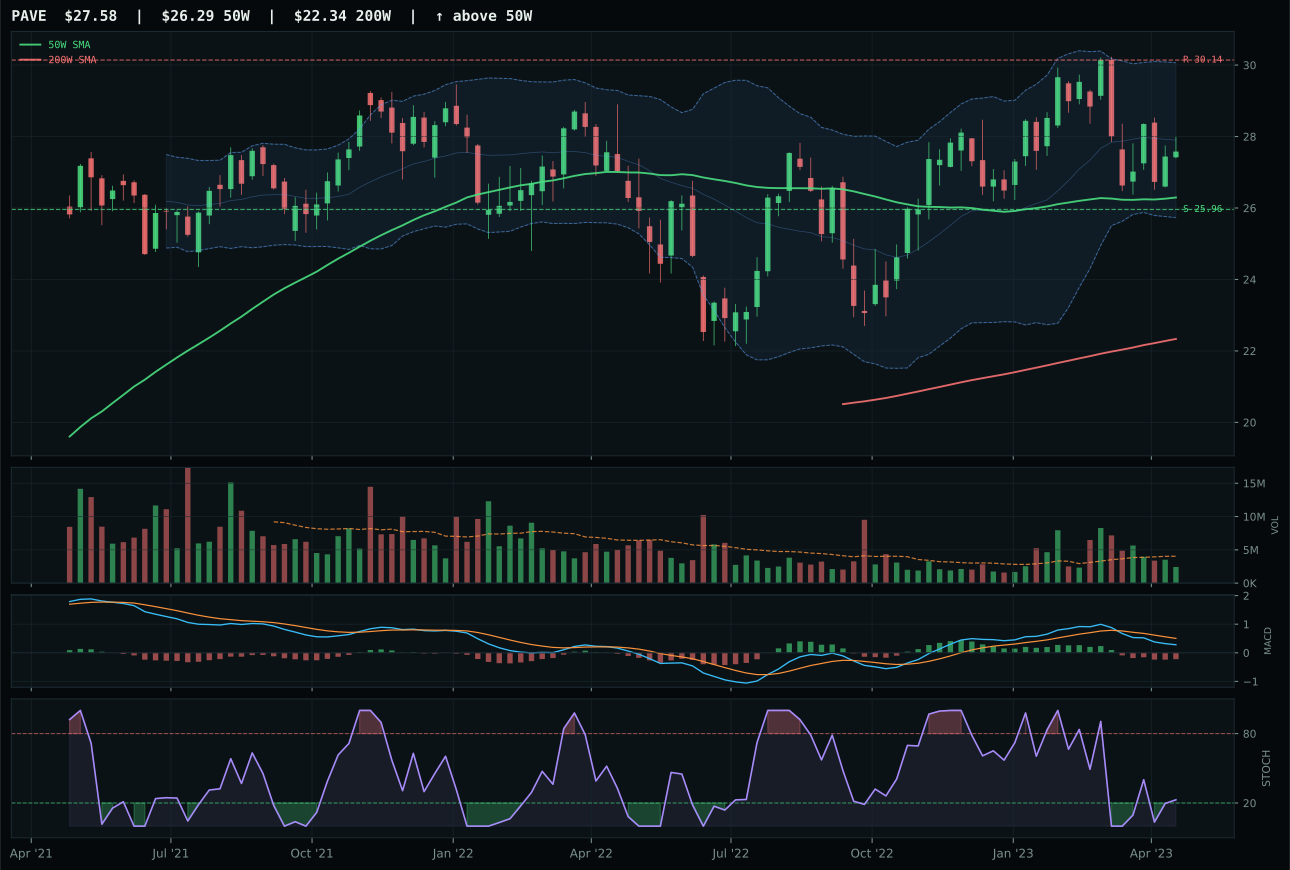
PAVE has a neutral structure profile with -4.2% 13-week relative strength versus SPY.
A failed hold above support would weaken the setup.
Actionable but governed by invalidation levels.
XLU wins because its compression setup—just 0.5% below the 50W—paired with 100.0 timing and bullish, improving MACD creates the tightest entry geometry in the category. Stochastic RSI at overbought 0.96 signals exhaustion of the bounce, but the near-50W positioning means reversals can be contained with minimal loss if the setup fails. IGF's neutral structure (higher Fib zone at 0.236) and 90.0 timing lose the micro-decision purely on distance—IGF sits 8.6% above support, requiring more risk to enter. Volume thin participation is identical in both; XLU's 0.2% category-relative strength barely beats IGF's 0.0%, confirming this is a peer selection, not category conviction.
Utilities & Infrastructure earned 5% allocation as a tier-2 position despite a modest 57.8 score, ranking fifth among ten categories. Disinflation environment strongly favors defensive regulated utilities: the active descriptor 'disinflation pressure' contributes +6 points while the transition/mixed macro state adds +4, creating a 62.0/100 category-level macro fit. XLU's 66.5/100 technical evidence provides real support—compression near the 50W is the safest defensive entry available in the portfolio. The 58.4/100 risk/reward reflects minimal upside (2.4% to resistance) but only 8.1% downside to support, asymmetric in a disinflation world where volatility favors tight stops. To upgrade this to 5% allocation, XLU would need to break above 35.67 resistance on volume, signaling shift from compression into breakout mode. Current position is defensive float, appropriate for a portfolio hedging duration and credit stress simultaneously.
AI — BOTZ
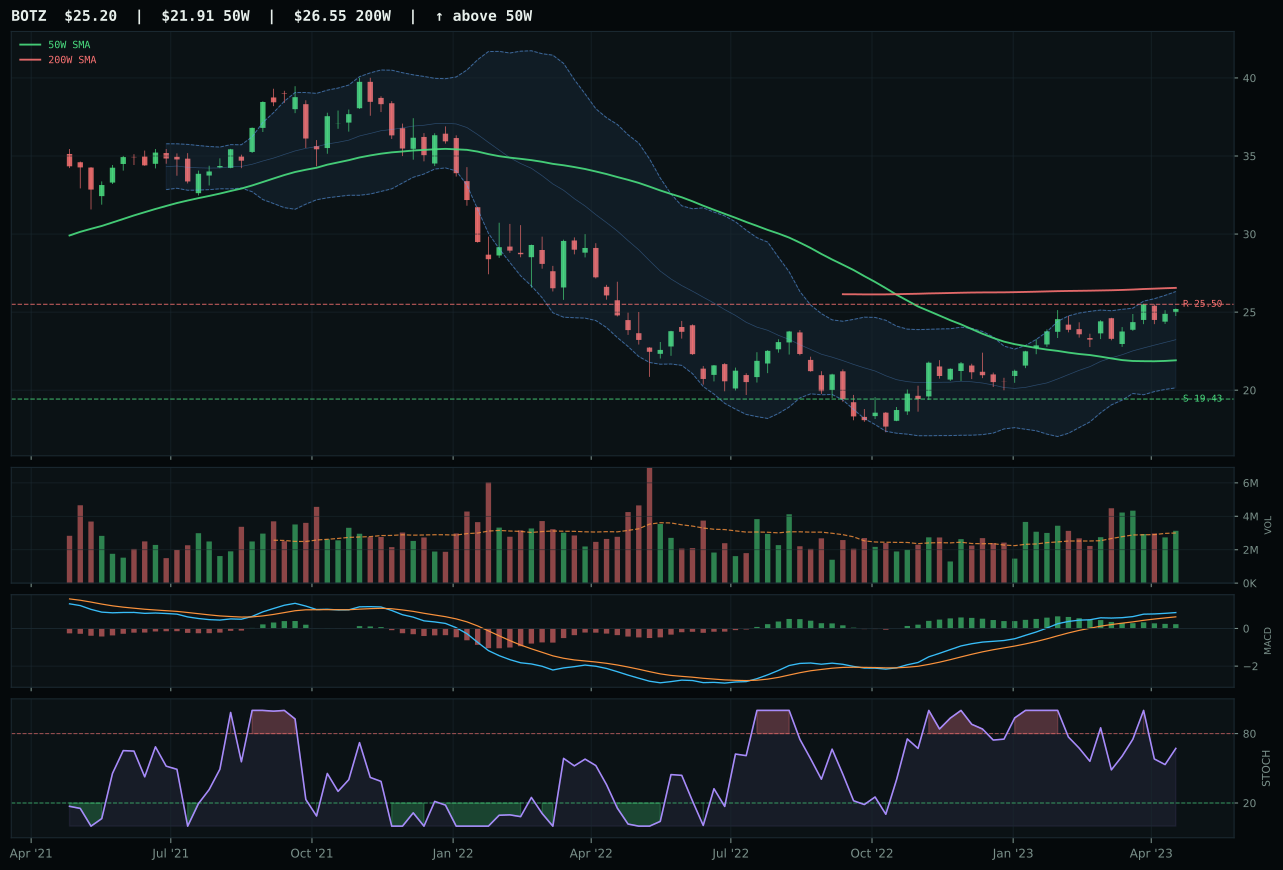
BOTZ has a neutral structure profile with 6.1% 13-week relative strength versus SPY.
A failed hold above support would weaken the setup.
Actionable but governed by invalidation levels.
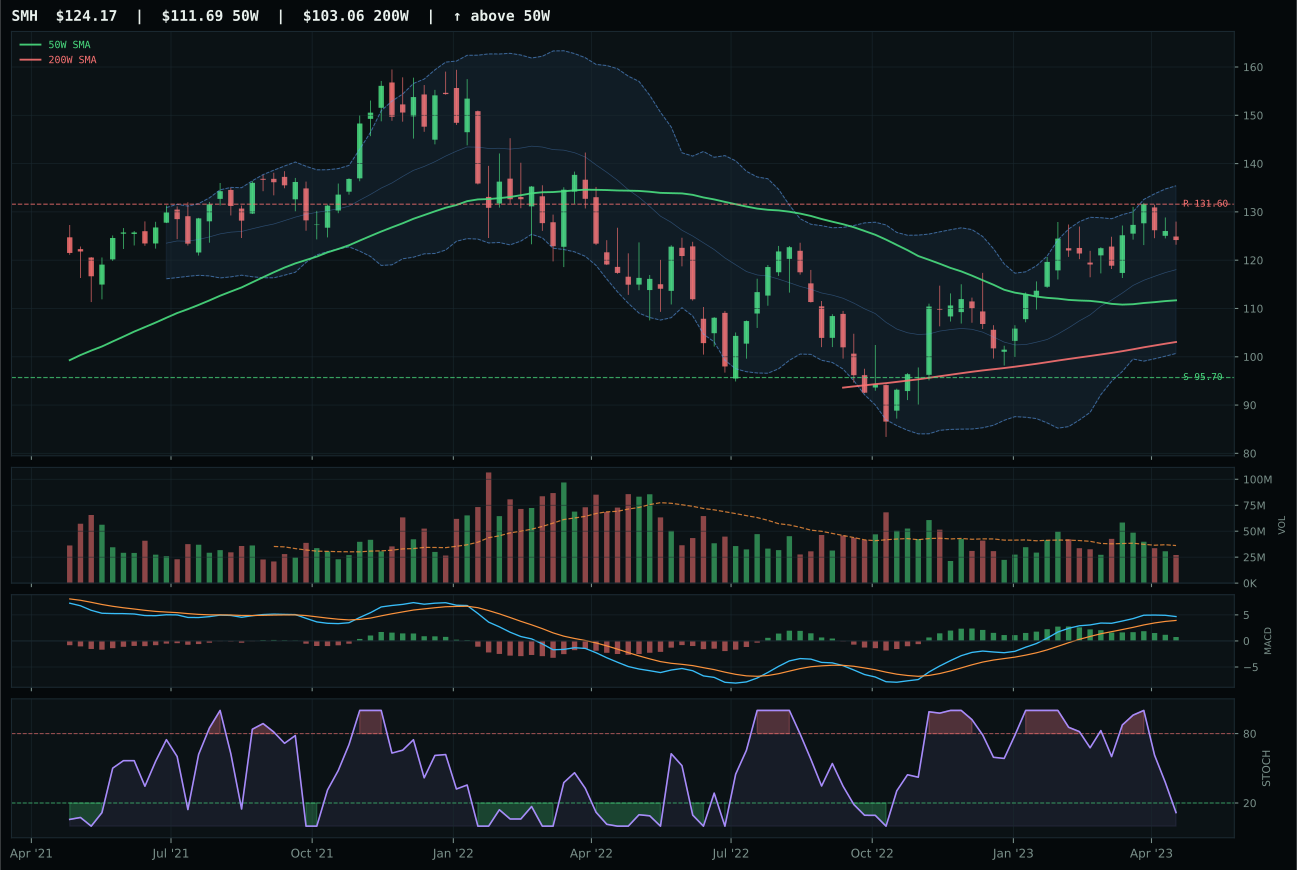
SMH has a neutral structure profile with 5.1% 13-week relative strength versus SPY.
A failed hold above support would weaken the setup.
Actionable but governed by invalidation levels.
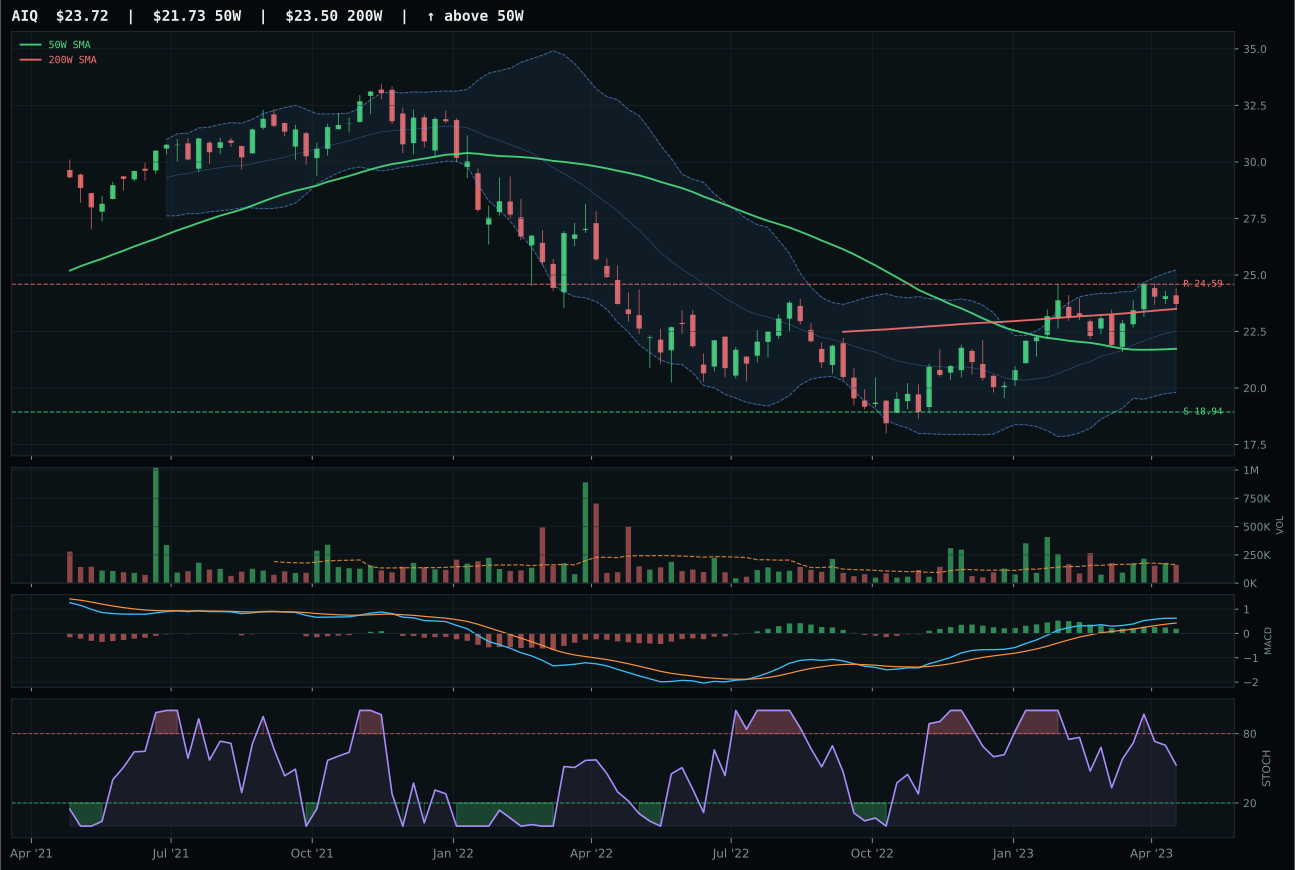
AIQ has a neutral structure profile with 2.5% 13-week relative strength versus SPY.
A failed hold above support would weaken the setup.
Tracked, but not top-2 eligible because: .
BOTZ wins because neutral volume at 1.04x the 20-day average provides better confirmation than SMH's thin participation (0.65x), meaning this setup has real sponsorship rather than bounce mechanics. The 1.0% category-relative strength edges out SMH's 0.0%, a small margin that reflects BOTZ's robotics and physical AI cyclicality capturing demand that semiconductors haven't yet priced. MACD is bullish but flattening in both names, yet BOTZ's stochastic RSI sits at 0.67 (falling/neutral) while SMH bottoms at oversold, telling you BOTZ is normalizing after a push rather than reversing from panic. Price sits 15% above the 50W in a near-52-week-high setup—late to the move, but the weight of flow confirms serious accumulation.
AI earned 5% as a tier-2 category, below the top-two cutoff despite strong macro sponsorship from AI growth narratives and risk appetite signals. The category score of 56.6 reflects technical fragmentation: SMH reasoned 66.3/100 while BOTZ checked in at 65.0/100, a virtual tie that forced the decision to the volume-price confirmation layer where neutral participation beat thin. Macro fit is solid at 59.0/100—AI growth sponsorship is active at +14 and risk appetite is +10—but that alone cannot override a category score ranking third or fourth among the ten. To earn top-2 status, AI would need either SMH's more decisive technical breakout to confirm or BOTZ's setup to tighten closer to the 50W, reducing entry risk. For now, the 5% slot acknowledges the macro case while respecting technical caution.
Defense & Aerospace — ITA
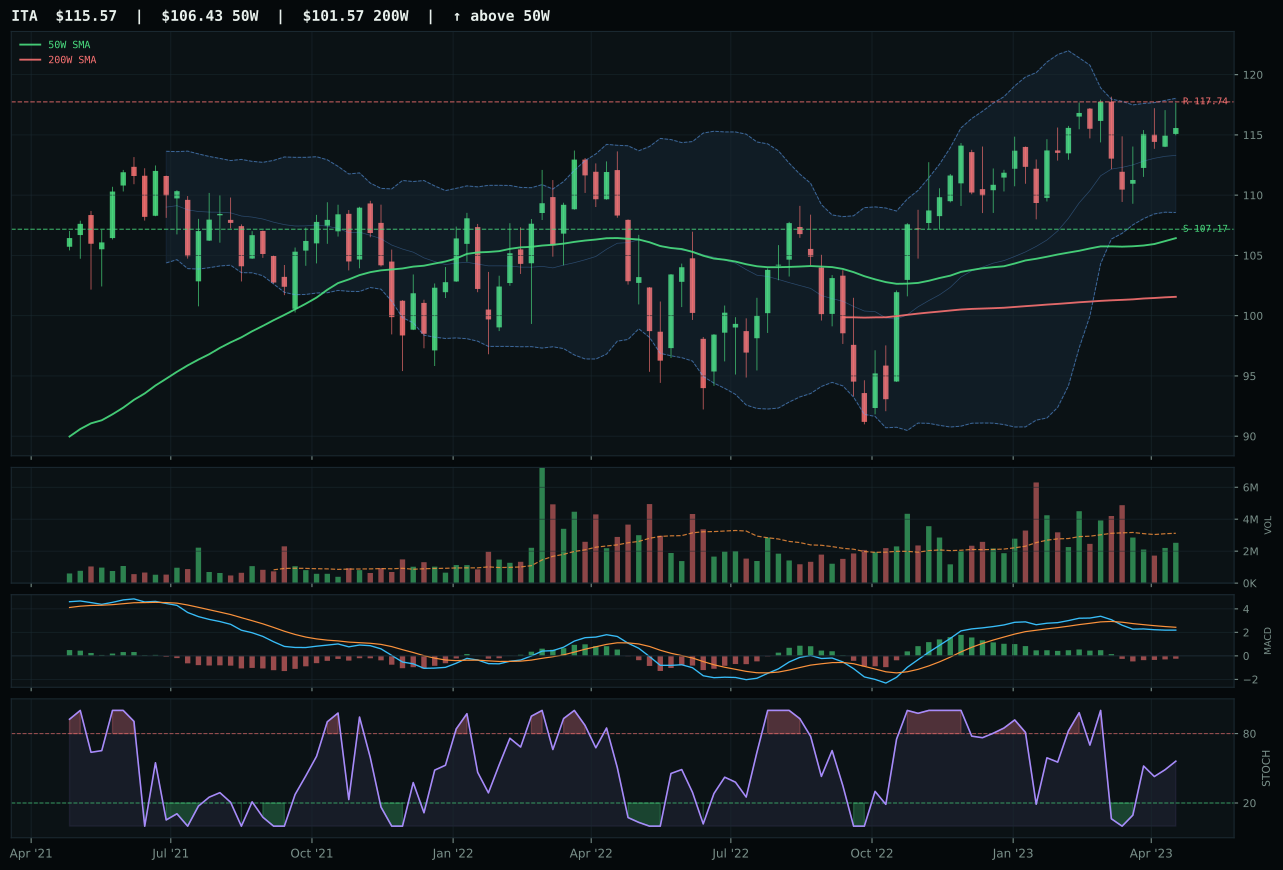
ITA has a neutral structure profile with 1.6% 13-week relative strength versus SPY.
A failed hold above support would weaken the setup.
Actionable but governed by invalidation levels.
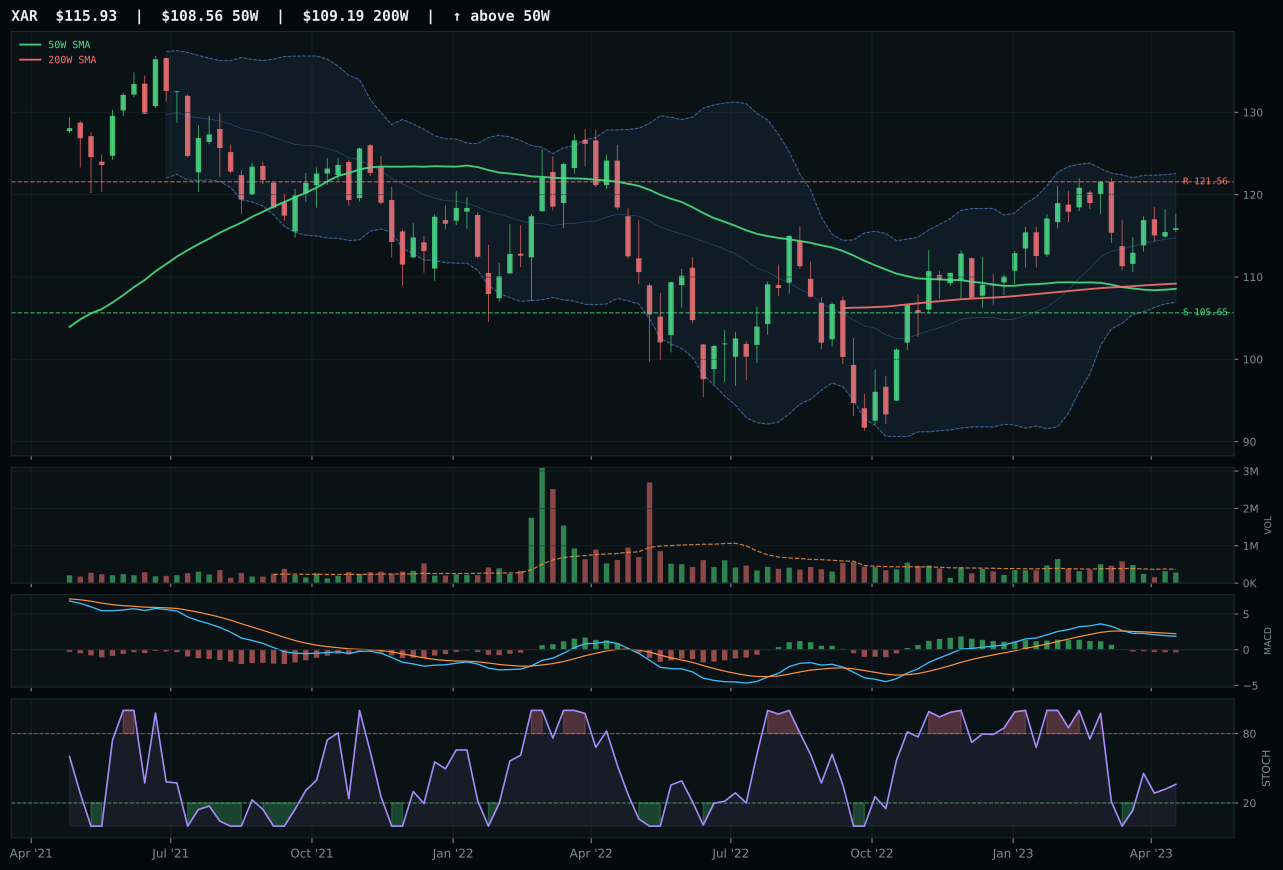
XAR has a neutral structure profile with -1.1% 13-week relative strength versus SPY.
A failed hold above support would weaken the setup.
Actionable but governed by invalidation levels.
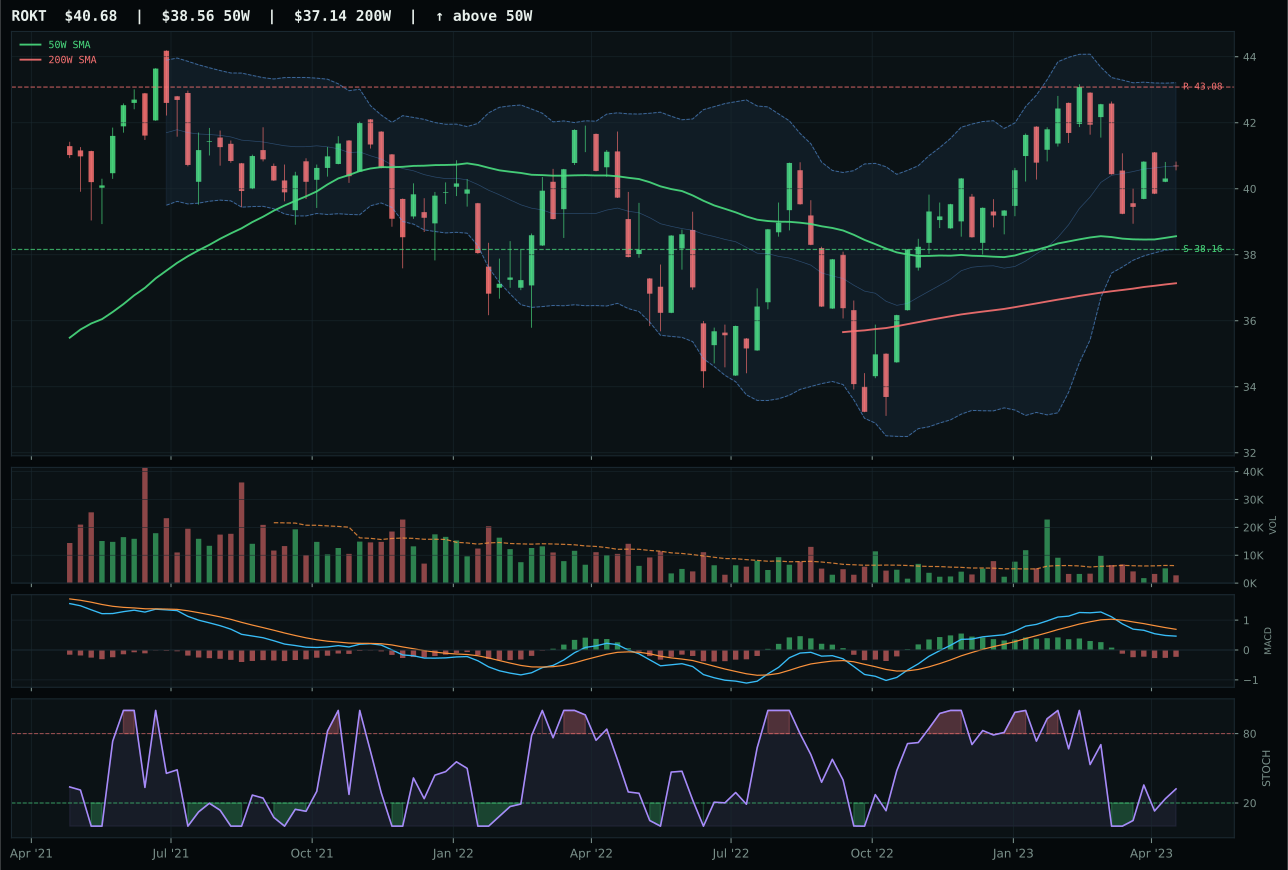
ROKT has a neutral structure profile with -4.4% 13-week relative strength versus SPY.
A failed hold above support would weaken the setup.
Tracked, but not top-2 eligible because: .
ITA wins by converting bearish MACD momentum into a rising mid-zone stochastic RSI, a rare setup where technical repair is visible before price breaks higher. The 83.0 timing score dominates XAR's 70.0 because price compression at 8.6% above the 50W paired with MACD improvement creates a narrow invalidation band—if the 50W holds, upside to the 117.74 resistance runs nine percent with defined risk. Category-relative strength of 2.7% shows this ETF is outperforming peer names in a weak category, proof of selective accumulation. XAR's -1.1% relative strength and bearish/weakening MACD reveal distribution pressure and deteriorating technicals, the exact inverse of ITA's setup.
Defense & Aerospace earned 5% allocation despite a weak 46.8 category score, ranked below technology, AI, and precious metals but ahead of category exclusions. The macro regime penalizes real assets under disinflation: credit stress is barely positive at +2 while liquidity stress drains -4 points, leaving category-level macro fit at just 51.0/100. ITA's 73.9/100 technical evidence carries the position, but the weak macro/narrative score (47.0/100) means this allocation is entirely technical and tactically timed. The portfolio holds this position because ITA's timing and structure setup offers a defined pullback-into-support trade with 7.8% downside to support versus 11.6% upside to resistance—an asymmetric edge. If credit stress accelerates or trend breaks below 107, this allocation becomes vulnerable to reduction.
Industrial Metals — COPX
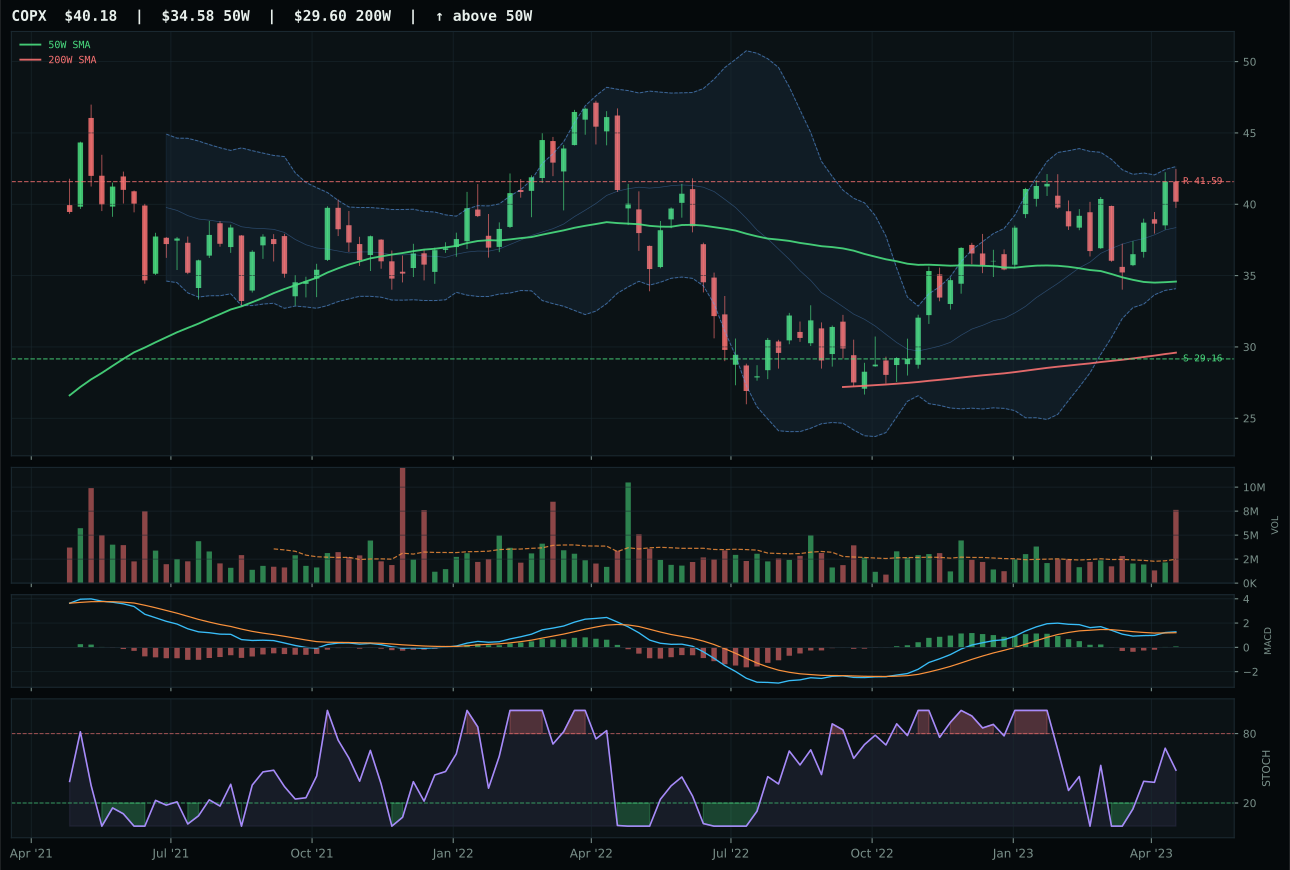
COPX has a vertical extension profile with -6.8% 13-week relative strength versus SPY.
A failed hold above support would weaken the setup.
Actionable but governed by invalidation levels.
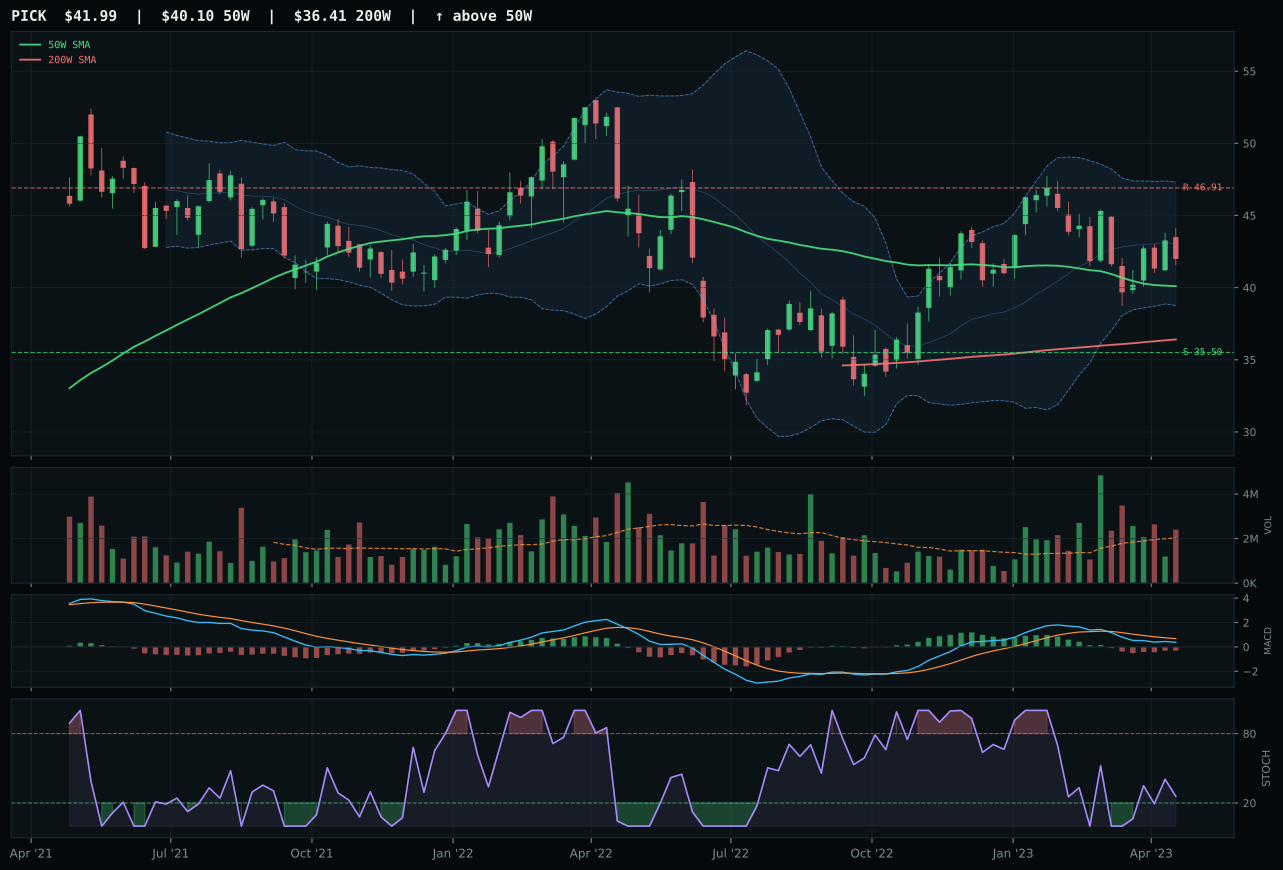
PICK has a neutral structure profile with -13.6% 13-week relative strength versus SPY.
A failed hold above support would weaken the setup.
Actionable but governed by invalidation levels.
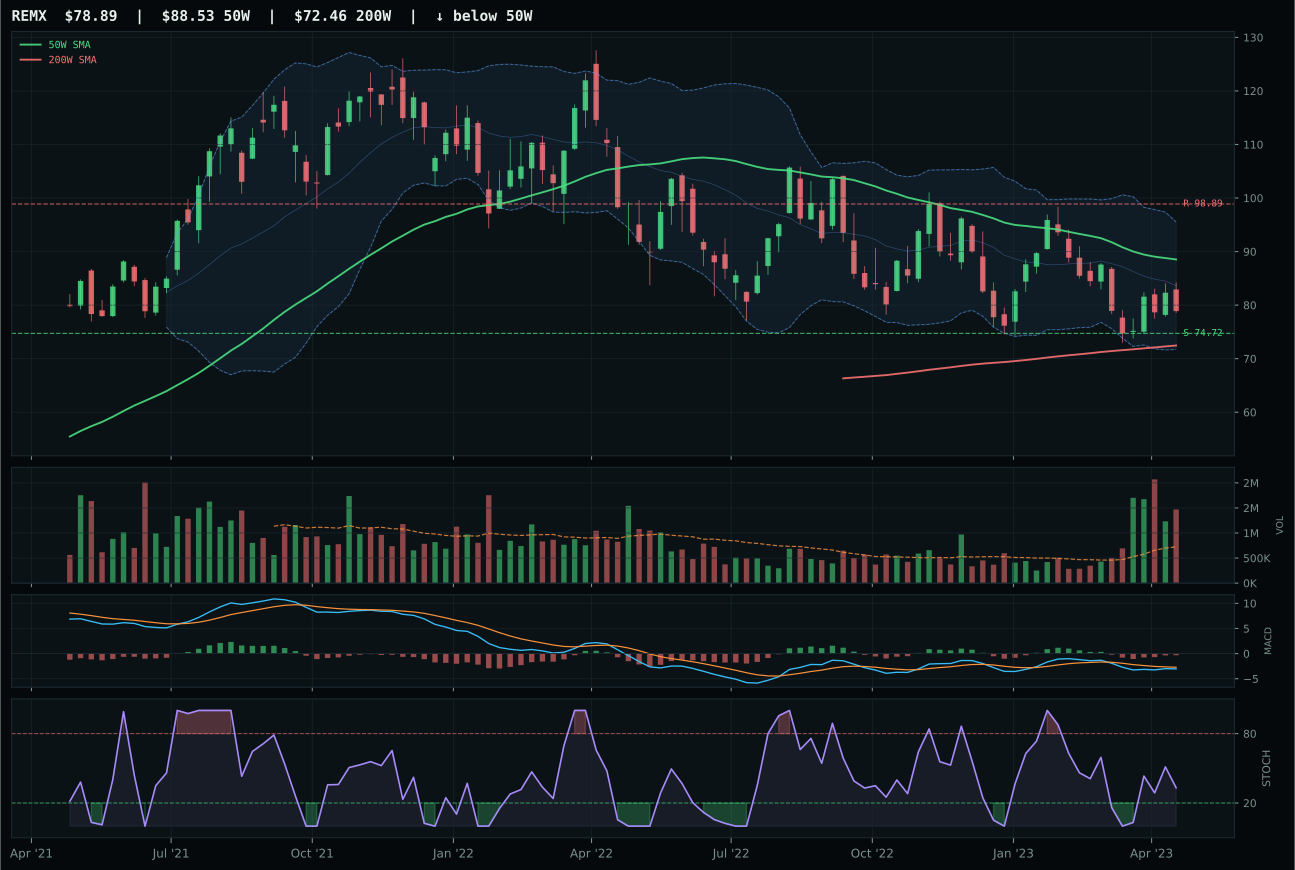
REMX has a neutral structure profile with -16.2% 13-week relative strength versus SPY.
A failed hold above support would weaken the setup.
Actionable but governed by invalidation levels.
COPX wins despite its weak -6.8% SPY-relative strength because its MACD is bullish and improving while stochastic RSI rises mid-zone at 0.48, setting up potential breakout from vertical extension. The 6.9% category-relative strength—first positive number in this weak commodity lineup—proves COPX is the chosen industrial metal proxy despite its 16.2% extension above the 50W. Volume at 3.07x the 20-day average screams distribution pressure, yet the improving MACD suggests smart money is accumulating into selling, not capitulating alongside it. PICK lost because its bearish but improving MACD lacks urgency and stochastic RSI falls into neutral, providing no real-time momentum confirmation of accumulation.
Industrial Metals earned 5% as a tier-2 category despite a low 43.7 score, ranking seventh in a lineup of ten and surviving only because macro tailwinds (metals scarcity +14, commodity breadth +10) offset weak technical evidence (COPX's 40.0/100 technical score is among the poorest held). The risk/reward is backward—38.6/100 downside protection versus only 3.4% upside to resistance—making this a pure macro hedge, not a technical setup. If metals scarcity and commodity breadth turn, this position should be lightened immediately. The 5% slot exists because the portfolio acknowledges industrial demand inflection risk in a disinflation scenario where credit tightening later proves temporary. COPX's improving MACD at elevated extension is the last thread of technical evidence; loss of 29.16 support would trigger position reduction to zero.
Nuclear Energy — URA
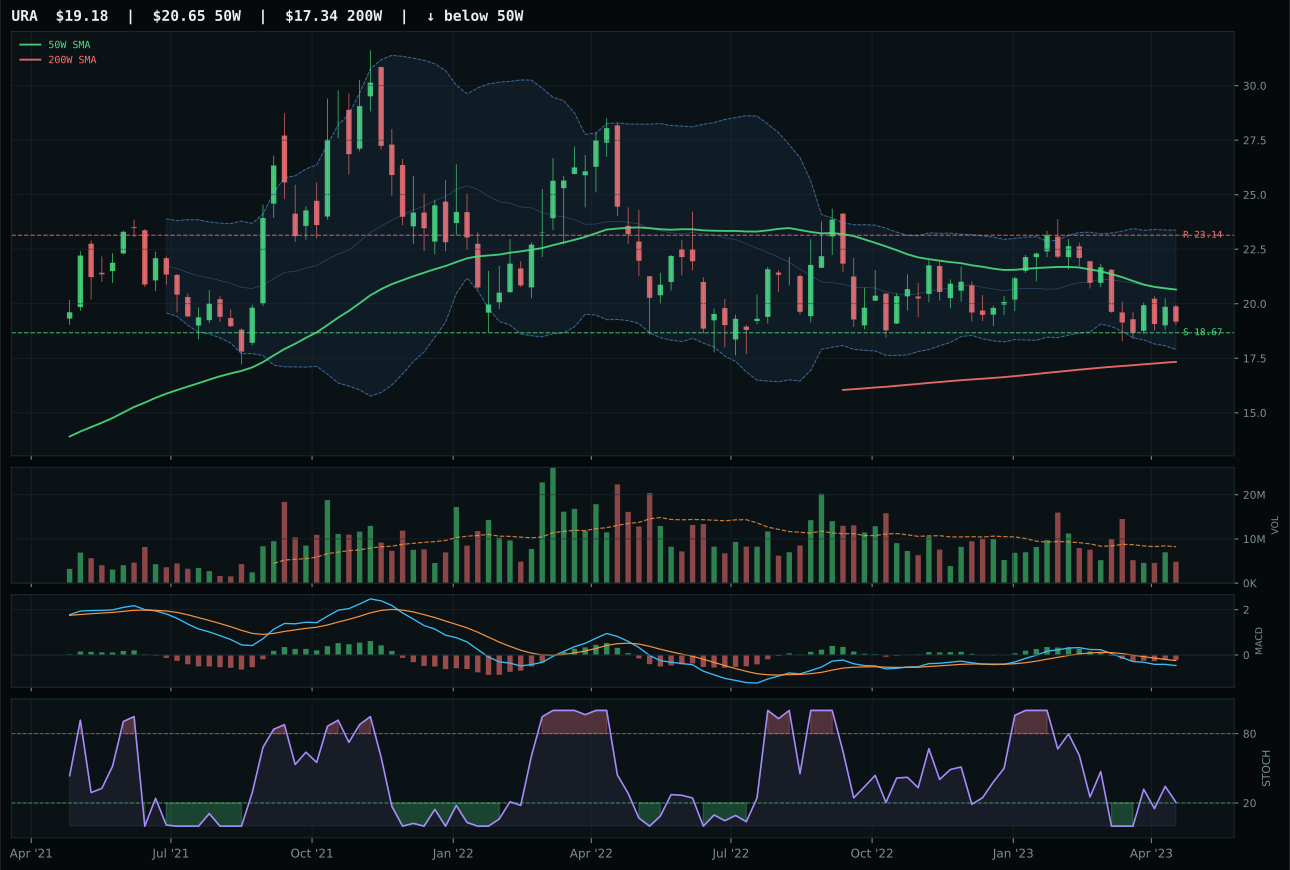
URA has a pullback into support profile with -18.1% 13-week relative strength versus SPY.
A failed hold above support would weaken the setup.
Actionable but governed by invalidation levels.
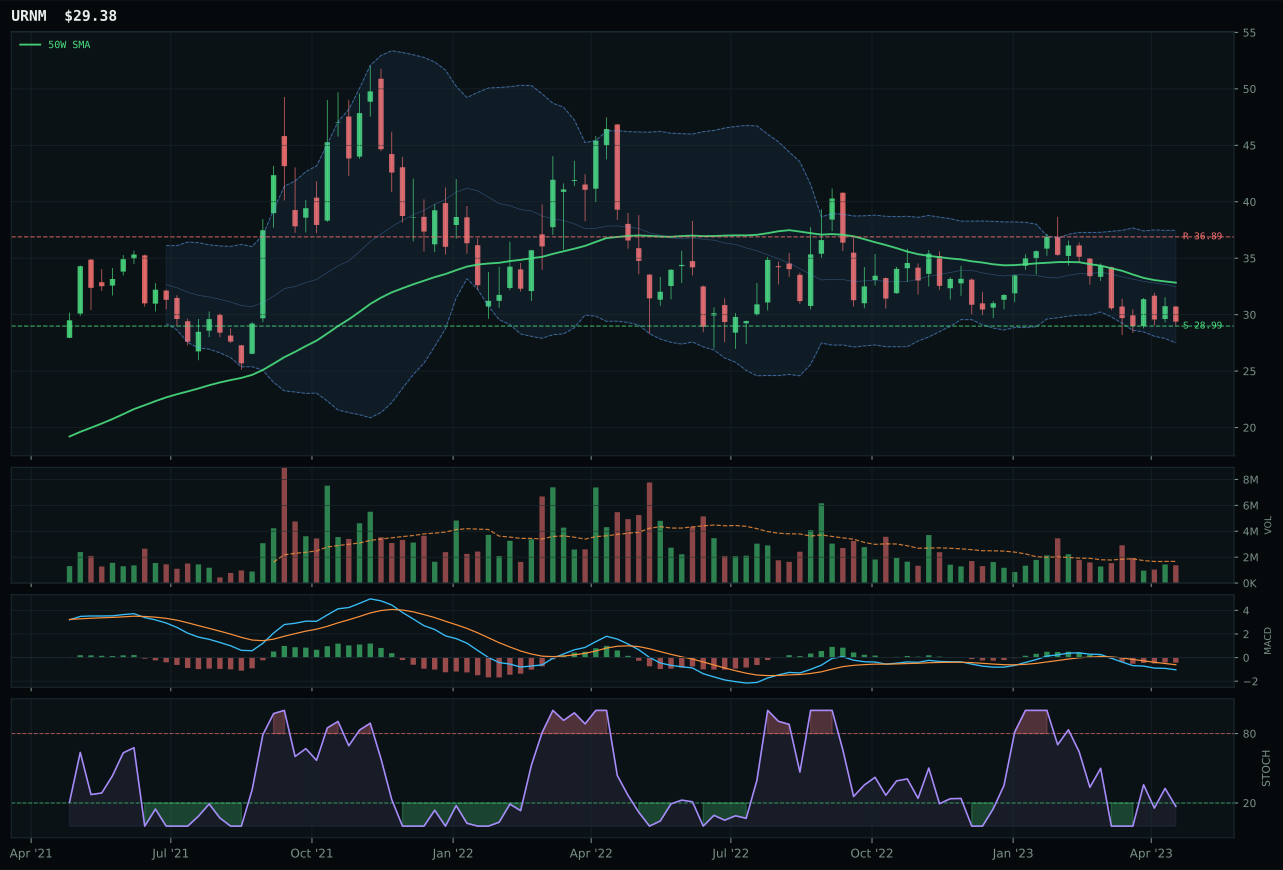
URNM has a pullback into support profile with -21.6% 13-week relative strength versus SPY.
A failed hold above support would weaken the setup.
Actionable but governed by invalidation levels.
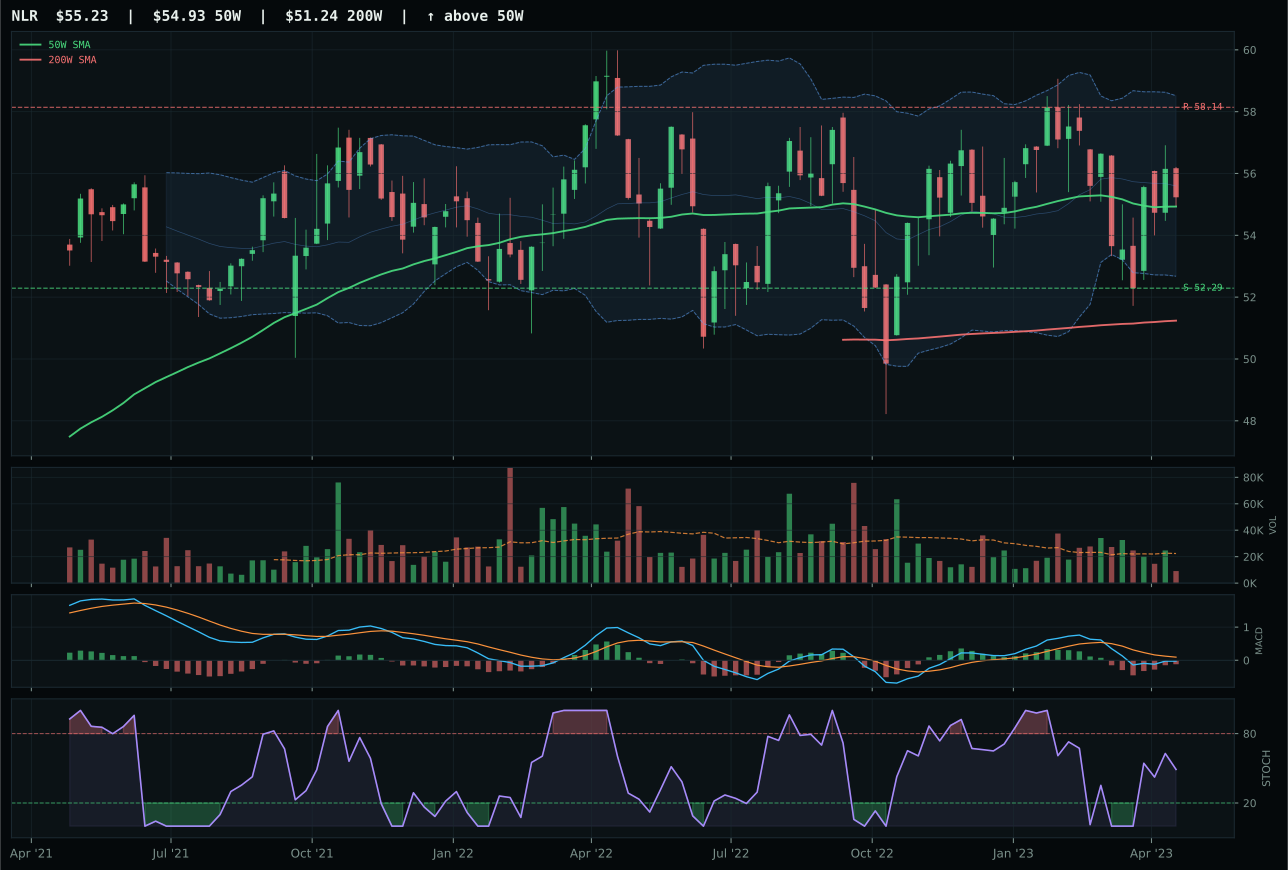
NLR has a compression near 50W profile with -6.8% 13-week relative strength versus SPY.
A failed hold above support would weaken the setup.
Tracked, but not top-2 eligible because: .
URA wins because its risk/reward scores 90.0—the highest in its category—versus URNM's 75.0, reflecting tighter support at 18.67 and defined invalidation geography. Both are pullbacks into repair zones deep below the 50W, yet URA's timing advantage comes from falling/neutral stochastic RSI at 0.21 paired with MACD bearish but improving, a setup where mechanical reversal is still ahead. The -14.0% 13-week return is severe, but thin volume at 0.58x the 20-day average at lows often precedes capitulation washouts. URNM's oversold stochastic RSI and heavier decline (-17.5% 13W) suggest continuation risk below current support.
Nuclear Energy earned 5% allocation despite a weak 33.6 score, ranking eighth and surviving only on the strength of macro tailwinds (real asset sponsorship +7, AI growth sponsorship +5) offsetting weak technical evidence (42.5/100 for the winner). Category-level macro fit is neutral at 50.0/100, reflecting no category-specific descriptors, meaning the position is pure macro hedge insurance. URA's 90.0 risk/reward and 85.0 timing create tactical definition, but the 8.5/100 momentum confirmation reveals zero earnings or growth sponsorship—this is entirely a deep-value reversal trade. The -18.1% SPY-relative strength tells you nuclear energy is hated in this regime. The 5% slot reflects a bet that if energy, inflation, or demand sentiment shifts, nuclear capacity becomes critical infrastructure. Loss of the 18.67 support would trigger immediate exit; a weekly close above 23.14 resistance would justify adding on technical confirmation of stabilization.
Agriculture & Livestock — VEGI
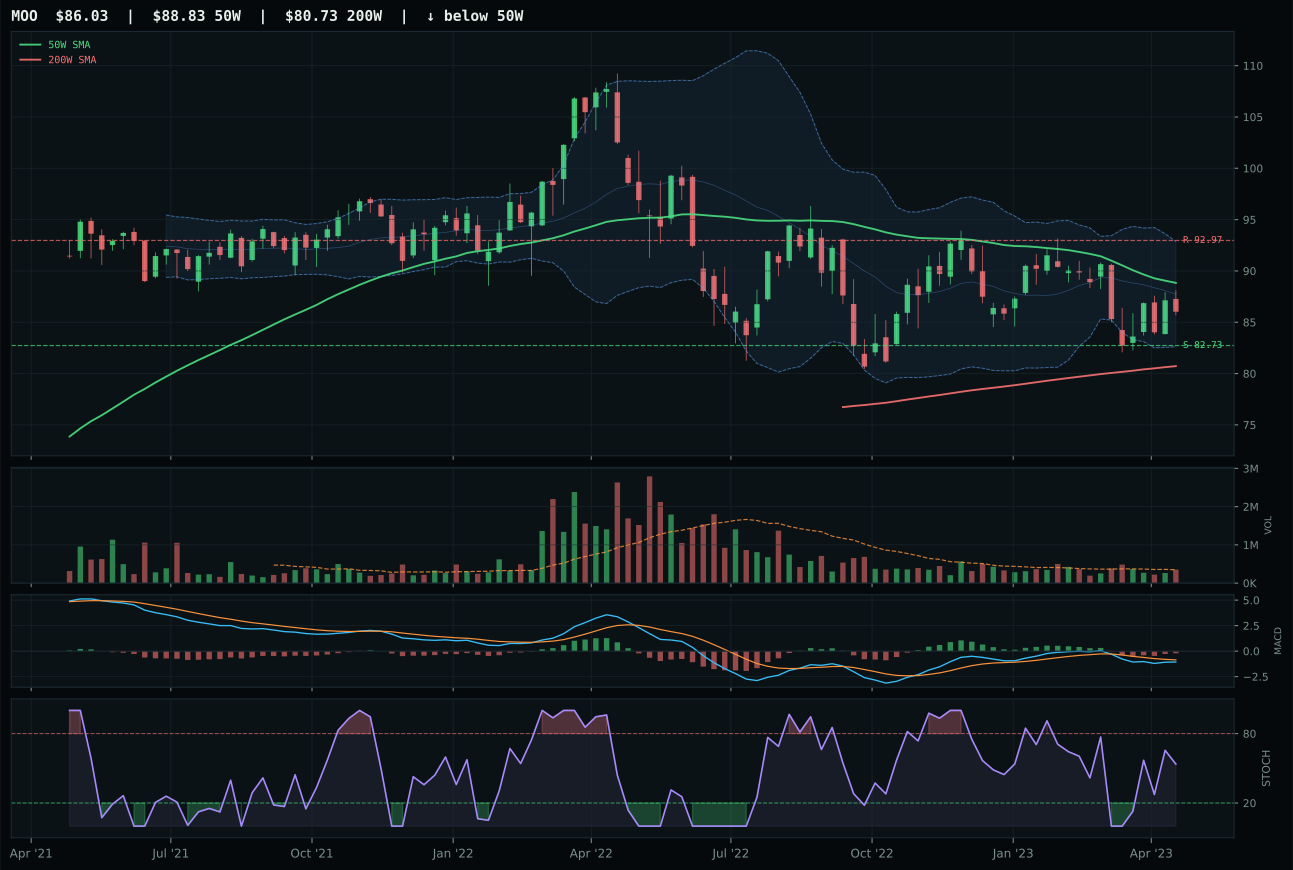
MOO has a pullback into support profile with -8.8% 13-week relative strength versus SPY.
A failed hold above support would weaken the setup.
Actionable but governed by invalidation levels.
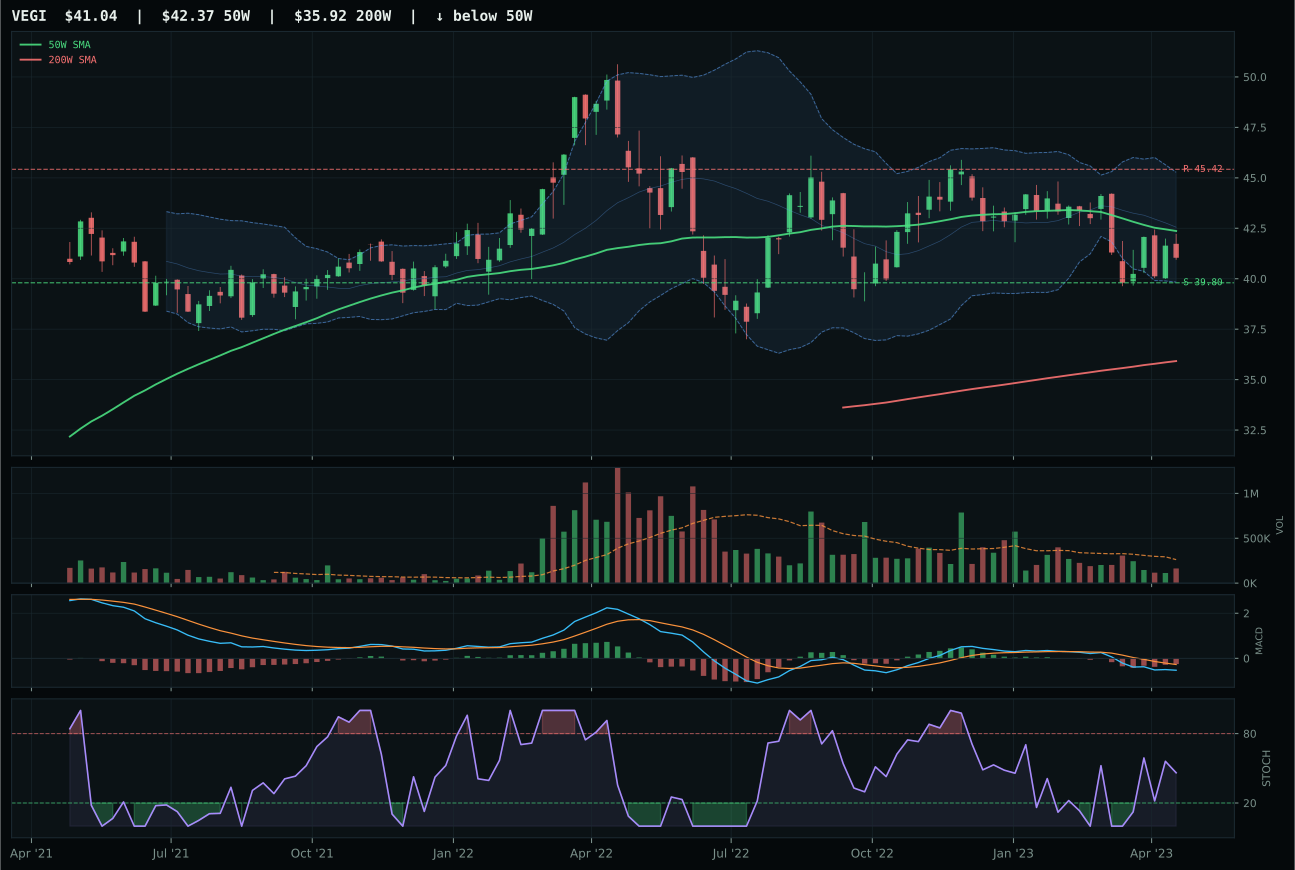
VEGI has a pullback into support profile with -9.5% 13-week relative strength versus SPY.
A failed hold above support would weaken the setup.
Actionable but governed by invalidation levels.
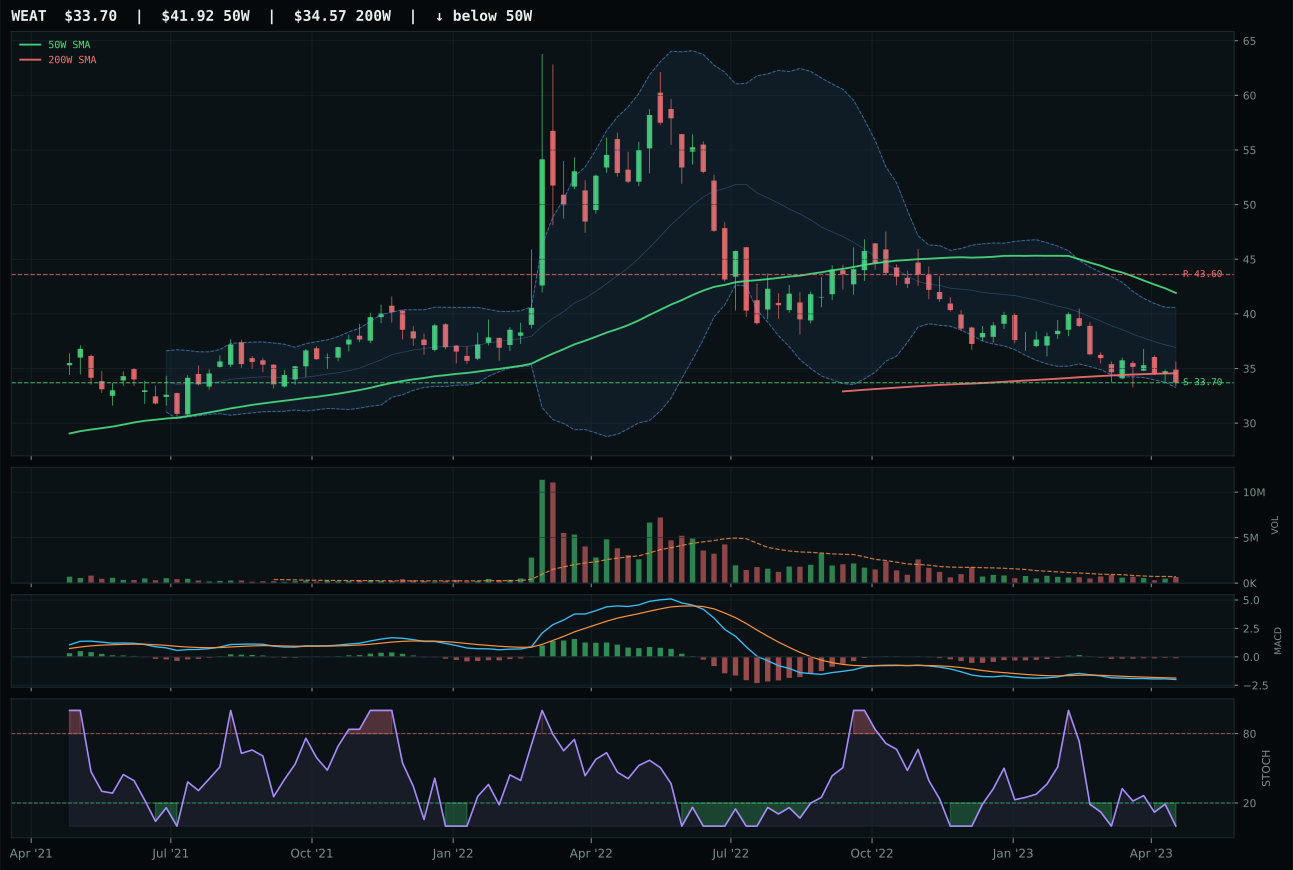
WEAT has a pullback into support profile with -14.6% 13-week relative strength versus SPY.
A failed hold above support would weaken the setup.
Actionable but governed by invalidation levels.
VEGI wins by a razor-thin margin over MOO because its risk/reward scores 98.0 versus MOO's 86.7, reflecting superior downside containment in a beaten-down sector. Both are pullbacks into support, both show MACD bearish but improving, yet VEGI's tighter risk architecture—only 3.1% downside to the 39.80 support against 9.6% upside—gives the portfolio a cleaner entry if buyers defend. The -5.4% 13-week return and -9.5% SPY-relative strength confirm this is not momentum; it is a reset of a weakened group. MOO's neutral volume versus VEGI's thin participation explains the micro-edge: lighter volume at lows often precedes recovery more cleanly than the chop of neutral participation.
Agriculture earned 5% allocation despite a collapsed 26.8 category score, the weakest among positions held, ranking near the bottom as disinflation actively pressures commodity breadth (-8 points). The category-level macro fit is 45.0/100, dragged down by disinflation pressure (-8) and liquidity stress (-4), offset only by commodity breadth positive at +5. VEGI's 51.3/100 technical evidence is thin support for a 5% position, but the 100.0 timing score and 98.0 risk/reward create a defined, low-conviction contrarian setup. This is a portfolio hedging decision: if the disinflation regime breaks and real assets reaccelerate, agriculture is well-positioned to participate from deeply depressed valuations. Until macro turns, this is a 5% collar trade, not a conviction bet. A return to positive 13-week momentum would elevate it; sustained weakness below 39.80 support would trigger reduction or exit.
Emerging Markets — IEMG
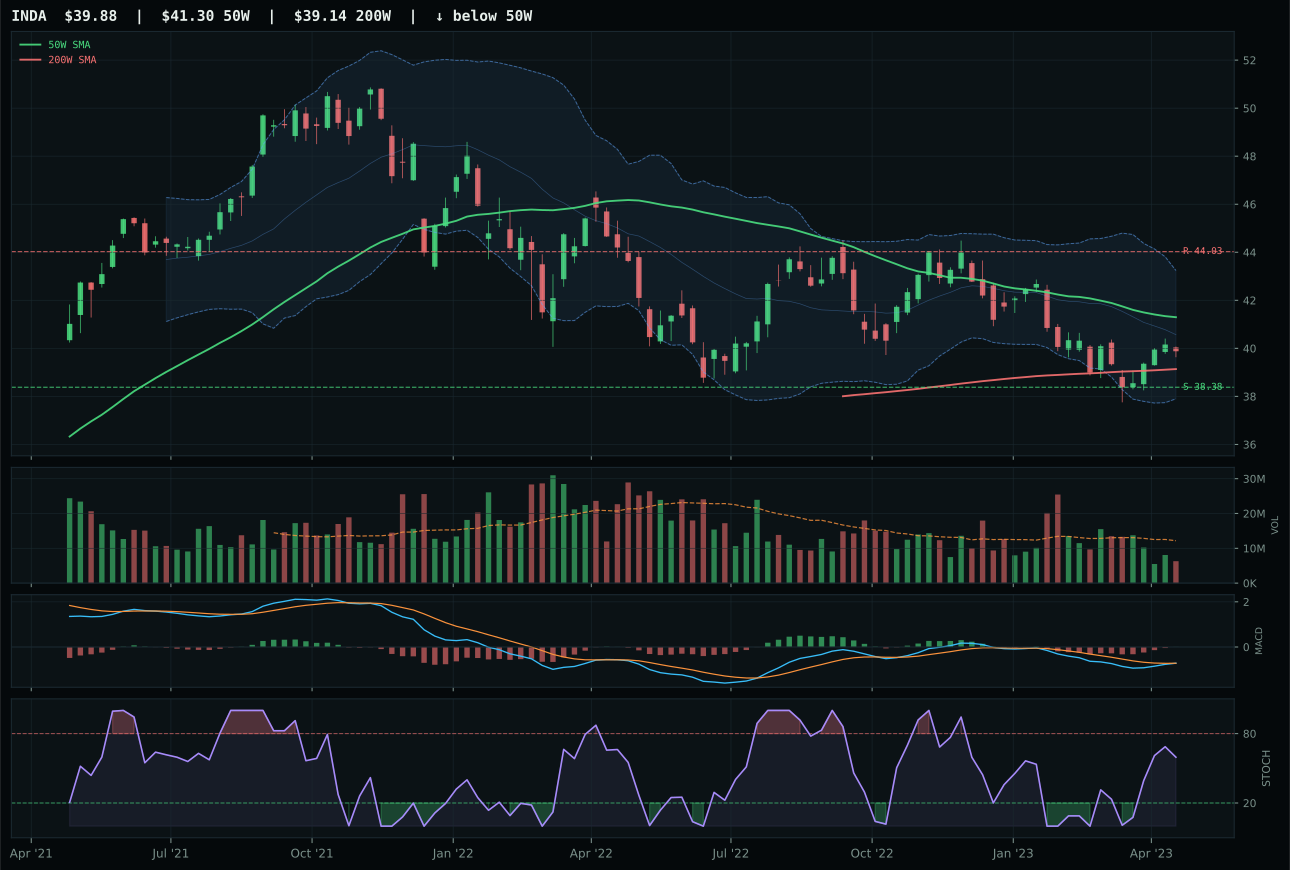
INDA has a pullback into support profile with -10.7% 13-week relative strength versus SPY.
A failed hold above support would weaken the setup.
Actionable but governed by invalidation levels.
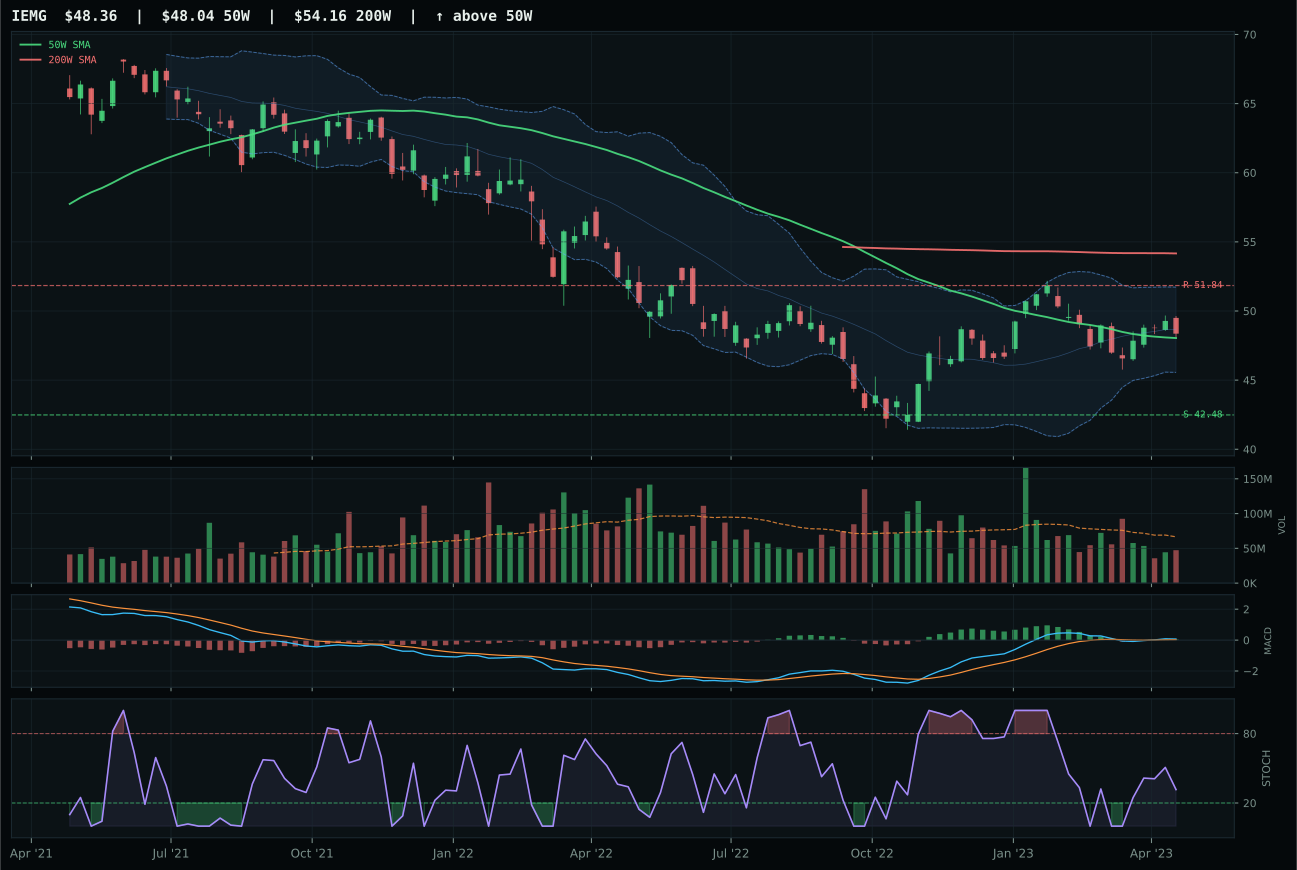
IEMG has a compression near 50W profile with -9.7% 13-week relative strength versus SPY.
A failed hold above support would weaken the setup.
Actionable but governed by invalidation levels.
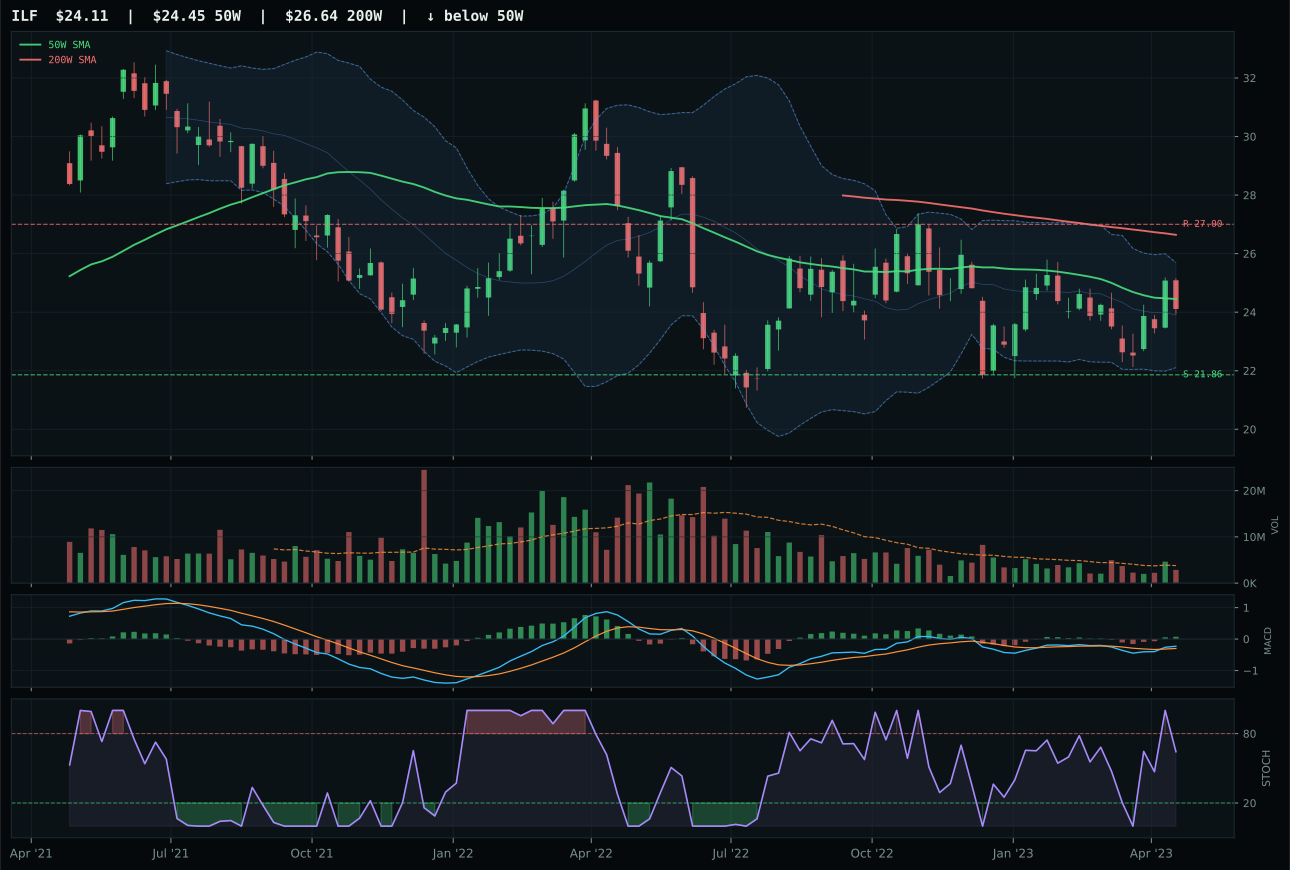
ILF has a compression near 50W profile with -7.0% 13-week relative strength versus SPY.
Extension and support failure are the main tactical risks.
Tracked, but not top-2 eligible because: structurally broken.
IEMG wins a close call over INDA by just 0.1 points because its compression near the 50W (0.7% distance) paired with 100.0 timing score offers the tightest technical entry in the category. Both show bullish and improving MACD and carry -9.5% to -10.7% SPY-relative strength, confirming emerging markets are in a bear trend. INDA's pullback-into-support setup (38.38 support) is deeper and more aggressive, with rising mid-zone stochastic RSI offering faster reversion mechanics; IEMG's compression is more conservative, requiring buyers to defend the 50W before upside accelerates. Category-relative strength splits the difference: IEMG's 0.0% ties INDA's nominal -1.0%, so timing edge goes to IEMG.
Emerging Markets earned 0% allocation, ranking tenth with a 19.5 score, the lowest among all categories. Credit stress and liquidity stress both hit -10 points, creating a 38.0/100 macro fit that actively rejects portfolio allocation during this regime. IEMG's 58.2/100 technical evidence cannot overcome -20 points of macro headwind; risk appetite at +8 provides some offset, but it is insufficient. The portfolio correctly recognizes that disinflation and tightening conditions hurt emerging-market currencies and growth narratives most severely. To earn a position, EM would require either a decisive credit event that forces flight-to-yield (favoring higher EM rates) or a visible recovery above the 50W on volume, neither present. This is a clean zero-position category where the technical setup is secondary to macro regime repulsion.
Traditional Energy — XLE
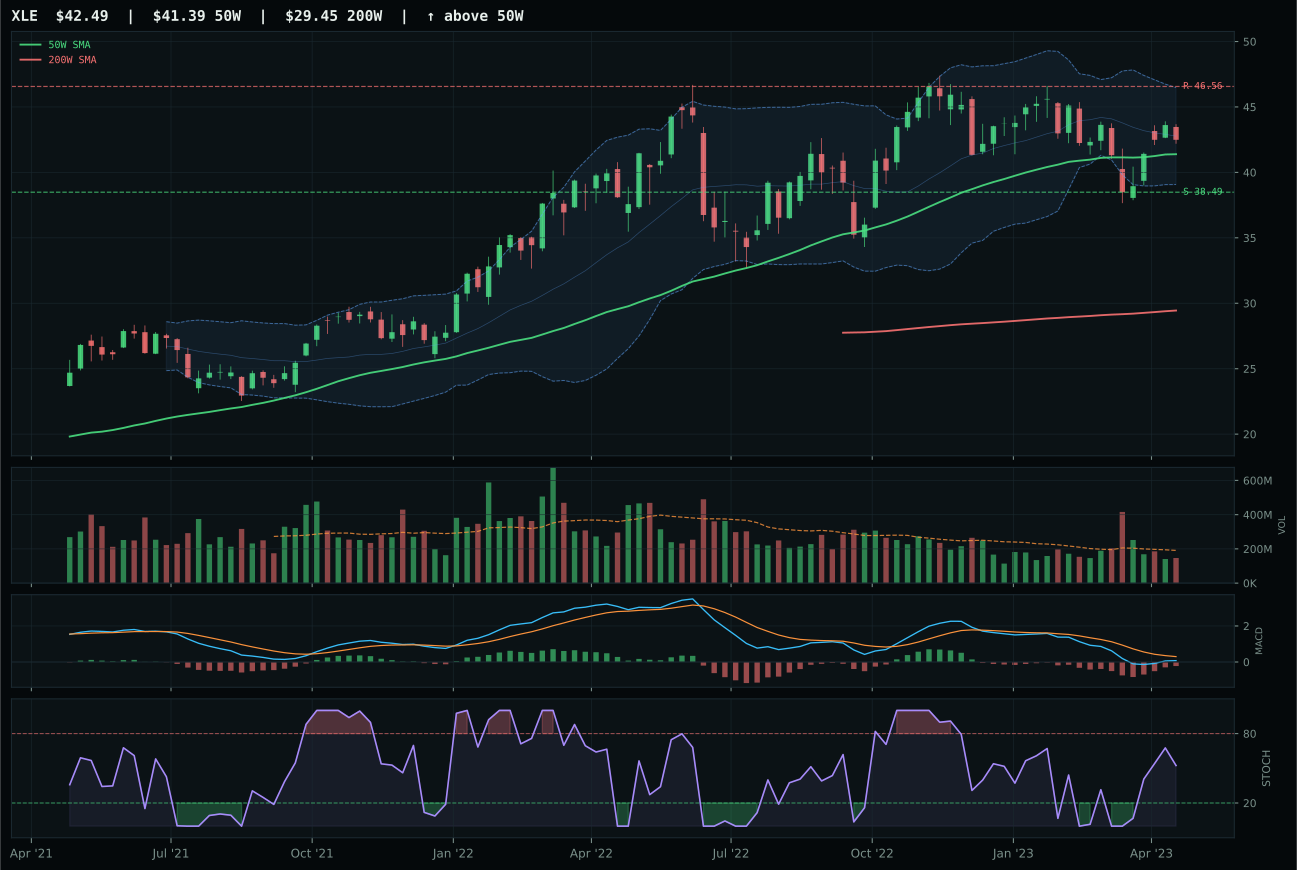
XLE has a compression near 50W profile with -10.2% 13-week relative strength versus SPY.
A failed hold above support would weaken the setup.
Actionable but governed by invalidation levels.
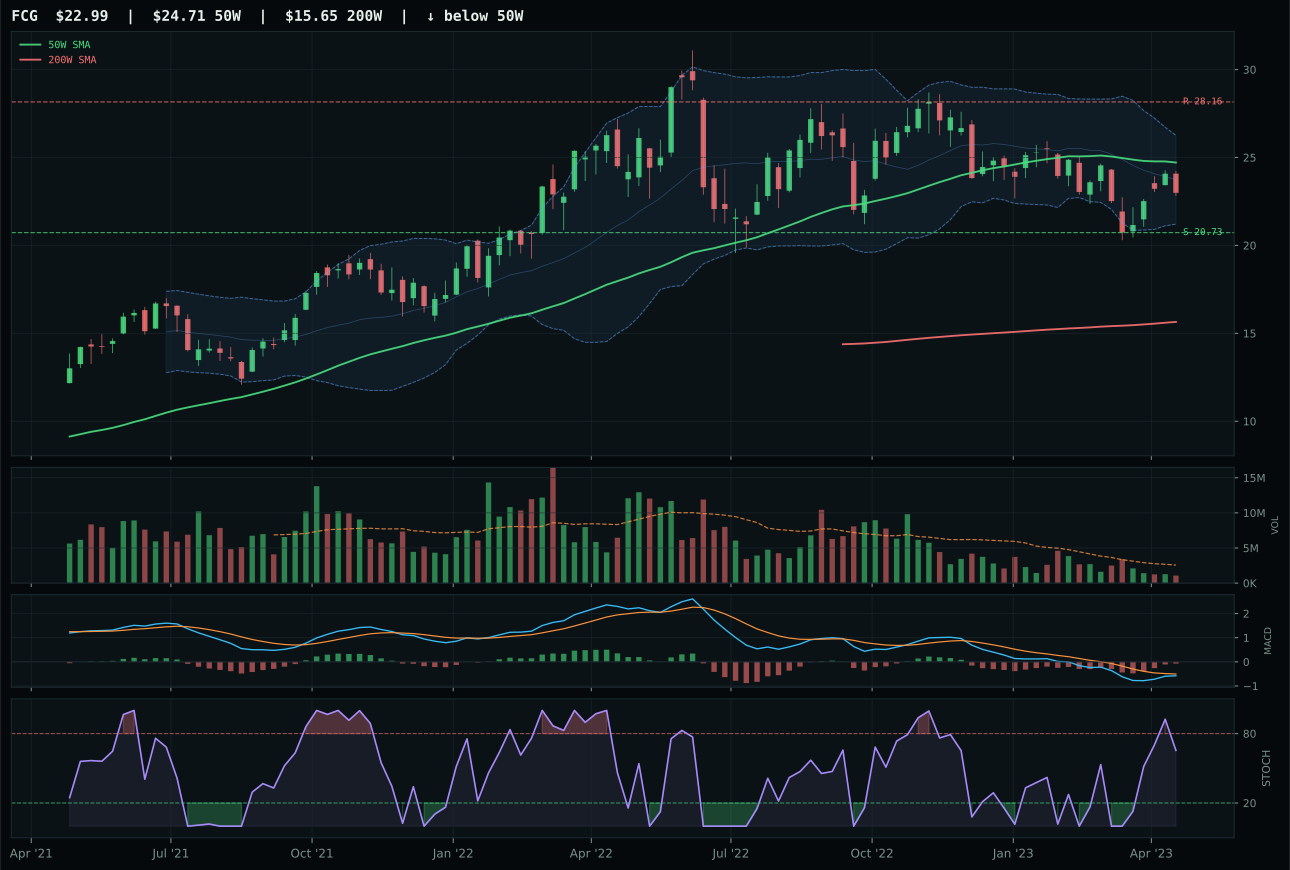
FCG has a neutral structure profile with -13.3% 13-week relative strength versus SPY.
A failed hold above support would weaken the setup.
Actionable but governed by invalidation levels.
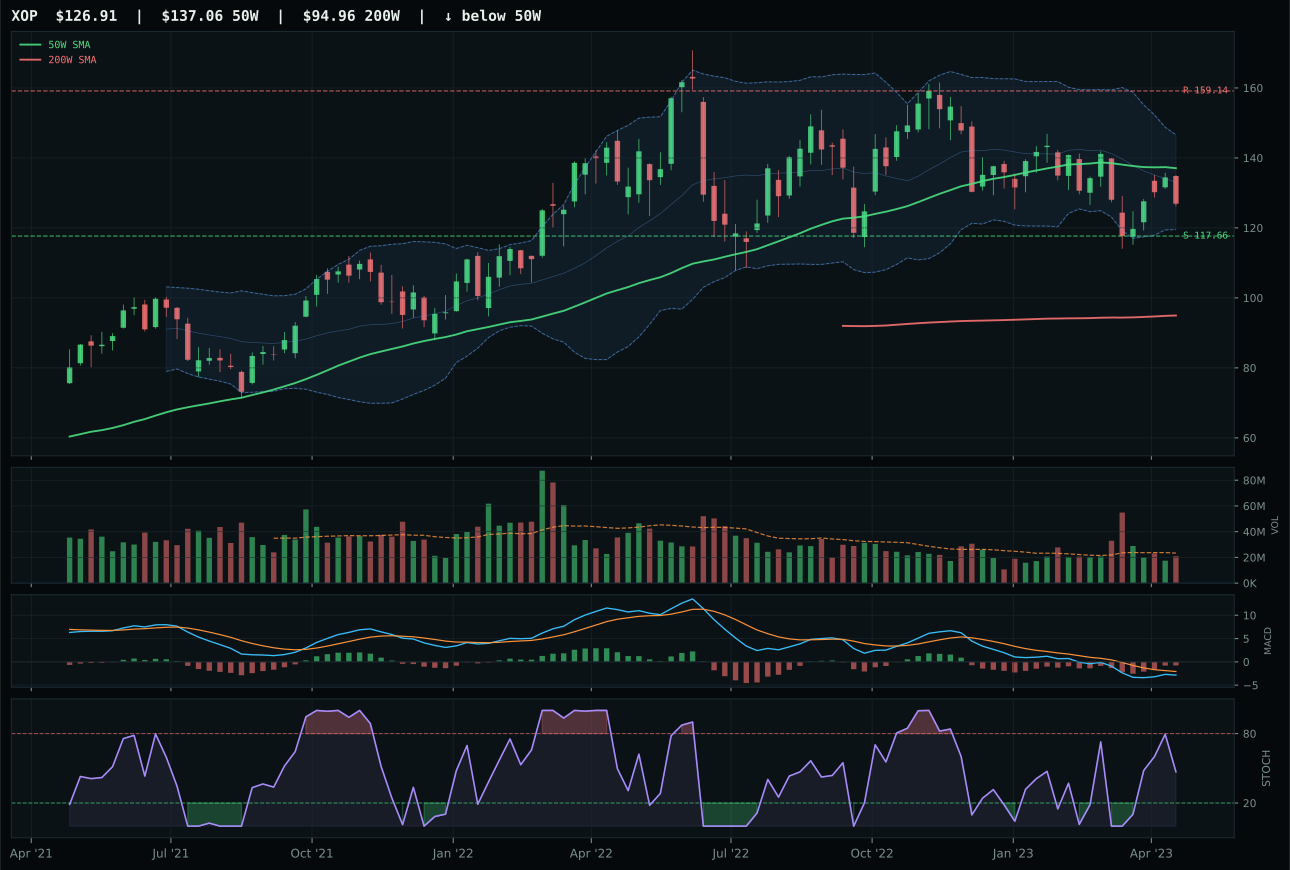
XOP has a neutral structure profile with -14.6% 13-week relative strength versus SPY.
A failed hold above support would weaken the setup.
Actionable but governed by invalidation levels.
XLE wins the category despite being excluded from portfolio allocation because its timing score of 100.0 is the cleanest in the category: price compression just 2.7% above the 50W with MACD bearish but improving and stochastic RSI rising mid-zone creates tight setup definition. The -10.2% SPY-relative strength proves energy is in bear mode, yet 3.1% category-relative strength and the near-50W positioning offer a technical entry if macro shifts. FCG's timing at 90.0 and thin volume participation disqualify it despite the category-relative strength match. XLE's 0.77x volume is neutral—not exciting, but not distribution pressure either.
Traditional Energy earned 0% allocation, ranking ninth or tenth among the ten categories with a collapsed 8.8 score. Disinflation regime is actively hostile: disinflation pressure contributes -10 points, credit stress -7, and liquidity stress -7, creating a 23.0/100 macro fit that is the weakest in the portfolio system. XLE's 70.4/100 technical evidence cannot overcome this macro headwind; the category requires major regime shift (inflation surprise, credit event, real asset reversal) to earn a position. Real asset sponsorship is active at +7, but it cannot match the -30 point macro penalty from disinflation environment. To earn allocation, energy needs either a decisive technical breakout above the 46.56 resistance on volume or a macro descriptor pivot—neither is present. The portfolio correctly recognizes this as a zero-position category until macro or technicals materially improve.