
2023-04-14
Informational purposes only. The content in this report, including allocations, analysis, and commentary, is provided solely for informational and educational purposes. It does not constitute financial advice, investment advice, trading advice, or any other type of advice. Past performance does not guarantee future results. Always conduct your own research and consult a qualified financial professional before making investment decisions.
Weekly Allocation
| Ticker | Category | Weight | Role |
|---|---|---|---|
| FBTC | 50% | Overlay | |
| GLD | Precious Metals | 10% | Top-2 (10%) |
| IGV | Technology | 10% | Top-2 (10%) |
| BOTZ | AI | 5% | Tier-2 (5%) |
| COPX | Industrial Metals | 5% | Tier-2 (5%) |
| IGF | Utilities & Infrastructure | 5% | Tier-2 (5%) |
| ITA | Defense & Aerospace | 5% | Tier-2 (5%) |
| URA | Nuclear Energy | 5% | Tier-2 (5%) |
| VEGI | Agriculture & Livestock | 5% | Tier-2 (5%) |
Trade Instructions — Monday Open
Sell the tranche from 2023-03-17 (completing its 4-week hold). Buy the new tranche. Instructions show net portfolio changes — same-asset positions cancel, weight changes show the delta.
| Action | Ticker | Instruction |
|---|---|---|
| SELL | XLK | Sell 33% of XLK position (reduce 7.50% → 5.00%) |
| SELL | SMH | Sell 29% of SMH position (reduce 8.75% → 6.25%) |
| SELL | XLU | Sell 25% of XLU position (reduce 5.00% → 3.75%) |
| SELL | INDA | Sell 50% of INDA position (reduce 2.50% → 1.25%) |
| BUY | GLD | Buy GLD — 16.67% of freed cash (adds 1.25% to portfolio) |
| BUY | IGV | Buy IGV — 33.33% of freed cash (adds 2.50% to portfolio) |
| BUY | BOTZ | Buy BOTZ — 16.67% of freed cash (adds 1.25% to portfolio) |
| BUY | IGF | Buy IGF — 16.67% of freed cash (adds 1.25% to portfolio) |
| BUY | VEGI | Buy VEGI — 16.67% of freed cash (adds 1.25% to portfolio) |
Current Portfolio After Trade
Combined holdings across all 4 active tranches. Each tranche is 25% of the portfolio.
| Ticker | % of Portfolio | Weight Bar |
|---|---|---|
| FBTC | 50.00% | |
| SMH | 6.25% | |
| GLD | 6.25% | |
| XLK | 5.00% | |
| ITA | 5.00% | |
| URA | 5.00% | |
| COPX | 5.00% | |
| IGV | 5.00% | |
| XLU | 3.75% | |
| IEMG | 2.50% | |
| INDA | 1.25% | |
| GDX | 1.25% | |
| BOTZ | 1.25% | |
| IGF | 1.25% | |
| VEGI | 1.25% |
Macro Regime — Disinflation
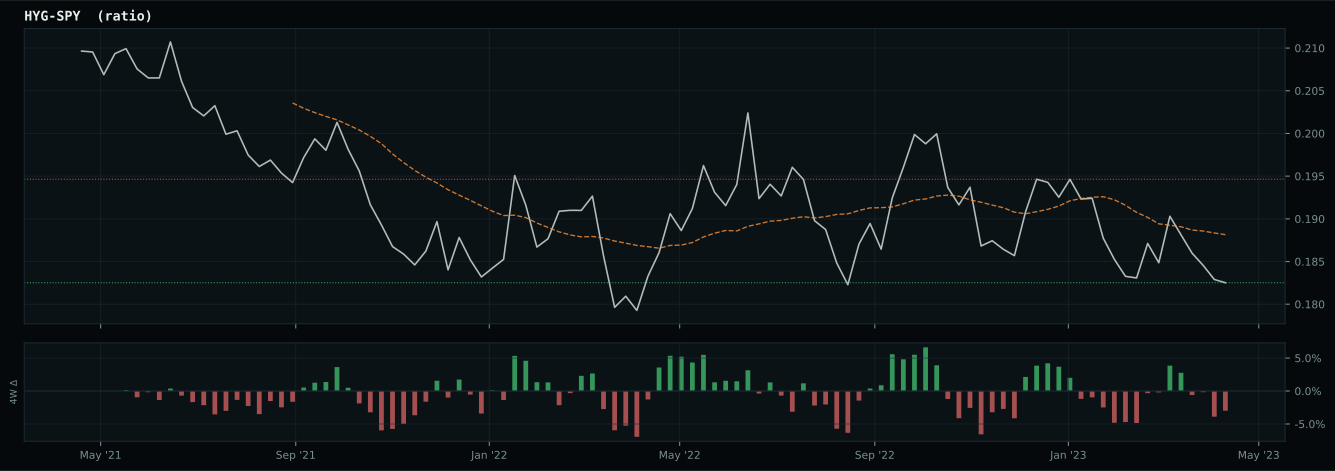
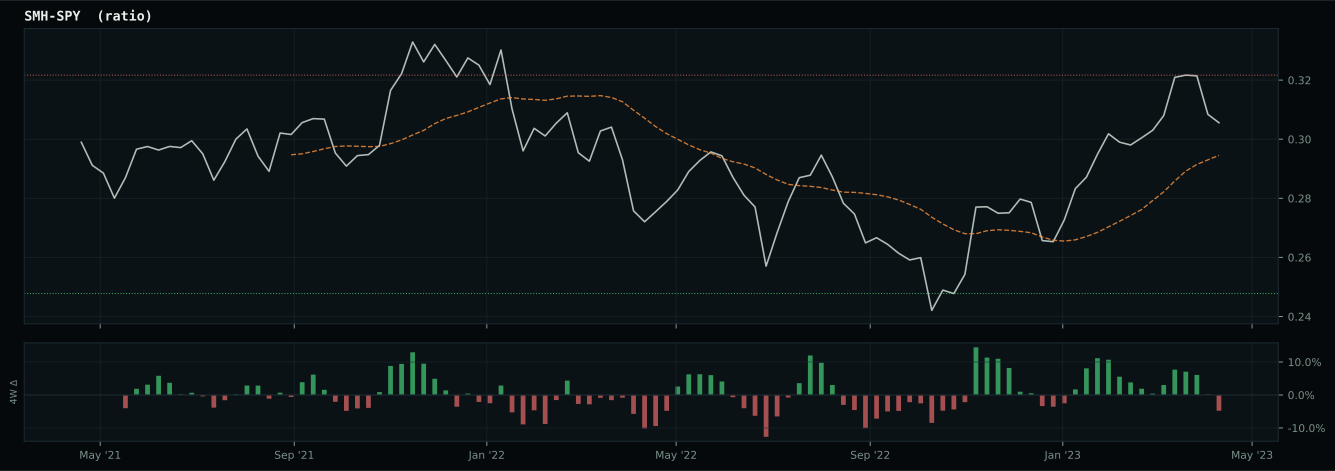
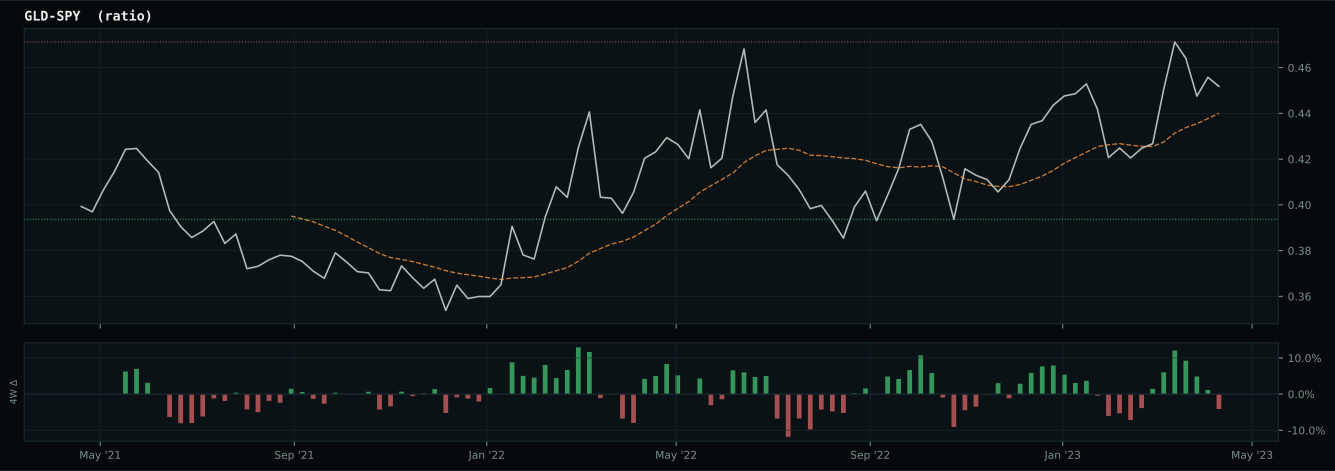
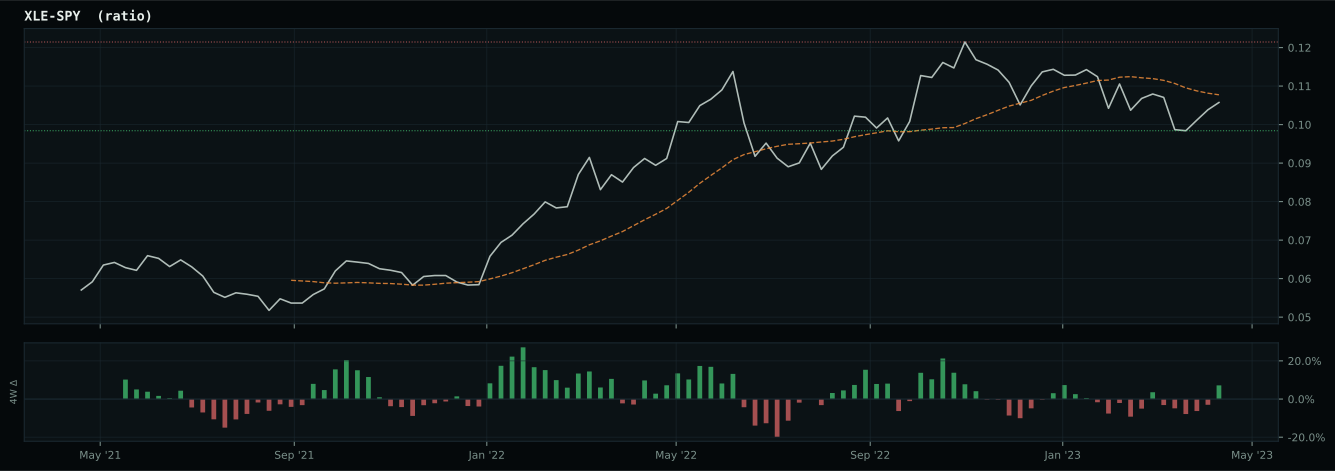
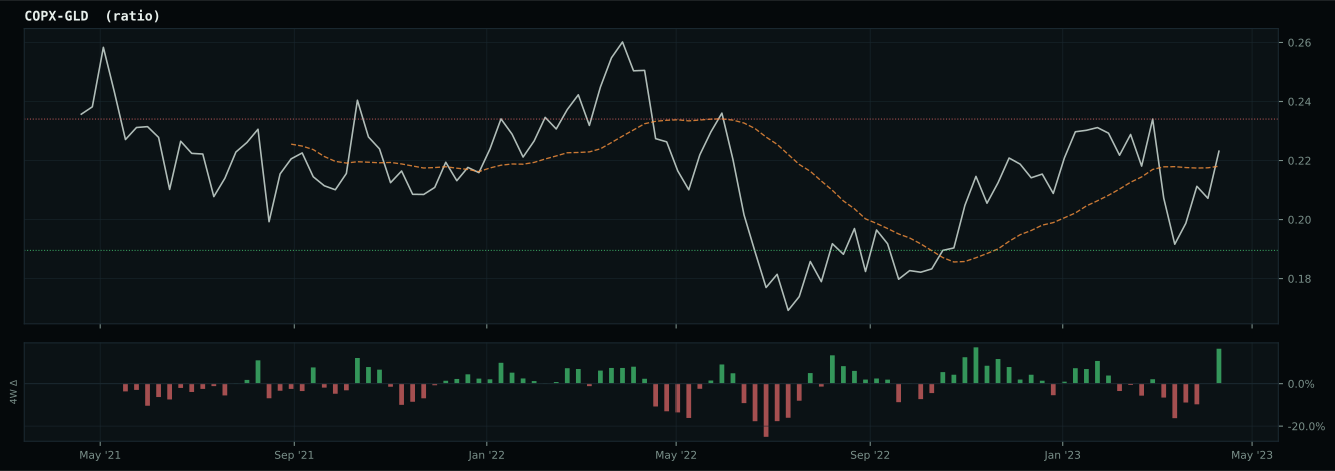
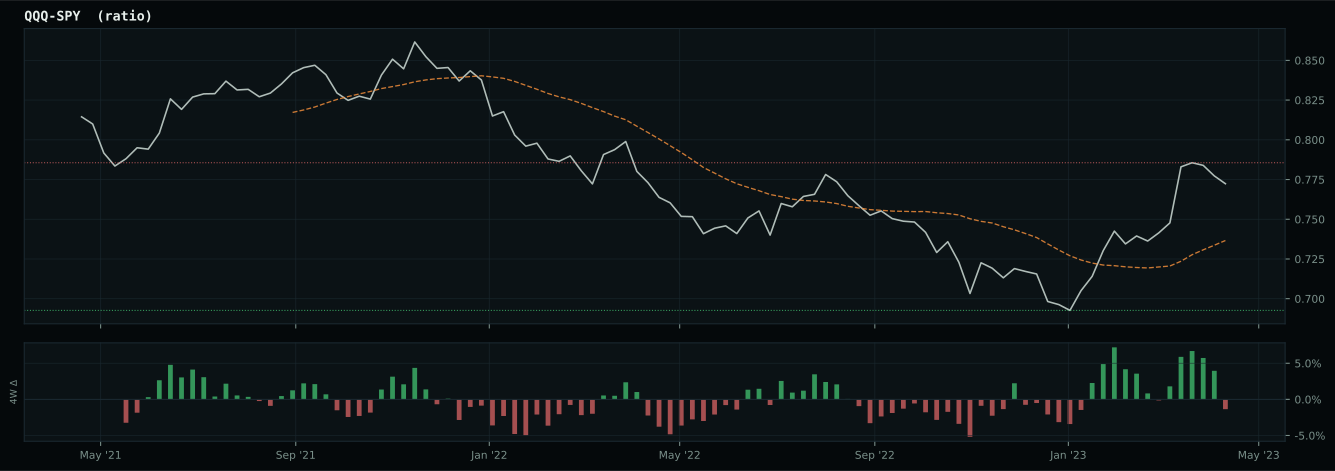
Macro Evidence Charts
Market-implied signals behind the macro regime scores. Each ratio compares two assets; the direction and slope of the ratio is what the macro engine reads.
Crypto Regime — ValueBTC
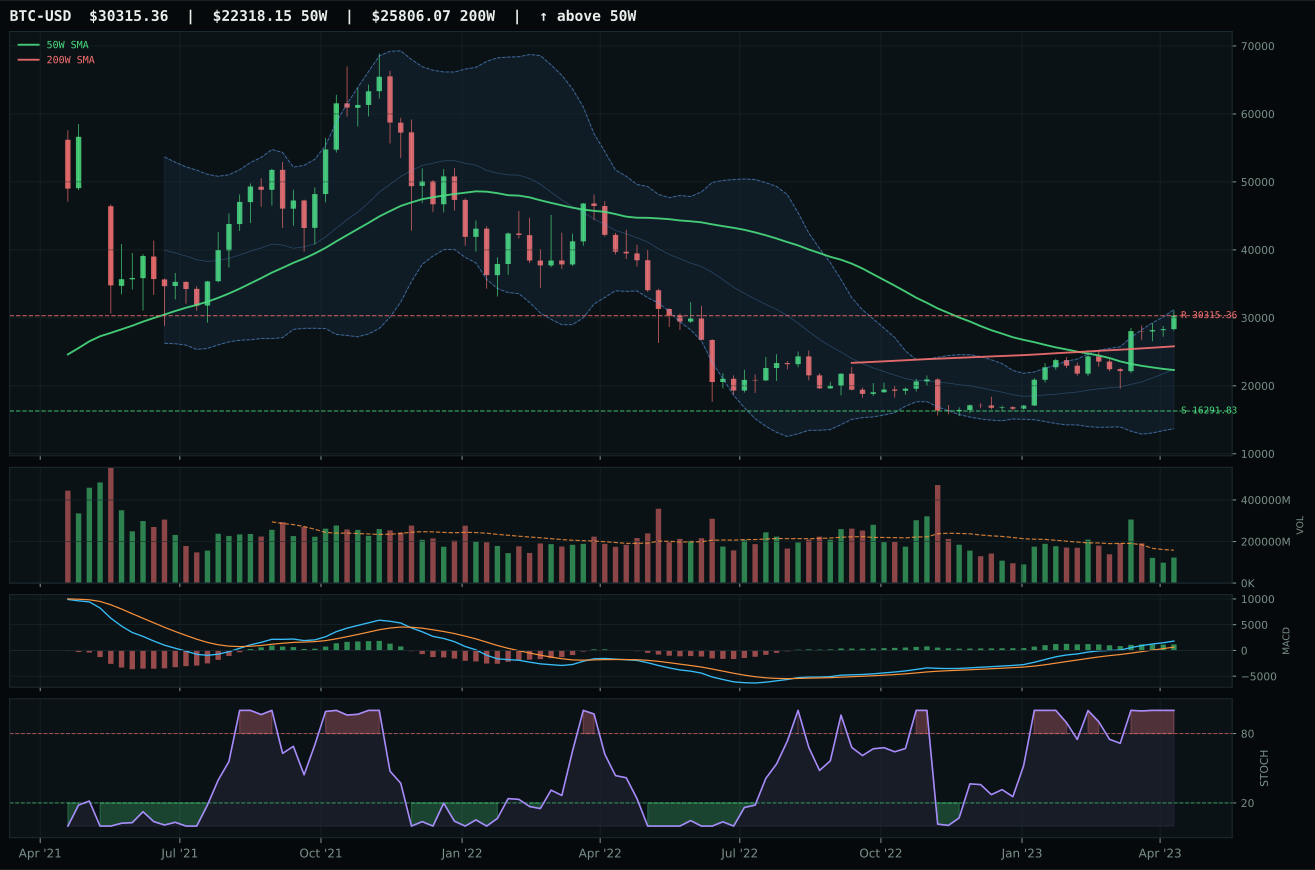
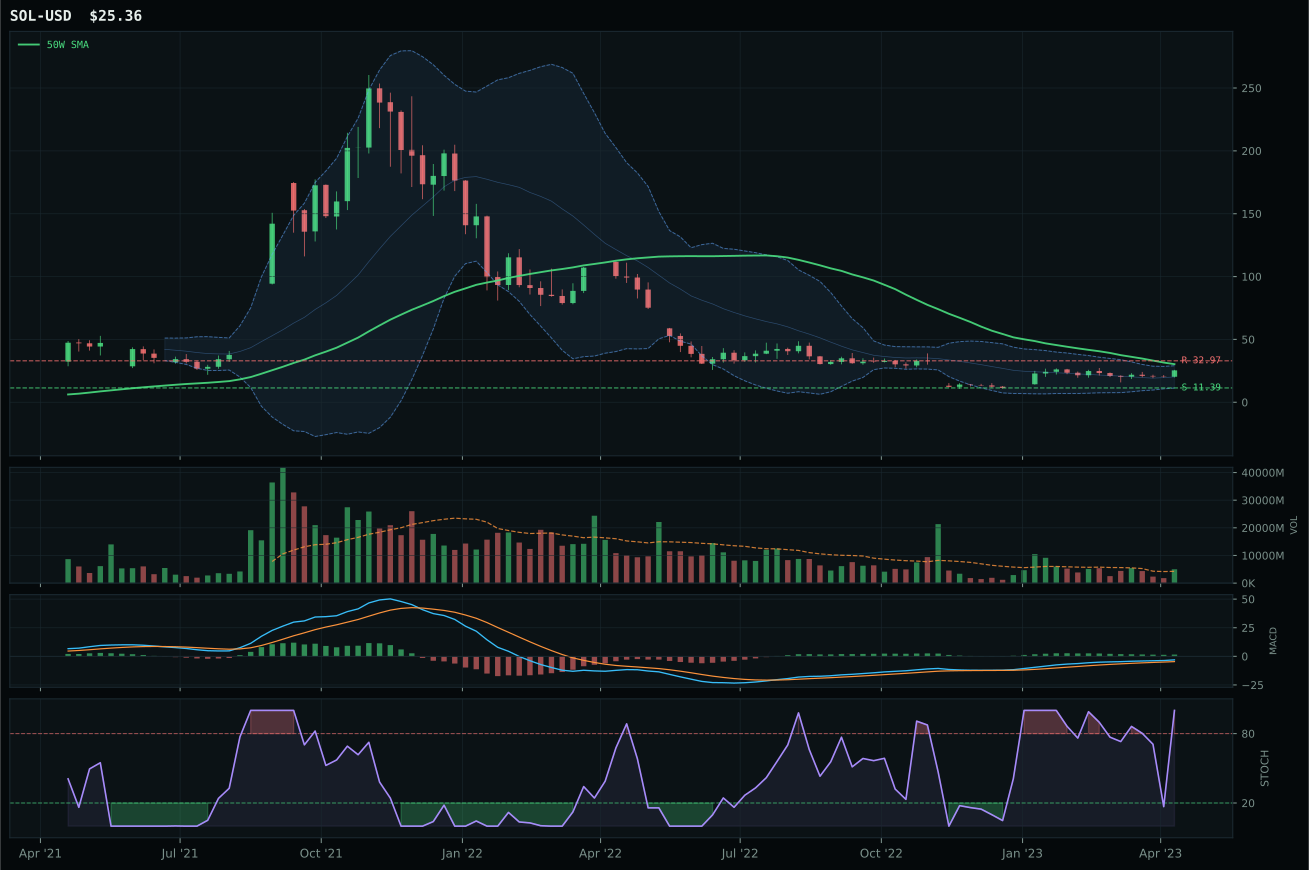
ValueBTC armed; waiting for breakout volume above 20W average
TrendBTC not confirmed
one or more available conditions failed
Category Rankings
| Rank | Category | Winner | Score | Alloc | 4W Ret | Peers (4W) |
|---|---|---|---|---|---|---|
| 1 | Precious Metals | GLD | 69.6 | 20% | +0.76% | SLV -4.9% · GDX -2.6% |
| 2 | Technology | IGV | 64.1 | 20% | -1.77% | CIBR -4.2% · XLK +1.5% |
| 3 | AI | BOTZ | 58.5 | 10% | +2.04% | SMH -1.5% · AIQ -0.6% |
| 4 | Industrial Metals | COPX | 56.3 | 10% | -9.67% | REMX +2.9% · PICK -7.9% |
| 5 | Utilities & Infrastructure | IGF | 52.2 | 10% | -0.08% | XLU +0.4% · PAVE +1.2% |
| 6 | Defense & Aerospace | ITA | 42.8 | 10% | -3.46% | XAR -2.3% · ROKT -0.4% |
| 7 | Nuclear Energy | URA | 31.5 | 10% | +2.57% | URNM +3.5% · NLR +3.3% |
| 8 | Agriculture & Livestock | VEGI | 27.7 | 10% | -5.51% | MOO -5.9% · WEAT -6.2% |
| 9 | Emerging Markets | ILF | 27.4 | 0% | +2.23% | IEMG -2.3% · INDA +3.7% |
| 10 | Traditional Energy | XLE | 17.9 | 0% | -9.35% | XOP -10.9% · FCG -8.9% |
Precious Metals — GLD
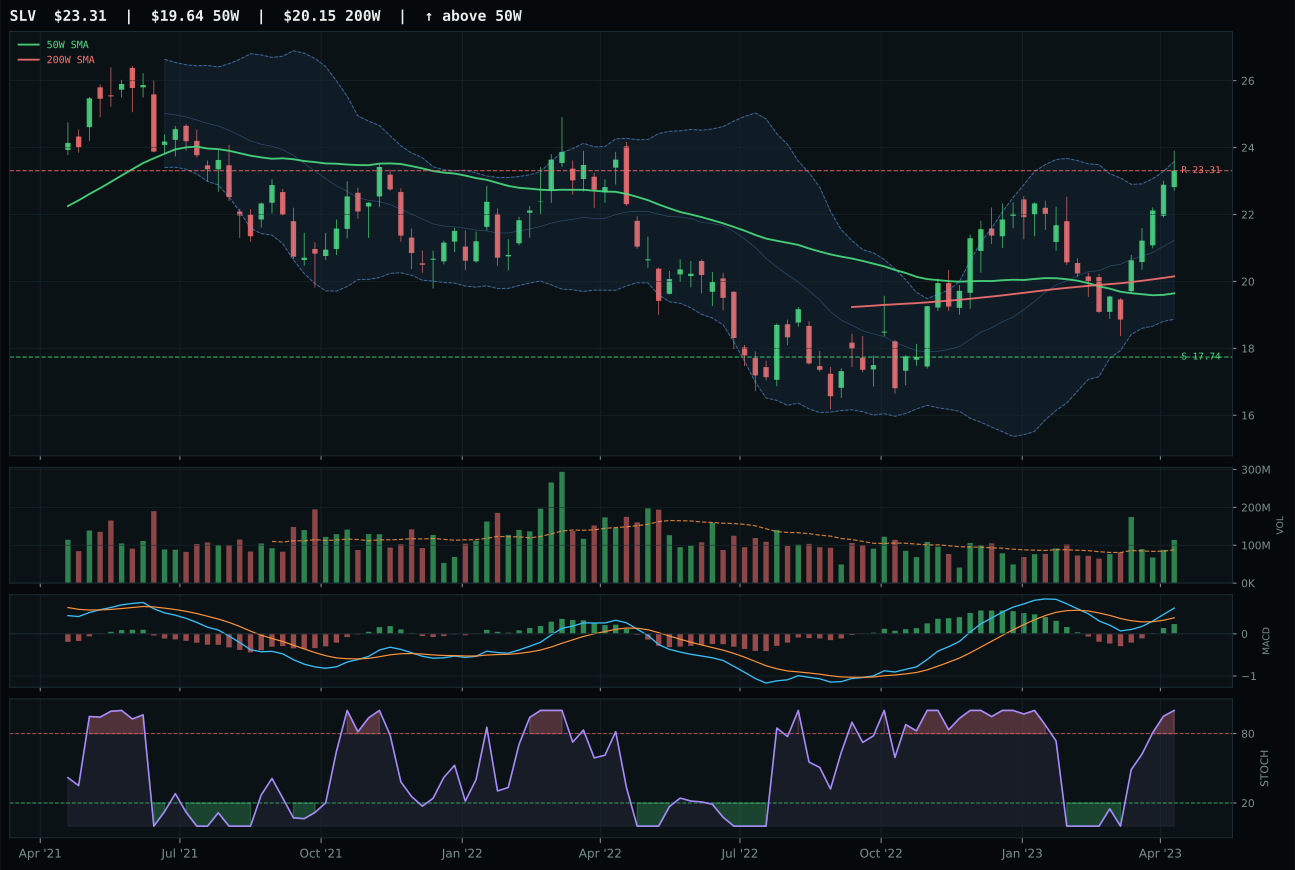
SLV has a vertical extension profile with 0.9% 13-week relative strength versus SPY.
A failed hold above support would weaken the setup.
Actionable but governed by invalidation levels.
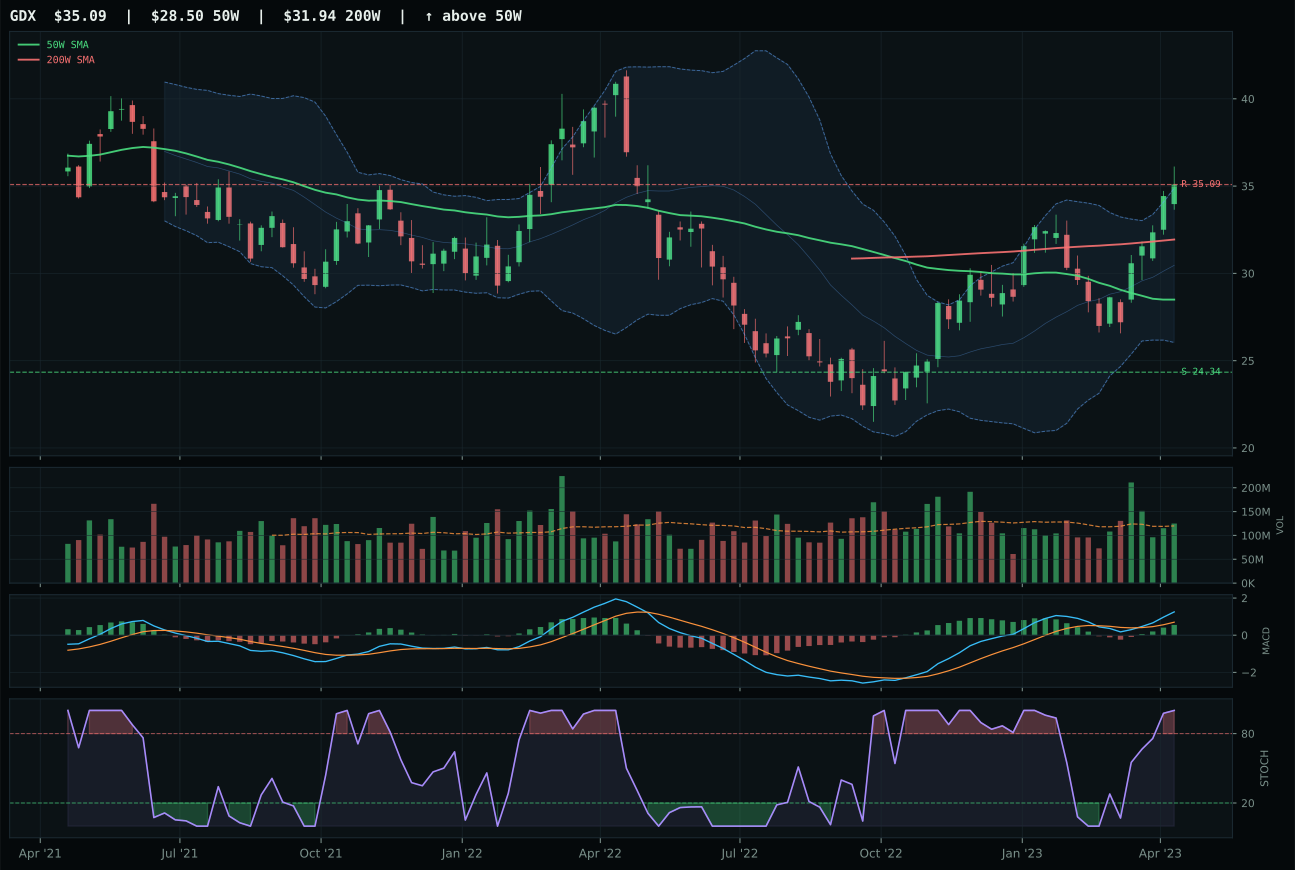
GDX has a vertical extension profile with 4.0% 13-week relative strength versus SPY.
A failed hold above support would weaken the setup.
Actionable but governed by invalidation levels.
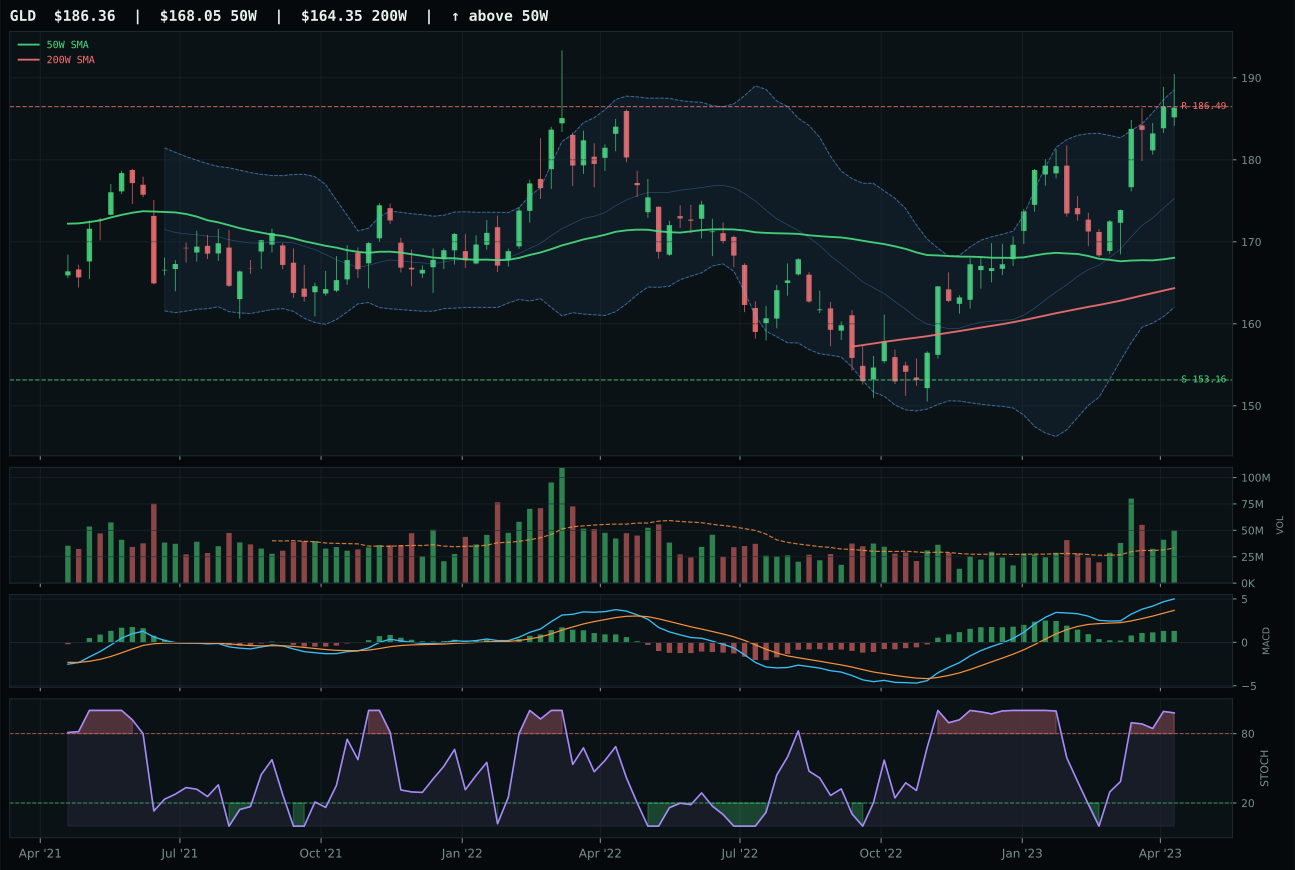
GLD has a neutral structure profile with 0.7% 13-week relative strength versus SPY.
A failed hold above support would weaken the setup.
Actionable but governed by invalidation levels.
GLD wins decisively with a perfect 100.0/100 trend score—price above both the 50W and 200W with a non-deteriorating 0.1% slope—and converts that foundation into a 5.8-point victory over SLV through superior timing of 67.0/100 versus SLV's 45.0. The setup is textbook: 10.9% from the 50W (not extended), MACD bullish and improving, stochastic RSI overbought at 0.98, and price in the upper retracement zone. Most critically, GLD benefits from 1.50x above-average volume participation, providing real institutional sponsorship for the move, while SLV sits at 18.7% above the 50W—stretched enough that every fresh buyer has already paid a friction premium. Volume-price confirmation favors GLD at 71.4/100, and the 13W return comparison (4.3% vs 4.4%) shows GLD delivered nearly identical momentum with better timing and less extension risk.
Precious Metals earned its top-2 slot at 10% allocation with a category score of 69.6, ranking among the two highest eligible final scores, because the disinflation regime delivers a direct +8 tailwind to this category, compounded by +6 from the disinflation pressure descriptor and +8 more from the category-level macro assessment rated at 60.0/100. The 3/2/1 weighted ETF basket (SLV 75.1, GLD 71.4, GDX 65.8) created a starting score of 72.3, which compressed only slightly to 69.6 after testing volume, persistence, and risk/reward. This is a clean case of macro alignment: as real rates compress under disinflation, gold's monetary hedge function activates, and the technicals confirm with above-average volume and bullish momentum. The -4 penalty from risk appetite positive is mild and reflects hedging behavior, not risk-off panic. GLD's representative position at 10% reflects not just category strength but the scarcity value of allocation slots in a 50% overlay environment where every basis point matters.
Technology — IGV
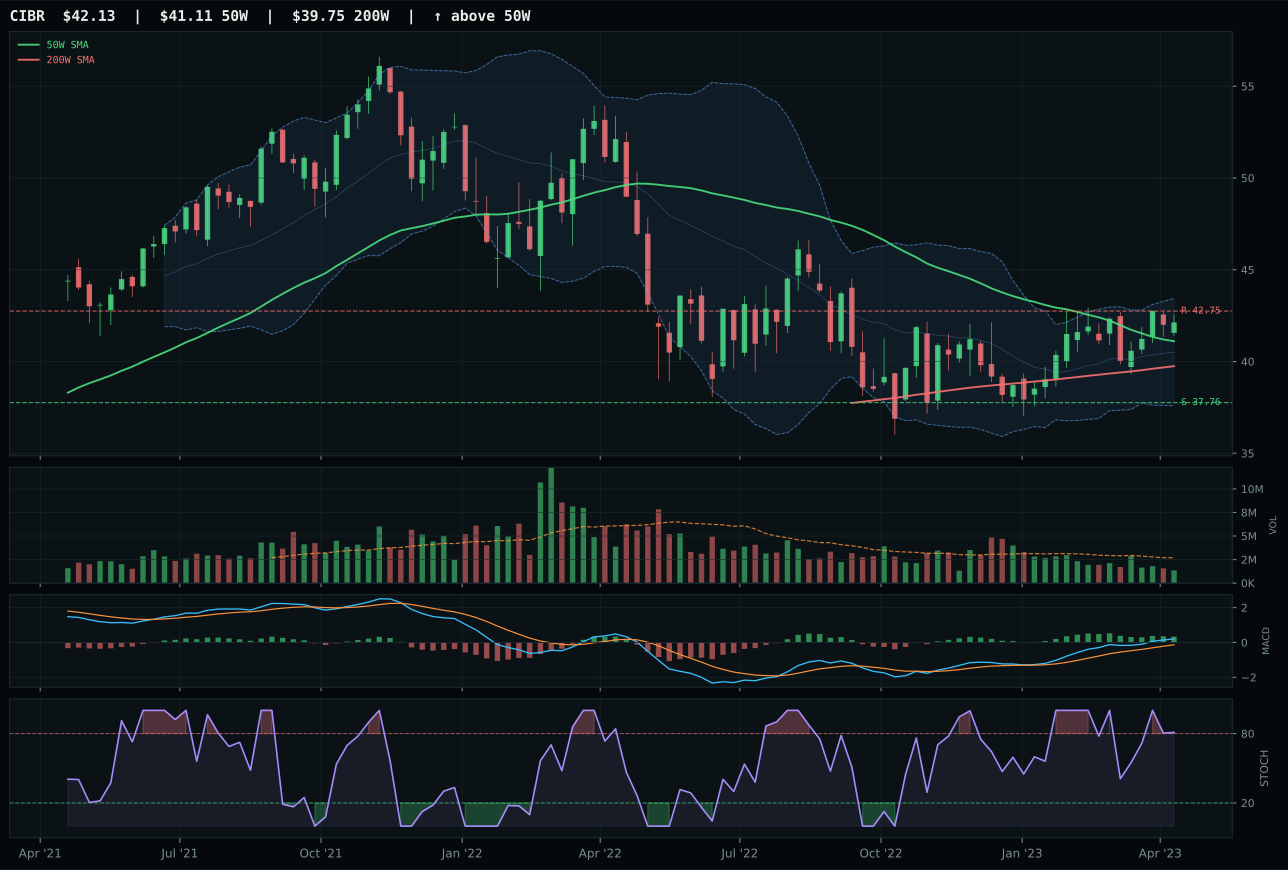
CIBR has a compression near 50W profile with 5.9% 13-week relative strength versus SPY.
A failed hold above support would weaken the setup.
Actionable but governed by invalidation levels.
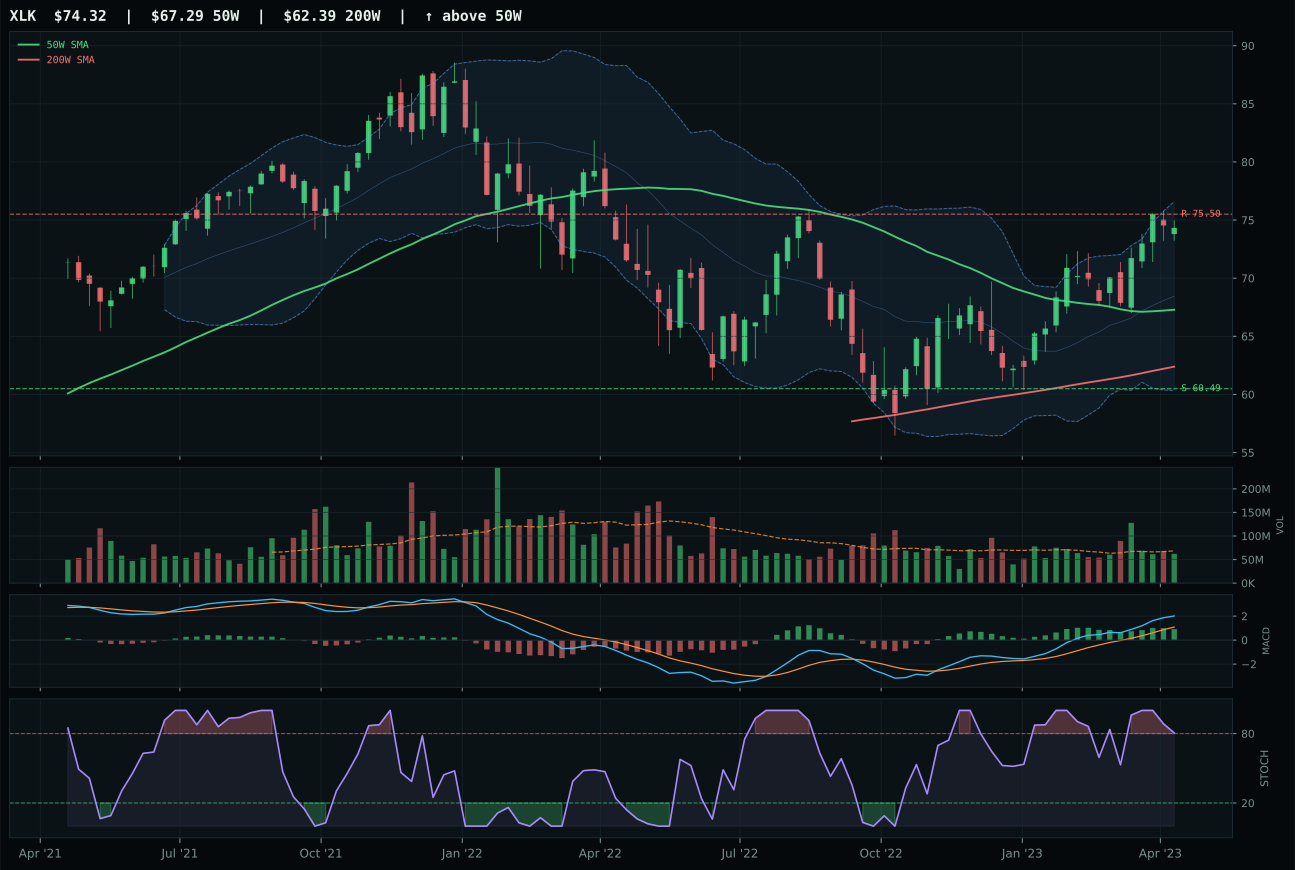
XLK has a neutral structure profile with 10.4% 13-week relative strength versus SPY.
A failed hold above support would weaken the setup.
Actionable but governed by invalidation levels.
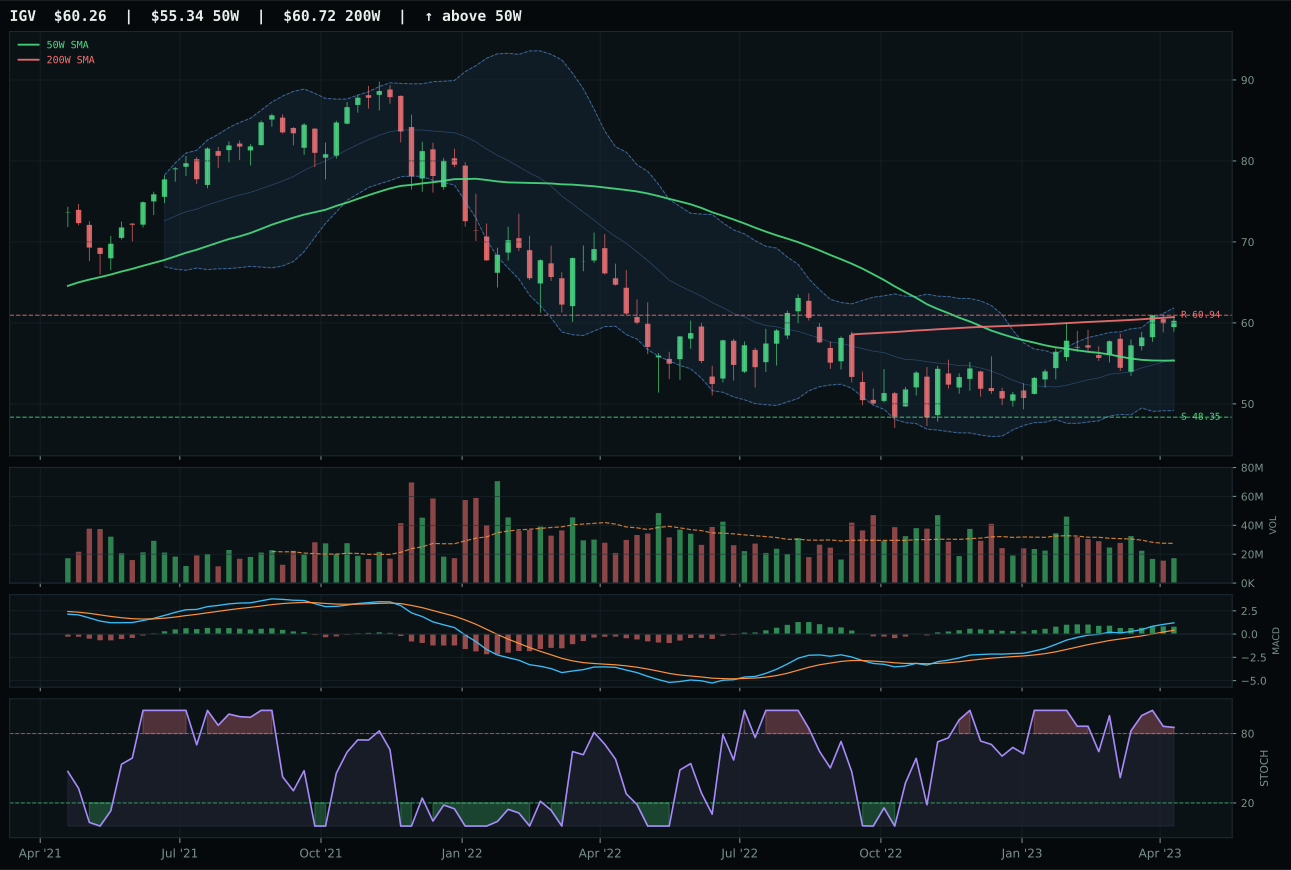
IGV has a neutral structure profile with 9.8% 13-week relative strength versus SPY.
A failed hold above support would weaken the setup.
Actionable but governed by invalidation levels.
IGV wins the category because it holds category-relative strength at parity (0.0% vs median) while CIBR lags by 3.9%, a decisive edge in a field where every ETF faces neutral structure and thin volume participation. The setup itself—price 8.9% above the 50W, MACD bullish and improving, stochastic RSI rolling over from overbought—is neither clean nor extended; it's a retracement zone where technicals must carry the day. What separates IGV is its momentum confirmation score of 87.0/100, driven by 13W returns of 13.3% and four-week gains of 5.3% paired with that category-level sponsorship. CIBR's 13W return of 9.4% and 5.9% SPY-relative strength tell the story: later in the cycle, with less breadth support, fighting against credit stress headwinds rated at -9 in macro descriptors.
Technology earned its top-2 slot at 10% allocation because the category score of 64.1 ranked among the two highest eligible final scores this week, driven by a 3/2/1 weighted ETF basket combining solid technical evidence (62% weight) with macro fit rated at 60.0/100. The disinflation regime that dominates this week actually helps technology: the +7 tailwind from disinflation itself, combined with active risk appetite (+9) and AI growth sponsorship (+6), overcomes liquidity stress (-10) and keeps the category competitive. This is no momentum chase—the 50W slope is flat at 0.0%, and upside to resistance sits at a mere -1.1%, meaning new buyers are paying full freight. The allocation reflects portfolio positioning for a regime where growth settles into durability rather than acceleration, and where the technicals have room to breathe as long as the macro floor holds.
AI — BOTZ
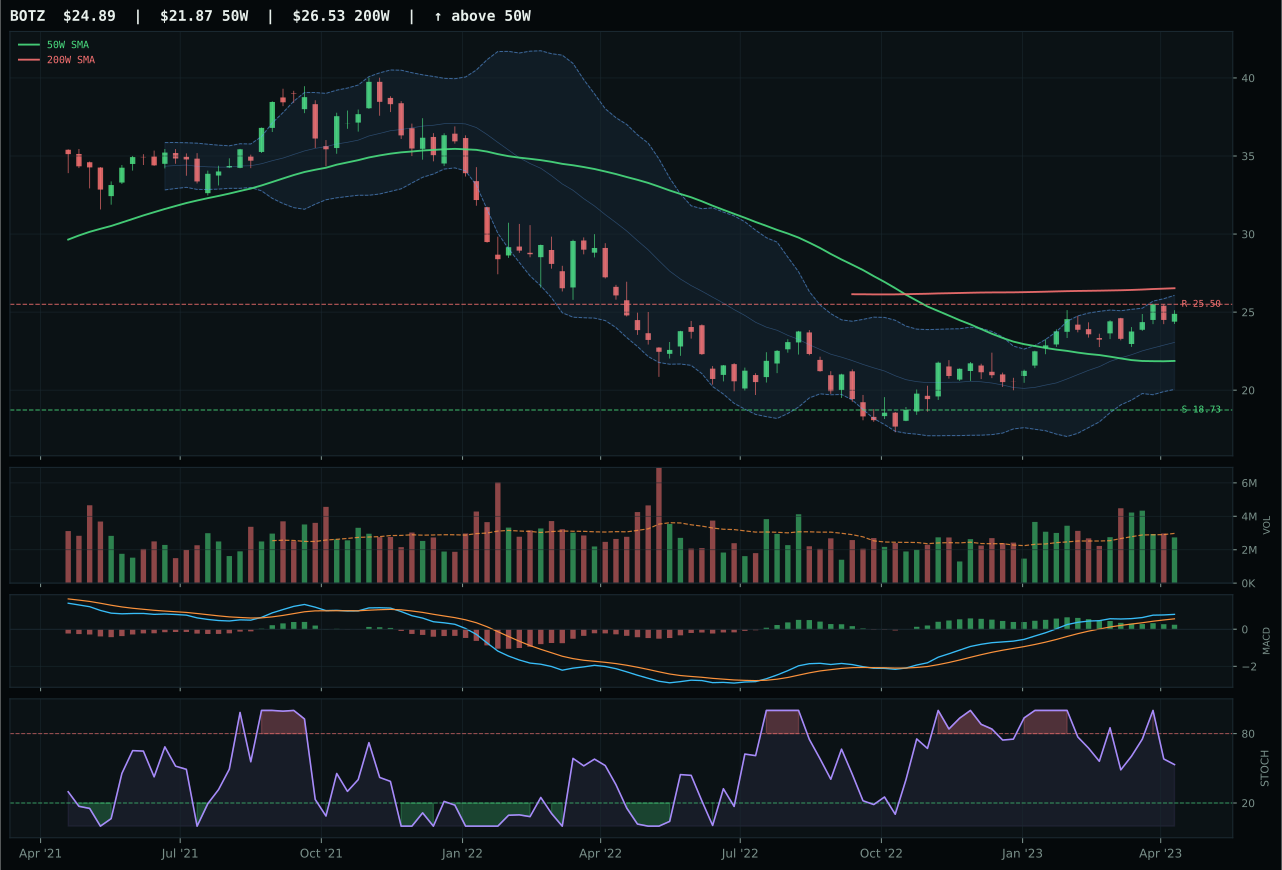
BOTZ has a neutral structure profile with 7.2% 13-week relative strength versus SPY.
A failed hold above support would weaken the setup.
Actionable but governed by invalidation levels.
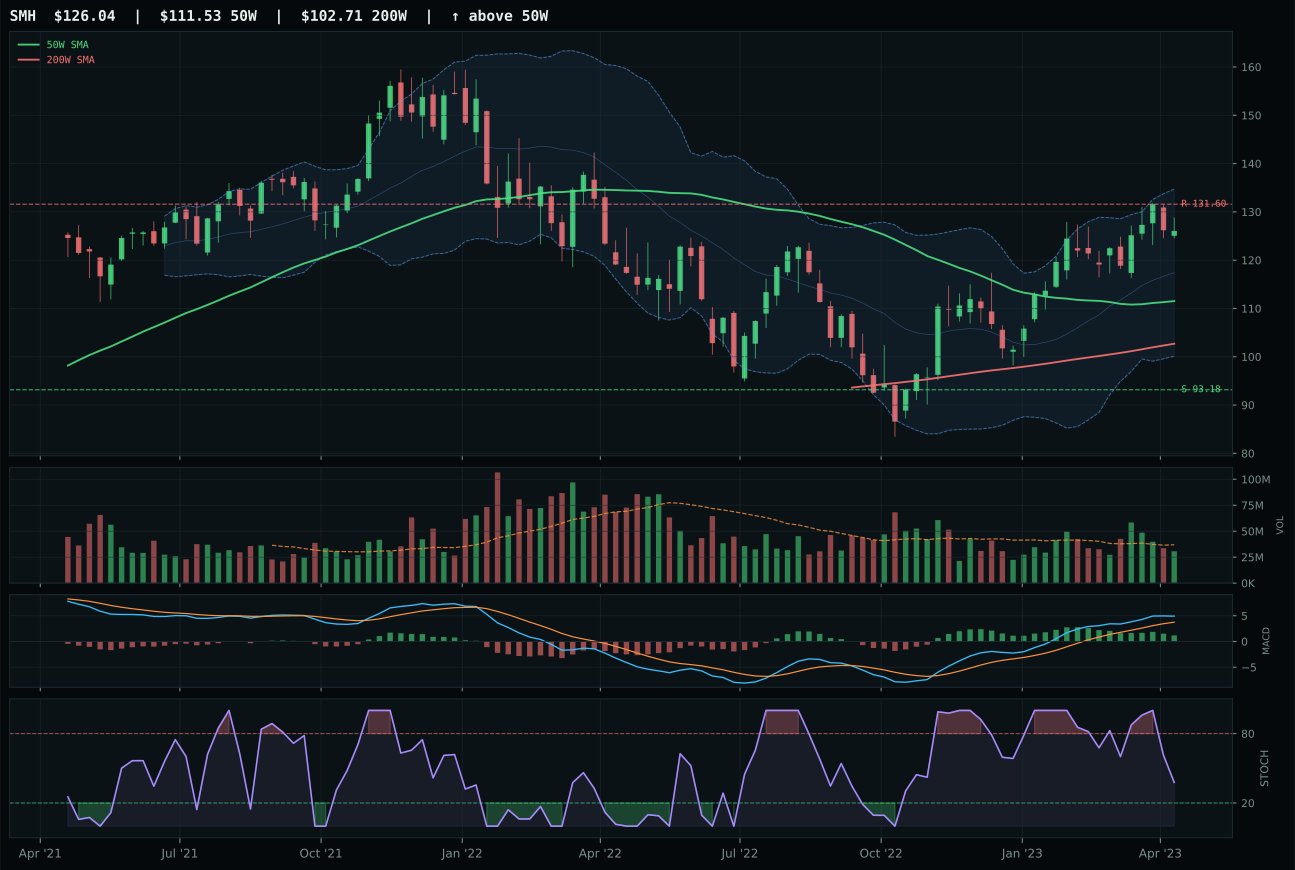
SMH has a neutral structure profile with 8.1% 13-week relative strength versus SPY.
A failed hold above support would weaken the setup.
Actionable but governed by invalidation levels.
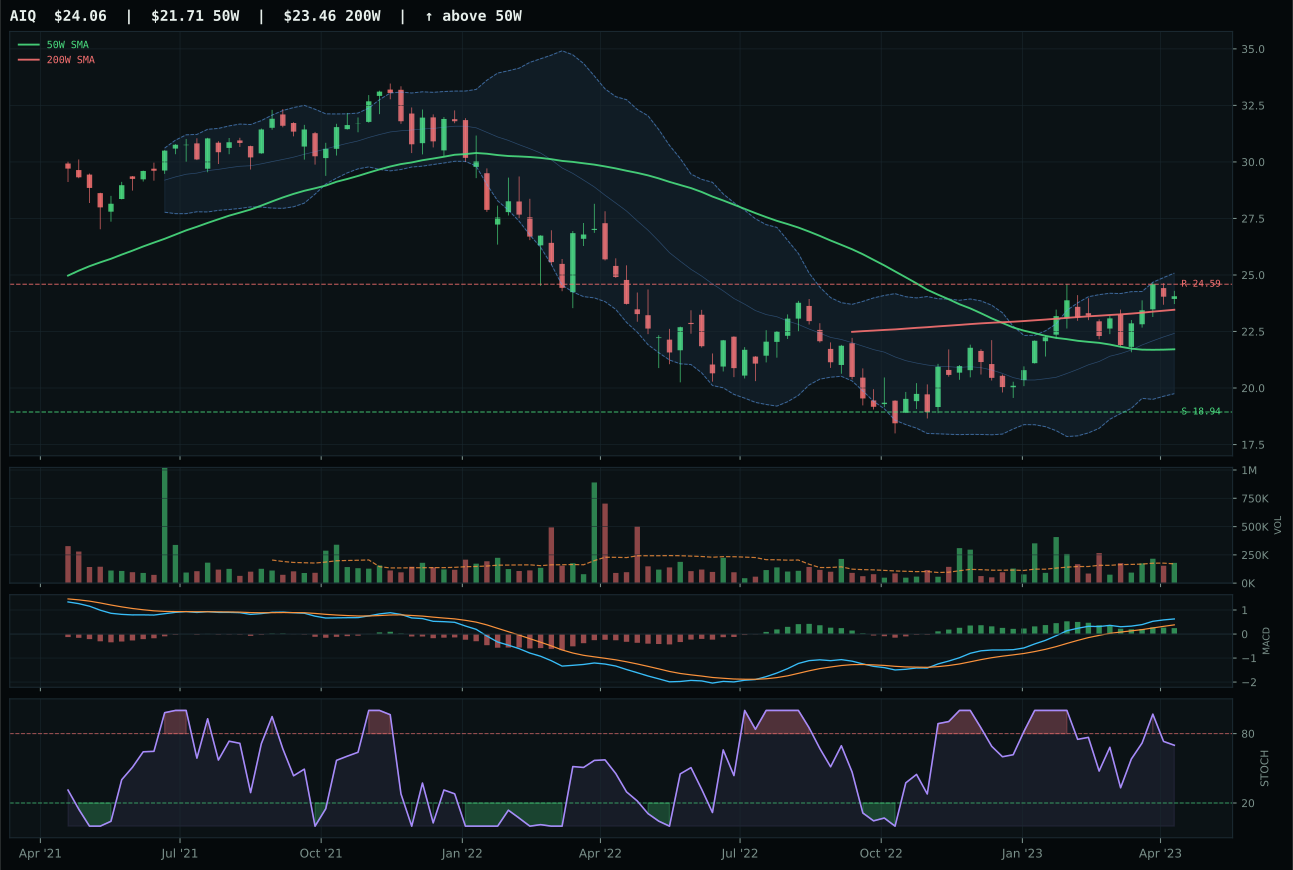
AIQ has a neutral structure profile with 5.4% 13-week relative strength versus SPY.
A failed hold above support would weaken the setup.
Tracked, but not top-2 eligible because: .
BOTZ wins because its structure cleanliness of 73.5/100 beats SMH's 69.8, a narrow but decisive margin in a category where both ETFs share the same neutral chart setup and bullish-but-flattening MACD. The technical evidence scoring differs mainly in structure quality and timing resilience: BOTZ sits 13.8% from the 50W with rising mid-zone stochastic RSI (0.53), giving it breathing room and less entry risk than SMH's stretched position. Where SMH stumbles is in its superior technical evidence rating (75.5/100 vs BOTZ's 72.0/100)—a paradox resolved by the macro layer: SMH's 14-point AI growth sponsorship bump versus BOTZ's 5-point tick means the semiconductor play is fighting overvaluation in the scoring system. BOTZ's 87.3/100 momentum confirmation, built on neutral volume and stable 10.7% thirteen-week returns, provides cleaner proof of accumulation without the expectation premium baked into SMH.
AI landed in tier-2 at 5% allocation because its category score of 58.5 fell short of the top-2 threshold, despite eligibility confirmation and a 3/2/1 basket that started at 64.9. The macro environment created a structural headwind: liquidity stress rated at -12 and credit stress at -8 push against the +14 AI growth sponsorship bonus, leaving the category's macro fit at 59.0/100—solid but not exceptional. The disinflation regime adds only +5 net support, and risk appetite positive tallies +10, but the math works against category leadership. What keeps AI in the portfolio rather than excluded is the technical competence of the representative ETF (trend 86.0/100, timing 70.0/100) and the near-term setup quality: the chart is not broken, just compressed and waiting. If liquidity tightening reverses or credit stress metrics improve, this category's 5% position becomes a natural promotion candidate.
Industrial Metals — COPX
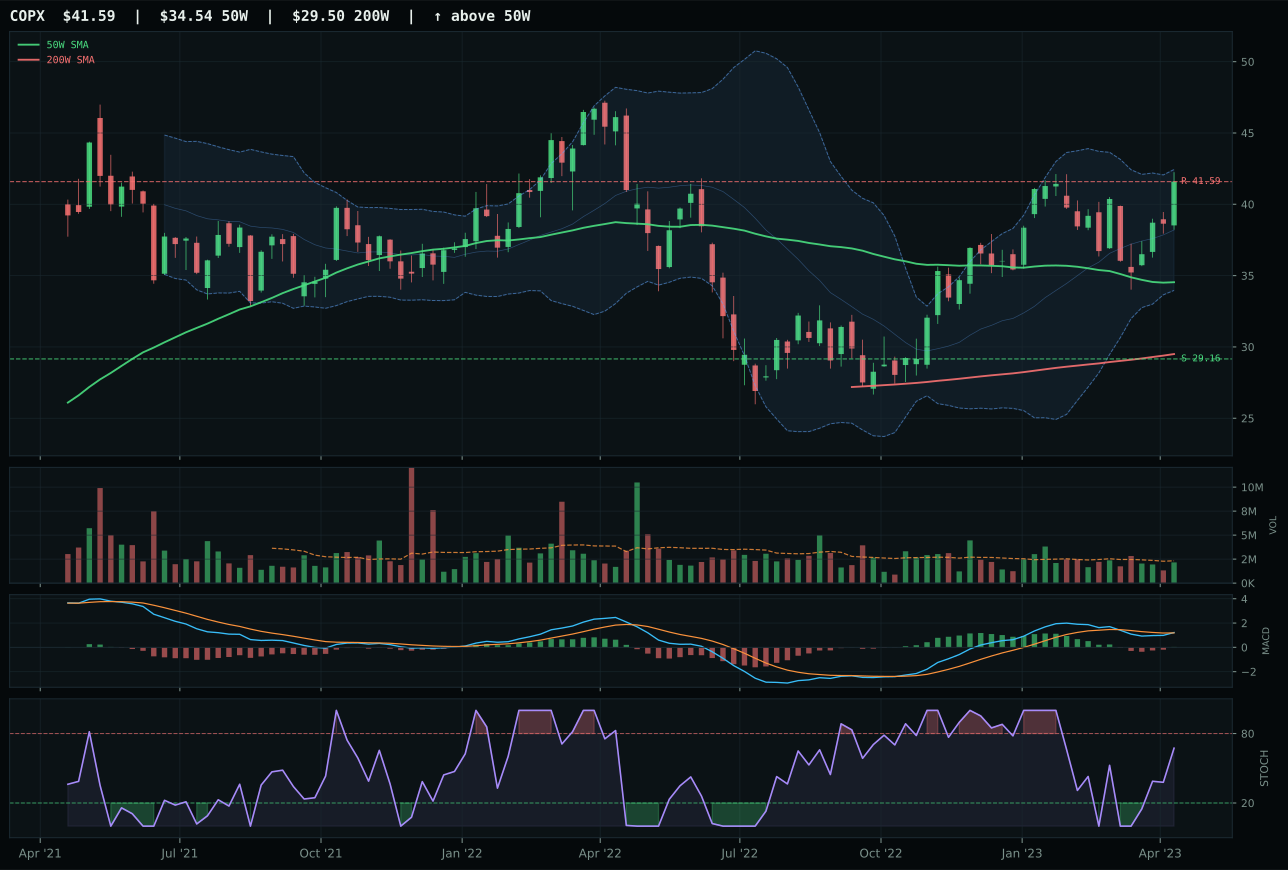
COPX has a vertical extension profile with -2.2% 13-week relative strength versus SPY.
A failed hold above support would weaken the setup.
Actionable but governed by invalidation levels.
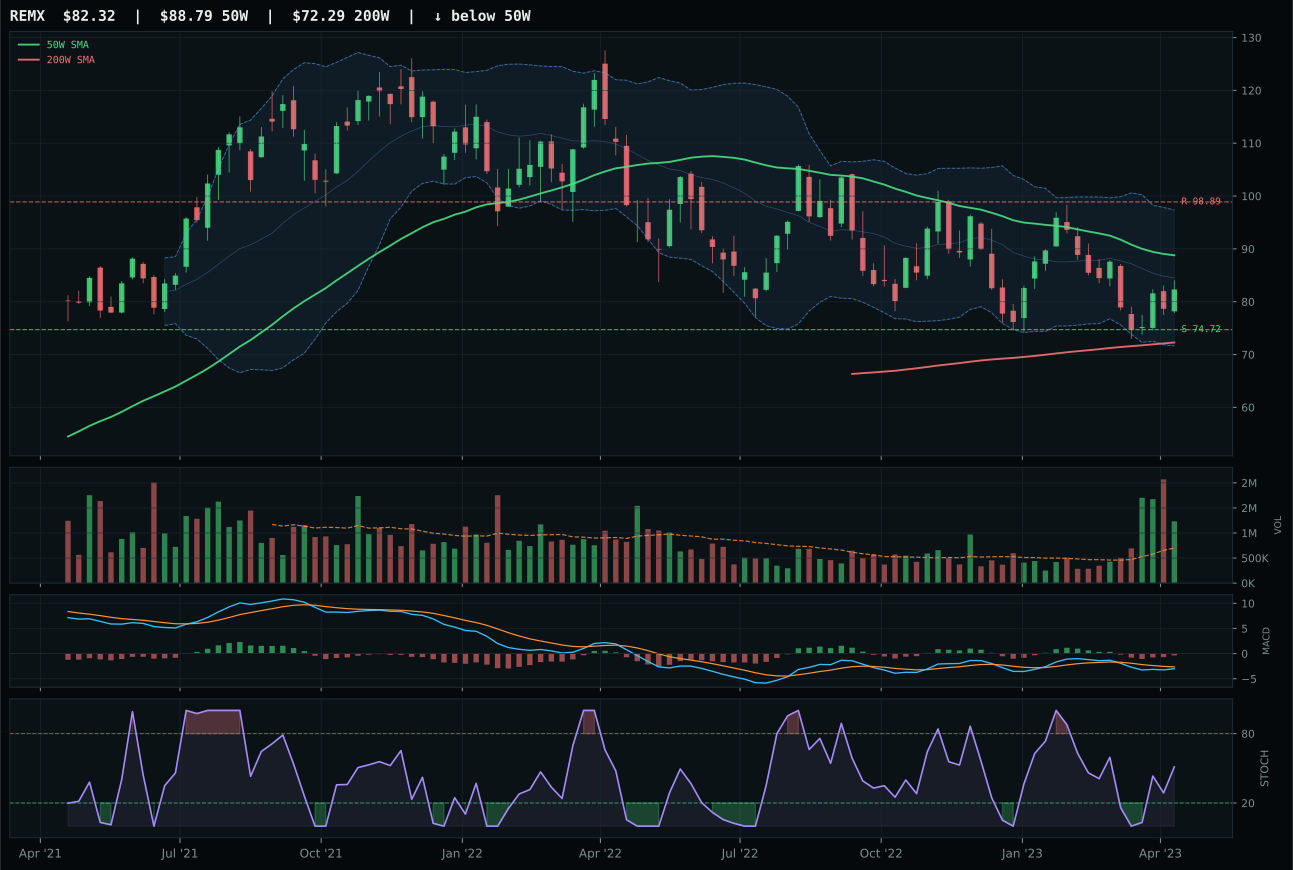
REMX has a neutral structure profile with -9.6% 13-week relative strength versus SPY.
A failed hold above support would weaken the setup.
Actionable but governed by invalidation levels.
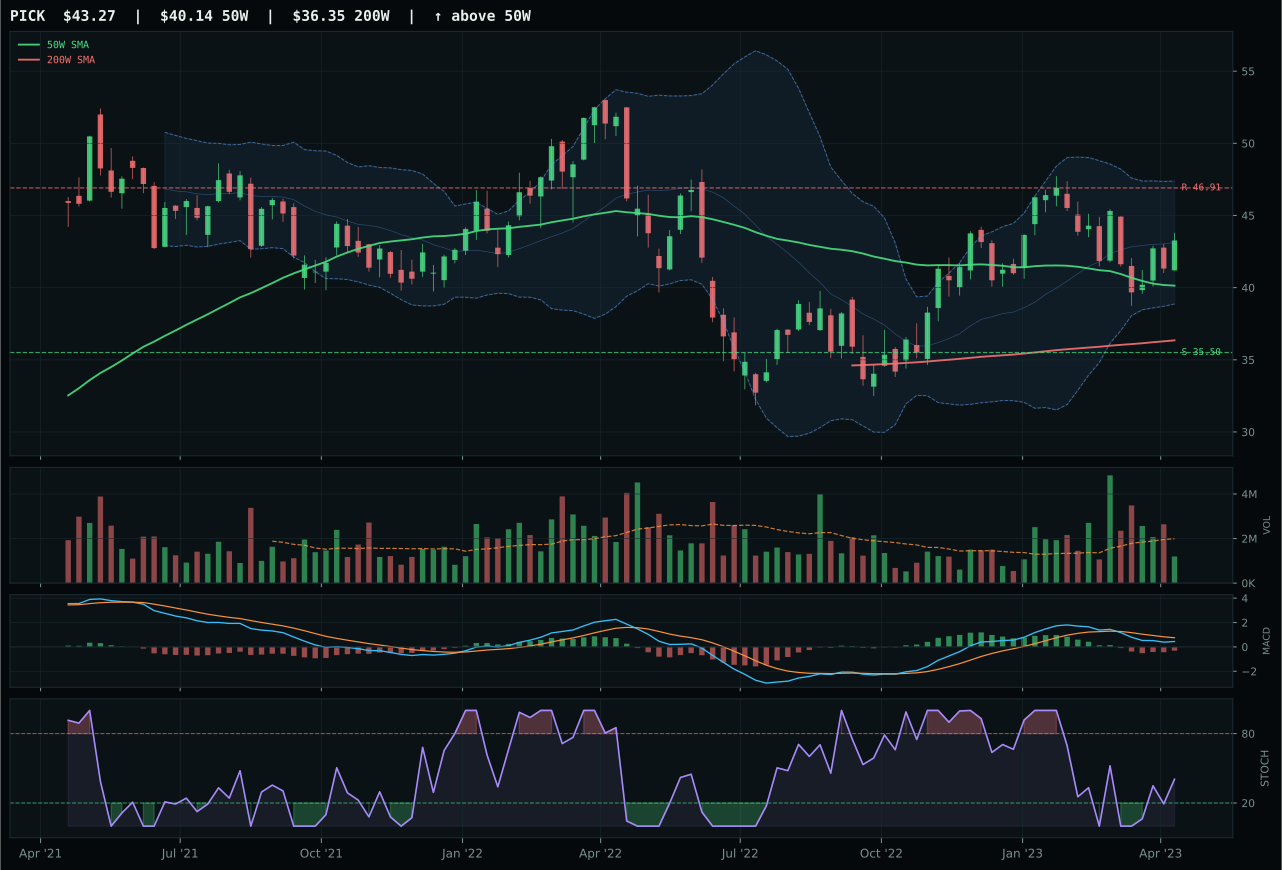
PICK has a neutral structure profile with -10.0% 13-week relative strength versus SPY.
A failed hold above support would weaken the setup.
Actionable but governed by invalidation levels.
COPX wins because it delivers perfect 100.0/100 momentum confirmation—4W return of 18.1%, category-relative strength of 7.3%, MACD bullish and improving—despite sitting extended at 20.4% above the 50W, a position that would normally signal caution. The key is that COPX's structure cleanliness of 50.0/100 and vertical extension pattern acknowledge this risk transparently rather than hiding weakness in neutral structure language. REMX, the runner-up, offered superior technical evidence at 63.8/100 (COPX 76.7/100 wins anyway) but crumbled in the momentum confirmation layer: its -6.0% 13W return, bearish-but-improving MACD, and 0.0% category-relative strength create a narrative of exhaustion rather than accumulation. Category-relative strength becomes the decisive separator: COPX's 7.3% edge over the median signals that copper scarcity sponsorship is real, not just chart construction.
Industrial Metals holds 5% allocation with a category score of 56.3 because the metals scarcity descriptor is extremely active, rated at +14 in the macro layer, combining with +10 from commodity breadth positive to create a 65.0/100 macro fit despite disinflation headwinds of -8 and credit stress of -7. This is a category where technical strength (COPX's trend 96.6/100, momentum confirmation 100.0/100) amplifies tailored macro support: the portfolio is positioning for an industrial-cycle undershoot before recovery, and copper's scarcity profile makes it the natural vehicle. The 5% weight reflects tier-2 status; it neither competes with precious metals' disinflation hedge nor achieves top-2 conviction. What keeps it in the portfolio is the marriage of real-world supply constraints (metals scarcity active) with technical proof of accumulation, creating a portfolio bet that industrial demand will stabilize before disinflation theory exhausts itself.
Utilities & Infrastructure — IGF
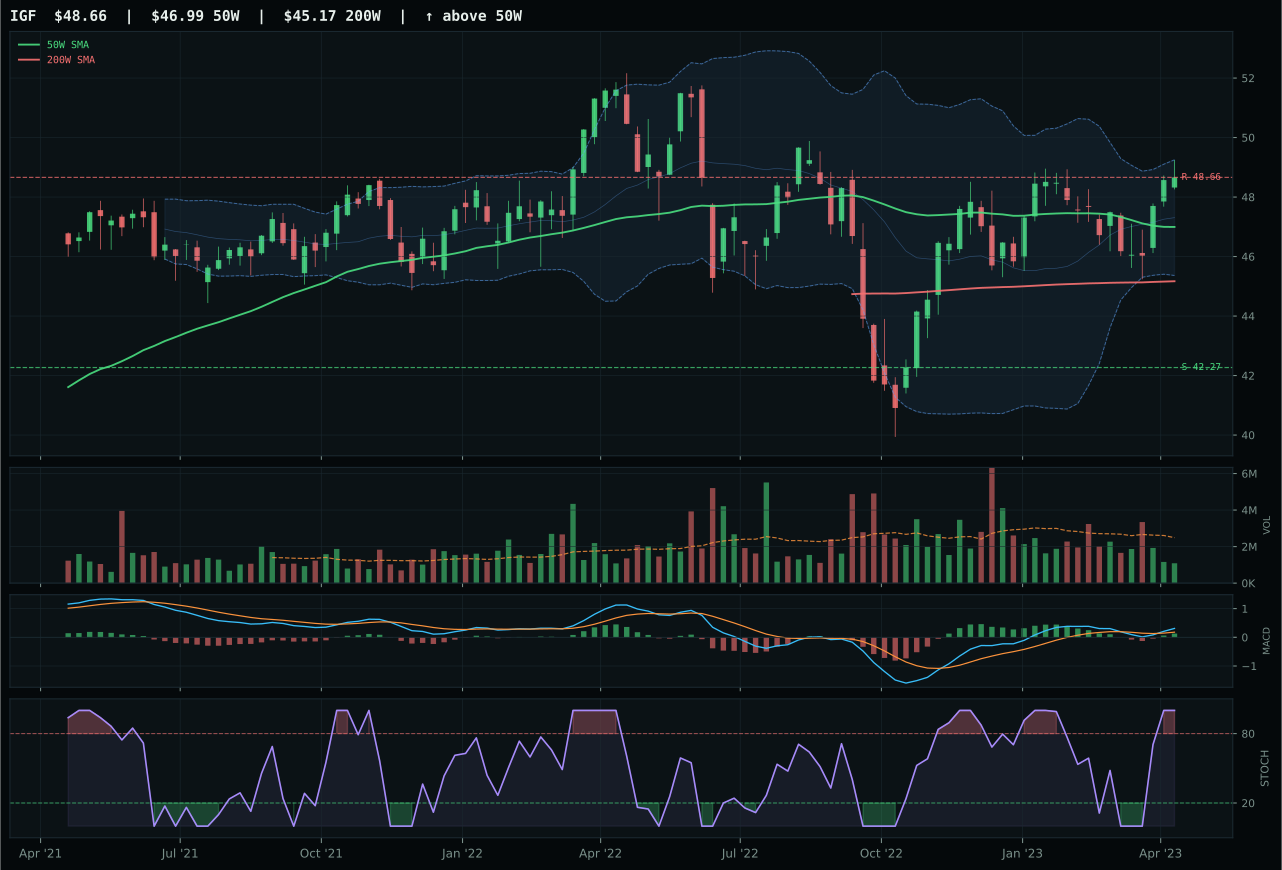
IGF has a neutral structure profile with -3.1% 13-week relative strength versus SPY.
A failed hold above support would weaken the setup.
Actionable but governed by invalidation levels.
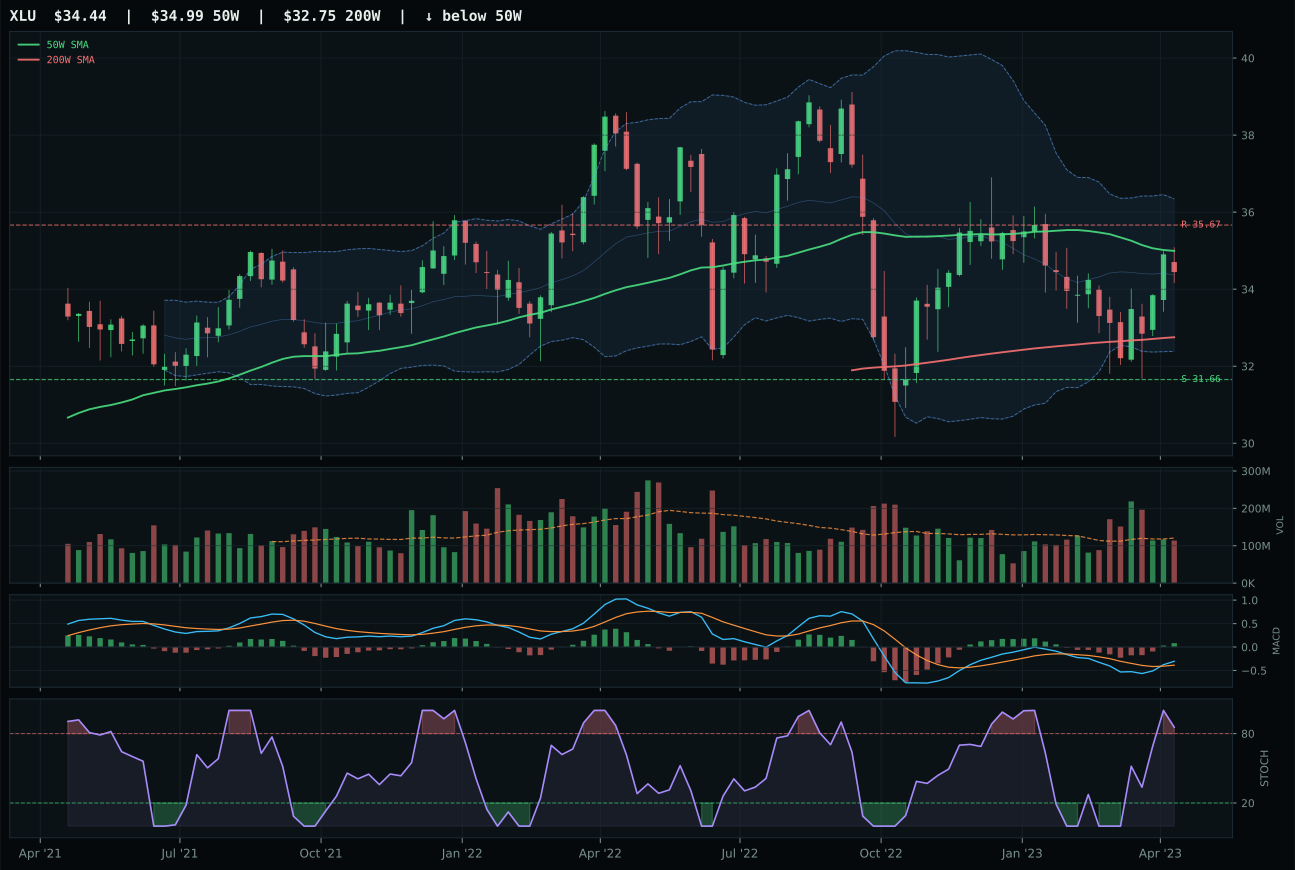
XLU has a compression near 50W profile with -6.9% 13-week relative strength versus SPY.
A failed hold above support would weaken the setup.
Actionable but governed by invalidation levels.
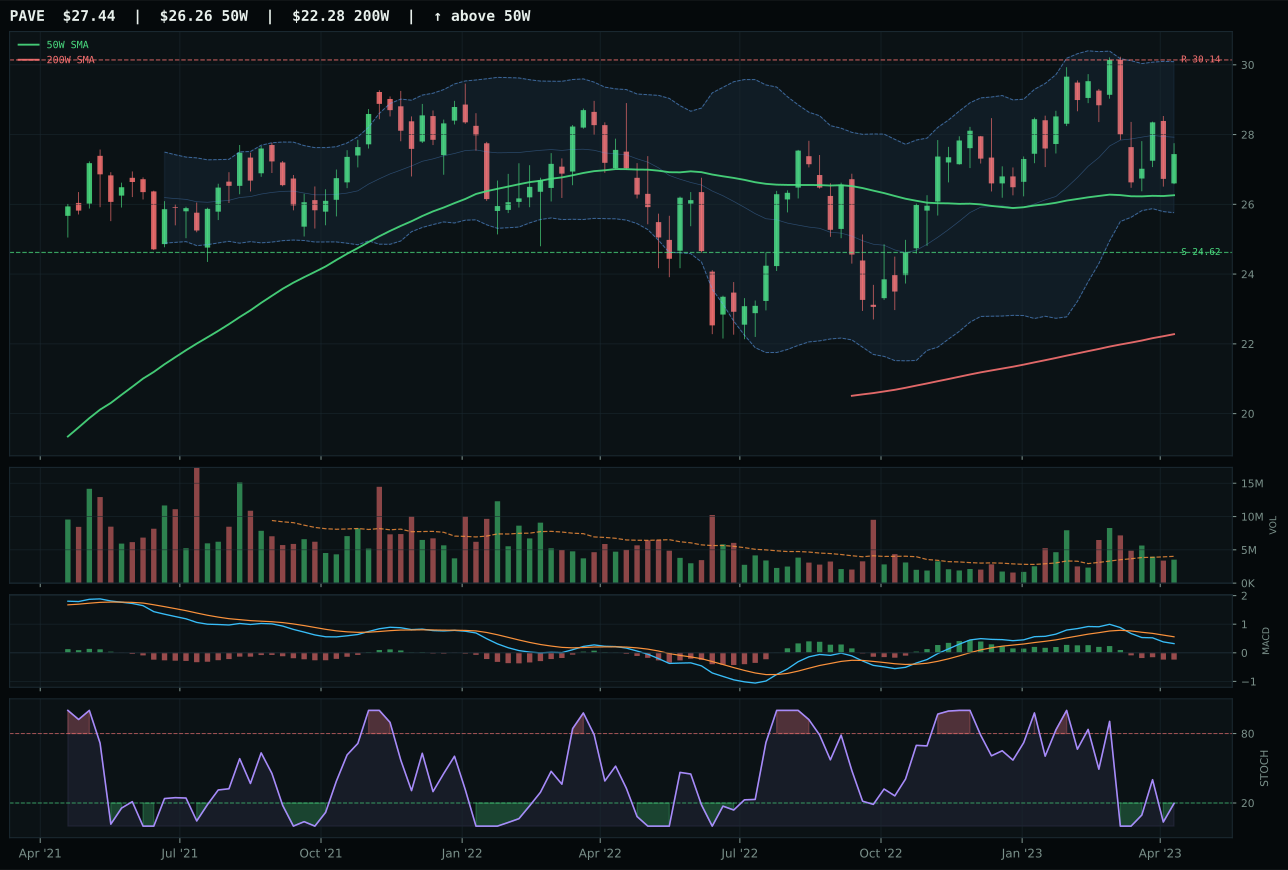
PAVE has a neutral structure profile with -7.0% 13-week relative strength versus SPY.
A failed hold above support would weaken the setup.
Actionable but governed by invalidation levels.
IGF wins by a 5.3-point margin over XLU through superior structure cleanliness (68.9/100 vs 66.6/100) and decisive category-relative strength of 3.9% versus XLU's 0.0%, overcoming XLU's perfect 100.0/100 timing score. The setup is nearly identical—both utilities, both compression or upper-retracement zones, both MACD bullish and improving, both stochastic RSI overbought—but IGF's 3.5% distance from the 50W with neutral structure offers cleaner entry than XLU's compression near the 50W and lower structure quality. IGF's 85.4/100 trend score reflects price above both moving averages with a flat 0.0% slope, providing stable foundation, while volume thin at 0.44x still confirms the move is not rejected. XLU's 55.0/100 trend score (price compressed, lower trend conviction) becomes secondary to the technical edge IGF extracts through breadth and category-relative strength accumulation.
Utilities & Infrastructure holds 5% allocation with a category score of 52.2 because the macro environment provides modest but meaningful support at 62.0/100 category-level fit, combining +7 from disinflation help, +6 from disinflation pressure descriptor, and +4 from transition/mixed regime bonus to offset -3 from liquidity stress and -2 from risk appetite positive. The 3/2/1 weighted basket (IGF 64.4, XLU 62.1, PAVE 42.9) started at 60.1 and compressed moderately to 52.2, indicating solid but not exceptional volume-price confirmation. The 5% tier-2 weight reflects a portfolio position that utilities' defensive characteristics and income streams are becoming relevant as rates stabilize under disinflation, but not compelling enough to challenge top-2 categories for capital. IGF's global infrastructure positioning adds optionality beyond pure domestic rate defense. This allocation would strengthen if disinflation pressure intensifies or if real-rate compression accelerates further.
Defense & Aerospace — ITA
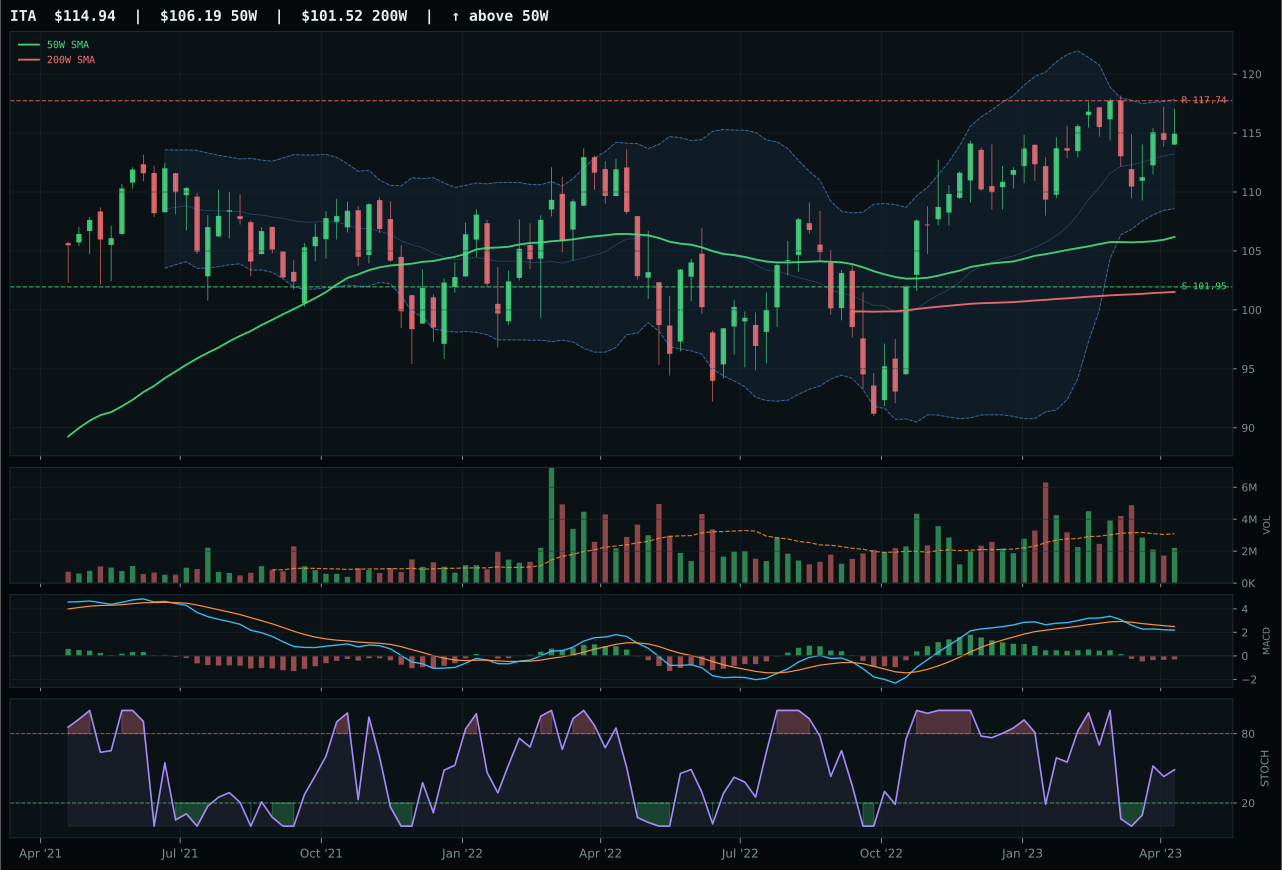
ITA has a neutral structure profile with -1.2% 13-week relative strength versus SPY.
A failed hold above support would weaken the setup.
Actionable but governed by invalidation levels.
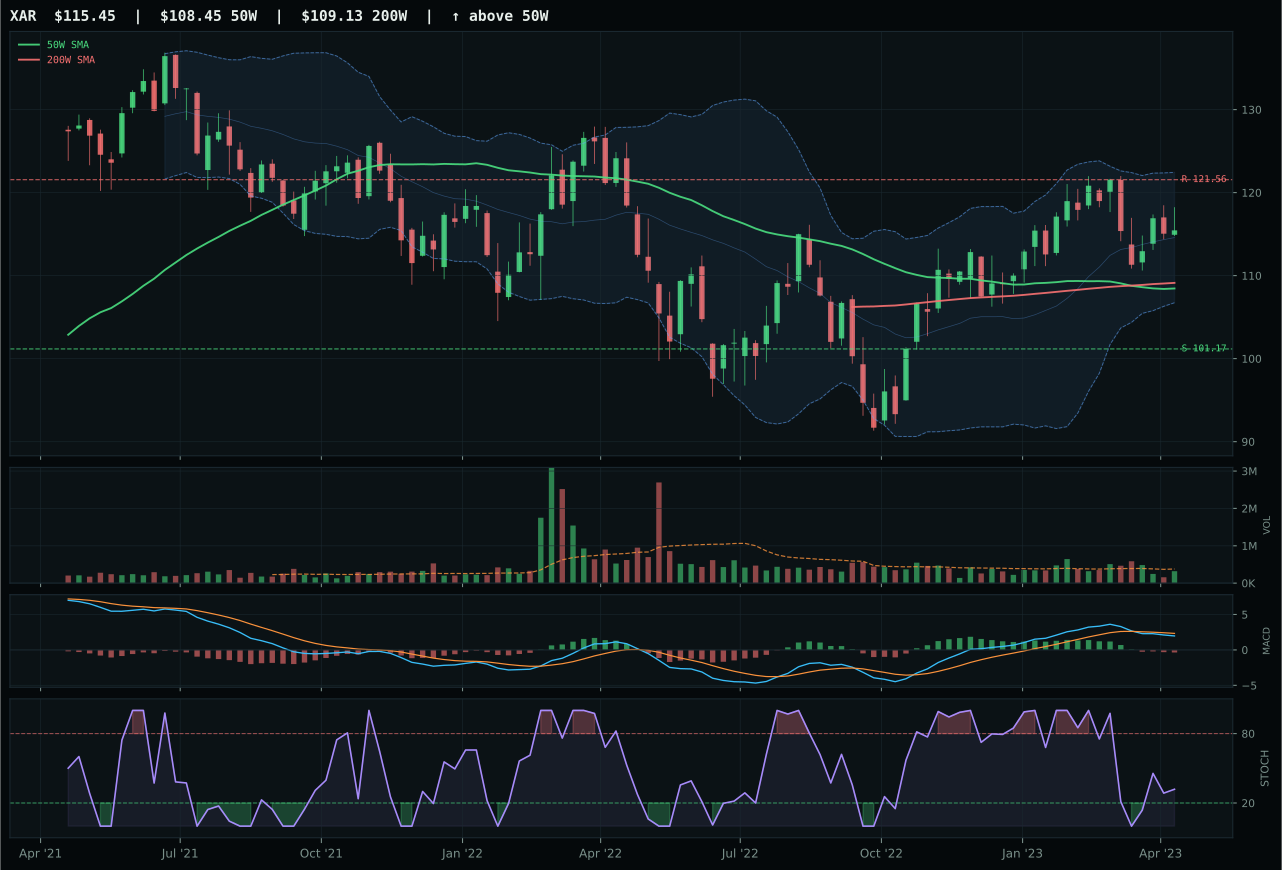
XAR has a neutral structure profile with -3.5% 13-week relative strength versus SPY.
A failed hold above support would weaken the setup.
Actionable but governed by invalidation levels.
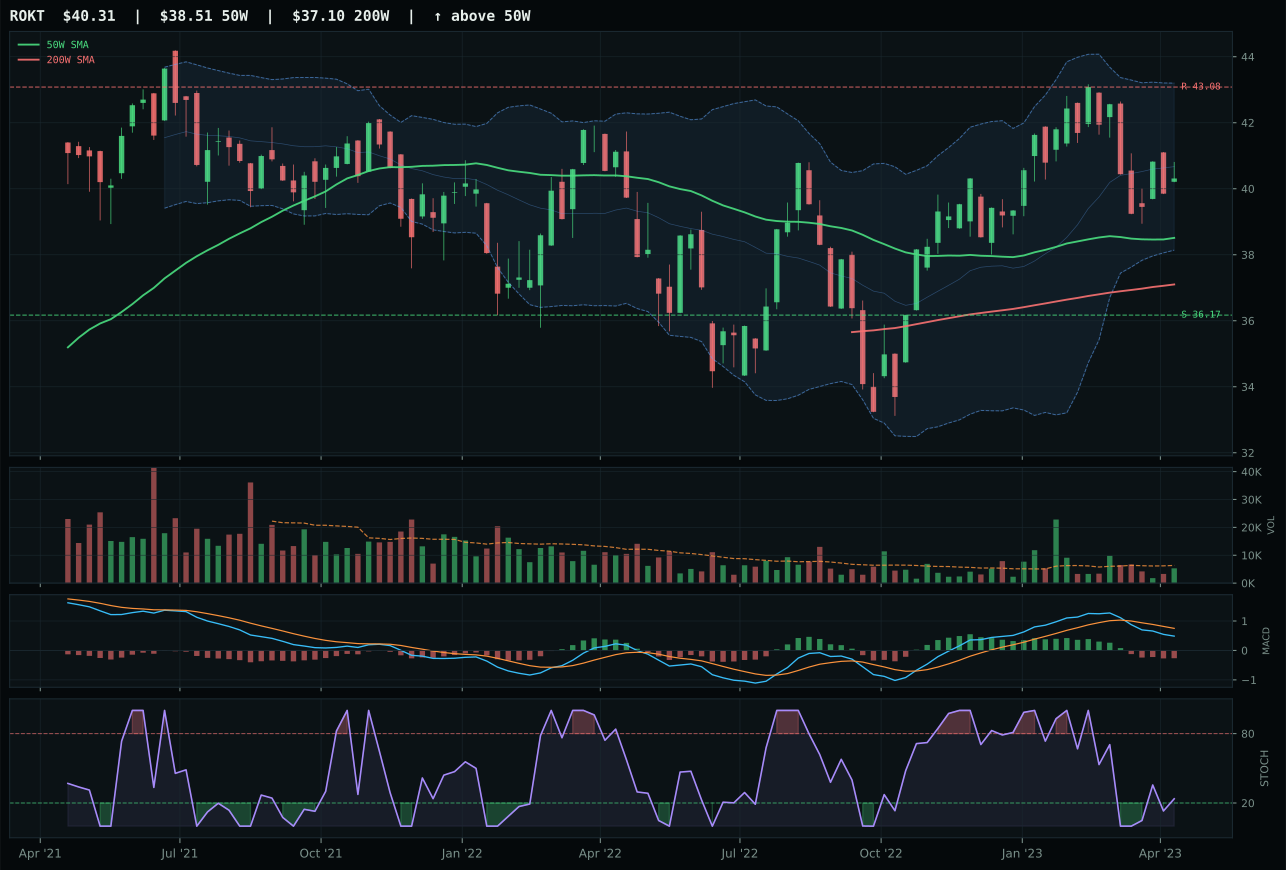
ROKT has a neutral structure profile with -6.7% 13-week relative strength versus SPY.
A failed hold above support would weaken the setup.
Tracked, but not top-2 eligible because: .
ITA wins despite a weak overall category by converting category-relative strength of +2.3% against XAR's 0.0%, a razor-thin advantage that reflects how hollow this category truly is. The technicals are defensive rather than constructive: bearish/weakening MACD, 13W returns flat at 2.3%, and momentum confirmation scoring only 41.8/100 because volume is thin and the four-week return of 4.1% cannot sustain the narrative. Price sits above both moving averages but only 8.2% from the 50W in a neutral structure compressed at 83.5/100, meaning there's no room to run without breaking cleanly above 117.74 resistance. XAR's failure comes from rolling over harder: its category-relative strength at 0.0% and 13W returns dead at 0.0% make it a technical laggard. Neither ETF offers conviction, but ITA's marginal outperformance in category breadth and timing (78.0/100 vs XAR's same score) makes it the least offensive choice.
Defense & Aerospace remains allocated at 5% only because it passed eligibility filters and ranked ahead of excluded categories; its score of 42.8 reflects genuine weakness, not strength. The macro environment is outright hostile: liquidity stress rated at -4, credit stress contributing a neutral +2, and the disinflation regime offering zero tailwind to a sector built on real spending and cycle durability. Category-level macro fit sits at 51.0/100—barely above neutral—leaving the entire portfolio commitment dependent on technical parsing of negative momentum. The tier-2 allocation here is a residual placeholder, not a conviction position. For this category to move higher in the priority stack, either credit stress metrics must reverse or risk appetite must surge hard enough to justify cyclical defense plays; currently, neither driver exists, and the thin 5% weight reflects appropriate skepticism about whether aerospace durability can overcome the macro headwinds.
Nuclear Energy — URA
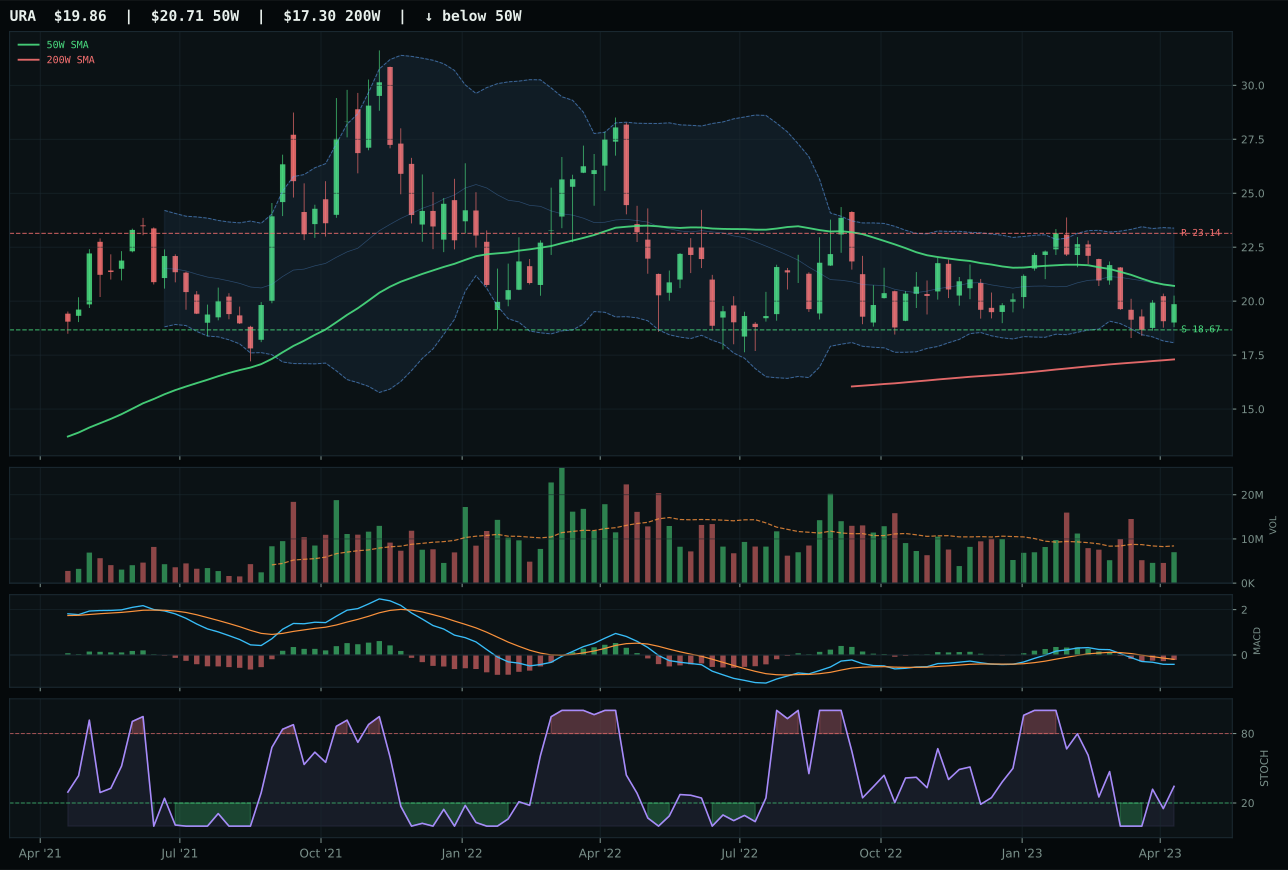
URA has a neutral structure profile with -13.8% 13-week relative strength versus SPY.
A failed hold above support would weaken the setup.
Actionable but governed by invalidation levels.
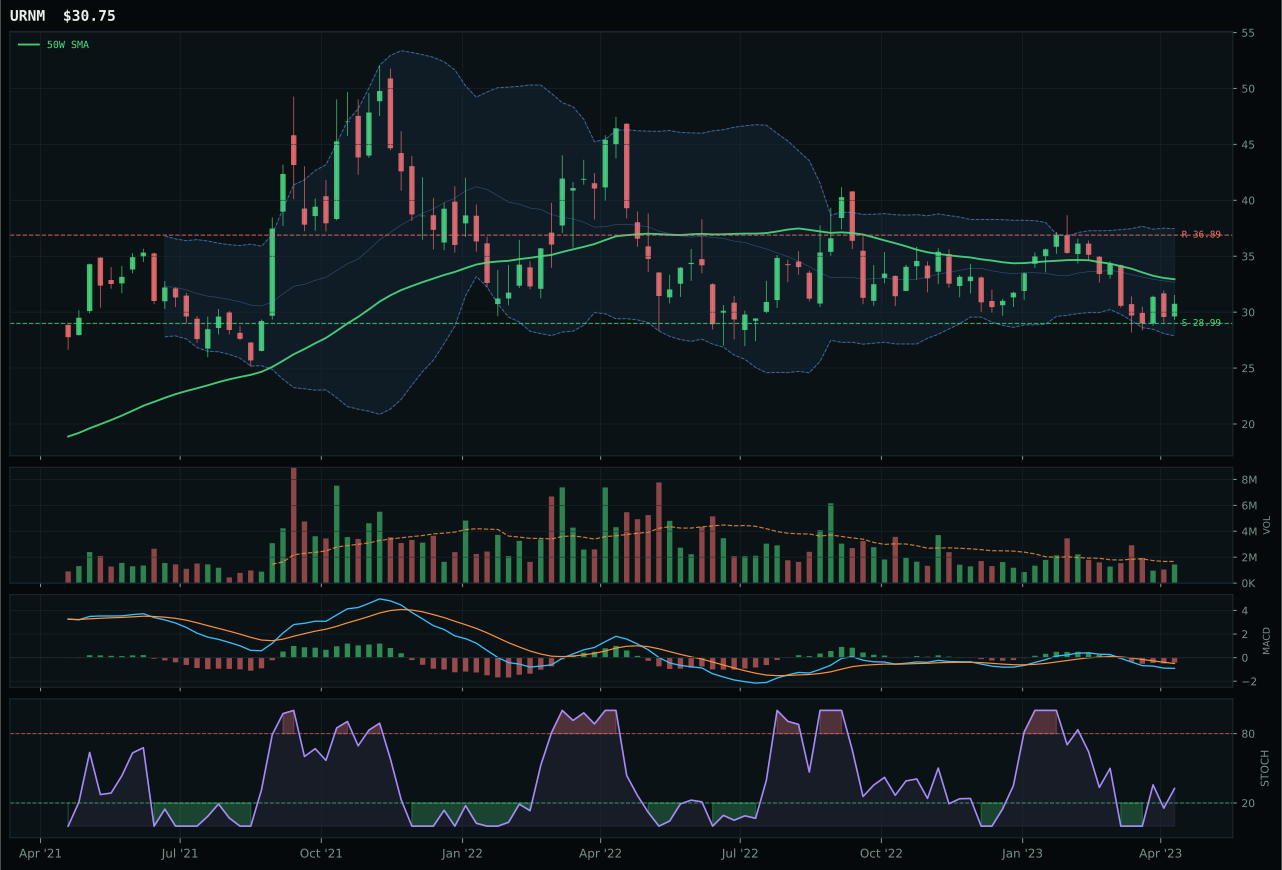
URNM has a neutral structure profile with -15.7% 13-week relative strength versus SPY.
A failed hold above support would weaken the setup.
Actionable but governed by invalidation levels.
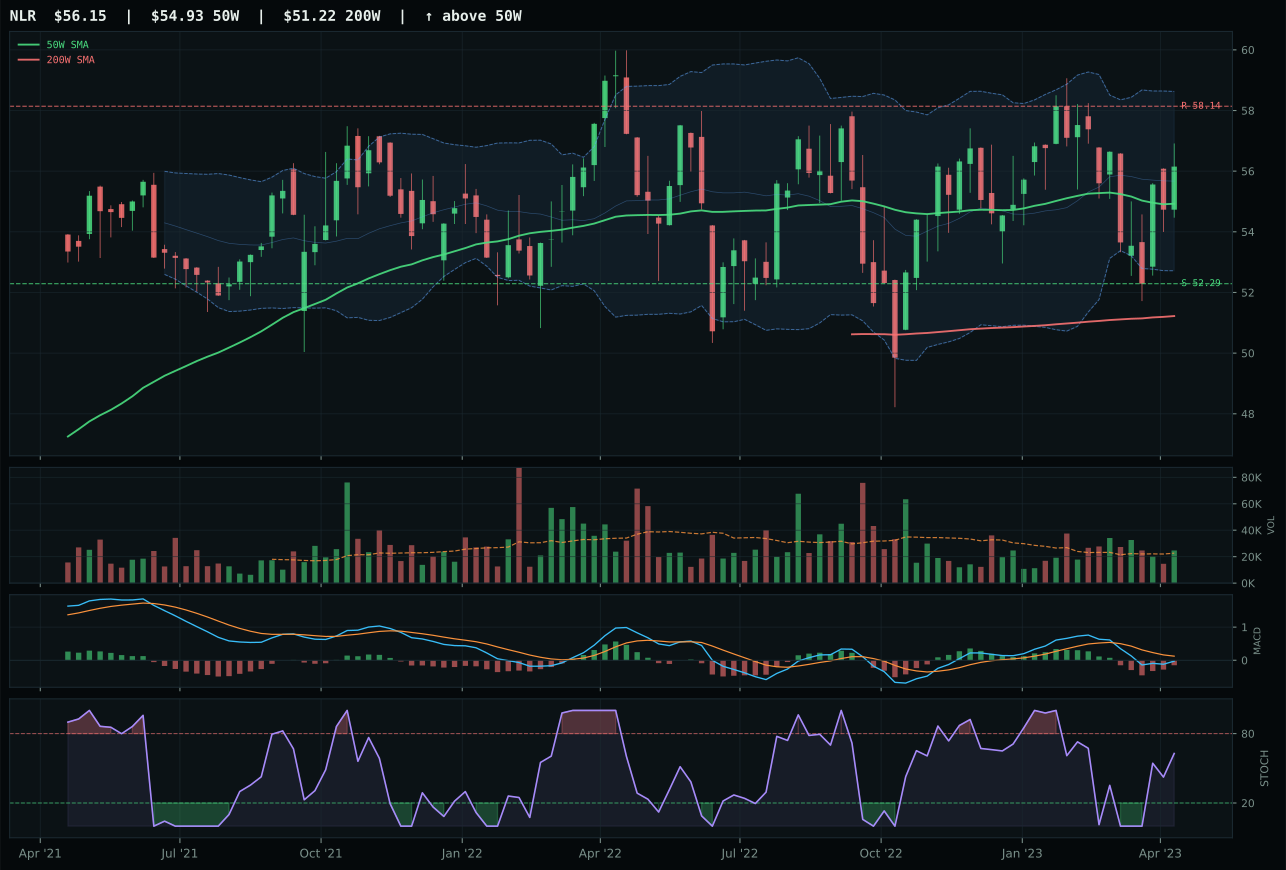
NLR has a compression near 50W profile with -4.7% 13-week relative strength versus SPY.
A failed hold above support would weaken the setup.
Tracked, but not top-2 eligible because: .
URA wins over URNM by exploiting the one dimension where chart damage can become an asset: risk/reward. URA's 85.0/100 risk/reward score—upside to resistance at -14.2% but downside to support only 6.4%—creates a defined-risk setup where 13W losses of -10.3% have painted a depressed valuation near the 52W low repair zone. URNM's -15.7% SPY-relative strength and -12.2% 13W return are worse in every direction, and its technical evidence score of 0.0/100 (versus URA's 32.1/100) reflects catastrophic momentum breakdown. URA's 93.0/100 timing score comes from price just 4.1% below the 50W with MACD bearish-weakening and stochastic RSI rising from oversold mid-zone—this is classic repair-zone geometry. URNM offers no such foundation; it's underwater without excuse.
Nuclear Energy holds 5% allocation despite a weak category score of 31.5 because the macro environment carries neutral positioning (50.0/100 macro fit) with real asset sponsorship at +7 and AI growth sponsorship at +5 offsetting moderate headwinds from liquidity stress (-7) and credit stress (-5). The 3/2/1 weighted basket (NLR 45.0, URA 37.5, URNM 14.9) compressed from an initial 37.5 to a final 31.5, indicating poor volume-price persistence and deteriorating breadth—the category is weak. The 5% slot reflects a longer-term structural bet on uranium supply tightness and AI power-demand sponsorship rather than near-term technical strength. URA's 93.0/100 timing score offers true mean-reversion potential if the selloff exhausts, but this is a speculative position that would evaporate if real asset sponsorship reverses. The allocation is hedging a specific macro scenario, not trading a validated breakout.
Agriculture & Livestock — VEGI
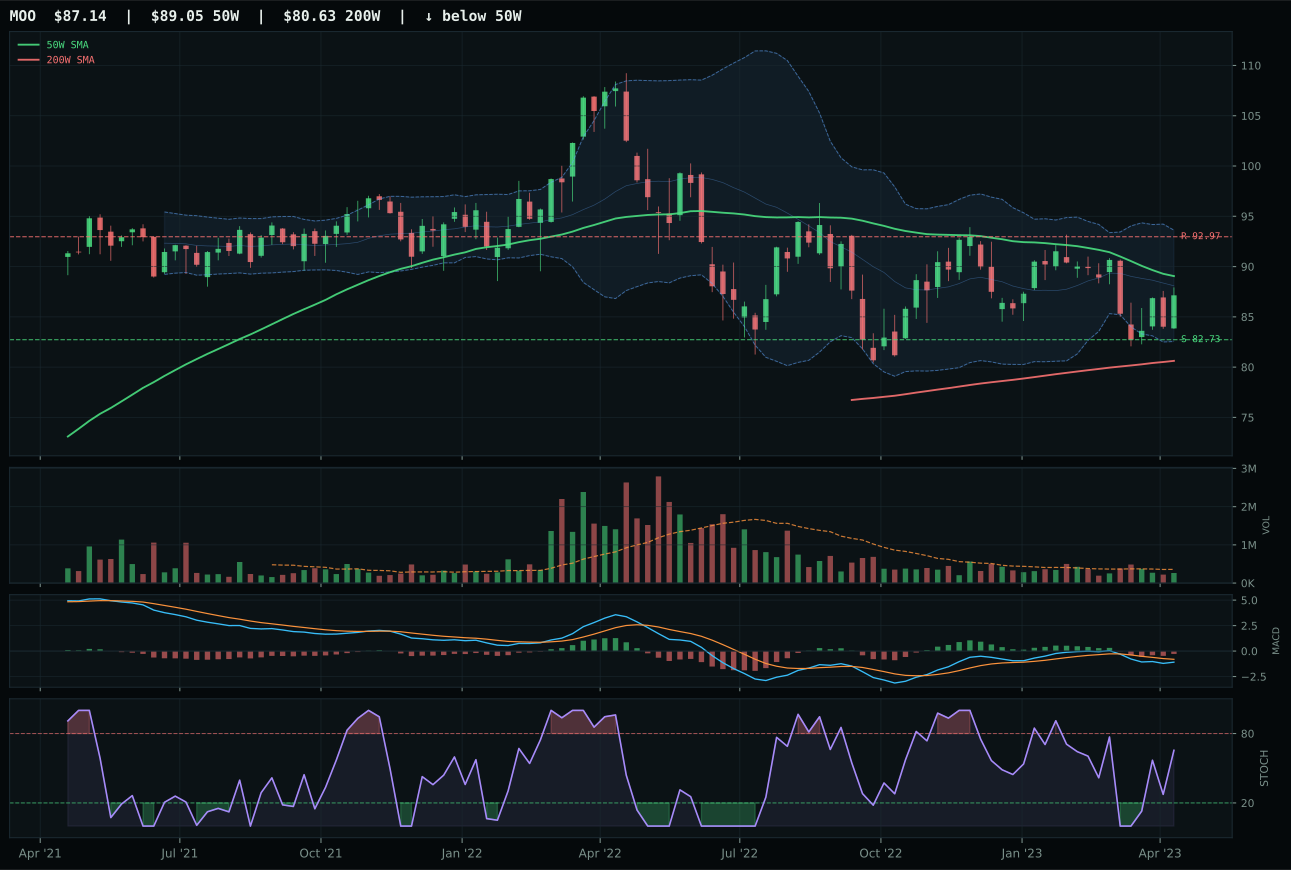
MOO has a compression near 50W profile with -7.2% 13-week relative strength versus SPY.
A failed hold above support would weaken the setup.
Actionable but governed by invalidation levels.
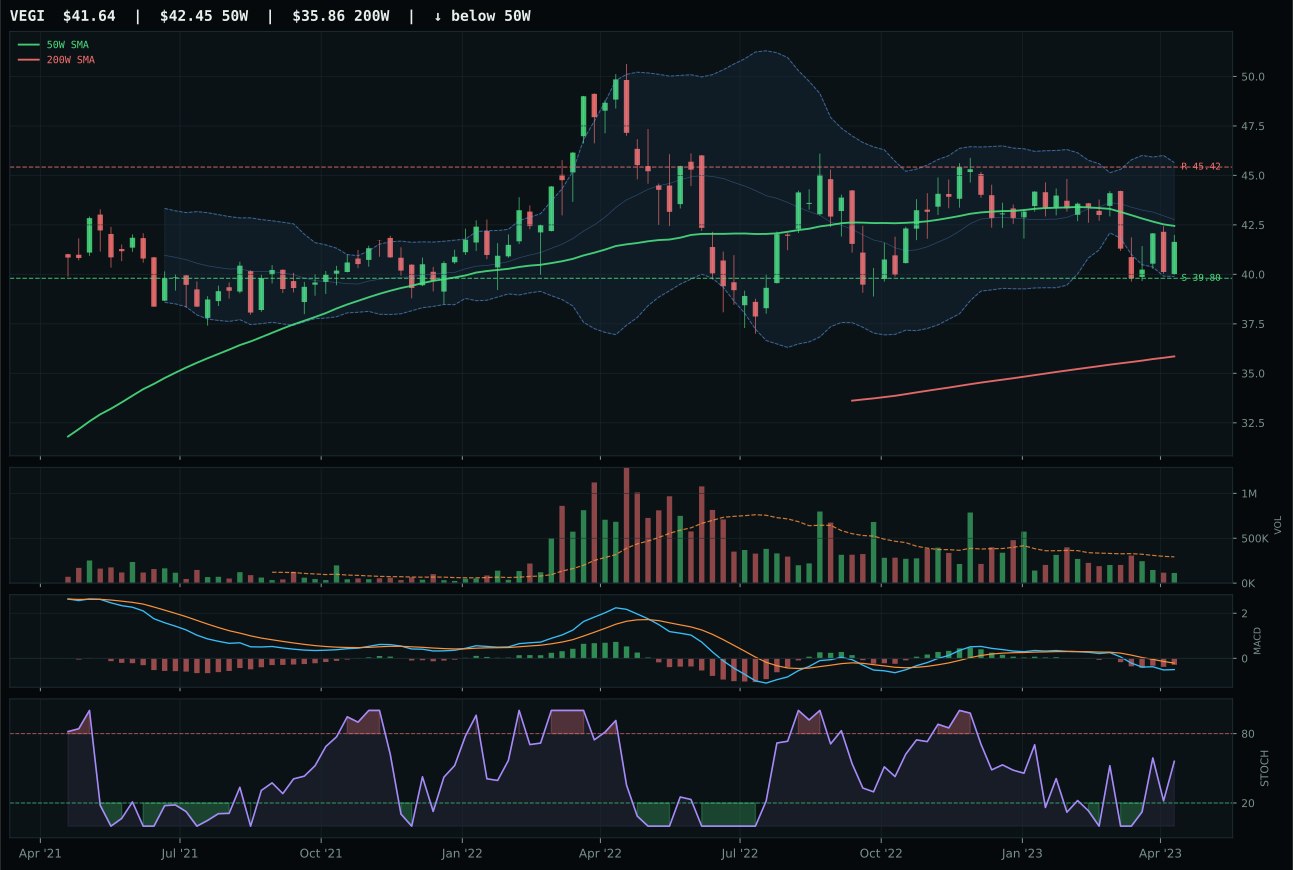
VEGI has a pullback into support profile with -9.3% 13-week relative strength versus SPY.
A failed hold above support would weaken the setup.
Actionable but governed by invalidation levels.
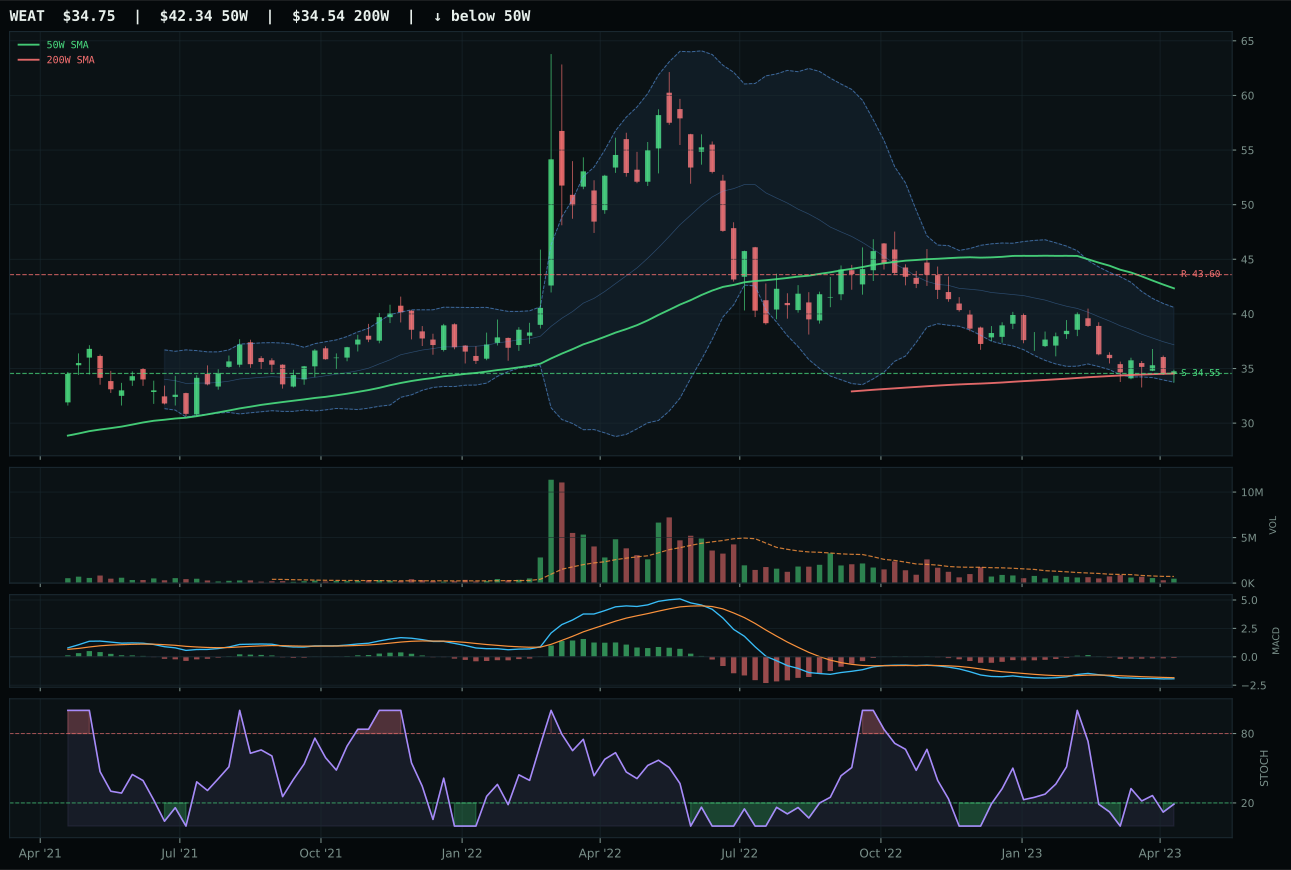
WEAT has a pullback into support profile with -11.0% 13-week relative strength versus SPY.
A failed hold above support would weaken the setup.
Actionable but governed by invalidation levels.
VEGI wins because it offers a rare technical gift in a weak category: perfect 100.0/100 timing score built on price just 1.9% below the 50W, MACD bearish but improving, and stochastic RSI rising mid-zone in a deep retracement zone near Fib 0.618. This is a setup where support at 39.80 creates defined risk on the downside (4.6% to that level) against asymmetric upside potential capped only by the -8.3% gap to resistance at 45.42. MOO, the runner-up, trapped itself in compression near the 50W and delivered weaker risk/reward (66.2/100 vs VEGI's 85.4/100), sacrificing the edge that comes with true pullback positioning. VEGI's 13W return of -5.7% paired with its category-relative strength at 0.0% tells an honest story: this is not momentum but reset, and that reset is precisely what the technicals reward when every other metric in agriculture is weak.
Agriculture & Livestock holds 5% allocation despite scoring only 27.7, the second-lowest category this week, because the macro environment is actively rotating toward real assets and commodity breadth: the +5 tailwind from commodity breadth positive combined with +8 for real asset sponsorship nearly balances the -6 disinflation headwind and -8 disinflation pressure descriptor. The 3/2/1 weighted basket started at 47.1 and compressed down to 27.7 after the system tested persistence, volume, and risk/reward quality—a harsh penalty that reflects the category's genuine fragility. The 5% slot exists not because agriculture is attractive but because it is less bad than excluded categories and because VEGI's timing score offers a legitimate mean-reversion setup if commodities stabilize. This is tactical positioning ahead of a potential macro shift, not strategic conviction; a deterioration in real asset sponsorship or a harder disinflation move would collapse this allocation to zero.
Emerging Markets — ILF
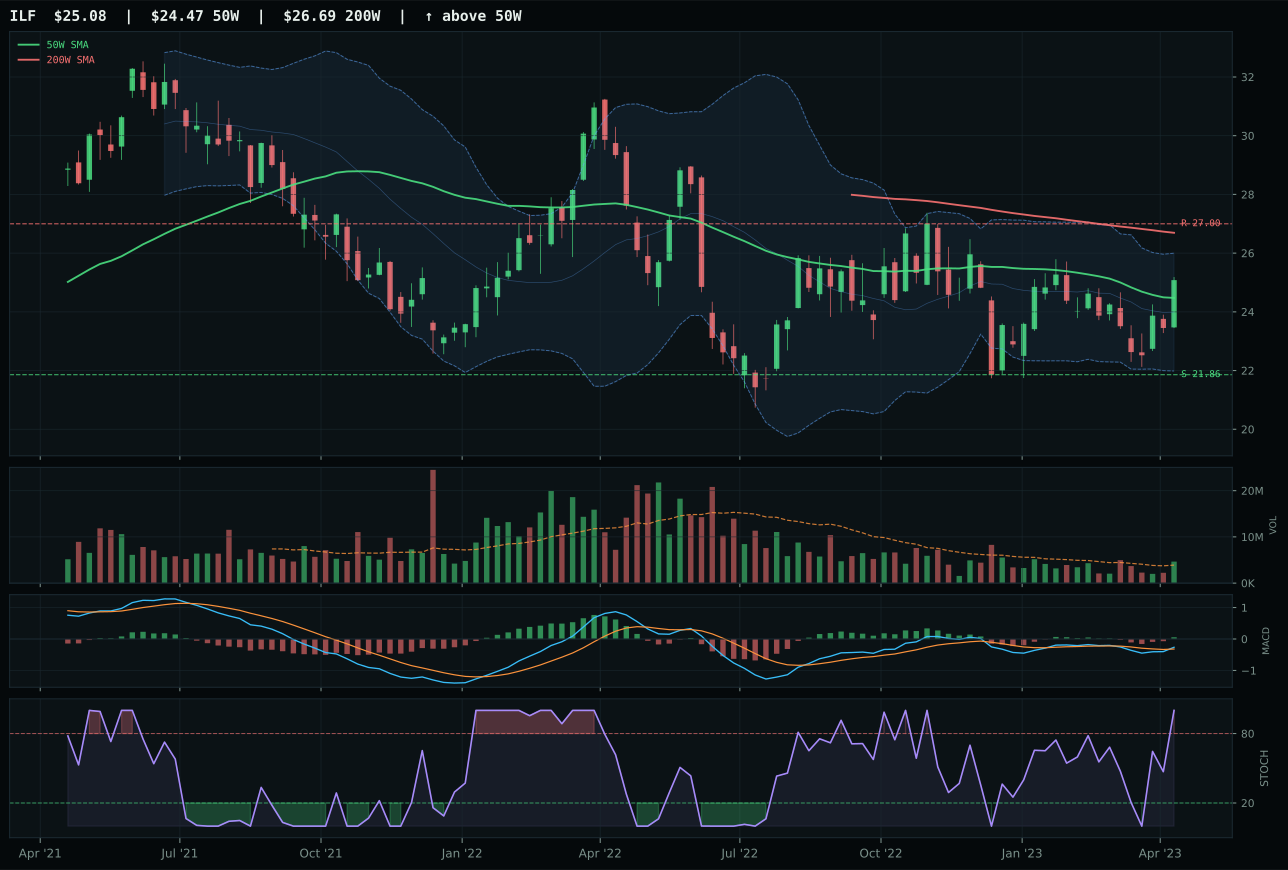
ILF has a compression near 50W profile with -2.6% 13-week relative strength versus SPY.
A failed hold above support would weaken the setup.
Actionable but governed by invalidation levels.
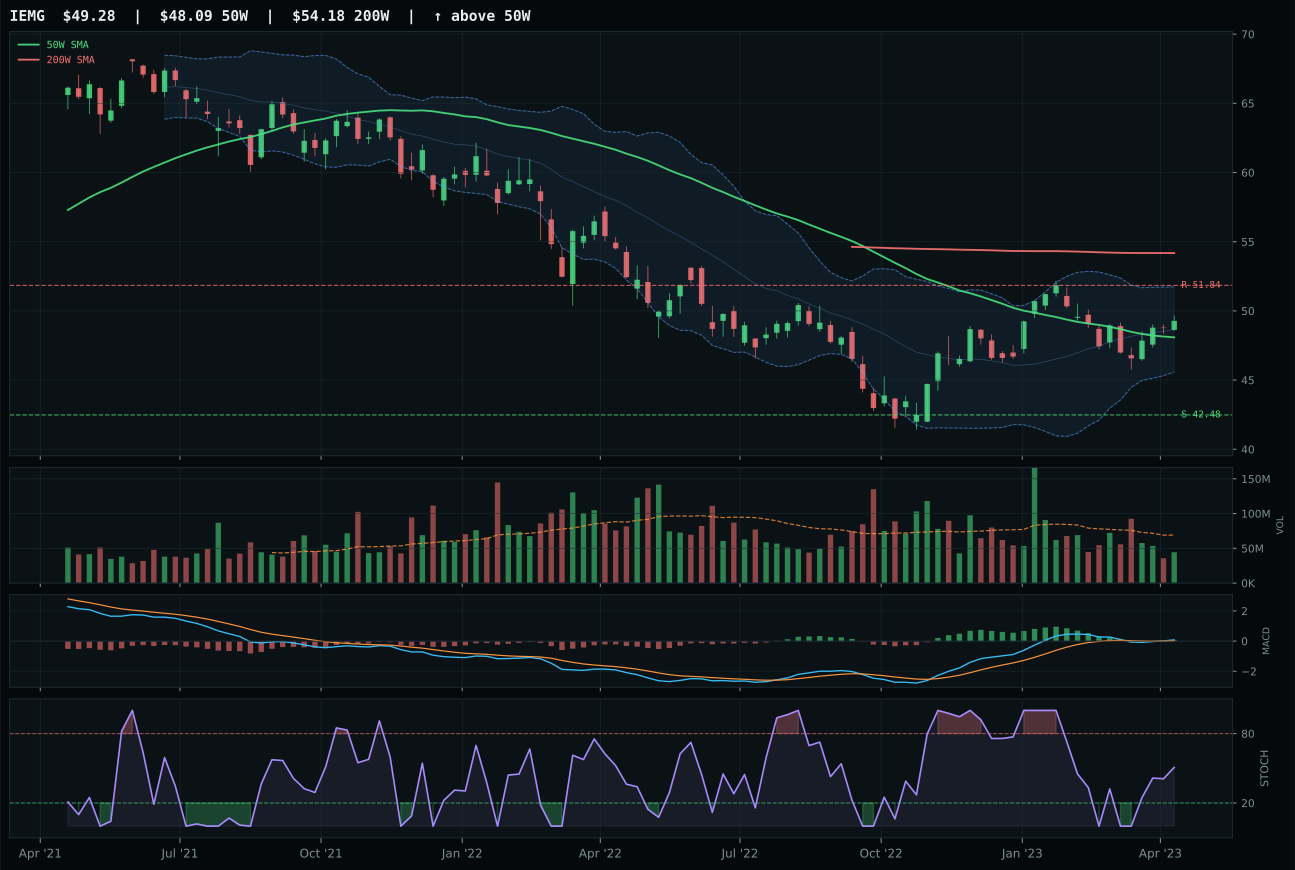
IEMG has a compression near 50W profile with -6.3% 13-week relative strength versus SPY.
A failed hold above support would weaken the setup.
Actionable but governed by invalidation levels.
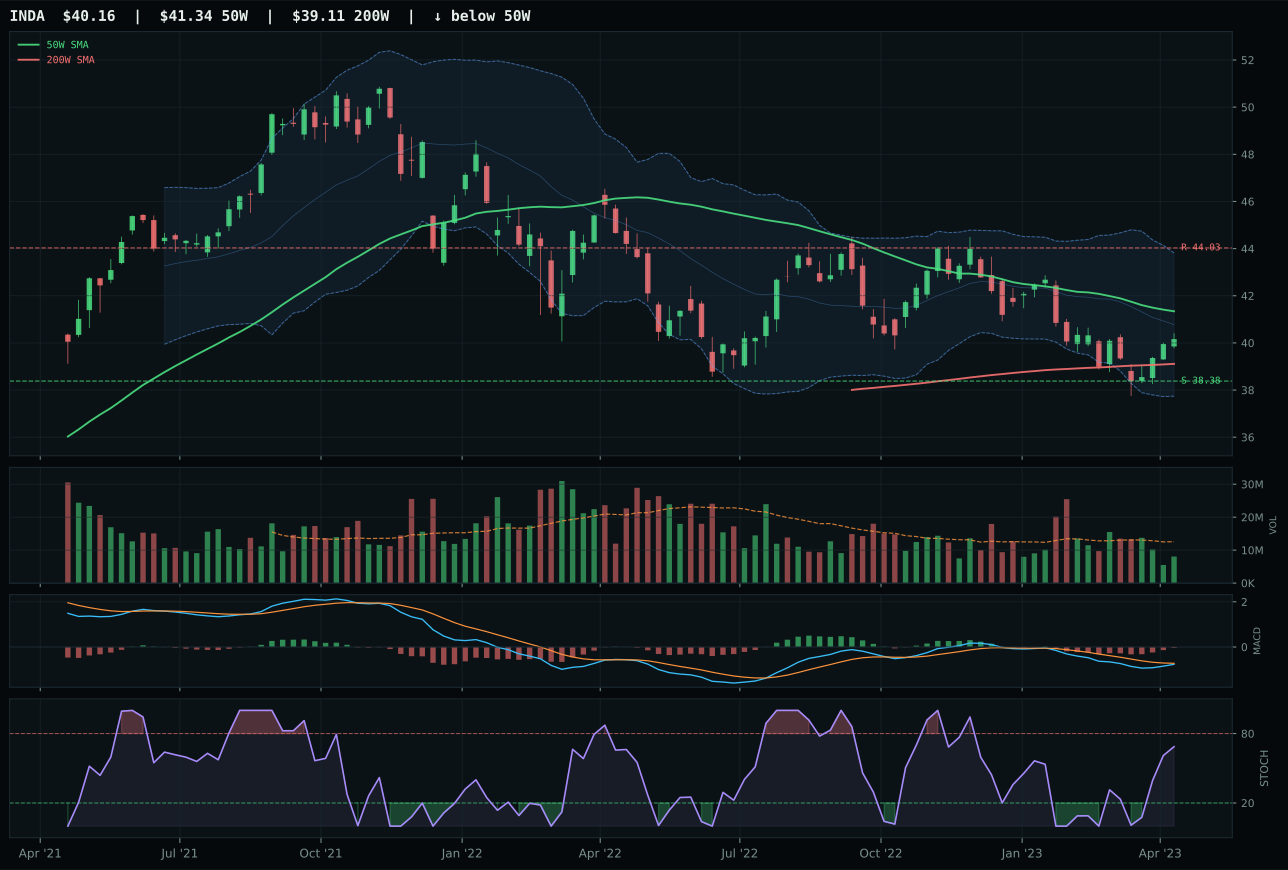
INDA has a pullback into support profile with -8.9% 13-week relative strength versus SPY.
A failed hold above support would weaken the setup.
Actionable but governed by invalidation levels.
ILF wins by 6.6 points over IEMG through superior risk/reward (61.7/100 vs 58.5/100), structure cleanliness (71.3/100 vs 68.5/100), and above-average volume participation (1.20x vs thin participation) paired with decisive category-relative strength of 3.7% against IEMG's 0.0%. The setup is compression near the 50W (2.5% distance) with MACD bullish and improving, stochastic RSI overbought at 1.00, creating a perfect timing score of 100.0/100 for both ETFs but separated by volume sponsorship and structural cleanliness. ILF's 10.8% 4W return and 0.9% 13W return create a narrative of late-cycle breakout from consolidation, while IEMG's -2.8% 13W return confirms it's lagging the category rotation. Where ILF's technical evidence scores 83.3/100, IEMG manages only 59.2/100, a gap driven entirely by volume, structure, and relative strength confirmation.
Emerging Markets earns 0% allocation, excluded from the portfolio entirely, despite ILF's technical strength because the category score of 27.4 failed to reach allocable tier positions and the macro environment is actively hostile at 38.0/100 category-level fit. Credit stress rated at -10 and liquidity stress at -10 create a symmetrical one-two punch that overwhelms the +8 from risk appetite positive. The 3/2/1 weighted basket (ILF 71.9, IEMG 53.1, INDA 31.2) started strong at 58.9 but compressed harshly to 27.4 after testing volume-price sponsorship, persistence, and risk/reward quality. The portfolio is declining to add emerging-market duration during a period when both liquidity and credit stress are elevated, even though ILF's compression-breakout setup is technically sound. For emerging markets to return to allocation, credit stress must reverse or risk appetite must spike hard enough to overcome the tightening regime that currently dominates positioning.
Traditional Energy — XLE
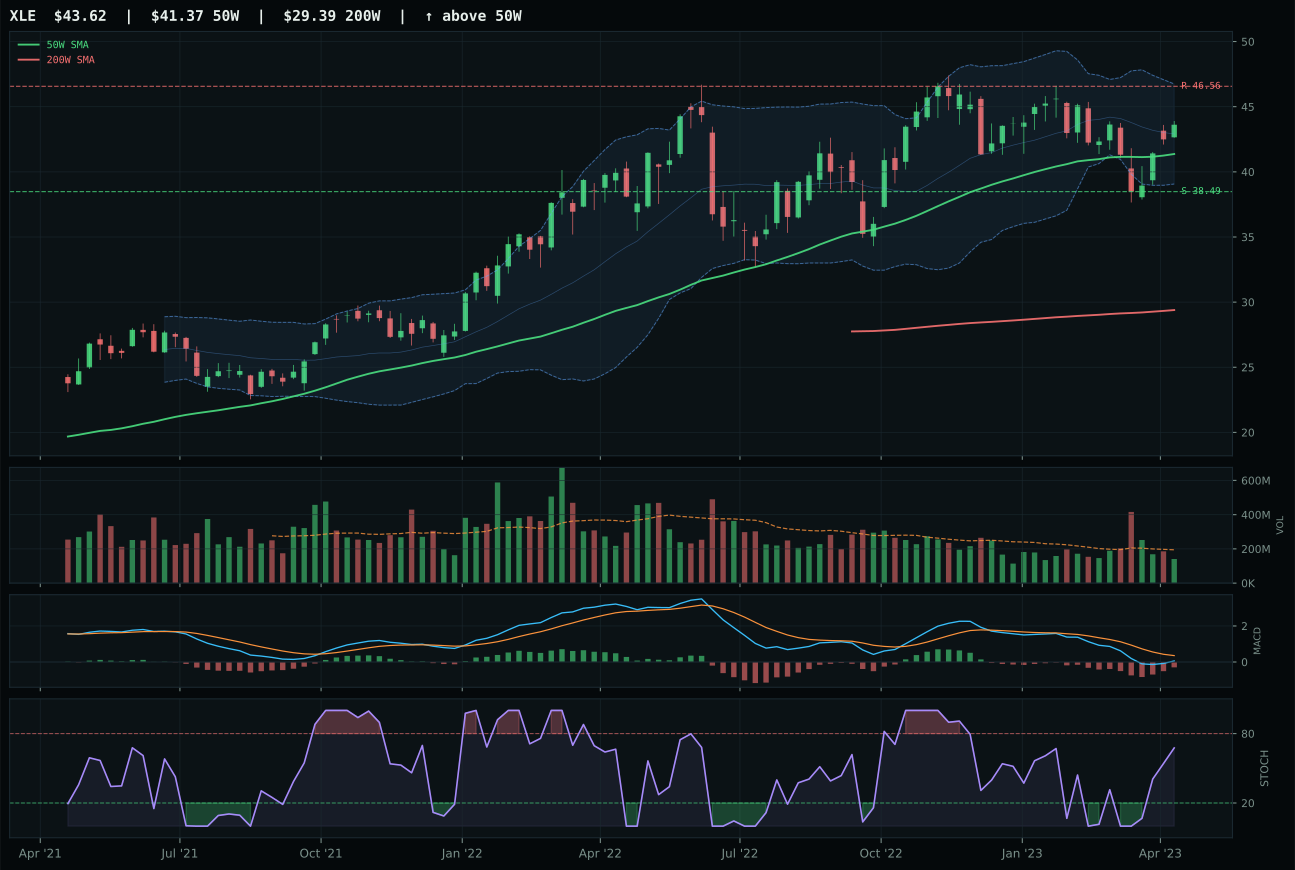
XLE has a neutral structure profile with -6.5% 13-week relative strength versus SPY.
A failed hold above support would weaken the setup.
Actionable but governed by invalidation levels.
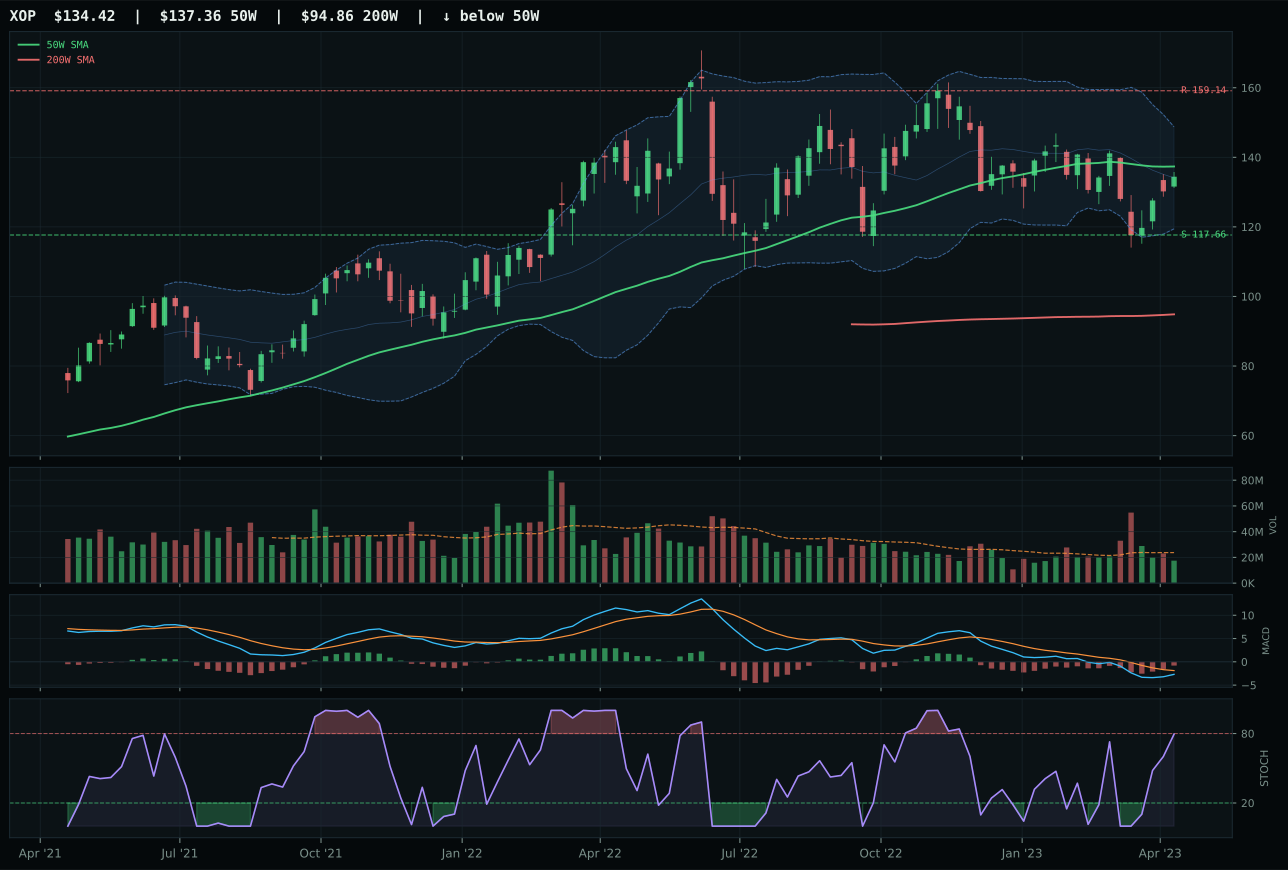
XOP has a compression near 50W profile with -6.9% 13-week relative strength versus SPY.
A failed hold above support would weaken the setup.
Actionable but governed by invalidation levels.
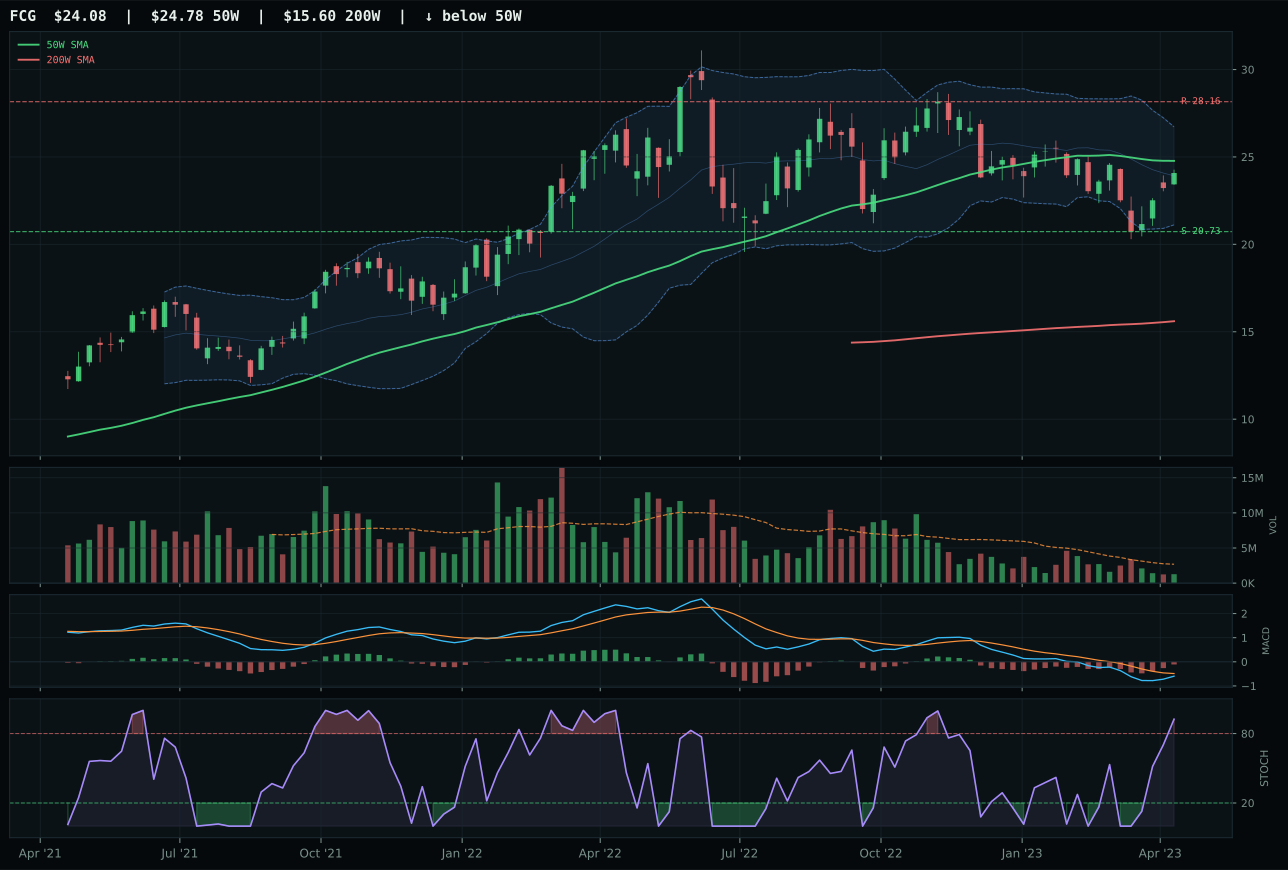
FCG has a compression near 50W profile with -7.7% 13-week relative strength versus SPY.
A failed hold above support would weaken the setup.
Actionable but governed by invalidation levels.
XLE wins by a narrow 6.5-point margin over XOP, but even victory in this category is a Pyrrhic achievement: the spread comes down to structure cleanliness (73.0/100 vs 71.4/100) and category-relative strength (0.3% vs 0.0%), margins so thin they barely register. XLE's setup—price 5.4% above the 50W, MACD bearish but improving, stochastic RSI rising mid-zone, thin 0.72x volume—offers zero conviction. The 13W return of -3.0% paired with four-week outperformance of +13.3% screams momentum divergence: short-term noise in a longer-term downtrend. XOP's compression near the 50W and 100.0/100 timing score would normally create an edge, but both ETFs are fighting the same macro headwind, and XLE's marginal structure advantage tips an otherwise indifferent category decision.
Traditional Energy earns 0% allocation, excluded entirely from the portfolio, because its category score of 17.9 ranked outside the allocable positions (9th or 10th tier) and its macro fit of 23.0/100 is catastrophically poor. Disinflation hurts this exposure by -10, disinflation pressure descriptor subtracts another -10, and credit stress adds -7 more, overwhelming the +7 from real asset sponsorship. The fundamental problem is regime mismatch: the portfolio is positioned for a disinflationary environment where energy demand stays suppressed and capital redirection flows to monetization and scarcity plays, not commodity extraction. XLE's bearish-weakening MACD and thin volume confirm that even technical buyers have abandoned conviction. For energy to re-enter the allocation, either the macro regime must shift toward reflationary pressure or credit stress must spike high enough that real-asset diversification overrides sector weakness—neither condition exists this week.