
2023-04-07
Informational purposes only. The content in this report, including allocations, analysis, and commentary, is provided solely for informational and educational purposes. It does not constitute financial advice, investment advice, trading advice, or any other type of advice. Past performance does not guarantee future results. Always conduct your own research and consult a qualified financial professional before making investment decisions.
Weekly Allocation
| Ticker | Category | Weight | Role |
|---|---|---|---|
| FBTC | 50% | Overlay | |
| GLD | Precious Metals | 10% | Top-2 (10%) |
| IGV | Technology | 10% | Top-2 (10%) |
| SMH | AI | 5% | Tier-2 (5%) |
| XLU | Utilities & Infrastructure | 5% | Tier-2 (5%) |
| COPX | Industrial Metals | 5% | Tier-2 (5%) |
| IEMG | Emerging Markets | 5% | Tier-2 (5%) |
| ITA | Defense & Aerospace | 5% | Tier-2 (5%) |
| URA | Nuclear Energy | 5% | Tier-2 (5%) |
Trade Instructions — Monday Open
Sell the tranche from 2023-03-10 (completing its 4-week hold). Buy the new tranche. Instructions show net portfolio changes — same-asset positions cancel, weight changes show the delta.
| Action | Ticker | Instruction |
|---|---|---|
| SELL | XAR | Sell entire XAR position (5.00% of portfolio) |
| SELL | XLK | Sell 40% of XLK position (reduce 12.50% → 7.50%) |
| SELL | IGF | Sell entire IGF position (2.50% of portfolio) |
| SELL | SMH | Sell 12% of SMH position (reduce 10.00% → 8.75%) |
| SELL | URA | Sell 20% of URA position (reduce 6.25% → 5.00%) |
| SELL | PICK | Sell entire PICK position (2.50% of portfolio) |
| SELL | MOO | Sell entire MOO position (2.50% of portfolio) |
| BUY | FBTC | Buy FBTC — 62.50% of freed cash (adds 12.50% to portfolio) |
| BUY | XLU | Buy XLU — 6.25% of freed cash (adds 1.25% to portfolio) |
| BUY | ITA | Buy ITA — 6.25% of freed cash (adds 1.25% to portfolio) |
| BUY | COPX | Buy COPX — 6.25% of freed cash (adds 1.25% to portfolio) |
| BUY | IEMG | Buy IEMG — 6.25% of freed cash (adds 1.25% to portfolio) |
| BUY | IGV | Buy IGV — 12.50% of freed cash (adds 2.50% to portfolio) |
Current Portfolio After Trade
Combined holdings across all 4 active tranches. Each tranche is 25% of the portfolio.
| Ticker | % of Portfolio | Weight Bar |
|---|---|---|
| FBTC | 50.00% | |
| SMH | 8.75% | |
| XLK | 7.50% | |
| URA | 5.00% | |
| GLD | 5.00% | |
| XLU | 5.00% | |
| ITA | 5.00% | |
| COPX | 5.00% | |
| INDA | 2.50% | |
| IEMG | 2.50% | |
| IGV | 2.50% | |
| GDX | 1.25% |
Macro Regime — Goldilocks
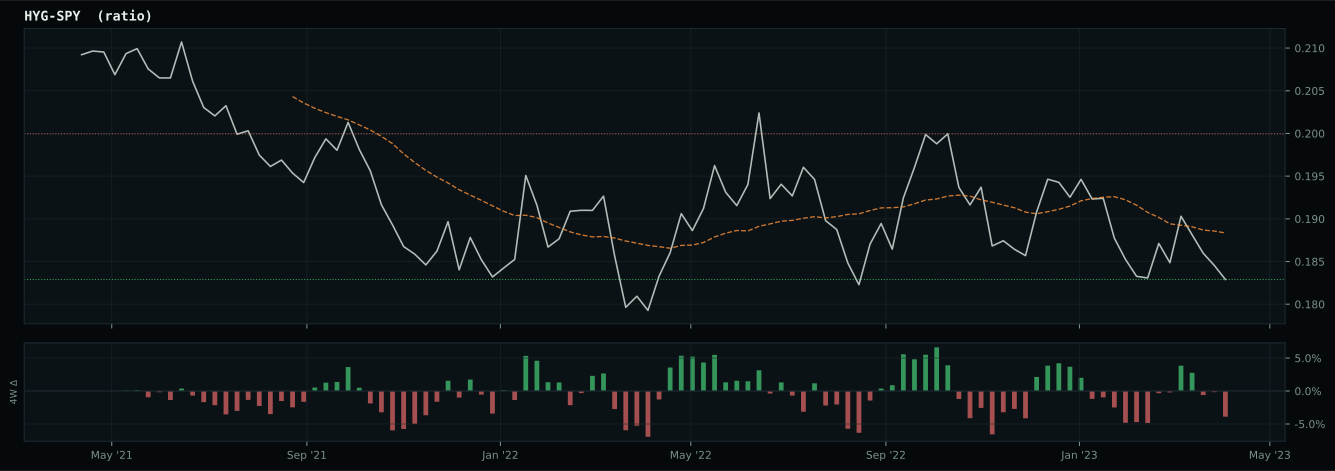
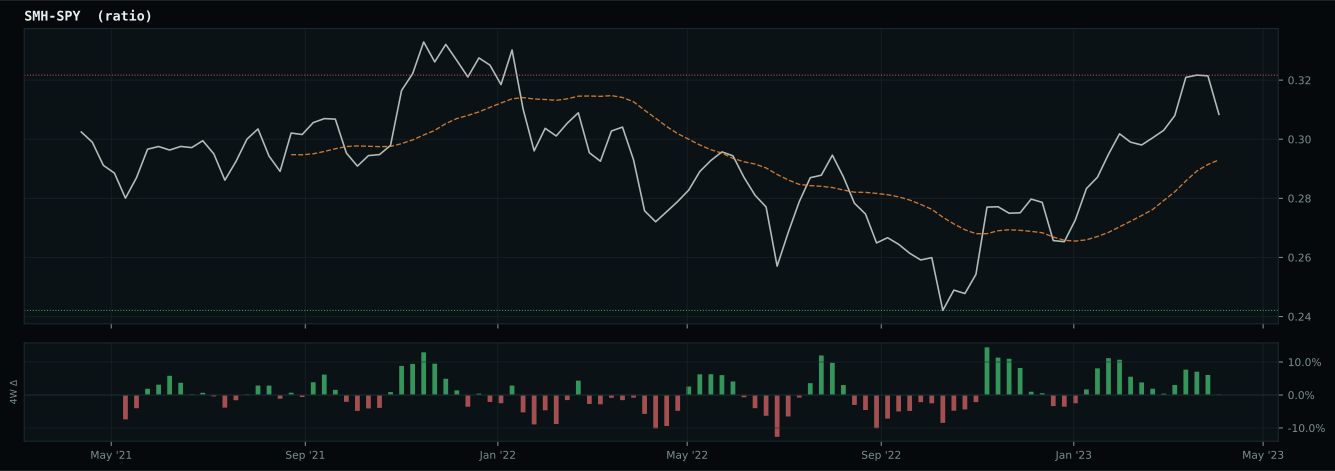
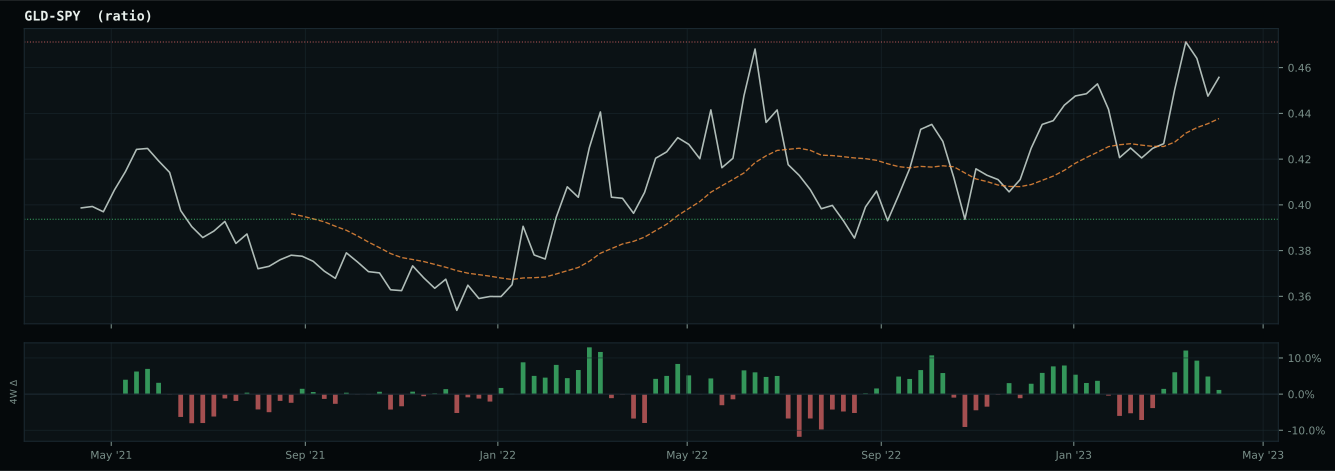
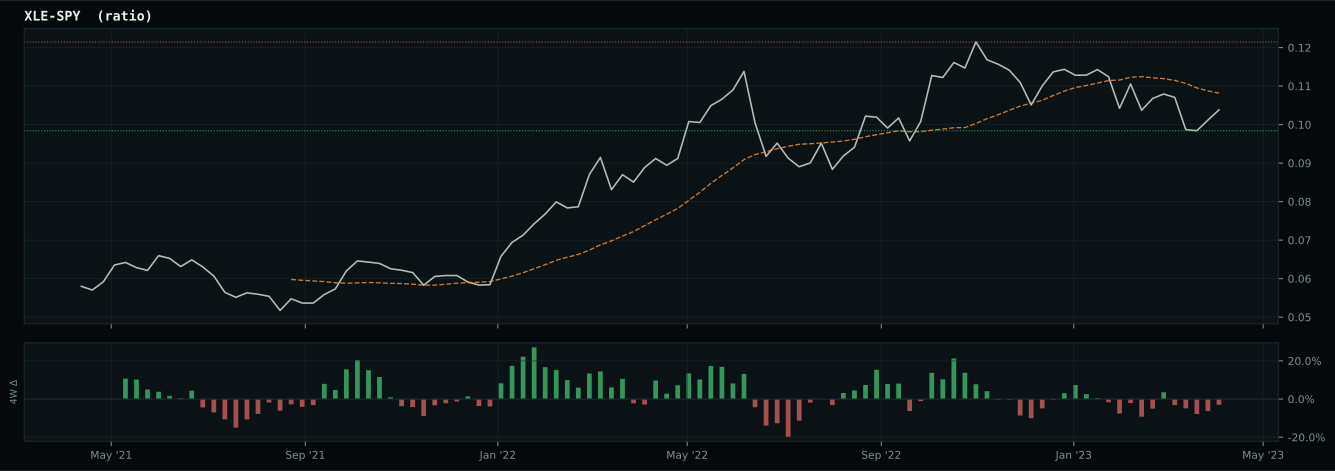
Macro Evidence Charts
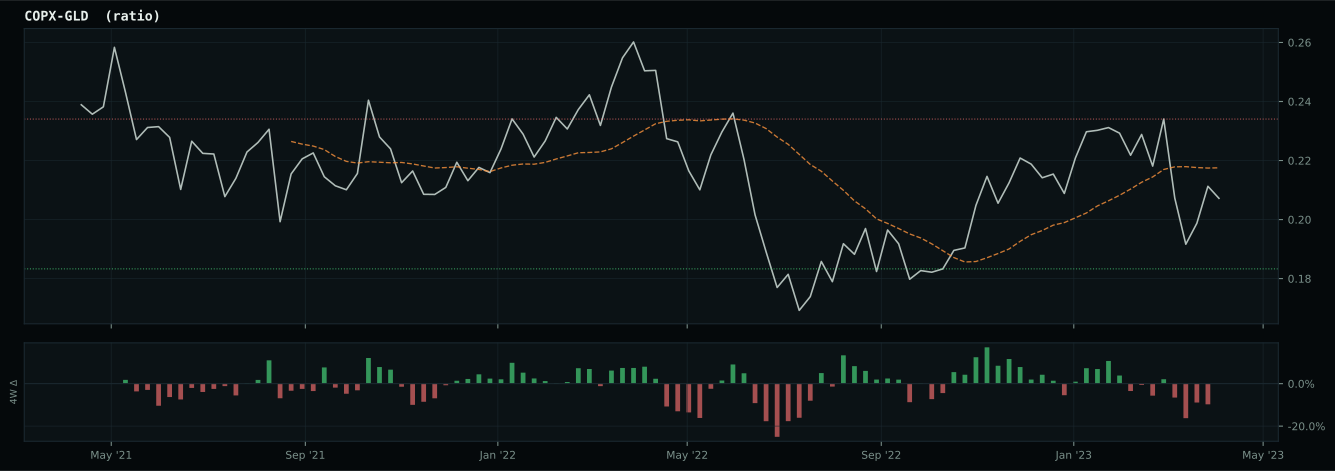
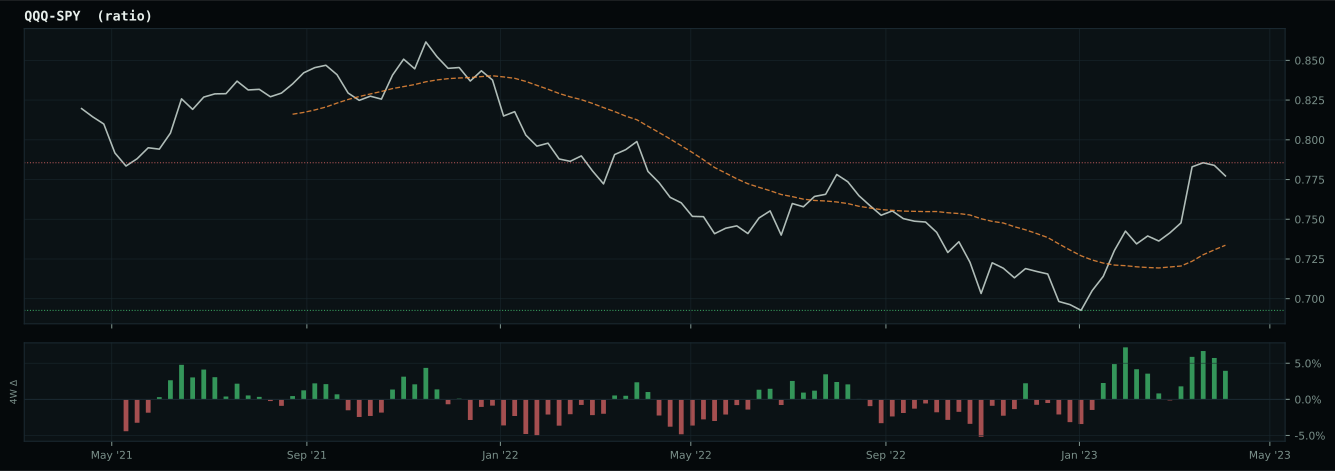
Market-implied signals behind the macro regime scores. Each ratio compares two assets; the direction and slope of the ratio is what the macro engine reads.
Crypto Regime — ValueBTC
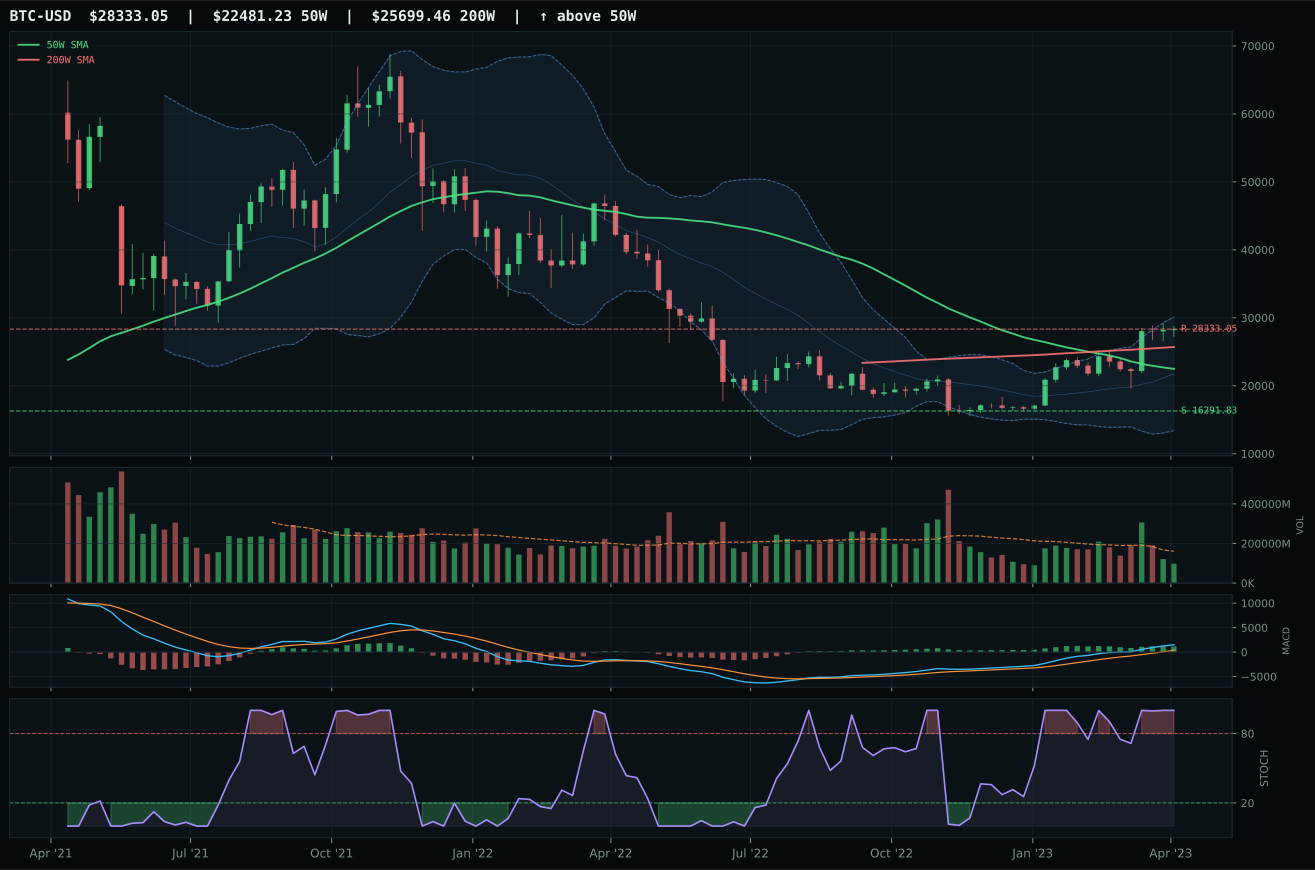
ValueBTC armed; waiting for decisive close above post-touch range resistance by 3%, breakout volume above 20W average
TrendBTC not confirmed
one or more available conditions failed
Category Rankings
| Rank | Category | Winner | Score | Alloc | 4W Ret | Peers (4W) |
|---|---|---|---|---|---|---|
| 1 | Precious Metals | GLD | 71.4 | 20% | +1.43% | GDX +4.5% · SLV +3.0% |
| 2 | Technology | IGV | 70.4 | 20% | -1.50% | XLK +2.3% · CIBR -3.6% |
| 3 | AI | SMH | 67.8 | 10% | -0.86% | BOTZ +4.0% · AIQ -0.4% |
| 4 | Utilities & Infrastructure | XLU | 50.0 | 10% | -0.65% | IGF +1.3% · PAVE +5.5% |
| 5 | Industrial Metals | COPX | 47.5 | 10% | +5.40% | PICK +0.7% · REMX +4.8% |
| 6 | Emerging Markets | IEMG | 43.8 | 10% | +0.86% | INDA +4.5% · ILF +6.7% |
| 7 | Defense & Aerospace | ITA | 37.4 | 10% | -1.72% | XAR -1.1% · ROKT +0.3% |
| 8 | Nuclear Energy | URA | 32.2 | 10% | +6.31% | URNM +6.0% · NLR +5.1% |
| 9 | Agriculture & Livestock | VEGI | 26.8 | 0% | +0.85% | MOO +1.0% · WEAT -3.6% |
| 10 | Traditional Energy | XLE | 16.6 | 0% | -4.57% | FCG -3.6% · XOP -6.2% |
Precious Metals — GLD
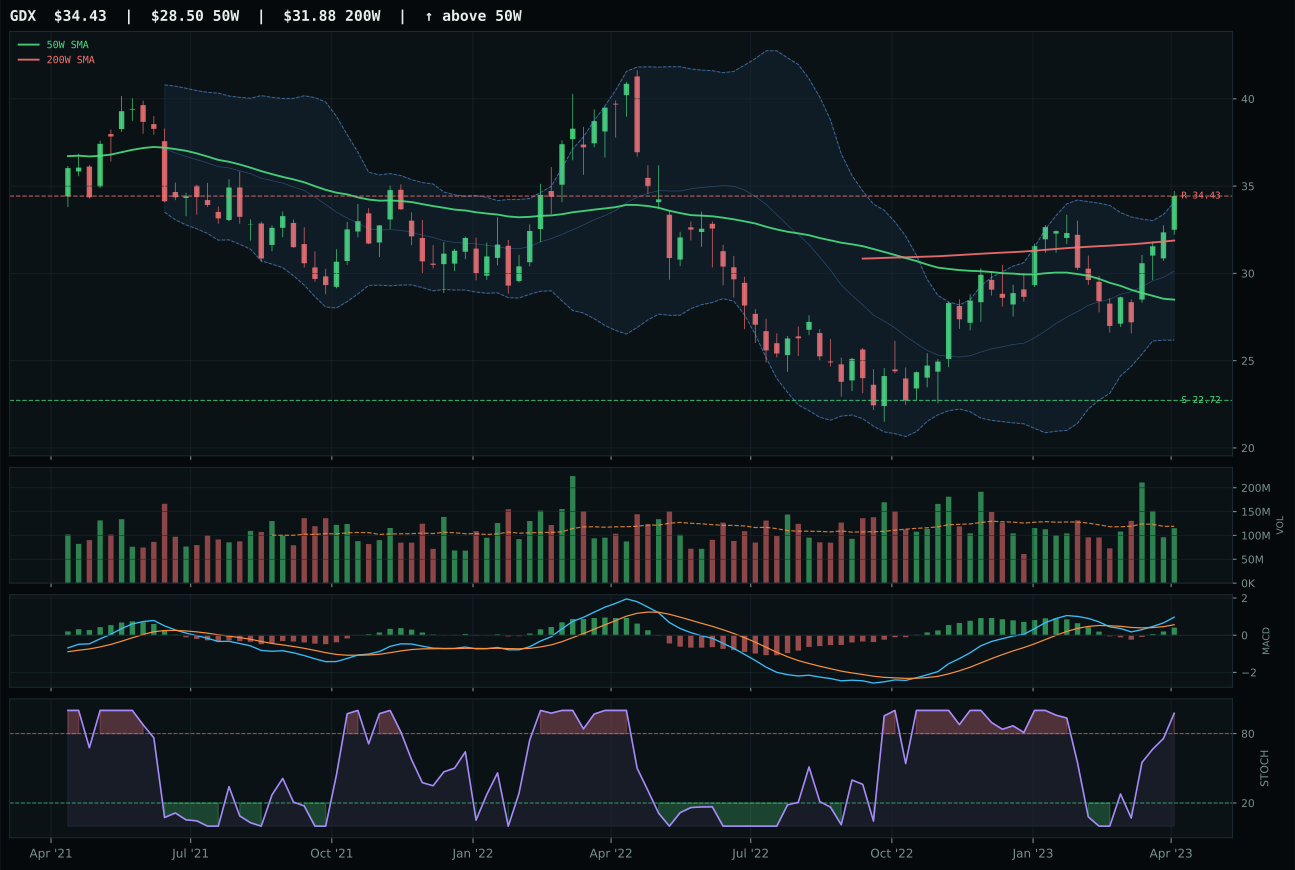
GDX has a vertical extension profile with 3.7% 13-week relative strength versus SPY.
A failed hold above support would weaken the setup.
Actionable but governed by invalidation levels.
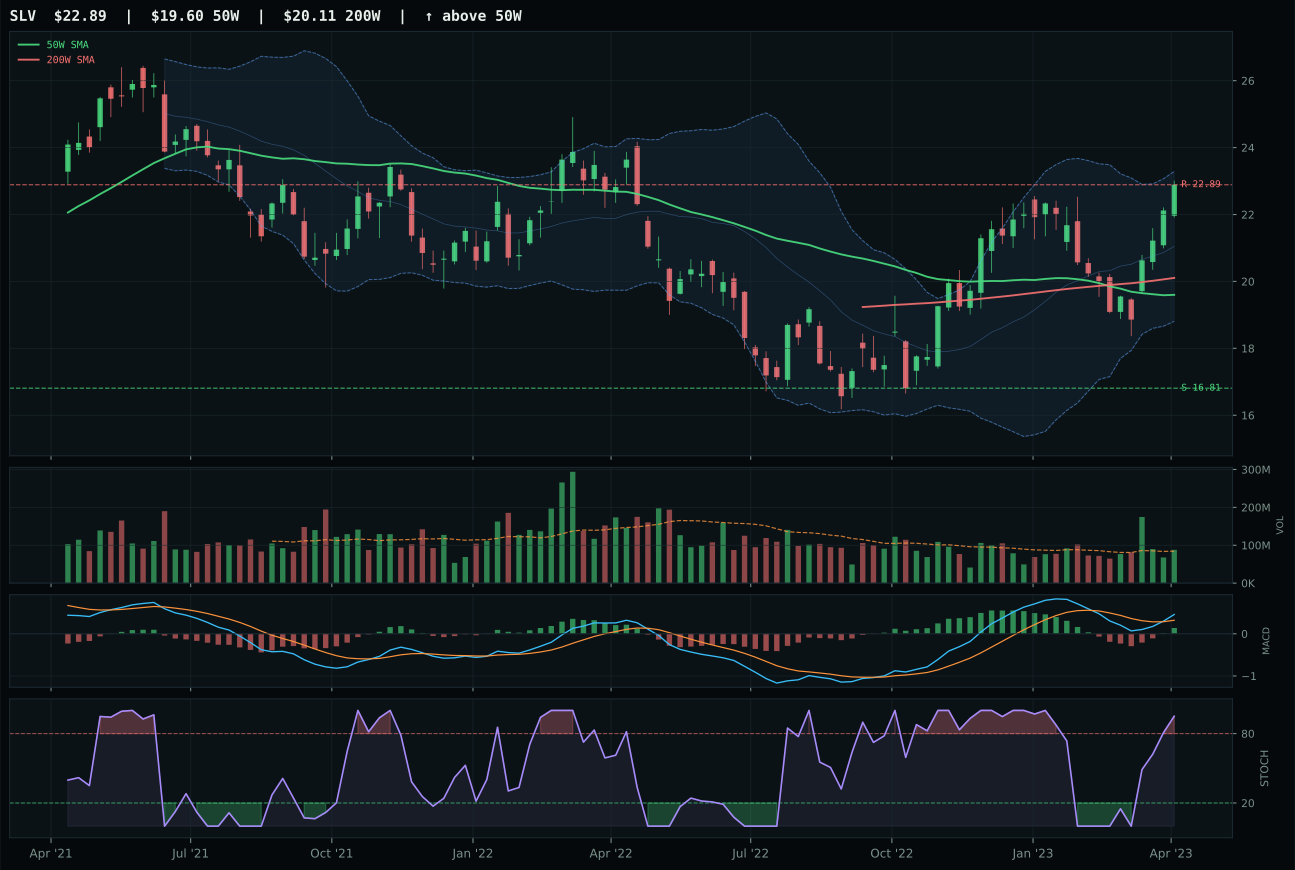
SLV has a vertical extension profile with -1.0% 13-week relative strength versus SPY.
A failed hold above support would weaken the setup.
Actionable but governed by invalidation levels.
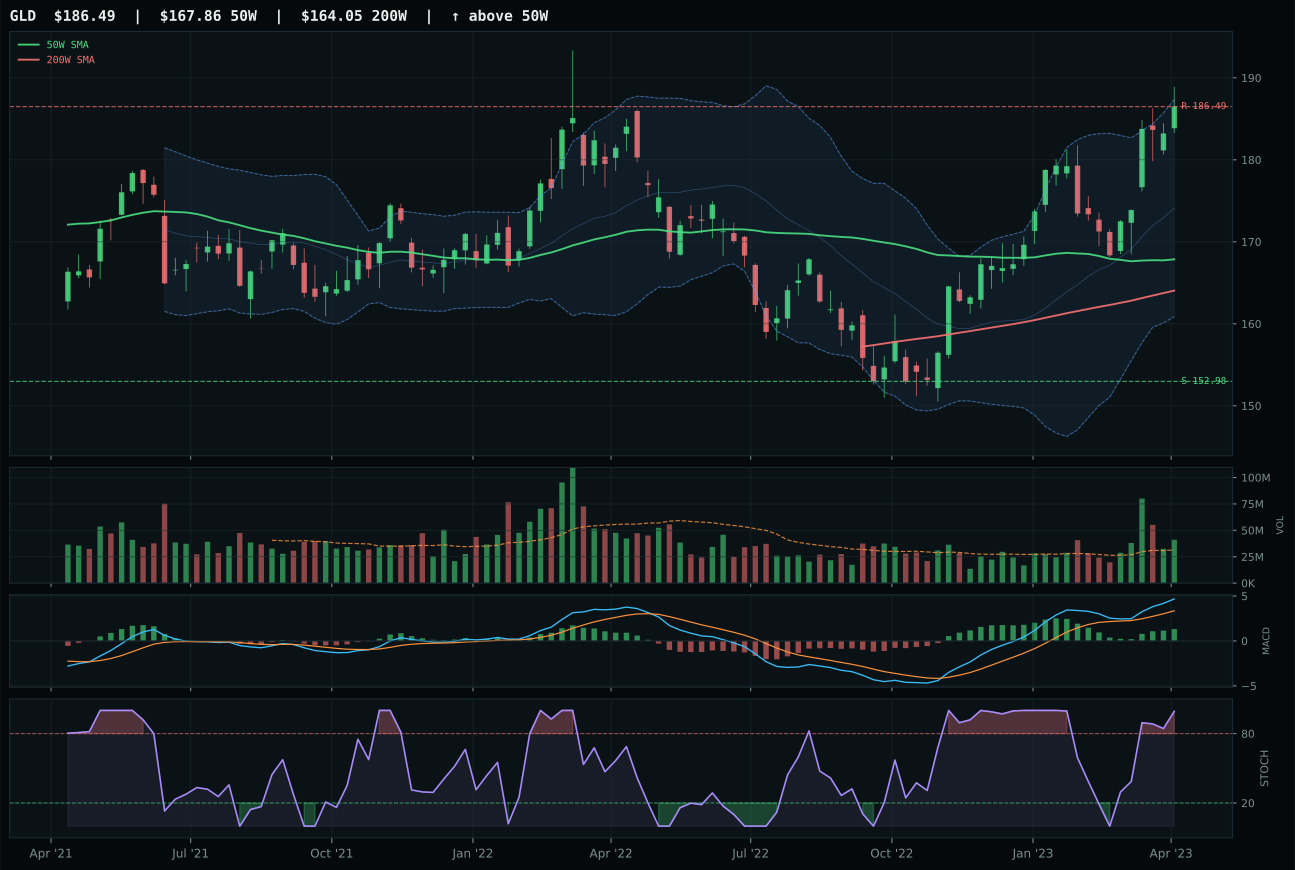
GLD has a neutral structure profile with 1.9% 13-week relative strength versus SPY.
A failed hold above support would weaken the setup.
Actionable but governed by invalidation levels.
GLD won decisively, earning its top-2 slot with a 10.4-point lead over runner-up GDX by delivering a 100.0/100 trend score with better execution than rivals stretched deeper into extension risk. Price sits 11.1% above the 50W—not overextended—with 1.9% RS versus SPY and a clean neutral structure that speaks to accumulation rather than speculation. Volume above-average at 1.31x confirms institutional participation, and MACD is bullish-and-improving rather than flattening as in GDX. The critical edge: GLD's timing score of 59.0/100 beats GDX's 45.0/100 because GLD remains within reach of support (21.9% downside to 152.98) while GDX is vertical at 20.8% from its 50W and will exhaust faster when momentum fades. Stochastic RSI overbought at 0.99 across both, but GLD's superior volume sponsorship means the overbought condition is being accumulated into, not rejected.
Precious Metals earns 10% as a co-leader of the portfolio alongside Technology, justified by a 71.4 final category score and active macro sponsorship unavailable to other categories. The portfolio recognizes that monetary hedge bid is the single strongest descriptor this week at 14 points added to category reasoning, making gold the cleanest expression of credit stress insurance and disinflation protection. Goldilocks regime adds 9 points, and disinflation pressure adds 6 more, building a compelling macro case for the 84.1/100 technical evidence that GLD provides. The tension is real: risk appetite positive actually subtracts 4 points because equities still working makes gold a defensive crowding trade, yet the 10% allocation reflects the judgment that credit stress risk is real enough to justify hedging despite the growth bias. Volume-price confirmation at 76.7/100 is strong enough to trust the accumulation story; watch for MACD to flatten or stochastic RSI to roll over as exit signals if credit stress suddenly disappears.
Technology — IGV
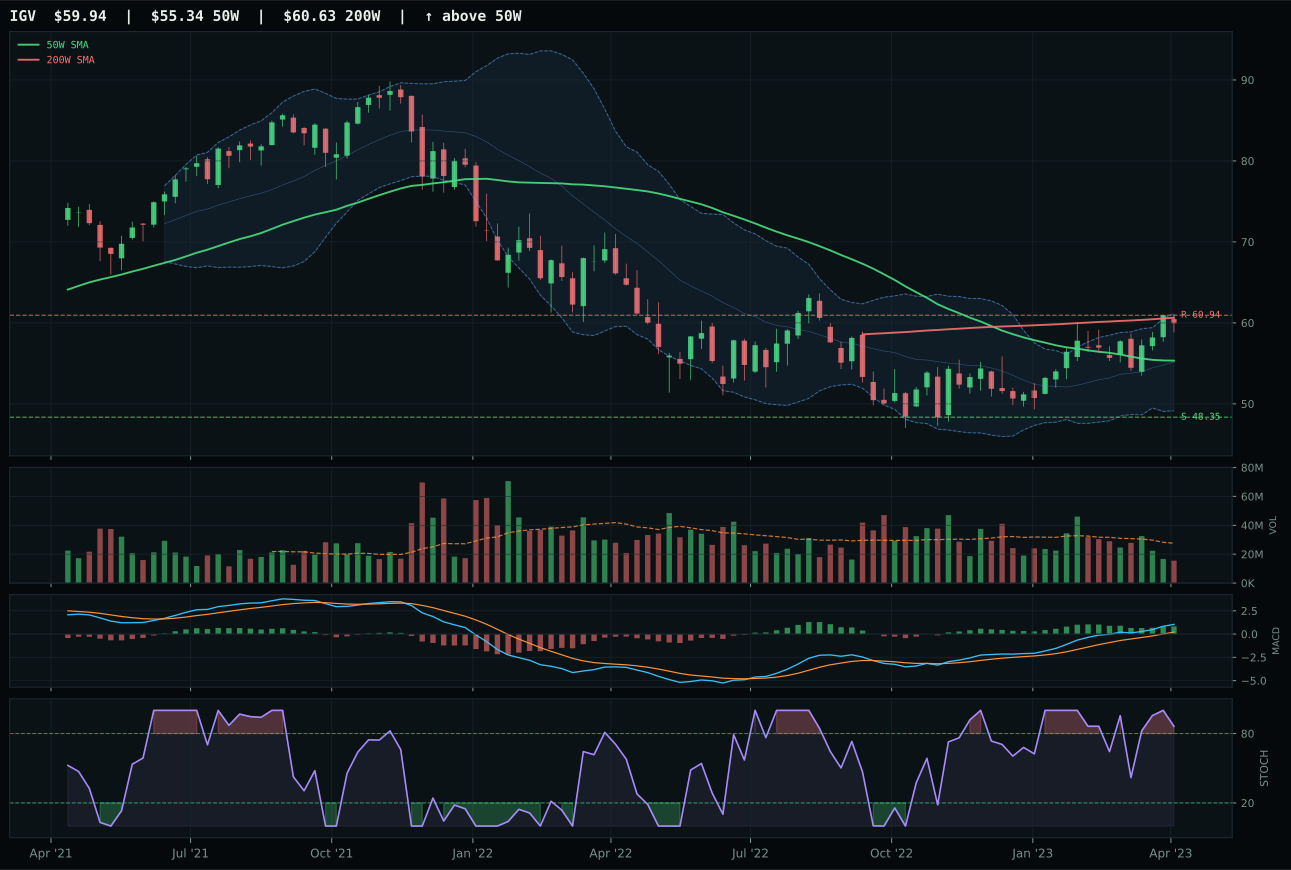
IGV has a neutral structure profile with 12.8% 13-week relative strength versus SPY.
A failed hold above support would weaken the setup.
Actionable but governed by invalidation levels.
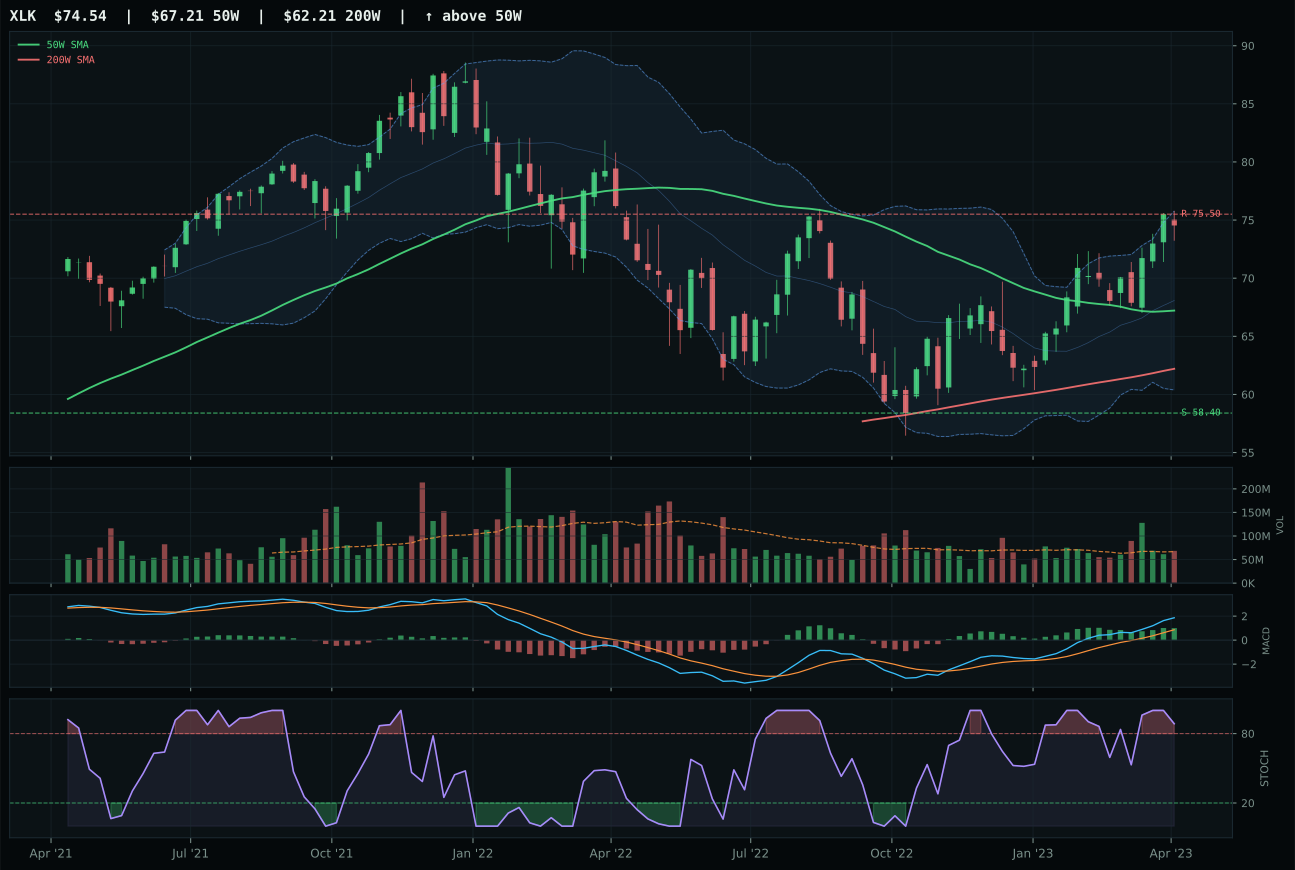
XLK has a neutral structure profile with 14.1% 13-week relative strength versus SPY.
A failed hold above support would weaken the setup.
Actionable but governed by invalidation levels.
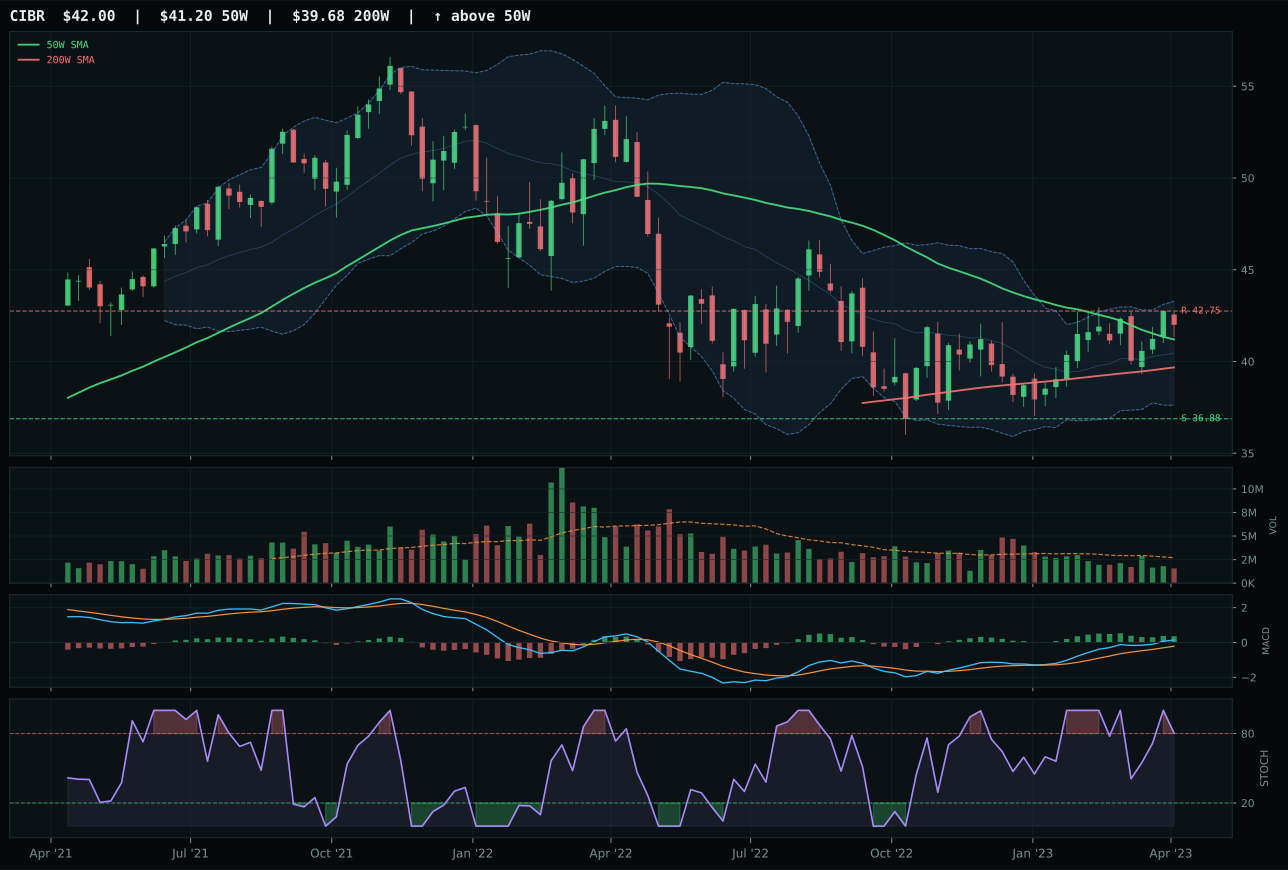
CIBR has a compression near 50W profile with 5.3% 13-week relative strength versus SPY.
A failed hold above support would weaken the setup.
Actionable but governed by invalidation levels.
IGV won the category because its setup presents a cleaner entry point than XLK despite trailing on absolute momentum. Price sits 8.3% above the 50W with MACD bullish and improving, but stochastic RSI is already overbought at 0.86—a red flag for extension risk that XLK shares at a worse level (rolling over from the same overbought zone). The decisive edge is timing: IGV's neutral structure and thin 0.56x volume participation keeps risk/reward tighter at 46.2/100 versus XLK's stretched 37.8/100, where every new buyer is paying up for already-priced momentum. Category-relative strength of 0.0% versus XLK's 1.3% edge means IGV is the category representative without relative baggage, making it the cleaner proxy for the tech thesis when both charts show deteriorating sponsor commitment into resistance.
Technology earns 10% allocation as a tier-2 position in a Goldilocks regime where growth can coexist with defensive rotations. This category ranks second only to Precious Metals among the 10 slots, securing its dual 10% slot based on a 70.4 composite score driven by 80.0/100 trend strength from price sitting above the 50W yet below the 200W. The macro environment supports it: risk appetite is active and AI growth sponsorship adds 6 points to the category reasoning layer, while disinflation pressure adds 5 more. What restrains Technology from top rank is credit stress actively penalizing it at -7 points, and the subtle truth that overbought stochastic RSI across all three ETFs signals late-cycle positioning. Allocation here reflects conviction that the setup is real but not bulletproof—hold the position but respect the overbought meter as a tactical exit signal if momentum fades.
AI — SMH
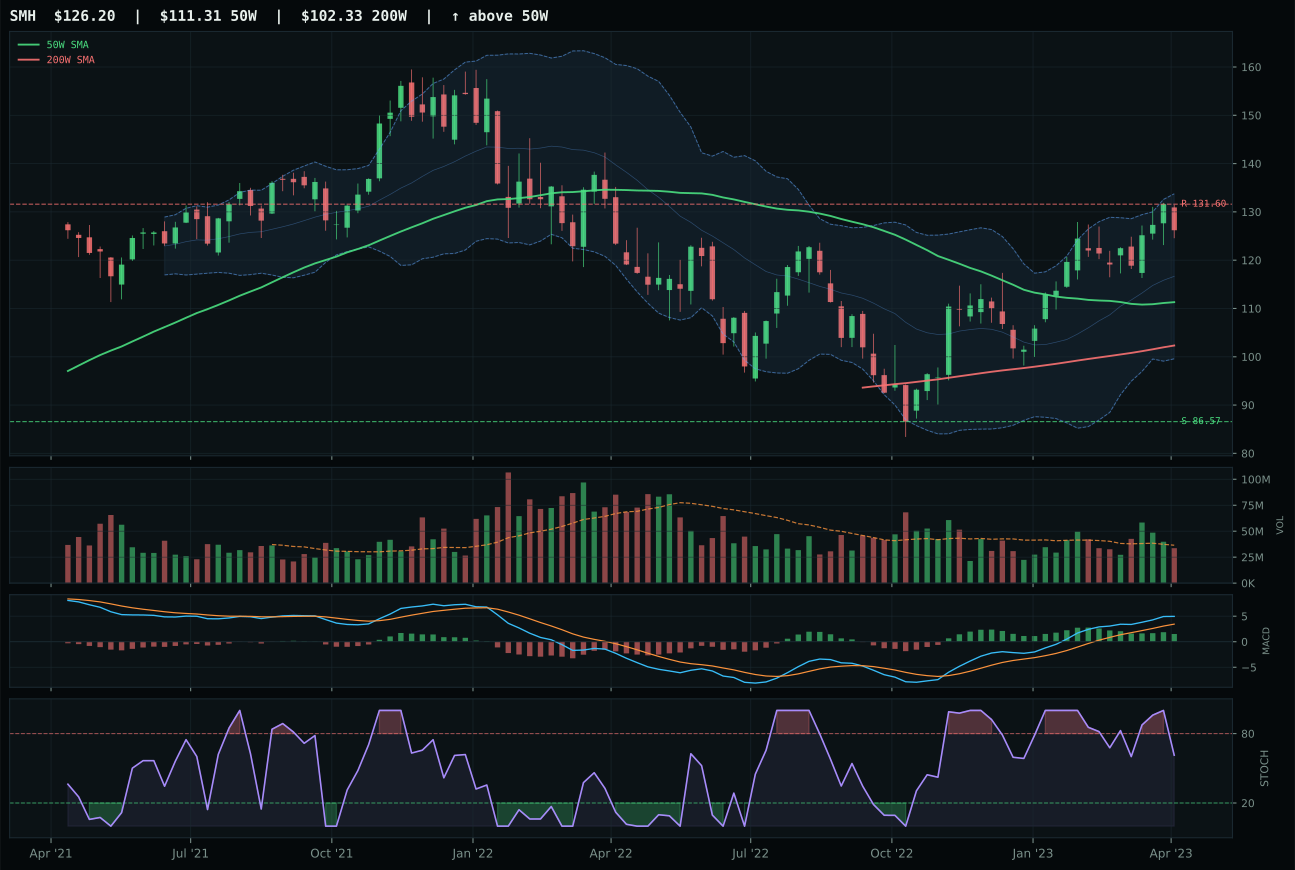
SMH has a neutral structure profile with 13.8% 13-week relative strength versus SPY.
A failed hold above support would weaken the setup.
Actionable but governed by invalidation levels.
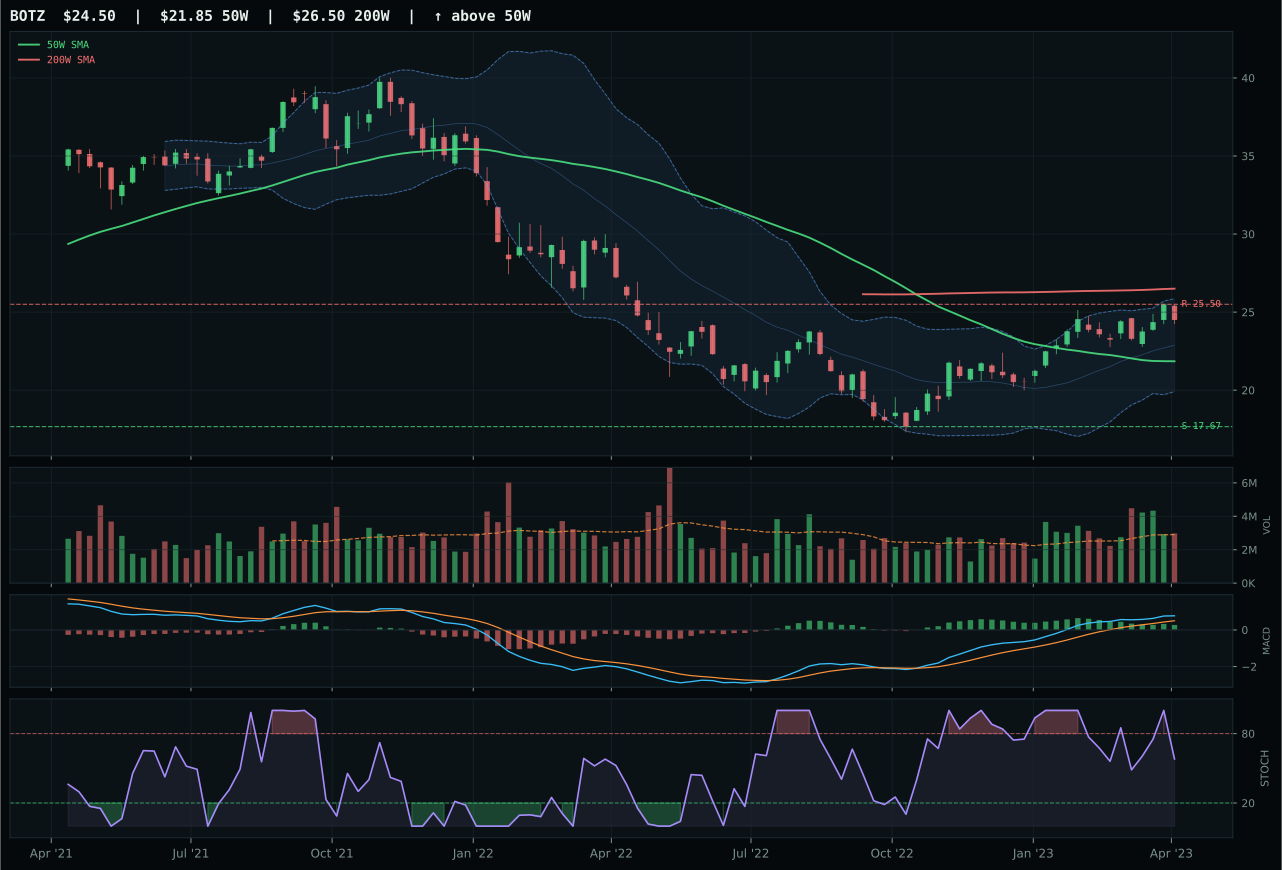
BOTZ has a neutral structure profile with 9.9% 13-week relative strength versus SPY.
A failed hold above support would weaken the setup.
Actionable but governed by invalidation levels.
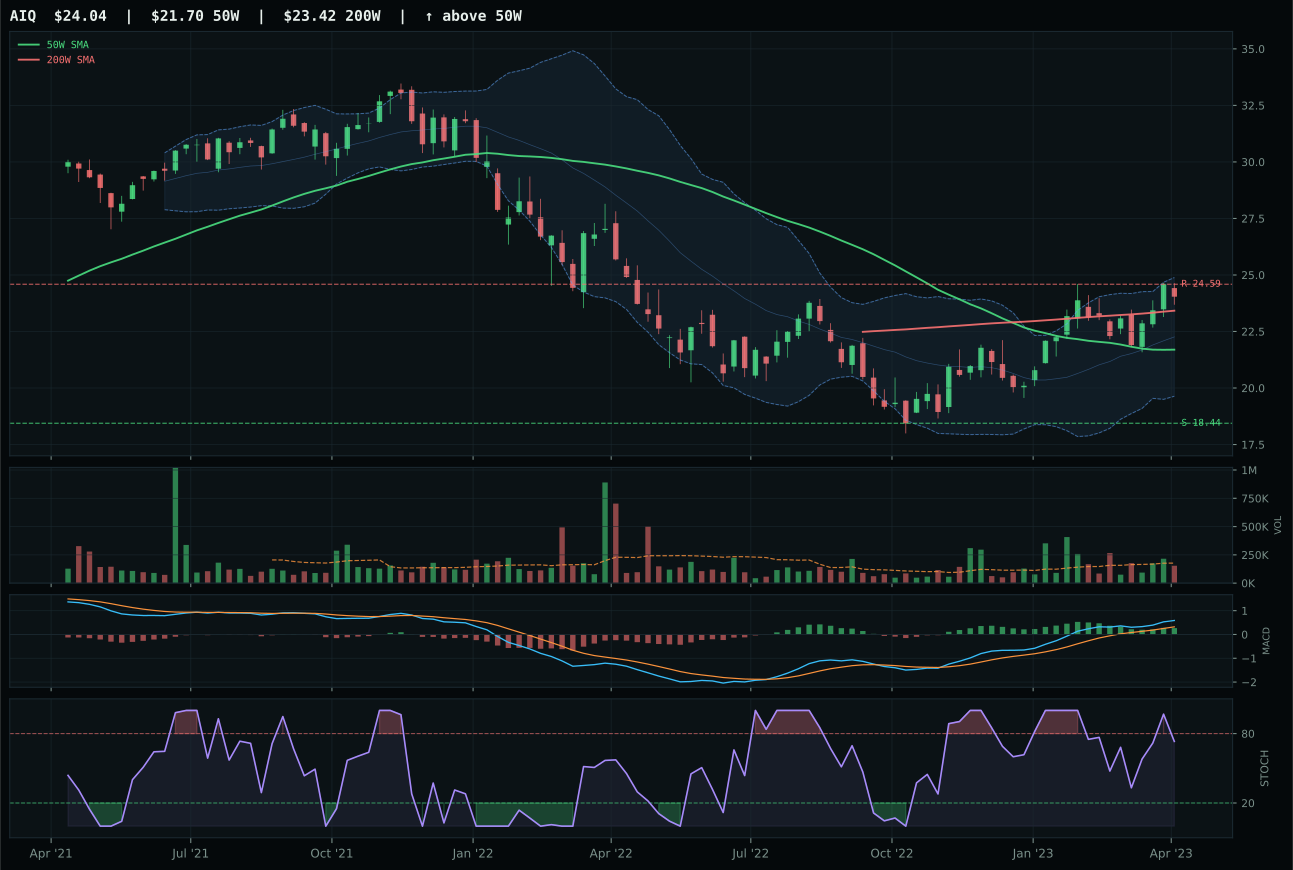
AIQ has a neutral structure profile with 10.2% 13-week relative strength versus SPY.
A failed hold above support would weaken the setup.
Tracked, but not top-2 eligible because: .
SMH wins because it combines trend perfection with category-relative strength superiority that BOTZ simply cannot match. Price above both the 50W and 200W with 0.2% slope yields a 100.0/100 trend score, but the technical edge widens on the 3.6% category-relative strength advantage: SMH leads the AI basket with 13.8% RS versus SPY while BOTZ lags at 9.9%. Volume confirmation at 0.92x neutral participation and MACD bullish-but-flattening suggest the move is being accumulated steadily rather than chased. BOTZ's stochastic RSI is rolling over from the same overbought zone, warning that robotics momentum is fading faster than semiconductor momentum, making SMH the natural representative of sustained AI compute demand.
AI receives 5% allocation as a tier-2 category despite strong technical merits (67.8 final score) because two higher-ranked categories—Technology at 70.4 and Precious Metals at 71.4—claimed the top two slots. SMH's 100.0/100 trend score and 81.0/100 volume-price confirmation reflect authentic structural strength, yet the category's macro tailwind is narrower than peers: AI growth sponsorship adds a robust 14 points, but credit stress carves away 8. The allocation holds because Goldilocks regime supports risk appetite (10 points) and the macro descriptor set favors semiconductors as a clean compute play. Conviction here is medium—the setup is sound but conditional on credit stress remaining contained and AI growth sponsorship staying active; any deterioration in either could push this category into exclusion territory.
Utilities & Infrastructure — XLU
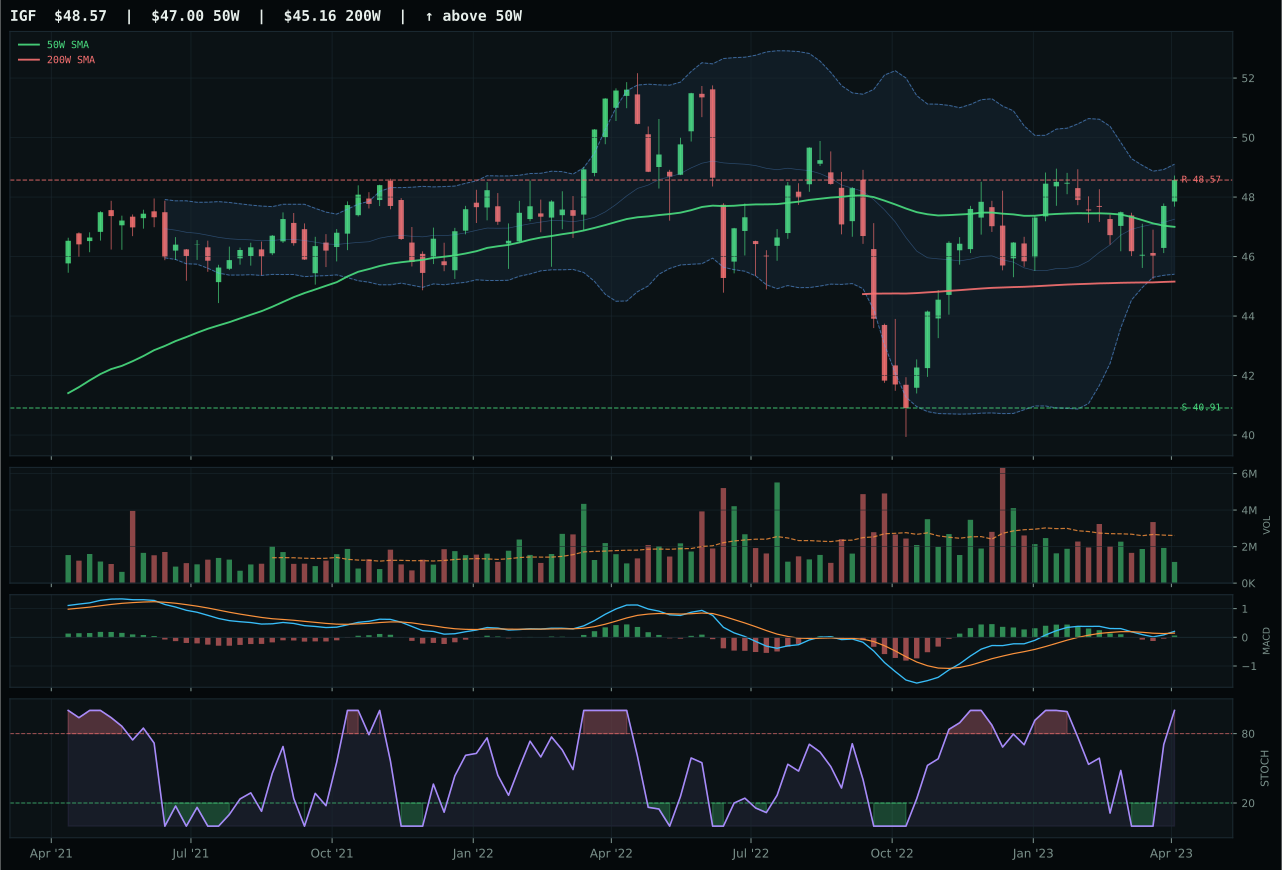
IGF has a neutral structure profile with -2.8% 13-week relative strength versus SPY.
A failed hold above support would weaken the setup.
Actionable but governed by invalidation levels.
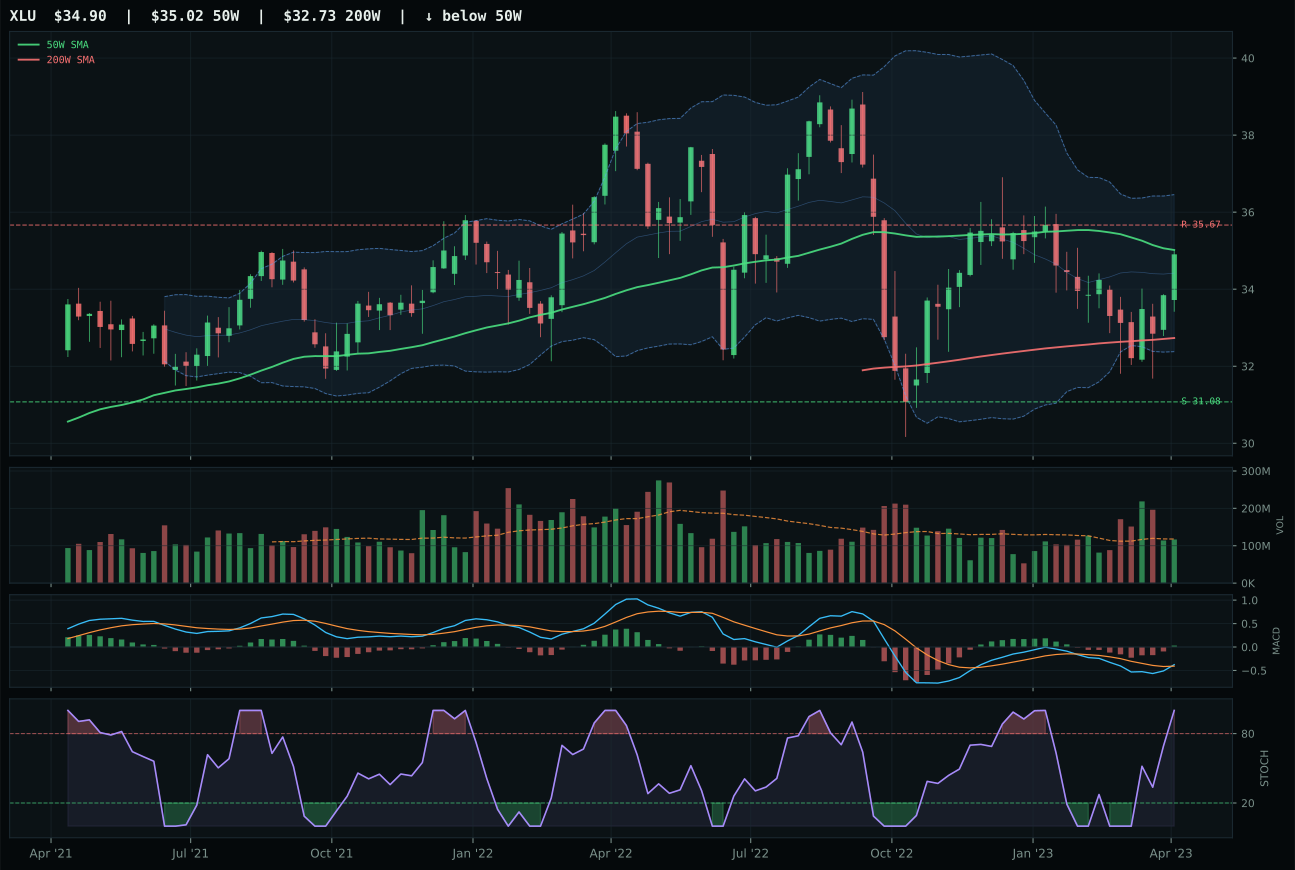
XLU has a compression near 50W profile with -7.1% 13-week relative strength versus SPY.
A failed hold above support would weaken the setup.
Actionable but governed by invalidation levels.
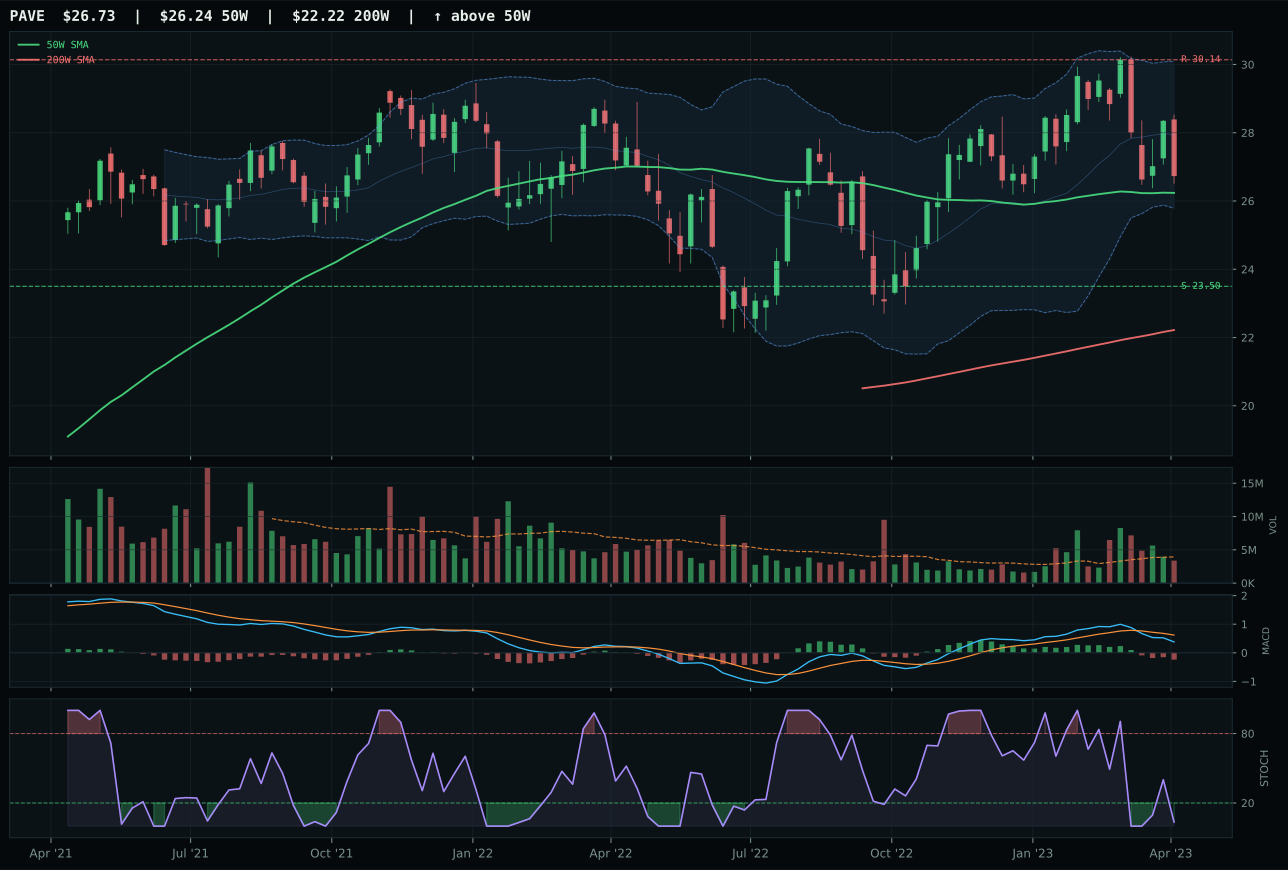
PAVE has a compression near 50W profile with -7.5% 13-week relative strength versus SPY.
A failed hold above support would weaken the setup.
Actionable but governed by invalidation levels.
XLU won the closest category race (IGF lead by just 0.2 basis points in reasoned proof order) by delivering a 100.0/100 timing score that IGF could not match at 90.0/100, despite both having nearly identical trend scores in the mid-60s. Price sits -0.3% from the 50W with compression near 50W structure and MACD bullish-and-improving, giving XLU the perfect compression-breakout setup. Stochastic RSI overbought at 1.00 in both, but XLU's volume at 0.99x neutral participation beats IGF's thin 0.57x thin participation—indicating XLU accumulation is real institutional participation, not thin-book noise. Risk/reward at 56.1/100 edges IGF's 52.7/100, and cleanliness of 33.3 matches IGF's relative weakness but the neutral volume makes up the structural gap. This is a tight call where 2 basis points of technical precision separated winner from runner-up.
Utilities & Infrastructure holds 5% as a tier-2 allocation in a Goldilocks regime where the category earns a 50.0 composite score—respectable enough to hold a tier-2 slot but not compelling enough to challenge for top-2. XLU's 67.7/100 technical evidence is driven by near-perfect timing (100.0/100) rather than momentum strength; momentum confirmation sits at 63.5/100 reflecting the -1.7% 13W return and modest 8.4% 4W bounce. Macro fit of 53.0/100 is neutral and defensive: disinflation pressure helps at 6 points but risk appetite positive hurts at -3 points, suggesting utilities are crowding as a de-risk trade rather than a growth contribution. Category macro fit is 58.0/100, supporting allocation by default rather than conviction. The 5% exists as a defensive satellite position—hold it if credit stress intensifies or risk appetite swings negative, but it's not a core thematic bet. Upgrade to top-2 would require momentum confirmation to jump above 75 and technical evidence to exceed 75; downgrade to exclusion would follow if MACD rolls over or 4W returns turn negative.
Industrial Metals — COPX
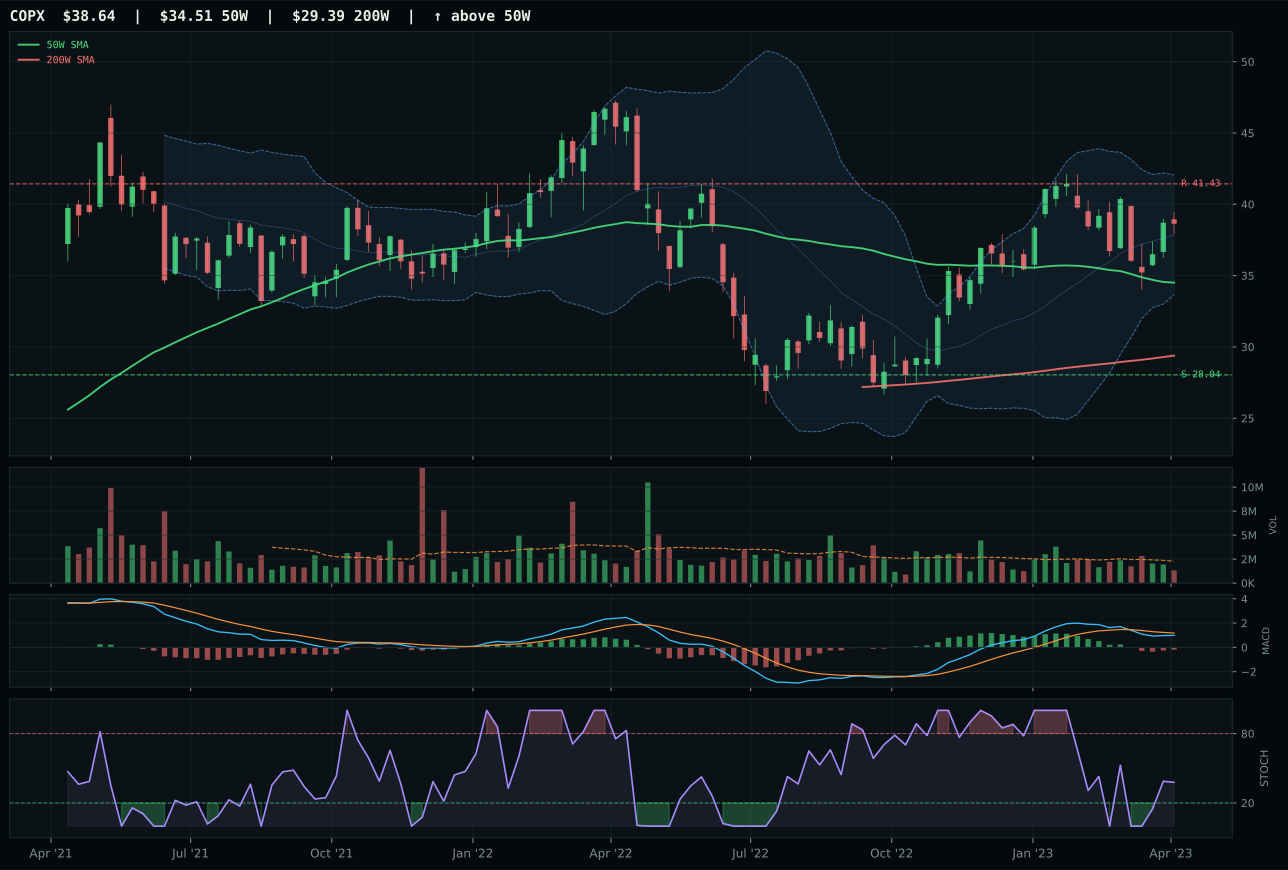
COPX has a neutral structure profile with -4.7% 13-week relative strength versus SPY.
A failed hold above support would weaken the setup.
Actionable but governed by invalidation levels.
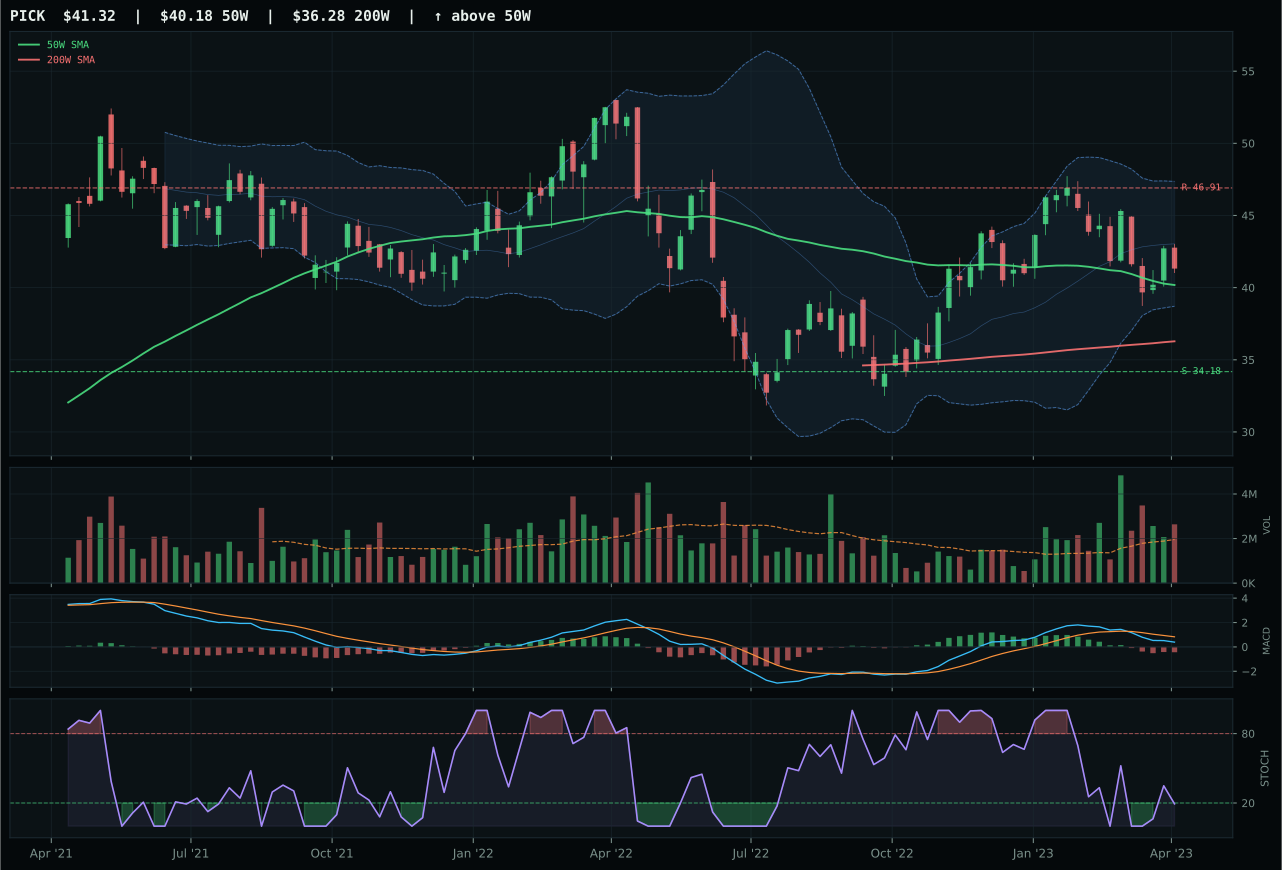
PICK has a compression near 50W profile with -10.8% 13-week relative strength versus SPY.
A failed hold above support would weaken the setup.
Actionable but governed by invalidation levels.
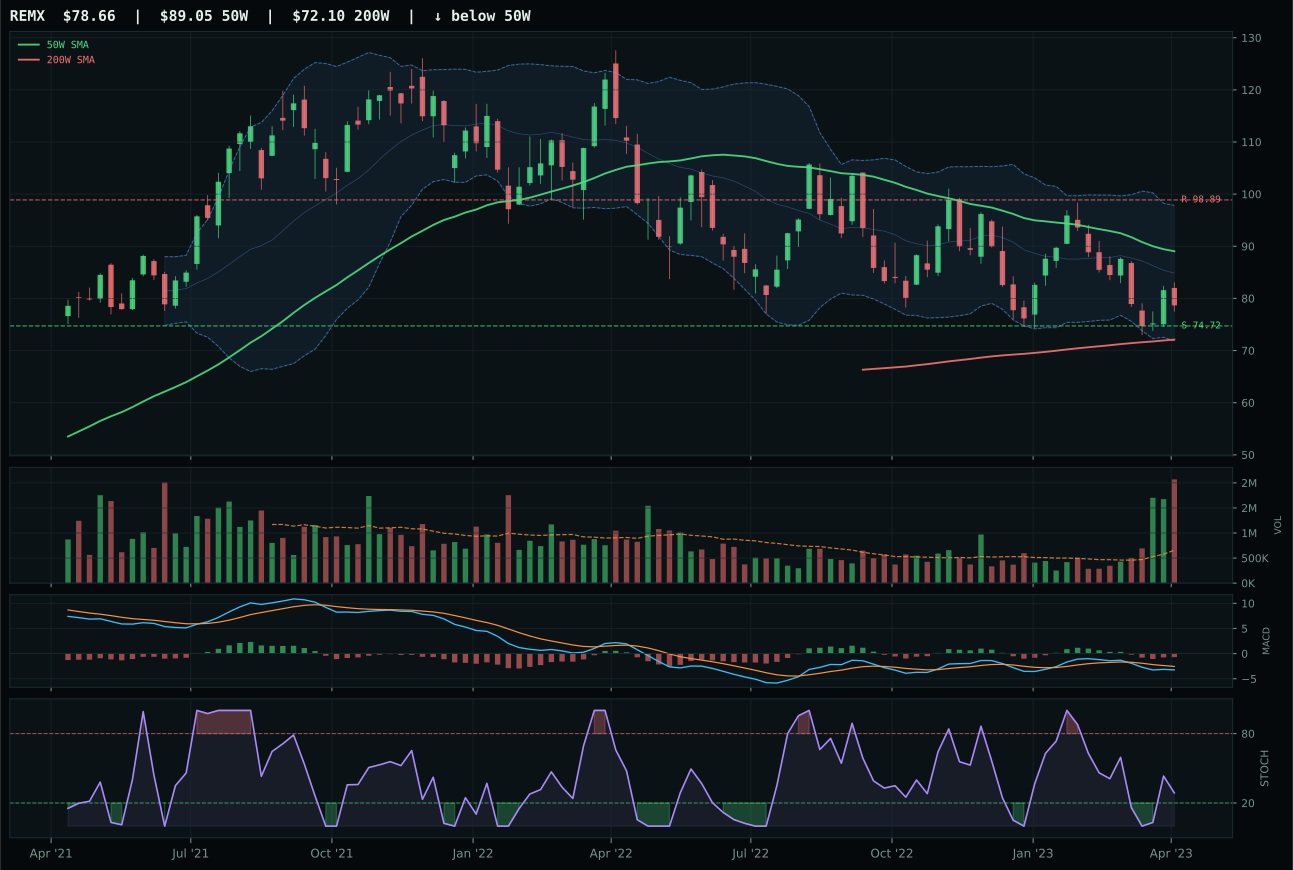
REMX has a neutral structure profile with -10.2% 13-week relative strength versus SPY.
A failed hold above support would weaken the setup.
Actionable but governed by invalidation levels.
COPX won a close race over PICK (just 1.1-point gap) because category-relative strength of 5.5% versus PICK's -0.6% and stochastic RSI rising mid-zone at 0.38 present a cleaner entry point than PICK's oversold-turn-up setup at 0.15. Both charts are in repair mode—price below the 50W, MACD bearish/weakening, volume thin at 0.58x and above-average respectively—but COPX's 12.0% distance to the 50W provides more breathing room than PICK's compression near 50W. Timing scores both high (85.0 vs 100.0) but COPX's rising stochastic RSI means the squeeze is still potentially coiling, whereas PICK's oversold turn-up is a binary all-or-nothing trigger. Risk/reward slightly favors PICK at 63.0/100 versus 56.2/100, yet COPX's category-relative strength edge and neutral-structure setup make it the cleaner accumulation candidate when volume is thin across the board.
Industrial Metals holds 5% as a tier-2 allocation despite a 47.5 composite score because metals scarcity and commodity breadth descriptors provide active macro tailwind (12 and 7 points respectively) that rescues a weak technical setup. COPX's 39.3/100 technical evidence is fragile—trend at 64.9/100, momentum confirmation at 44.9/100—but macro fit of 69.0/100 creates a positive spread. The category reasoning layer weights macro at 38%, enough to keep Industrial Metals in tier-2 allocation ahead of categories with zero macro support. Goldilocks regime helps (6 points) and real asset sponsorship is active (6 points), building a case that scarcity-driven metals can hold value even when risk appetite is positive. Conviction is conditional: this slot exists because the macro descriptors are active, not because the chart is strong. If metals scarcity descriptor flips to inactive or commodity breadth turns negative, Industrial Metals drops to exclusion. Hold it tight but stay ready to cut if macro support evaporates.
Emerging Markets — IEMG
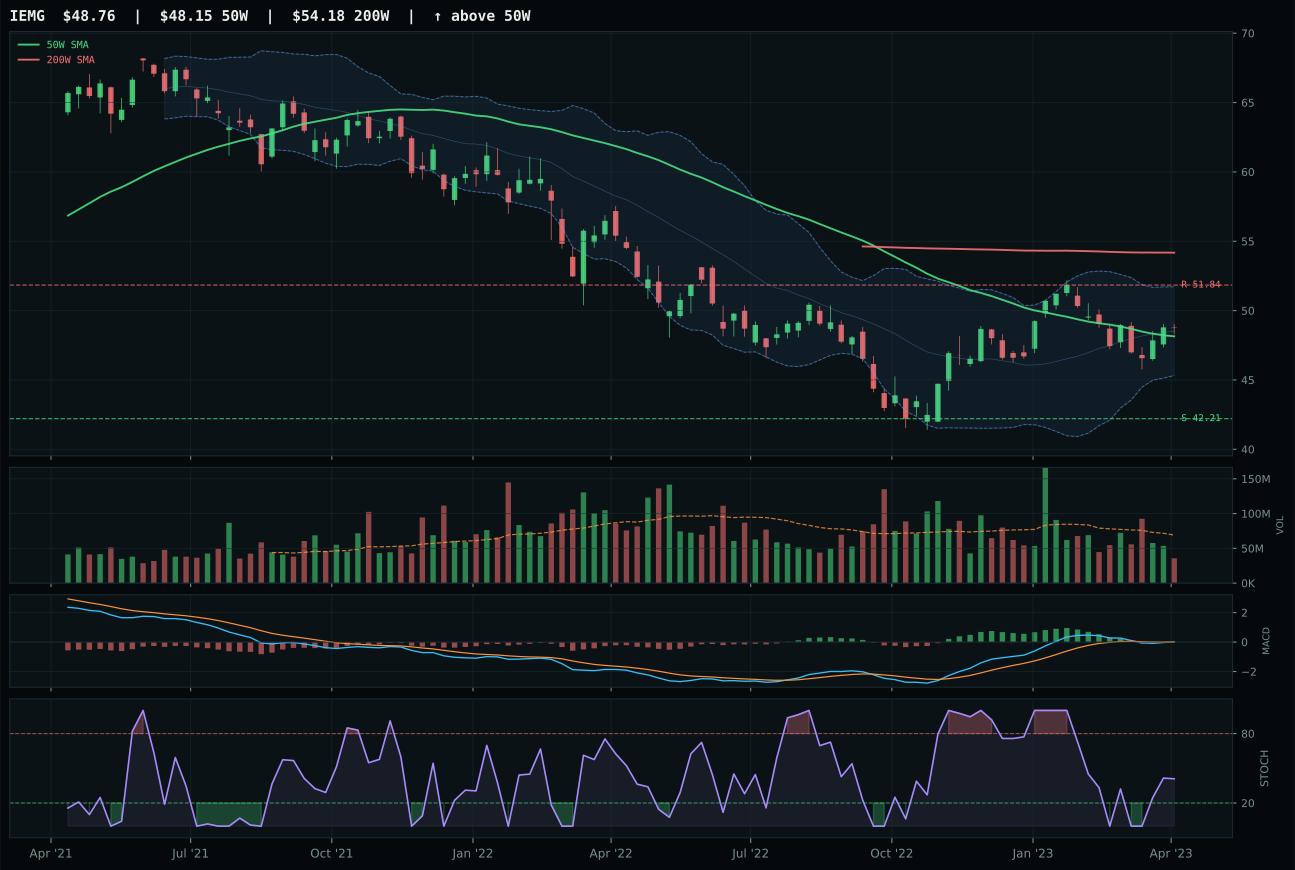
IEMG has a compression near 50W profile with -6.4% 13-week relative strength versus SPY.
A failed hold above support would weaken the setup.
Actionable but governed by invalidation levels.
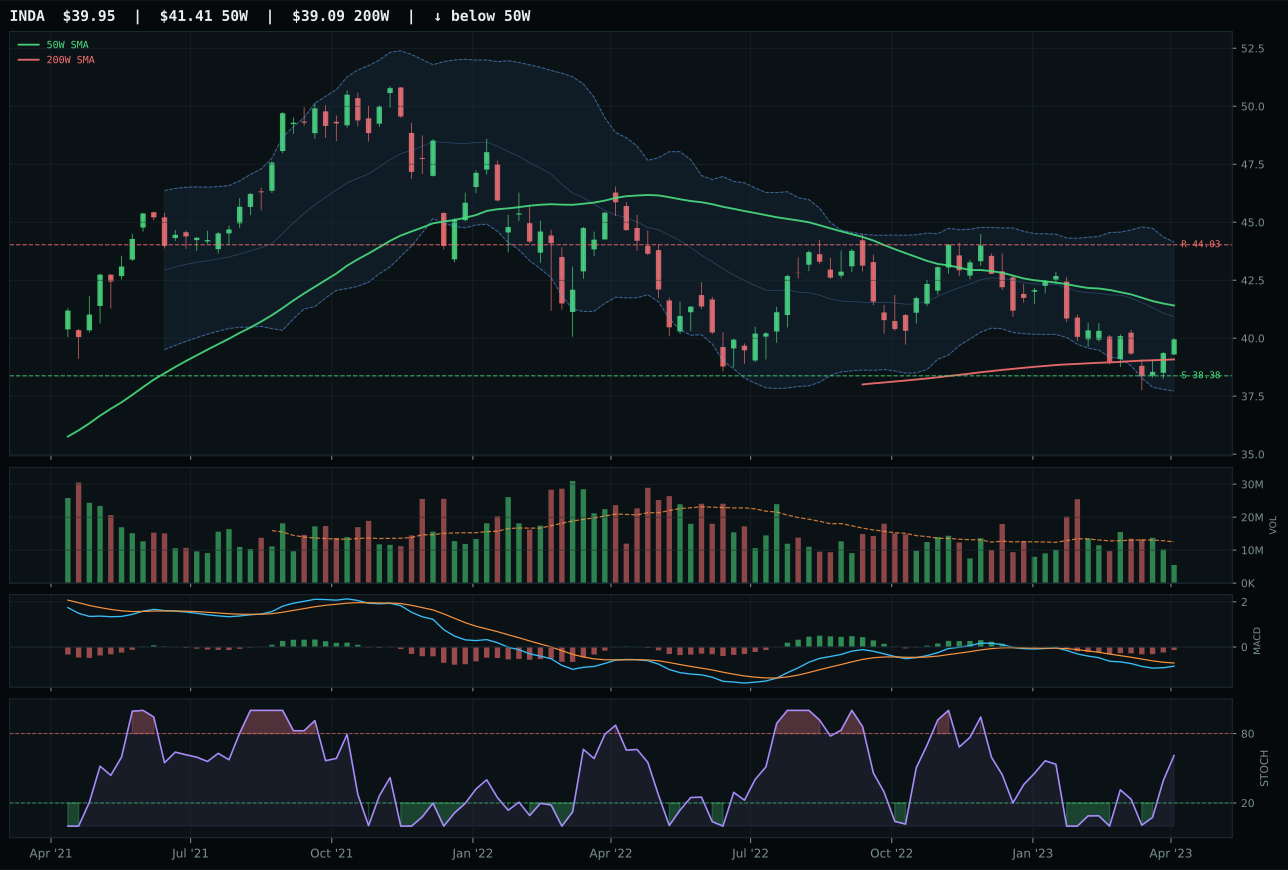
INDA has a pullback into support profile with -10.5% 13-week relative strength versus SPY.
A failed hold above support would weaken the setup.
Actionable but governed by invalidation levels.
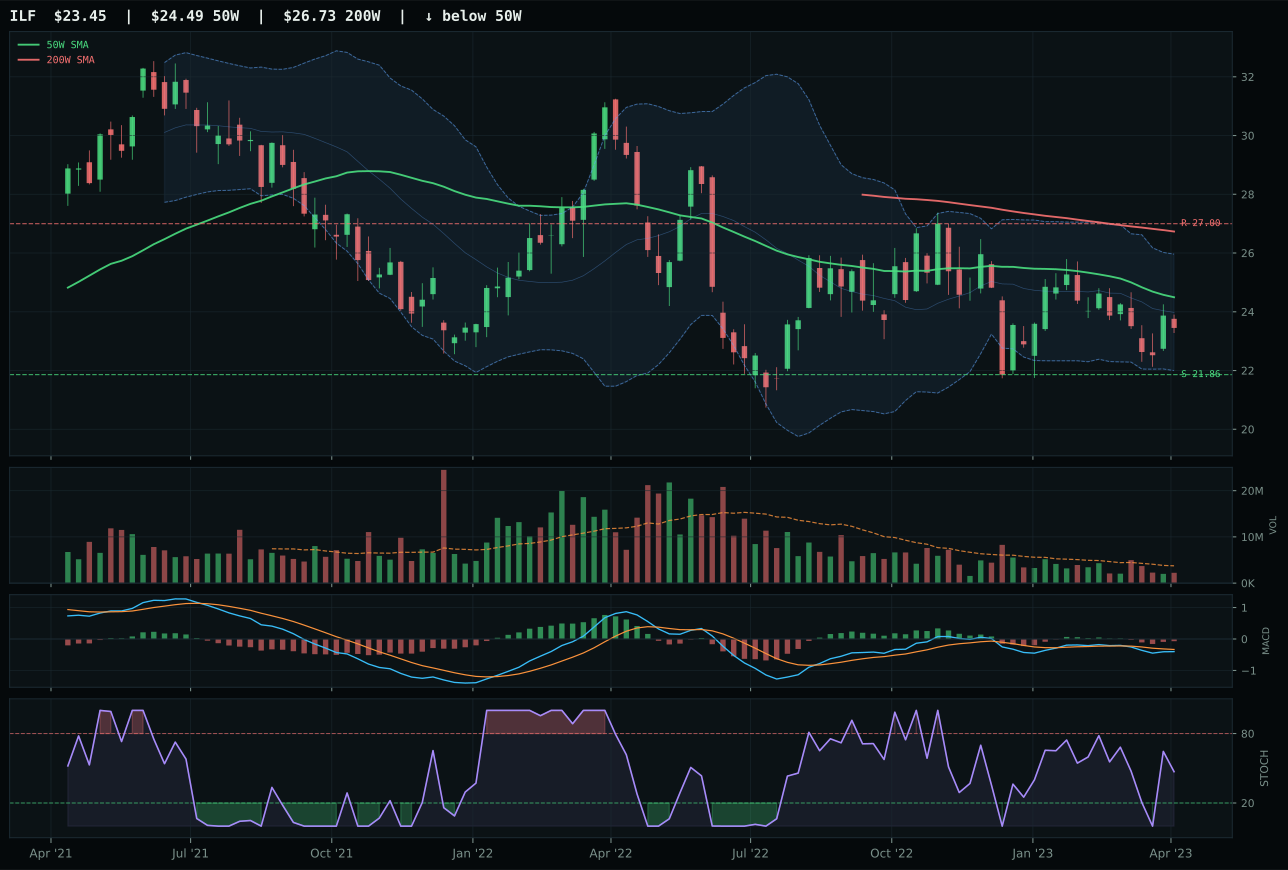
ILF has a neutral structure profile with -6.0% 13-week relative strength versus SPY.
Extension and support failure are the main tactical risks.
Tracked, but not top-2 eligible because: structurally broken.
IEMG won by a decisive 7.5 points over INDA because compression near the 50W combined with bullish-but-flattening MACD presents a cleaner expansion trigger than INDA's pullback-into-support setup with bearish-but-improving MACD. Price is just 1.3% from the 50W, and IEMG's timing score of 100.0/100 reflects that proximity perfectly—the chart is coiled and ready to either confirm buyers or break support definitively. Category-relative strength of 0.0% versus INDA's -4.1% deficit means IEMG leads the EM basket without relative baggage. Volume at 0.52x is thin across both, but IEMG's structure cleanliness of 68.2/100 beats INDA's pullback structure at an implied lower cleanliness. Stochastic RSI rising mid-zone at 0.41 in both, but IEMG's MACD is the superior technical evidence: bullish-but-flattening suggests institutional accumulation, not retail bounce.
Emerging Markets holds 5% as a tier-2 allocation despite a 43.8 composite score because EM liquidity support descriptor is unusually active this week at 14 points, the single largest macro boost in the entire category set. IEMG's compression near 50W with perfect 100.0/100 timing provides a structured entry point for the macro thesis, making 58.2/100 technical evidence acceptable when paired with 60.0/100 macro fit. Risk appetite positive adds 6 points and Goldilocks regime adds 8 points, building a coherent case that EM can participate in risk-on growth without the credit stress concerns that plague other categories. Conviction is moderate: this slot exists because EM liquidity support is active and timing is clean, not because technical evidence is strong (58.2/100 trails most allocated categories). Watch for EM liquidity support to remain active and stochastic RSI to confirm above 0.60 before escalating; if EM liquidity support flips to inactive or credit stress becomes acute, this category drops to 0% on the next cycle.
Defense & Aerospace — ITA
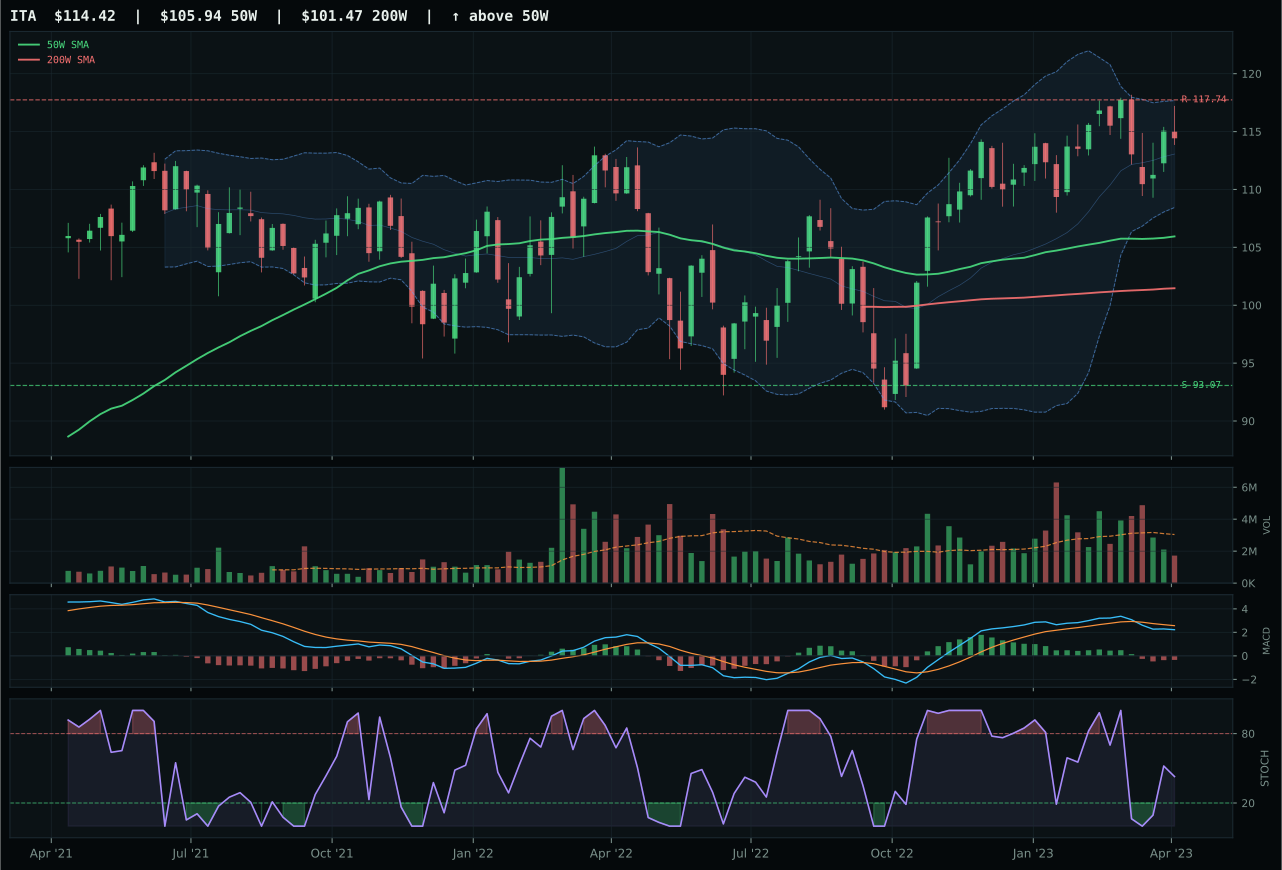
ITA has a neutral structure profile with -4.8% 13-week relative strength versus SPY.
A failed hold above support would weaken the setup.
Actionable but governed by invalidation levels.
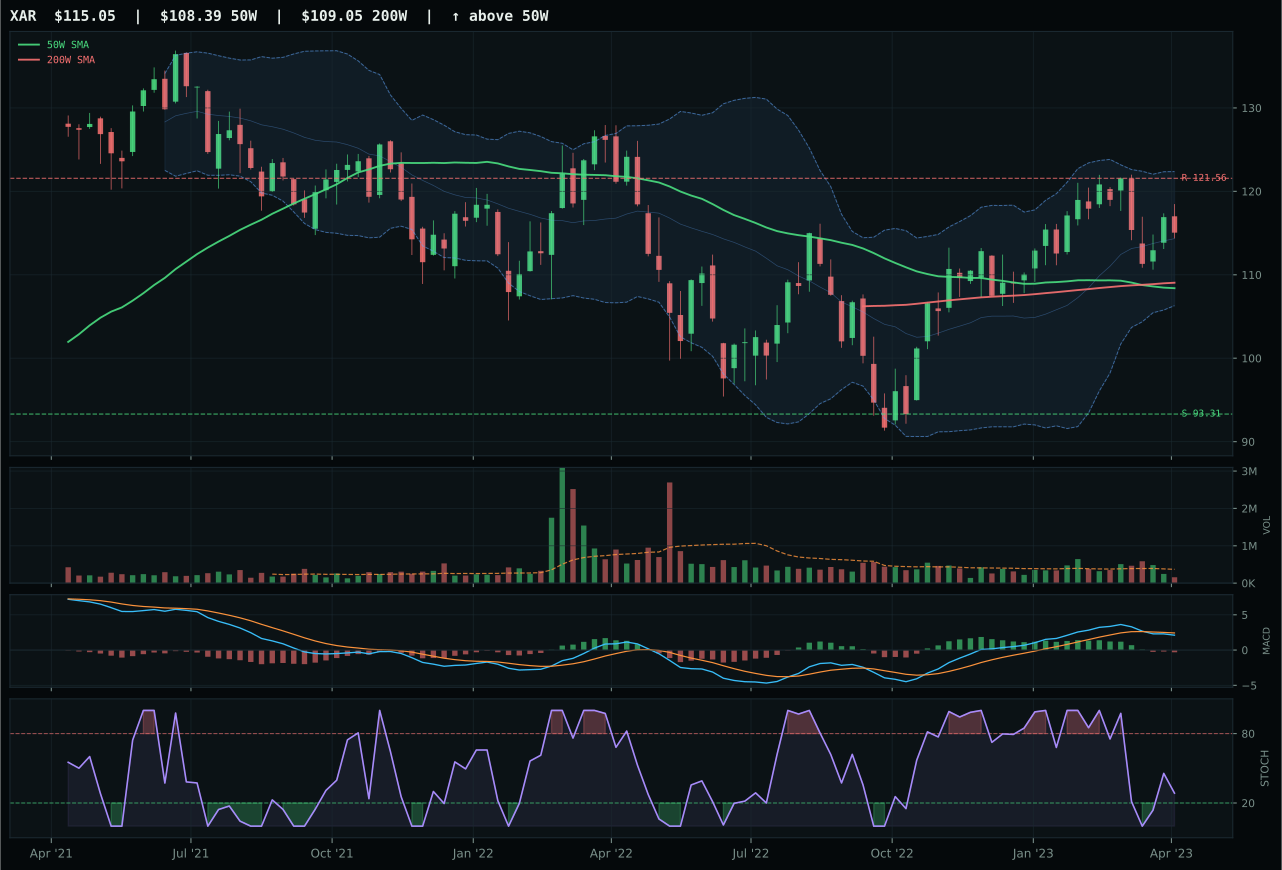
XAR has a neutral structure profile with -3.5% 13-week relative strength versus SPY.
A failed hold above support would weaken the setup.
Actionable but governed by invalidation levels.
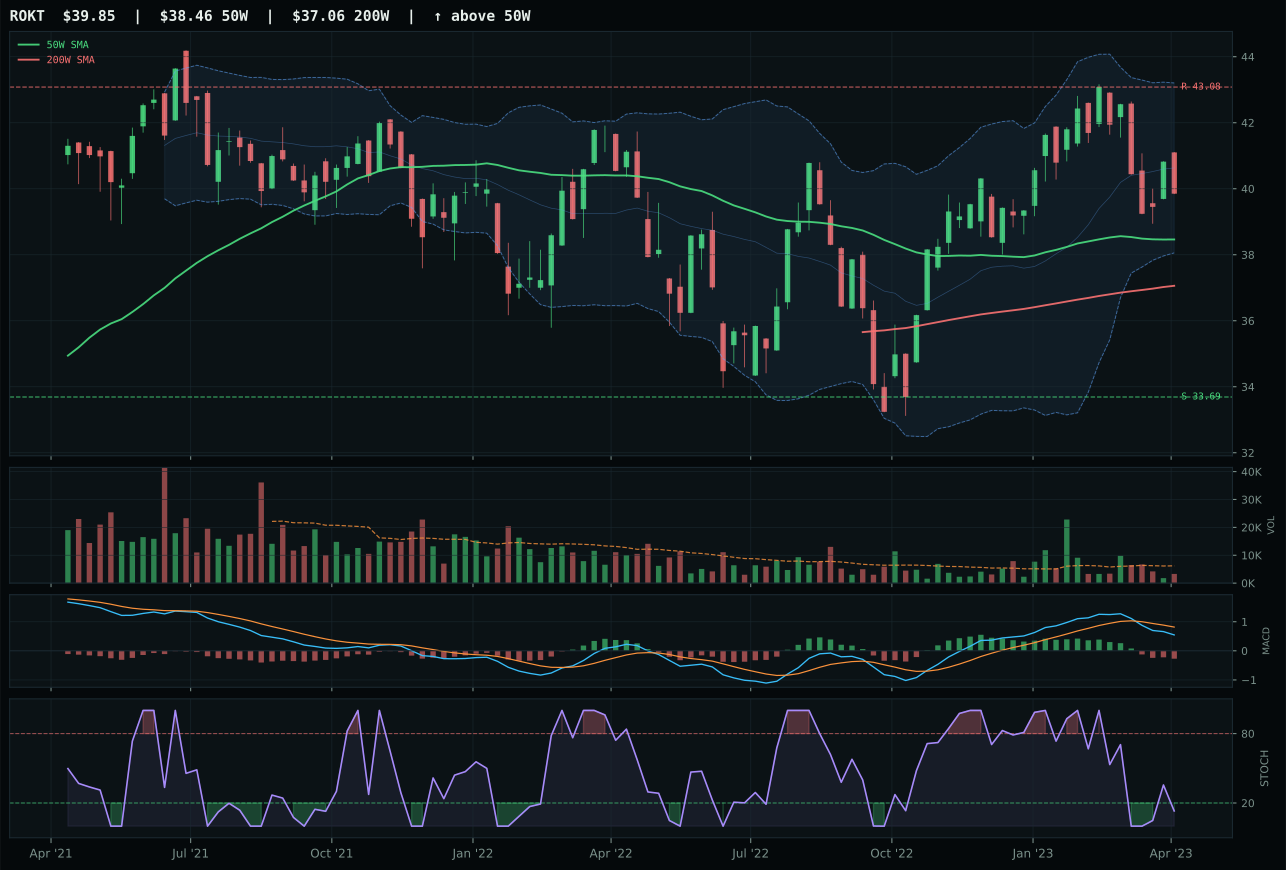
ROKT has a neutral structure profile with -7.2% 13-week relative strength versus SPY.
A failed hold above support would weaken the setup.
Tracked, but not top-2 eligible because: .
ITA wins by the narrowest margin—just 2.0 points over XAR—in a category where everyone's weak momentum and negative returns make relative cleanliness the only real differentiator. Price sits 8.0% above the 50W and positive slope at 0.1% gives ITA a 74.8/100 trend score versus XAR's 67.0, but the real story is momentum collapse: 13W return of 0.6% and MACD bearish/weakening mean this chart is barely alive. Structure cleanliness of 70.5/100 edges XAR's 69.8/100, enough to claim the representative slot. Volume at 0.57x thin participation and stochastic RSI rising mid-zone suggest accumulation is happening, but this is a category with no sponsor conviction—risk/reward at 47.2/100 means support is close (22.9% downside) and upside resistance is tight (-2.8%), trapping traders in a no-momentum box.
Defense & Aerospace holds 5% as a tier-2 position in a Goldilocks regime where the category itself earned only a 37.4 composite score—the weakest of all allocated categories. This rank reflects the brutal technical reality: ITA's momentum confirmation scored just 25.6/100, volume-price confirmation 38.7/100, and 13W return of 0.6% signals the sector is stalled. Macro fit does not rescue it: no active descriptor strongly favors defense, and credit stress is neutral at only 2 points. The allocation exists because tier-2 slots exist and the reasoner must populate them; Defense & Aerospace is here by elimination, not conviction. Watch for MACD to stabilize above its current bearish/weakening state or for risk appetite to swing negative (flipping credit stress to positive +2) before upgrading this to a hold-or-sell decision. Until then, 5% is a placeholder.
Nuclear Energy — URA
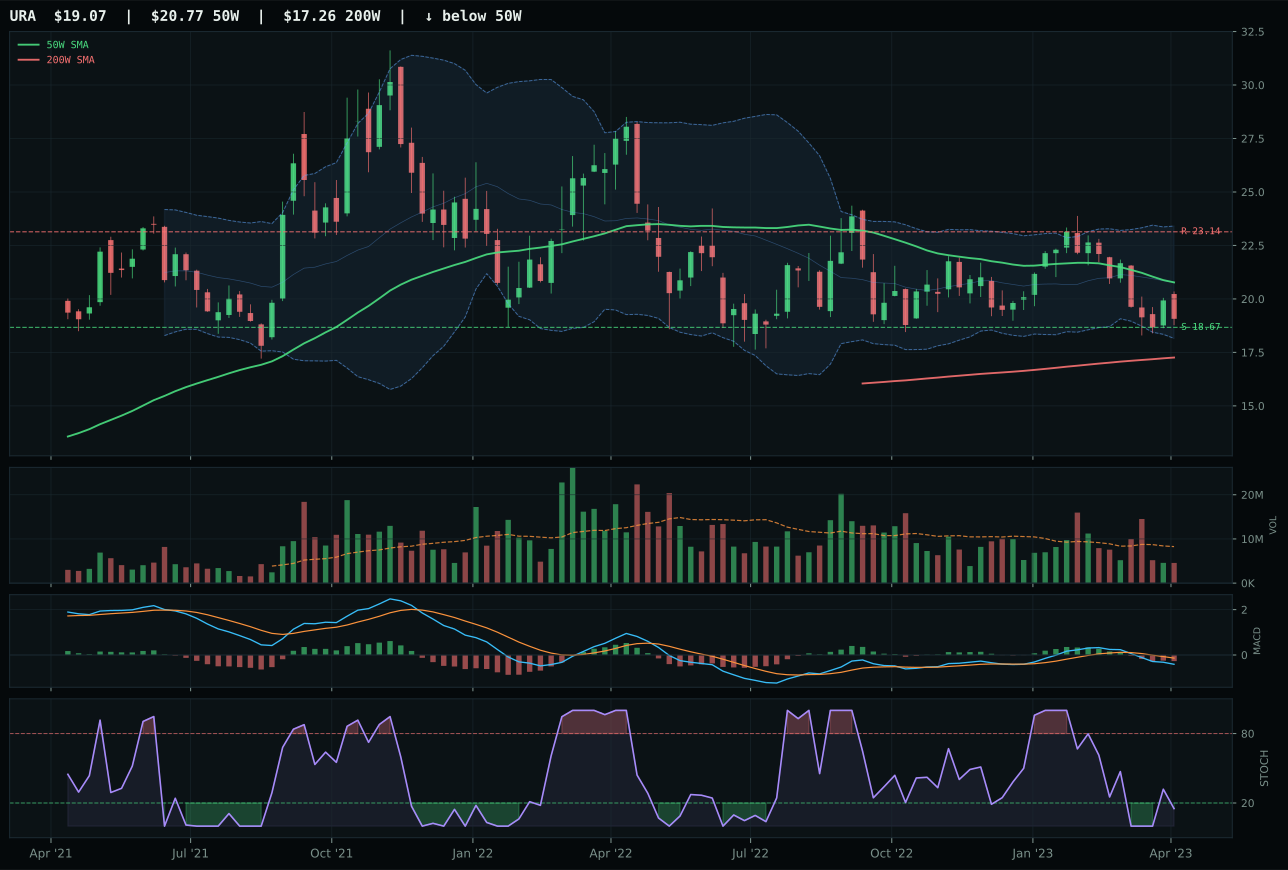
URA has a pullback into support profile with -15.4% 13-week relative strength versus SPY.
A failed hold above support would weaken the setup.
Actionable but governed by invalidation levels.
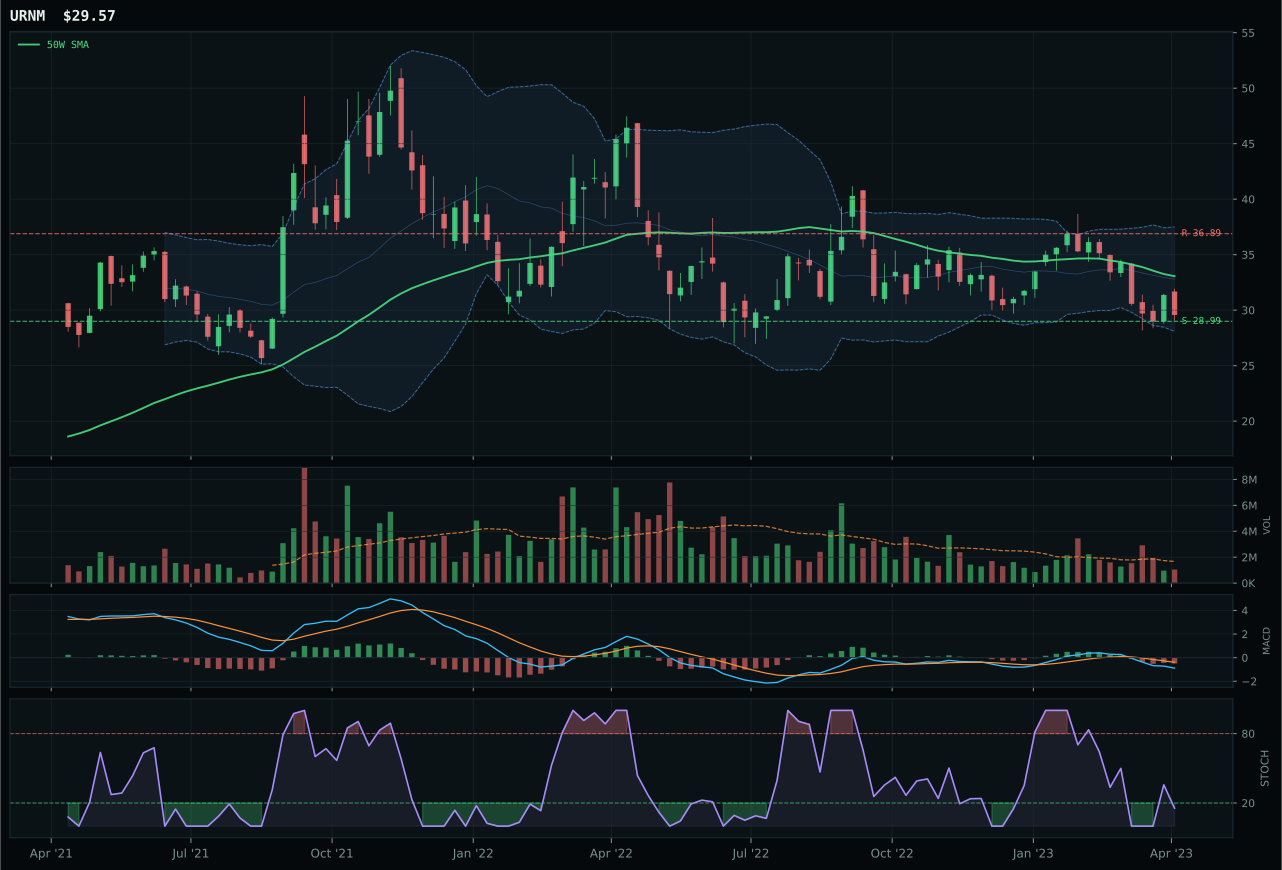
URNM has a pullback into support profile with -17.1% 13-week relative strength versus SPY.
A failed hold above support would weaken the setup.
Actionable but governed by invalidation levels.
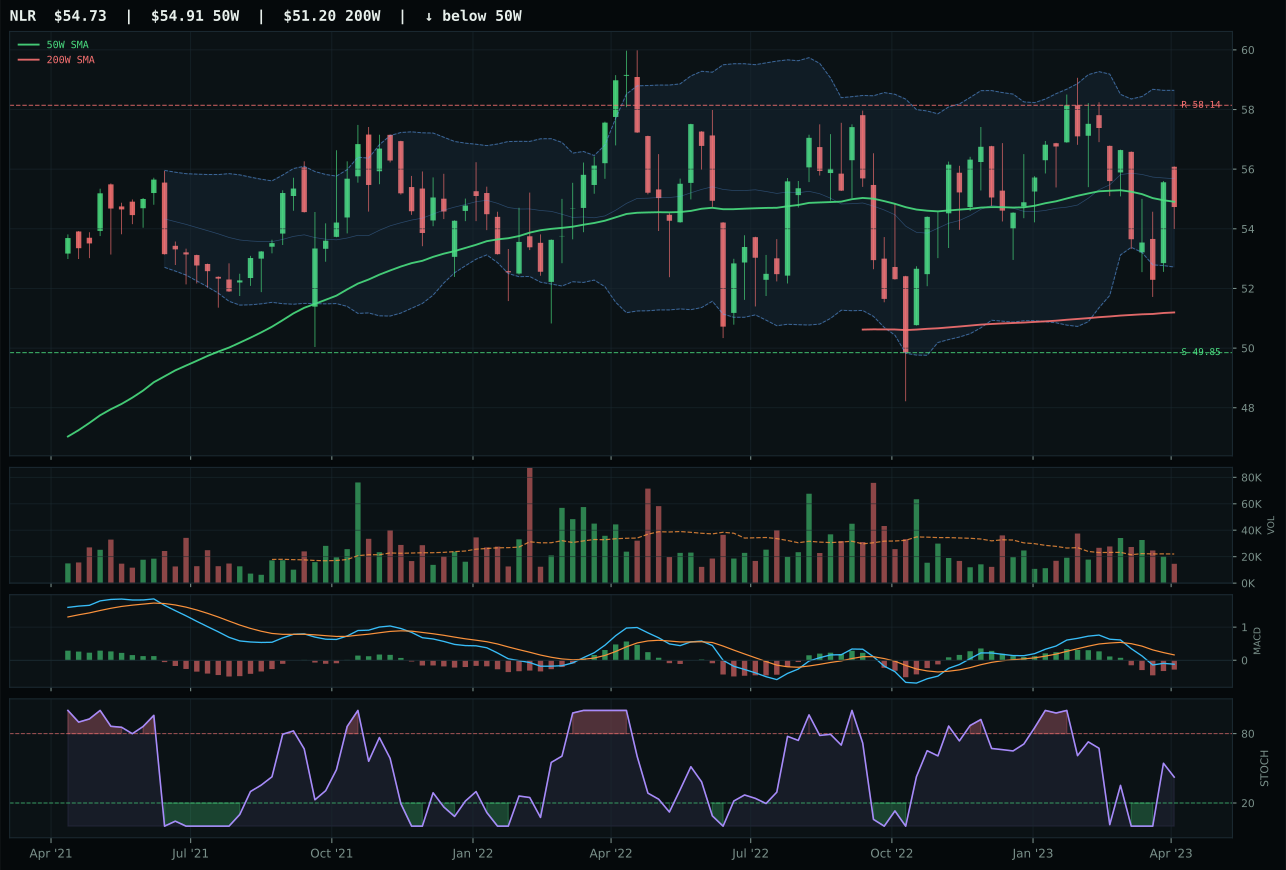
NLR has a compression near 50W profile with -7.2% 13-week relative strength versus SPY.
A failed hold above support would weaken the setup.
Tracked, but not top-2 eligible because: .
URA won the category despite a weak 32.2 composite score by posting the cleanest pullback-into-support setup available, beating URNM by 21.8 points on cleanliness and structure. Price is 8.2% below the 50W but still above the 200W, setting up a defined mean-reversion box: support at 18.67, resistance at 23.14. Timing scores a remarkable 94.0/100 because stochastic RSI is oversold-turn-up at 0.15 in the near-52W-low repair zone, and risk/reward is 90.0/100 (only 2.1% downside, -17.6% upside distance). URNM is a death trap by comparison: timing 74.0/100, risk/reward 75.0/100, and technical evidence collapsed to 0.0/100 meaning the chart has no structural validity. URA's 63.6/100 structure score on a pullback-into-support setup is cleaner than URNM's vertical collapse because support is defined and stochastic RSI setup is binary and testable.
Nuclear Energy holds 5% as a tier-2 position in a portfolio where the category scores only 32.2 and ranks below Defense & Aerospace at 37.4, representing conviction in a mean-reversion setup rather than structural category strength. URA's -15.4% RS versus SPY and -9.9% 13W return are disastrous on the surface, but the allocation exists because macro support is active: real asset sponsorship adds 7 points and AI growth sponsorship adds 5 points, building to 57.0/100 category macro fit. Technical evidence is weak at 25.5/100, making this a pure macro-driven allocation that works only if real assets and AI themes remain in the portfolio narrative. The portfolio is betting that nuclear energy's role in AI compute infrastructure justifies holding a deeply oversold chart until stochastic RSI completes its turn-up and breaks above the 50W. This is a speculative tactical allocation: if real asset sponsorship or AI growth descriptors flip to inactive, Nuclear Energy moves to 0% immediately. The 5% exists as a conviction bet, not as portfolio ballast.
Agriculture & Livestock — VEGI
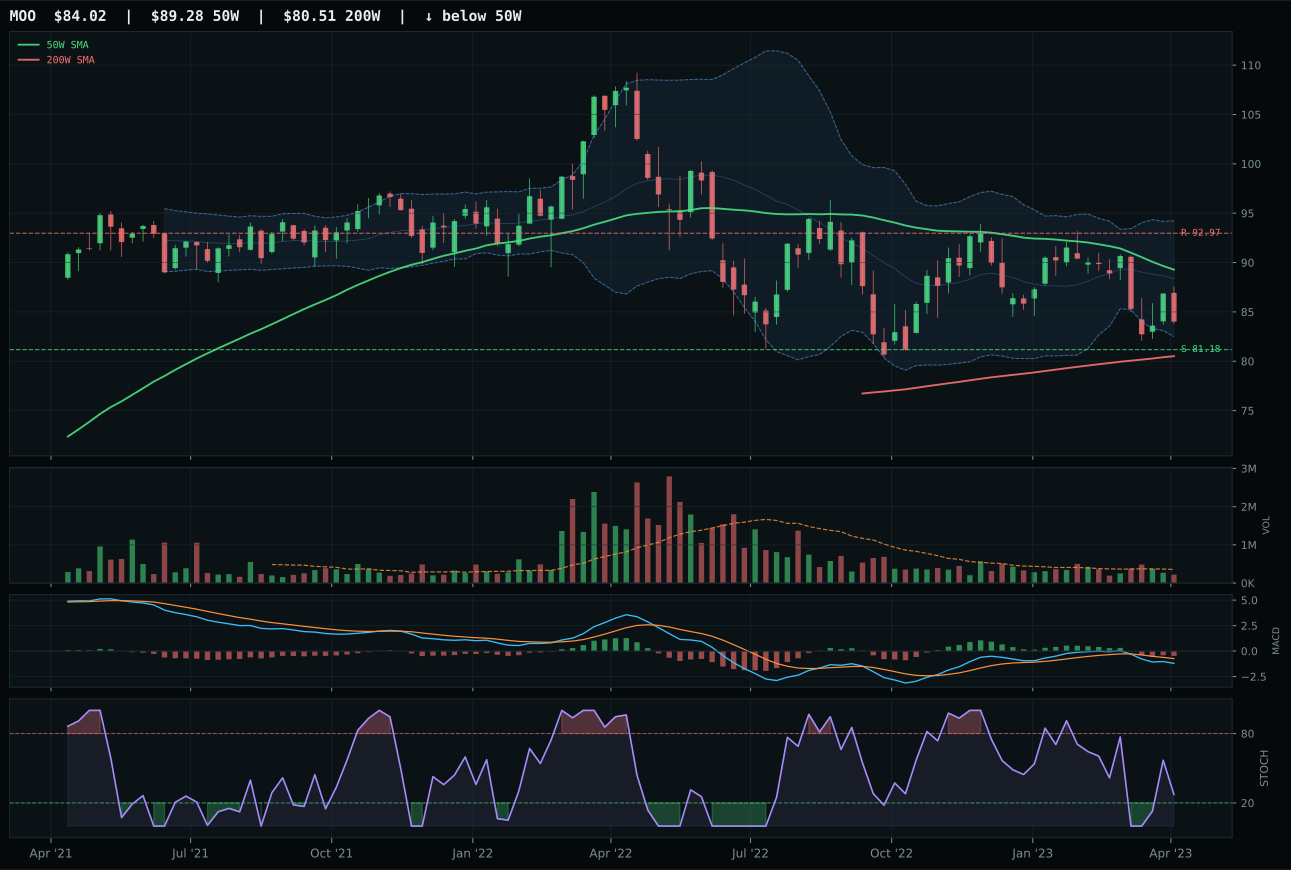
MOO has a pullback into support profile with -9.2% 13-week relative strength versus SPY.
A failed hold above support would weaken the setup.
Actionable but governed by invalidation levels.
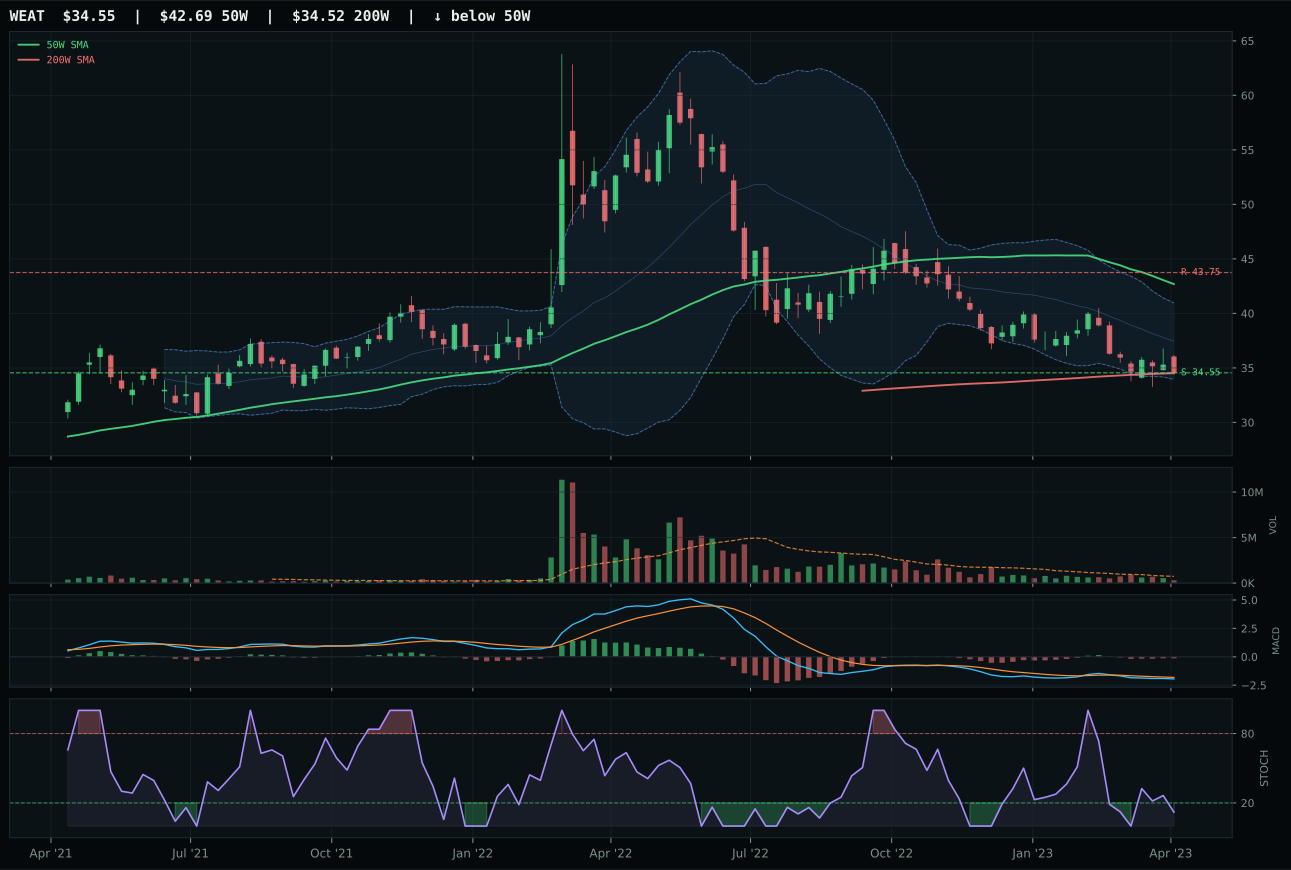
WEAT has a pullback into support profile with -13.6% 13-week relative strength versus SPY.
A failed hold above support would weaken the setup.
Actionable but governed by invalidation levels.
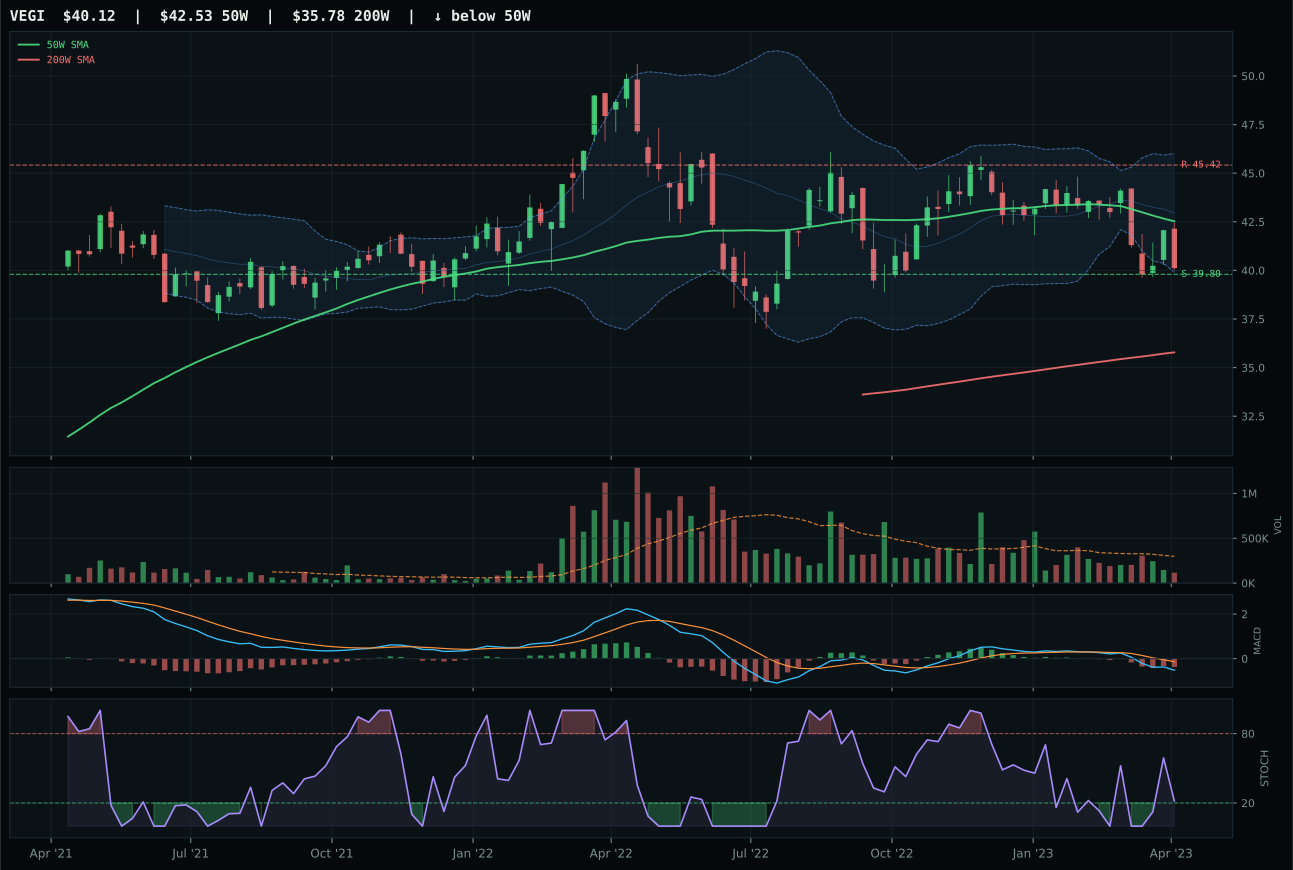
VEGI has a pullback into support profile with -12.5% 13-week relative strength versus SPY.
A failed hold above support would weaken the setup.
Actionable but governed by invalidation levels.
Agriculture & Livestock is excluded from allocation this week with 0% and ranked 9th or 10th because the entire category is broken: VEGI won but scored only 26.8 on the final composite, making it the weakest category available. VEGI's chart is a pullback into defined support (39.80 support, 45.42 resistance), and from a mean-reversion standpoint the risk/reward looks asymmetric at 90.0/100 with 0.8% downside and -11.7% upside distance. But that asymmetry is a trap—momentum confirmation is 0.0/100, 13W return is -7.1%, and RS versus SPY at -12.5% tells you institutions are selling, not accumulating. Volume at 0.39x participation and MACD bearish/weakening confirm this is capitulation setup, not accumulation. The category-relative strength of 0.0% means VEGI is not even leading a weak peer group; MOO is actually stronger on technical evidence (35.4/100 vs 30.3/100). This is a category in genuine downtrend with no sponsor cover.
Agriculture & Livestock earns 0% allocation this week because it ranks 9th or 10th among the ten categories and failed to clear the eligibility bar. Final composite score of 26.8 is the weakest of any category, well below even Defense & Aerospace at 37.4. The macro regime offers no help: commodity breadth positive adds 5 points but disinflation pressure subtracts 8, leaving net negative bias. Real asset sponsorship is active at 8 points, but that support is too late to rescue a chart with -12.5% RS versus SPY and zero momentum confirmation. This is a sector in structural oversupply with sellers in control; support at 39.80 in VEGI may hold on a bounce, but the 0% allocation reflects the reality that capital is better deployed elsewhere. For Agriculture to earn a 5% slot, it would need to see MACD print bullish-and-improving (not just rising), 13W returns turn positive, and RS versus SPY recover above -5%. None of that is present.
Traditional Energy — XLE
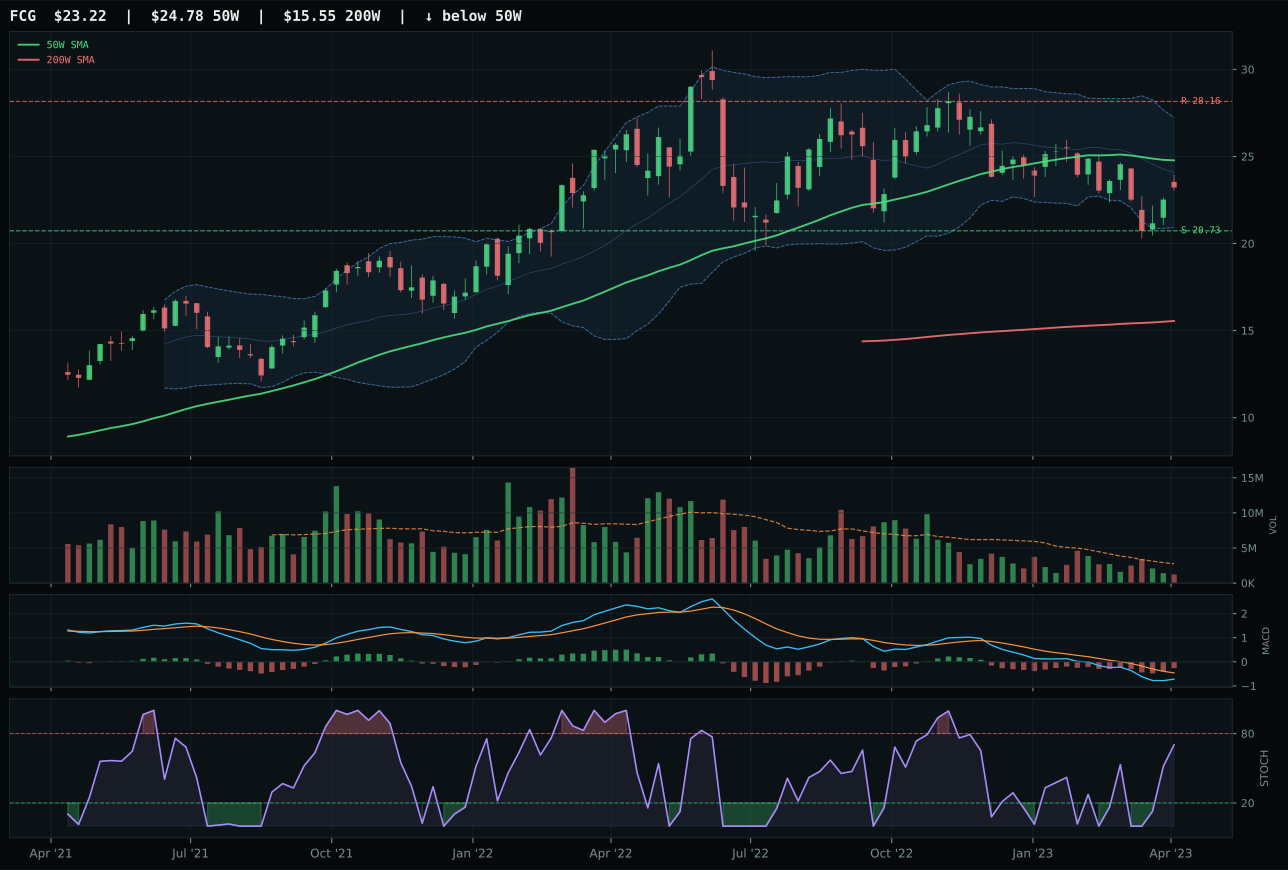
FCG has a neutral structure profile with -8.3% 13-week relative strength versus SPY.
A failed hold above support would weaken the setup.
Actionable but governed by invalidation levels.
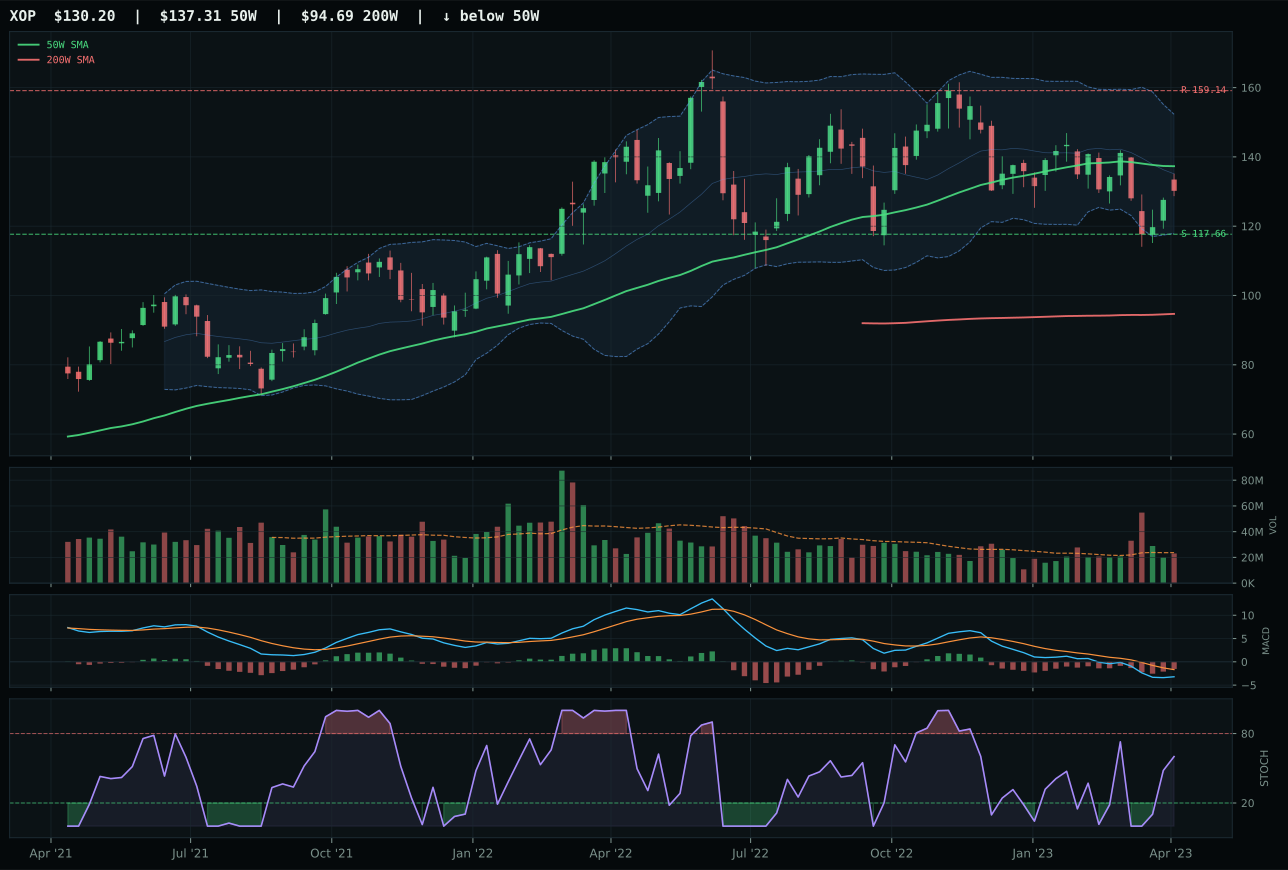
XOP has a neutral structure profile with -6.5% 13-week relative strength versus SPY.
A failed hold above support would weaken the setup.
Actionable but governed by invalidation levels.
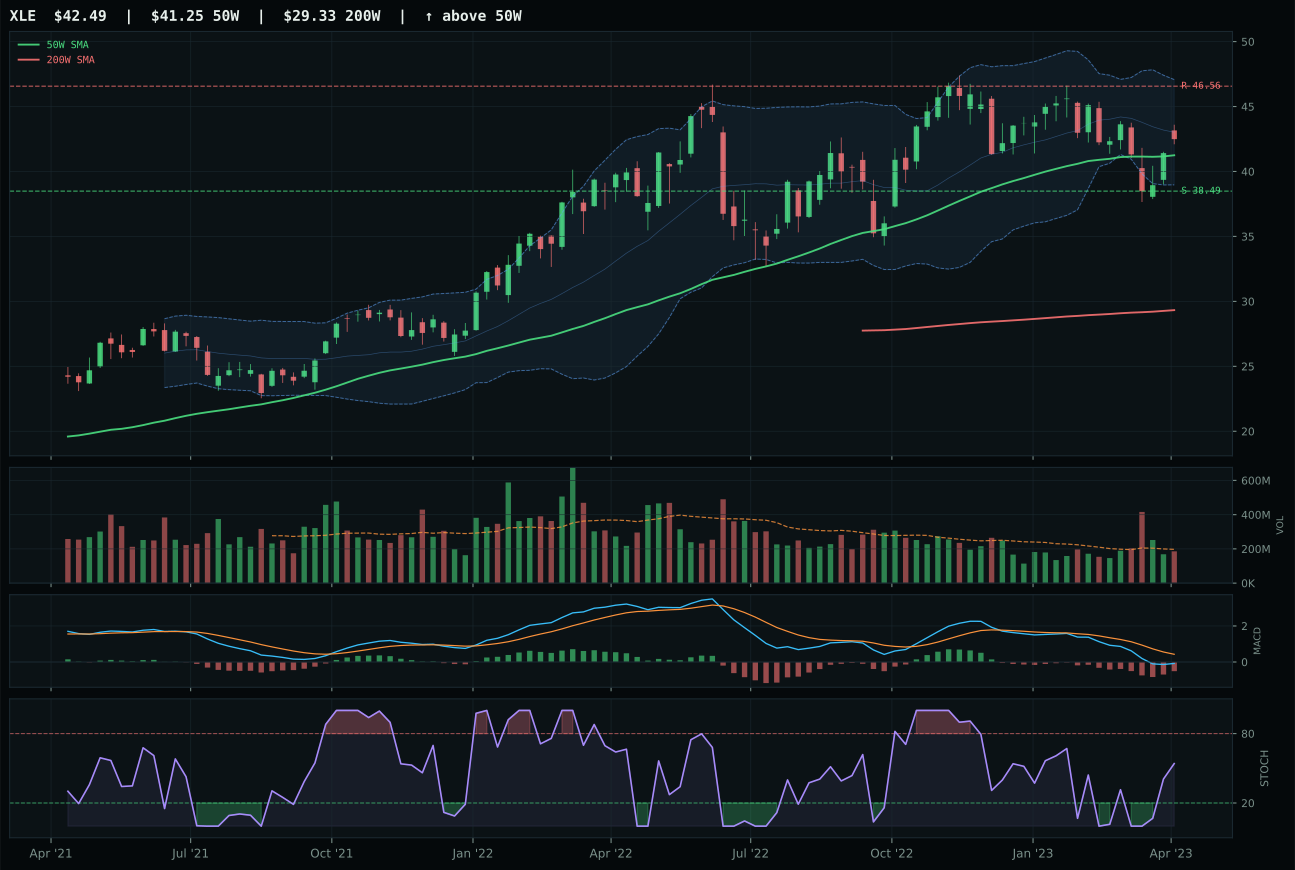
XLE has a neutral structure profile with -8.4% 13-week relative strength versus SPY.
A failed hold above support would weaken the setup.
Actionable but governed by invalidation levels.
Traditional Energy is excluded from allocation this week with 0% and ranked 9th or 10th because the category composite score of 16.6 is nearly non-functional—the second-weakest available. XLE won by just 2.0 points over FCG in a race where both cars have broken engines. XLE's 69.4/100 trend score reflects price above the moving averages, but the story is all execution failure: -2.9% 13W return, -8.4% RS versus SPY, and MACD bearish/weakening despite timing showing 93.0/100 (a trap score—technical proximity to support means nothing when momentum is dead). Volume-price confirmation at 38.5/100 and persistence at 39.2/100 are disastrous red flags showing buyers are absent. Stochastic RSI rising mid-zone looks constructive in isolation, but this is a chart sliding into support on capitulation, not accumulating on strength. Momentum confirmation at 24.1/100 says the message clearly: energy is broken.
Traditional Energy earns 0% allocation this week, ranking 9th or 10th among categories with a 16.6 final composite score that sits below even Agriculture & Livestock at 26.8. Macro environment is actively hostile: disinflation pressure subtracts 10 points, credit stress subtracts 7 points, and category-level macro fit is only 40.0/100—the weakest in the portfolio. Real asset sponsorship of 7 points cannot overcome the dual headwind of falling energy demand (implicit in disinflation) and credit stress concerns that make energy capex a risk. XLE's 39.1/100 technical evidence is saved only by timing at 93.0/100 (proximity to support 38.49) but that proximity is a consequence of a broken downtrend, not a bottoming setup. For Traditional Energy to earn a 5% slot, it would need either disinflation descriptor to flip to neutral, credit stress to flip to positive (highly unlikely), or XLE to print MACD bullish-and-improving with volume above 1.0x average. The allocation is zero because none of those preconditions are met and the macro case is deteriorating, not improving.