
2023-03-31
Informational purposes only. The content in this report, including allocations, analysis, and commentary, is provided solely for informational and educational purposes. It does not constitute financial advice, investment advice, trading advice, or any other type of advice. Past performance does not guarantee future results. Always conduct your own research and consult a qualified financial professional before making investment decisions.
Weekly Allocation
| Ticker | Category | Weight | Role |
|---|---|---|---|
| FBTC | 50% | Overlay | |
| XLK | Technology | 10% | Top-2 (10%) |
| SMH | AI | 10% | Top-2 (10%) |
| GLD | Precious Metals | 5% | Tier-2 (5%) |
| COPX | Industrial Metals | 5% | Tier-2 (5%) |
| IEMG | Emerging Markets | 5% | Tier-2 (5%) |
| ITA | Defense & Aerospace | 5% | Tier-2 (5%) |
| XLU | Utilities & Infrastructure | 5% | Tier-2 (5%) |
| URA | Nuclear Energy | 5% | Tier-2 (5%) |
Trade Instructions — Monday Open
Sell the tranche from 2023-03-03 (completing its 4-week hold). Buy the new tranche. Instructions show net portfolio changes — same-asset positions cancel, weight changes show the delta.
| Action | Ticker | Instruction |
|---|---|---|
| SELL | COPX | Sell 50% of COPX position (reduce 7.50% → 3.75%) |
| SELL | CIBR | Sell entire CIBR position (5.00% of portfolio) |
| SELL | XLU | Sell 25% of XLU position (reduce 5.00% → 3.75%) |
| SELL | ITA | Sell 25% of ITA position (reduce 5.00% → 3.75%) |
| SELL | BOTZ | Sell entire BOTZ position (2.50% of portfolio) |
| SELL | URA | Sell 17% of URA position (reduce 7.50% → 6.25%) |
| SELL | GLD | Sell 20% of GLD position (reduce 6.25% → 5.00%) |
| SELL | MOO | Sell 50% of MOO position (reduce 5.00% → 2.50%) |
| BUY | XLK | Buy XLK — 13.33% of freed cash (adds 2.50% to portfolio) |
| BUY | SMH | Buy SMH — 13.33% of freed cash (adds 2.50% to portfolio) |
| BUY | FBTC | Buy FBTC — 66.67% of freed cash (adds 12.50% to portfolio) |
| BUY | IEMG | Buy IEMG — 6.67% of freed cash (adds 1.25% to portfolio) |
Current Portfolio After Trade
Combined holdings across all 4 active tranches. Each tranche is 25% of the portfolio.
| Ticker | % of Portfolio | Weight Bar |
|---|---|---|
| FBTC | 37.50% | |
| XLK | 12.50% | |
| SMH | 10.00% | |
| URA | 6.25% | |
| GLD | 5.00% | |
| XAR | 5.00% | |
| XLU | 3.75% | |
| ITA | 3.75% | |
| COPX | 3.75% | |
| MOO | 2.50% | |
| IGF | 2.50% | |
| PICK | 2.50% | |
| INDA | 2.50% | |
| GDX | 1.25% | |
| IEMG | 1.25% |
Macro Regime — Goldilocks
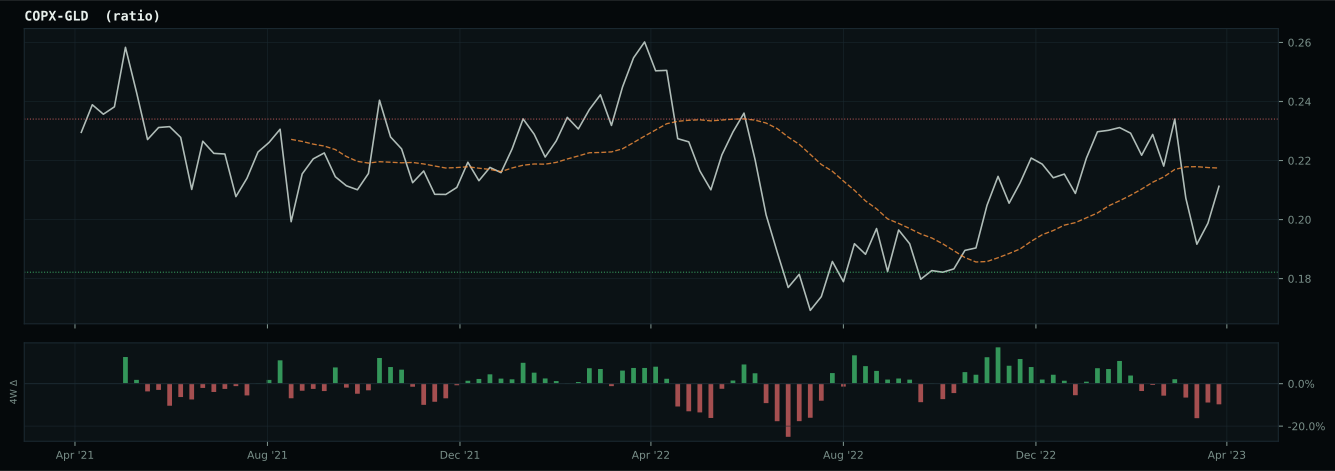
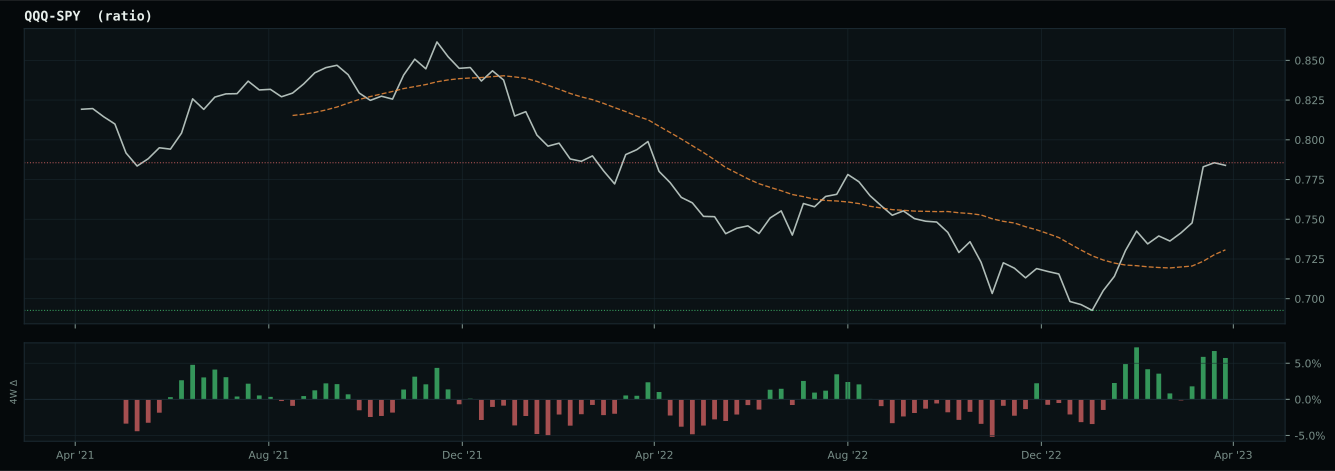
Macro Evidence Charts
Market-implied signals behind the macro regime scores. Each ratio compares two assets; the direction and slope of the ratio is what the macro engine reads.
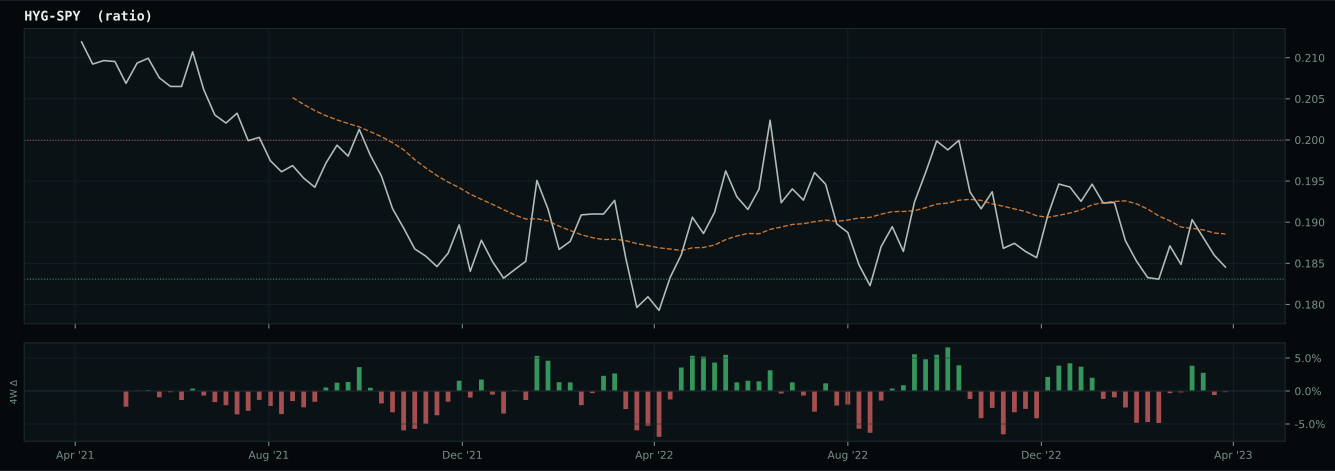
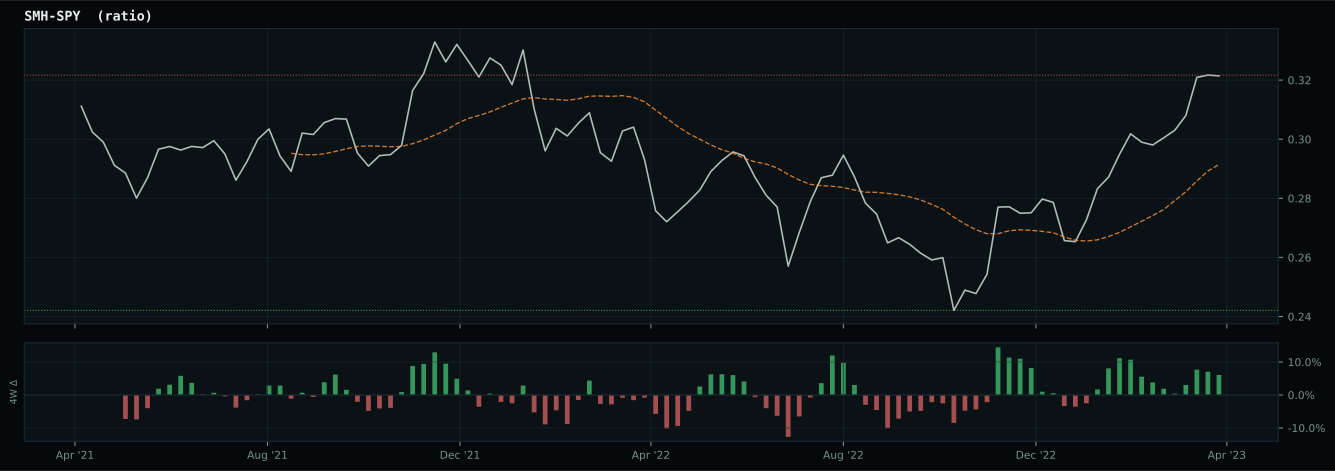
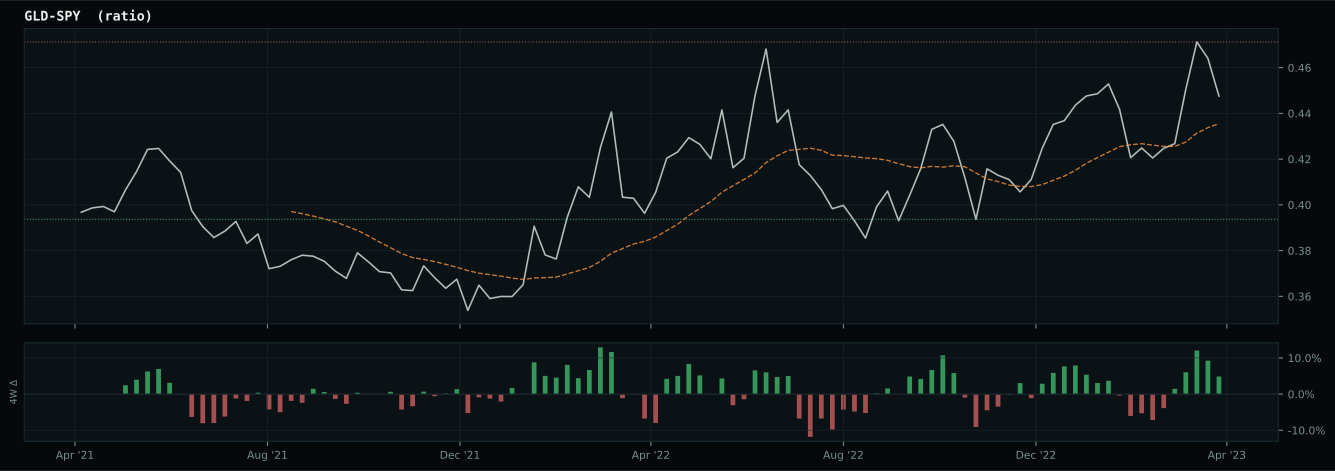
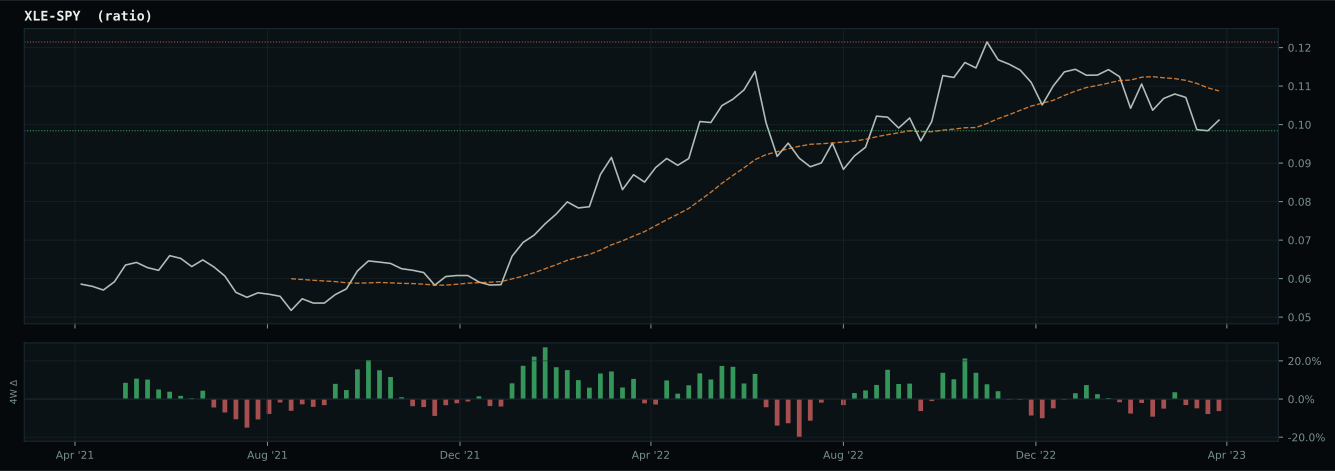
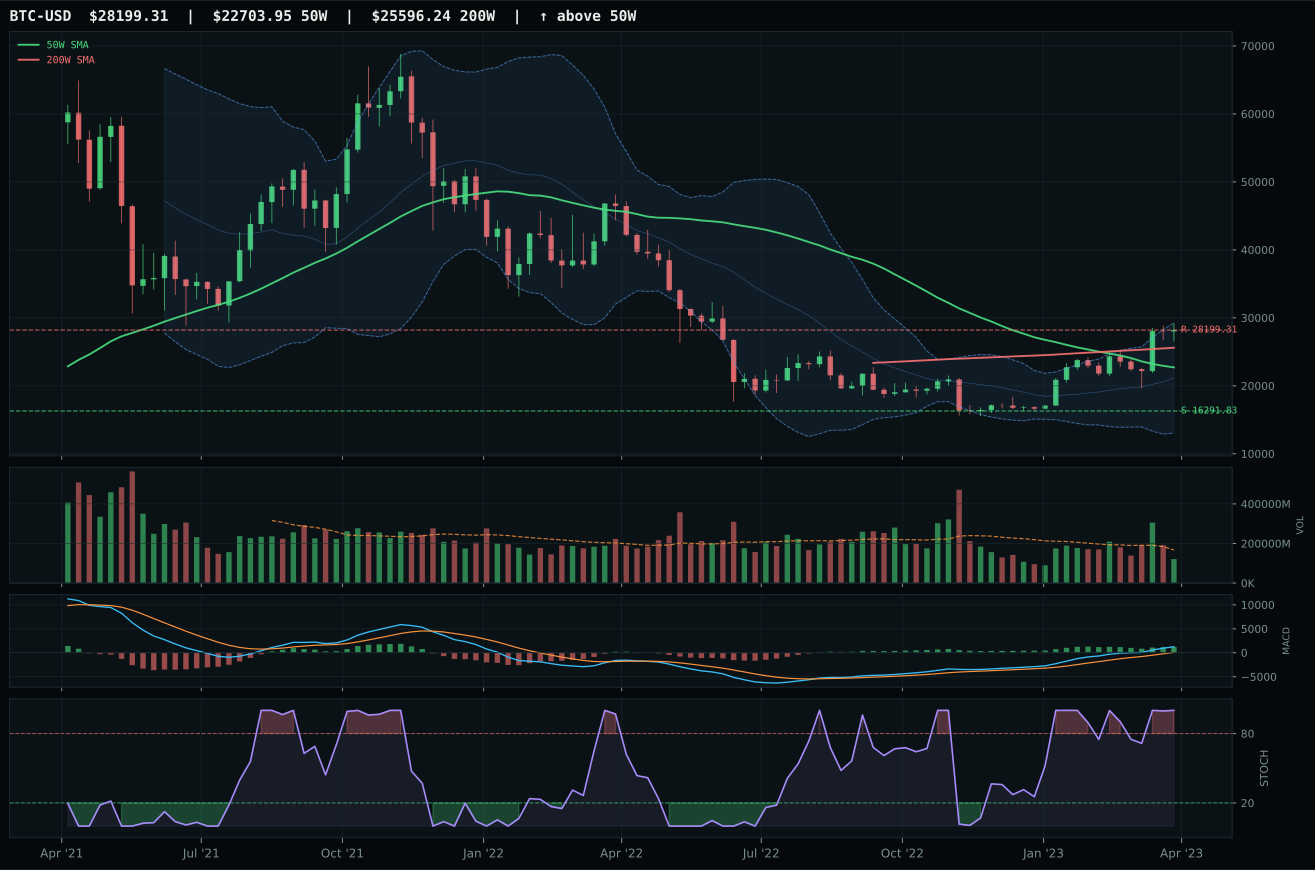
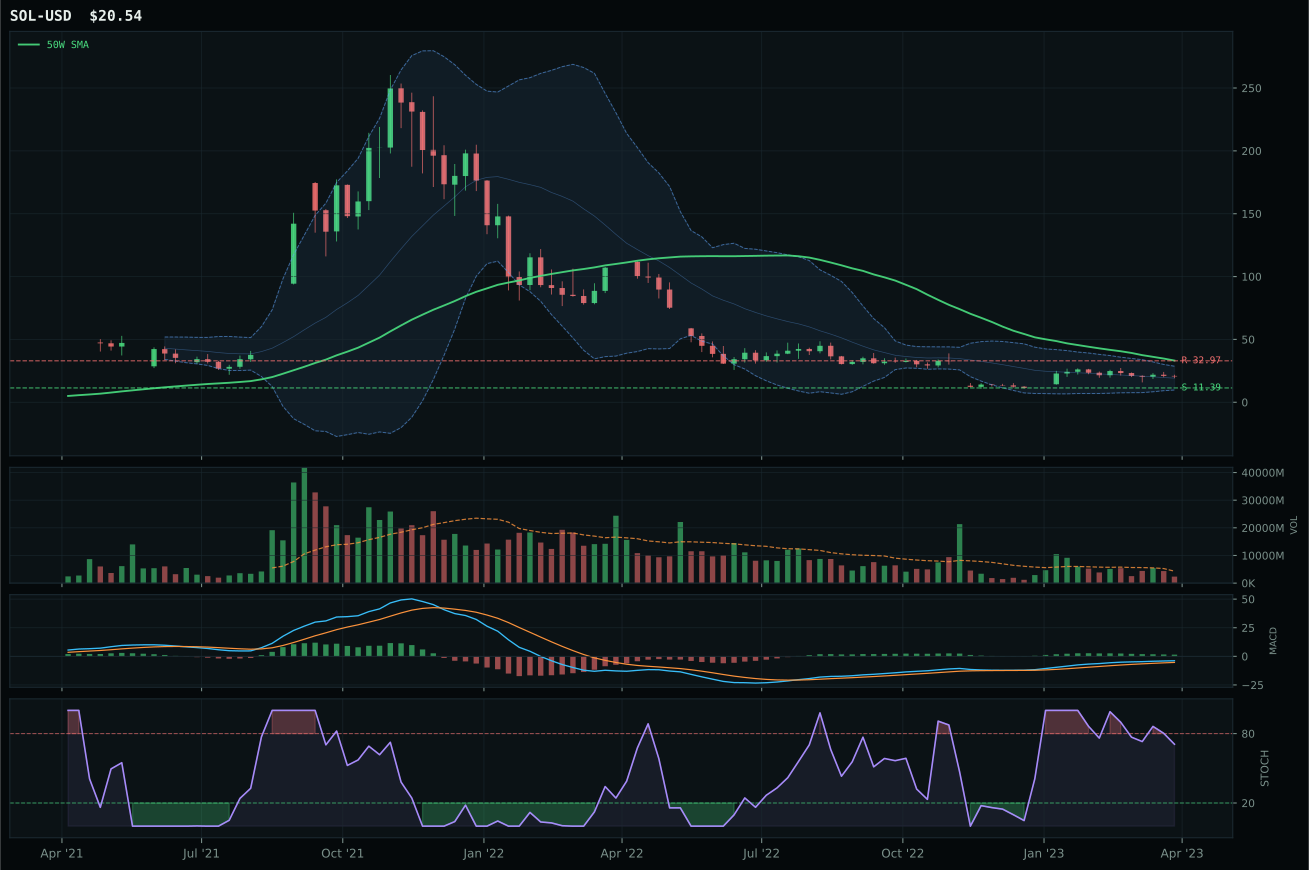
Crypto Regime — ValueBTC
ValueBTC armed; waiting for decisive close above post-touch range resistance by 3%, breakout volume above 20W average
TrendBTC not confirmed
one or more available conditions failed
Category Rankings
| Rank | Category | Winner | Score | Alloc | 4W Ret | Peers (4W) |
|---|---|---|---|---|---|---|
| 1 | Technology | XLK | 75.7 | 20% | +0.41% | IGV -2.2% · CIBR -6.9% |
| 2 | AI | SMH | 74.3 | 20% | -5.30% | BOTZ -1.4% · AIQ -2.3% |
| 3 | Precious Metals | GLD | 61.4 | 10% | +1.20% | GDX +5.1% · SLV +7.9% |
| 4 | Industrial Metals | COPX | 56.6 | 10% | +2.82% | REMX -3.3% · PICK -2.9% |
| 5 | Emerging Markets | IEMG | 45.9 | 10% | -0.70% | INDA +4.8% · ILF +3.4% |
| 6 | Defense & Aerospace | ITA | 38.5 | 10% | -0.95% | XAR -2.2% · ROKT -1.3% |
| 7 | Utilities & Infrastructure | XLU | 38.3 | 10% | +2.05% | IGF +2.4% · PAVE -3.0% |
| 8 | Nuclear Energy | URA | 34.4 | 10% | -1.29% | NLR +0.9% · URNM -2.4% |
| 9 | Agriculture & Livestock | WEAT | 25.4 | 0% | -12.21% | MOO -1.9% · VEGI -3.6% |
| 10 | Traditional Energy | XLE | 9.0 | 0% | -2.62% | XOP -6.1% · FCG -3.1% |
Technology — XLK
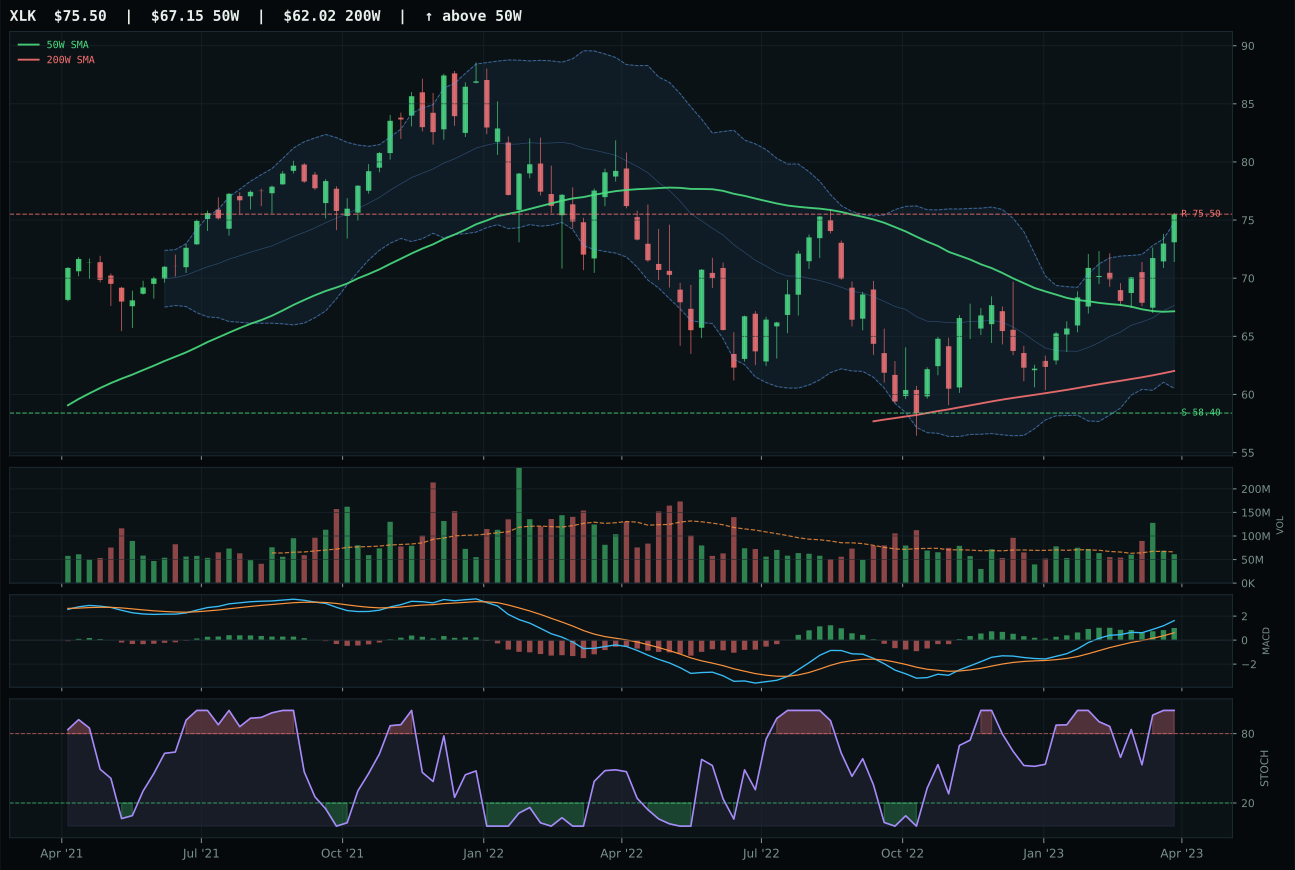
XLK has a neutral structure profile with 14.3% 13-week relative strength versus SPY.
A failed hold above support would weaken the setup.
Actionable but governed by invalidation levels.
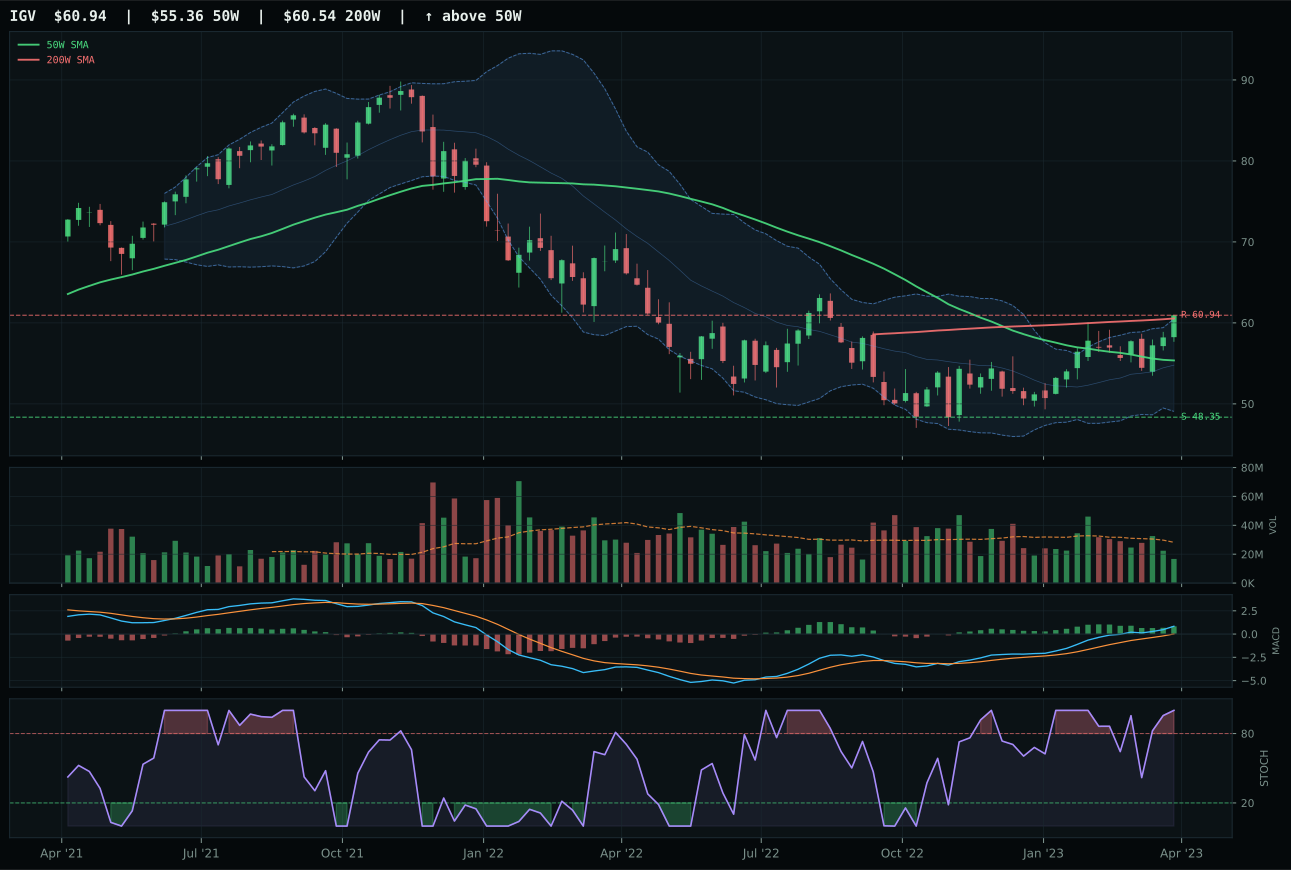
IGV has a neutral structure profile with 12.0% 13-week relative strength versus SPY.
A failed hold above support would weaken the setup.
Actionable but governed by invalidation levels.
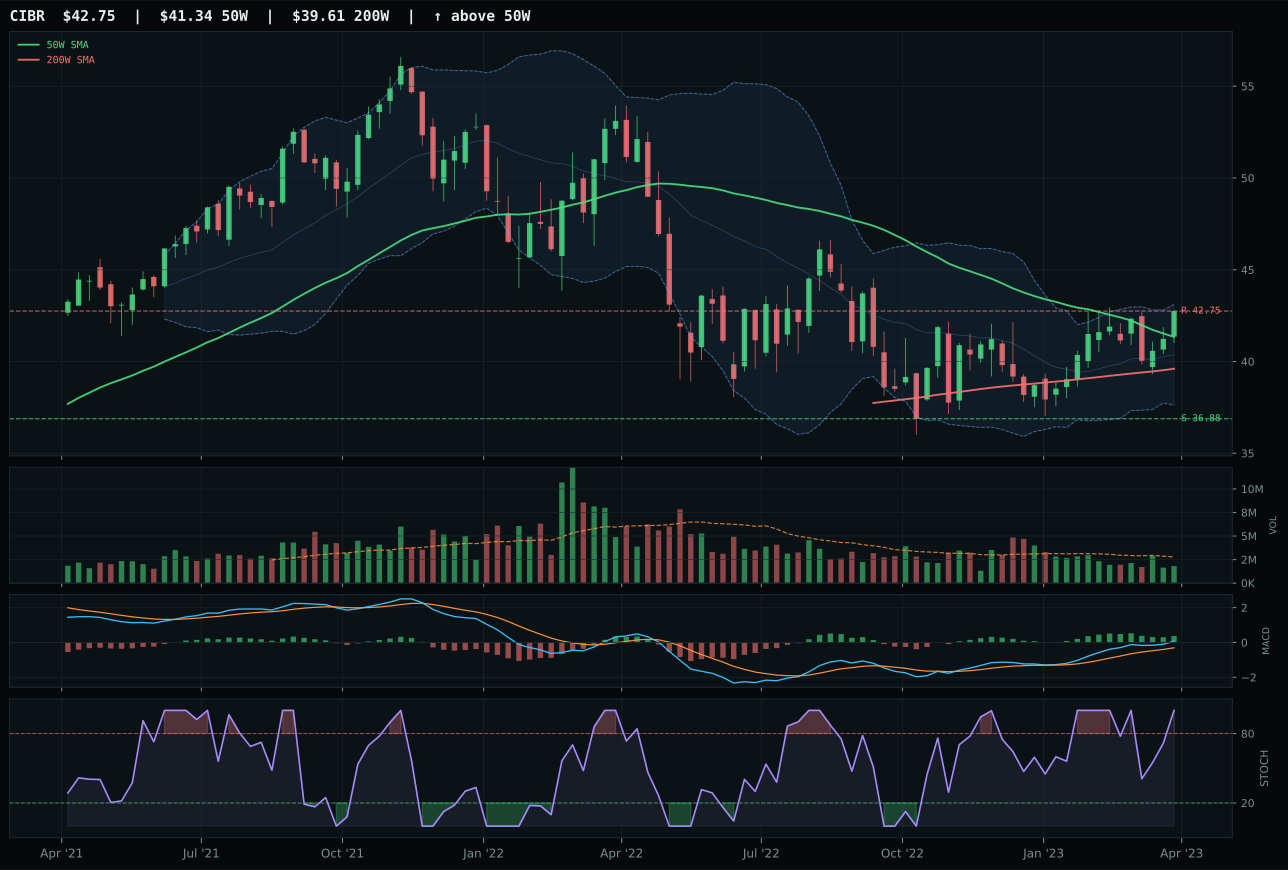
CIBR has a neutral structure profile with 3.4% 13-week relative strength versus SPY.
A failed hold above support would weaken the setup.
Actionable but governed by invalidation levels.
XLK wins the category with a 6.1-point lead over IGV because its relative strength versus SPY (14.3%) and category peers (2.3%) is materially cleaner and its volume-price sponsorship is confirming the uptrend. The core setup is neutral structure at 12.4% above the 50W with MACD bullish and improving—the marker that separates accumulation from mere bounce. IGV's MACD is flattening and its category-relative strength sits at zero, meaning it is not winning a three-way ETF conversation inside its own bracket. With 21.4% 13W return and a 100.0 trend score, XLK is extended but the volume profile and momentum confirmation at 100.0 tell us that new buyers are still participating rather than hesitating at resistance.
Technology ranks in the top-2 and receives a 10% allocation because its 75.7 final score and 81.0 macro fit position it as one of the two highest-scoring eligible categories this week. XLK's technical evidence is 88.2/100—driven by trend leadership, relative strength breadth, and volume-price confirmation that the move is being accumulated. Goldilocks macro state helps this exposure, and the active descriptors (liquidity expansion, risk appetite positive, AI growth sponsorship) all push positive. The category-level macro fit of 81.0 against a Goldilocks regime means technology's duration-sensitive character aligns with the risk-on tone. Risk appetite is positive, not deteriorating, and liquidity is expanding—the exact environment where broad technology can sustain gains. The trade-off is timing; XLK sits 12.4% above the 50W and stochastic RSI is overbought, so entry risk exists. But the category rank and macro sponsorship justify holding it at the top-2 slot.
AI — SMH
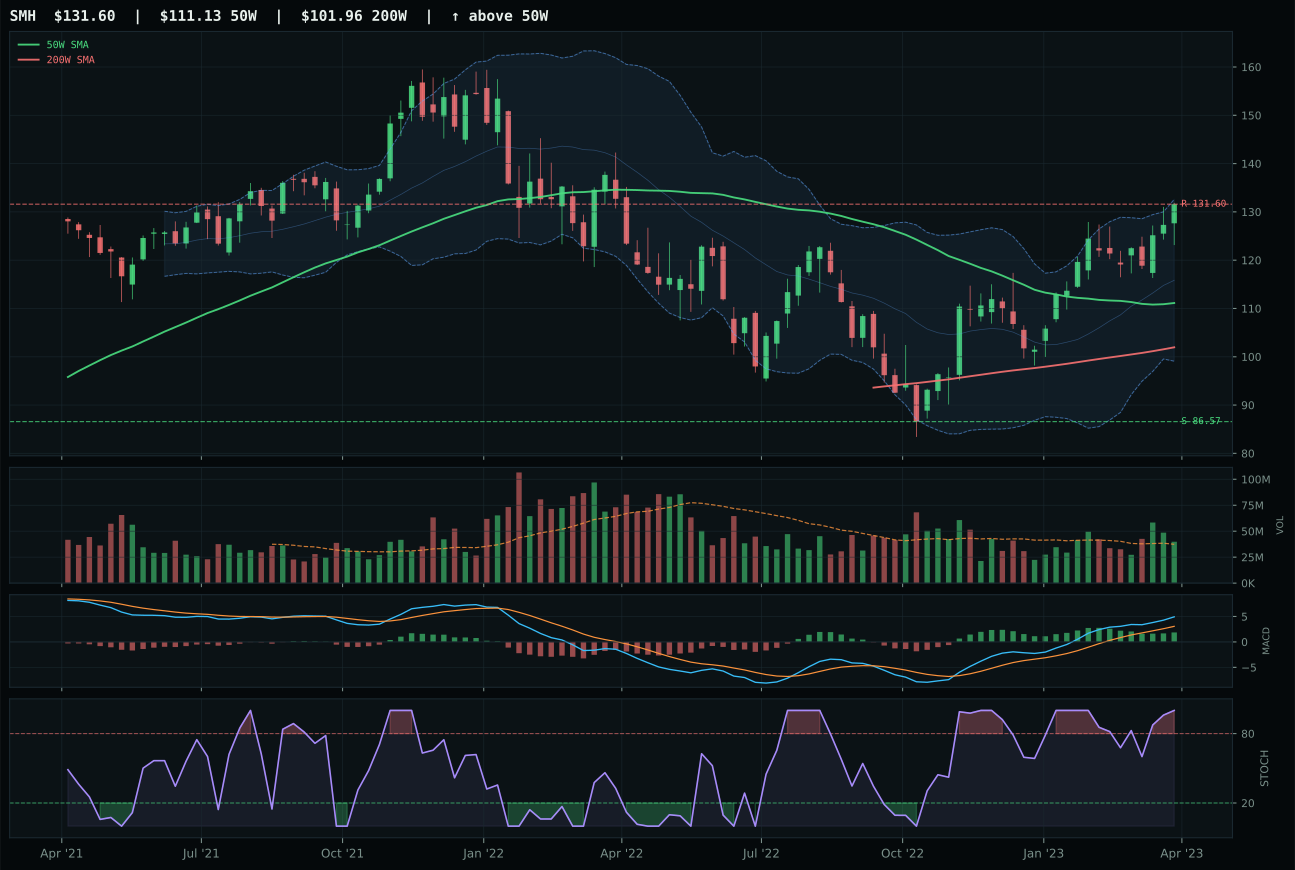
SMH has a vertical extension profile with 22.6% 13-week relative strength versus SPY.
A failed hold above support would weaken the setup.
Actionable but governed by invalidation levels.
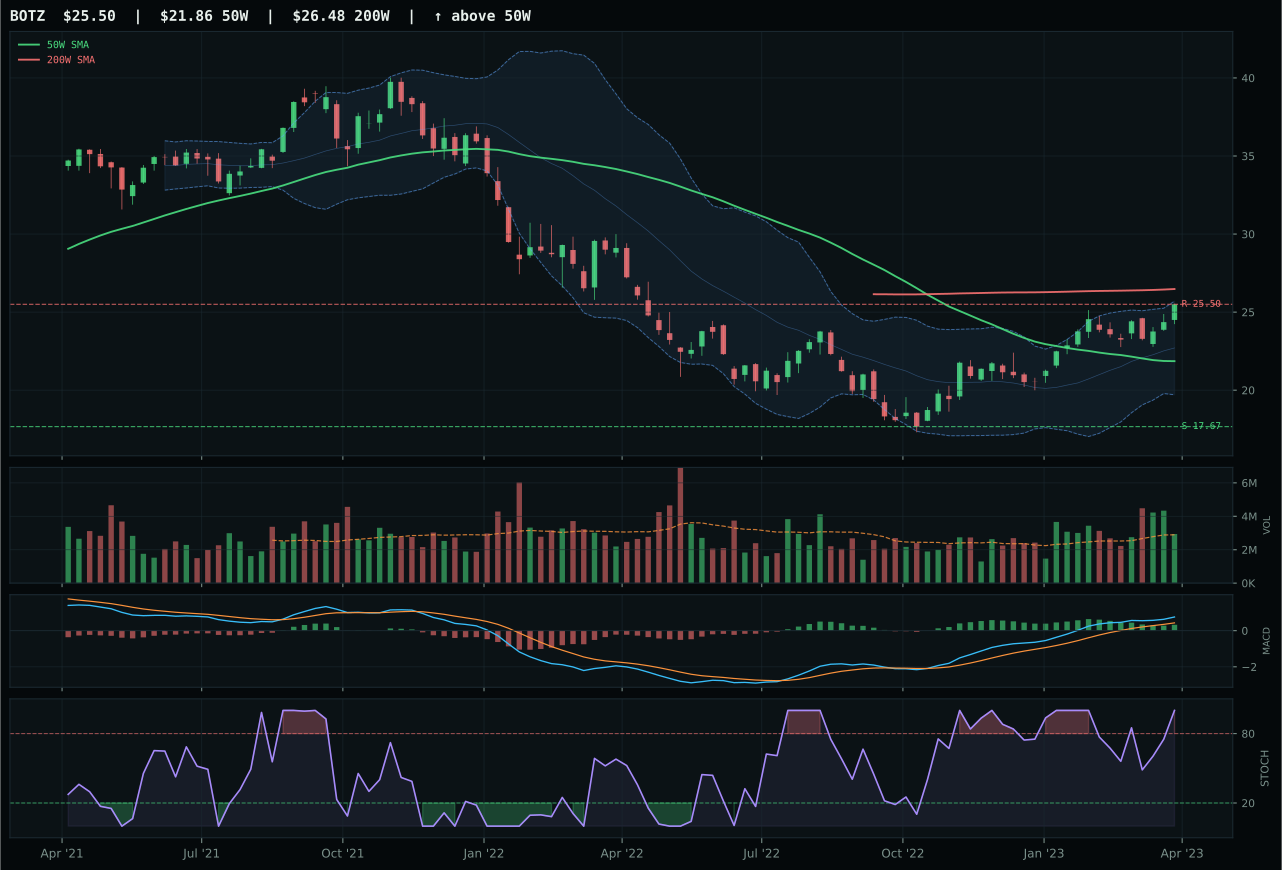
BOTZ has a vertical extension profile with 17.0% 13-week relative strength versus SPY.
A failed hold above support would weaken the setup.
Actionable but governed by invalidation levels.
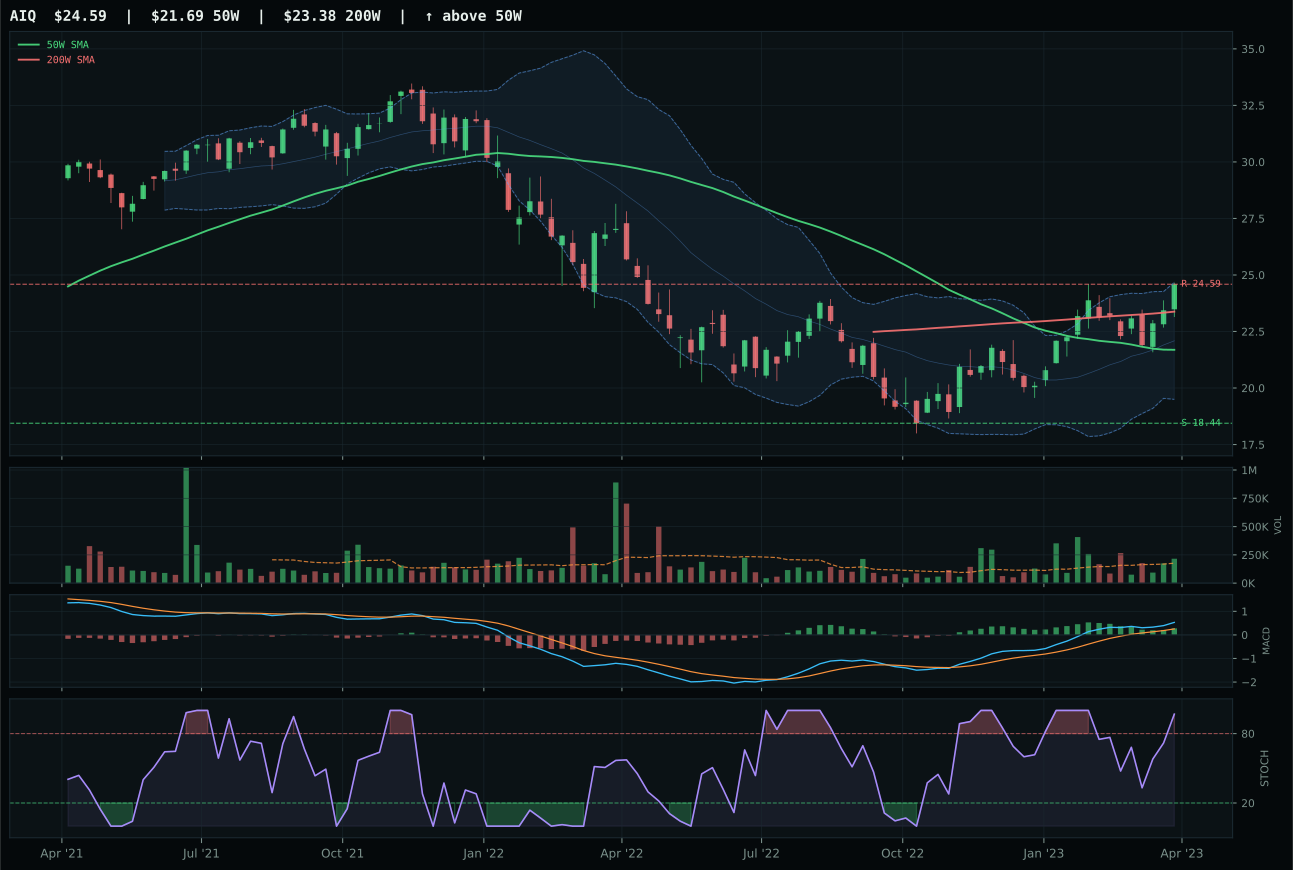
AIQ has a neutral structure profile with 15.3% 13-week relative strength versus SPY.
A failed hold above support would weaken the setup.
Tracked, but not top-2 eligible because: .
SMH wins with a 6.9-point margin over BOTZ because its category-relative strength at 5.6% versus BOTZ's 0.0% signals that semiconductor compute dominance is the favored expression of AI upside in this moment. Price sits 18.4% above the 50W near the 52W high with MACD bullish but flattening, which normally would penalize a setup for entry risk. However, the 29.7% 13W return and 100.0 momentum confirmation score indicate that the vertical extension is being powered by volume and persistent buyer participation, not retail capitulation. The 22.6% RS versus SPY is the second-highest in the entire portfolio, communicating that AI compute (via semiconductors) is the consensus crowded position—one that still has enough sponsorship to carry through. BOTZ's 17.0% SPY-relative strength is respectable but trails SMH by 5.6 category points, confirming that robotics and physical automation are not capturing the same breadth of capital.
AI earns the second top-2 slot at 10% allocation based on a 74.3 final score and 86.0 category-level macro fit. SMH's technical evidence is 72.4/100 from trend, relative strength, and persistence (93.6), which means the setup is not pristine on entry metrics but the move is durable. The macro sponsorship is acute: AI growth is active at +14, risk appetite positive at +10, and liquidity expansion at +6. These are the three highest-conviction macro descriptors active this week outside of the metals-scarcity complex. The category fits Goldilocks regime (+10) because risk appetite is positive without volatility spikes. Entry timing is late (32.0 timing score reflects the vertical extension and 18.4% distance above 50W), and downside risk to support is 52%, but the macro alignment and category rank justify the allocation. This is a crowded consensus trade with momentum validation—hold it.
Precious Metals — GLD
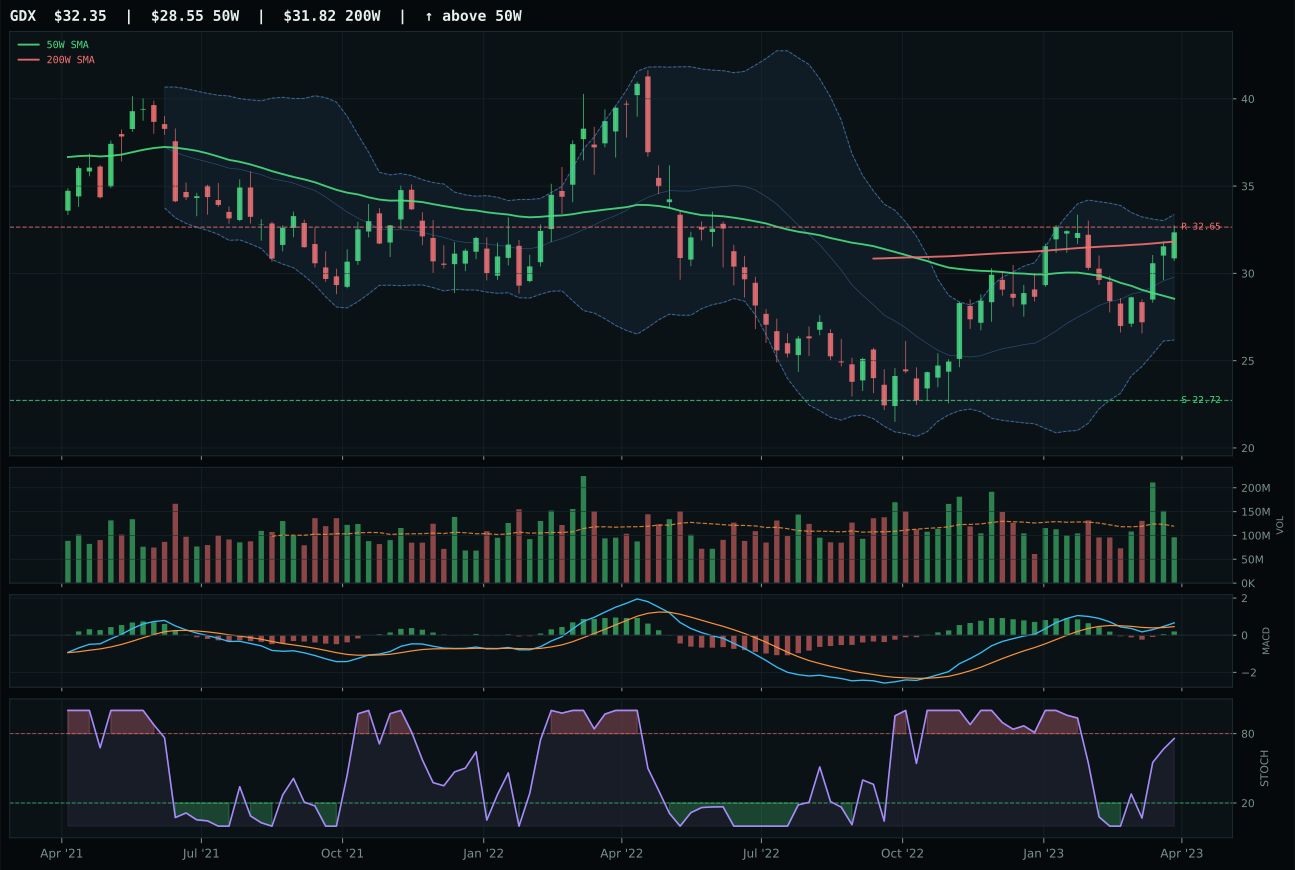
GDX has a neutral structure profile with 5.8% 13-week relative strength versus SPY.
A failed hold above support would weaken the setup.
Actionable but governed by invalidation levels.
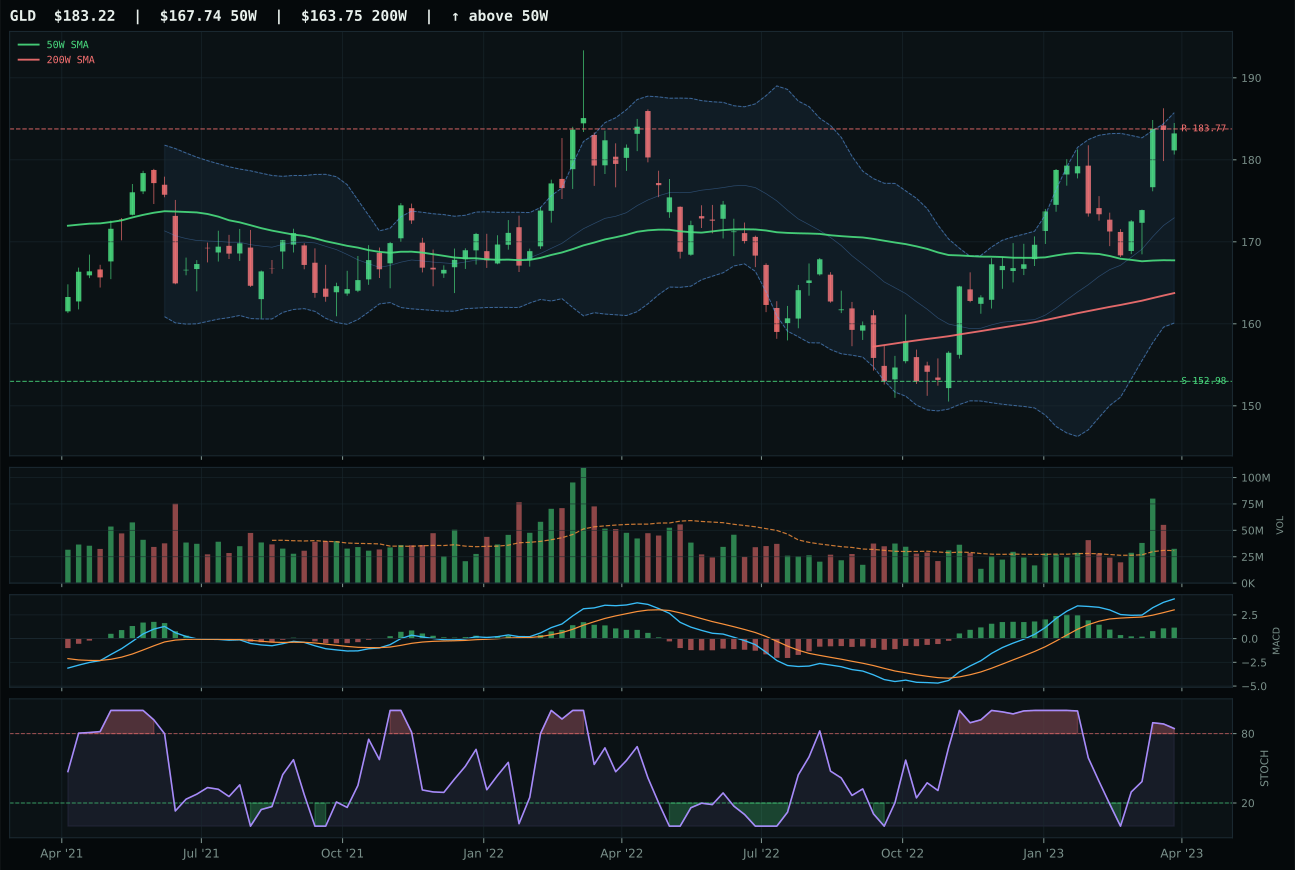
GLD has a neutral structure profile with 1.0% 13-week relative strength versus SPY.
A failed hold above support would weaken the setup.
Actionable but governed by invalidation levels.
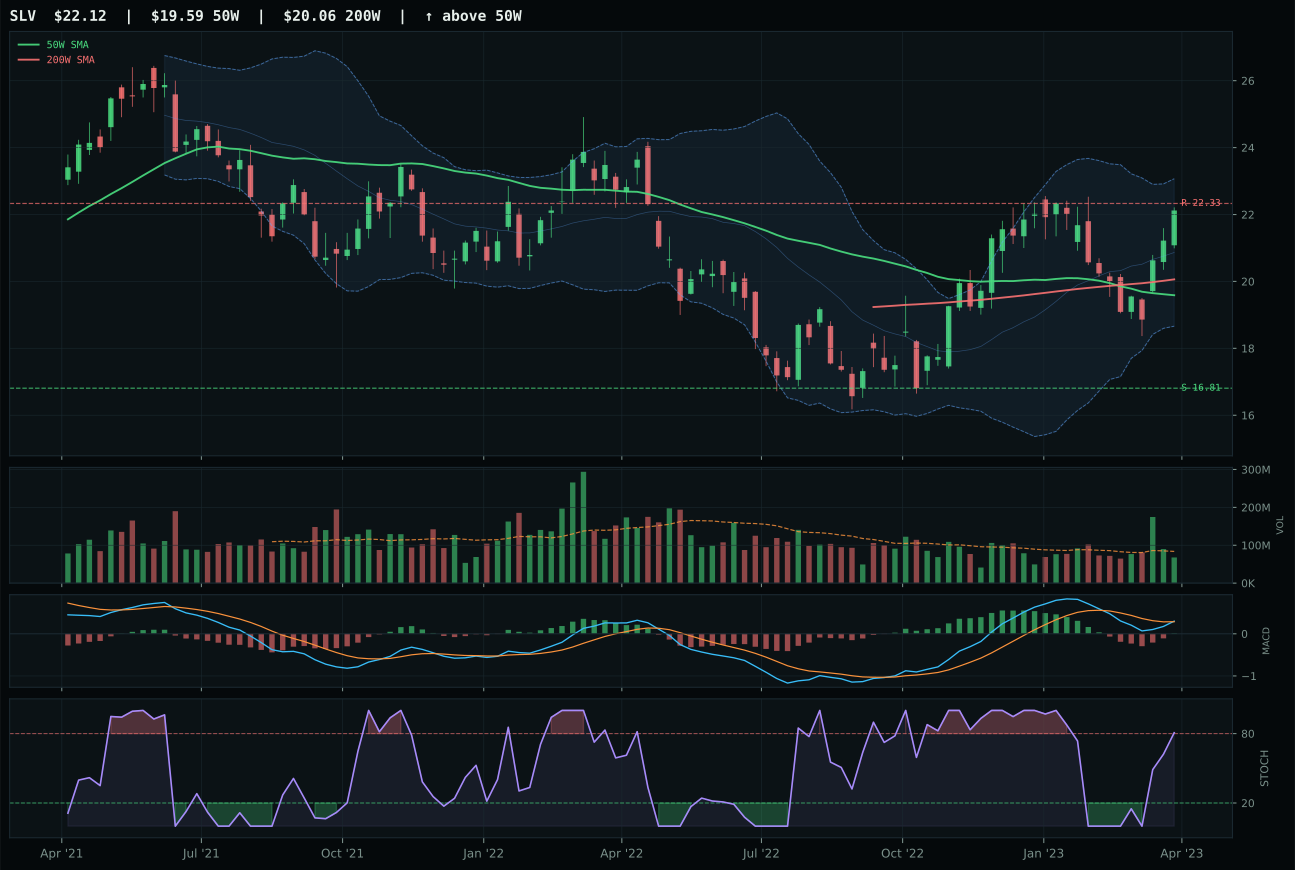
SLV has a neutral structure profile with -6.6% 13-week relative strength versus SPY.
A failed hold above support would weaken the setup.
Actionable but governed by invalidation levels.
GLD wins over GDX despite GDX's superior technical score (91.5 vs 76.5) because structure cleanliness and risk/reward asymmetry favor the bullion ETF over the miner leveraged play. GDX has stronger trend, momentum, and volume-price confirmation (79/100/79 respectively), but GLD's 70.5 structure score reflects tighter compression and more coherent support/resistance bands at 152.98/183.77. GLD's risk/reward of 37.3 (constrained upside, defined downside) loses on absolute asymmetry to GDX's 53, but GLD's 82.0 momentum confirmation (8.0% 13W return, bullish/improving MACD, neutral volume) signals sustained accumulation rather than a momentum vacuum. The macro fit tilts toward GLD: disinflation pressure (+8) favors gold as a monetary hedge more than miners, which are equity beta plays on gold prices. The 1.0% RS versus SPY tells investors that GLD is moving independently of the broad market—a cleaner hedge characteristic.
Precious Metals earns a 5% allocation as a tier-2 holding, with a 61.4 final score in a weak absolute sense but sufficient to hold a standard allocation in the Goldilocks regime. GLD's technical evidence is 76.5/100, driven by strong trend (91.4) and momentum confirmation (82.0), offset by thin risk/reward (37.3 from minimal upside at -0.3% to 183.77 resistance). Macro fit is 54.0/100—neutral territory—because disinflation pressure is active (+8) but risk appetite positive (-4) and liquidity expansion (-2) work against gold's appeal. In a Goldilocks environment, risk appetite does not demand a portfolio hedge, and gold's yield-free carry cost compounds the challenge. The category ranks tier-2 because it provides true diversification (negative correlation to equities in a stress regime) without requiring conviction. GLD's 1.0% RS versus SPY and neutral volume sponsorship suggest the category is being held for structural, not tactical, reasons. Maintain the position but do not add; any weakness below the 50W with volume confirmation would be a signal to reduce.
Industrial Metals — COPX
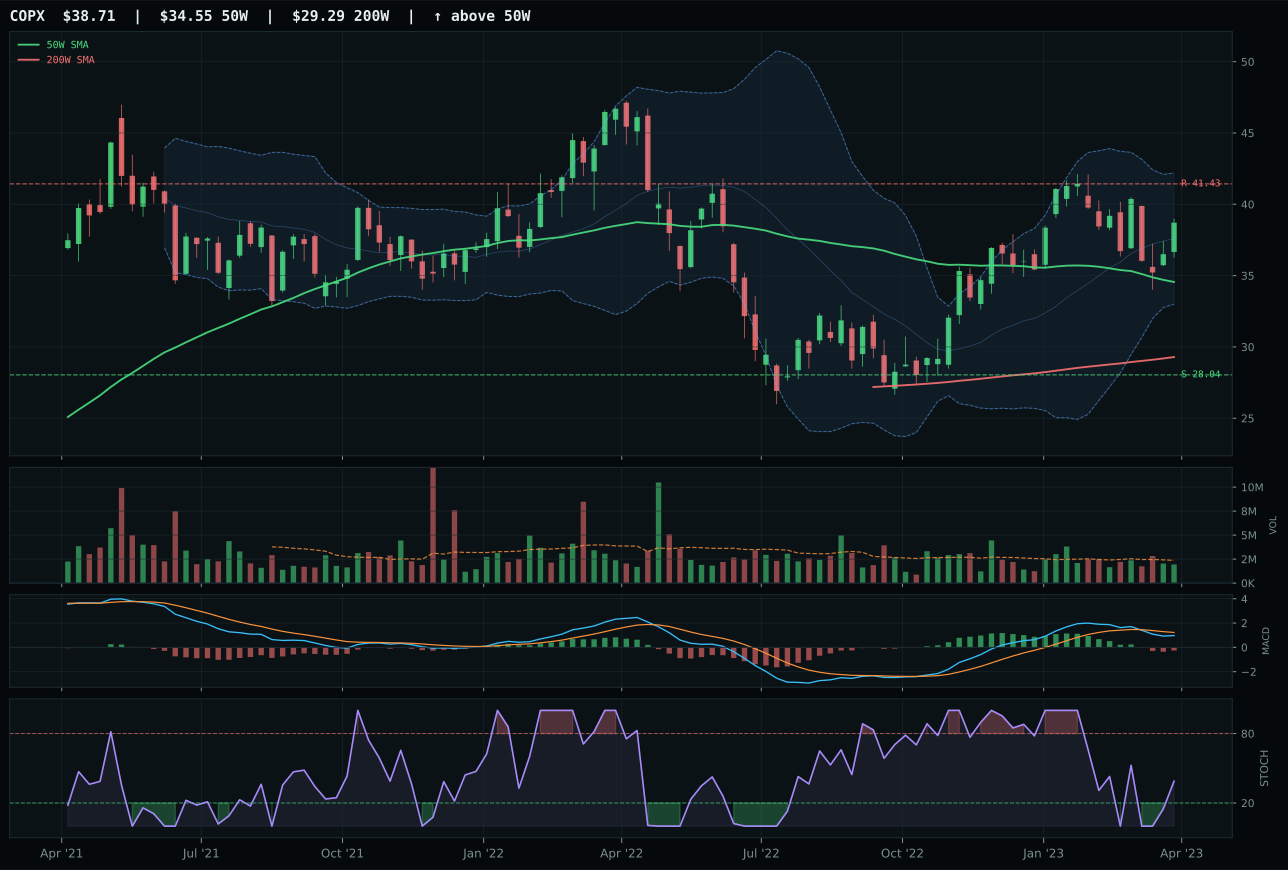
COPX has a neutral structure profile with 2.2% 13-week relative strength versus SPY.
A failed hold above support would weaken the setup.
Actionable but governed by invalidation levels.
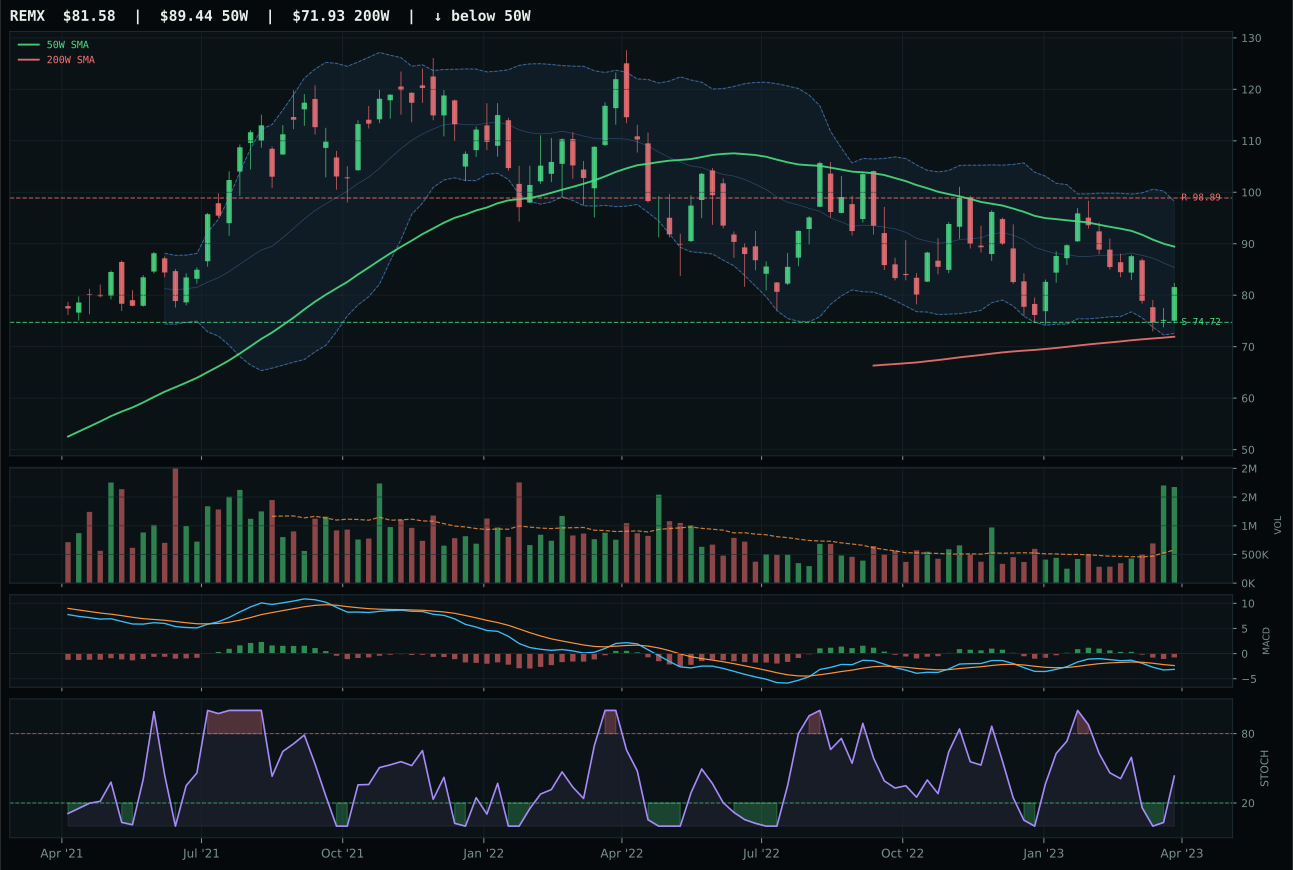
REMX has a neutral structure profile with 0.1% 13-week relative strength versus SPY.
A failed hold above support would weaken the setup.
Actionable but governed by invalidation levels.
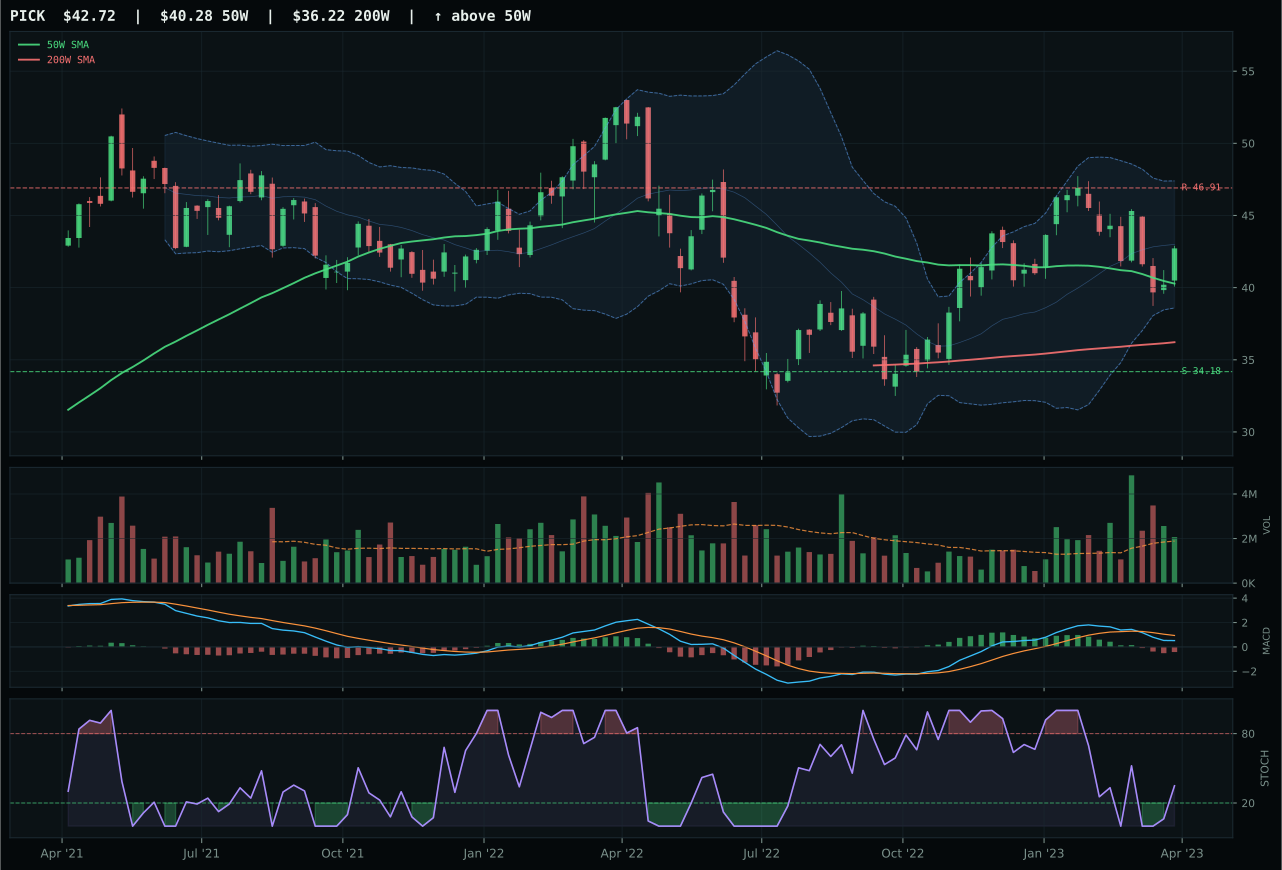
PICK has a neutral structure profile with -2.9% 13-week relative strength versus SPY.
A failed hold above support would weaken the setup.
Actionable but governed by invalidation levels.
COPX wins a clear category decision (16.1 points over REMX) because its balance of timing (85.0), trend (75.3), and category-relative strength (2.1%) delivers the most actionable setup at current levels. COPX sits 12% above the 50W in the middle retracement / decision zone, which is neither extended nor oversold, creating a zone where both new accumulation and tactical profit-taking can coexist. MACD is bearish/weakening, which normally would penalize momentum, but the 50W slope is negative and the stochastic RSI is rising mid-zone (0.39)—a textbook mean-reversion coil setup. REMX's volume score is superior (54 vs 48) with accumulation/confirmation present, but its timing score of 78 versus COPX's 85 reflects REMX's deeper position in the near-52W-low repair zone, which requires more patience. COPX's 9.3% 13W return and 2.2% SPY relative strength provide evidence that industrial demand (driven by AI compute buildout and clean-energy infrastructure) is sponsoring copper more than rare earths.
Industrial Metals earns a 5% allocation as a tier-2 holding with a 56.6 final score and 79.0 category-level macro fit, the strongest macro fit outside the top-2 categories. COPX's technical evidence is 51.0/100—modest but sufficient—because timing (85.0) and trend (75.3) are offset by thin momentum confirmation (43.9) and weak risk/reward (56.1 with only 38.1% downside to support against a constrained upside). The macro case is compelling: metals scarcity is active at +14 (the highest single descriptor bonus in the portfolio), commodity breadth positive at +10, and real asset sponsorship at +6. These three active descriptors directly favor copper's scarcity narrative in a Goldilocks regime where infrastructure buildout (EV, data centers, power grids) drives demand. Disinflation pressure (-8) is present but overwhelmed by scarcity and commodity breadth. The portfolio carries this allocation because the macro sponsorship is rare and durable—metals scarcity does not reverse on calendar days. Any breakdown below the 50W with volume would be a sell signal, but the current position balances Goldilocks macro alignment with neutral technical setup risk.
Emerging Markets — IEMG
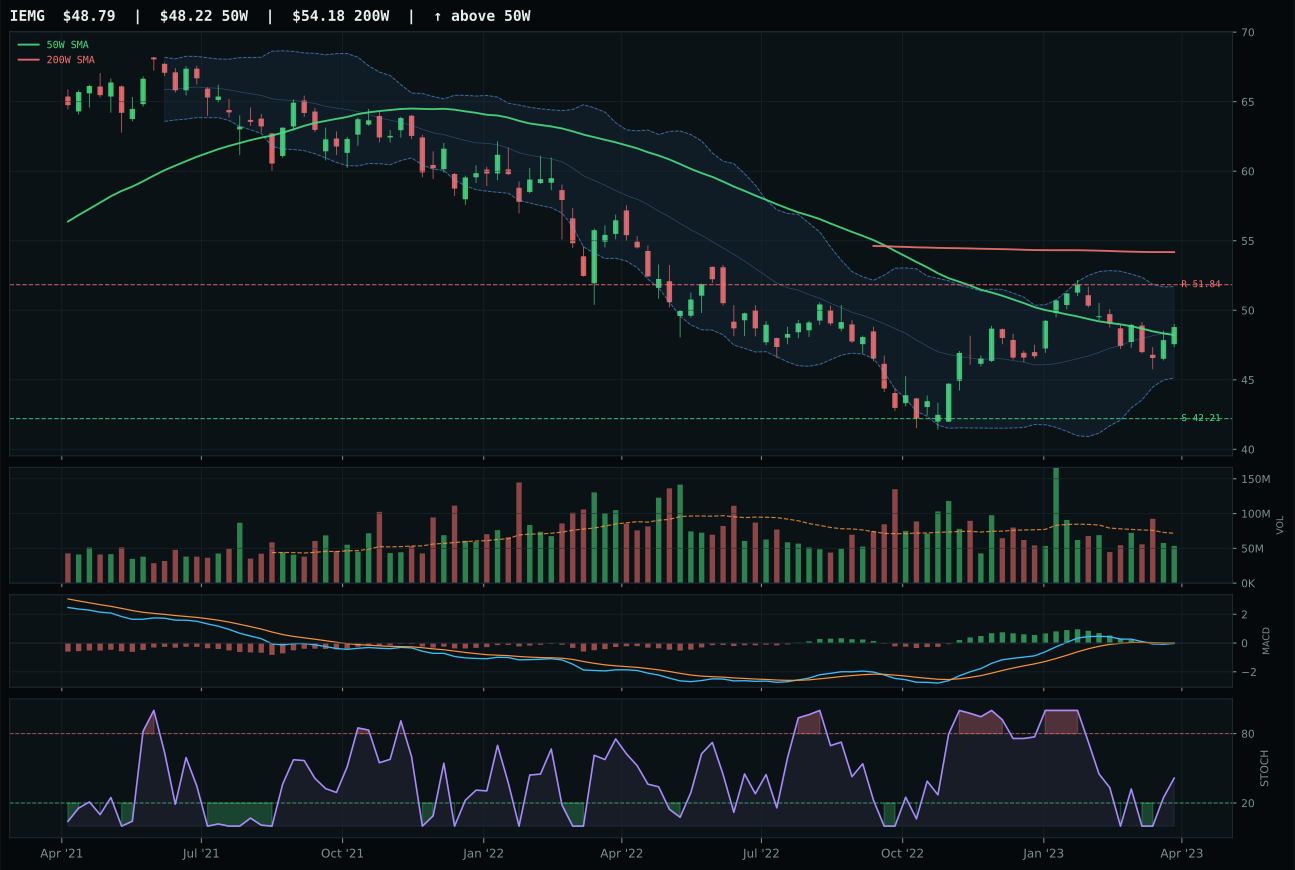
IEMG has a compression near 50W profile with -2.6% 13-week relative strength versus SPY.
A failed hold above support would weaken the setup.
Actionable but governed by invalidation levels.
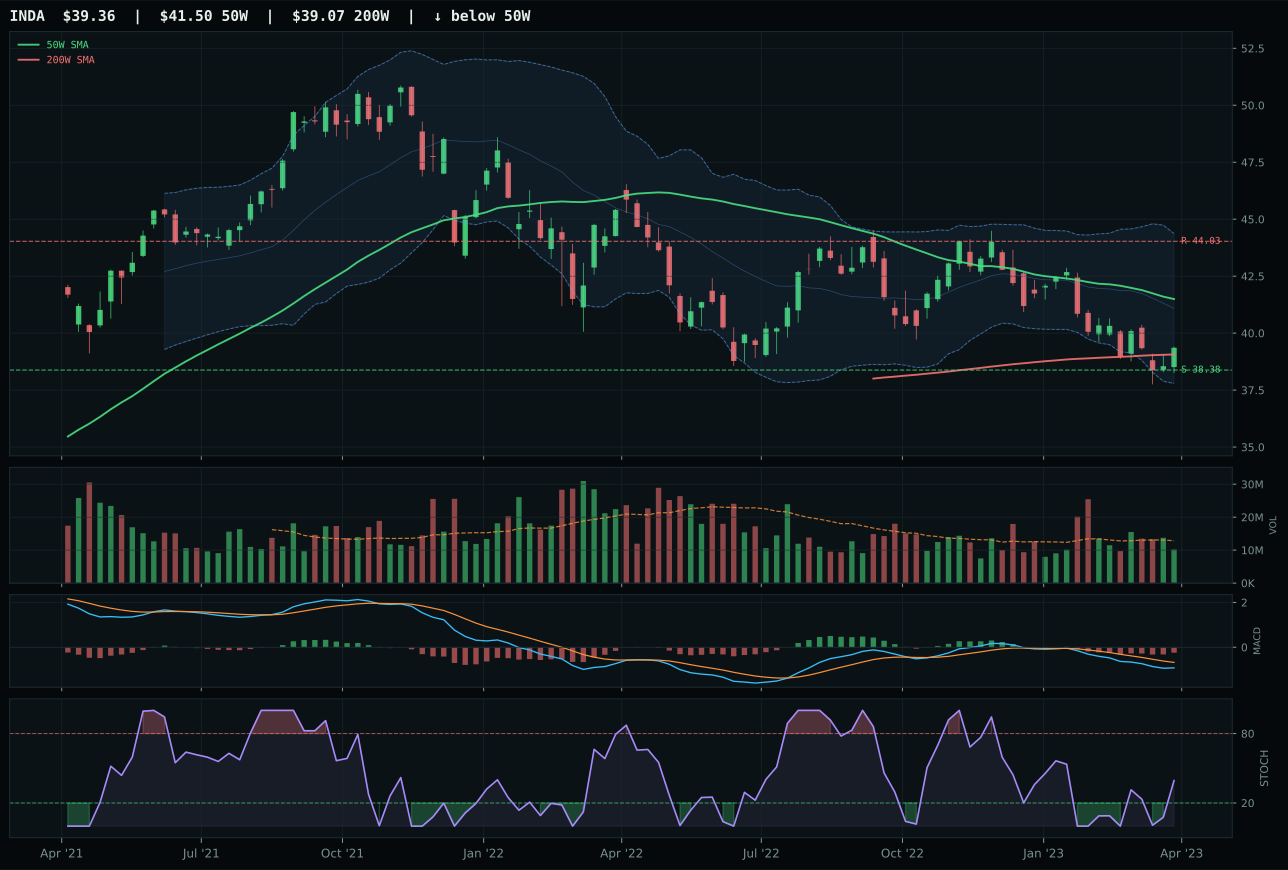
INDA has a pullback into support profile with -12.8% 13-week relative strength versus SPY.
A failed hold above support would weaken the setup.
Actionable but governed by invalidation levels.
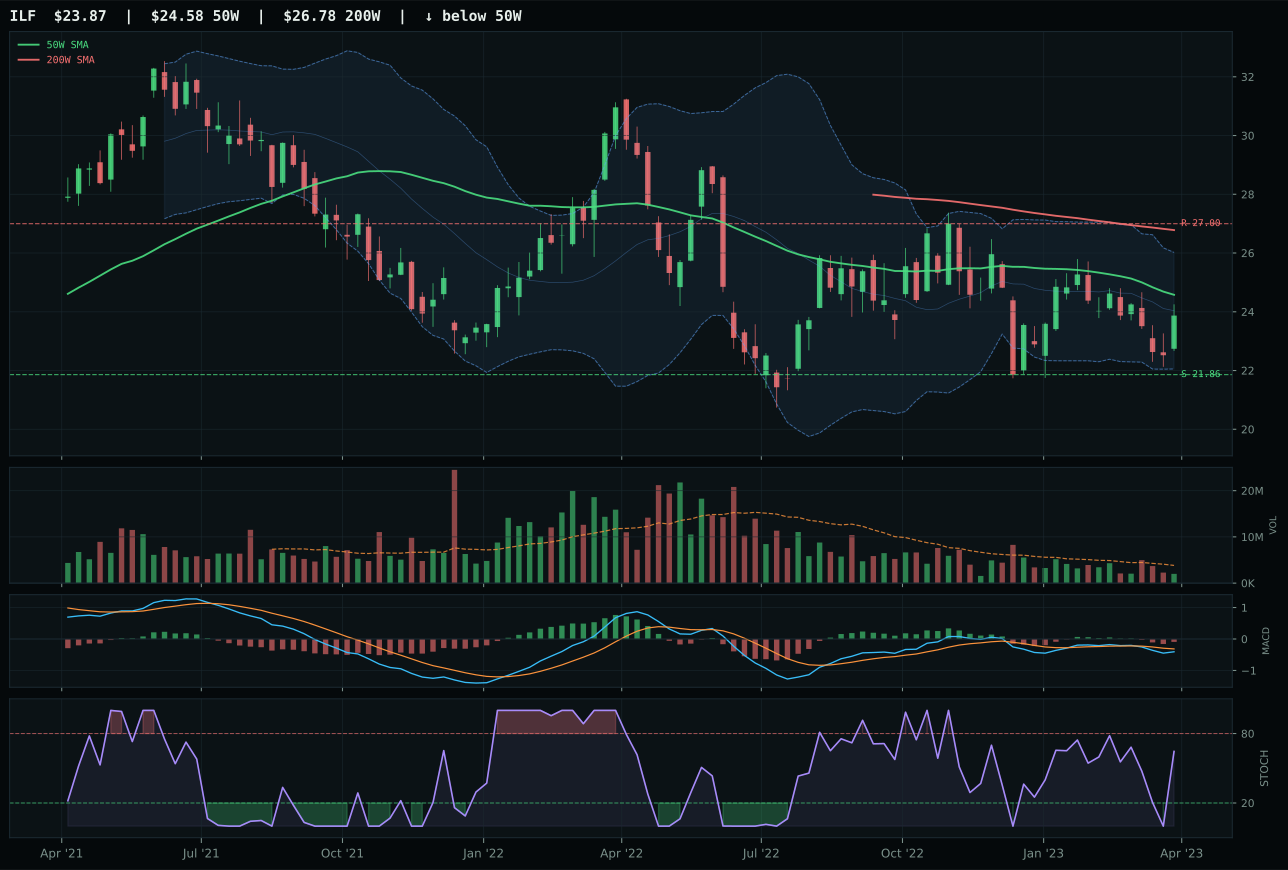
ILF has a compression near 50W profile with -2.8% 13-week relative strength versus SPY.
Extension and support failure are the main tactical risks.
Tracked, but not top-2 eligible because: structurally broken.
IEMG wins a clean decision over INDA (8.5 points) because broad emerging-market beta at compression near the 50W is more actionable than India-focused quality exposure that sits in deep pullback (13W return -5.7%, -12.8% RS versus SPY). IEMG trades 1.2% above the 50W with a timing score of 100.0—perfect positioning at the middle retracement zone (Fib 0.500 at 49.48). MACD is bearish/weakening across both tickers, but IEMG's thin volume (0.75x 20W) at least is neutral, while INDA's structure is pullback into support with lower recovery conviction. IEMG's 4.5% 13W return and -2.6% RS versus SPY suggest the broad basket is stabilizing while India-specific plays are still capitulating. Category-relative strength at 0.2% for IEMG versus -10.0% for INDA is the decisive metric: IEMG is holding relative parity within its basket while INDA is being actively sold. Risk/reward for IEMG is 59.8 (upside -5.9%, downside 15.6%—a mild asymmetry) versus INDA's 90.0 (inverted—much cheaper on entry but risk of extended decline).
Emerging Markets earns a 5% allocation as a tier-2 holding with a 45.9 final score and 78.0 category-level macro fit, one of the strongest macro fits in the tier-2 cohort. IEMG's technical evidence is 44.4/100—mediocre on absolute basis—but the macro sponsorship is acute. Emerging-market liquidity support is active at +14 (the single strongest EM-specific descriptor), liquidity expansion at +8, risk appetite positive at +8. Disinflation pressure (-8) and credit stress (-10) are headwinds, but the net macro fit of 78.0 reflects EM-specific strength relative to the Goldilocks environment. IEMG sits at perfect timing (100.0) in the middle retracement zone with compression near the 50W, creating a coherent mean-reversion setup. The momentum confirmation is weak (30.4) because the 13W return is only 4.5% and the -2.6% RS versus SPY shows EM is lagging developed markets. However, the macro setup—where EM liquidity support (+14) is the dominant active descriptor—argues this lagging will reverse once risk appetite triggers. Carry this position and use any break above the 23.14 resistance as a signal to add; if risk appetite implodes (credit stress worsens), exit immediately.
Defense & Aerospace — ITA
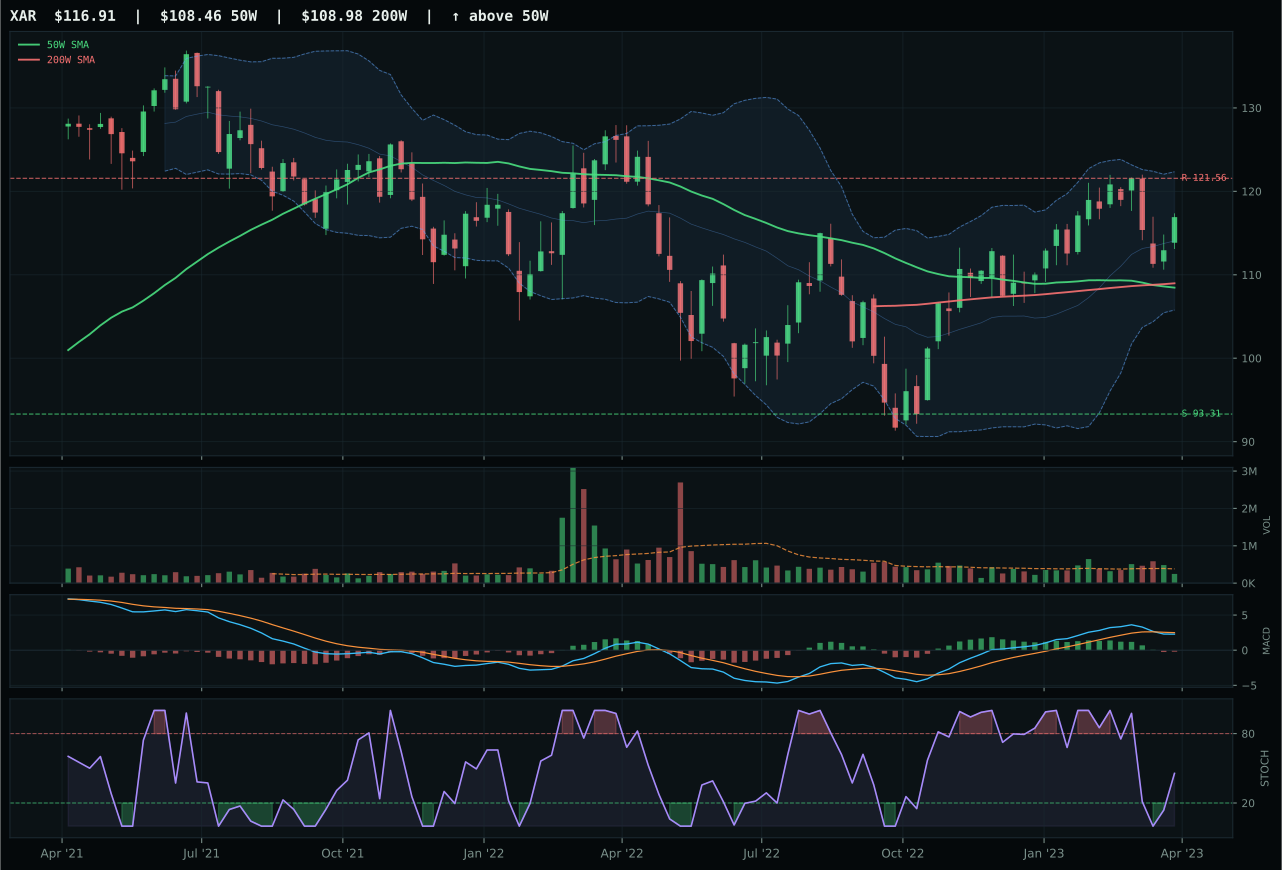
XAR has a neutral structure profile with -0.8% 13-week relative strength versus SPY.
A failed hold above support would weaken the setup.
Actionable but governed by invalidation levels.
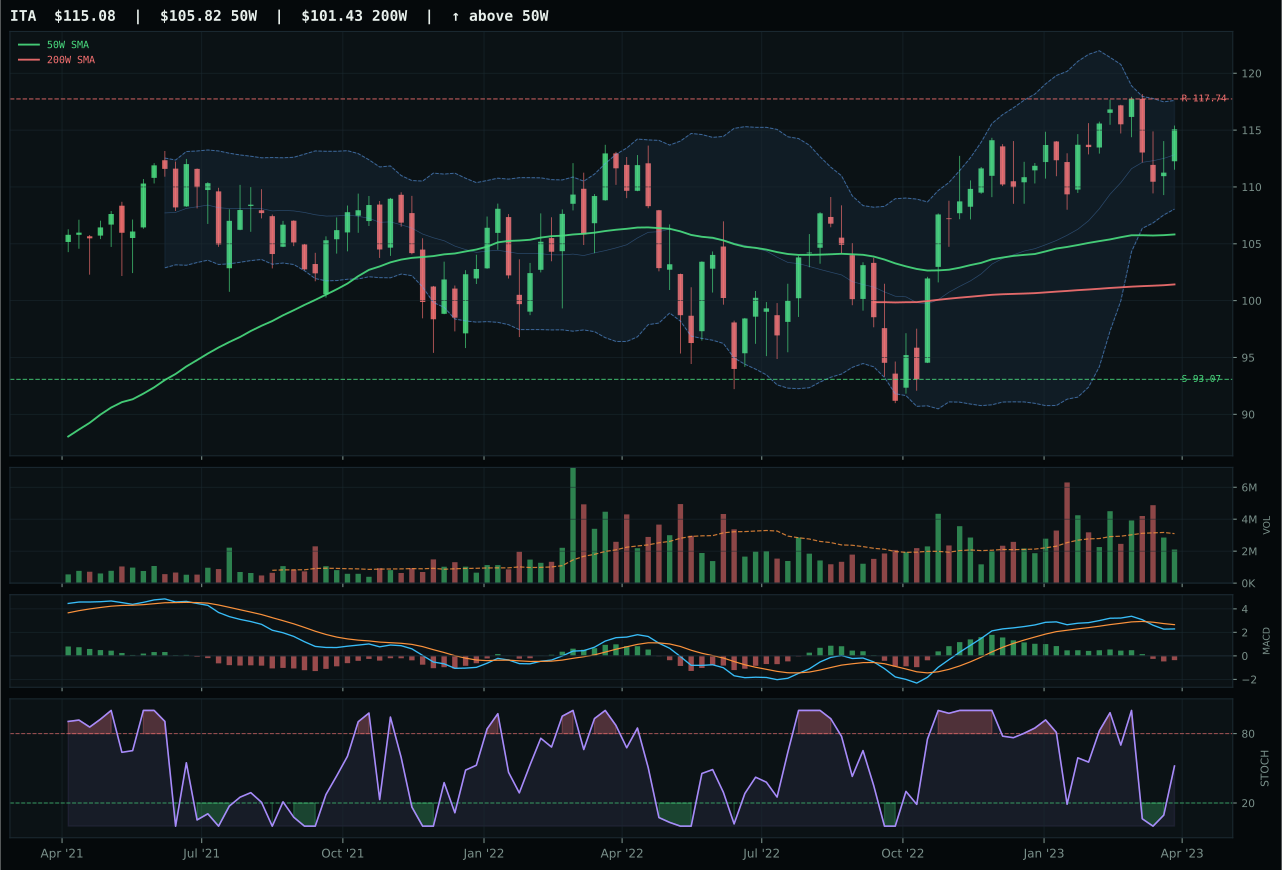
ITA has a neutral structure profile with -4.2% 13-week relative strength versus SPY.
A failed hold above support would weaken the setup.
Actionable but governed by invalidation levels.
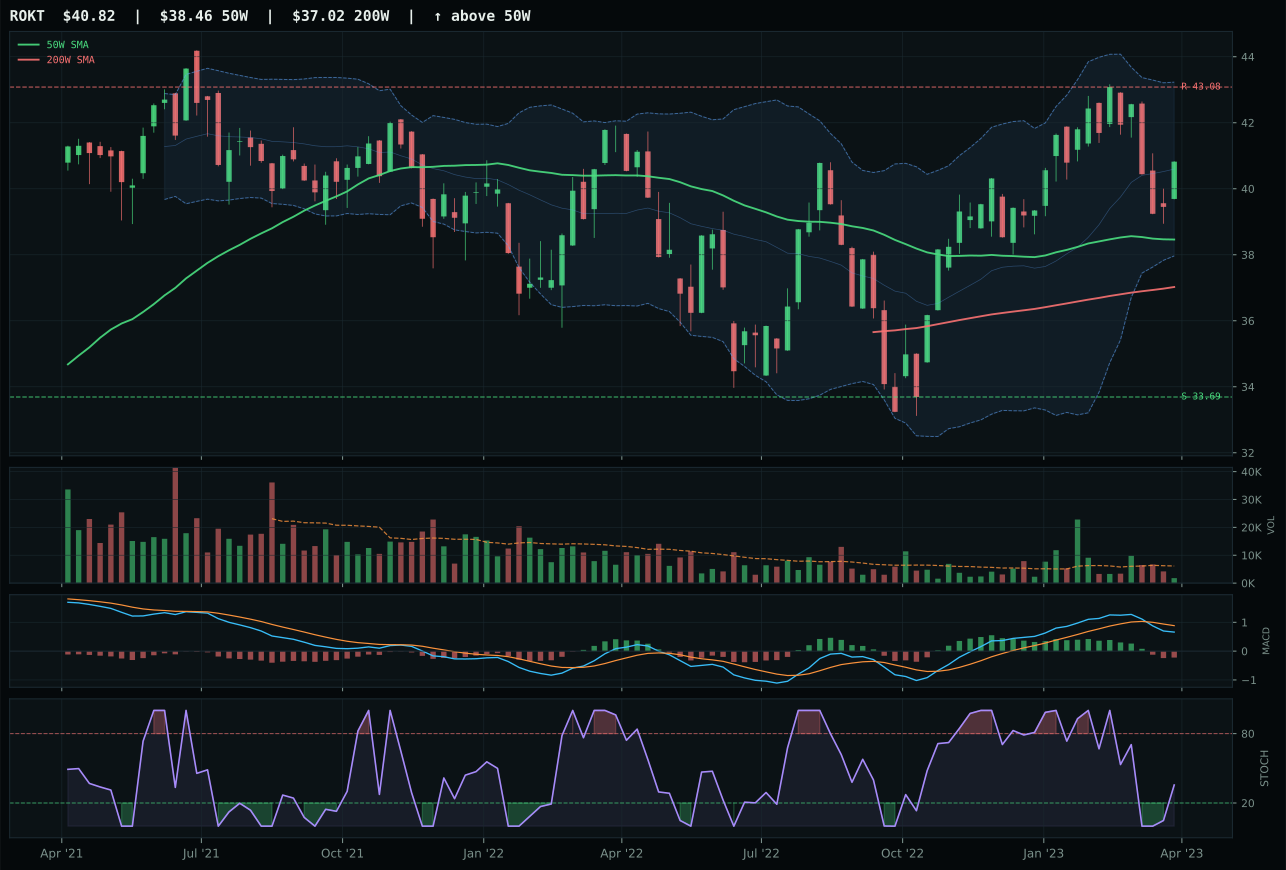
ROKT has a neutral structure profile with -3.3% 13-week relative strength versus SPY.
A failed hold above support would weaken the setup.
Tracked, but not top-2 eligible because: .
ITA wins a narrow decision over XAR—separated by just 0.5 points—because its technical evidence blend of trend (75.7), structure (70.6), and timing (78.0) combines to deliver slightly better risk/reward (46.7 vs 48.0 for XAR) without the illusion of momentum. Both charts show price above 50W and 200W but with bearish/weakening MACD and thin volume participation. ITA's 13W return of 2.9% and category-relative strength of -0.9% tell the story: this is a lagging category within a lagging setup. The setup is neutral structure compressing near support at 93.07, which provides a defined risk zone. XAR has slightly better SPY-relative strength at -0.8% versus -4.2%, but ITA wins on the durability of its structure measurement and the tightness of its Fibonacci zone (upper retracement at 111.74) versus XAR's wider band. This is a weak category decision, not a strong one.
Defense & Aerospace receives a 5% allocation as a tier-2 holding, ranked below the top-2 overweights. The 38.5 final category score reflects weak technical evidence (38.6/100 for ITA) paired with neutral macro fit (50.0) in a Goldilocks regime that does not require defensive crowding. ITA's momentum confirmation is only 21.1/100—negative 13W return, negative SPY relative strength, weak MACD—all signaling that defense is in repair mode, not accumulation. The category macro fit does not benefit from active descriptors; no strong sponsor among the six active checklist items. Disinflation pressure and credit stress are the only micro-movers, and they net out to neutral. The portfolio carries this slot because tier-2 allocations in a normal week are standard practice, but the message is clear: defense is not a conviction hold. A move above 50W with bullish MACD and volume confirmation would be the baseline threshold to elevate this category upward.
Utilities & Infrastructure — XLU
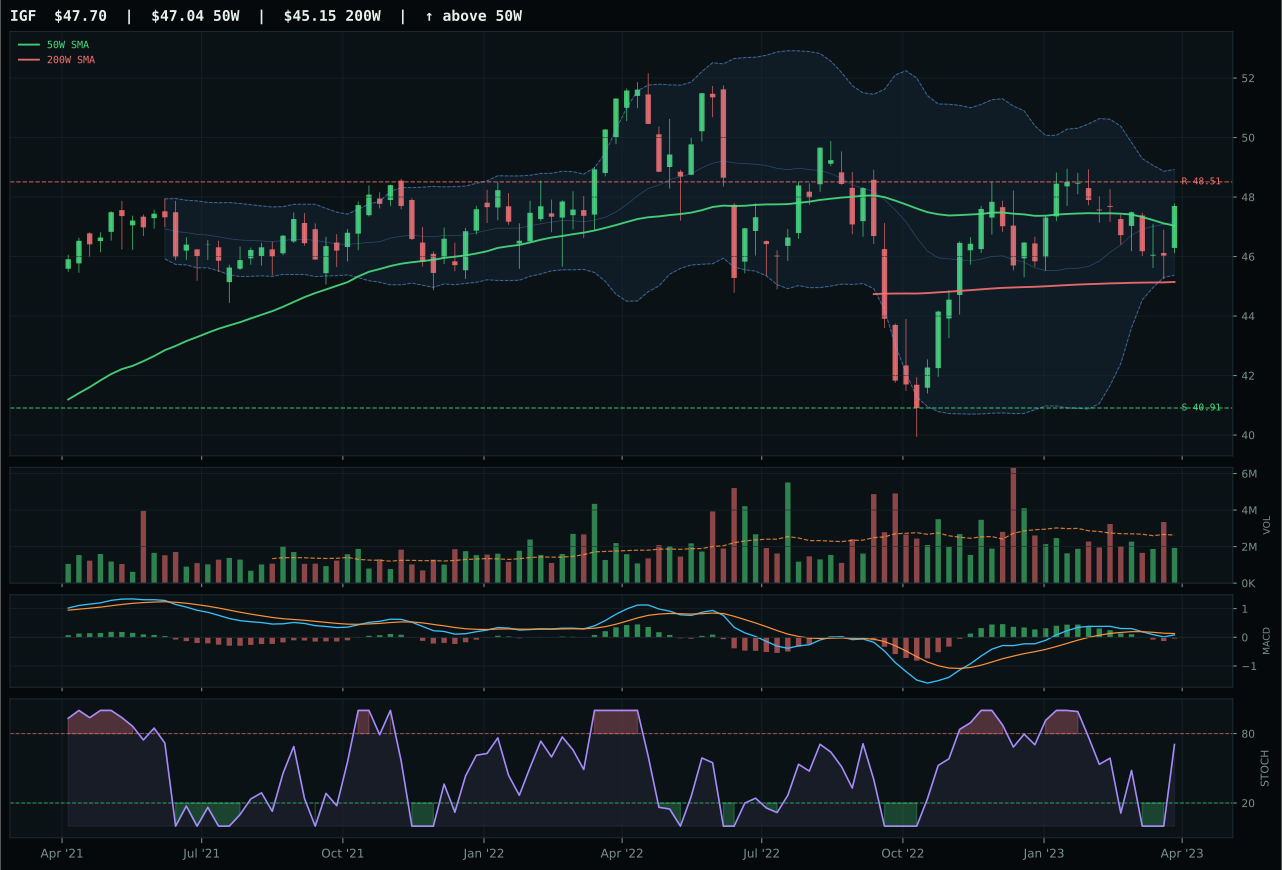
IGF has a compression near 50W profile with -3.0% 13-week relative strength versus SPY.
A failed hold above support would weaken the setup.
Actionable but governed by invalidation levels.
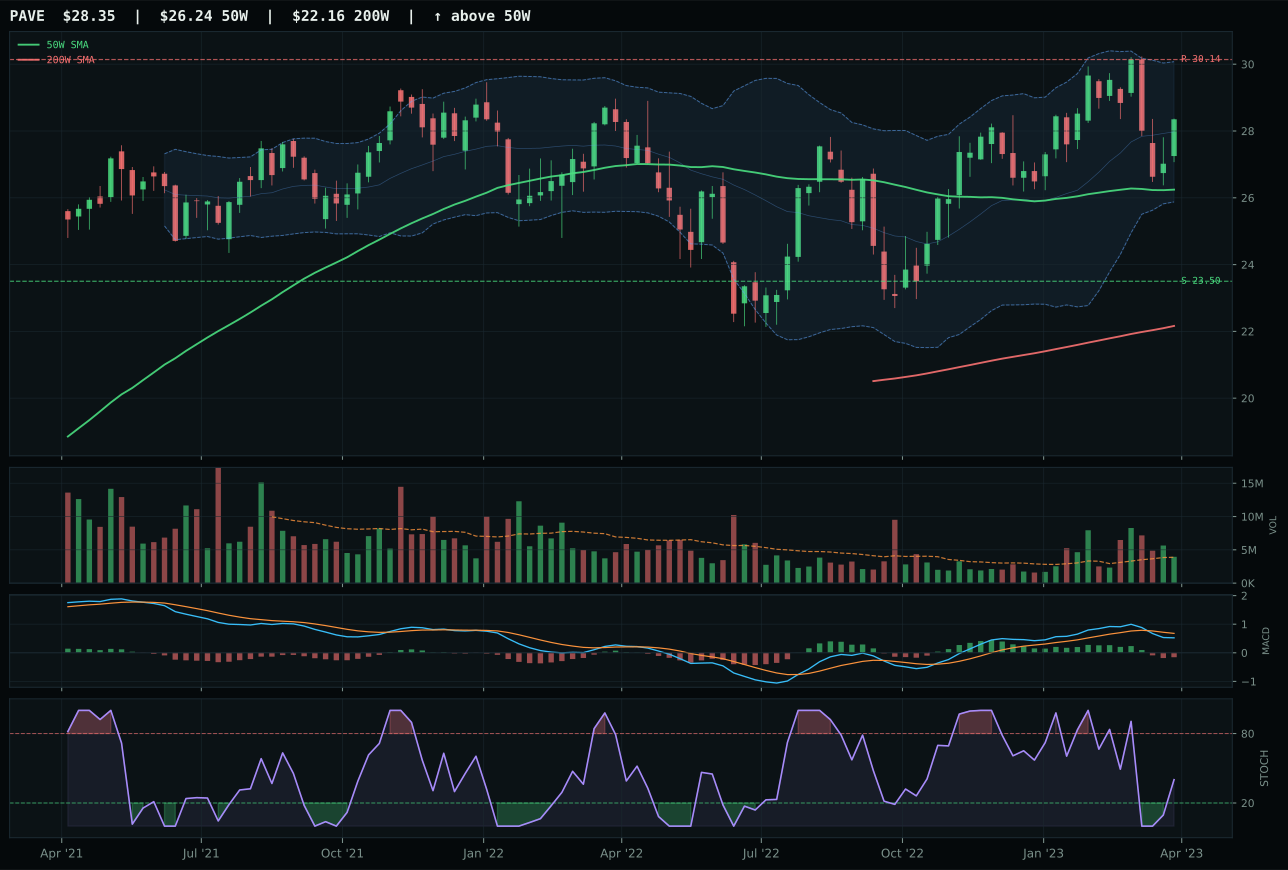
PAVE has a neutral structure profile with -0.0% 13-week relative strength versus SPY.
A failed hold above support would weaken the setup.
Actionable but governed by invalidation levels.
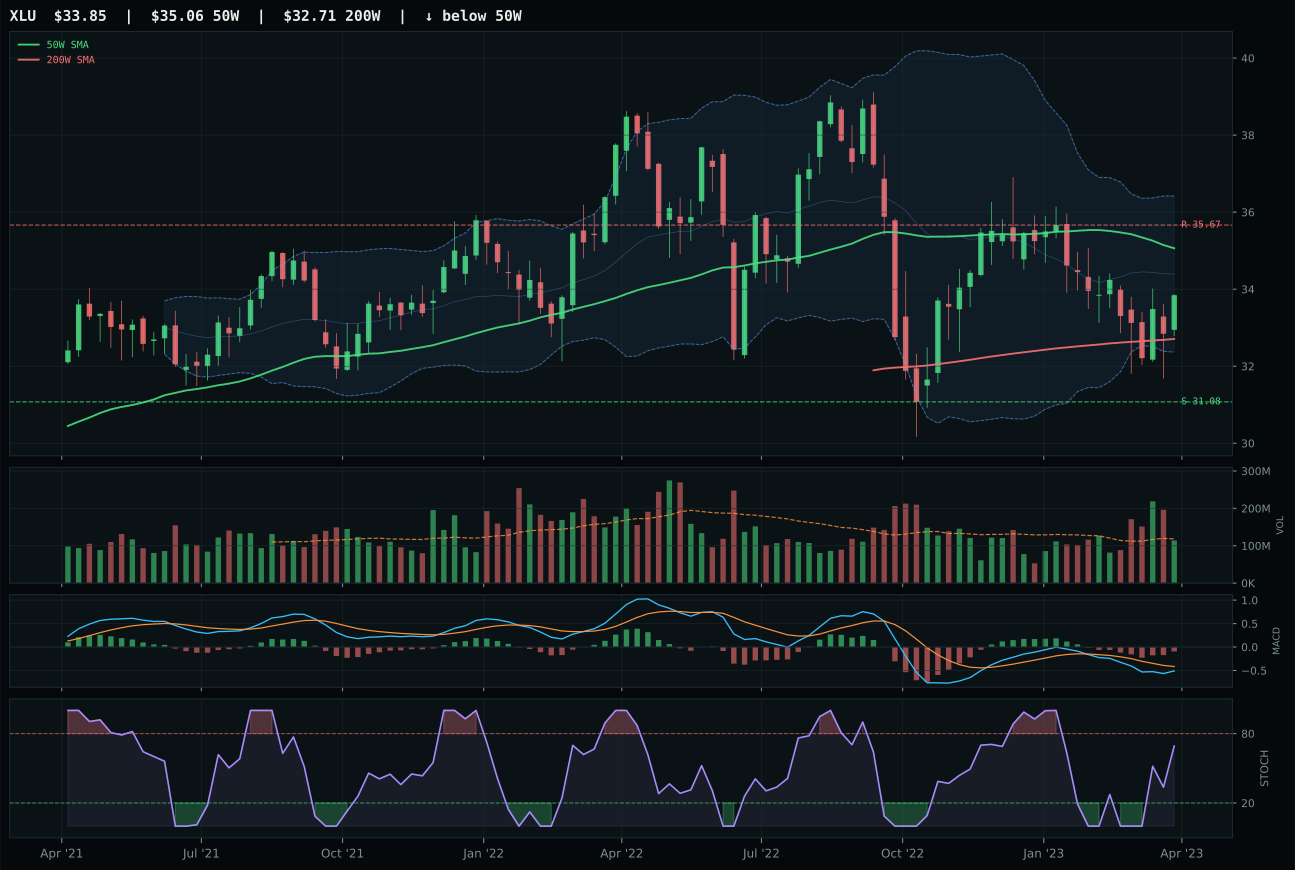
XLU has a neutral structure profile with -11.0% 13-week relative strength versus SPY.
A failed hold above support would weaken the setup.
Actionable but governed by invalidation levels.
XLU wins a close decision over PAVE (-20.8 points, a very wide gap indicating a weak category) because its timing is perfect (100.0) and its macro macro fit for a defensive sector is straightforward in a Goldilocks regime. XLU trades -3.5% below the 50W in the middle retracement zone (Fib 0.618 at 33.59) with MACD bearish but improving—a mean-reversion setup with emerging confirmation. PAVE and IGF both have better absolute technical scores (67 and 68 respectively), but their structures are less clean and their volume sponsorship is thin. PAVE's -0.0% RS versus SPY looks neutral but its trend score of 82 suggests it is riding broader market momentum, not independent strength. IGF's compression near 50W delivers a 100.0 timing score but its risk/reward (46.8) is constrained and its cleanliness (33.3) is poor. XLU's 63.3 risk/reward and 66.5 structure—built on 79.7% compression—provides the most defined setup. The -4.0% 13W return and -11.0% RS versus SPY are genuine weaknesses, but they reflect defensive sector underperformance in a risk-on regime, not structural deterioration.
Utilities & Infrastructure earns a 5% allocation as a tier-2 holding with a 38.3 final score and 58.0 category-level macro fit. XLU's technical evidence is 27.9/100—the weakest technical foundation among all tier-2 holdings—but it earns allocation because the timing is flawless (100.0) and macro fit is coherent. Disinflation pressure is active (+6), supporting regulated utility valuations through lower discount rates. The category receives the lowest technical evidence score among tier-2 holdings because momentum confirmation is 21.5/100 (negative 13W return, negative SPY relative strength, category-relative weakness) and volume-price confirmation is thin. However, Goldilocks regime (+4 transition/mixed boost) favors defensive structures precisely because there is no volatility forcing rotation into equities. Risk appetite positive is present but tempered (-2), meaning defensive utility stocks are not being punished but not celebrated either. Carry this as a structural portfolio ballast: if SPY breaks below its 200W or credit stress worsens, XLU becomes a flight-to-quality holding. Until such a catalyst, this is a carry position that offsets concentration in technology and AI. Reduce on strength above the 35.67 resistance with volume confirmation.
Nuclear Energy — URA
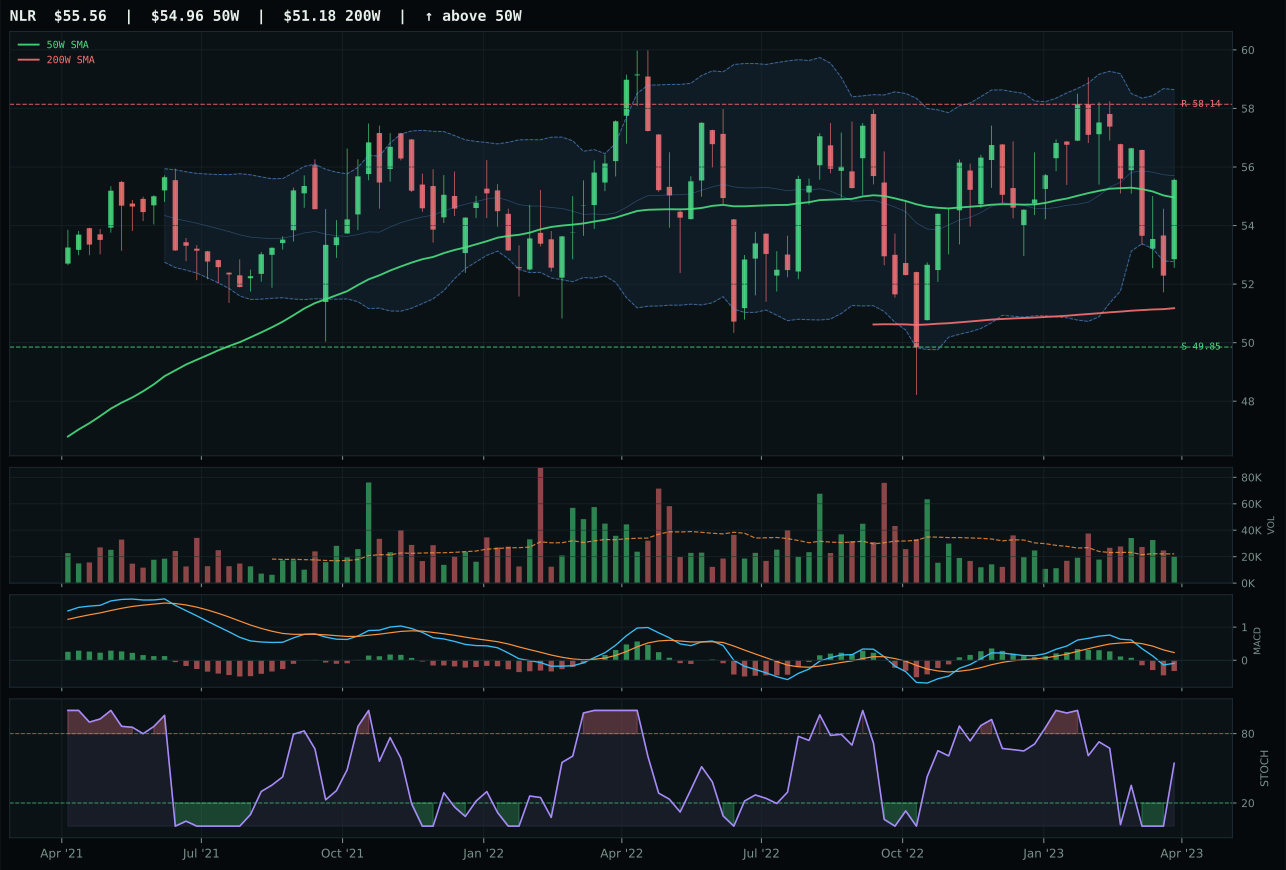
NLR has a compression near 50W profile with -5.8% 13-week relative strength versus SPY.
A failed hold above support would weaken the setup.
Tracked, but not top-2 eligible because: .
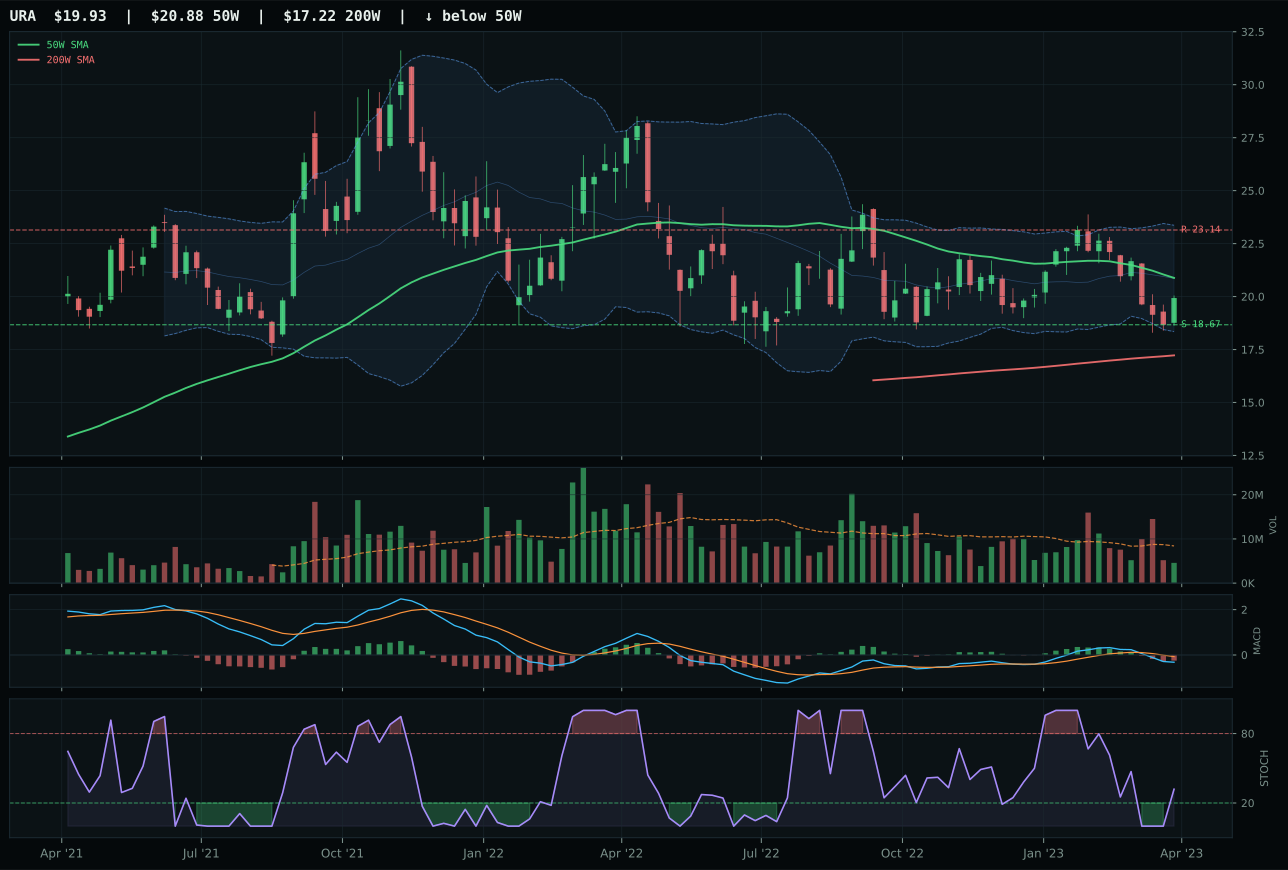
URA has a neutral structure profile with -7.8% 13-week relative strength versus SPY.
A failed hold above support would weaken the setup.
Actionable but governed by invalidation levels.
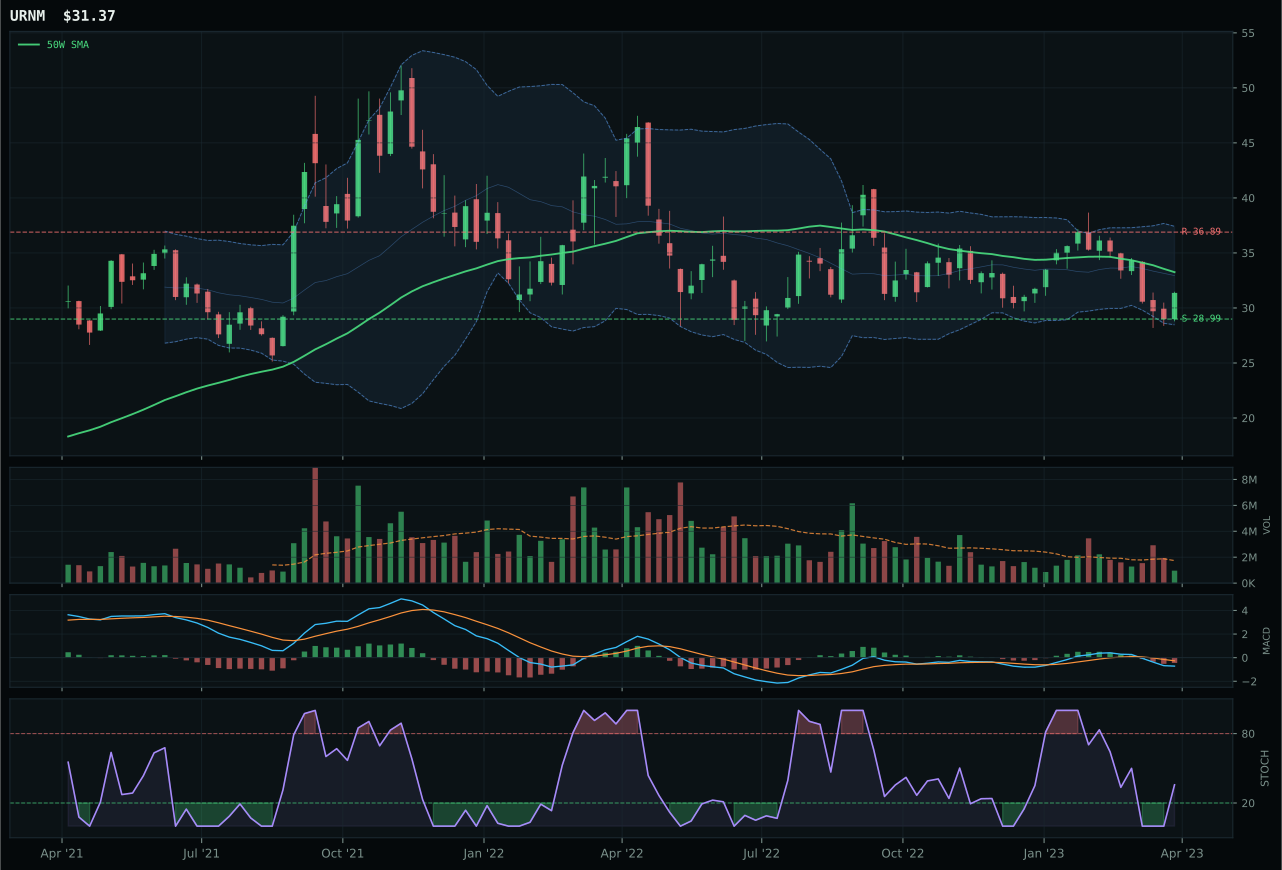
URNM has a neutral structure profile with -8.2% 13-week relative strength versus SPY.
A failed hold above support would weaken the setup.
Actionable but governed by invalidation levels.
URA wins by 11.0 points over NLR despite inferior technical evidence (31.9 vs 45.0) because its risk/reward setup is superior and its pullback structure offers a cleaner entry frame. URA is -4.6% below the 50W, sitting in the near-52W-low repair zone near Fib 0.786 at 19.97, with downside to support at only 6.7% against upside to resistance constrained at -13.9%. This asymmetry, combined with a timing score of 93.0, creates a coherent mean-reversion opportunity. NLR's compression near the 50W looks tighter (timing 100.0) but the structure is less clean (66.8 vs 66.8—they tie, actually, but NLR's risk/reward is 52.0 versus URA's 82.0, the real separator). URA's 13W return of -0.7% and -7.8% RS versus SPY tell the story of sustained underperformance, which creates capitulation setup geometry. NLR's 1.2% 13W return suggests it has held up slightly better, which paradoxically makes it less attractive for mean-reversion trading. URA's thin volume (0.54x 20W) is a weakness, but the downside risk is so limited that fresh accumulation would only increase conviction.
Nuclear Energy earns a 5% allocation as a tier-2 holding with a 34.4 final score and 57.0 category-level macro fit. URA's technical evidence is 31.9/100—poor absolute quality—but the portfolio carries this position because the risk/reward is coherent and macro sponsorship exists. Real asset sponsorship is active (+7) and AI growth sponsorship (+5, driven by power-intensive data center demand) offset credit stress (-5). The macro narrative here is specific: AI compute buildout requires massive power infrastructure, and nuclear is the only scalable zero-carbon baseload option. URA is -4.6% from the 50W and -0.7% on a 13W return, making it structurally the most beaten-down category in the portfolio. Timing score of 93.0 reflects near-support proximity and a repair-zone Fib location. The category rank and allocation reflect a Goldilocks macro fit with limited upside convolution: if AI power demand sustains, nuclear energy benefits. If AI capex disappoints, the position loses its thesis. This is not a conviction overweight but rather a thematic holding; reduce aggressively if XLE breaks below support or if AI-related semiconductor demand falters.
Agriculture & Livestock — WEAT
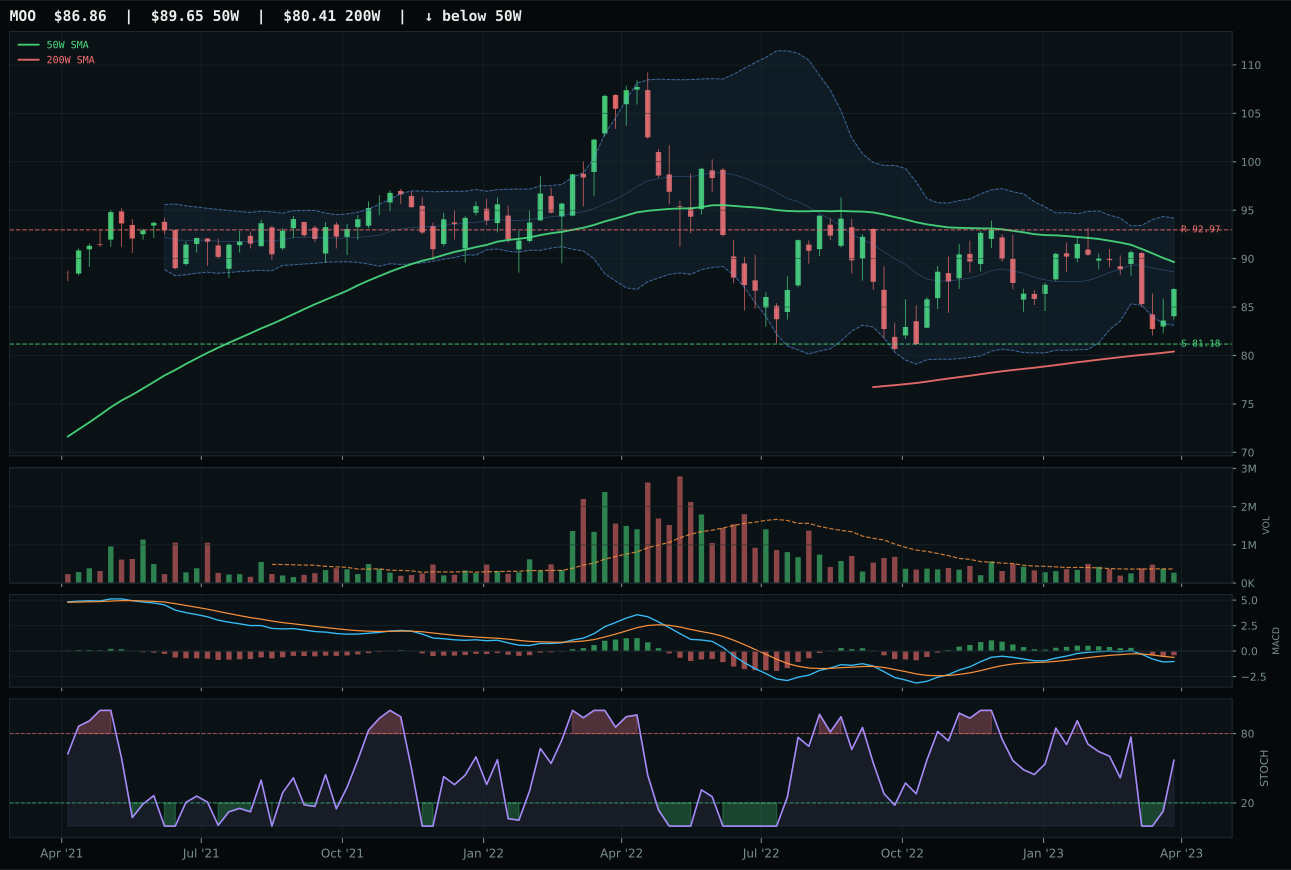
MOO has a neutral structure profile with -5.9% 13-week relative strength versus SPY.
A failed hold above support would weaken the setup.
Actionable but governed by invalidation levels.
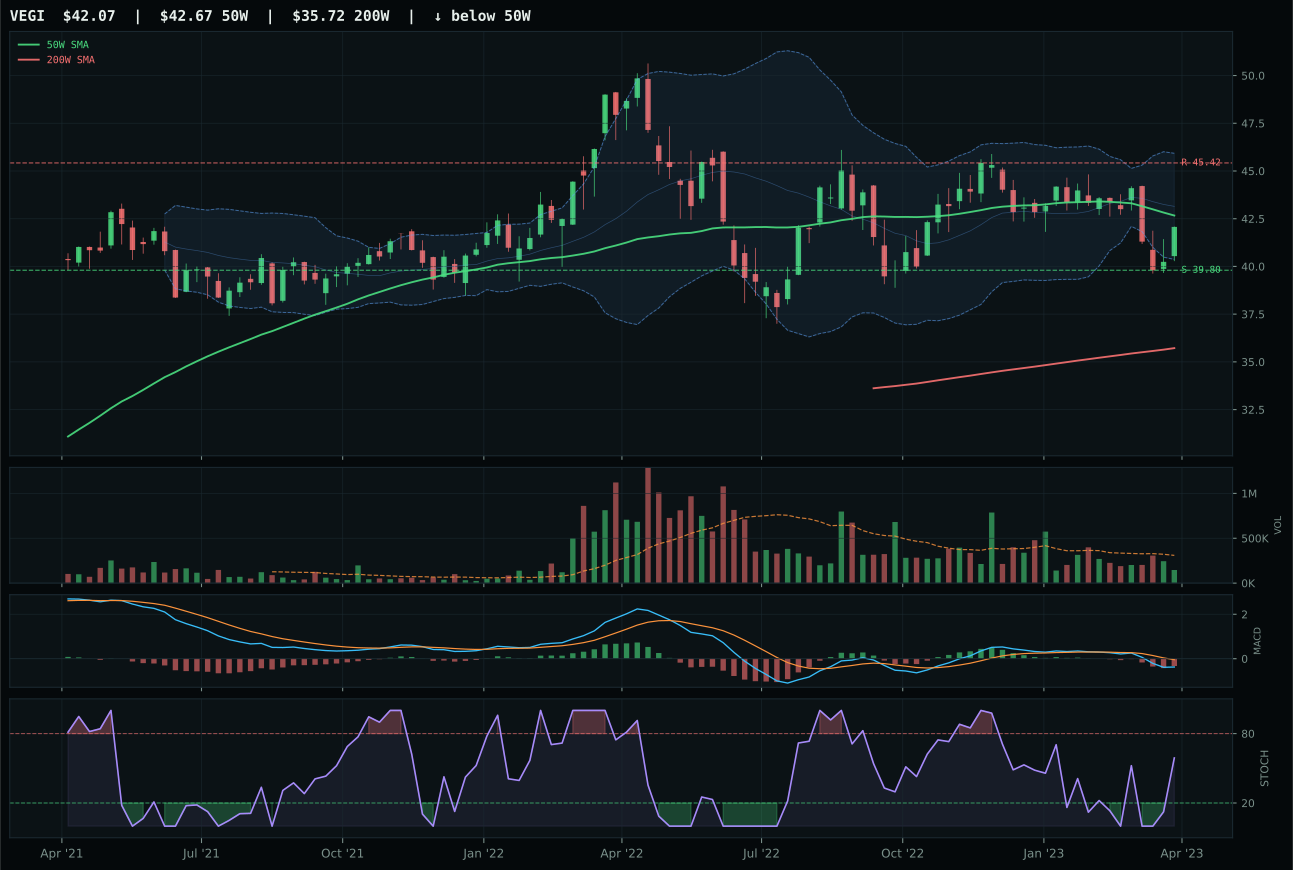
VEGI has a compression near 50W profile with -8.9% 13-week relative strength versus SPY.
A failed hold above support would weaken the setup.
Actionable but governed by invalidation levels.
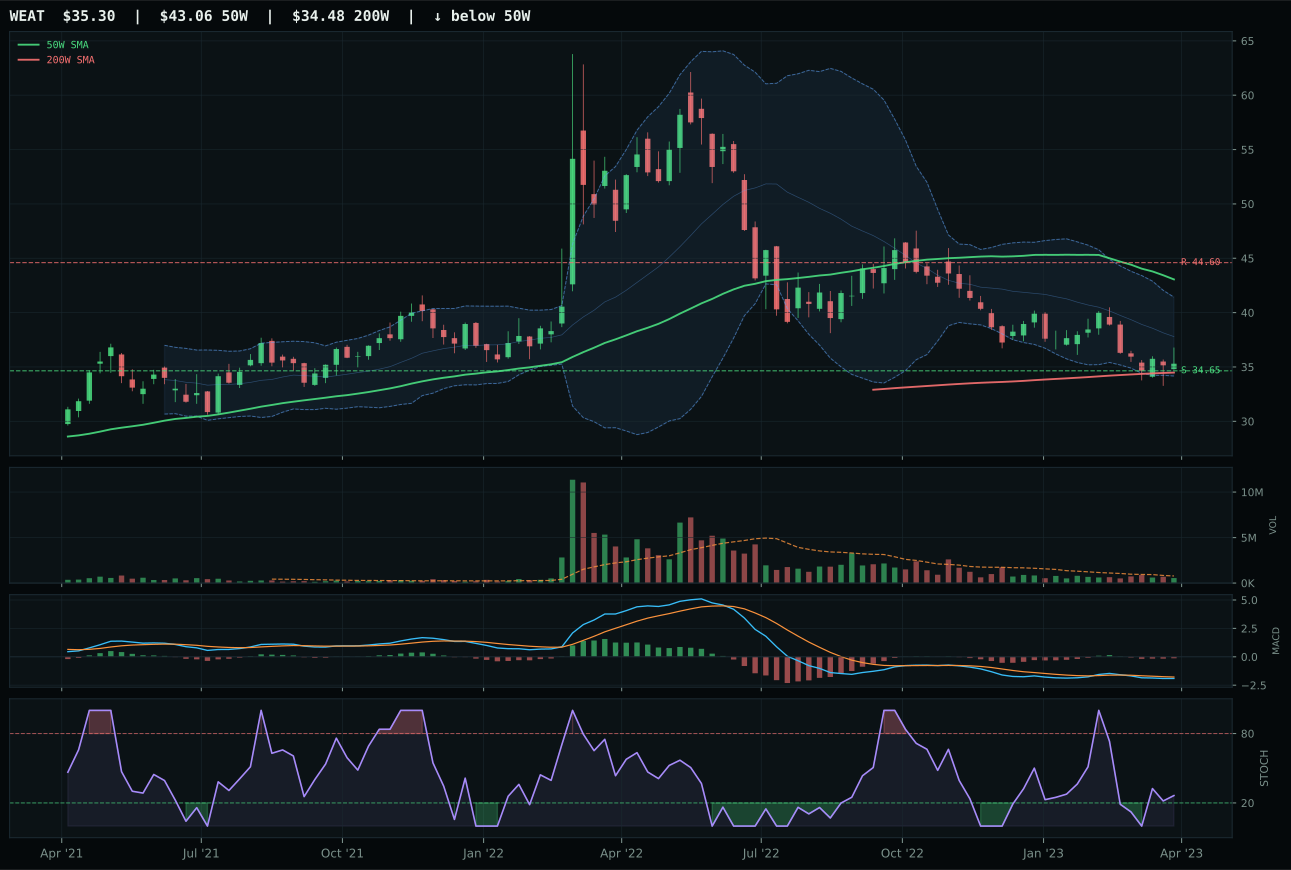
WEAT has a pullback into support profile with -18.6% 13-week relative strength versus SPY.
A failed hold above support would weaken the setup.
Actionable but governed by invalidation levels.
WEAT wins the category but earns 0% allocation because its technical evidence is 0.0/100—a floor score indicating the chart provides zero directional conviction. Price is 18% below the 50W, MACD is bearish/weakening, momentum confirmation is 0.0, and volume is thin participation across all timeframes. What prevents WEAT from collapsing entirely is its risk/reward score of 90.0: the 13W return is -11.5%, RS versus SPY is -18.6%, but downside to support at 34.65 is only 1.9% while upside to resistance sits at -20.9%. In other words, the pain is behind the trade; the chart is pulling into a defined support zone near Fib 0.786 in the repair/near-52W-low zone. Against MOO and VEGI (which also scored in the teens and twenties), WEAT's risk/reward setup at least provides a coherent pullback structure. This is not a winner; it is the least-bad setup in a category that has no technical merit.
Agriculture & Livestock is excluded from the portfolio entirely this week with a 25.4 final score and 55.0 macro fit, ranking among the bottom two categories. WEAT's technical evidence of 0.0/100 is disqualifying—the ETF has no momentum, no breadth confirmation, no volume sponsorship, and no MACD support. The 13W return of -11.5% and RS versus SPY of -18.6% position agriculture as a lagging sector inside a lagging setup. Macro fit offers no rescue: real asset sponsorship is active (+8) and commodity breadth positive (+5), but these are overwhelmed by disinflation pressure (-8), which signals that commodity prices are under structural pressure. Goldilocks regime does not favor agricultural exposure—growth is steady and inflation is not accelerating, so food/feed demand outlook lacks conviction. The category needs either a bullish MACD crossover with volume confirmation or a breakout above the 50W to earn a tier-2 slot. Until then, capital is better deployed in metals (which have scarcity sponsorship) or energy (which offers cleaner mean-reversion setups from deeper lows).
Traditional Energy — XLE
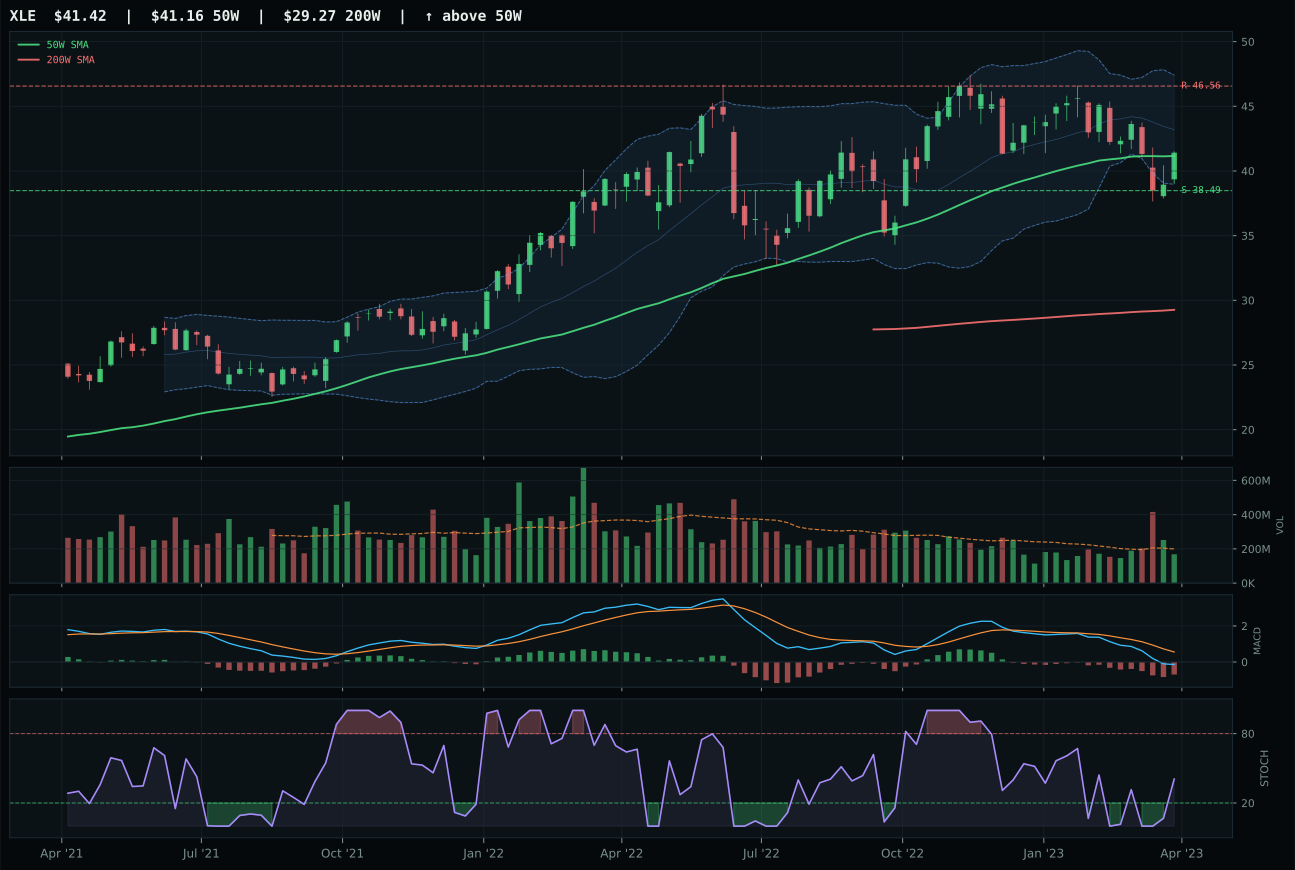
XLE has a compression near 50W profile with -12.4% 13-week relative strength versus SPY.
A failed hold above support would weaken the setup.
Actionable but governed by invalidation levels.
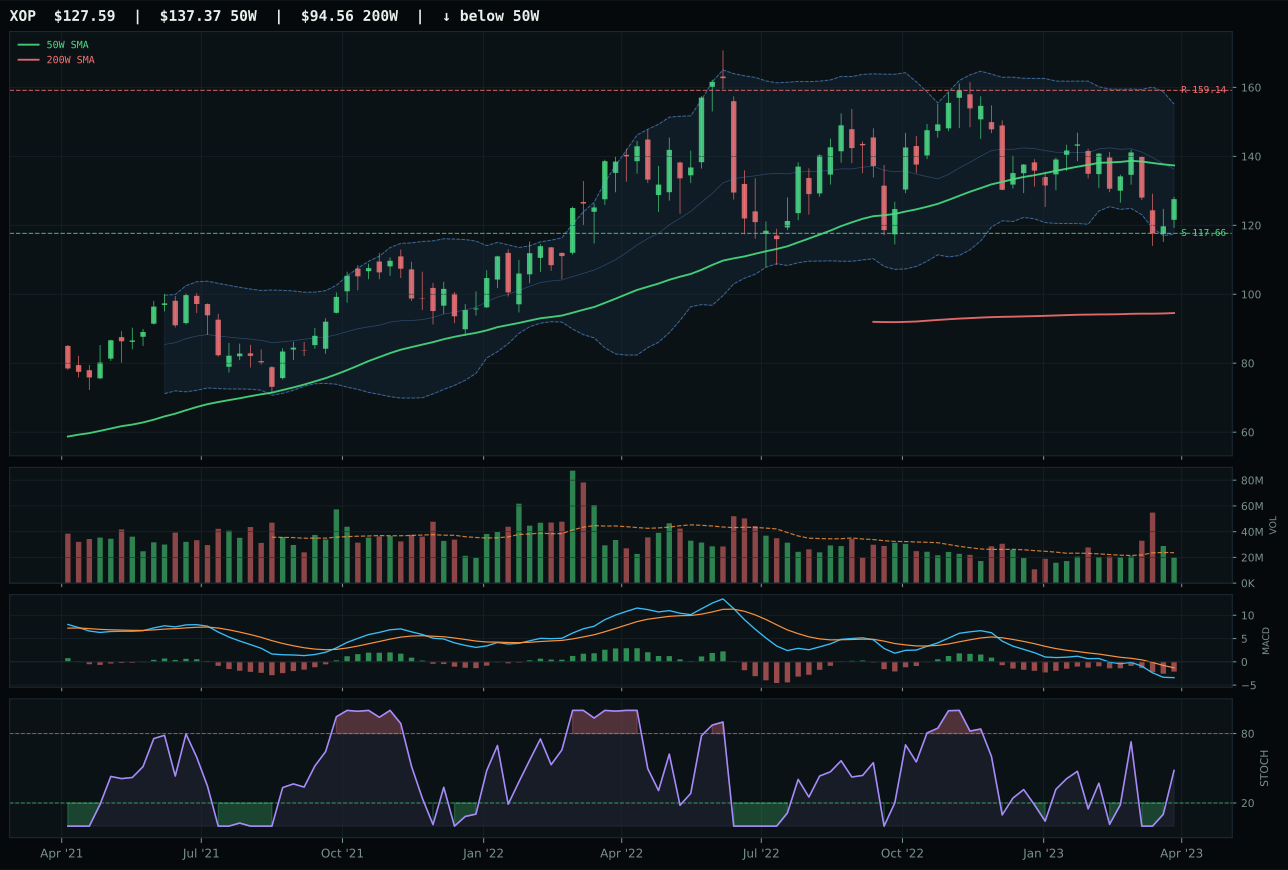
XOP has a neutral structure profile with -13.2% 13-week relative strength versus SPY.
A failed hold above support would weaken the setup.
Actionable but governed by invalidation levels.
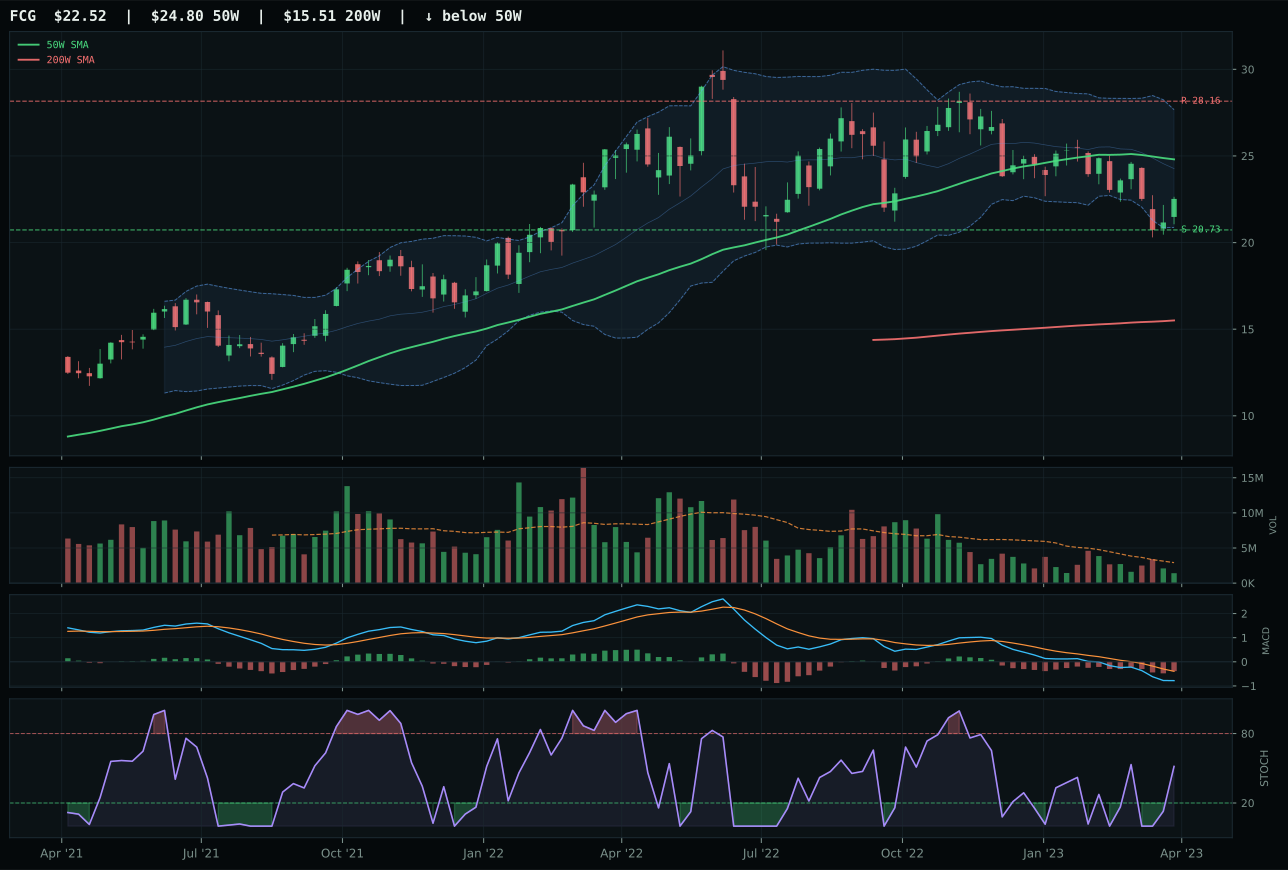
FCG has a neutral structure profile with -15.2% 13-week relative strength versus SPY.
A failed hold above support would weaken the setup.
Actionable but governed by invalidation levels.
XLE wins the category but earns 0% allocation because energy as a whole has failed to attract sustained buying despite a compressed technical setup. XLE sits 0.6% above the 50W (timing score of 100.0) with neutral volume and a structure of compression near the moving average, which should be fertile ground for expansion. Instead, the 13W return is -5.3%, SPY relative strength is -12.4%, and momentum confirmation is 2.3/100—signals of structural rejection despite technical support. MACD is bearish/weakening, and volume-price confirmation is 31.9/100, meaning that any buyers near the 50W are not persisting. XLE's 79.2 risk/reward—upside to resistance is constrained at -11.1%, but downside to support is only 7.6%—indicates that the setup is mean-reverting by geometry, not by conviction. XOP trails XLE because its timing is worse (85 vs 100) and category-relative strength is zero, but both reflect the same reality: energy is being rejected in a Goldilocks regime.
Traditional Energy is excluded from the portfolio with a 9.0 final score and 40.0 category-level macro fit, ranking as one of the two lowest-conviction categories. XLE's technical evidence is 44.7/100, and while the timing is perfect (100.0) and risk/reward is favorable (79.2), the momentum confirmation of 2.3 disqualifies the setup from any conviction stance. Energy lacks sponsorship in Goldilocks: liquidity expansion does not require energy demand, disinflation pressure actively penalizes energy valuations (-10), and credit stress (-7) suppresses cyclical appetite. Real asset sponsorship is active (+7) but is overwhelmed by macro headwinds. The 13W return of -5.3% and -12.4% RS versus SPY confirm that capital is fleeing energy in favor of other real assets (metals) that carry greater scarcity and inflation-hedge properties. XLE's compression at the 50W is a setup waiting for a catalyst; the 7.6% downside to support and 79.2 risk/reward score suggest that pain is limited. But without momentum confirmation, volume sponsorship, or macro alignment, this category does not earn allocation. Energy needs a re-entry above the resistance at 46.56 with bullish MACD and volume to qualify for tier-2 consideration.