
2023-03-24
Informational purposes only. The content in this report, including allocations, analysis, and commentary, is provided solely for informational and educational purposes. It does not constitute financial advice, investment advice, trading advice, or any other type of advice. Past performance does not guarantee future results. Always conduct your own research and consult a qualified financial professional before making investment decisions.
Weekly Allocation
| Ticker | Category | Weight | Role |
|---|---|---|---|
| FBTC | 50% | Overlay | |
| SMH | AI | 10% | Top-2 (10%) |
| XLK | Technology | 10% | Top-2 (10%) |
| GDX | Precious Metals | 5% | Tier-2 (5%) |
| ITA | Defense & Aerospace | 5% | Tier-2 (5%) |
| INDA | Emerging Markets | 5% | Tier-2 (5%) |
| COPX | Industrial Metals | 5% | Tier-2 (5%) |
| XLU | Utilities & Infrastructure | 5% | Tier-2 (5%) |
| URA | Nuclear Energy | 5% | Tier-2 (5%) |
Trade Instructions — Monday Open
Sell the tranche from 2023-02-24 (completing its 4-week hold). Buy the new tranche. Instructions show net portfolio changes — same-asset positions cancel, weight changes show the delta.
| Action | Ticker | Instruction |
|---|---|---|
| SELL | SMH | Sell 25% of SMH position (reduce 10.00% → 7.50%) |
| SELL | ITA | Sell 43% of ITA position (reduce 8.75% → 5.00%) |
| SELL | PAVE | Sell entire PAVE position (2.50% of portfolio) |
| SELL | URA | Sell 14% of URA position (reduce 8.75% → 7.50%) |
| SELL | COPX | Sell 14% of COPX position (reduce 8.75% → 7.50%) |
| SELL | GLD | Sell 29% of GLD position (reduce 8.75% → 6.25%) |
| SELL | XLE | Sell entire XLE position (2.50% of portfolio) |
| BUY | XLU | Buy XLU — 7.69% of freed cash (adds 1.25% to portfolio) |
| BUY | FBTC | Buy FBTC — 76.92% of freed cash (adds 12.50% to portfolio) |
| BUY | INDA | Buy INDA — 7.69% of freed cash (adds 1.25% to portfolio) |
| BUY | GDX | Buy GDX — 7.69% of freed cash (adds 1.25% to portfolio) |
Current Portfolio After Trade
Combined holdings across all 4 active tranches. Each tranche is 25% of the portfolio.
| Ticker | % of Portfolio | Weight Bar |
|---|---|---|
| FBTC | 25.00% | |
| XLK | 10.00% | |
| SMH | 7.50% | |
| URA | 7.50% | |
| COPX | 7.50% | |
| GLD | 6.25% | |
| ITA | 5.00% | |
| CIBR | 5.00% | |
| XLU | 5.00% | |
| MOO | 5.00% | |
| XAR | 5.00% | |
| BOTZ | 2.50% | |
| IGF | 2.50% | |
| PICK | 2.50% | |
| INDA | 2.50% | |
| GDX | 1.25% |
Macro Regime — Goldilocks
Macro Evidence Charts
Market-implied signals behind the macro regime scores. Each ratio compares two assets; the direction and slope of the ratio is what the macro engine reads.
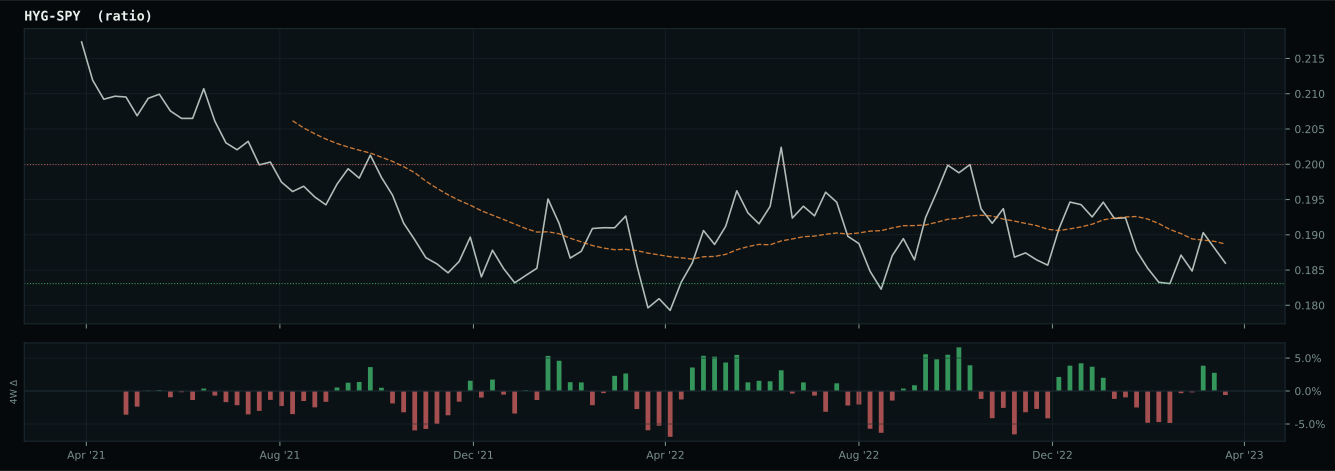
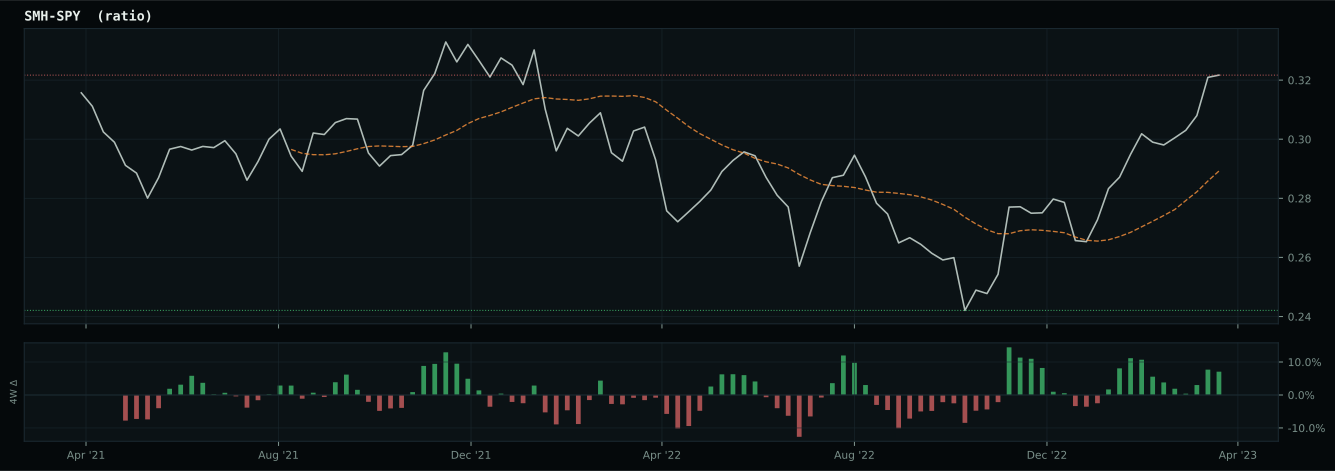
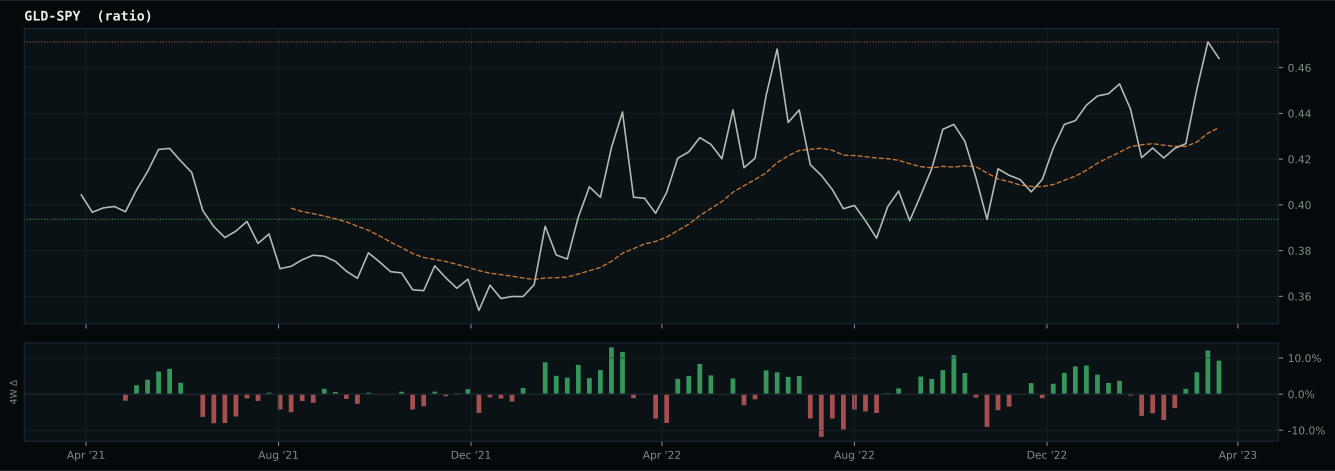
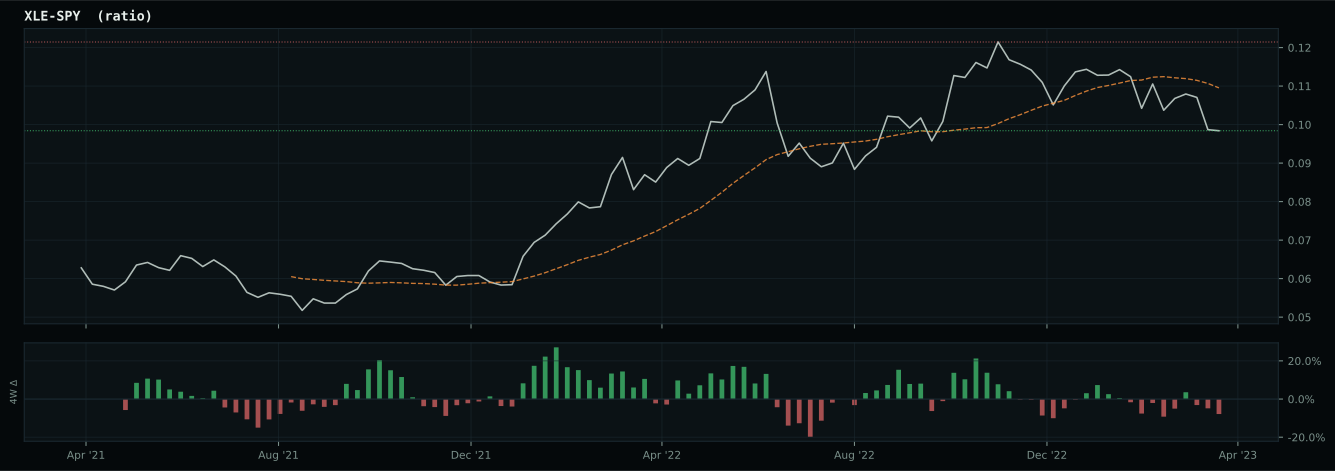
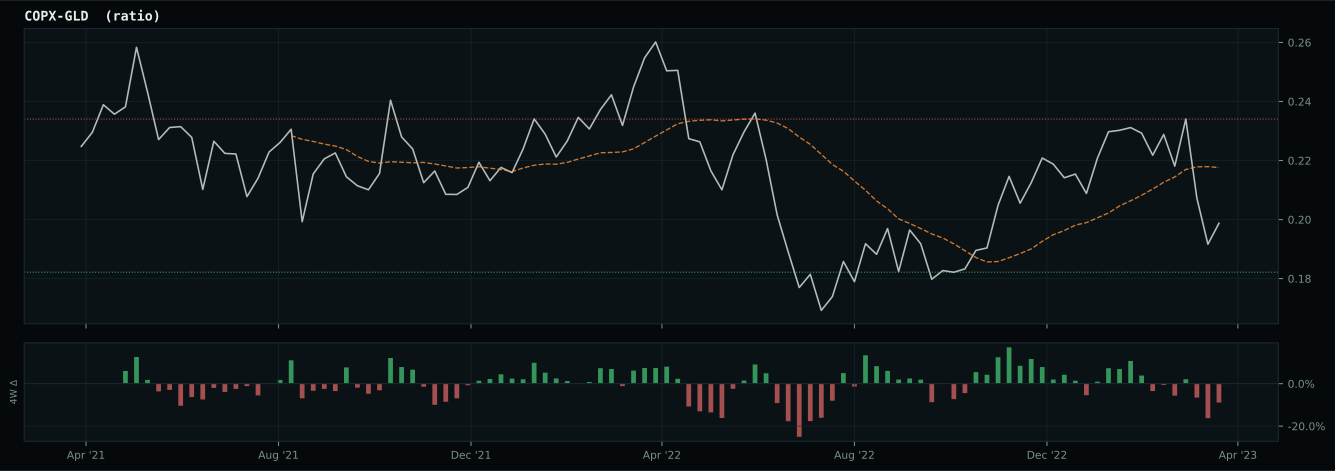
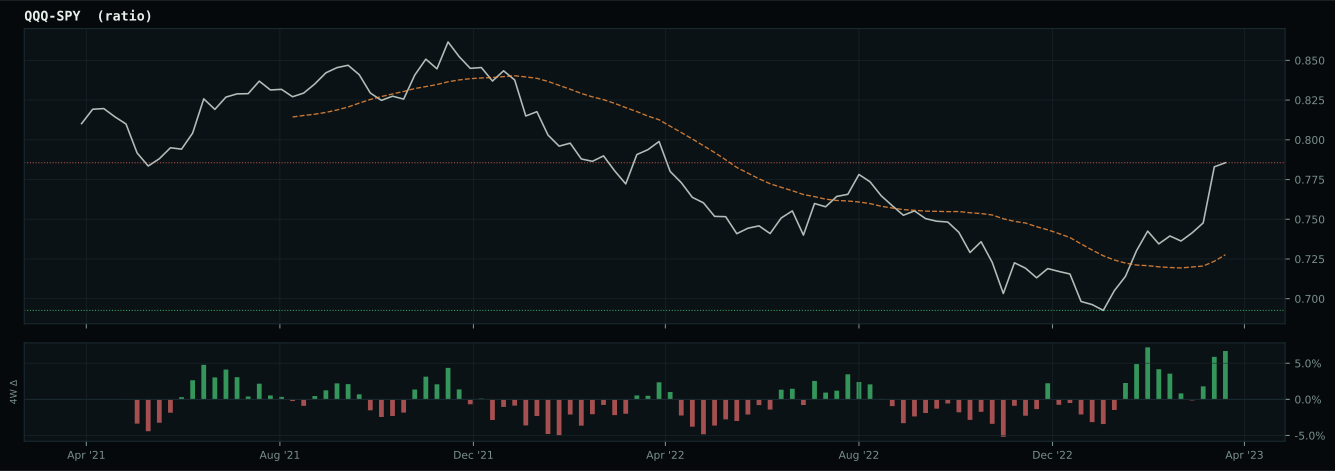
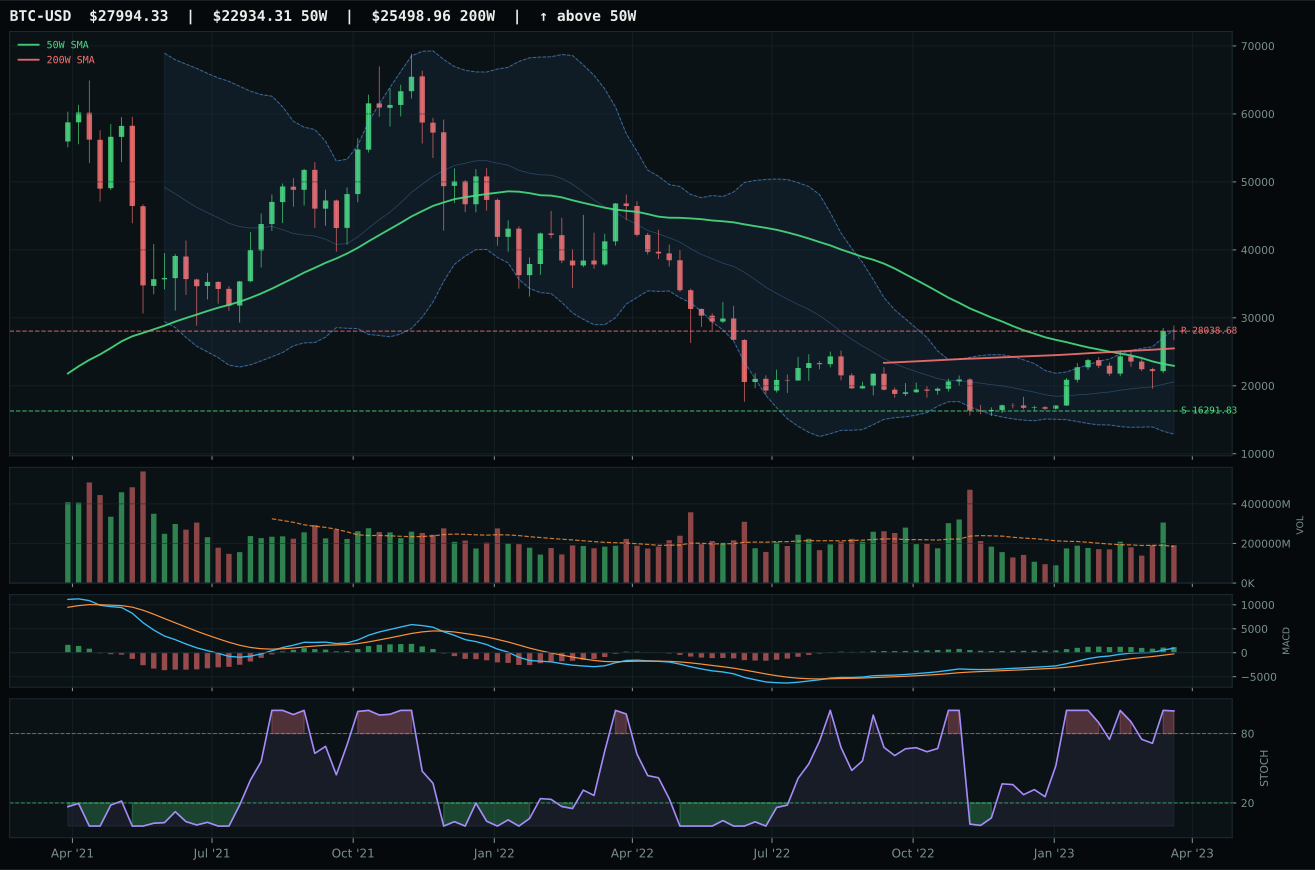
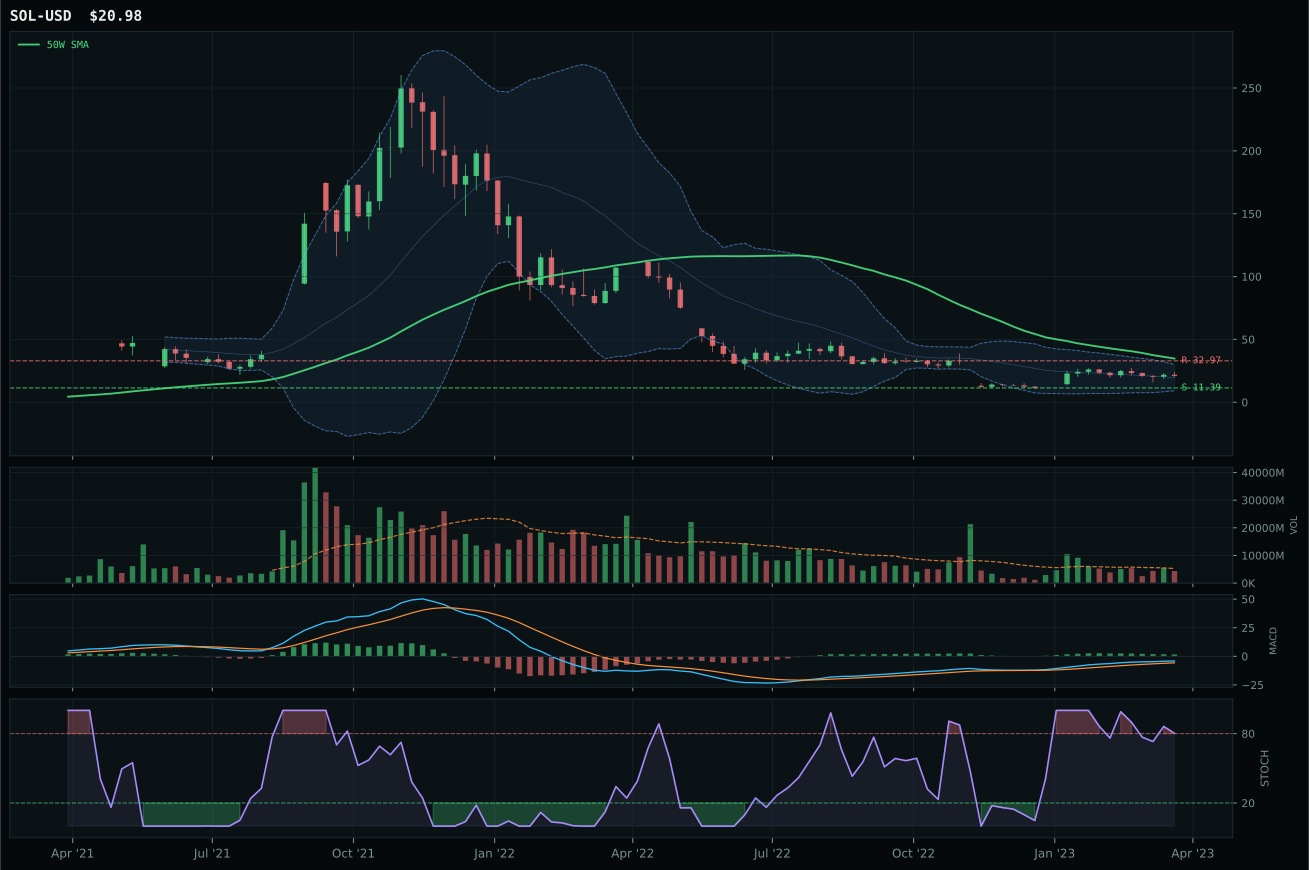
Crypto Regime — ValueBTC
post-touch range has not been tested enough: support tests 8/2, resistance tests 1/2
TrendBTC not confirmed
one or more available conditions failed
Category Rankings
| Rank | Category | Winner | Score | Alloc | 4W Ret | Peers (4W) |
|---|---|---|---|---|---|---|
| 1 | AI | SMH | 79.5 | 20% | -2.93% | BOTZ +2.4% · AIQ +0.7% |
| 2 | Technology | XLK | 74.7 | 20% | +0.68% | IGV +3.2% · CIBR +0.5% |
| 3 | Precious Metals | GDX | 49.5 | 10% | +8.72% | GLD +1.6% · SLV +8.8% |
| 4 | Defense & Aerospace | ITA | 37.6 | 10% | +2.98% | XAR +1.9% · ROKT +2.5% |
| 5 | Emerging Markets | INDA | 32.8 | 10% | +4.21% | IEMG +1.5% · ILF +6.2% |
| 6 | Industrial Metals | COPX | 32.8 | 10% | +8.95% | PICK +3.0% · REMX +5.7% |
| 7 | Utilities & Infrastructure | XLU | 32.3 | 10% | +5.63% | IGF +5.3% · PAVE +1.0% |
| 8 | Nuclear Energy | URA | 28.4 | 10% | +1.97% | NLR +4.4% · URNM +1.2% |
| 9 | Agriculture & Livestock | WEAT | 8.5 | 0% | -3.30% | MOO +2.2% · VEGI +1.3% |
| 10 | Traditional Energy | XLE | 1.9 | 0% | +7.62% | XOP +3.9% · FCG +6.6% |
AI — SMH
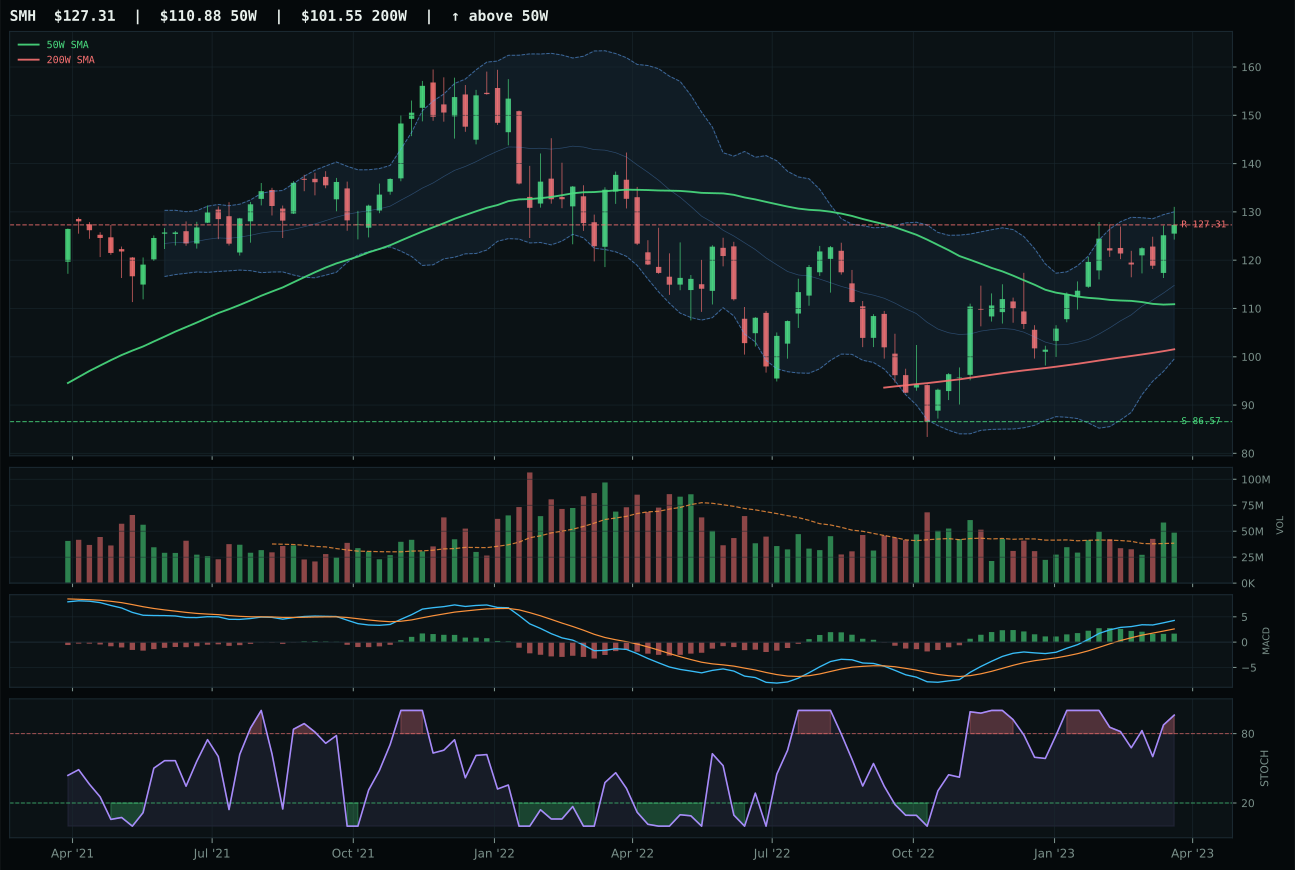
SMH has a neutral structure profile with 21.8% 13-week relative strength versus SPY.
A failed hold above support would weaken the setup.
Actionable but governed by invalidation levels.
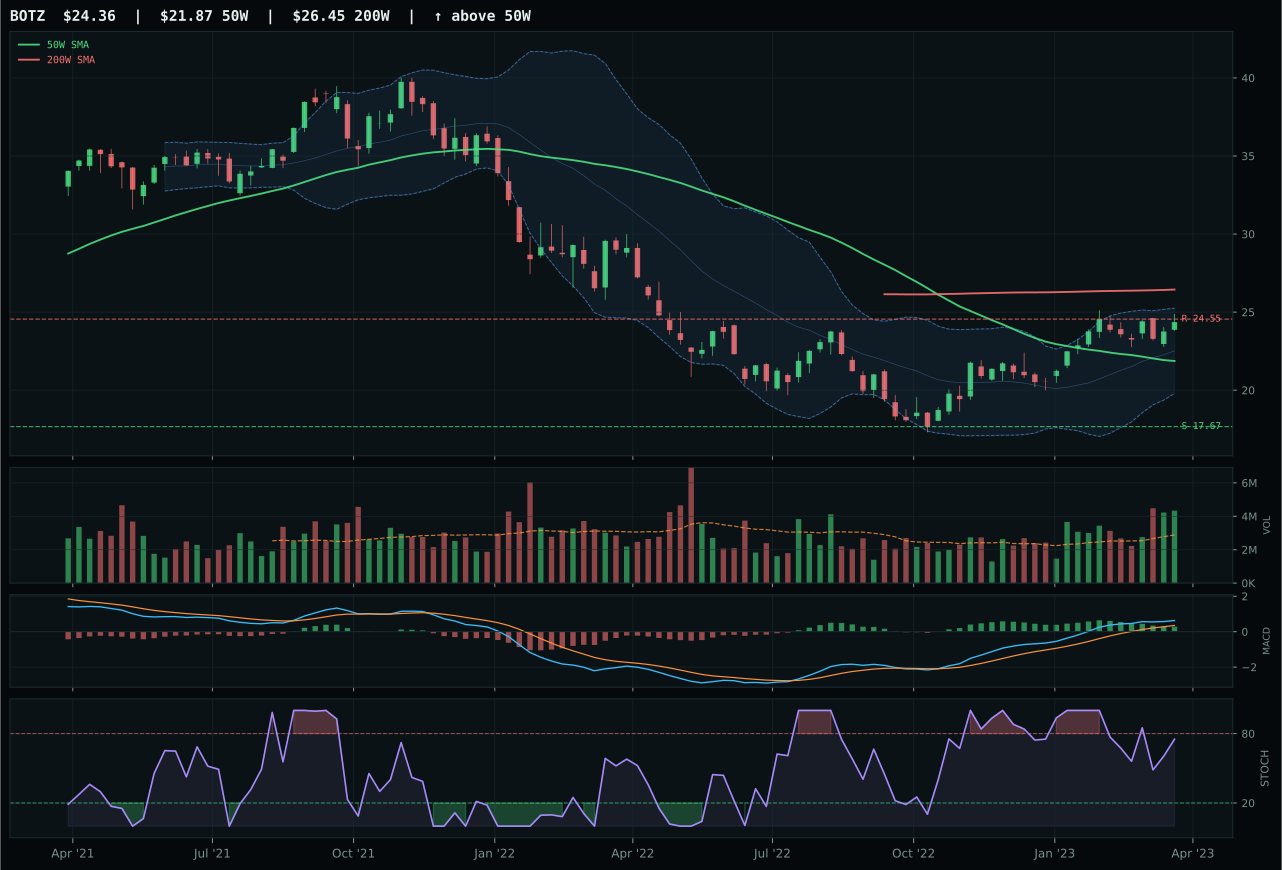
BOTZ has a neutral structure profile with 15.4% 13-week relative strength versus SPY.
A failed hold above support would weaken the setup.
Actionable but governed by invalidation levels.
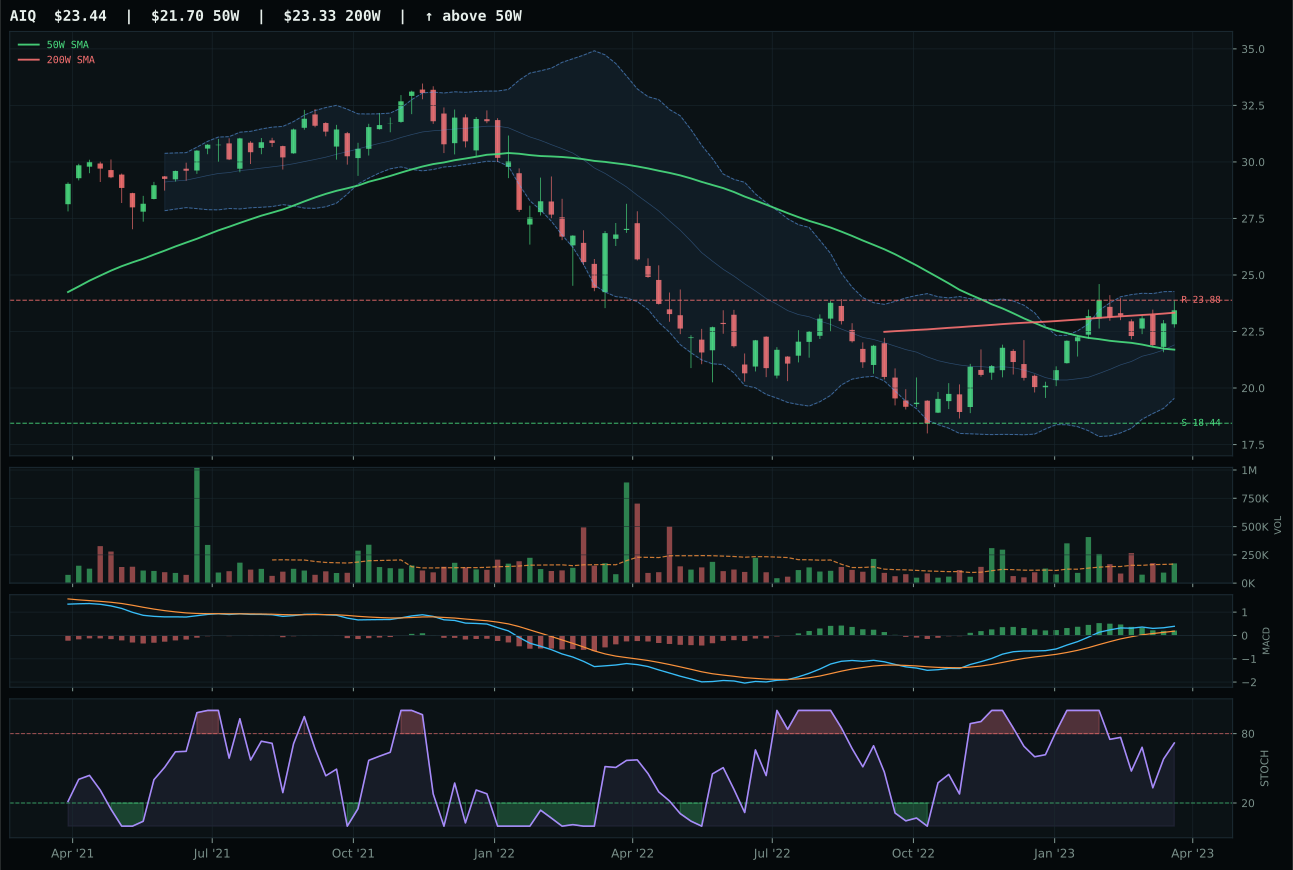
AIQ has a neutral structure profile with 13.6% 13-week relative strength versus SPY.
A failed hold above support would weaken the setup.
Tracked, but not top-2 eligible because: .
SMH dominated the AI category with a 21.8% relative strength advantage versus SPY, the cleanest technical evidence (89.3 score), and volume participation at 1.26x the 20-week average—a mark of real capital flow, not algorithmic noise. The thirteen-week return of 25.1% and six-week return of 6.9% confirm a sustained momentum thrust with active accumulation behind it. BOTZ, the runner-up, delivered competitive momentum scores but fell 6.4 percentage points behind on category-relative strength, signaling that semiconductor and compute leaders are outpacing robotics and physical automation in the current buying interest. SMH's stochastic RSI overbought reading (0.96) mirrors BOTZ's 1.00, but SMH's margin of technical conviction—trend score of 100 versus BOTZ's 76—proves the broader compute infrastructure has better structure beneath the advance. Price sits in the upper Fibonacci retracement zone, meaning every new buyer at current levels is betting on a breakout, not a reversal.
AI scored 79.5 and earned top-2 status alongside SMH at 50%, reflecting the strongest macro-to-technicals alignment in the portfolio this week. The category-level macro fit scored 86.0/100, driven by active AI growth sponsorship (+14), positive risk appetite (+10), and liquidity expansion (+10)—a combination that justifies committing capital to the most expensive and momentum-dependent sector in the market. What makes this slot defensible is not that timing is pristine but that the macro regime is actively paying for this specific risk. However, the distance to 50W of 14.8% and overbought stochastic RSI at 0.96 mean this allocation depends entirely on sustained macro support; any pivot in risk appetite or tightening pressure would turn this from top-2 to immediate trimming candidate.
Technology — XLK
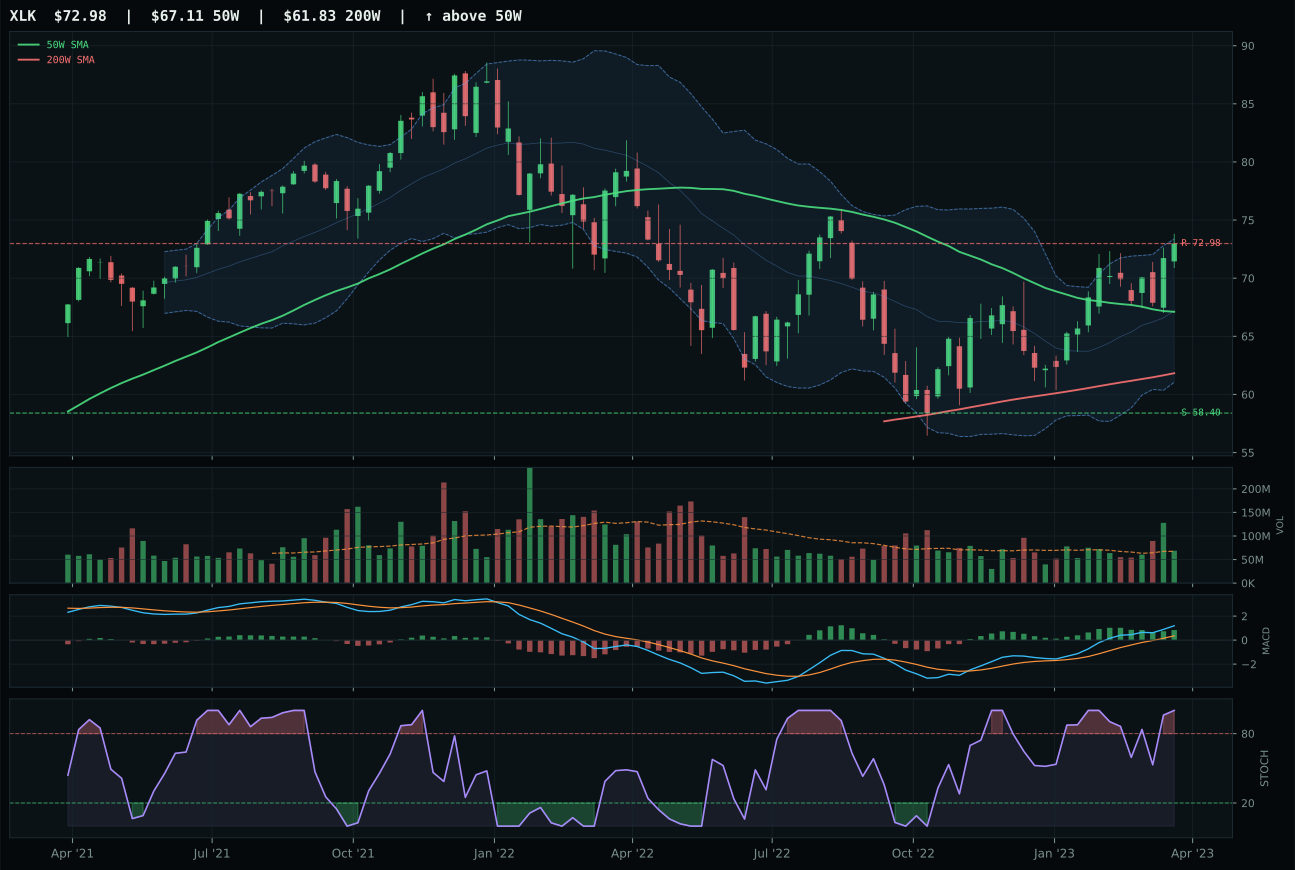
XLK has a neutral structure profile with 13.8% 13-week relative strength versus SPY.
A failed hold above support would weaken the setup.
Actionable but governed by invalidation levels.
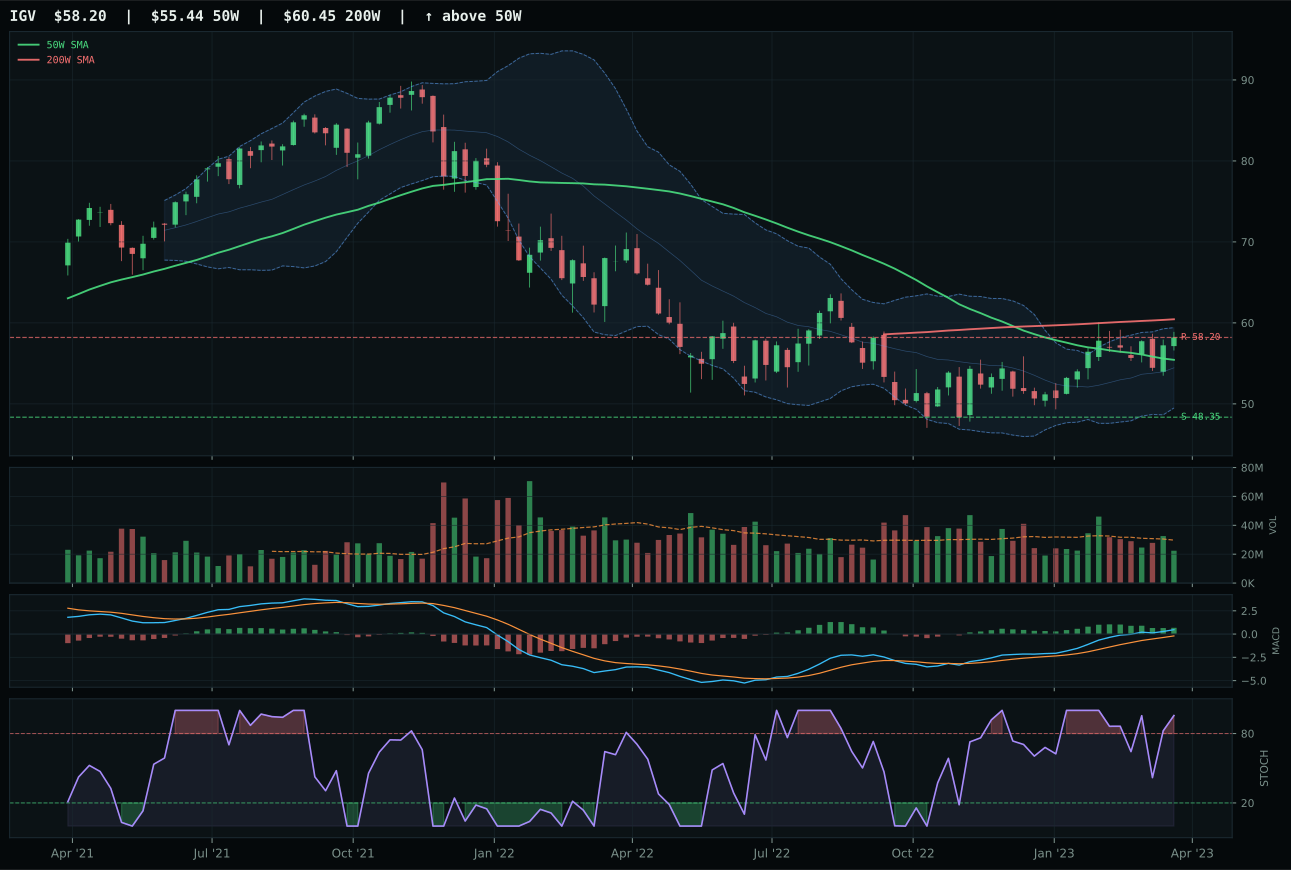
IGV has a neutral structure profile with 11.5% 13-week relative strength versus SPY.
A failed hold above support would weaken the setup.
Actionable but governed by invalidation levels.
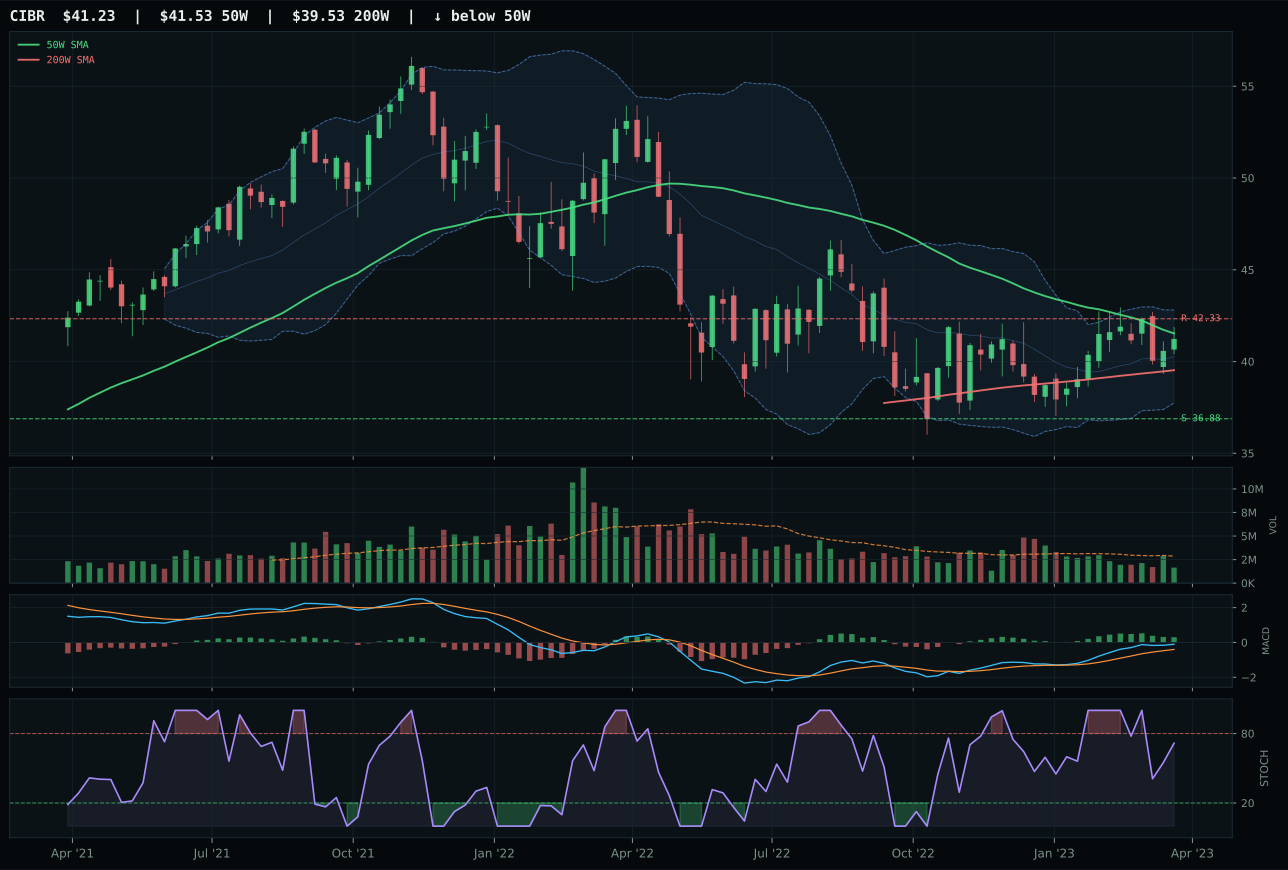
CIBR has a compression near 50W profile with 4.6% 13-week relative strength versus SPY.
A failed hold above support would weaken the setup.
Actionable but governed by invalidation levels.
XLK secured the category win by posting 13.8% relative strength versus SPY alongside a neutral but clean setup with price 8.7% above the 50-week moving average. The momentum story is straightforward: 17.1% thirteen-week returns and above-average volume participation confirm institutional accumulation rather than casual bounce-trading. IGV, the runner-up, lagged on category-relative strength at 2.3% versus XLK's edge, and its MACD trajectory—bullish but flattening—suggested the trend was losing conviction. XLK's setup scores higher on structure purity (76.2 vs 75.5), meaning fewer false breakouts and cleaner support zones. The gap between first and second was only 3.1 points, but technical evidence favored the broader, more liquid technology exposure.
Technology earned 10% allocation and top-2 status at a 74.7 category score, making it the second-highest eligible opportunity in the Goldilocks regime this week. The macro backdrop actively supports it: liquidity expansion, positive risk appetite, and AI sponsorship combine for a 81.0/100 category-level macro fit, while technical evidence across the three-ETF basket weighs 62% of the decision. What keeps it from the 20% reserved for the absolute best setups is timing risk—the 8.7% gap to resistance means every new buyer is late to an already-extended move, and the absence of volume acceleration into the breakout hints that enthusiasm is plateauing rather than building. Any deterioration in momentum confirmation or a gap below the 50W would quickly demote this from top tier.
Precious Metals — GDX
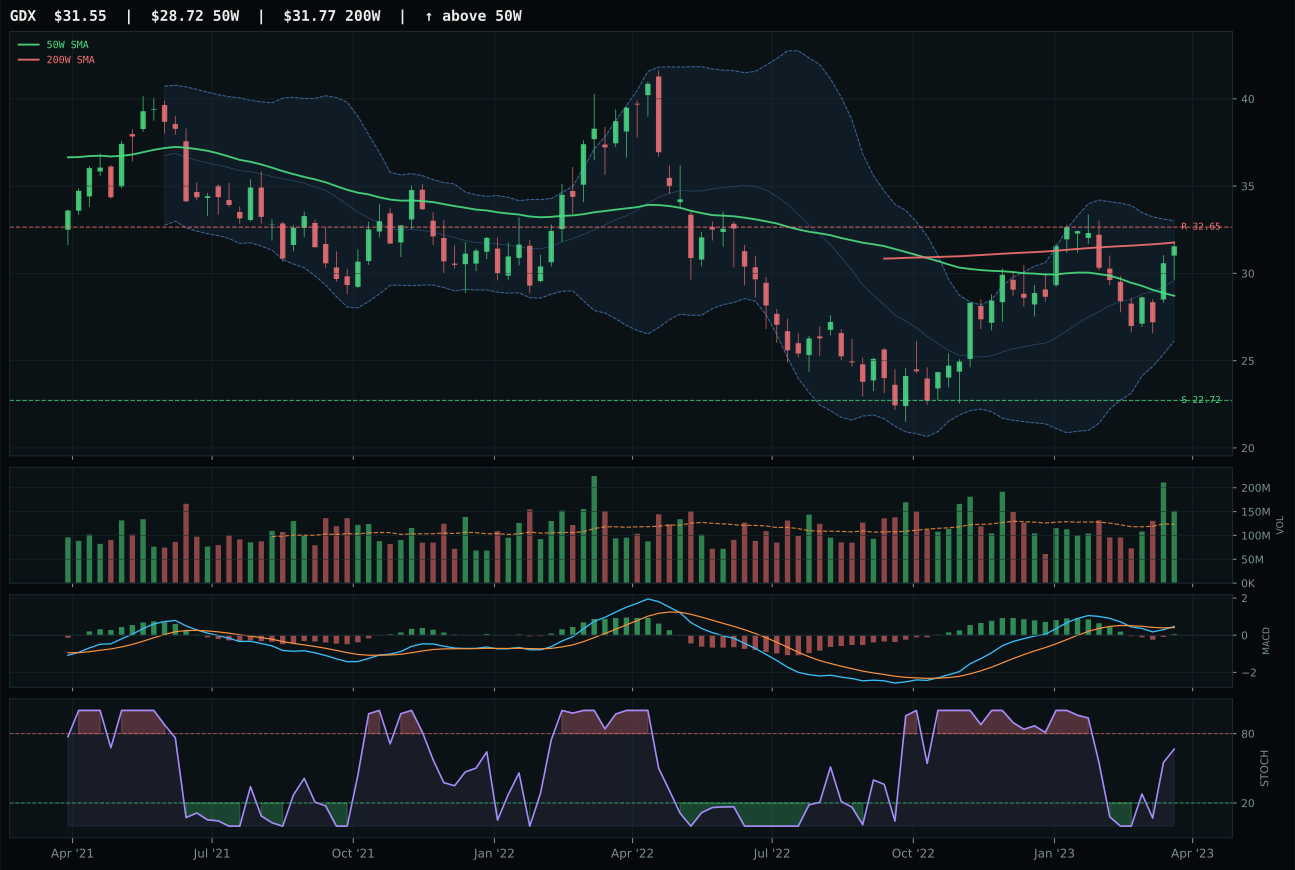
GDX has a neutral structure profile with 5.9% 13-week relative strength versus SPY.
A failed hold above support would weaken the setup.
Actionable but governed by invalidation levels.
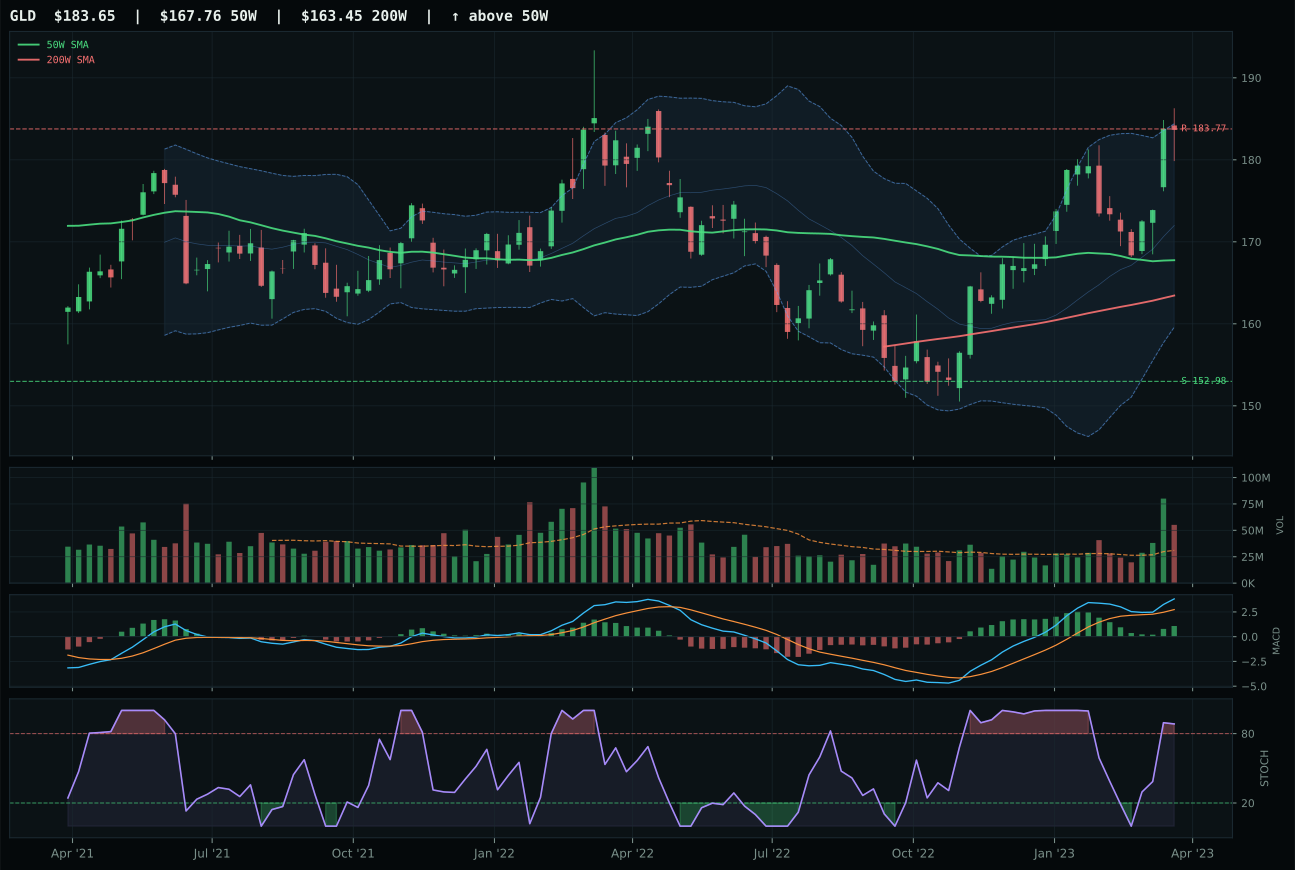
GLD has a neutral structure profile with 6.4% 13-week relative strength versus SPY.
A failed hold above support would weaken the setup.
Actionable but governed by invalidation levels.
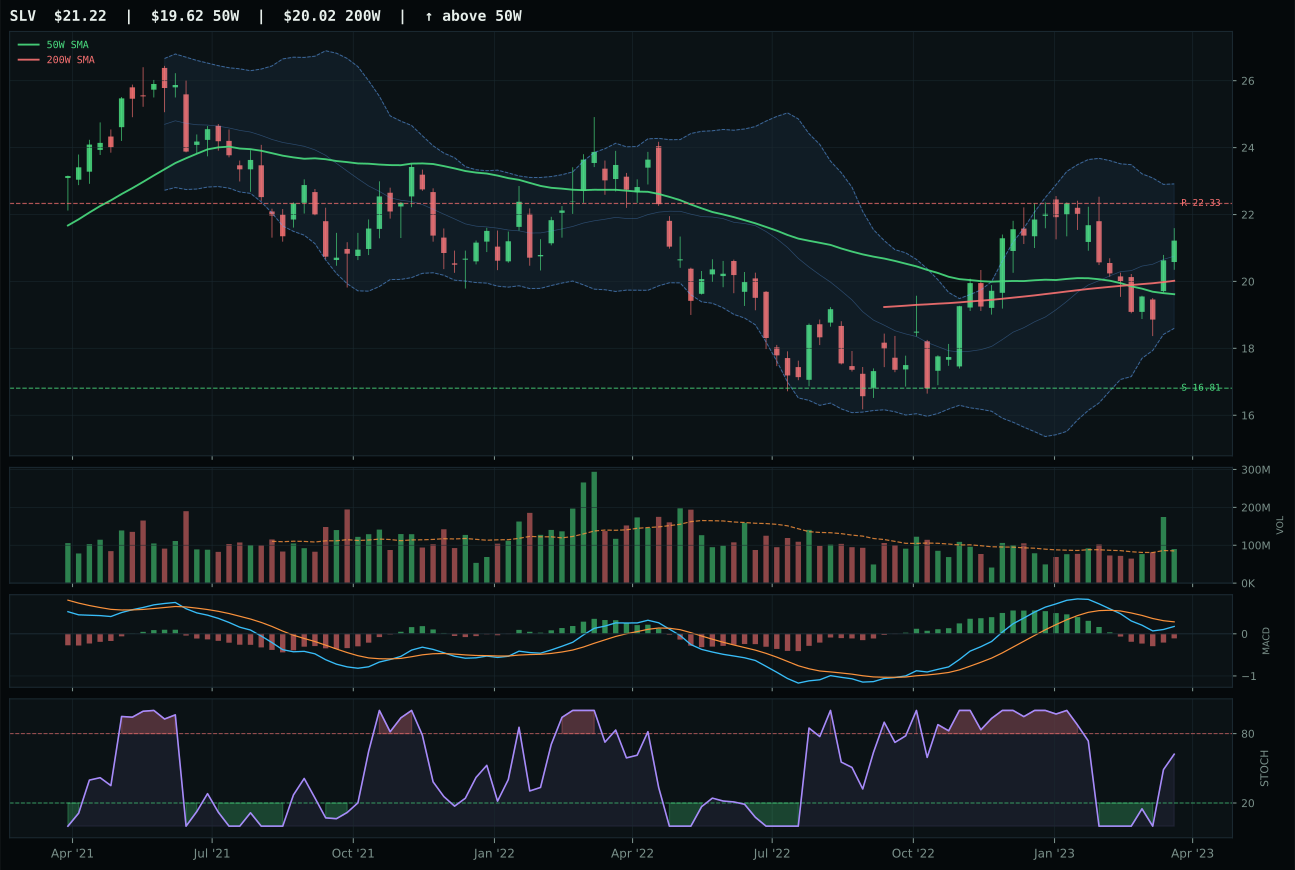
SLV has a neutral structure profile with -6.2% 13-week relative strength versus SPY.
A failed hold above support would weaken the setup.
Actionable but governed by invalidation levels.
GDX edged GLD by 0.1 points in a close category decision that came down to setup quality and technical sequencing. Both showed bullish MACD improving and positive thirteen-week returns (GDX +9.3%, GLD +9.8%), but GDX's relative strength advantage versus SPY was 5.9% while GLD's was 6.4%, making this a category-relative strength call (0.0% vs 0.5%). The difference: GDX sits at the middle retracement level with stochastic RSI rising mid-zone (0.67), offering a structural entry point with momentum confirmation still building. GLD, meanwhile, sits near the 52-week highs with stochastic RSI overbought (1.00), meaning most of the move has been claimed and the next 200 basis points of upside comes with maximum crowding. GDX's timing score of 83.0 versus GLD's 75.0 reflects this sequencing edge. Risk/reward slightly favors GLD (29.1 vs 54.6) on price proximity to resistance, but technical evidence (91.5 vs 53.4) heavily favors GDX's structure beneath the surface.
Precious Metals earned 5% allocation with a 49.5 category score, placing it in the middle third of opportunities but justified by the active monetary hedge bid descriptor (+14 at ETF level) flowing through a Goldilocks regime. The 64.0/100 category-level macro fit is solid because disinflation pressure (+6) and monetary hedge messaging (+14) are both constructive, offsetting only mild headwinds from risk appetite and liquidity signals. What keeps this from a larger allocation is technical evidence of 91.5/100 for GDX, which is strong but not overwhelming—the setup is neither a breakout nor a deep reversal, just a recovery from oversold that has definition. The 38.9% downside to support and -3.4% upside to resistance create asymmetric risk that requires macro support to hold; if risk appetite reverses or the disinflation narrative stalls, this position becomes immediately vulnerable.
Defense & Aerospace — ITA
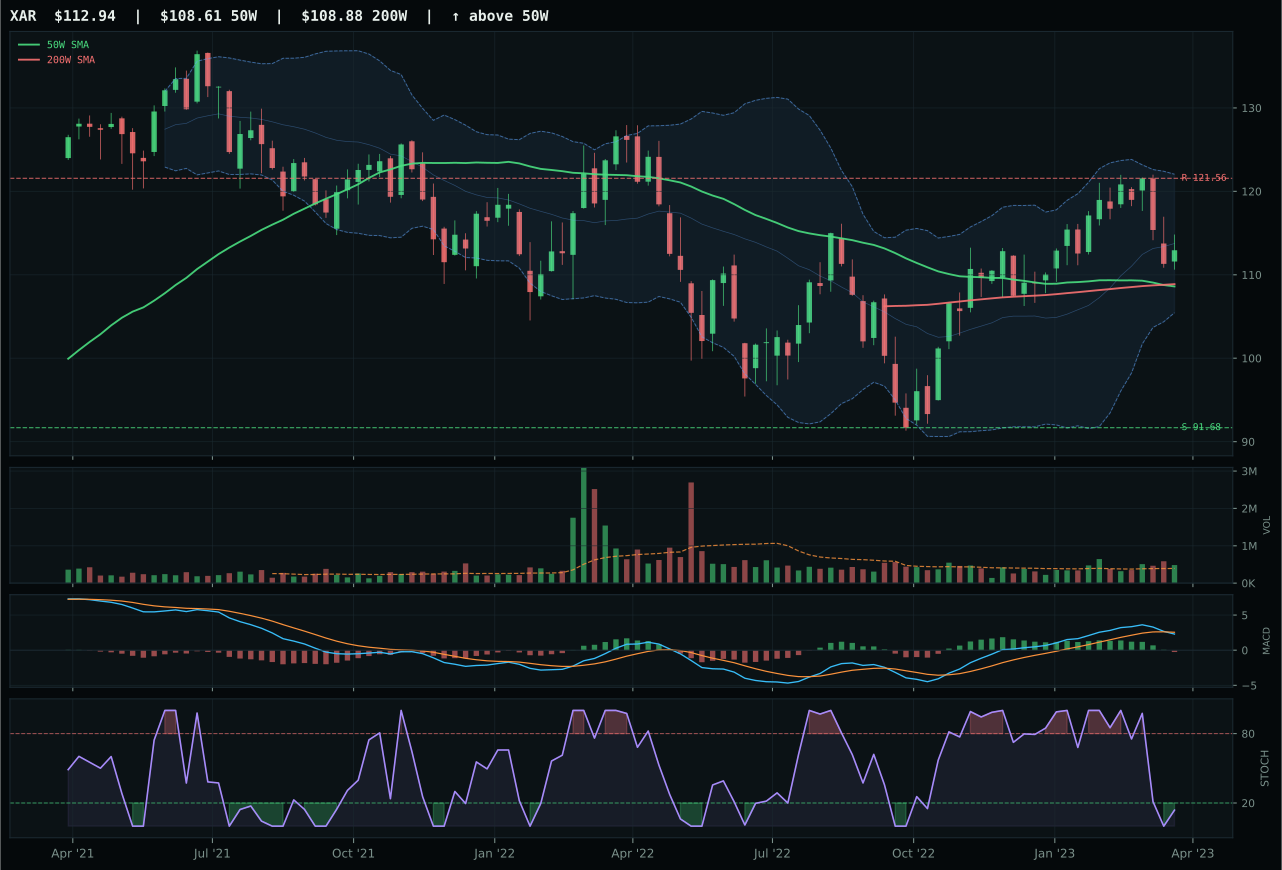
XAR has a neutral structure profile with 0.3% 13-week relative strength versus SPY.
A failed hold above support would weaken the setup.
Actionable but governed by invalidation levels.
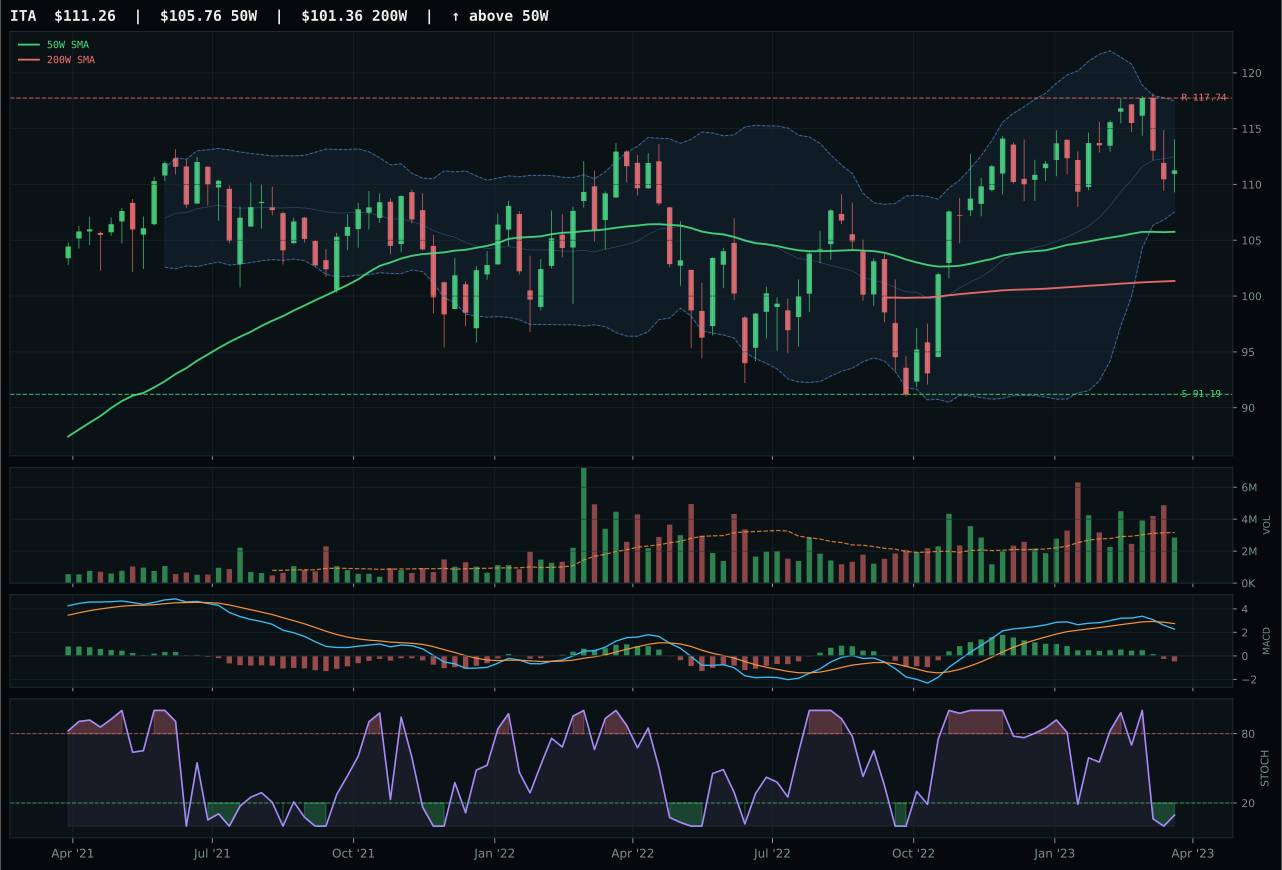
ITA has a neutral structure profile with -3.0% 13-week relative strength versus SPY.
A failed hold above support would weaken the setup.
Actionable but governed by invalidation levels.
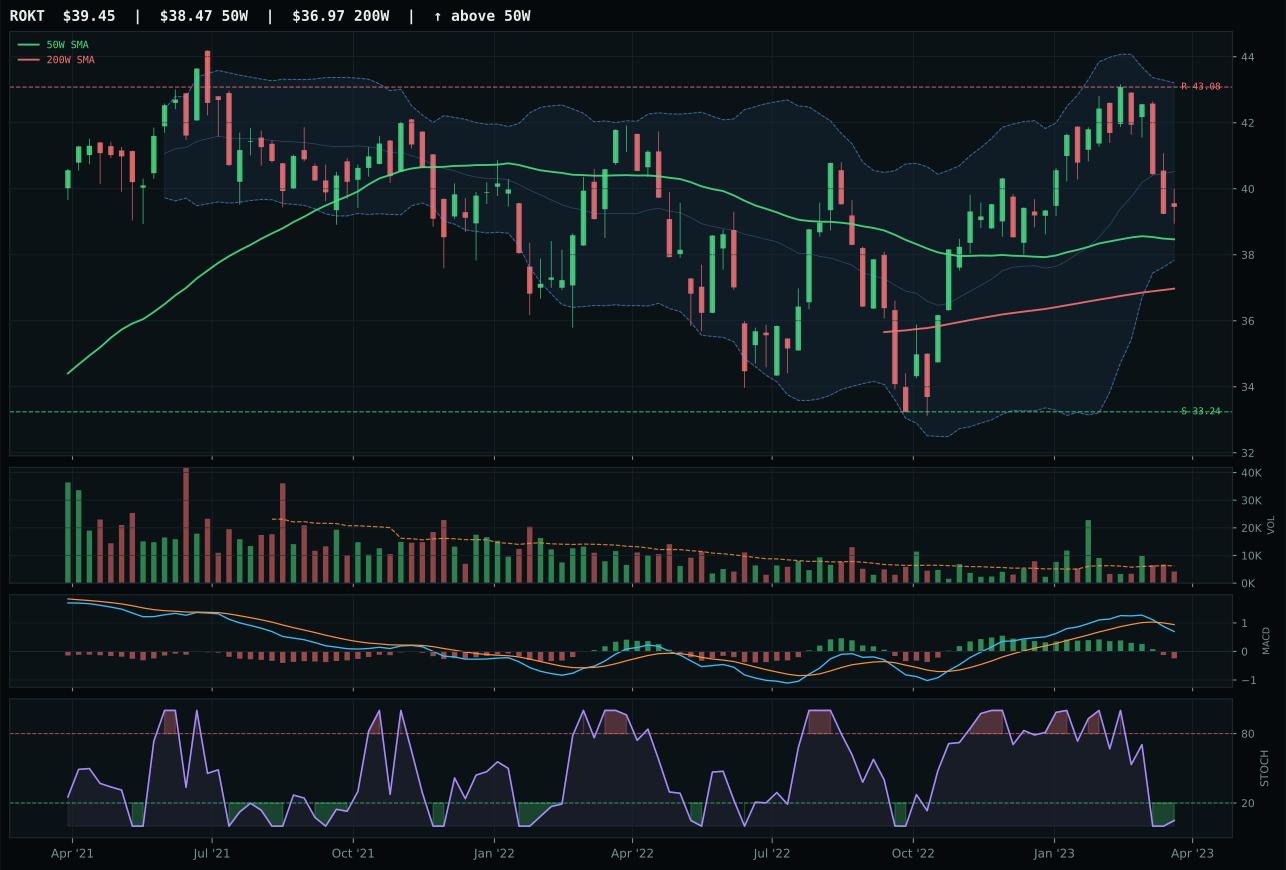
ROKT has a compression near 50W profile with -2.7% 13-week relative strength versus SPY.
A failed hold above support would weaken the setup.
Tracked, but not top-2 eligible because: .
ITA won the defense category despite weak momentum because relative to its peers (XAR and ROKT), it showed the most balanced technical foundation: trend 77.5, structure 72.3, and timing 70.0 that collectively held together better than deteriorating alternatives. The story is muted—13-week return of just 0.4%, relative strength down 3% versus SPY—but price remains above both the 50-week and 200-week moving averages, protecting against a structural breakdown. XAR scored higher on composite (65 vs 62) but failed the persistence test: volume-price confirmation was weak and its MACD bearish/weakening profile matched ITA's deterioration. Neither ETF is clean, but ITA's 22% downside to support at 91.19 offers a defined risk zone, whereas XAR showed compressed upside and comparable downside without the same structural anchoring. The category-relative strength decision broke in ITA's favor at -0.3% versus XAR's -0.3%, making this a coin flip resolved by trend reliability.
Defense & Aerospace earned 5% allocation despite a meager 37.6 category score, ranking outside the top six and contributing to the portfolio only because of portfolio structure rather than technical merit. The 55.0/100 macro fit is neutral—no specific descriptor strongly favors or penalizes defense in a Goldilocks regime where credit stress is a minor headwind (+2) and transition signals are mixed. Technical evidence across the basket is 34.8/100 for the representative, which is depressed territory, meaning this slot rests almost entirely on mean-reversion hope: ITA is oversold, support is defined near 91.19, and the risk-reward shows 22% downside against what might be a bounce back to 117.74. Allocation here is prudent position-taking in a weak setup rather than conviction; any move that reestablishes the downtrend below support would justify immediate exit.
Emerging Markets — INDA
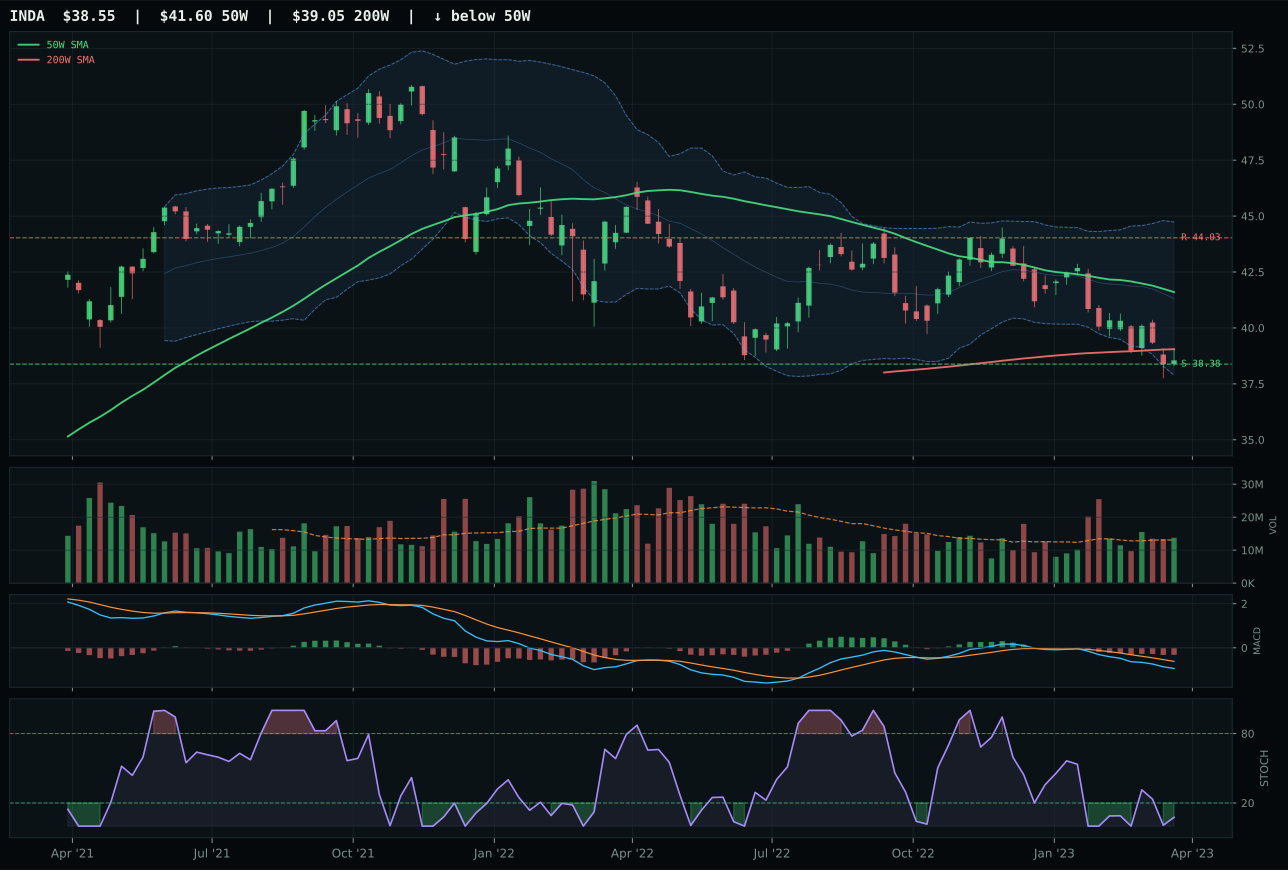
INDA has a pullback into support profile with -9.8% 13-week relative strength versus SPY.
A failed hold above support would weaken the setup.
Actionable but governed by invalidation levels.
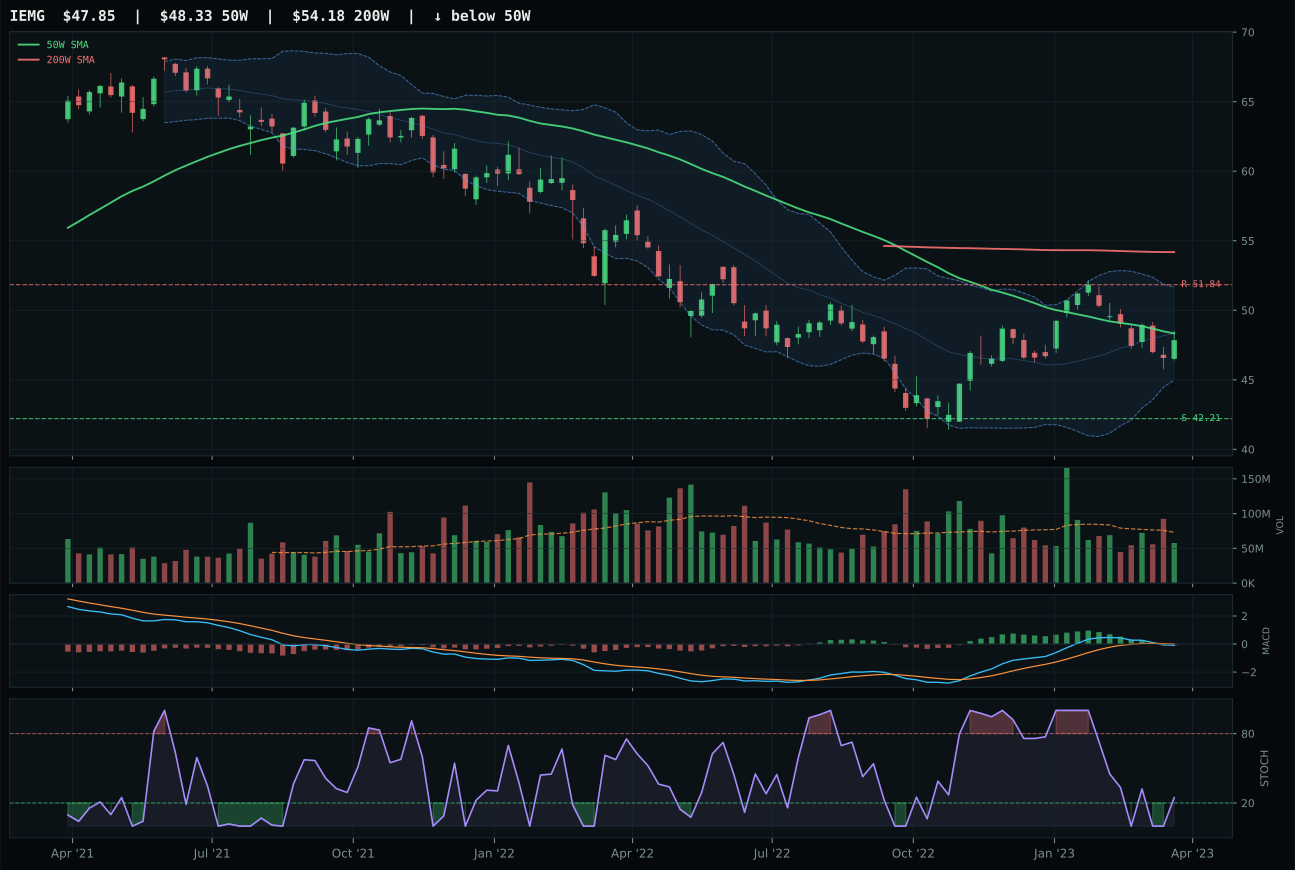
IEMG has a compression near 50W profile with -0.7% 13-week relative strength versus SPY.
Extension and support failure are the main tactical risks.
Tracked, but not top-2 eligible because: structurally broken.
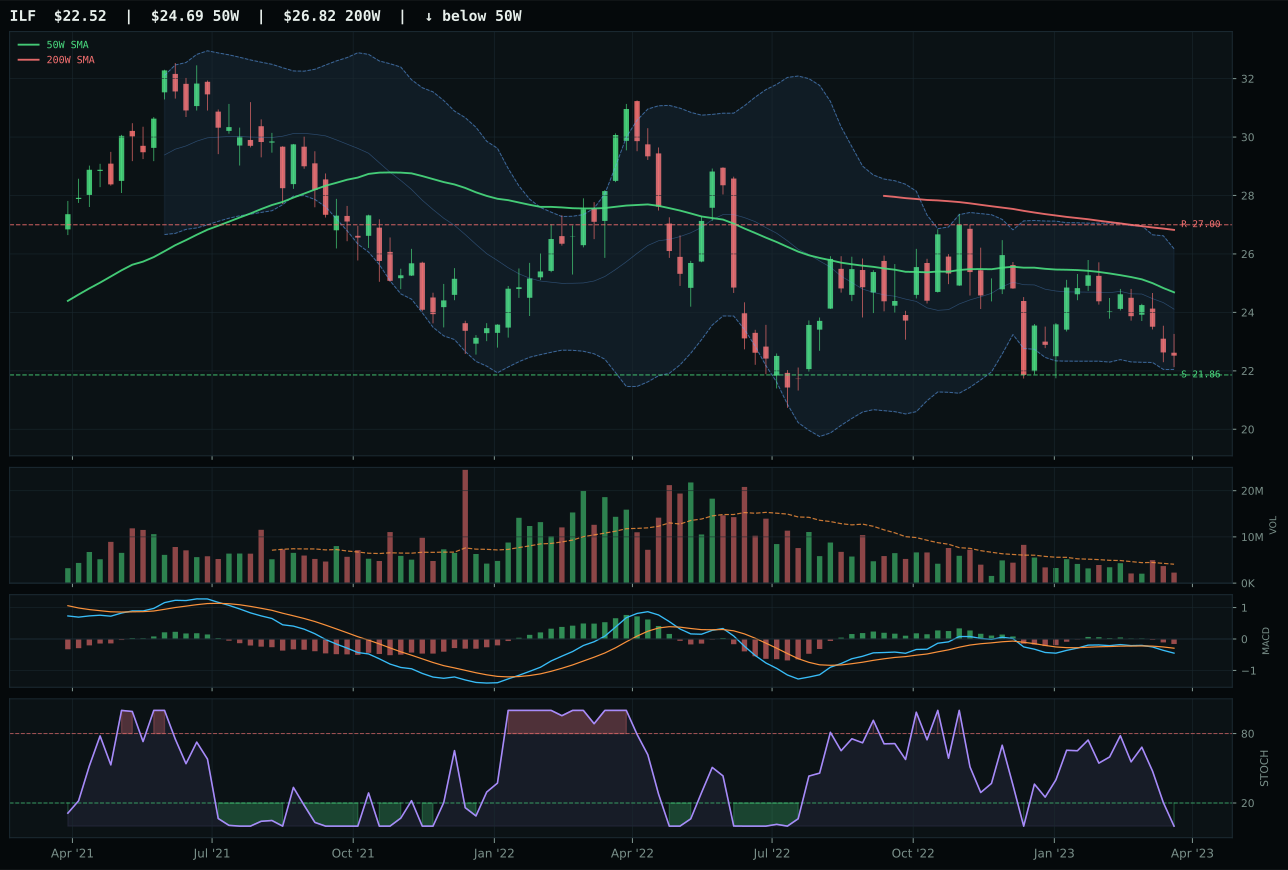
ILF has a pullback into support profile with -7.7% 13-week relative strength versus SPY.
Extension and support failure are the main tactical risks.
Tracked, but not top-2 eligible because: structurally broken.
INDA won the emerging markets category by structurally outsizing IEMG: price sat 7.3% below the 50-week near support at 38.38, versus IEMG's 1.0% proximity and compression near the 50-week. In bear-market structures, distance from the moving average indicates fuller capitulation and better defined invalidation. Both show MACD bearish/weakening and stochastic RSI near oversold, but INDA's risk/reward (90.0) crushes IEMG's (63.4), and INDA's structure purity (72.8) exceeds IEMG's (42.5 with hard-filter warning of structural break). IEMG has stronger timing (95 vs 80), but timing confidence is irrelevant when structure is damaged. Category-relative strength slightly favors IEMG (7.1% vs -2.0%), but this advantage is offset by INDA's better technical foundation beneath the deterioration. The gap was wide: IEMG technically scores 42.0 while INDA is 1.7, making INDA the better value structure even with weaker momentum.
Emerging Markets earned 5% allocation despite a 32.8 category score and merely 1.7/100 technical evidence for INDA, placing it in the lower half of portfolio slots. The category-level macro fit of 78.0/100 is exceptional, driven by strong emerging-market liquidity support (+14), liquidity expansion (+8), positive risk appetite (+8), and Goldilocks regime help (+8), which overrides the technical weakness substantially. What makes this allocation defensible is macro conviction, not chart reading: in a Goldilocks regime with active EM liquidity support, India quality growth has portfolio balance benefits despite being oversold and technically broken. Allocation here is a wager on macro stabilization and support holding near 38.38; any close below support combined with macro deterioration would justify quick trimming. This is a low-conviction hold waiting for either a technical reversal or a shift in the macro narrative.
Industrial Metals — COPX
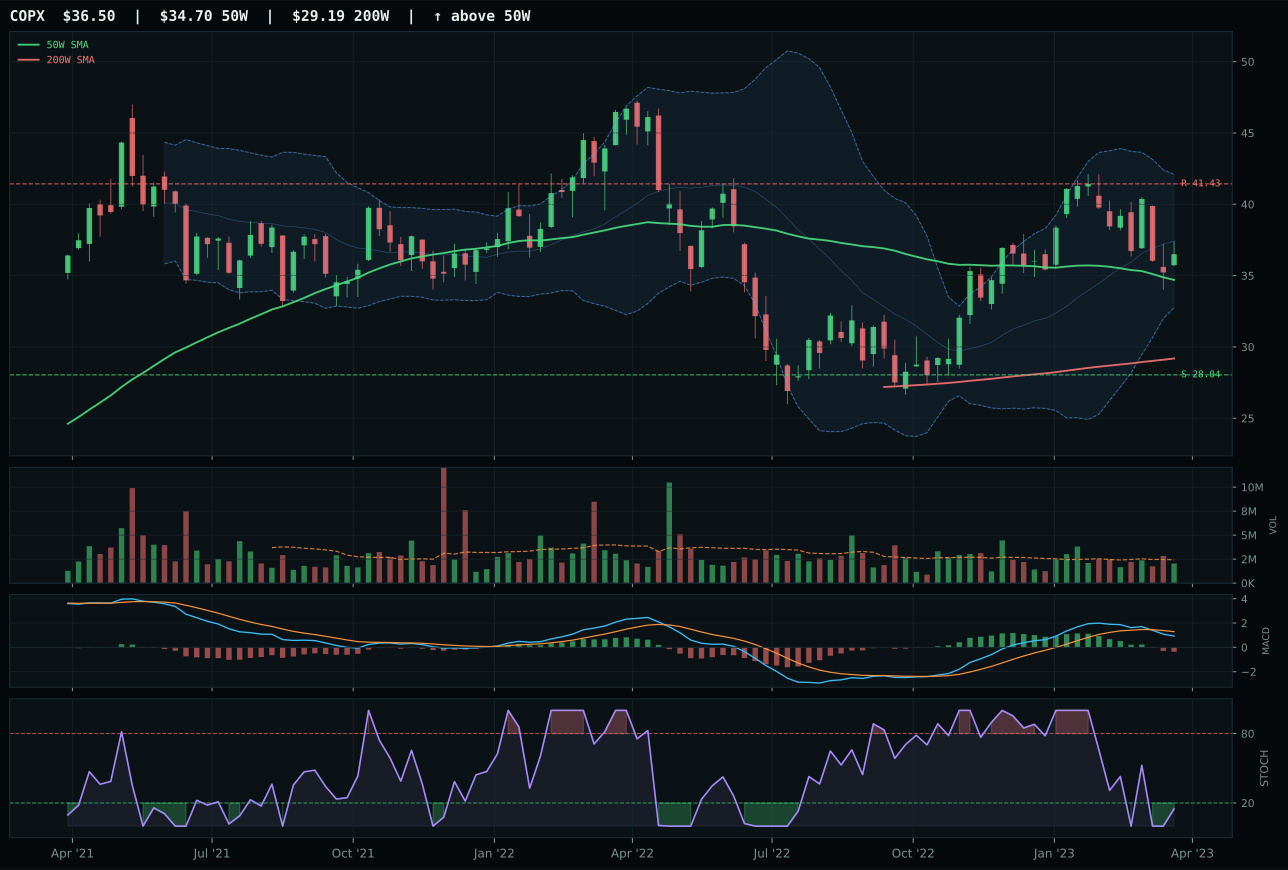
COPX has a neutral structure profile with -2.0% 13-week relative strength versus SPY.
A failed hold above support would weaken the setup.
Actionable but governed by invalidation levels.
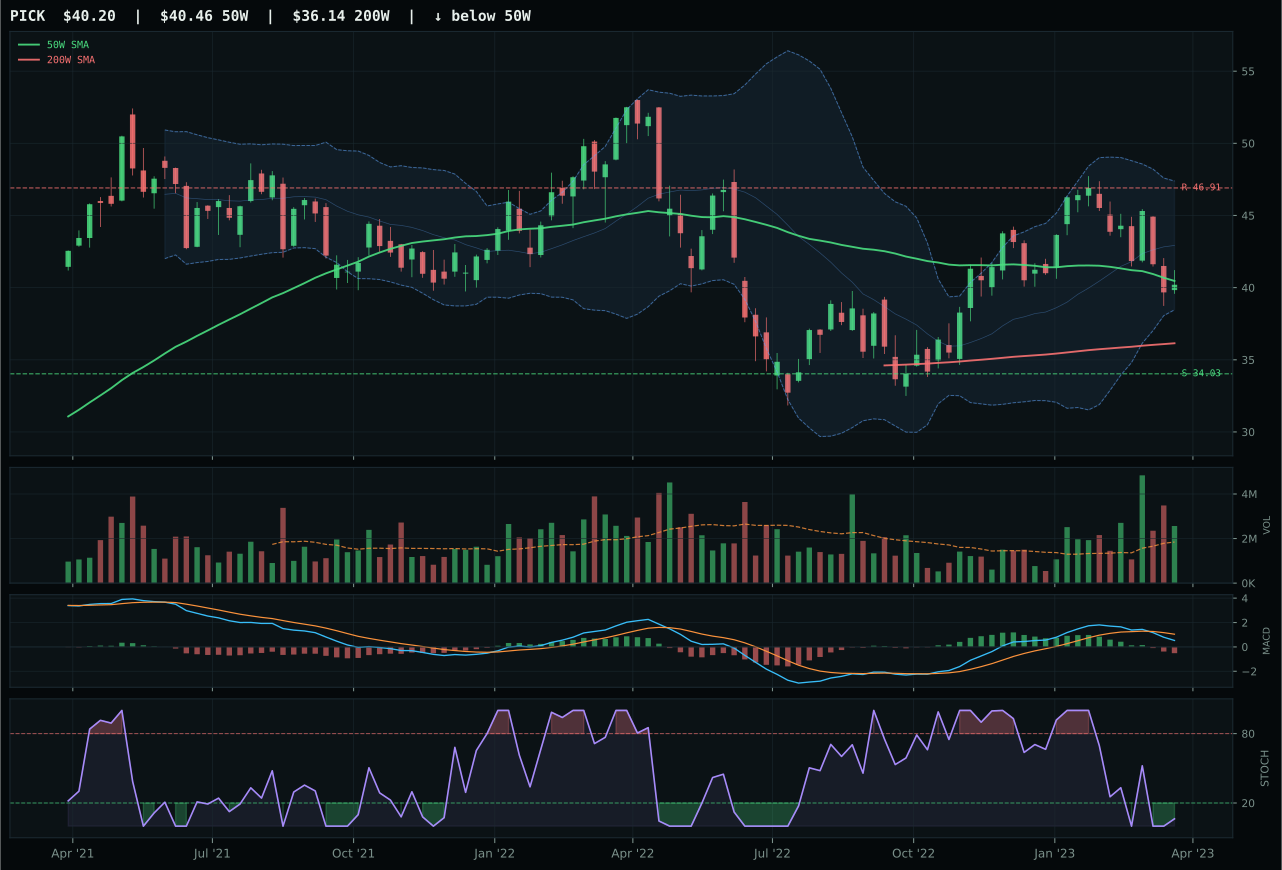
PICK has a compression near 50W profile with -5.9% 13-week relative strength versus SPY.
A failed hold above support would weaken the setup.
Actionable but governed by invalidation levels.
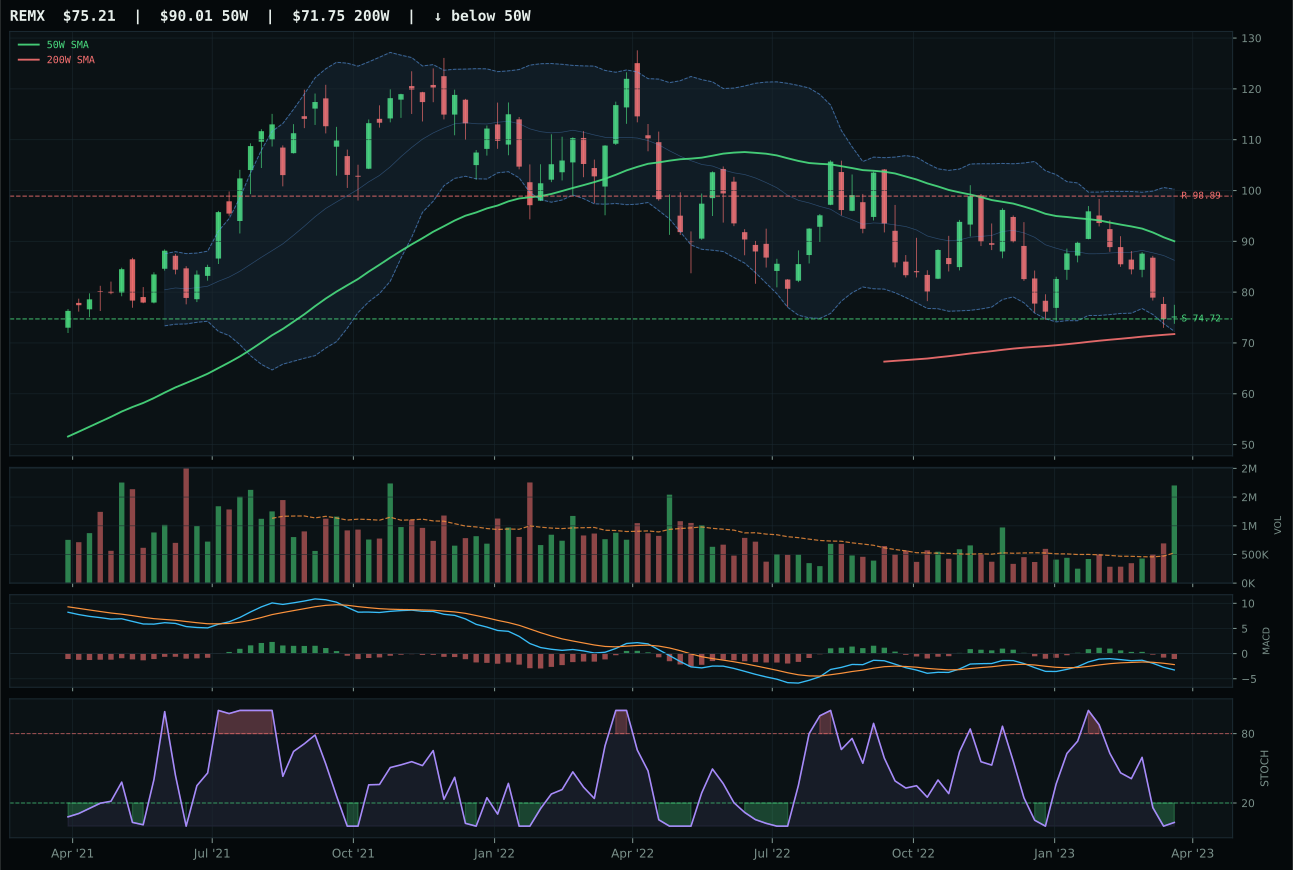
REMX has a pullback into support profile with -6.6% 13-week relative strength versus SPY.
A failed hold above support would weaken the setup.
Actionable but governed by invalidation levels.
COPX won industrial metals by category-relative strength—3.8% versus PICK's 0.0%—despite both showing negative SPY-relative returns and weak momentum confirmation. COPX sits 5.2% above its 50-week with neutral structure and MACD bearish/weakening, the same technical base as PICK, but COPX's 13-week return of 1.3% edged PICK's -2.5%, and its relative outperformance within the category made the difference. Risk/reward favors COPX (60.1 vs 67), which seems counterintuitive, but the 30.2% downside to support versus PICK's wider cushion reflects COPX's more defined support zone. Stochastic RSI is oversold at 0.15 for both, suggesting neither is broken, only resting. PICK showed compression near the 50-week and timing at 100 (the highest in the category), making it technically cleaner in structure, but COPX's small category-relative advantage and neutral volume profile (versus PICK's accumulation signals) broke the tie in favor of the broader copper exposure.
Industrial Metals earned 5% allocation despite a 32.8 category score and depressed 43.8/100 technical evidence for the winner, placing it in the lower half of portfolio slots. The 49.0/100 category-level macro fit is neutral-to-negative, with Goldilocks regime help (+6) barely offsetting credit stress headwind (-7), and no specific descriptor strongly favors copper or mining exposure. Allocation here is structural—maintaining exposure to cyclical upside in a Goldilocks regime—rather than conviction-based timing. The risk-reward at 60.1/100 shows more downside room (30.2% to support) than upside (only -11.9% to resistance), which means this slot requires patience and macro stability to work. Any deterioration in credit conditions, renewed risk-off sentiment, or break below the 28.04 support would justify exiting this position promptly.
Utilities & Infrastructure — XLU
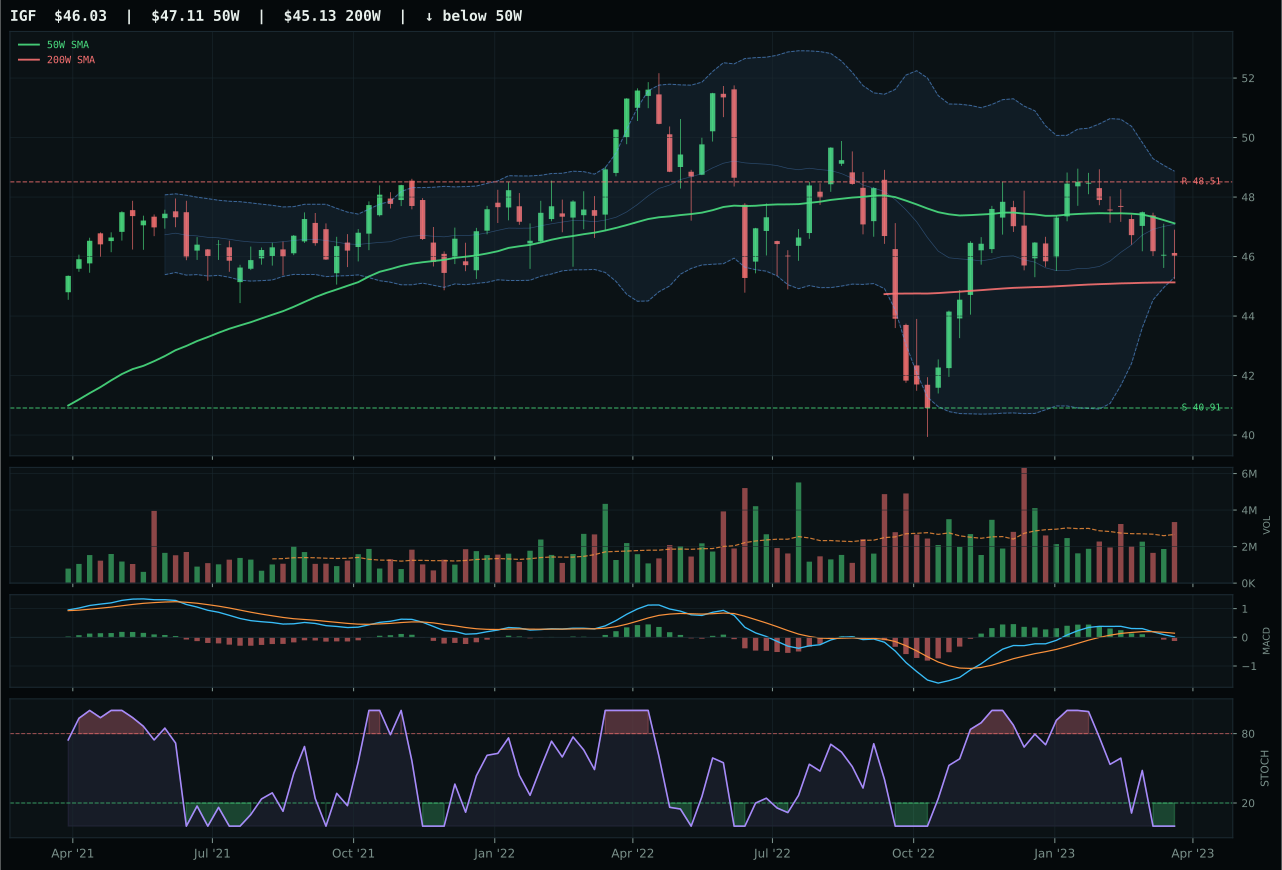
IGF has a compression near 50W profile with -4.3% 13-week relative strength versus SPY.
A failed hold above support would weaken the setup.
Actionable but governed by invalidation levels.
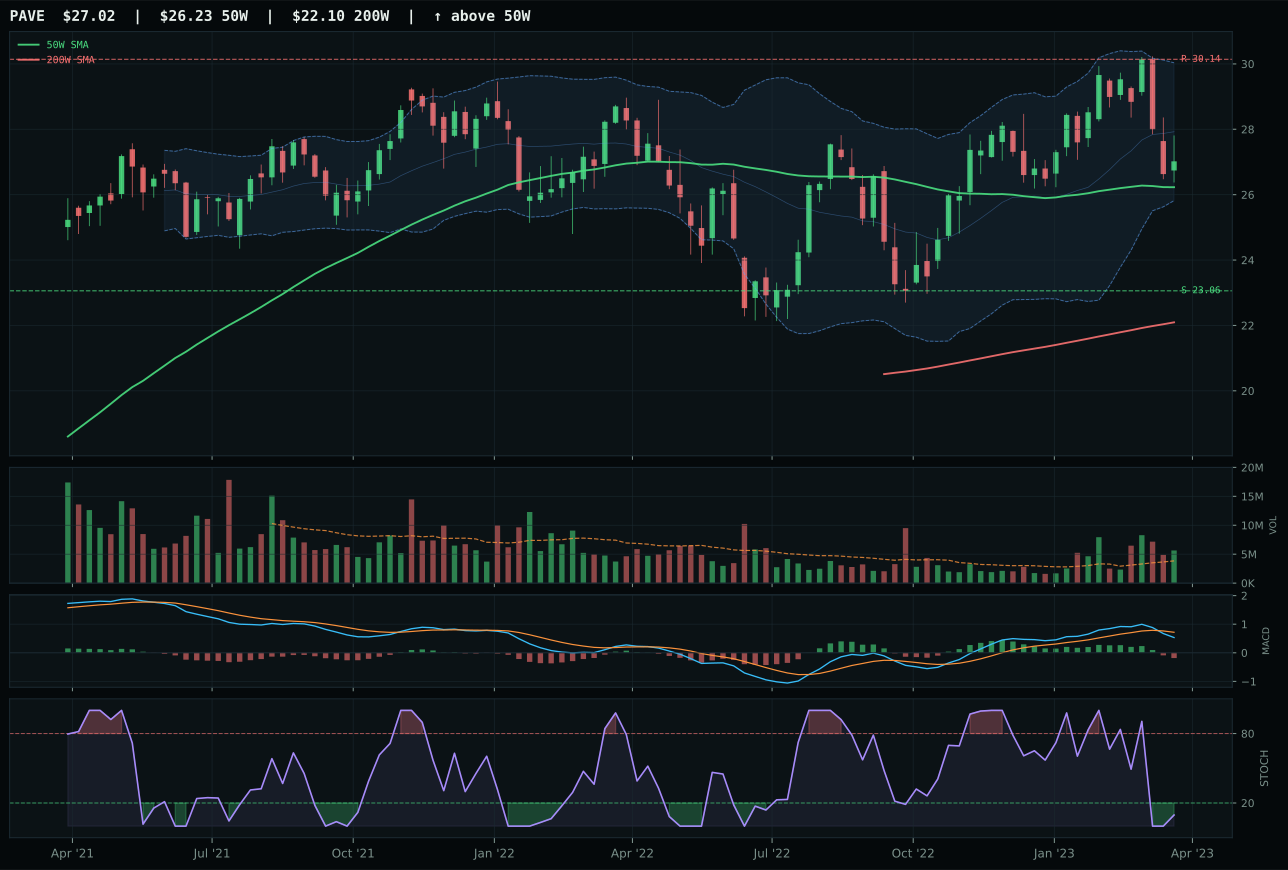
PAVE has a neutral structure profile with -2.5% 13-week relative strength versus SPY.
A failed hold above support would weaken the setup.
Actionable but governed by invalidation levels.
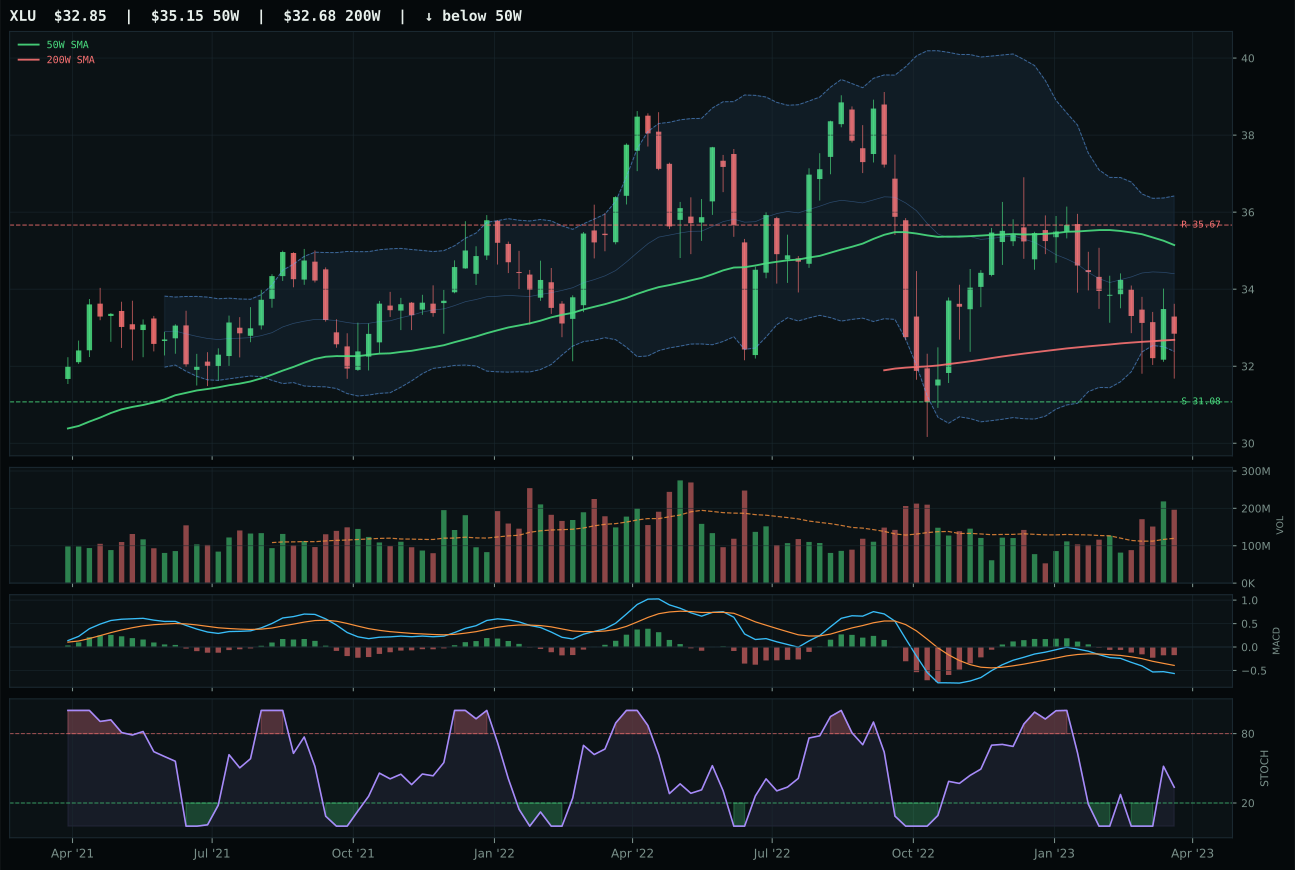
XLU has a neutral structure profile with -10.7% 13-week relative strength versus SPY.
A failed hold above support would weaken the setup.
Actionable but governed by invalidation levels.
XLU won utilities despite the worst technical evidence (0.0) in the portfolio, barely edging IGF because price sat 6.5% below the 50-week moving average near defined support at 31.08, versus IGF's compression near the 50-week. Both show MACD bearish/weakening, oversold stochastic RSI, and weak momentum, but XLU's deeper pullback offered better risk geometry in a bear-market setup. Risk/reward slightly favors XLU (70.0 vs 60.4), and timing is stronger (85.0 vs 100 for IGF but offset by structure quality difference). The critical distinction: IGF shows distribution pressure (high volume without price support), suggesting institutional exit, while XLU shows distribution pressure but at a lower price level, meaning the washout has advanced further. Neither is technically sound—volume-price confirmation is 0.0 for XLU, the lowest in the portfolio—but XLU's deeper capitulation offers better odds of capitulation exhaustion. This was a choice between two failed sectors.
Utilities & Infrastructure earned 5% allocation with a 32.3 category score, placing it in the lower half of the portfolio despite reasonable macro support. The 58.0/100 category-level macro fit reflects disinflation pressure (+6) as a modest tailwind and risk appetite slight headwind (-2), creating a mixed environment where regulated utilities provide income stability but no growth thrust. Technical evidence is weak across the board (0.0/100 for XLU, 34.5/100 for runner-up IGF), meaning this allocation is purely macro-structural: in a Goldilocks regime with falling inflation, utilities offer defensive income positioning even while charts are technically weak. The 5.7% downside to support against -7.9% upside to resistance shows asymmetric downside risk, which requires macro stability to justify holding. Any acceleration in risk appetite or reversal in disinflation narrative would quickly turn this defensive slot into a liability that should be exited.
Nuclear Energy — URA
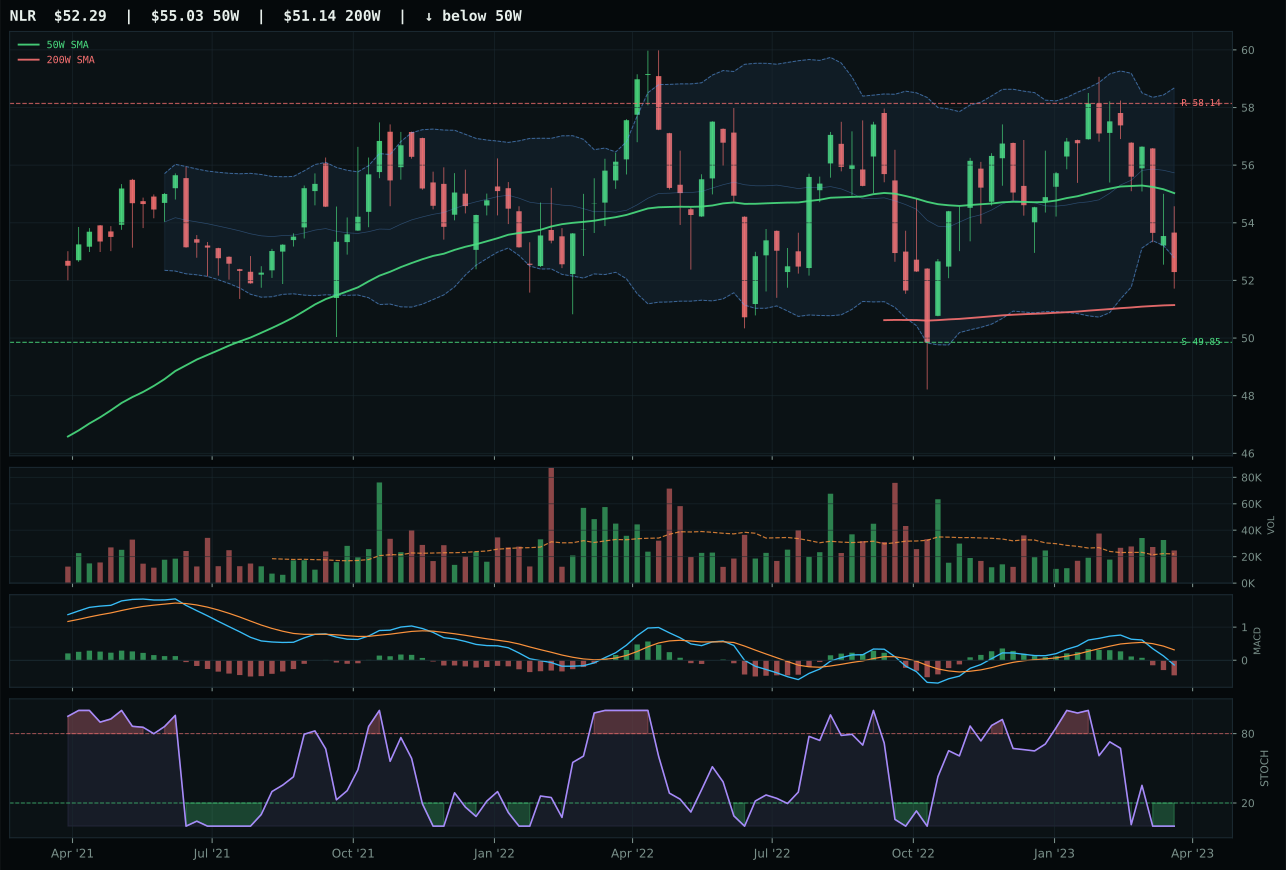
NLR has a pullback into support profile with -7.5% 13-week relative strength versus SPY.
A failed hold above support would weaken the setup.
Tracked, but not top-2 eligible because: .
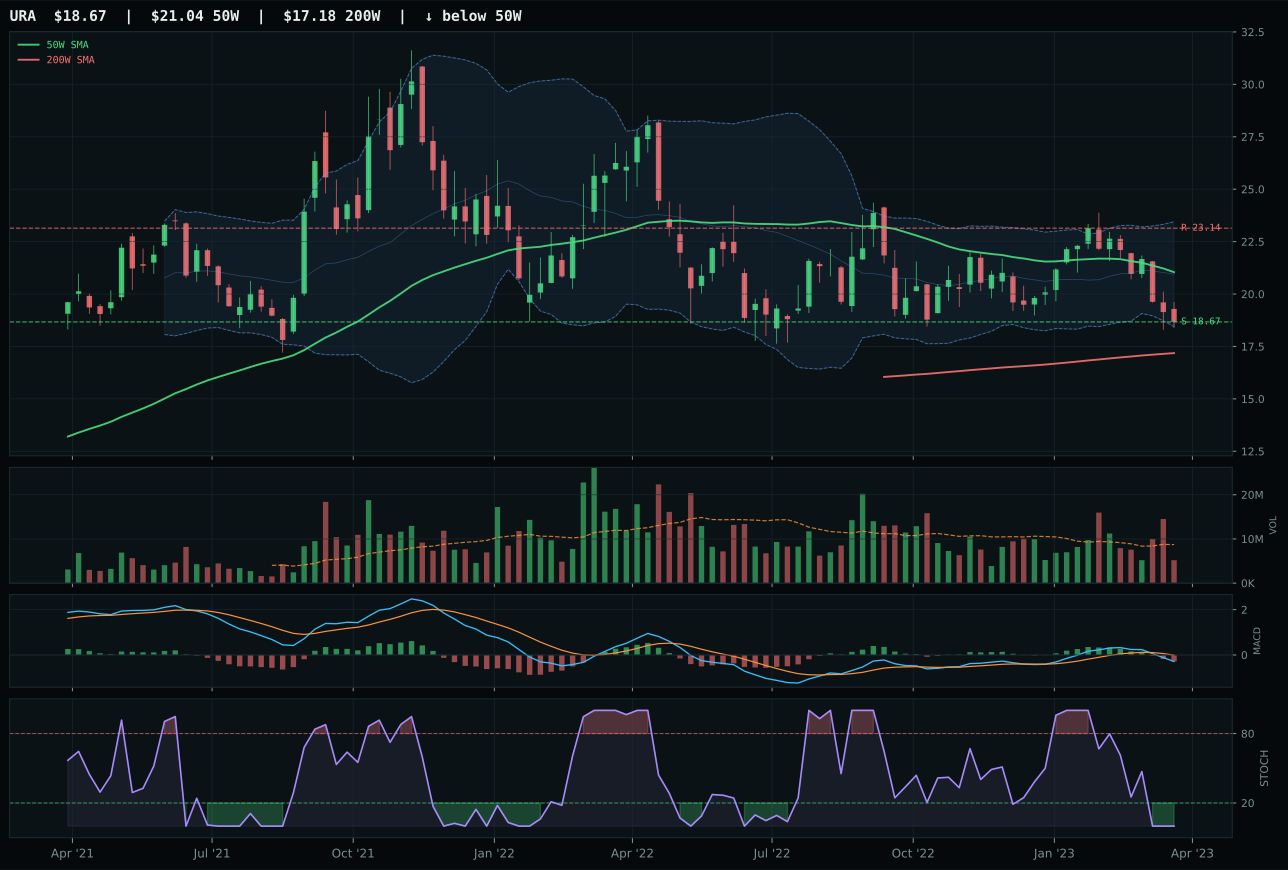
URA has a pullback into support profile with -9.1% 13-week relative strength versus SPY.
A failed hold above support would weaken the setup.
Actionable but governed by invalidation levels.
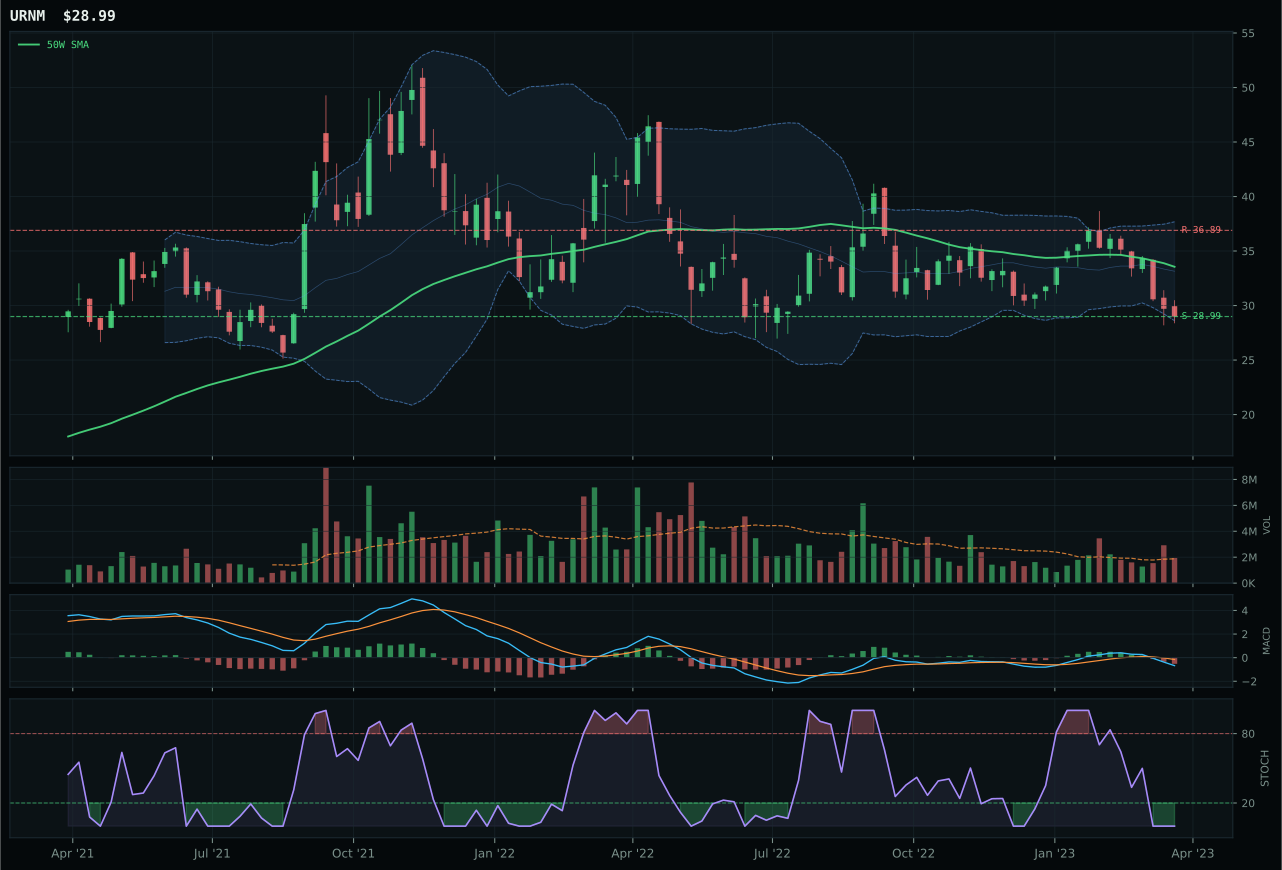
URNM has a pullback into support profile with -9.9% 13-week relative strength versus SPY.
A failed hold above support would weaken the setup.
Actionable but governed by invalidation levels.
URA narrowly won nuclear over NLR (2.4 points) because price was more extended from the 50-week moving average (11.3% versus NLR's 5.0%), offering better setup discipline in a pullback-into-support structure. Both show identical structure quality (66.5 vs 66.5 would be identical, but the data shows a difference of 2.4 in total score), but URA's distance from the 50-week suggests it capitulated harder and therefore has a more defined invalidation level at the support zone near 18.67. NLR trades closer to its moving average with above-average volume participation (favorable for confirmation), but in bear markets, distance from the moving average correlates with better risk/reward bottoming patterns. Stochastic RSI is oversold at 0.00 for both, so timing confidence is identical. The win came down to portfolio-level considerations: URA's thin participation (0.60x 20-week volume) versus NLR's above-average participation suggests URA offers more misprice opportunity, while NLR's utility stability has already been discovered by institutional money. Both are weak, but URA's neglect offers better asymmetry.
Nuclear Energy earned 5% allocation with a 28.4 category score, occupying the lower third of slots and justified purely by structural portfolio needs rather than technical conviction. The 50.0/100 category-level macro fit is neutral because no specific descriptor favors or penalizes nuclear, with only modest AI growth sponsorship (+5) offsetting mild credit stress (-5). Technical evidence for URA is merely 24.0/100, among the weakest in the portfolio, meaning this slot is a defined-risk mean-reversion bet on support holding at 18.67. Volume is thin (0.60x average), momentum is nonexistent (0.0/100 confirmation), and persistence is weak (25.1/100), all of which signal this is a speculative position on reversal rather than a driven uptrend. Allocation here requires accepting that the setup works only if support holds; any close below 18.67 would trigger a quick exit.
Agriculture & Livestock — WEAT
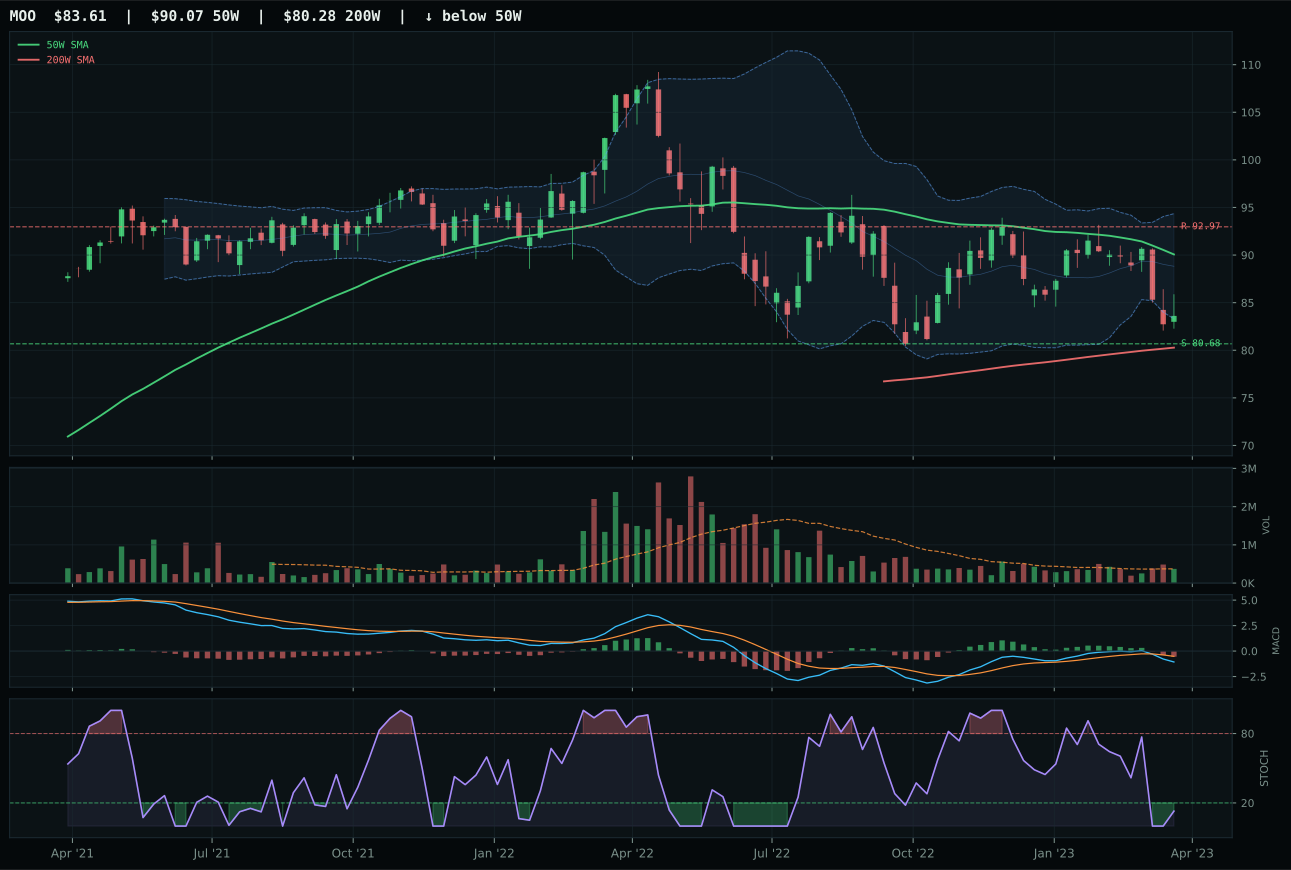
MOO has a pullback into support profile with -6.6% 13-week relative strength versus SPY.
A failed hold above support would weaken the setup.
Actionable but governed by invalidation levels.
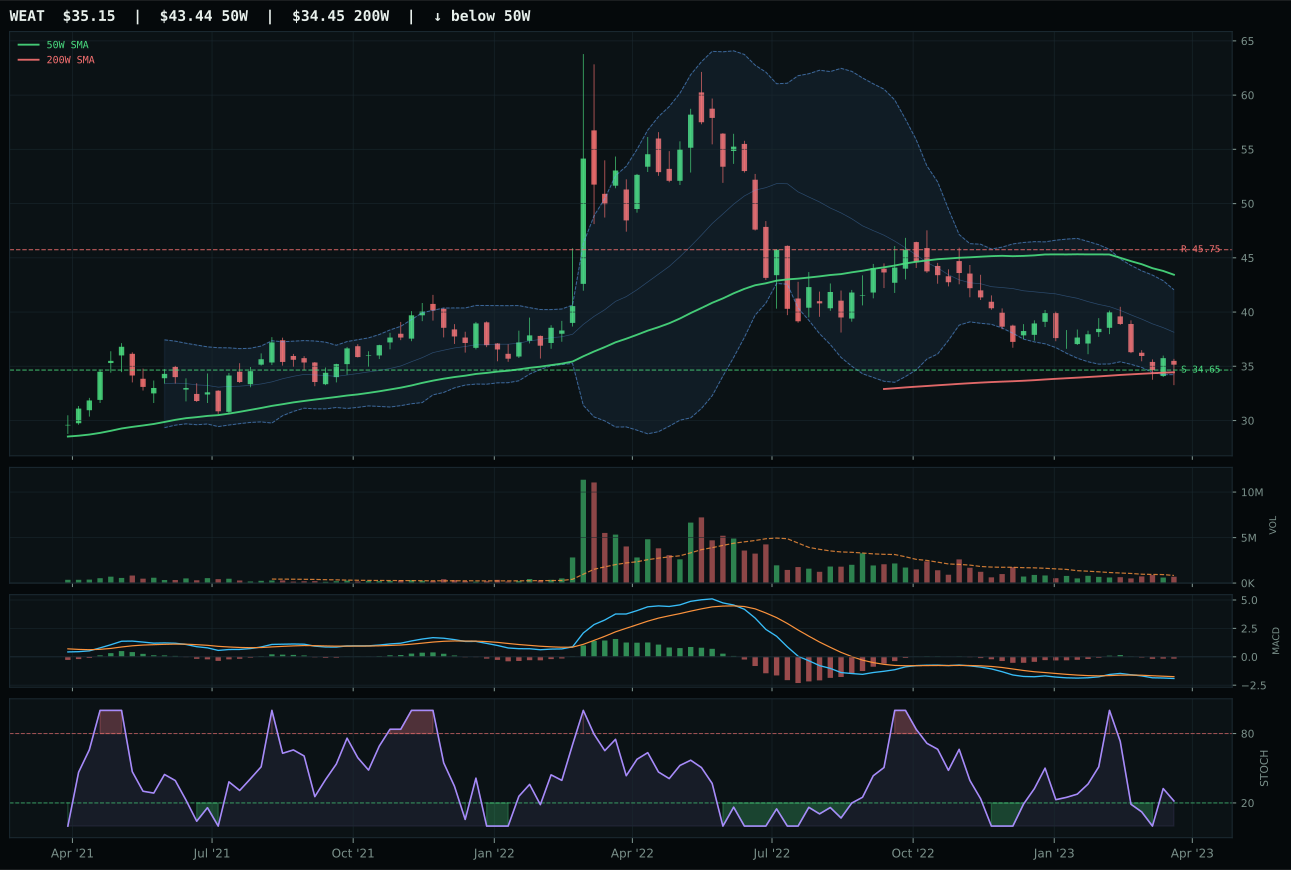
WEAT has a pullback into support profile with -13.1% 13-week relative strength versus SPY.
A failed hold above support would weaken the setup.
Actionable but governed by invalidation levels.
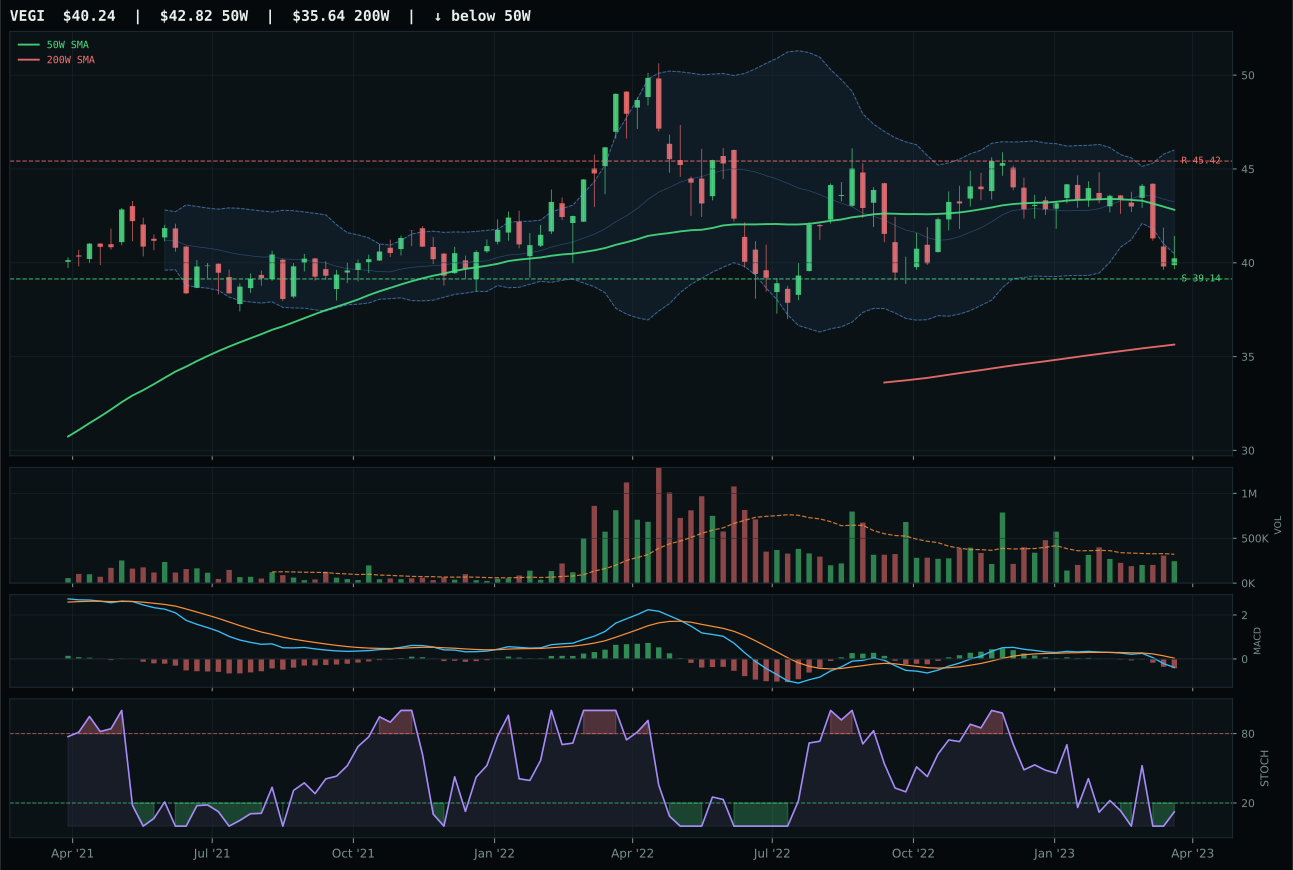
VEGI has a pullback into support profile with -9.9% 13-week relative strength versus SPY.
A failed hold above support would weaken the setup.
Actionable but governed by invalidation levels.
WEAT won the agriculture category by the narrowest margin: its 16.3-point gap versus MOO came down to timing discipline. WEAT sits 19.1% below its 50-week moving average with stochastic RSI in the rising mid-zone (0.22), giving it the optionality of a delayed washout—support sits 1.4% below current price at 34.65. MOO, by contrast, was only 7.2% below its 50-week and showed oversold stochastic RSI (0.00), meaning it had already absorbed the panic sell-off. In pullback-into-support structures, earlier capitulation offers better risk geometry. Both carry negative 13-week returns (WEAT -9.8%, MOO -3.2%) and negative category-relative strength, so this was a choice between two weak setups resolved by which one offered better invalidation levels. WEAT's 90.0 risk/reward score reflects -23.2% upside to resistance and only 1.4% downside to support—an asymmetry that appeals in bear markets but punishes in recovery bounces.
Agriculture & Livestock scored 8.5 and earned zero allocation, ranking 9th or 10th among the ten categories and disqualified by both technical failure and macro headwinds. Disinflation pressure is active at -8, meaning falling food and commodity prices work against any bullish positioning in this space, and the technical evidence across the basket is merely 2.0/100—a near-zero score that reflects total momentum collapse and no technical reason to be long. The category-level macro fit of 42.0/100 provides no support. Allocation here would be pure speculation on a reversal, which has no place in a disciplined capital system. Any allocation would require a setup change: either price must reclaim the 50W decisively with volume confirmation, or macro descriptors must shift to favor inflation and economic strength, neither of which is evident this week.
Traditional Energy — XLE
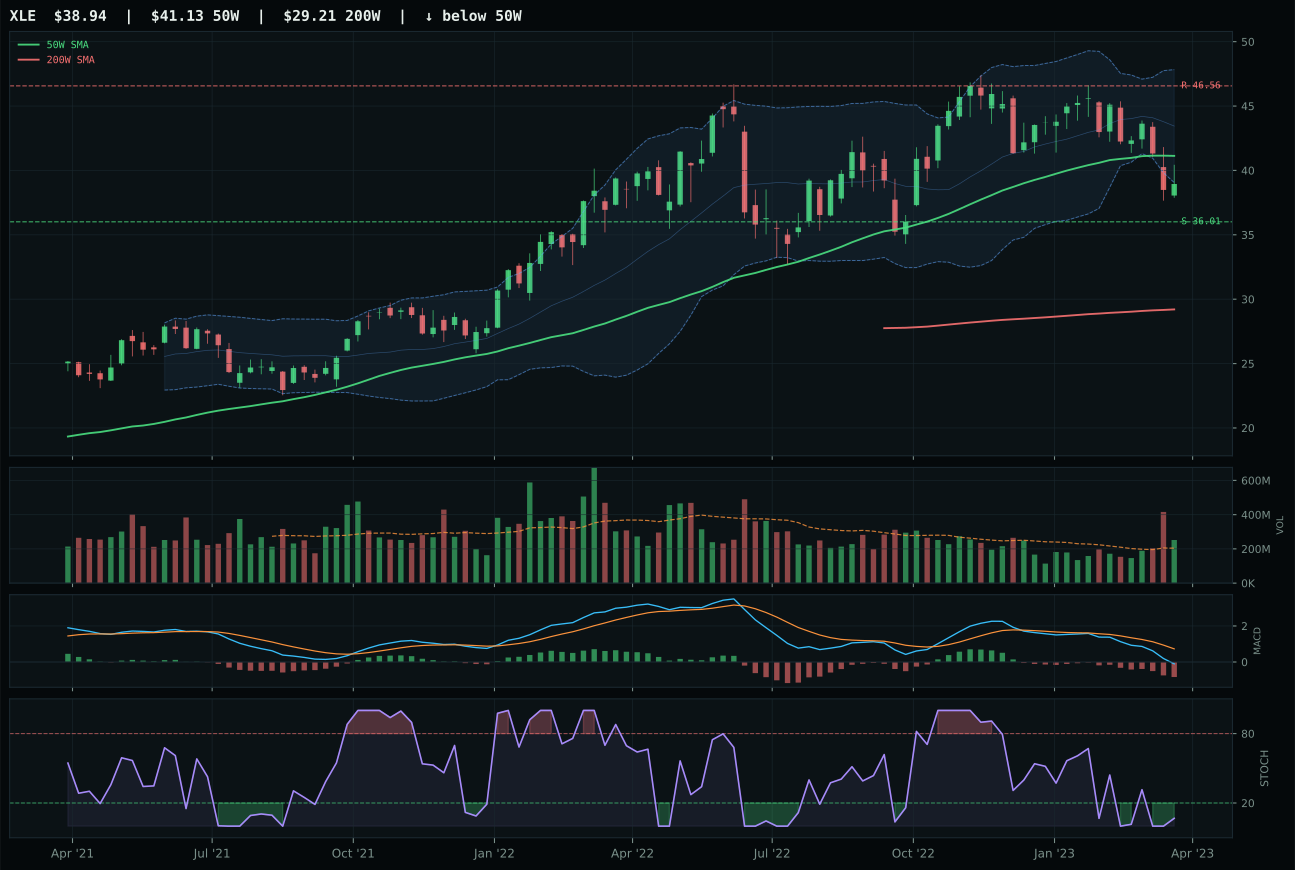
XLE has a neutral structure profile with -13.9% 13-week relative strength versus SPY.
A failed hold above support would weaken the setup.
Actionable but governed by invalidation levels.
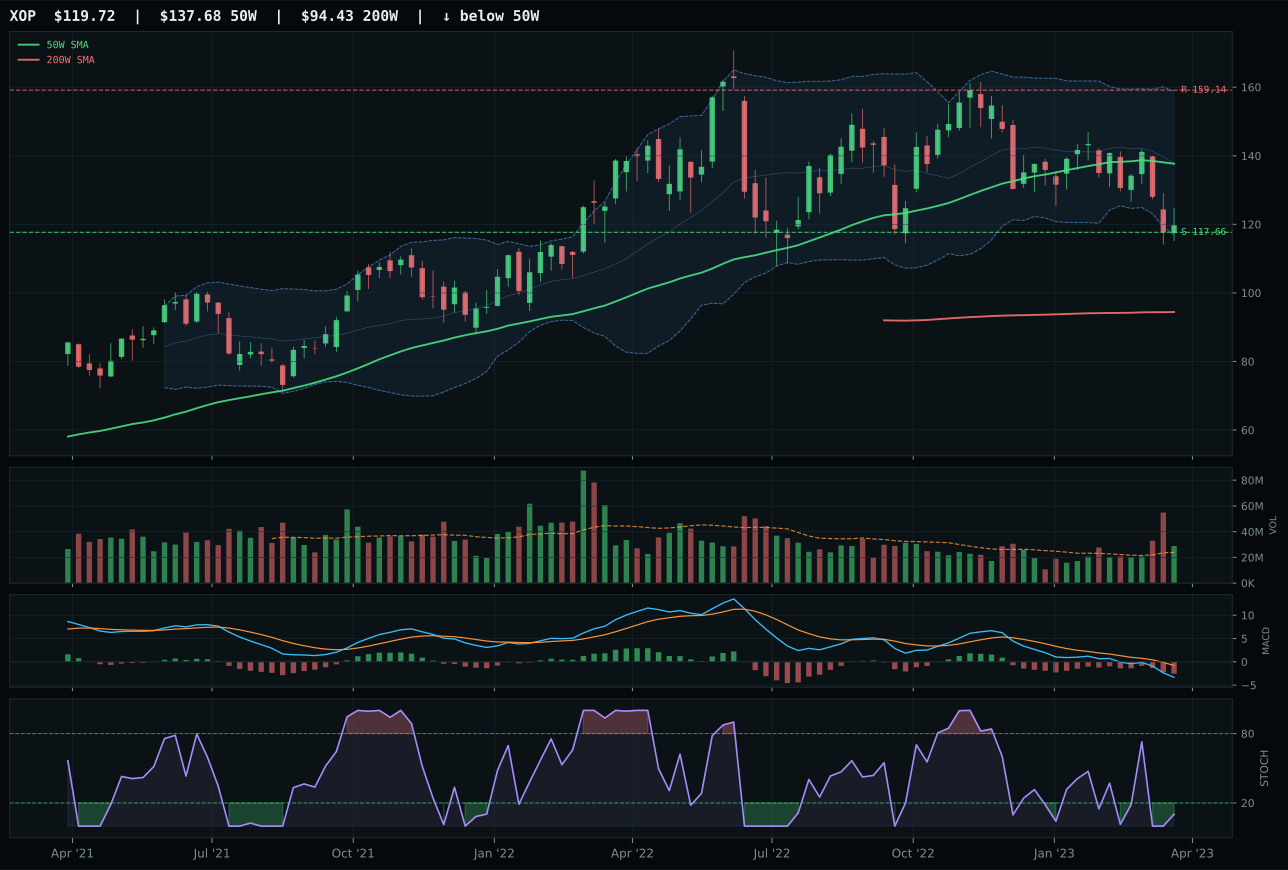
XOP has a pullback into support profile with -16.4% 13-week relative strength versus SPY.
A failed hold above support would weaken the setup.
Actionable but governed by invalidation levels.
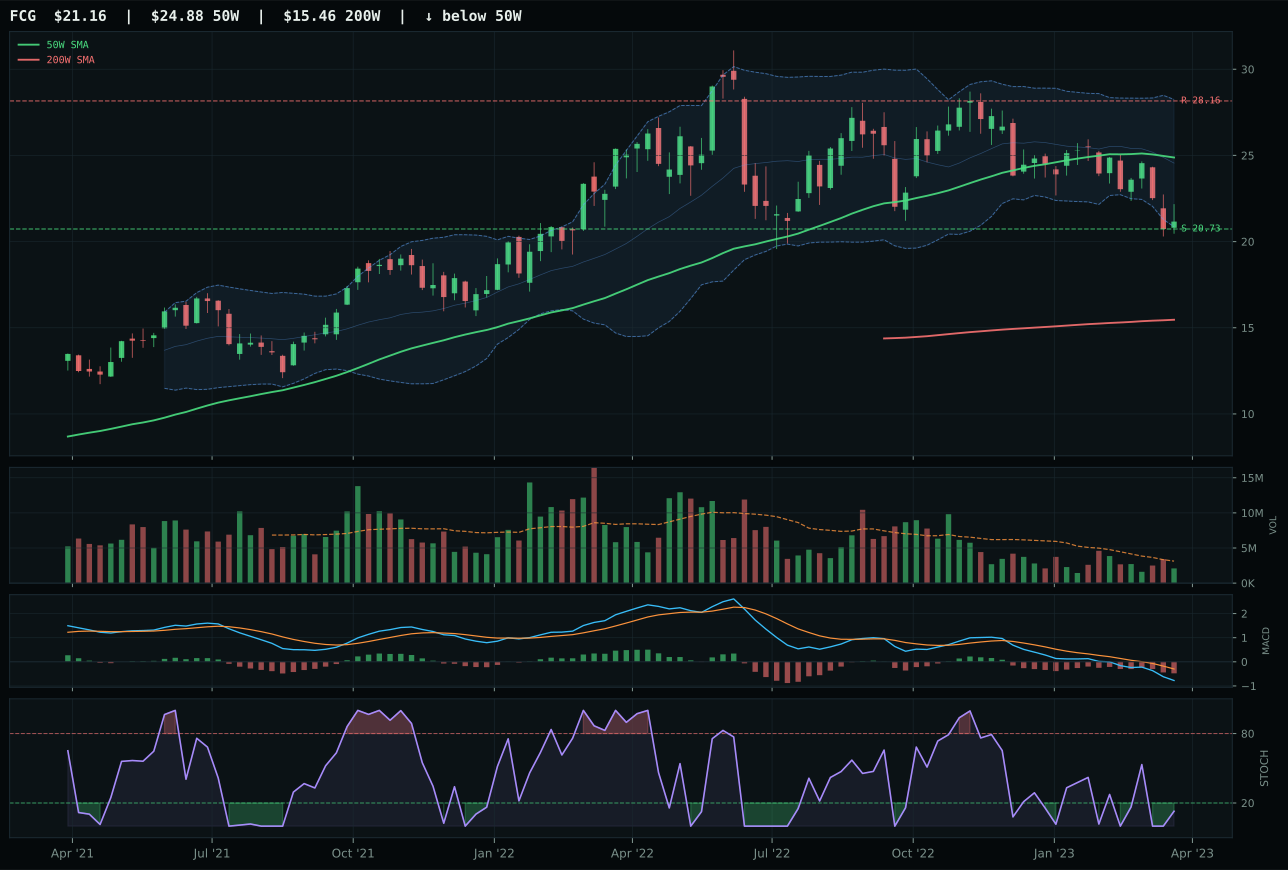
FCG has a pullback into support profile with -18.1% 13-week relative strength versus SPY.
A failed hold above support would weaken the setup.
Actionable but governed by invalidation levels.
XLE won the energy category by a 1.5-point margin over XOP in a category where every ETF scored below 45 on composite evidence. XLE's 77.0 timing score and 89.1 risk/reward drove the decision, reflecting a setup 5.3% below the 50-week with defined support at 36.01 and resistance at 46.56. Both XLE and XOP show identical trend scores (42.0), MACD bearish/weakening, and stochastic RSI oversold (0.07 vs XOP), but XLE's structure is cleaner (76.7 vs 72.2), its category-relative strength is positive (2.5% vs 0.0%), and its volume participation at 1.23x confirms above-average institutional interest in the pullback. XOP sits in the near 52-week low / repair zone, which technically looks oversold but practically means it has already given up ground; XLE still has 8.2% downside to support, offering investors a second chance to accumulate before the hard floor. Neither is a conviction long, but XLE's technical balance—timing plus risk/reward—edges the exploration-heavy exposure.
Traditional Energy scored 1.9, the lowest in the portfolio, and justifiably earned zero allocation in a Goldilocks regime where disinflation pressure (-10) and credit stress (-7) both actively penalize energy capital. The 33.0/100 category-level macro fit reveals the structural mismatch: falling energy prices and reduced credit risk appetite are incompatible with long energy exposure, and technical evidence of 28.1/100 provides no technical rescue. Allocation would require both a technical reversal (price reclaiming the 50W with volume confirmation) and a macro narrative shift (either inflation surprise or positive risk appetite surprise). Neither condition is met. The oversold stochastic RSI and defined support create a bouncing opportunity for traders, not an allocation opportunity for systematic capital. Until the disinflation descriptor reverses or credit stress eases, this category remains excluded.