
2023-03-17
Informational purposes only. The content in this report, including allocations, analysis, and commentary, is provided solely for informational and educational purposes. It does not constitute financial advice, investment advice, trading advice, or any other type of advice. Past performance does not guarantee future results. Always conduct your own research and consult a qualified financial professional before making investment decisions.
Weekly Allocation
| Ticker | Category | Weight | Role |
|---|---|---|---|
| FBTC | 50% | Overlay | |
| XLK | Technology | 10% | Top-2 (10%) |
| SMH | AI | 10% | Top-2 (10%) |
| GLD | Precious Metals | 5% | Tier-2 (5%) |
| XLU | Utilities & Infrastructure | 5% | Tier-2 (5%) |
| ITA | Defense & Aerospace | 5% | Tier-2 (5%) |
| INDA | Emerging Markets | 5% | Tier-2 (5%) |
| URA | Nuclear Energy | 5% | Tier-2 (5%) |
| COPX | Industrial Metals | 5% | Tier-2 (5%) |
Trade Instructions — Monday Open
Sell the tranche from 2023-02-17 (completing its 4-week hold). Buy the new tranche. Instructions show net portfolio changes — same-asset positions cancel, weight changes show the delta.
| Action | Ticker | Instruction |
|---|---|---|
| SELL | COPX | Sell 30% of COPX position (reduce 12.50% → 8.75%) |
| SELL | CIBR | Sell 50% of CIBR position (reduce 10.00% → 5.00%) |
| SELL | PAVE | Sell 50% of PAVE position (reduce 5.00% → 2.50%) |
| SELL | XAR | Sell 33% of XAR position (reduce 7.50% → 5.00%) |
| SELL | URA | Sell 12% of URA position (reduce 10.00% → 8.75%) |
| SELL | SLV | Sell entire SLV position (2.50% of portfolio) |
| SELL | WEAT | Sell entire WEAT position (2.50% of portfolio) |
| BUY | ITA | Buy ITA — 6.25% of freed cash (adds 1.25% to portfolio) |
| BUY | XLK | Buy XLK — 12.50% of freed cash (adds 2.50% to portfolio) |
| BUY | GLD | Buy GLD — 6.25% of freed cash (adds 1.25% to portfolio) |
| BUY | XLU | Buy XLU — 6.25% of freed cash (adds 1.25% to portfolio) |
| BUY | FBTC | Buy FBTC — 62.50% of freed cash (adds 12.50% to portfolio) |
| BUY | INDA | Buy INDA — 6.25% of freed cash (adds 1.25% to portfolio) |
Current Portfolio After Trade
Combined holdings across all 4 active tranches. Each tranche is 25% of the portfolio.
| Ticker | % of Portfolio | Weight Bar |
|---|---|---|
| FBTC | 12.50% | |
| SMH | 10.00% | |
| XLK | 10.00% | |
| URA | 8.75% | |
| ITA | 8.75% | |
| GLD | 8.75% | |
| COPX | 8.75% | |
| XAR | 5.00% | |
| CIBR | 5.00% | |
| MOO | 5.00% | |
| XLU | 3.75% | |
| PAVE | 2.50% | |
| XLE | 2.50% | |
| BOTZ | 2.50% | |
| IGF | 2.50% | |
| PICK | 2.50% | |
| INDA | 1.25% |
Macro Regime — Goldilocks
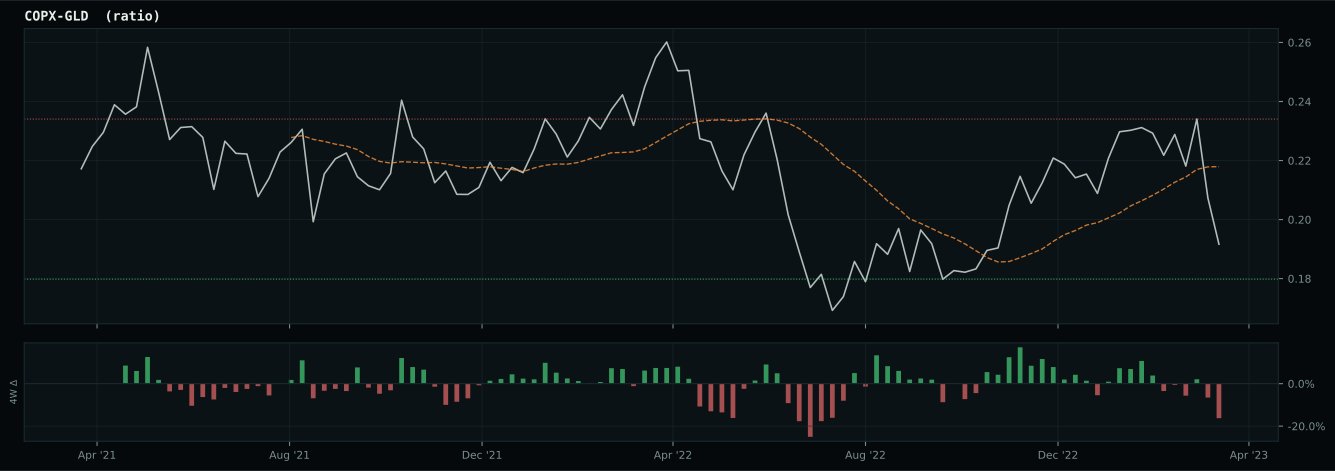
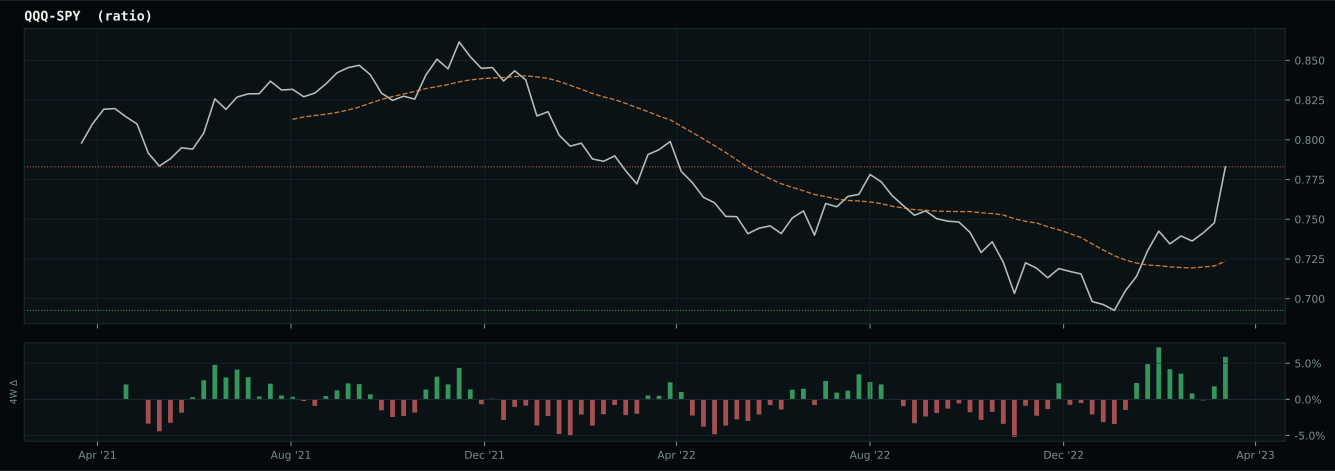
Macro Evidence Charts
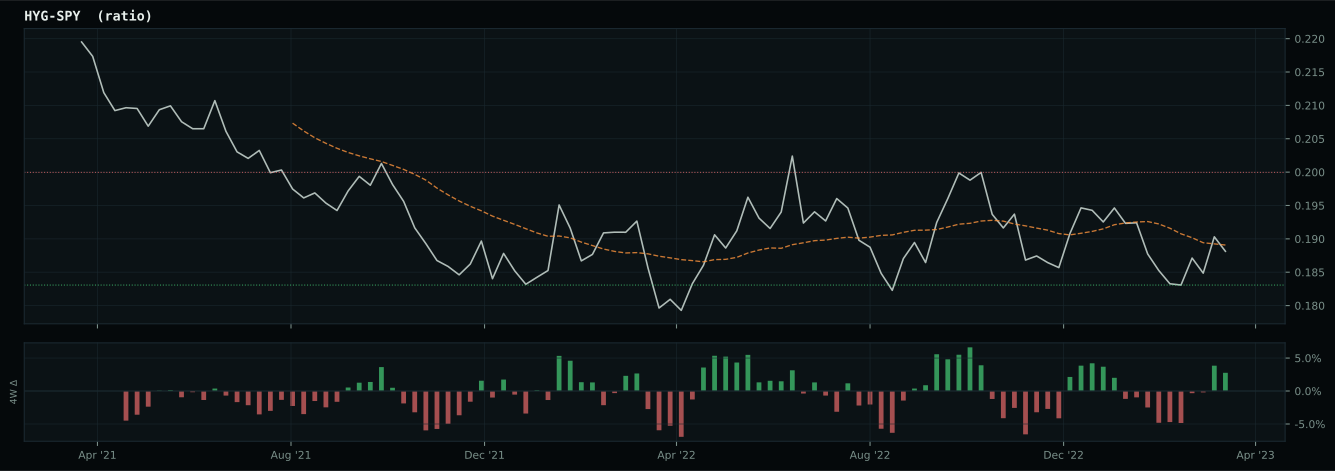
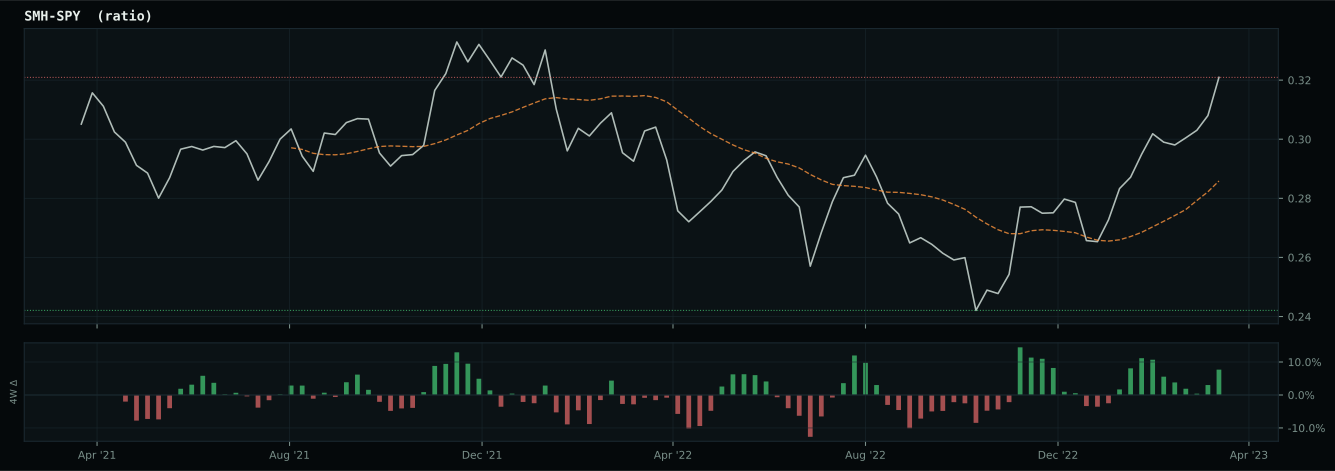
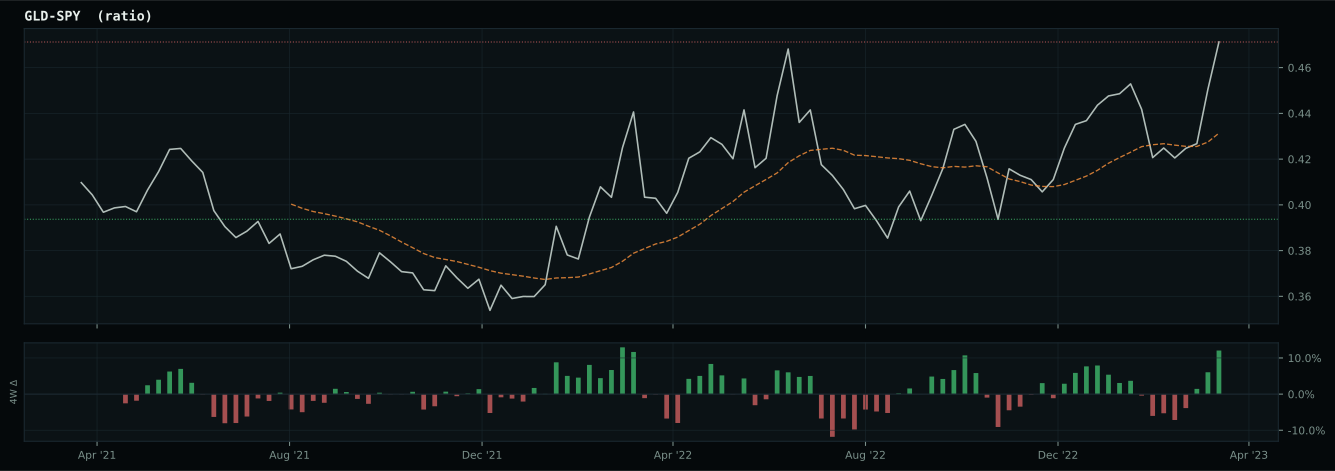
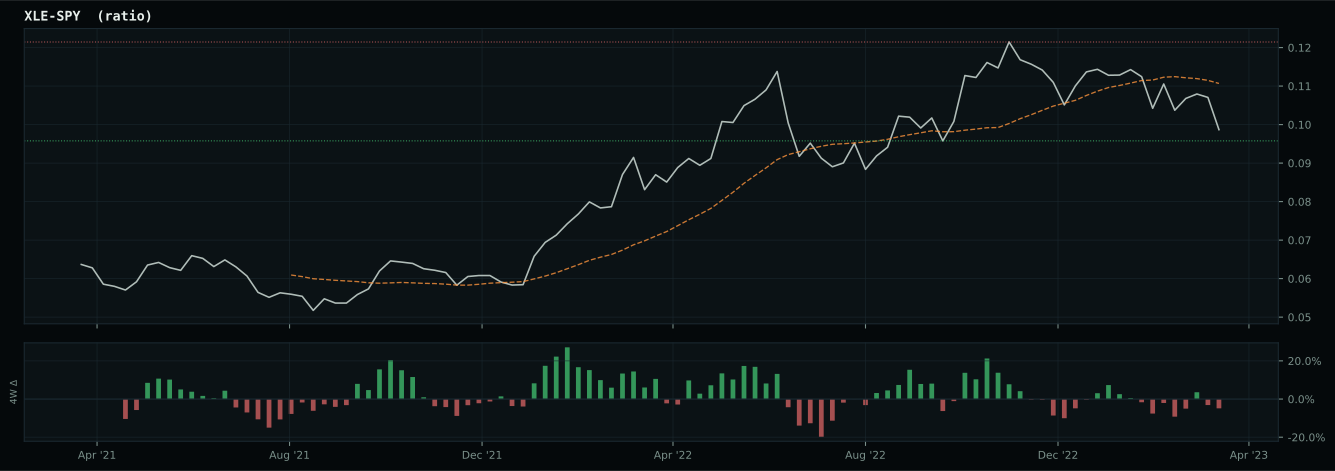
Market-implied signals behind the macro regime scores. Each ratio compares two assets; the direction and slope of the ratio is what the macro engine reads.
Crypto Regime — ValueBTC
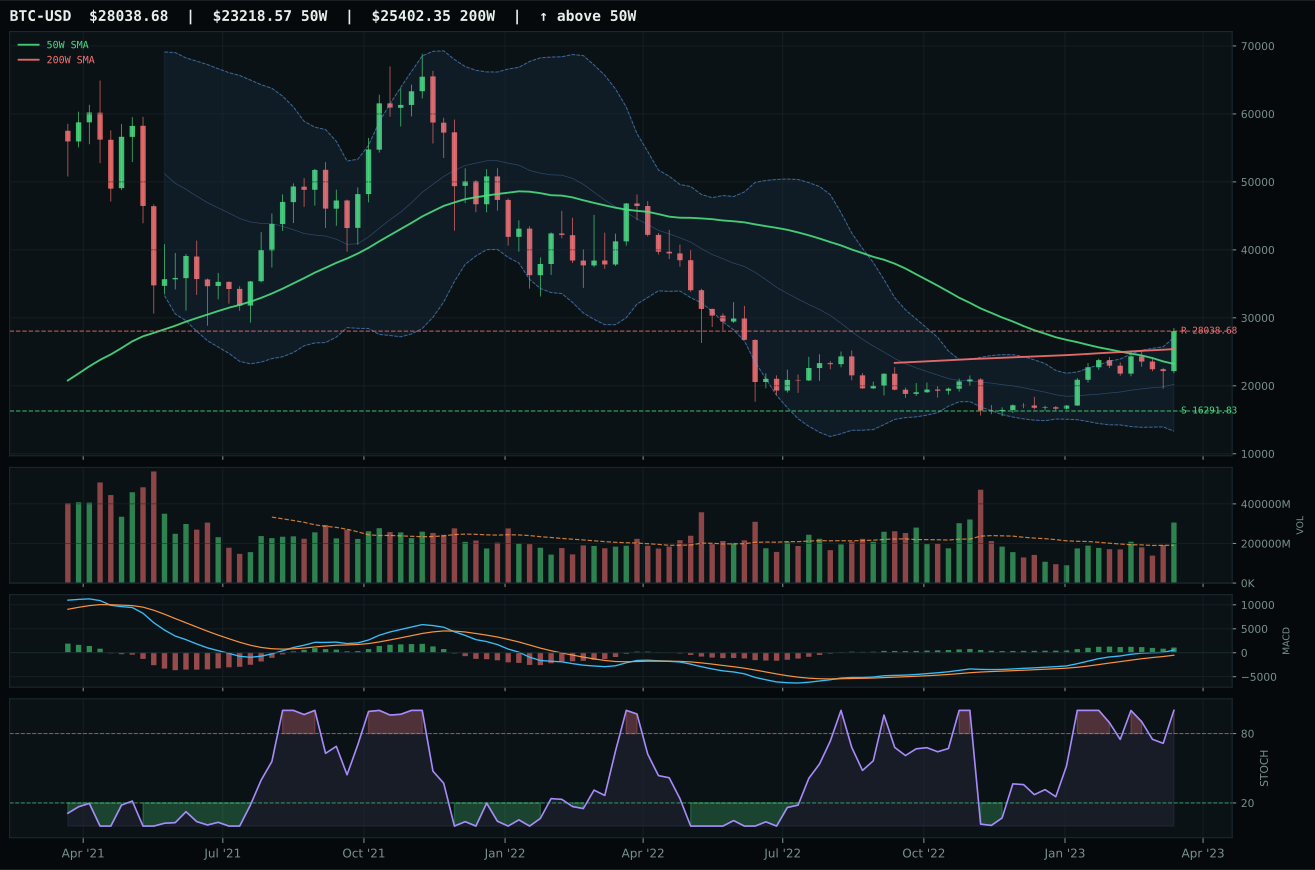
ValueBTC confirmed: BTC first touched the 200W buy zone, built a valid post-touch range, then closed decisively above range resistance by mo…
TrendBTC not confirmed
one or more available conditions failed
Category Rankings
| Rank | Category | Winner | Score | Alloc | 4W Ret | Peers (4W) |
|---|---|---|---|---|---|---|
| 1 | Technology | XLK | 77.7 | 20% | +4.16% | IGV +5.5% · CIBR +4.1% |
| 2 | AI | SMH | 76.0 | 20% | -0.48% | BOTZ +4.7% · AIQ +5.6% |
| 3 | Precious Metals | GLD | 69.7 | 10% | +0.92% | GDX +11.8% · SLV +13.2% |
| 4 | Utilities & Infrastructure | XLU | 42.5 | 10% | +3.65% | IGF +5.8% · PAVE +2.5% |
| 5 | Defense & Aerospace | ITA | 35.4 | 10% | +3.72% | XAR +3.7% · ROKT +2.9% |
| 6 | Emerging Markets | INDA | 30.3 | 10% | +4.30% | IEMG +6.4% · ILF +10.9% |
| 7 | Nuclear Energy | URA | 24.2 | 10% | +3.06% | NLR +4.7% · URNM +2.6% |
| 8 | Industrial Metals | COPX | 22.2 | 10% | +16.40% | PICK +9.2% · REMX +10.6% |
| 9 | Agriculture & Livestock | VEGI | 8.4 | 0% | +4.67% | WEAT -1.7% · MOO +5.2% |
| 10 | Traditional Energy | XLE | — | 0% | +14.24% | FCG +15.8% · XOP +14.7% |
Technology — XLK
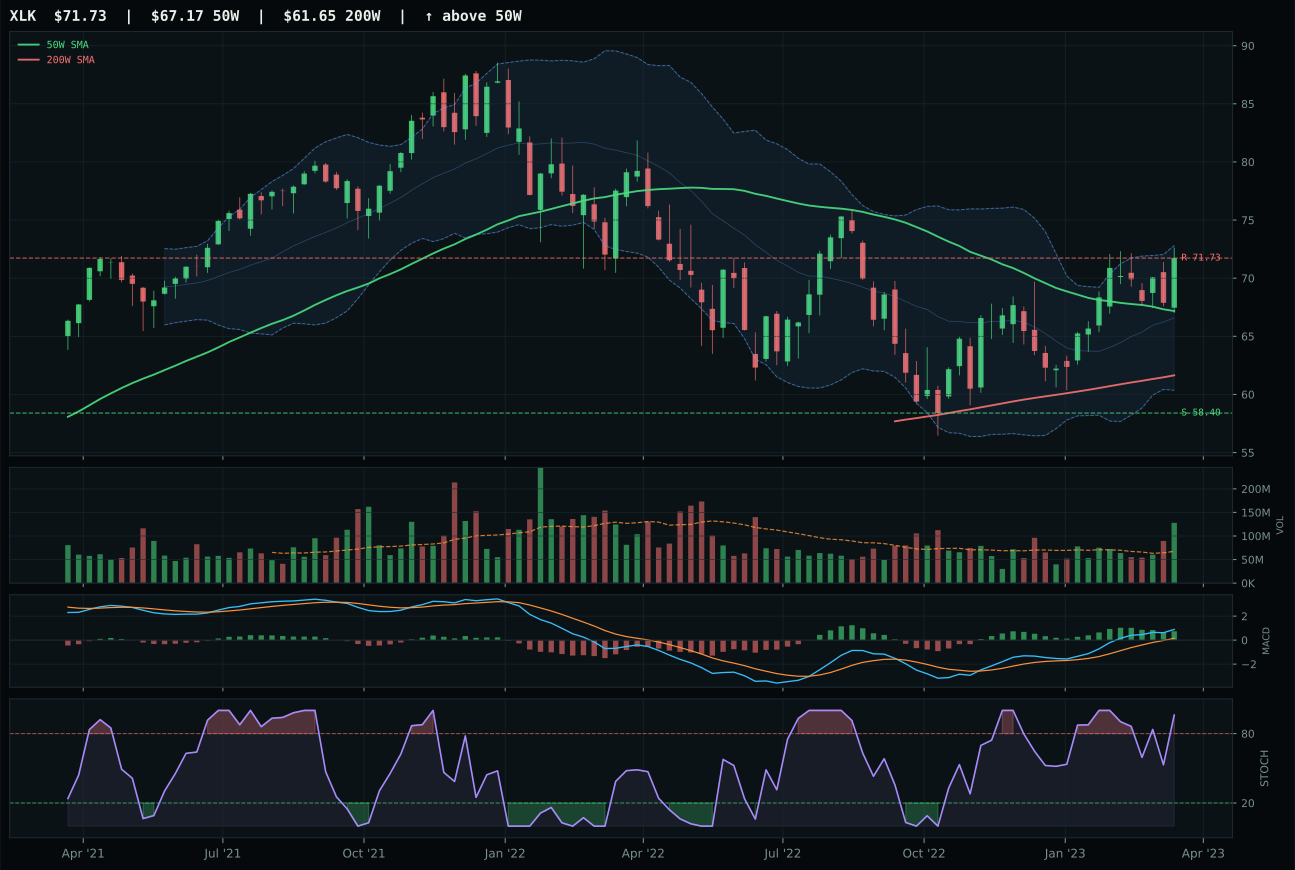
XLK has a neutral structure profile with 10.8% 13-week relative strength versus SPY.
A failed hold above support would weaken the setup.
Actionable but governed by invalidation levels.
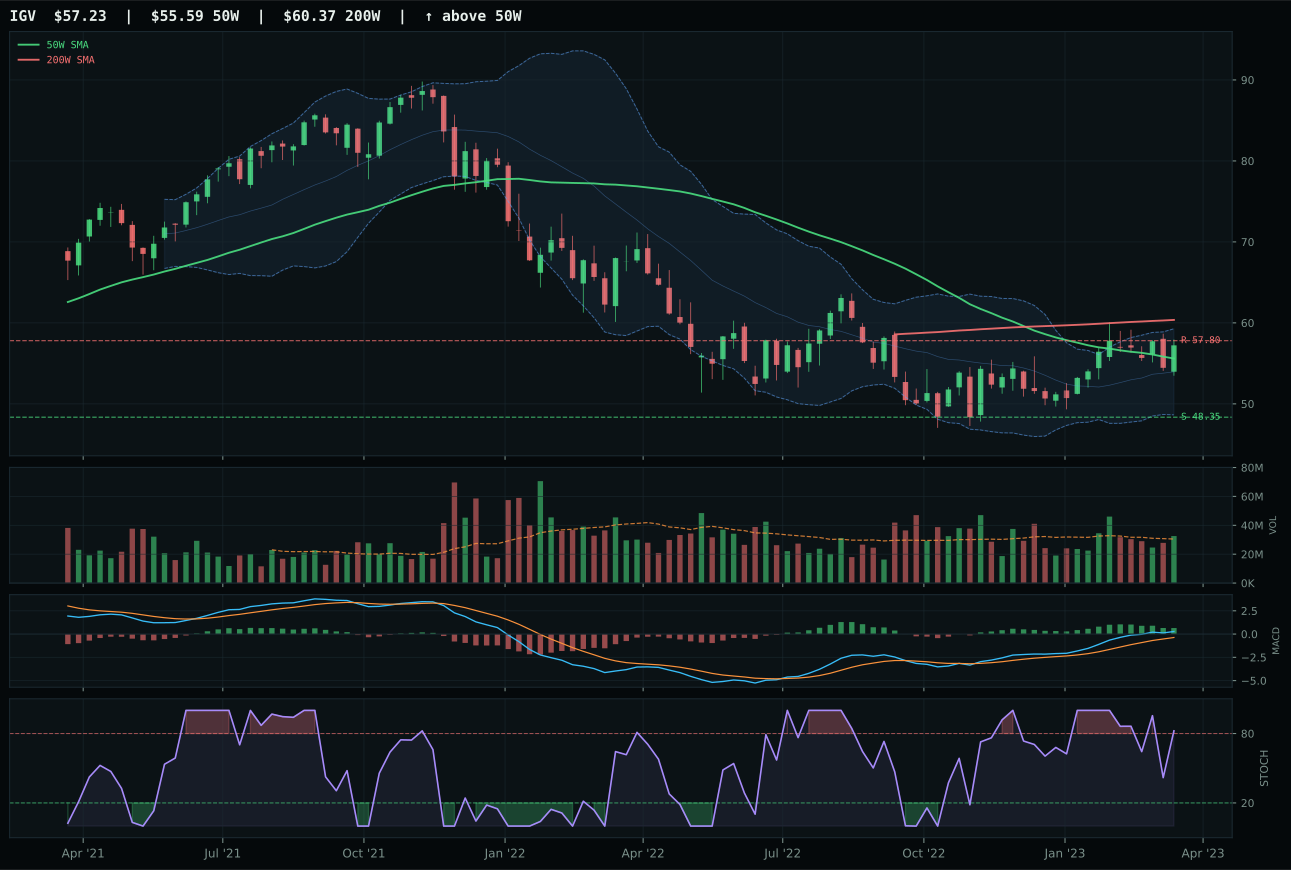
IGV has a compression near 50W profile with 9.2% 13-week relative strength versus SPY.
A failed hold above support would weaken the setup.
Actionable but governed by invalidation levels.
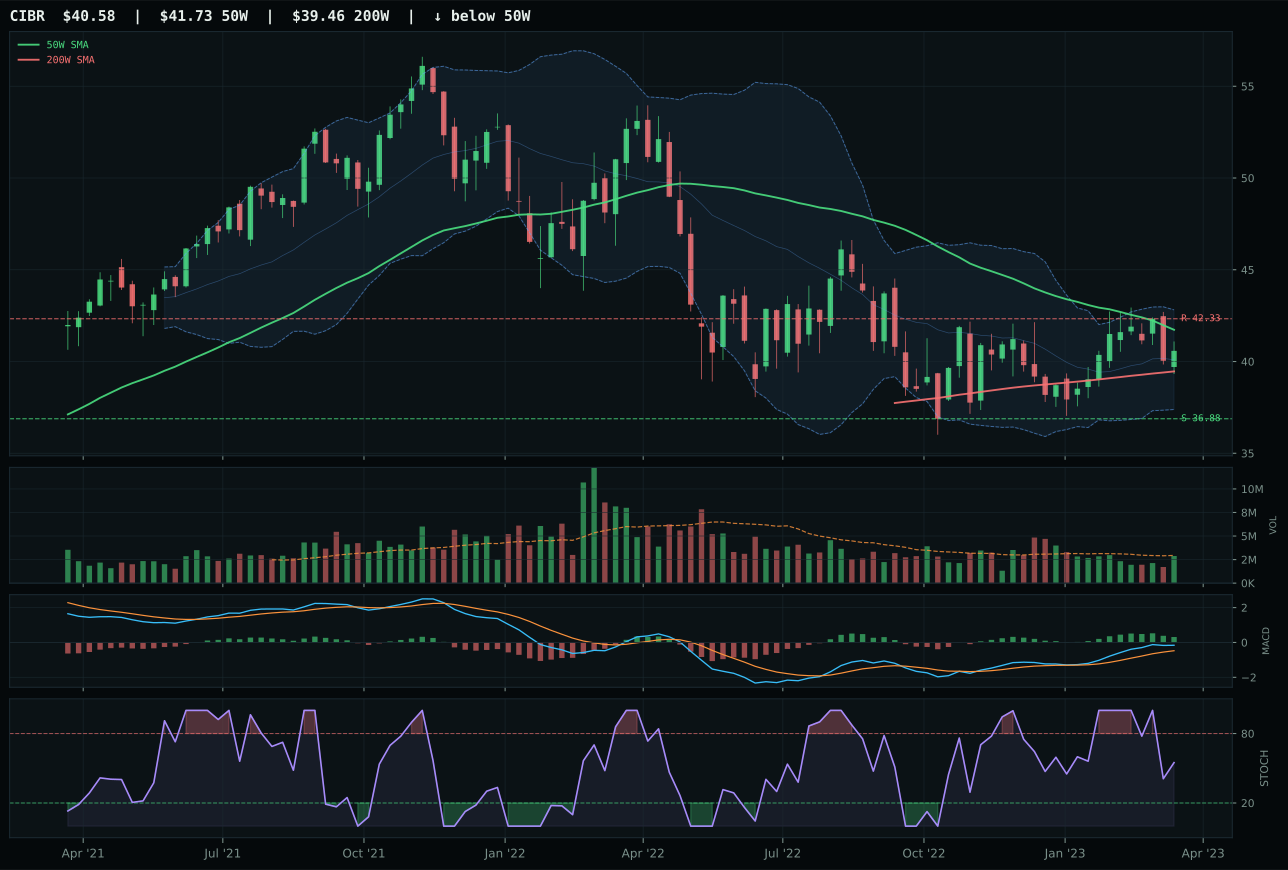
CIBR has a compression near 50W profile with 1.8% 13-week relative strength versus SPY.
A failed hold above support would weaken the setup.
Actionable but governed by invalidation levels.
XLK won the category by combining price momentum above both the 50W and 200W with meaningful relative strength versus SPY at 10.8% and internal category leadership of 1.6%, creating a setup where early buyers are being rewarded rather than trapped. The 13-week return of 12.5% arrived on 1.90x volume confirmation, signaling accumulation into a neutral structure rather than climactic distribution. IGV, the runner-up, lagged on multiple technical fronts: weaker risk-reward (54.0 vs 64.3), less aggressive volume support (neutral vs accumulation), and zero category-relative strength, which matters when the macro backdrop is generous enough to reward breadth. XLK's MACD remains bullish but flattening and the stochastic RSI sits overbought at 0.96, placing it at Fibonacci 0.382 in a decision zone—tight enough to preserve conviction, extended enough to demand patience on fresh entries.
Technology earned its 10% allocation by ranking in the top two categories this week, driven by a category score of 77.7 that reflects strong technical evidence (93.9/100) weighted against macro/narrative fit of 67.0/100. Goldilocks pricing, active liquidity expansion, and positive risk appetite all support this sleeve, while the active AI growth sponsorship descriptor (+4) and monetary hedge bid keep optionality alive if macro conditions shift toward defensive rotations. The tension is real: XLK sits in the upper third of its range with momentum confirmation at 100.0/100, yet distance to resistance is already negative and the 50W slope remains weak at -0.2%, meaning the category needs continued volume sponsorship and breadth confirmation to justify its weight. This allocation reflects confidence in near-term technicals and macro regime support, not a structural breakout that will compound without fresh evidence.
AI — SMH
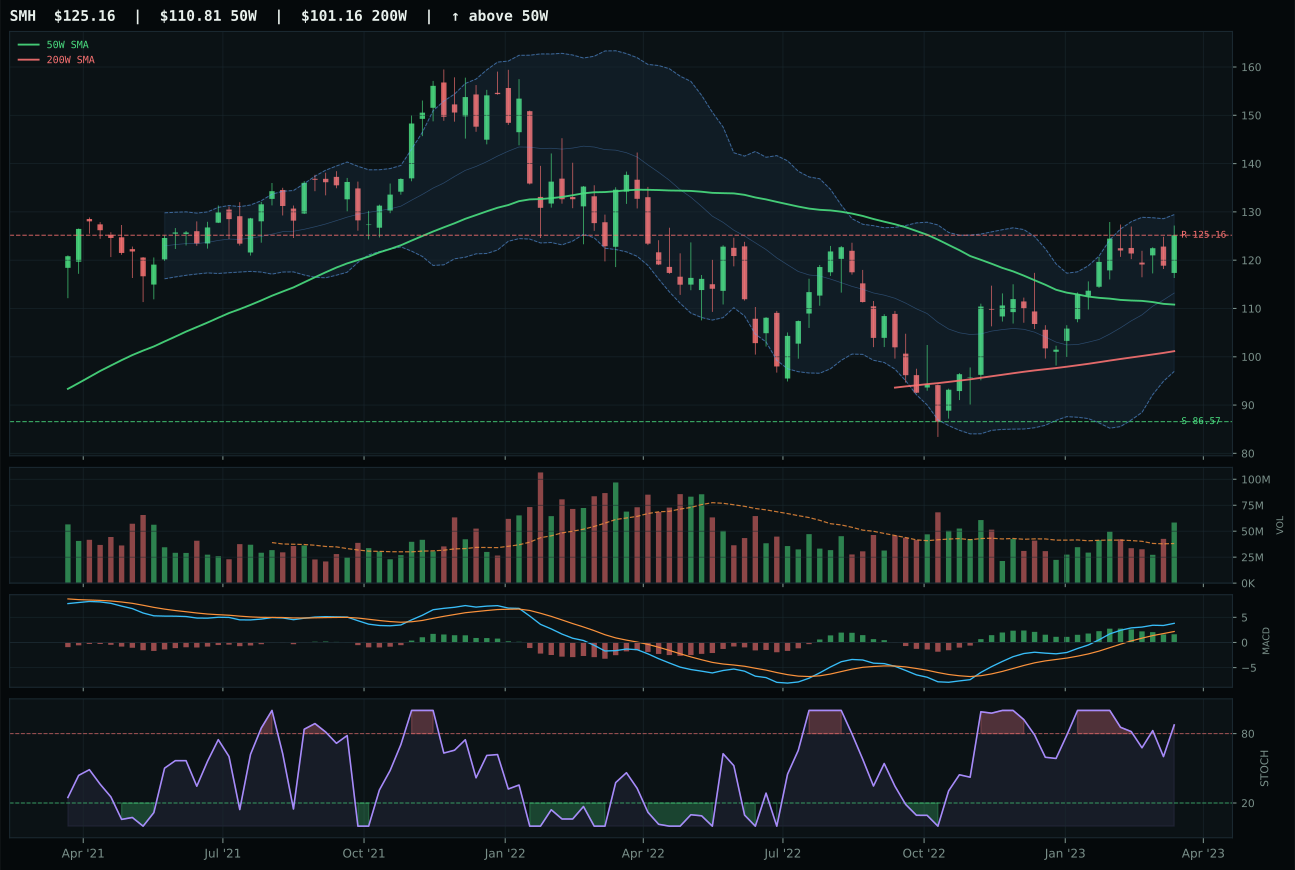
SMH has a neutral structure profile with 15.4% 13-week relative strength versus SPY.
A failed hold above support would weaken the setup.
Actionable but governed by invalidation levels.
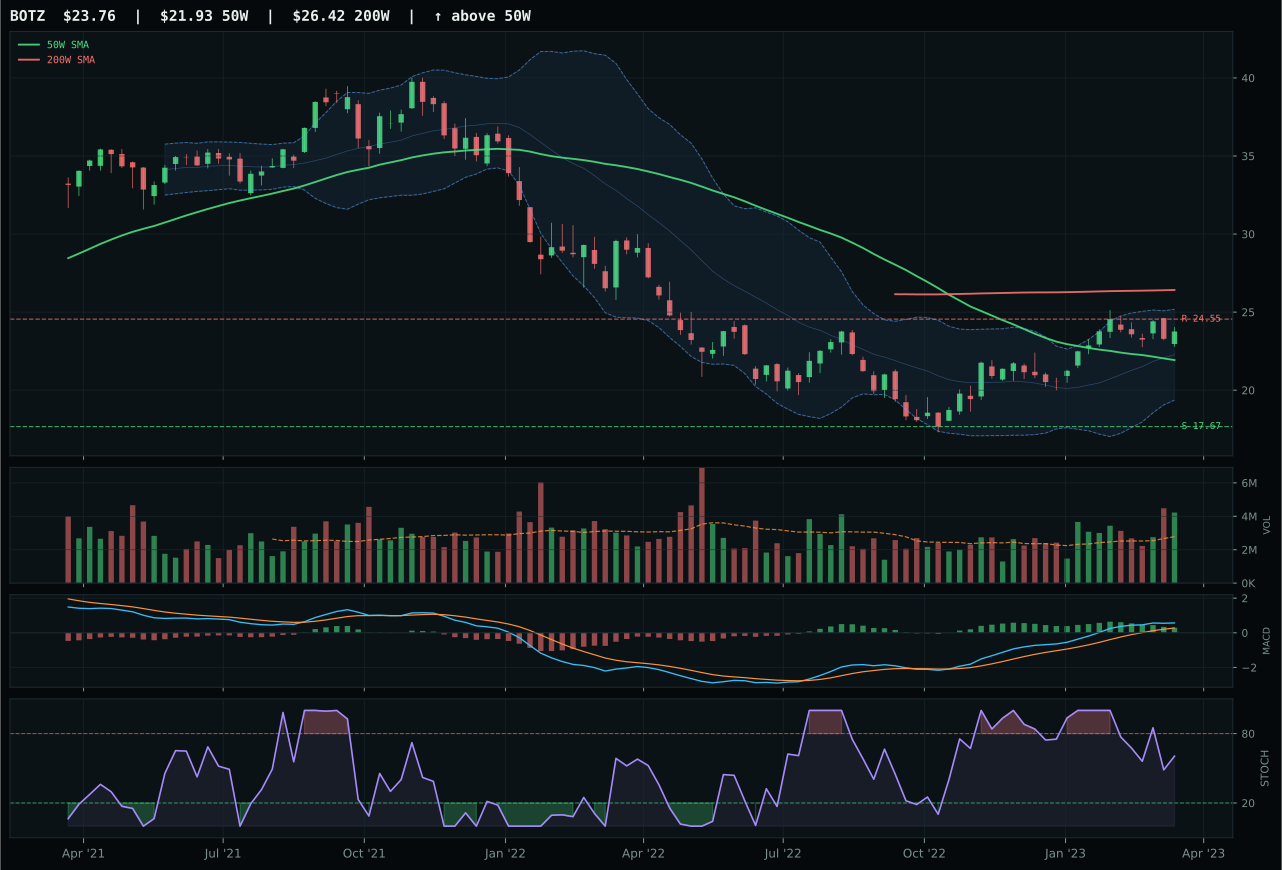
BOTZ has a neutral structure profile with 11.6% 13-week relative strength versus SPY.
A failed hold above support would weaken the setup.
Actionable but governed by invalidation levels.
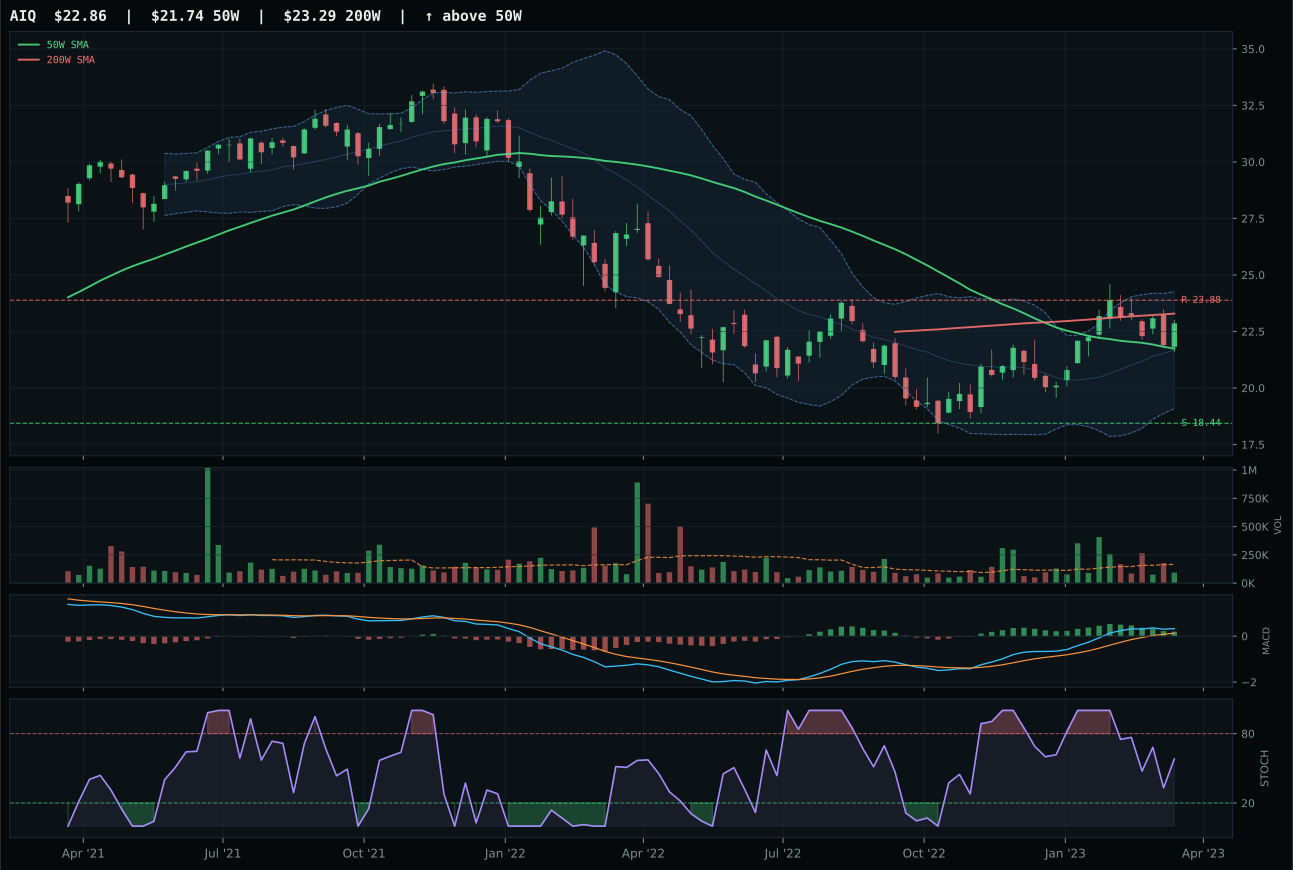
AIQ has a neutral structure profile with 10.0% 13-week relative strength versus SPY.
A failed hold above support would weaken the setup.
Tracked, but not top-2 eligible because: .
SMH won by delivering the category's cleanest blend of trend strength (96.0/100) and momentum confirmation (100.0/100), posting a 17.2% thirteen-week return on 1.53x volume accumulation that shows institutions are still willing to deploy into semiconductor leadership. Its 15.4% relative strength versus SPY and 3.8% category leadership over BOTZ provided the margin of victory—not decisive on individual metrics but compelling in aggregate when combined with price sitting just 13.0% above the 50W and stochastic RSI flashing overbought at 0.87. BOTZ, a credible runner-up with 11.6% SPY relative strength and rising mid-zone stochastics, lost because it offered zero category-relative strength and slightly weaker macro narrative fit (55.0 vs 74.0), leaving BOTZ vulnerable to any pullback in risk appetite. SMH's extended position (13% above the 50W) is only justified by volume persistence of 91.2/100 and the fact that AI growth sponsorship remains the category's strongest macro tailwind at +14.
AI's 10% top-two allocation reflects a category score of 76.0 supported by technical evidence at 96.8/100 and macro fit at 74.0/100—a healthy balance between what the chart shows and what the regime allows. Active AI growth sponsorship at +14 and positive risk appetite at +10 against only -6 credit stress makes this category the regime's purest growth expression within the 50% overlay constraint. The risk is apparent: SMH sits near the 52-week high with negative upside to resistance and a timing score of just 62.0, meaning entry risk is now asymmetric—every buyer from here is chasing, not accumulating. This allocation holds because the macro case is durable and volume-price confirmation remains strong, but it does not represent a new breakout; it represents a sustained conviction play that requires quarterly earnings and datacenter CapEx momentum to keep validating the elevation.
Precious Metals — GLD
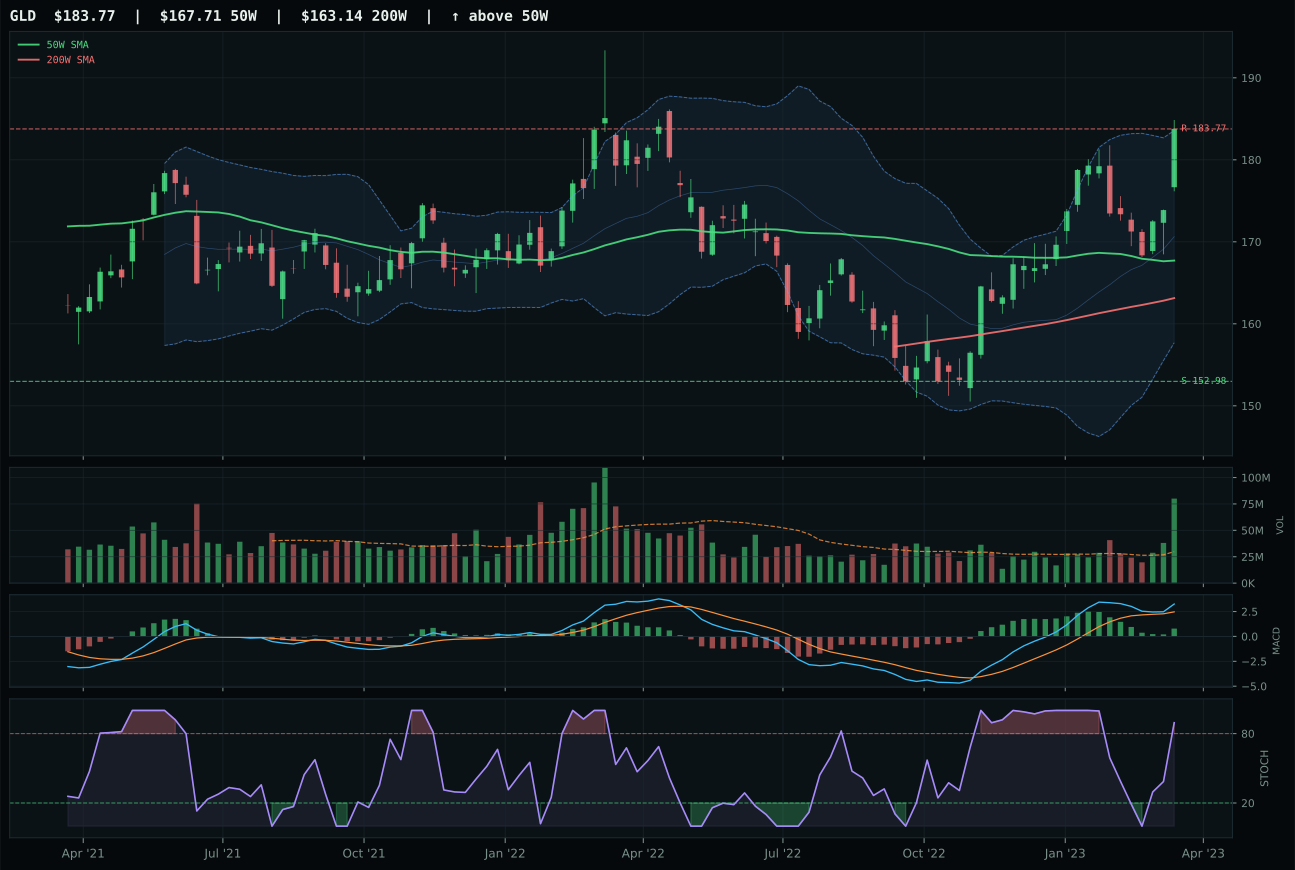
GLD has a neutral structure profile with 8.4% 13-week relative strength versus SPY.
A failed hold above support would weaken the setup.
Actionable but governed by invalidation levels.
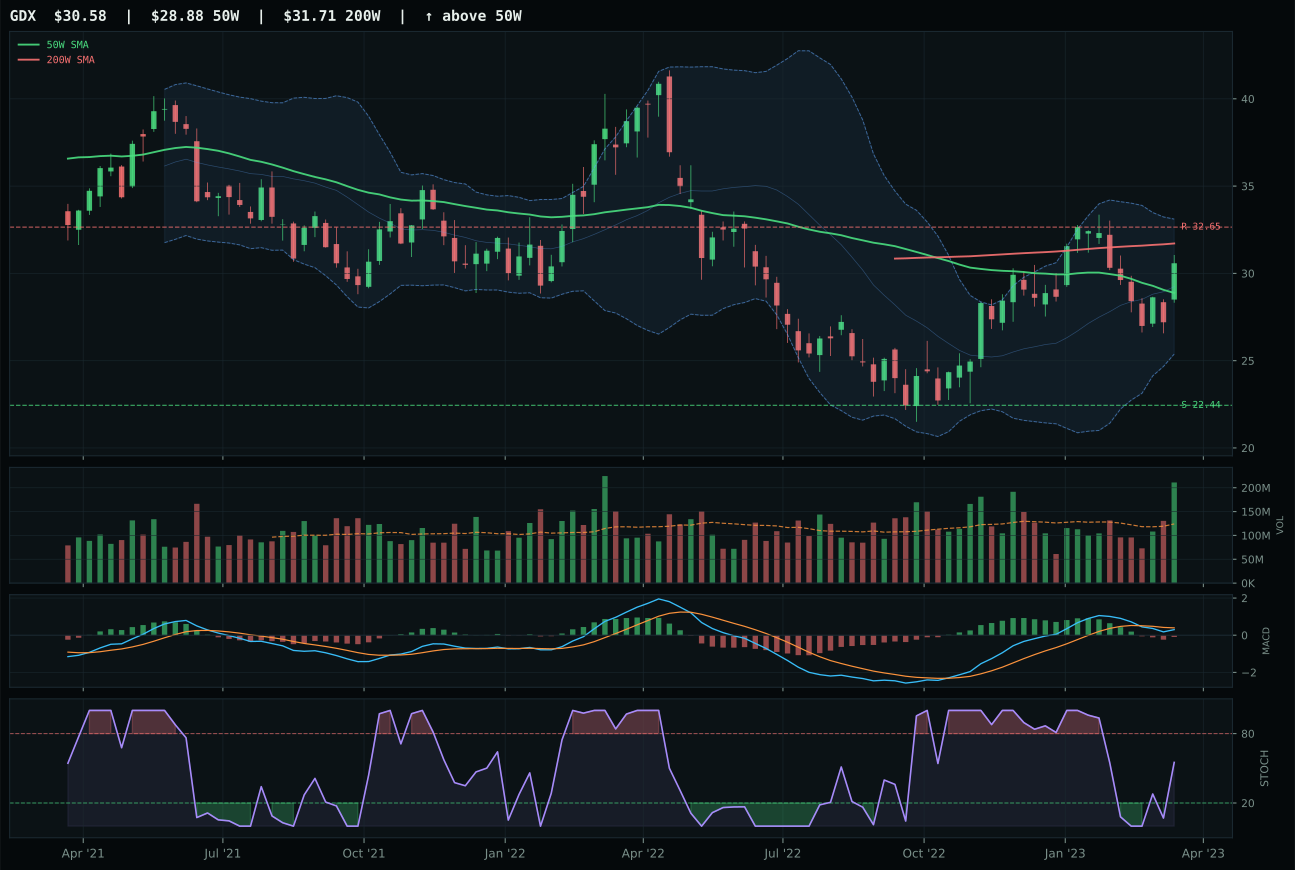
GDX has a neutral structure profile with 5.2% 13-week relative strength versus SPY.
A failed hold above support would weaken the setup.
Actionable but governed by invalidation levels.
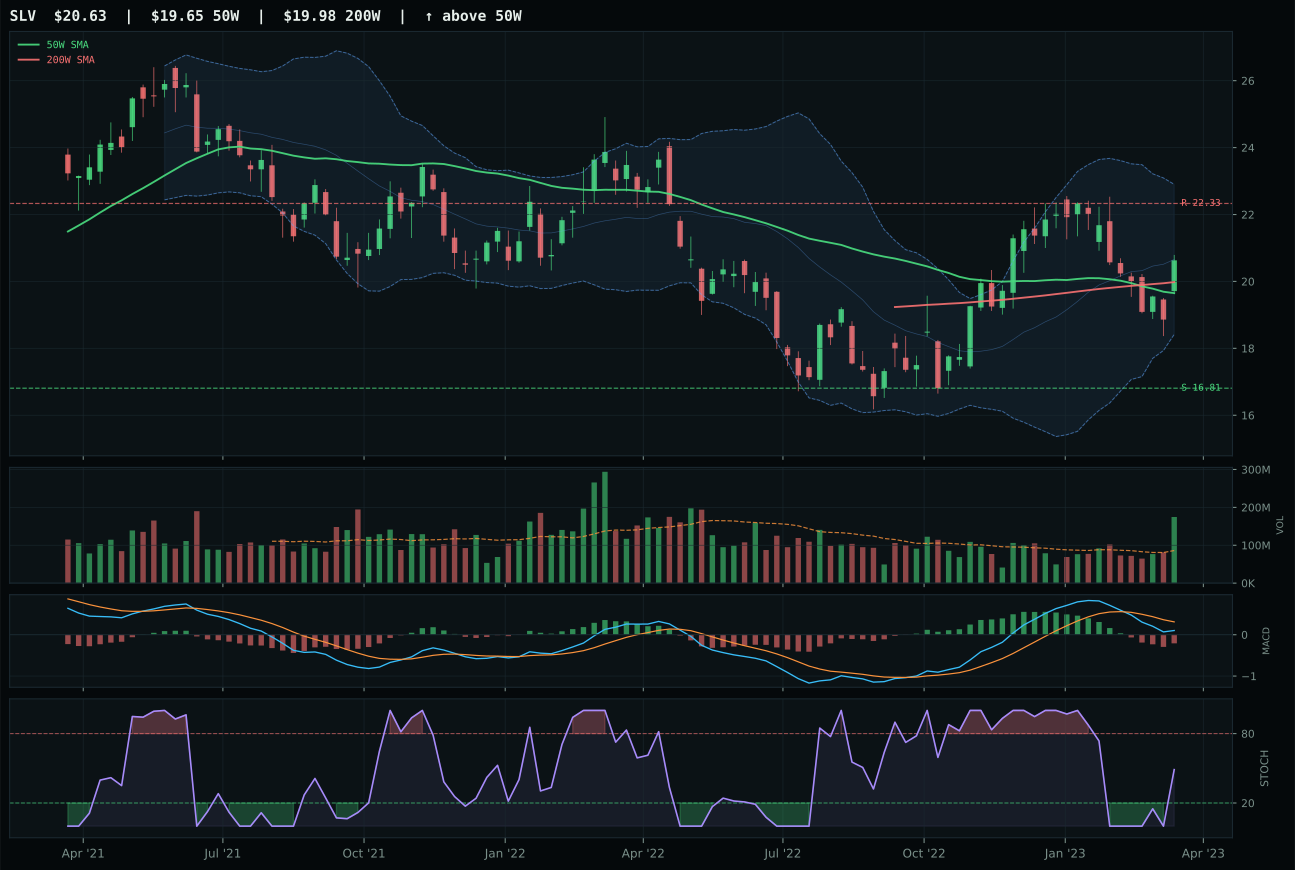
SLV has a neutral structure profile with -5.2% 13-week relative strength versus SPY.
A failed hold above support would weaken the setup.
Actionable but governed by invalidation levels.
GLD won Precious Metals decisively by posting perfect trend confirmation (100.0/100) on a 50W slope of +0.1%—flat but not deteriorating—while building a 10.2% thirteen-week return on aggressive 2.69x volume accumulation that signals institutional conviction in the monetary hedge narrative. Its 8.4% relative strength versus SPY and 3.3% category leadership over GDX provided both absolute and relative momentum proof; the stochastic RSI at 0.89 overbought is only acceptable because momentum confirmation scored 100.0/100 and volume-price persistence at 85.9/100 confirms buyers are still showing up despite extension. GDX, the silver mining alternative, deteriorated from GLD on structure cleanliness (69.8 vs 81.9), MACD weakening into bearish versus GLD's bullish flattening, and zero category relative strength. GLD's positioning at Fibonacci 0.236 (near the 52-week high) is aggressive, but the timing score of 70.0 reflects awareness that this is an extended move requiring ongoing macro catalysts to sustain.
Precious Metals earned its 5% tier-2 allocation on the strength of GLD's technical merit and a robust macro foundation: monetary hedge bid active at +14, defensive rotation at +7, and disinflation pressure at +6, offset only minimally by negative risk appetite of -4. The category score of 69.7 is respectable and kept it in the middle tier despite GLD's extended position. What matters is that the monetary hedge descriptor is active and durable—it reflects central bank expectations of credit stress and policy accommodation, both of which are embedded in the Goldilocks regime. The allocation size at 5% appropriately reflects this: gold is neither a top-conviction conviction (which would justify 10%) nor a speculative hedge (which might claim 2.5%), but a measured exposure that participates in risk-off scenarios without overcommitting. Conviction would increase only if credit stress descriptors became more acute or if GLD broke above resistance at 183.77 on fresh volume confirmation.
Utilities & Infrastructure — XLU
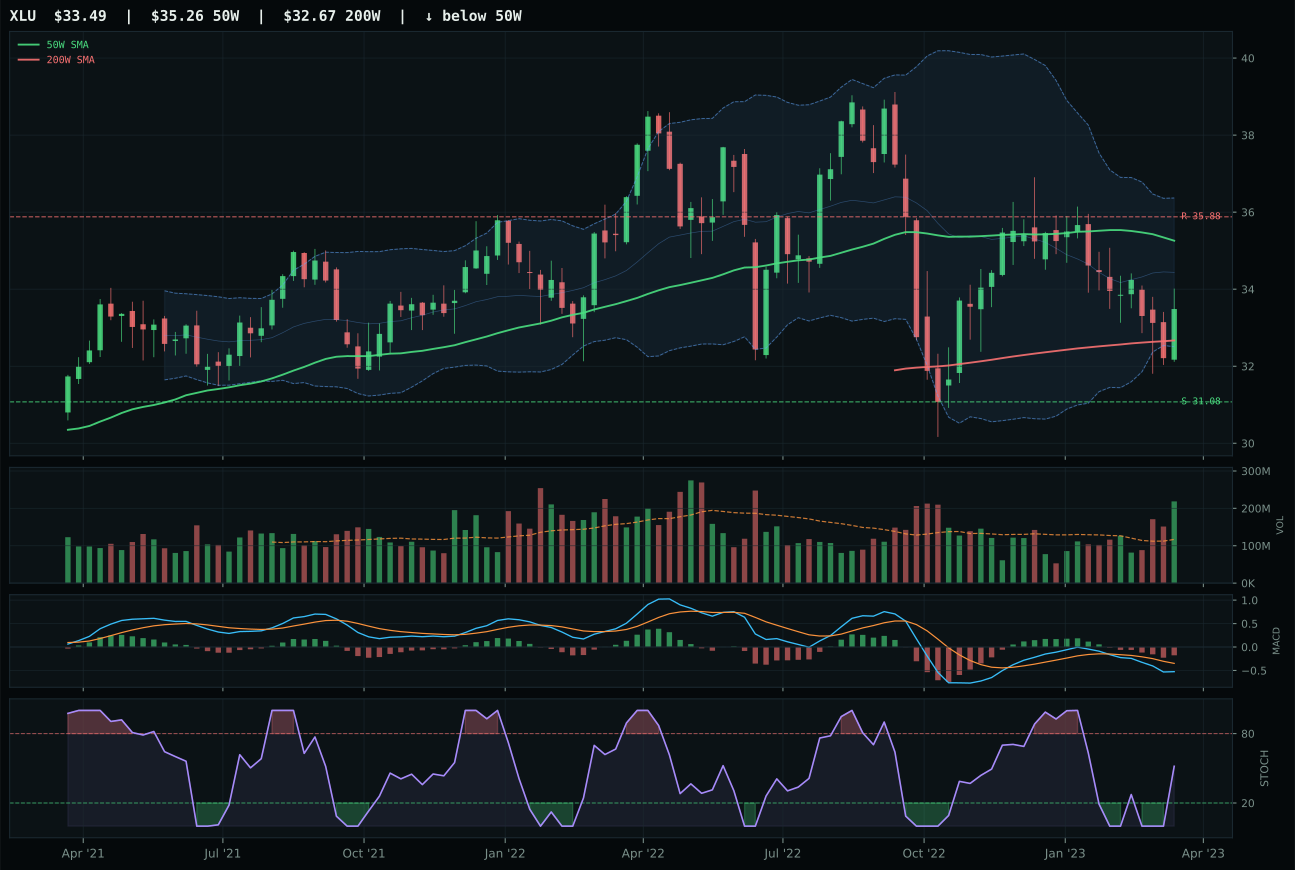
XLU has a neutral structure profile with -6.7% 13-week relative strength versus SPY.
A failed hold above support would weaken the setup.
Actionable but governed by invalidation levels.
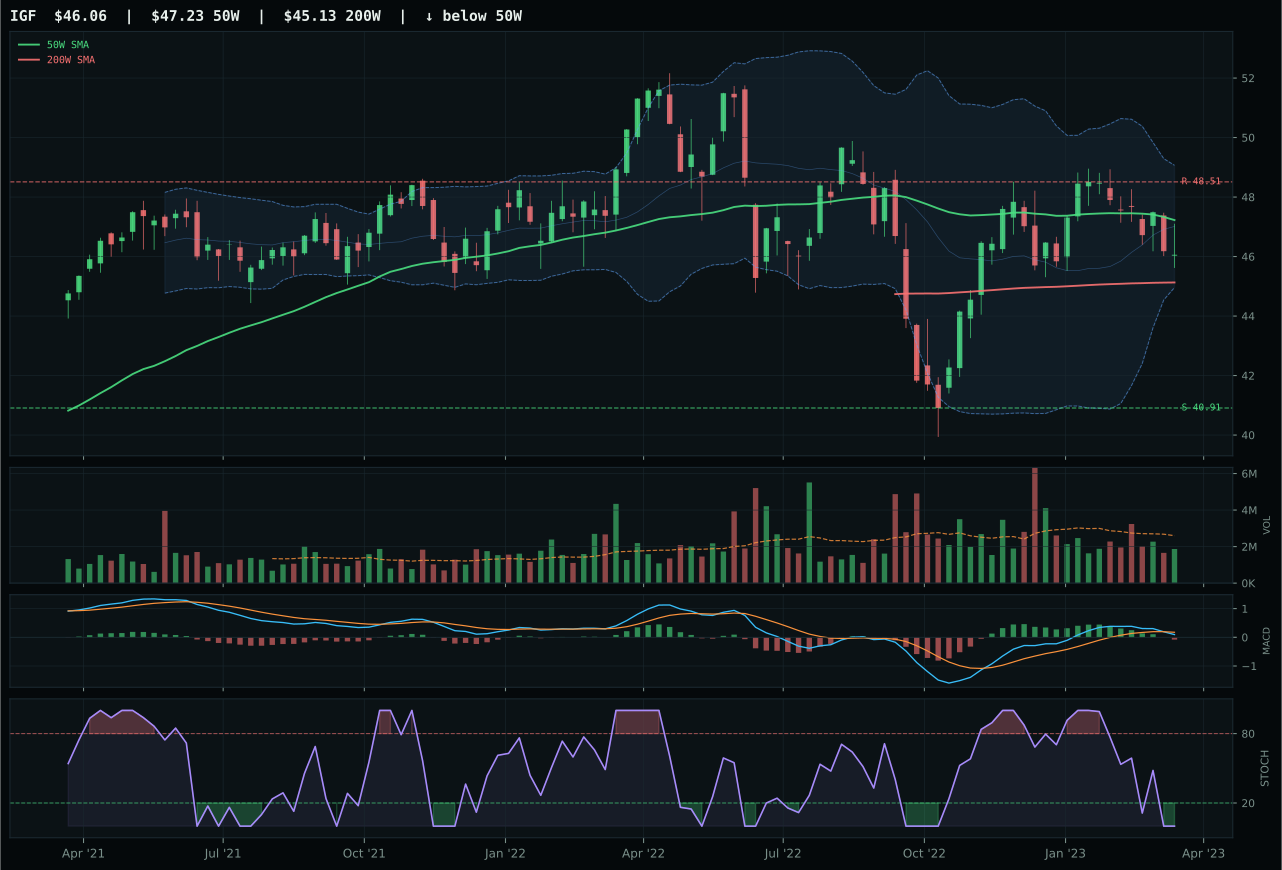
IGF has a compression near 50W profile with -1.0% 13-week relative strength versus SPY.
A failed hold above support would weaken the setup.
Actionable but governed by invalidation levels.
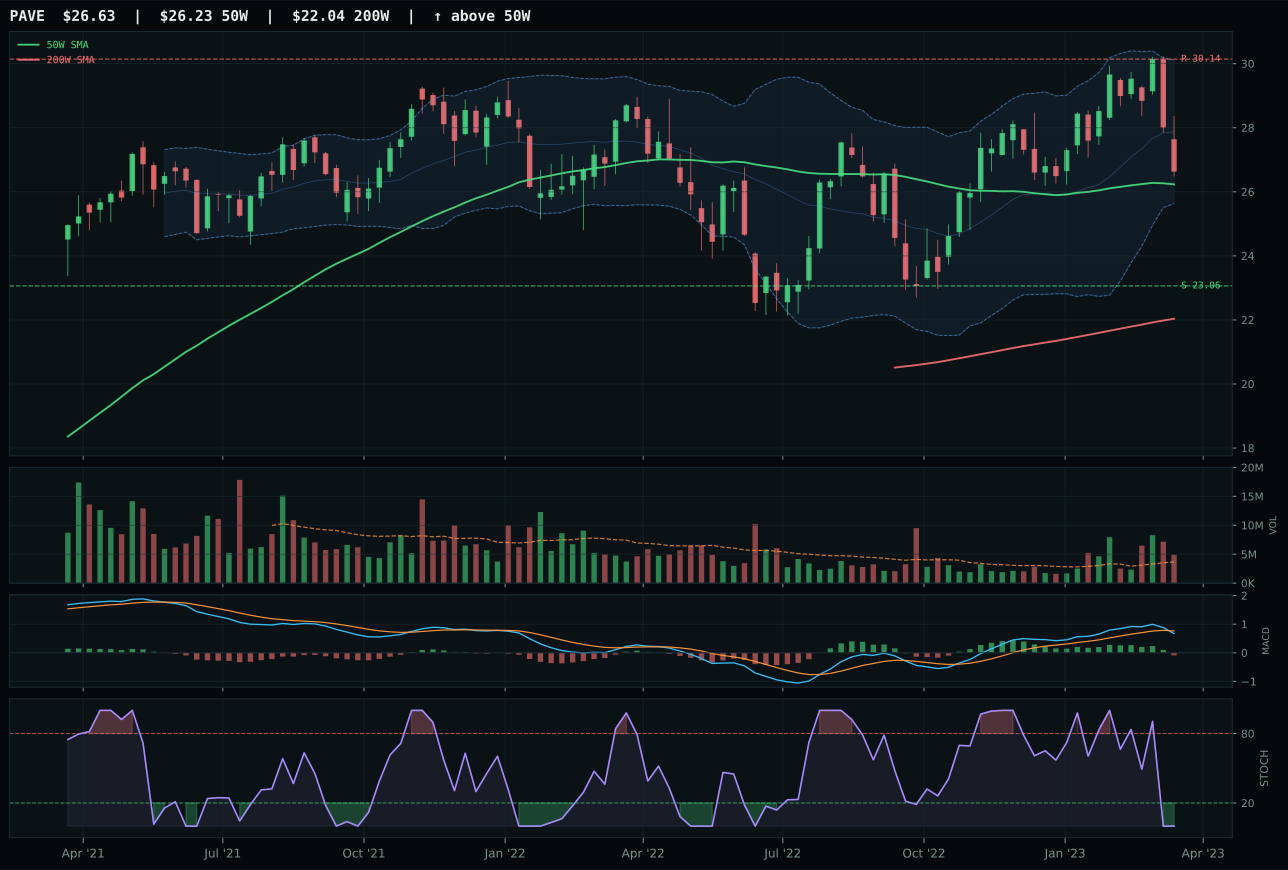
PAVE has a compression near 50W profile with -1.6% 13-week relative strength versus SPY.
A failed hold above support would weaken the setup.
Actionable but governed by invalidation levels.
XLU won Utilities by capitalizing on tight pullback-into-support geometry despite owning one of the weakest trend scores (36.9/100) among all category representatives. Its distance to the 50W at -5.0% and Fibonacci alignment at 0.618 (deep value zone) created a timing score of 85.0/100, while stochastic RSI at 0.52 rising mid-zone offered fresher reversal confirmation than IGF's oversold at 0.00 (exhausted signal). Volume at 1.87x accumulation/confirmation beats IGF's thin participation, providing evidence that institutional capital is willing to defend the 31.08 support level. However, XLU's trend at 36.9/100, momentum confirmation at 16.5/100, and -6.7% SPY relative strength make clear this is not a growth play—it is a defensive mean-reversion entry justified only by the active defensive rotation descriptor (+12) and disinflation pressure (+6) that favour lower-volatility, lower-beta exposure. IGF's cleaner compression setup was undermined by inferior volume confirmation and slightly worse macro alignment.
Utilities earned its 5% tier-2 allocation as a defensive portfolio hedge, with a category score of 42.5 ranking it 5th or 6th among ten categories, buttressed by powerful macro support: defensive rotation active at +12, disinflation pressure at +6, and broad market bear at +4. These descriptors matter more than XLU's weak absolute technicals because Utilities' role in this portfolio is risk dampening, not alpha generation. The trend score of 36.9/100 is irrelevant when the macro case is for deceleration and defensive repositioning; what matters is that XLU sits 5% below the 50W with support defined at 31.08 (7.8% below) and resistance tight at 35.88 (-6.7% upside). Allocation at 5% reflects appropriate sizing: large enough to cushion portfolio volatility if credit stress worsens or risk appetite evaporates, small enough to avoid overcommitting to a sector with deteriorating trend confirmation. Conviction could increase only if either the macro regime shifts away from defensive rotations or if XLU posts fresh upside above resistance on volume confirmation, signaling a trend reversal rather than a bounce.
Defense & Aerospace — ITA
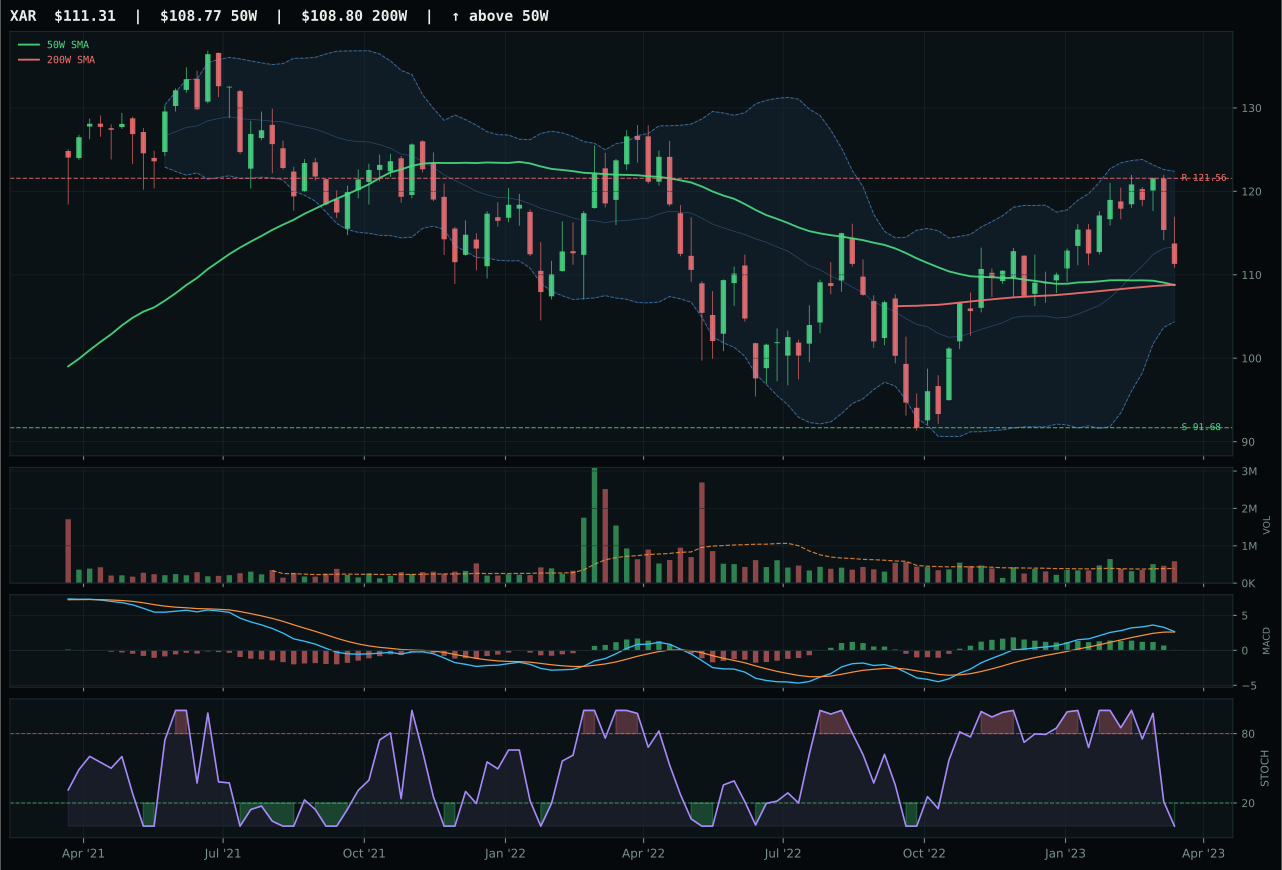
XAR has a compression near 50W profile with 0.3% 13-week relative strength versus SPY.
A failed hold above support would weaken the setup.
Actionable but governed by invalidation levels.
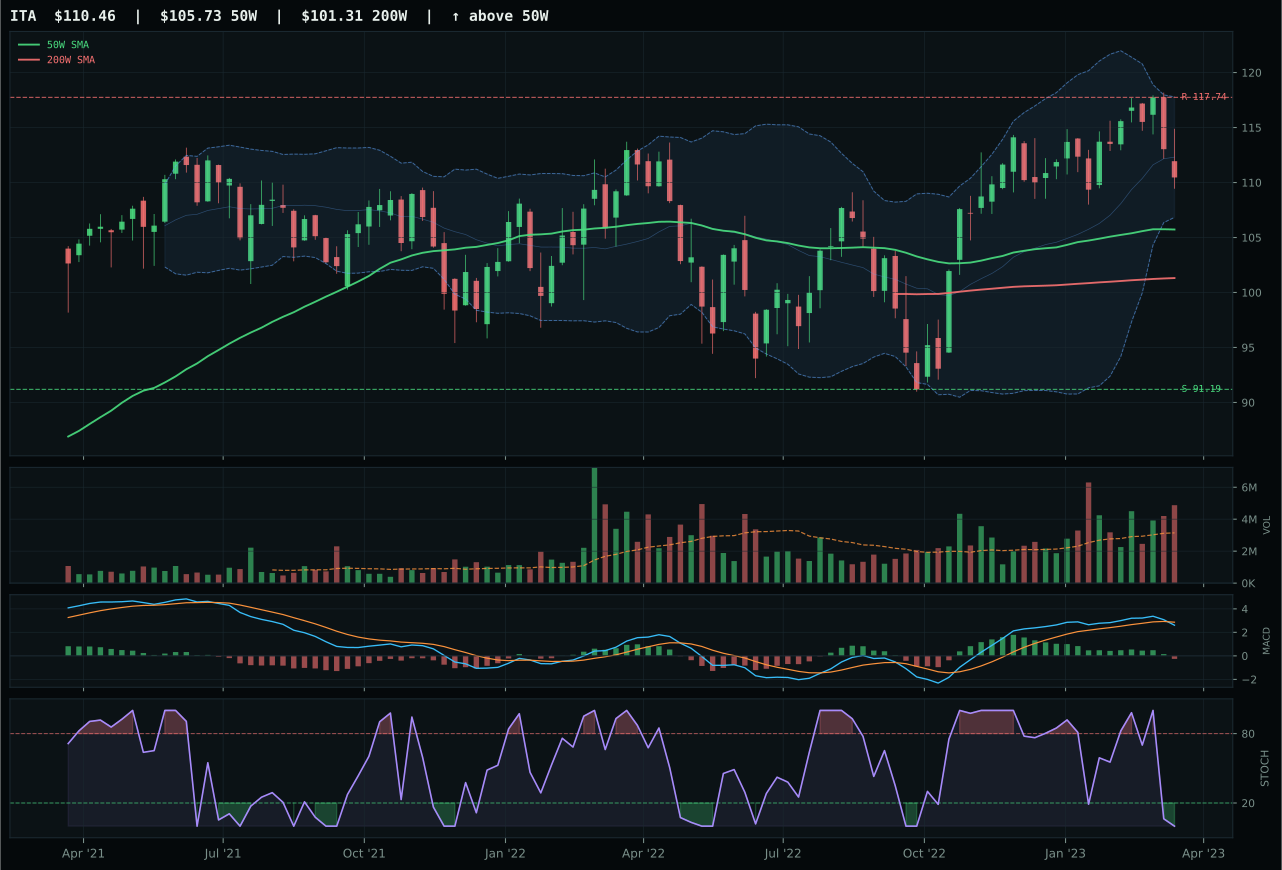
ITA has a neutral structure profile with -1.3% 13-week relative strength versus SPY.
A failed hold above support would weaken the setup.
Actionable but governed by invalidation levels.
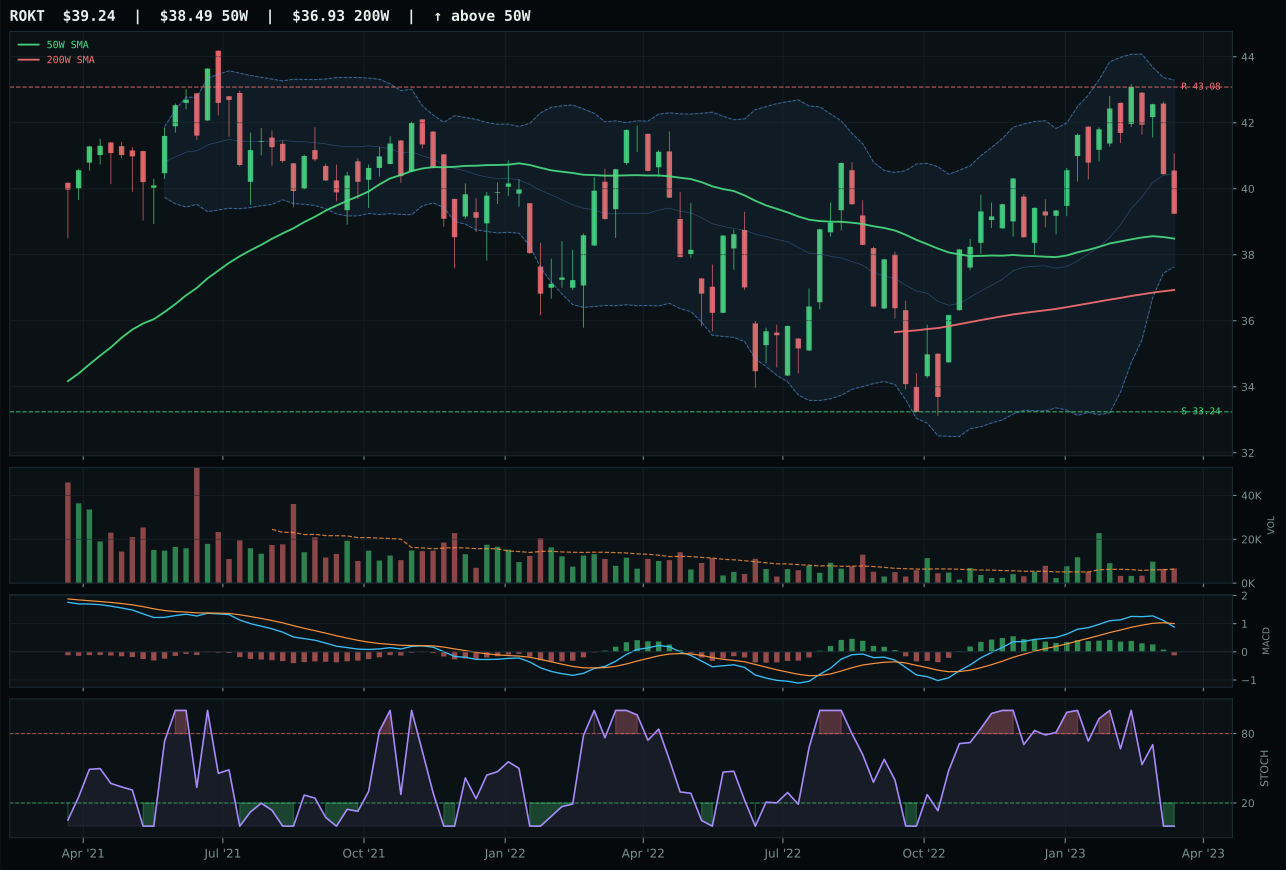
ROKT has a compression near 50W profile with -2.2% 13-week relative strength versus SPY.
A failed hold above support would weaken the setup.
Tracked, but not top-2 eligible because: .
ITA won a weak category by default rather than conviction—its technical evidence scored just 8.5/100, among the lowest of any winner, but it edged XAR because the latter's structure metrics failed to compensate for its own weaknesses. ITA's appeal is solely timing-based: oversold stochastic RSI at 0.00, pullback distance to the 50W at 4.5%, and Fibonacci alignment at 0.236 extension all suggest defined risk near support at 91.19. The momentum confirmation score of 12.3/100 and volume-price confirmation of 20.9/100 make clear this is not a reversal play but rather a least-bad entry point into a category where both trend (70.0) and relative strength (-1.3% vs SPY) are deteriorating. XAR's compression near the 50W offered superior trend (76.0) and timing (100.0) on paper, yet scored lower in the macro reasoning layer, revealing that defensive rotation and broad market bear descriptors favored ITA's oversold setup more than XAR's cleaner technicals.
Defense & Aerospace earned its 5% allocation as a tier-2 holding despite a category score of just 35.4, which ranks it sixth or seventh among the ten categories. The macro case is present—defensive rotation active at +8 and broad market bear at +6 argue for defensive exposure—but the technical execution is poor across all three candidate ETFs. ITA's -1.3% relative strength versus SPY and momentum confirmation near zero reveal this is a mean-reversion bet, not a trend confirmation. Allocation size at 5% reflects this ambiguity: the category merits a position because macro descriptors support it and support levels provide defined risk, but conviction is low enough that a single negative catalyst (further SPY strength or credit stress improving) could justify fast deleveraging. This is a defensive placeholder, not a alpha driver.
Emerging Markets — INDA
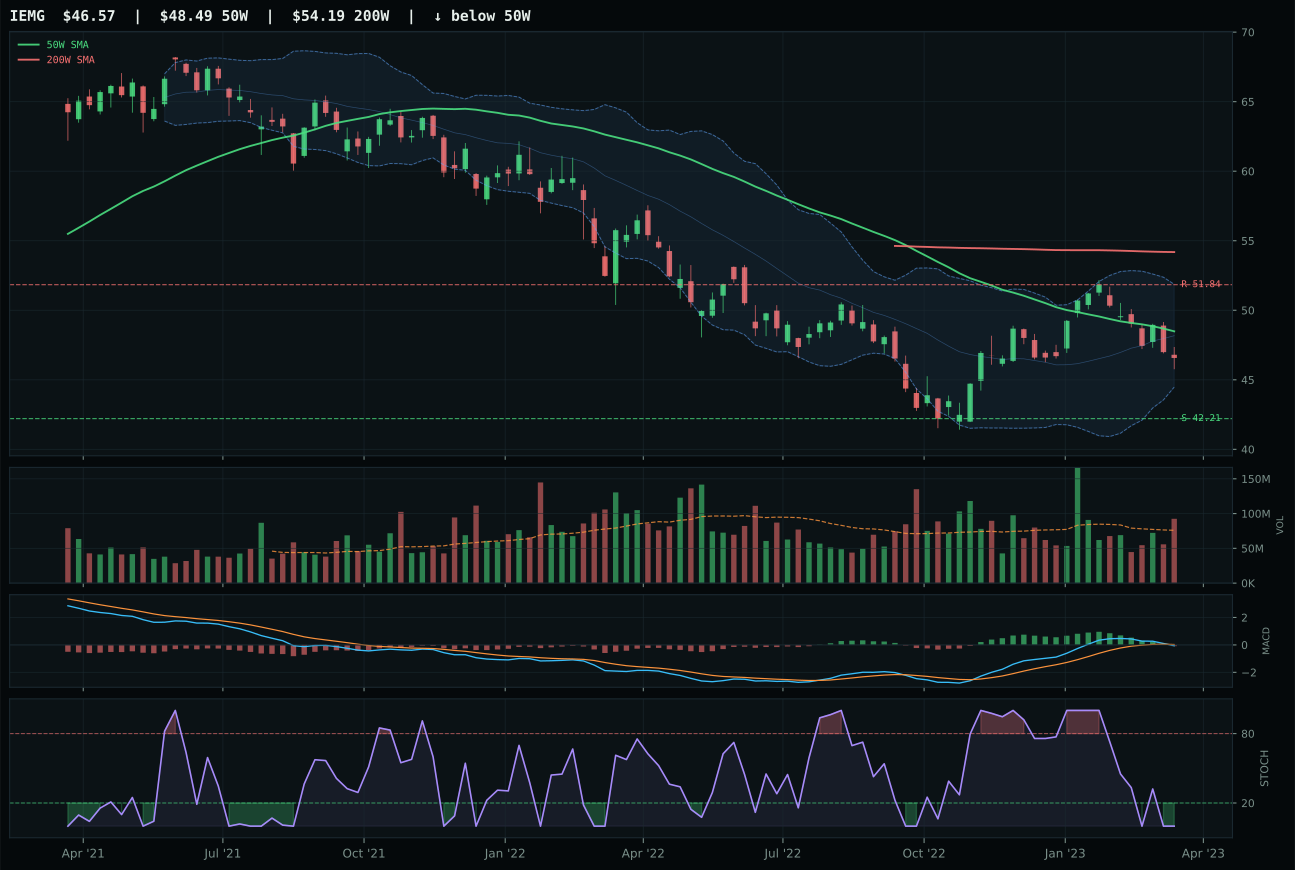
IEMG has a neutral structure profile with -1.8% 13-week relative strength versus SPY.
Extension and support failure are the main tactical risks.
Tracked, but not top-2 eligible because: structurally broken.
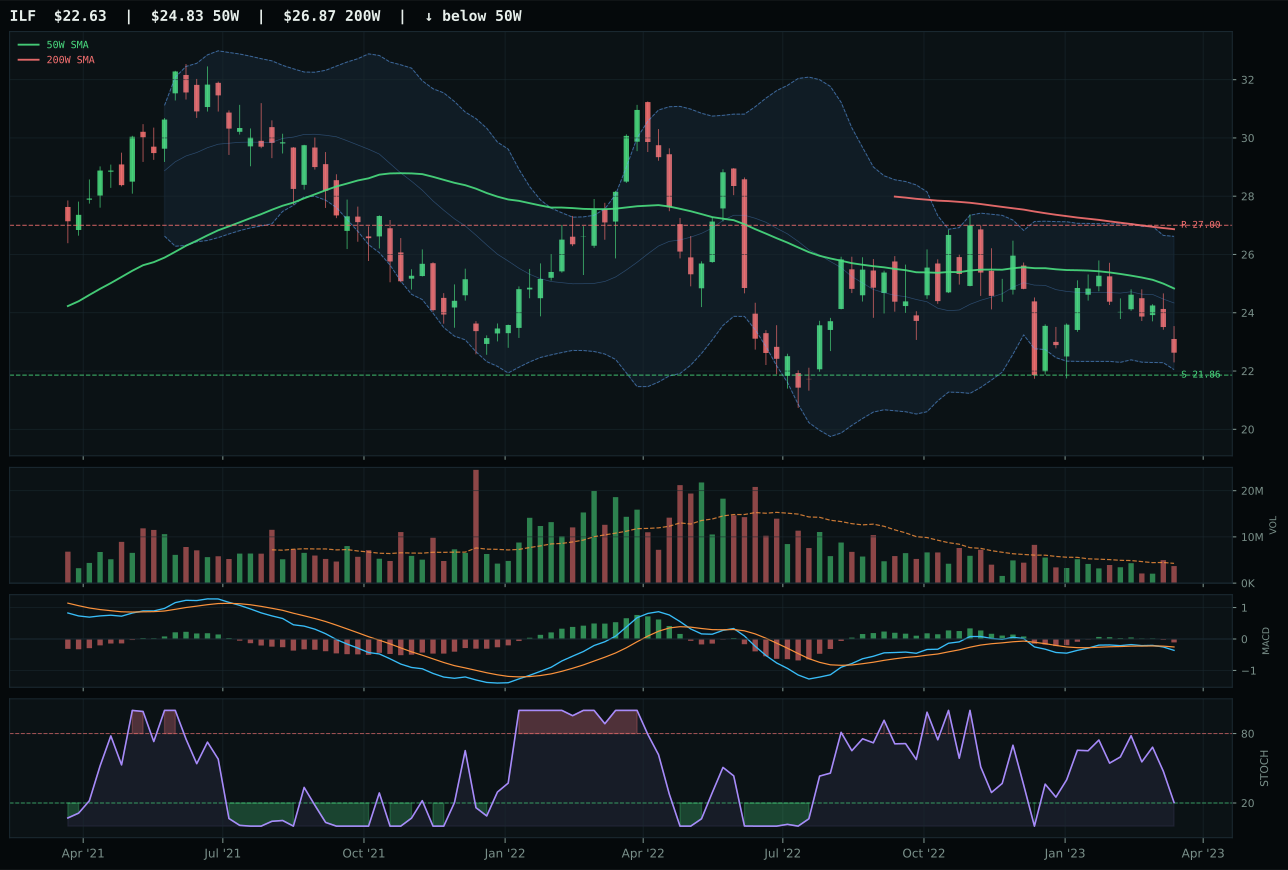
ILF has a pullback into support profile with 1.8% 13-week relative strength versus SPY.
Extension and support failure are the main tactical risks.
Tracked, but not top-2 eligible because: structurally broken.
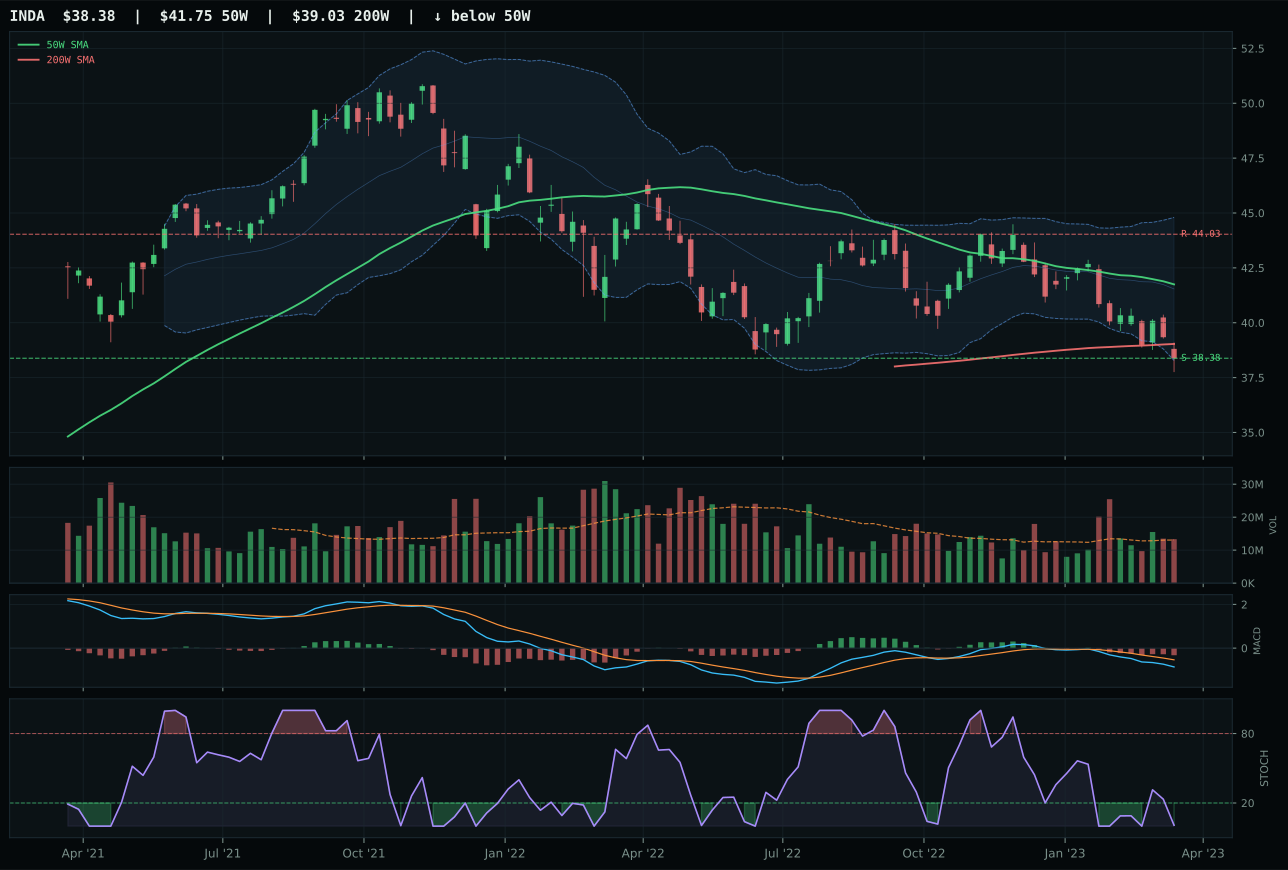
INDA has a pullback into support profile with -10.8% 13-week relative strength versus SPY.
A failed hold above support would weaken the setup.
Actionable but governed by invalidation levels.
INDA won Emerging Markets—allocated 0% this week—by offering the sharpest reversal geometry despite being the category's worst performer on absolute and relative returns. Its stochastic RSI at 0.01 (oversold turning up) and tight proximity to 52-week low support at Fibonacci 0.786 created a timing score of 94.0/100, compensating for trend at 22.0/100, momentum confirmation at 0.0/100, and a devastating -9.1% thirteen-week return paired with -10.8% SPY relative strength. IEMG, the macro-favorite runner-up, scored higher on relative strength (-1.8% vs SPY) and trend (30.0 vs 22.0), but failed INDA because its structure was broken (45.1 vs 72.6), stochastic RSI was oversold without upturn conviction, and macro descriptors identified it as structurally broken via hard filters. Both candidates are deeply wounded, but INDA offered the clearest bounce setup despite worse fundamental deterioration—a sign that this entire category represents forced liquidation, not opportunity.
Emerging Markets is allocated 0% this week and ranks 9th or 10th in the category hierarchy, excluded despite a respectable macro foundation featuring EM liquidity support at +14, liquidity expansion at +8, and positive risk appetite at +8. The problem is technical collapse: the category score of 30.3 reflects INDA's bounce setup, but IEMG's structurally broken filter and the broader -9% to -10% thirteen-week underperformance versus SPY expose capital destruction rather than opportunity. Price action in IEMG below major moving averages, price action in INDA at the 52-week low, and volume-price confirmation near zero across all three ETFs indicate institutional forced liquidation. Macro tailwinds cannot offset technical purges; this category needs either a stabilization breakout above the 200W moving average on fresh volume confirmation, or a shift in the macro regime that explicitly favors EM relative to US-based growth. Neither is present, so exclusion is appropriately severe.
Nuclear Energy — URA
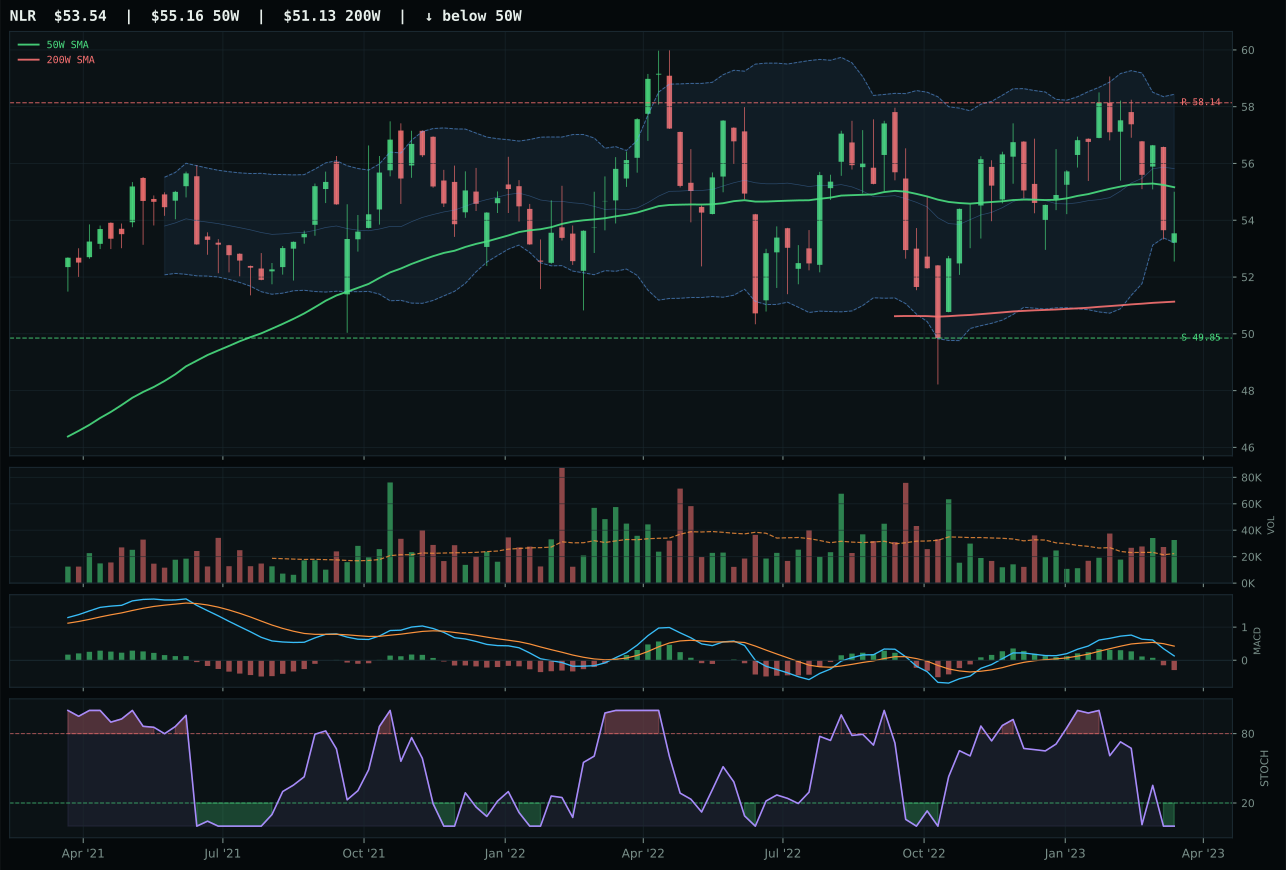
NLR has a compression near 50W profile with -3.7% 13-week relative strength versus SPY.
A failed hold above support would weaken the setup.
Tracked, but not top-2 eligible because: .
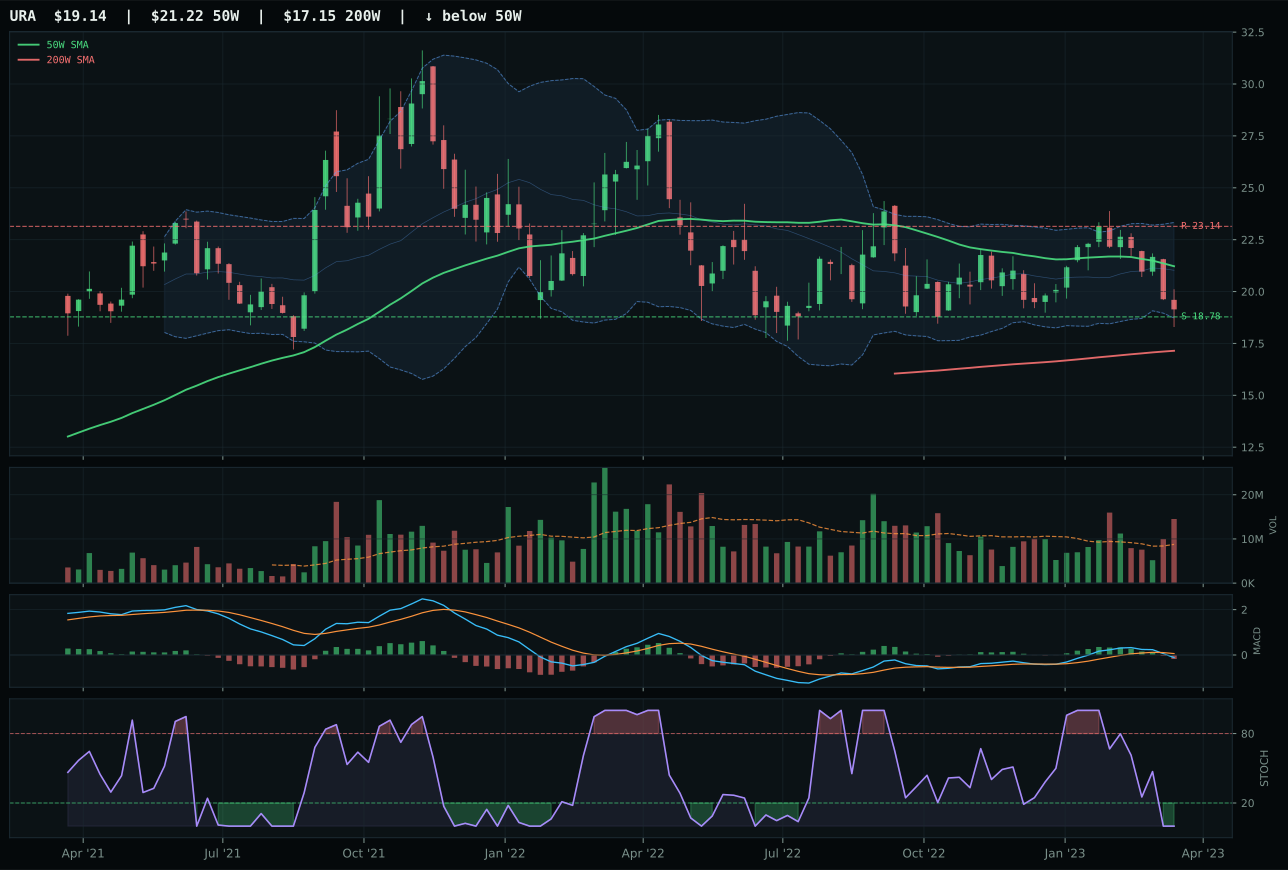
URA has a pullback into support profile with -3.5% 13-week relative strength versus SPY.
A failed hold above support would weaken the setup.
Actionable but governed by invalidation levels.
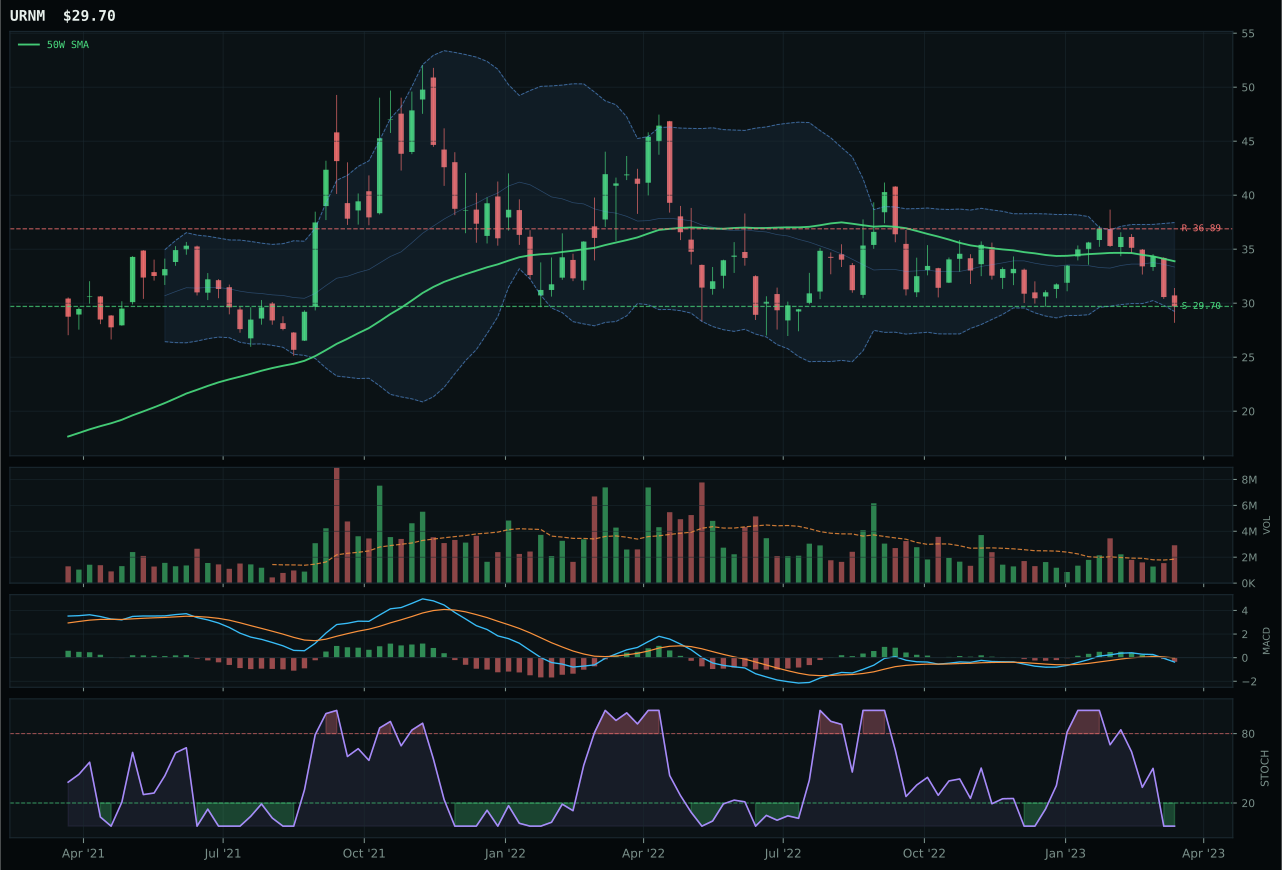
URNM has a pullback into support profile with -4.2% 13-week relative strength versus SPY.
A failed hold above support would weaken the setup.
Actionable but governed by invalidation levels.
URA won Nuclear Energy by offering the most defined reversal setup, despite both URA and NLR being deeply underwater on thirteen-week performance and momentum confirmation. URA's edge came from timing (80.0 vs 100.0 for NLR, but at a 0.2% category-relative strength advantage) combined with cleaner pullback-into-support structure (68.3 vs NLR's compression near 50W) and superior risk-reward (82.0 vs 72.2), reflecting support at 18.78 just 1.9% below price versus NLR's resistance at 58.14 providing much tighter asymmetry. Both candidates are oversold on stochastic RSI, but URA's 1.66x distribution pressure volume suggests forced liquidation into a defined support level—a classic reversal setup—while NLR's above-average participation indicates indecisive accumulation. The -1.8% thirteen-week return and -3.5% SPY relative strength make clear this is a bounce play, not a new trend; the 80.0 timing score earns the position only because support is tight and invalidation is defined.
Nuclear Energy earned its 5% tier-2 allocation despite a category score of just 24.2 and rank 5th or 6th among ten categories, justified primarily by defined support risk and the absence of strongly negative macro descriptors. AI growth sponsorship is active at +5, but credit stress at -5 creates a macro stalemate rather than a tailwind. The category's appeal is technical and tactical: URA sits 1.9% above support with stochastic RSI at 0.00 and Fibonacci alignment at 0.786 (52-week low zone), offering a defined mean-reversion entry for traders. However, the trend score of 41.7/100 and momentum confirmation at 0.0/100 make clear this is not a structural conviction—this is a 5% hedge allocation that benefits if the broader market stabilizes and investors redeploy into less-damaged sectors. Conviction could increase if URA holds above 18.78 support and volume shifts from distribution to accumulation, signaling a real rotation rather than a bounce within a downtrend.
Industrial Metals — COPX
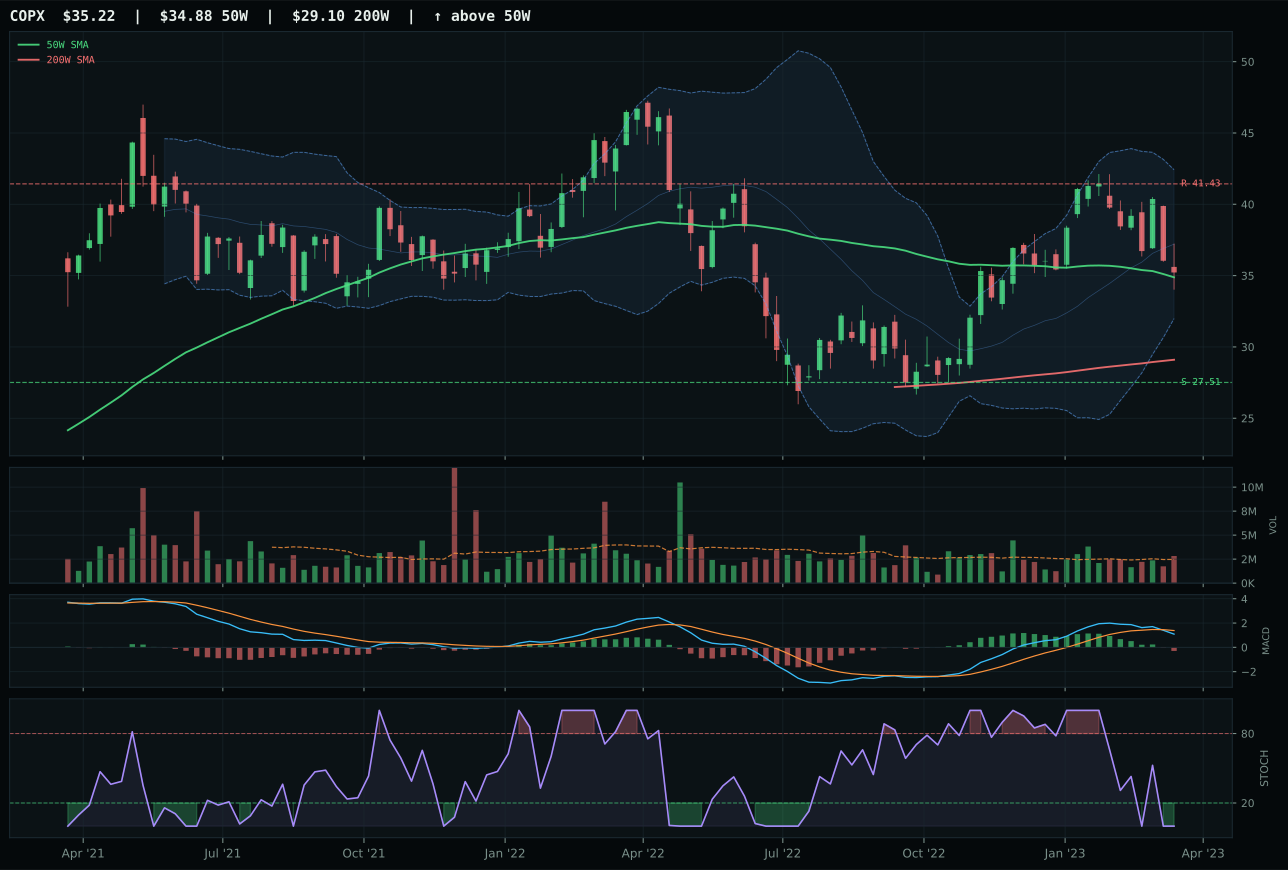
COPX has a compression near 50W profile with -3.2% 13-week relative strength versus SPY.
A failed hold above support would weaken the setup.
Actionable but governed by invalidation levels.
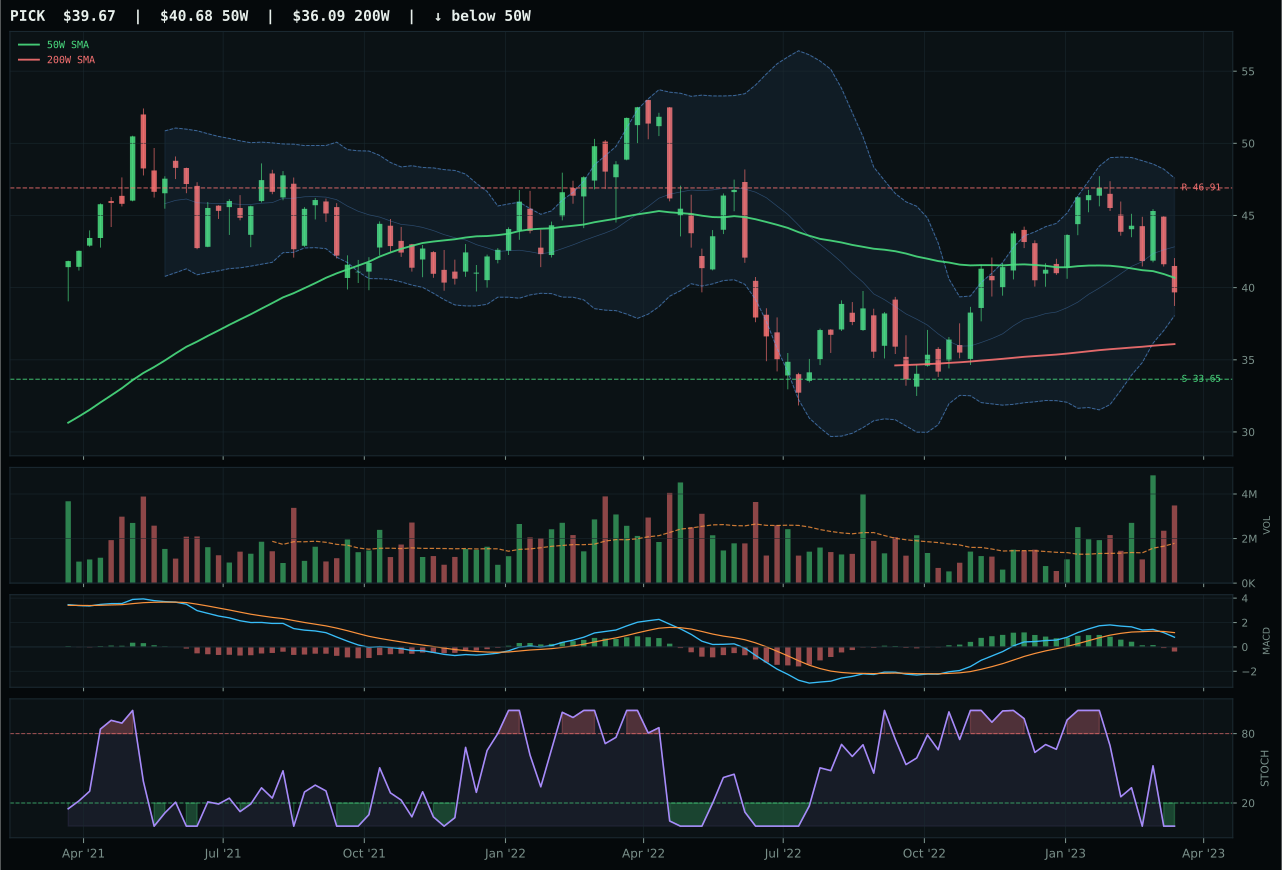
PICK has a compression near 50W profile with -3.8% 13-week relative strength versus SPY.
A failed hold above support would weaken the setup.
Actionable but governed by invalidation levels.
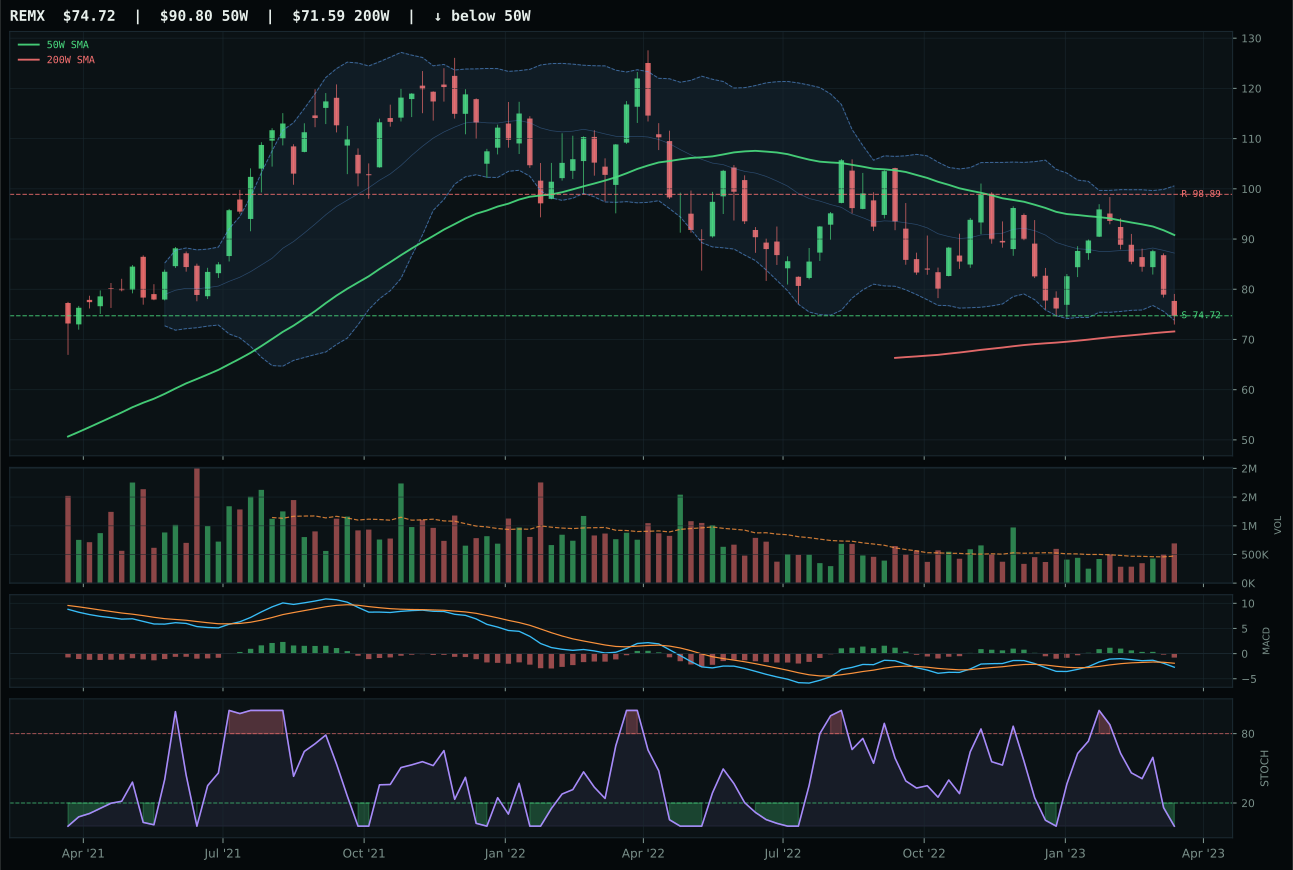
REMX has a pullback into support profile with -11.2% 13-week relative strength versus SPY.
A failed hold above support would weaken the setup.
Actionable but governed by invalidation levels.
COPX won Industrial Metals by the tightest possible margin over PICK and REMX—a category where all three candidates are technically exhausted and macro-driven. COPX's only decisive advantage is compression timing at 100.0/100 (distance to 50W at just 1.0%) combined with stochastic RSI at 0.00 oversold, offering the clearest reversal geometry in the category. Its structure at 70.7/100 edged PICK's 66.4, and volume at 1.15x above-average participation slightly outpaced PICK's distribution pressure. However, COPX's momentum confirmation at 16.2/100 and trend at 57.3/100 expose the core problem: a thirteen-week return of -1.4%, RS versus SPY of -3.2%, and MACD bearish/weakening make this a mean-reversion guess, not a conviction trade. Risk-reward of 54.6/100 reflects negative upside to resistance (-15.0%) and only 28.0% downside, meaning the risk-reward asymmetry is inverted—sellers have more room than buyers.
Industrial Metals earned its 5% tier-2 allocation despite a category score of just 22.2, ranking it 5th or 6th among the ten categories—a middling position justified mainly by the absence of catastrophic macro headwinds and some bullish industrial demand optionality. The Goldilocks regime provides +6 support, offset by credit stress at -7, leaving the category macro-neutral rather than prohibited. COPX's 100.0 timing score is the only technical anchor for this allocation, and it is a pullback-into-support setup, not a reversal breakout. Conviction is minimal: this is a 5% portfolio position that acknowledges copper is a reasonable tactical long at oversold levels but stops well short of suggesting upside is compelling. The allocation will remain at 5% unless either COPX breaks above resistance at 41.43 on volume confirmation or until the broader macro regime shifts toward inflation expectations, which would reactivate the commodity demand cycle and potentially push Industrial Metals to tier-1 status.
Agriculture & Livestock — VEGI
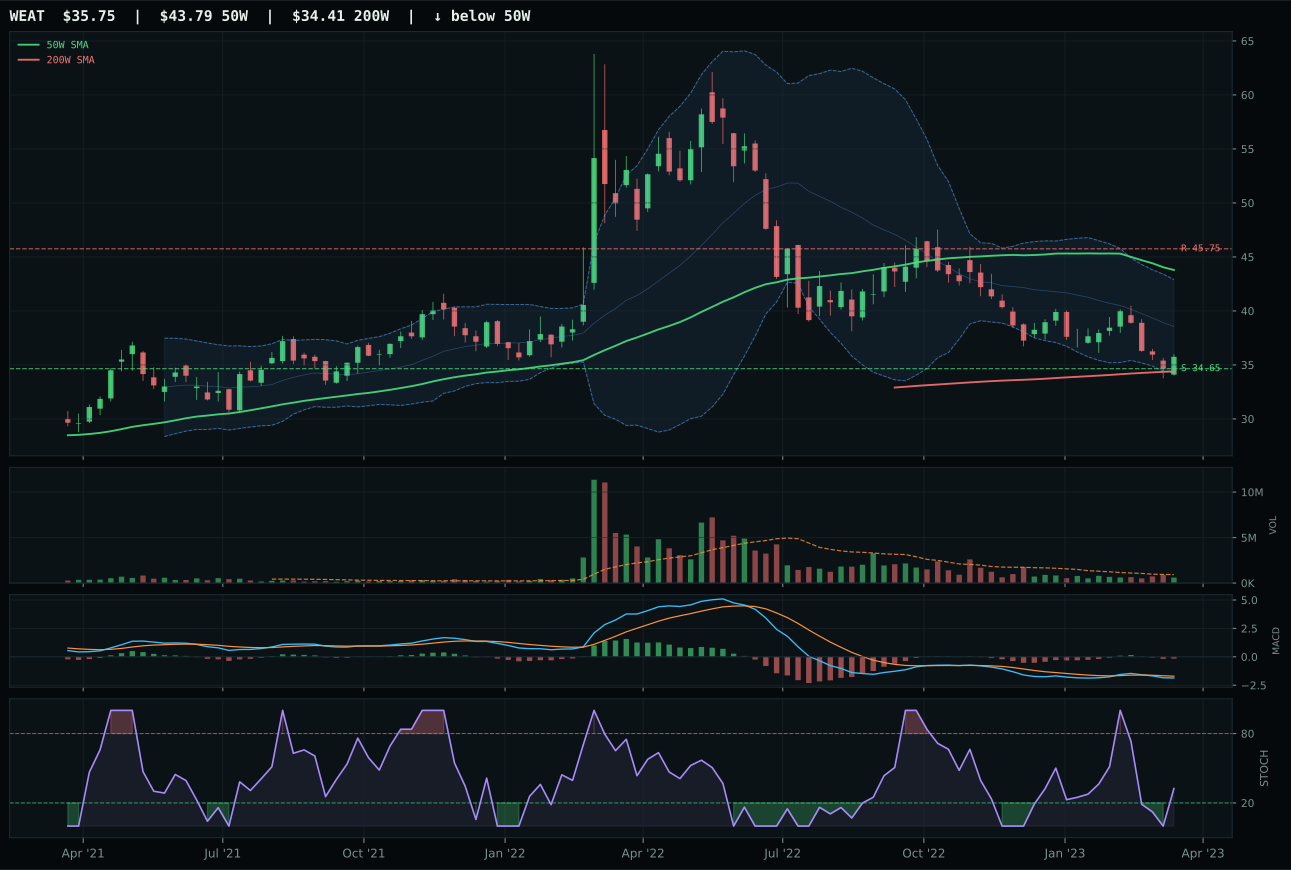
WEAT has a pullback into support profile with -8.3% 13-week relative strength versus SPY.
A failed hold above support would weaken the setup.
Actionable but governed by invalidation levels.
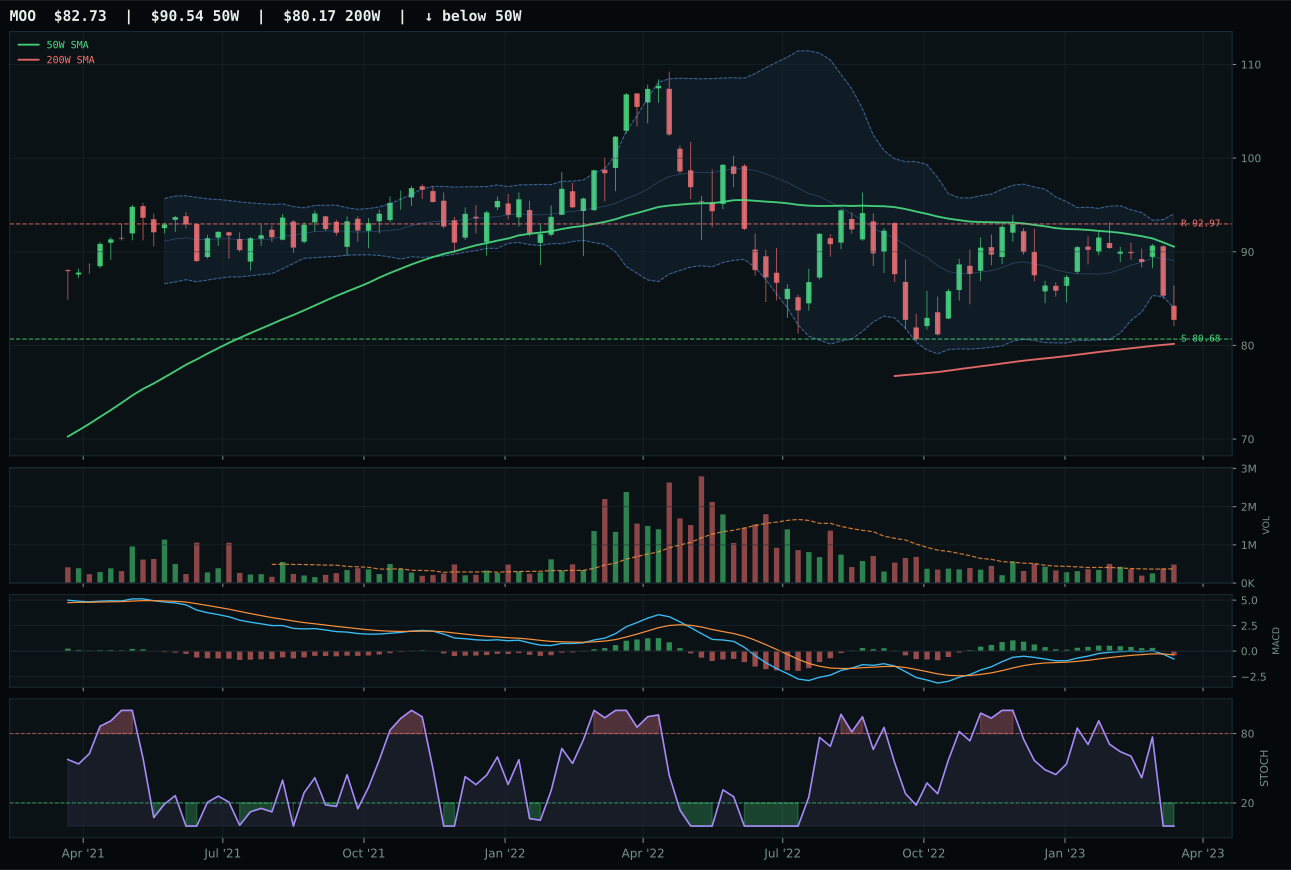
MOO has a pullback into support profile with -7.2% 13-week relative strength versus SPY.
A failed hold above support would weaken the setup.
Actionable but governed by invalidation levels.
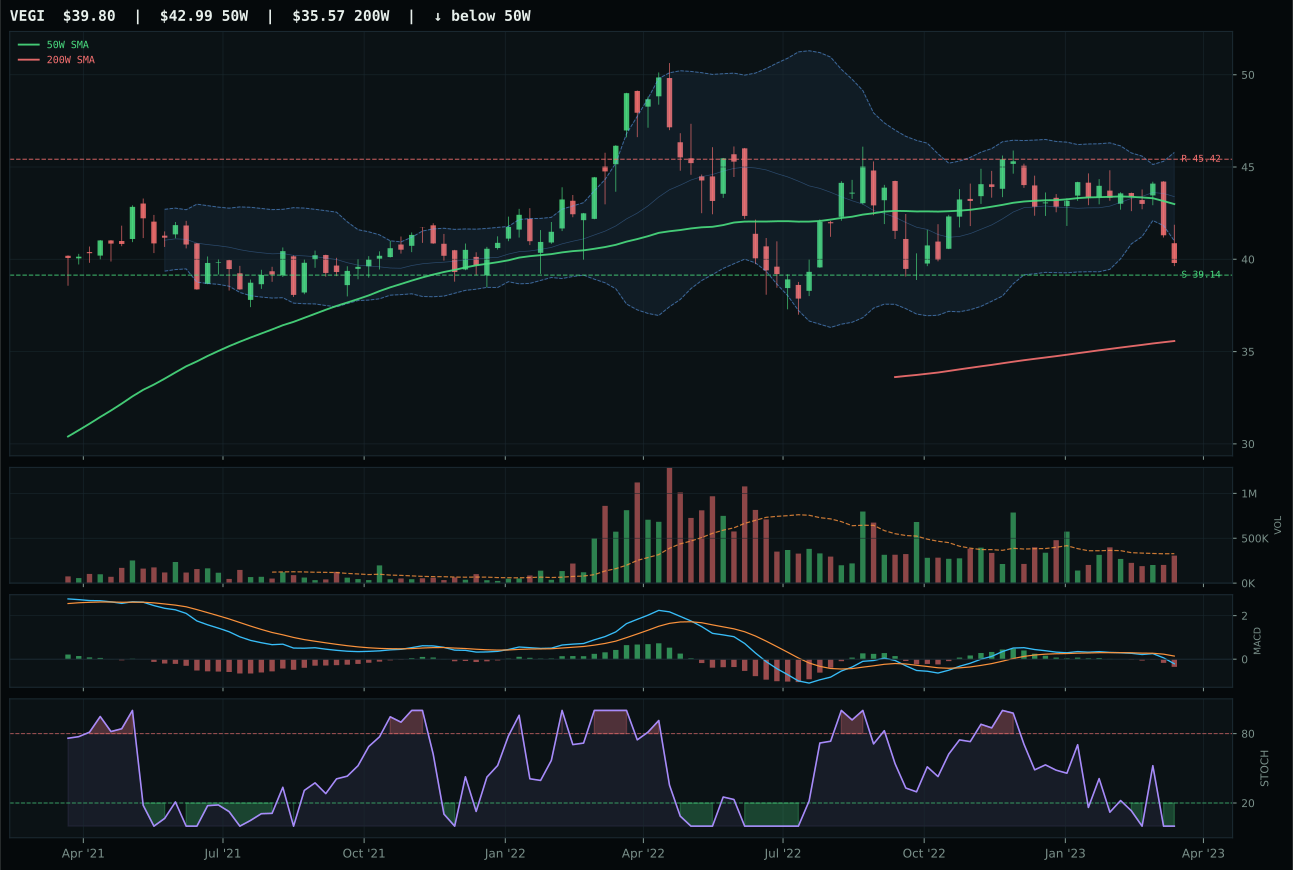
VEGI has a pullback into support profile with -8.9% 13-week relative strength versus SPY.
A failed hold above support would weaken the setup.
Actionable but governed by invalidation levels.
VEGI won the Agriculture category—which is ranked 9th or 10th overall and allocated 0%—by virtue of marginally superior timing and structure versus WEAT, though both ETFs are deeply broken on momentum and volume confirmation. VEGI's stochastic RSI sits at 0.00 (oversold turn) while WEAT's is rising mid-zone, giving VEGI slightly better reversal geometry at 80.0/100 timing. The real story is the category's -8.9% relative strength to SPY, -7.1% thirteen-week return, and neutral volume at 0.93x the 20-week average—all indicators that this is a sector in freefall, not a pullback within a trend. The risk-reward score of 90.0/100 appears generous, but it only reflects downside protection to support at 39.14 (1.7% below current price); upside to resistance sits at -12.4%, indicating a cap below current levels. Support near the 52-week low and Fibonacci 0.786 suggests institutional forced liquidation rather than strategic accumulation.
Agriculture is allocated 0% this week, excluded entirely from the portfolio because the category scored 8.4 and ranks 9th or 10th among the ten available sleeves. Disinflation pressure is active at -5, working directly against commodity producers, while no positive macro descriptors offset this headwind. The technical situation mirrors the macro case: trend at 33.7/100 with price below both the 50W and 200W, momentum confirmation at 0.0/100, and volume-price confirmation at 13.0/100 all confirm liquidation pressure rather than opportunity. Even VEGI's superior timing (80.0) cannot justify allocation when the broader regime is degrading the entire category. Inclusion would require either a reversal in disinflation expectations (inflation reacceleration) or a technical break above resistance at 45.42 on meaningful accumulation volume—neither is present.
Traditional Energy — XLE
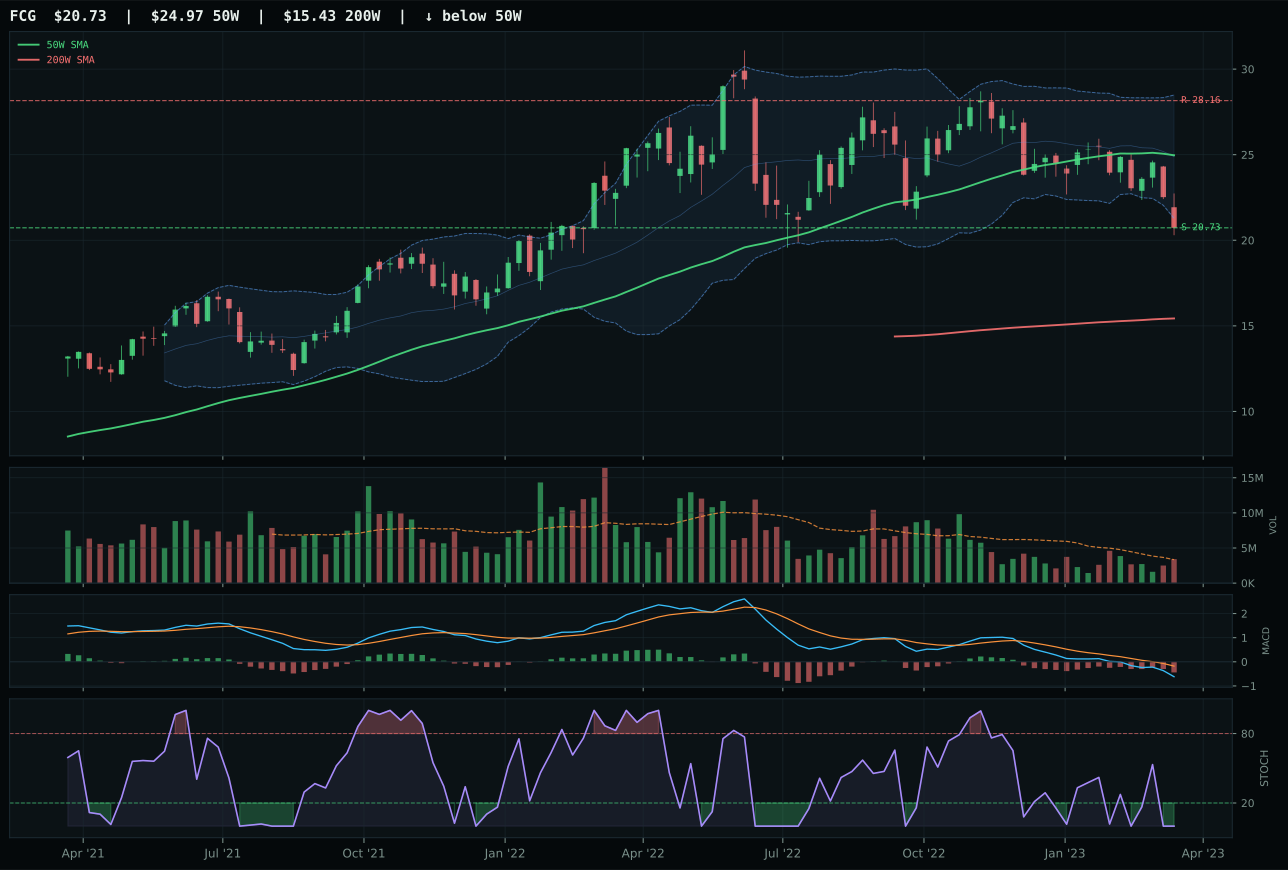
FCG has a pullback into support profile with -17.0% 13-week relative strength versus SPY.
A failed hold above support would weaken the setup.
Actionable but governed by invalidation levels.
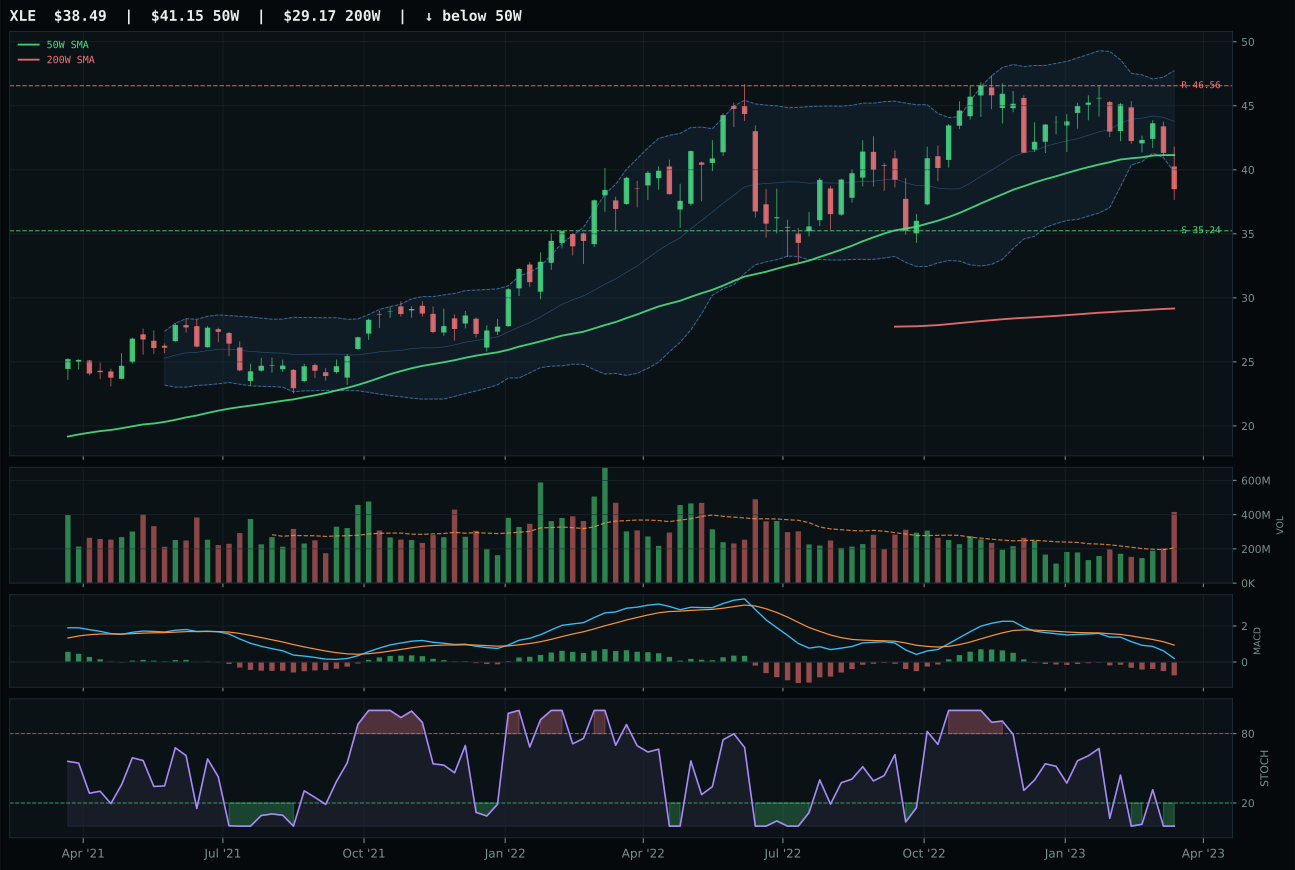
XLE has a neutral structure profile with -10.5% 13-week relative strength versus SPY.
A failed hold above support would weaken the setup.
Actionable but governed by invalidation levels.
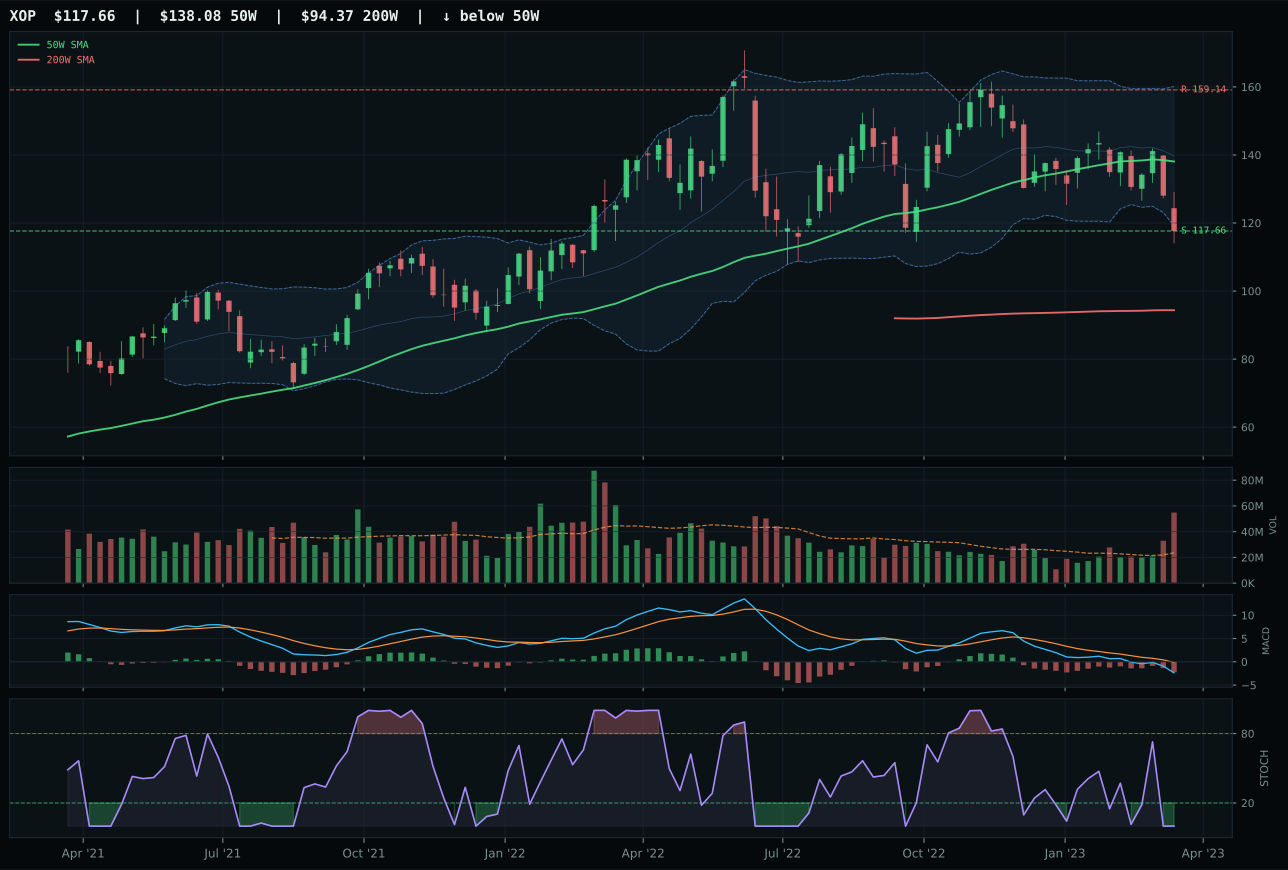
XOP has a pullback into support profile with -14.7% 13-week relative strength versus SPY.
A failed hold above support would weaken the setup.
Actionable but governed by invalidation levels.
XLE won a disqualified category—allocated 0% despite technically edging FCG and XOP—because the entire Traditional Energy complex is broken across all metrics that matter: technical evidence at 1.4/100 is the lowest among all winner candidates, momentum confirmation at 0.0/100 shows zero conviction, and the 13-week return of -8.8% with RS versus SPY at -10.5% confirms relentless selling pressure. XLE's only advantage over FCG was timing (77.0 vs 60.0) and structure (71.3 vs 67.5), both driven by oversold stochastic RSI positioning and neutral structural setup rather than accumulation. The 2.03x volume at XLE reflects distribution pressure, not buying—institutions are liquidating forced positions into strength, not accumulating for recovery. FCG's pullback-into-support setup offered theoretical value, but -15.2% thirteen-week performance and -17.0% SPY relative strength revealed it as the sector's worst performer, disqualifying it on both absolute and relative grounds.
Traditional Energy is allocated 0% this week and ranks 9th or 10th in the category hierarchy, disqualified by a combination of catastrophic technicals and hostile macro conditions. Disinflation pressure is active at -10 and credit stress at -7, both working directly against energy cash flow valuations. The technical evidence of 1.4/100 for the category-winning XLE is a signal that no part of the energy complex offers a defensible setup. Thirteen-week returns across all three ETFs are negative (-8.8% to -15.2%), relative strength universally poor, and volume-price confirmation near zero, indicating the sector is purging capital rather than accumulating it. This allocation can only return to the portfolio if either disinflation expectations reverse sharply (inflation reacceleration) or if credit stress descriptors shift from active to neutral, removing the sector's biggest headwind. Neither is evident in the current regime, so this exclusion is appropriately unambiguous.