
2023-03-10
Informational purposes only. The content in this report, including allocations, analysis, and commentary, is provided solely for informational and educational purposes. It does not constitute financial advice, investment advice, trading advice, or any other type of advice. Past performance does not guarantee future results. Always conduct your own research and consult a qualified financial professional before making investment decisions.
Weekly Allocation
| Ticker | Category | Weight | Role |
|---|---|---|---|
| XAR | Defense & Aerospace | 20% | Top-2 (20%) |
| XLK | Technology | 20% | Top-2 (20%) |
| IGF | Utilities & Infrastructure | 10% | Tier-2 (10%) |
| SMH | AI | 10% | Tier-2 (10%) |
| URA | Nuclear Energy | 10% | Tier-2 (10%) |
| GLD | Precious Metals | 10% | Tier-2 (10%) |
| PICK | Industrial Metals | 10% | Tier-2 (10%) |
| MOO | Agriculture & Livestock | 10% | Tier-2 (10%) |
Trade Instructions — Monday Open
Sell the tranche from 2023-02-10 (completing its 4-week hold). Buy the new tranche. Instructions show net portfolio changes — same-asset positions cancel, weight changes show the delta.
| Action | Ticker | Instruction |
|---|---|---|
| SELL | CIBR | Sell 33% of CIBR position (reduce 15.00% → 10.00%) |
| SELL | SMH | Sell 20% of SMH position (reduce 12.50% → 10.00%) |
| SELL | COPX | Sell 17% of COPX position (reduce 15.00% → 12.50%) |
| SELL | PAVE | Sell 33% of PAVE position (reduce 7.50% → 5.00%) |
| SELL | ITA | Sell 25% of ITA position (reduce 10.00% → 7.50%) |
| SELL | URNM | Sell entire URNM position (2.50% of portfolio) |
| SELL | WEAT | Sell 50% of WEAT position (reduce 5.00% → 2.50%) |
| BUY | XAR | Buy XAR — 25.00% of freed cash (adds 5.00% to portfolio) |
| BUY | URA | Buy URA — 12.50% of freed cash (adds 2.50% to portfolio) |
| BUY | XLK | Buy XLK — 25.00% of freed cash (adds 5.00% to portfolio) |
| BUY | MOO | Buy MOO — 12.50% of freed cash (adds 2.50% to portfolio) |
| BUY | IGF | Buy IGF — 12.50% of freed cash (adds 2.50% to portfolio) |
| BUY | PICK | Buy PICK — 12.50% of freed cash (adds 2.50% to portfolio) |
Current Portfolio After Trade
Combined holdings across all 4 active tranches. Each tranche is 25% of the portfolio.
| Ticker | % of Portfolio | Weight Bar |
|---|---|---|
| COPX | 12.50% | |
| CIBR | 10.00% | |
| SMH | 10.00% | |
| URA | 10.00% | |
| GLD | 7.50% | |
| ITA | 7.50% | |
| XAR | 7.50% | |
| XLK | 7.50% | |
| PAVE | 5.00% | |
| MOO | 5.00% | |
| WEAT | 2.50% | |
| SLV | 2.50% | |
| XLE | 2.50% | |
| XLU | 2.50% | |
| BOTZ | 2.50% | |
| IGF | 2.50% | |
| PICK | 2.50% |
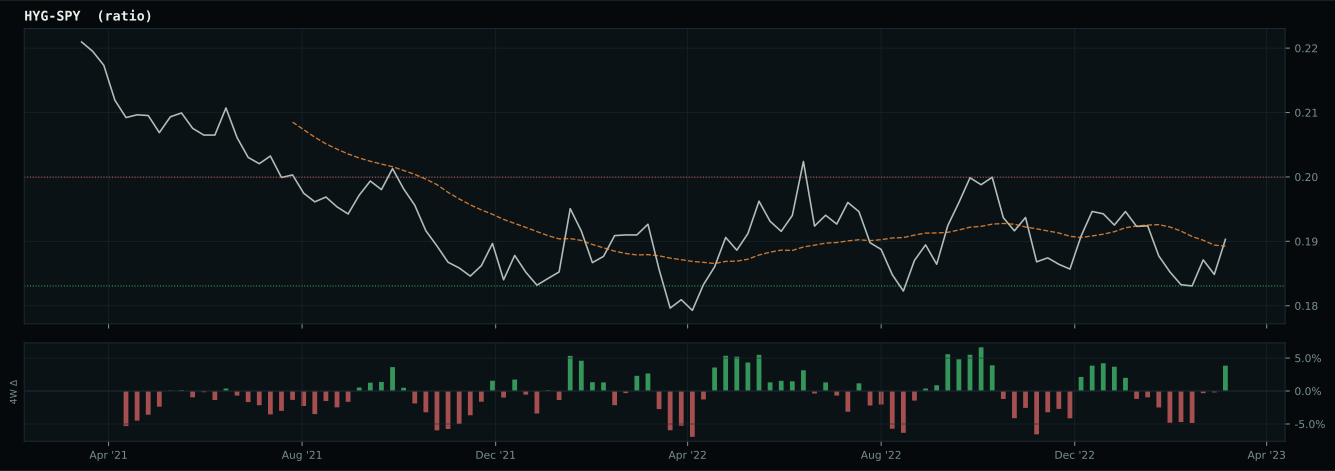
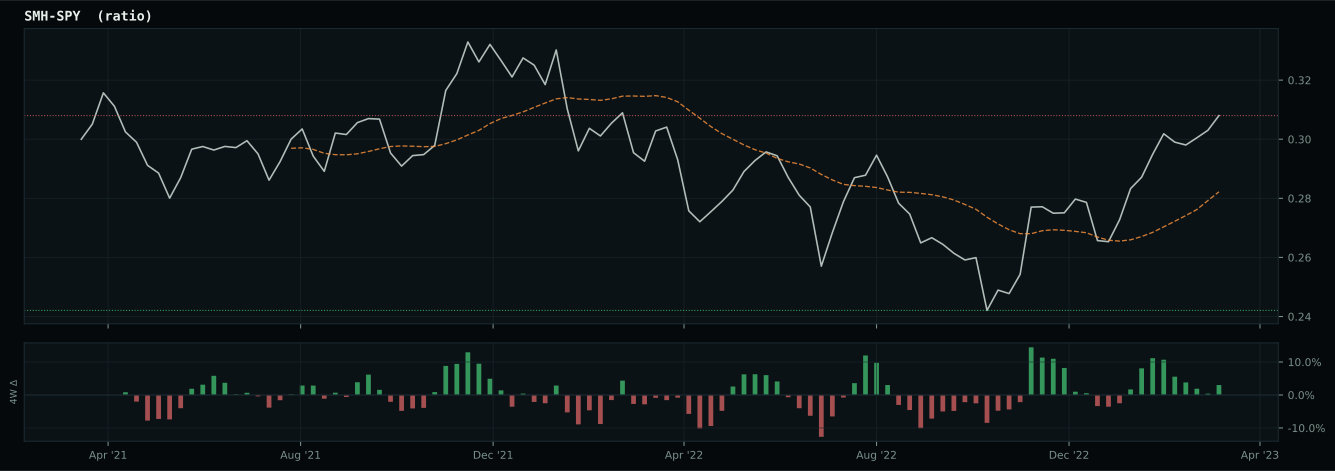
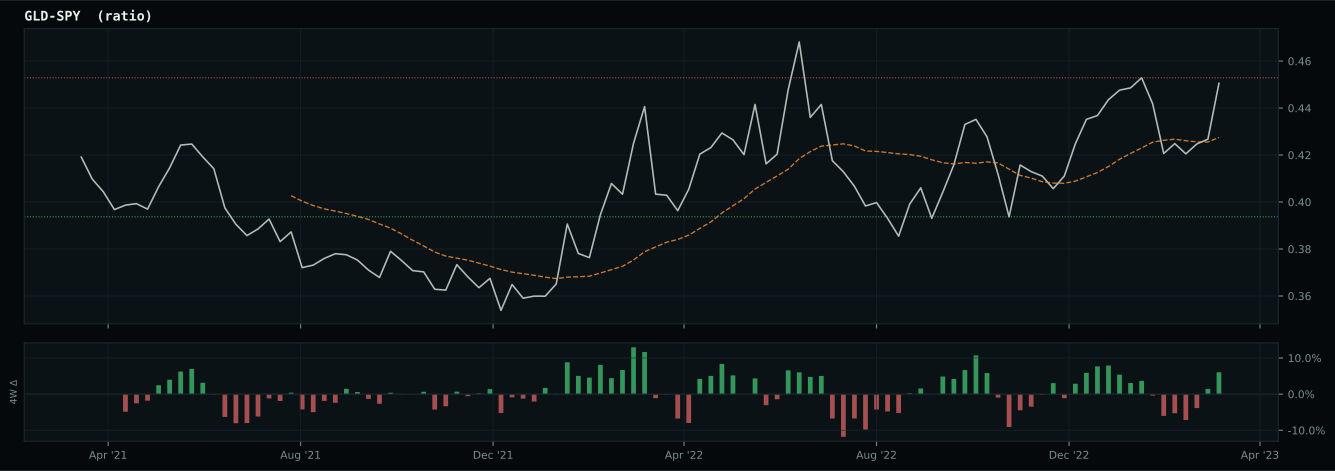
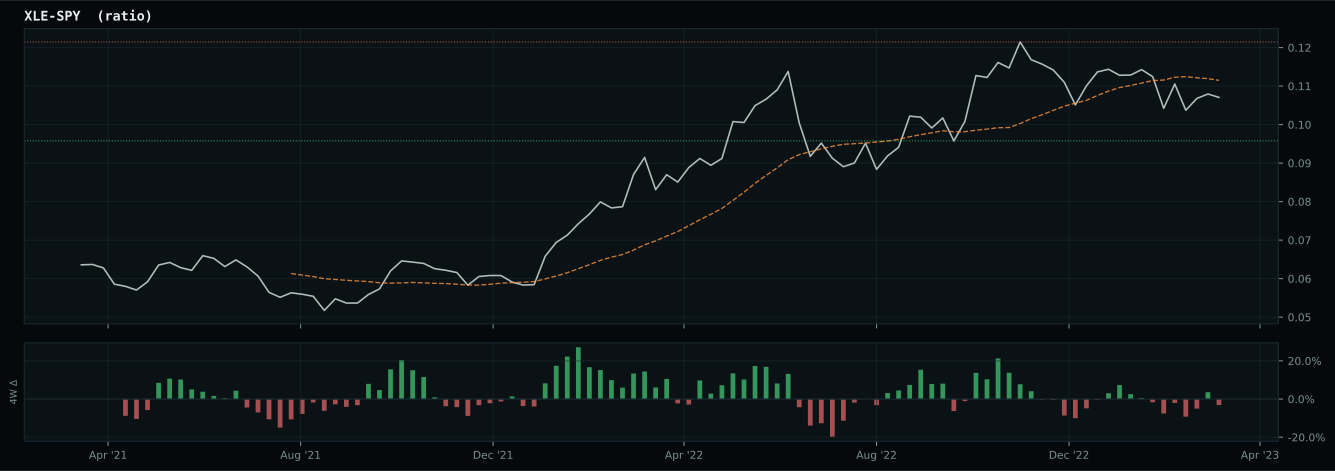
Macro Regime — Disinflation
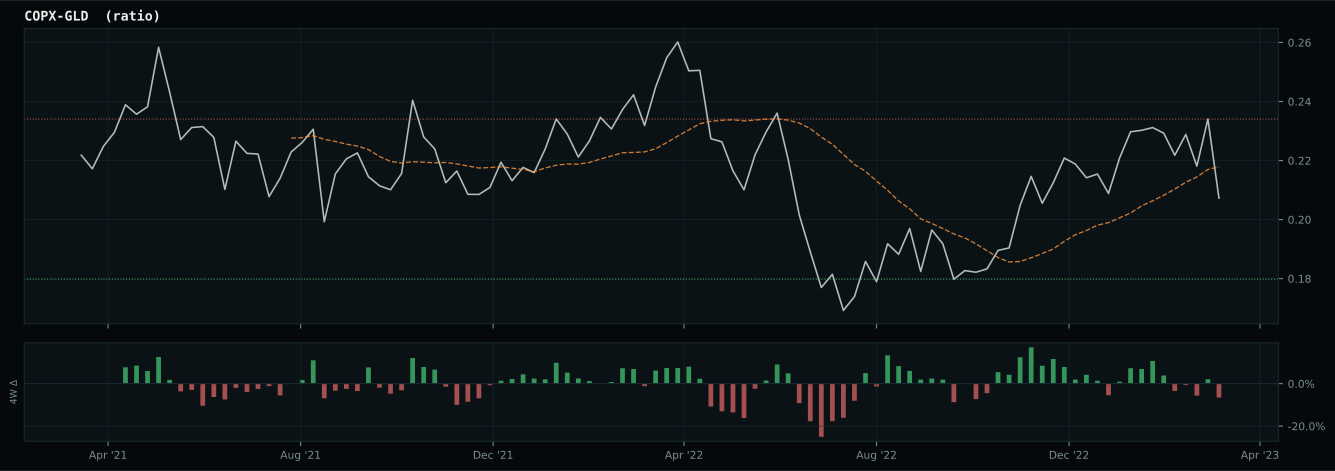
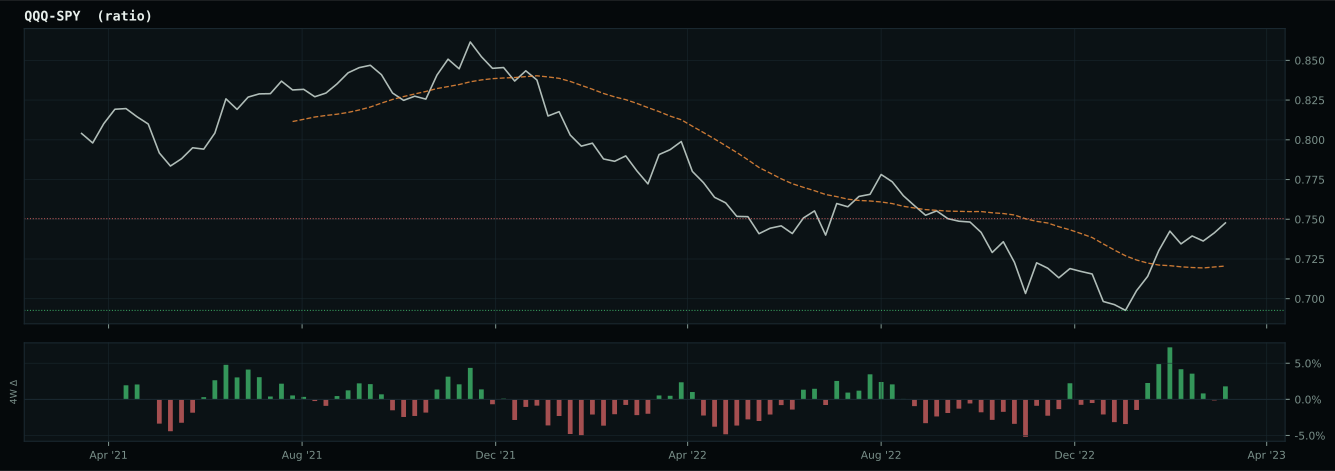
Macro Evidence Charts
Market-implied signals behind the macro regime scores. Each ratio compares two assets; the direction and slope of the ratio is what the macro engine reads.
Crypto Regime — NoCrypto
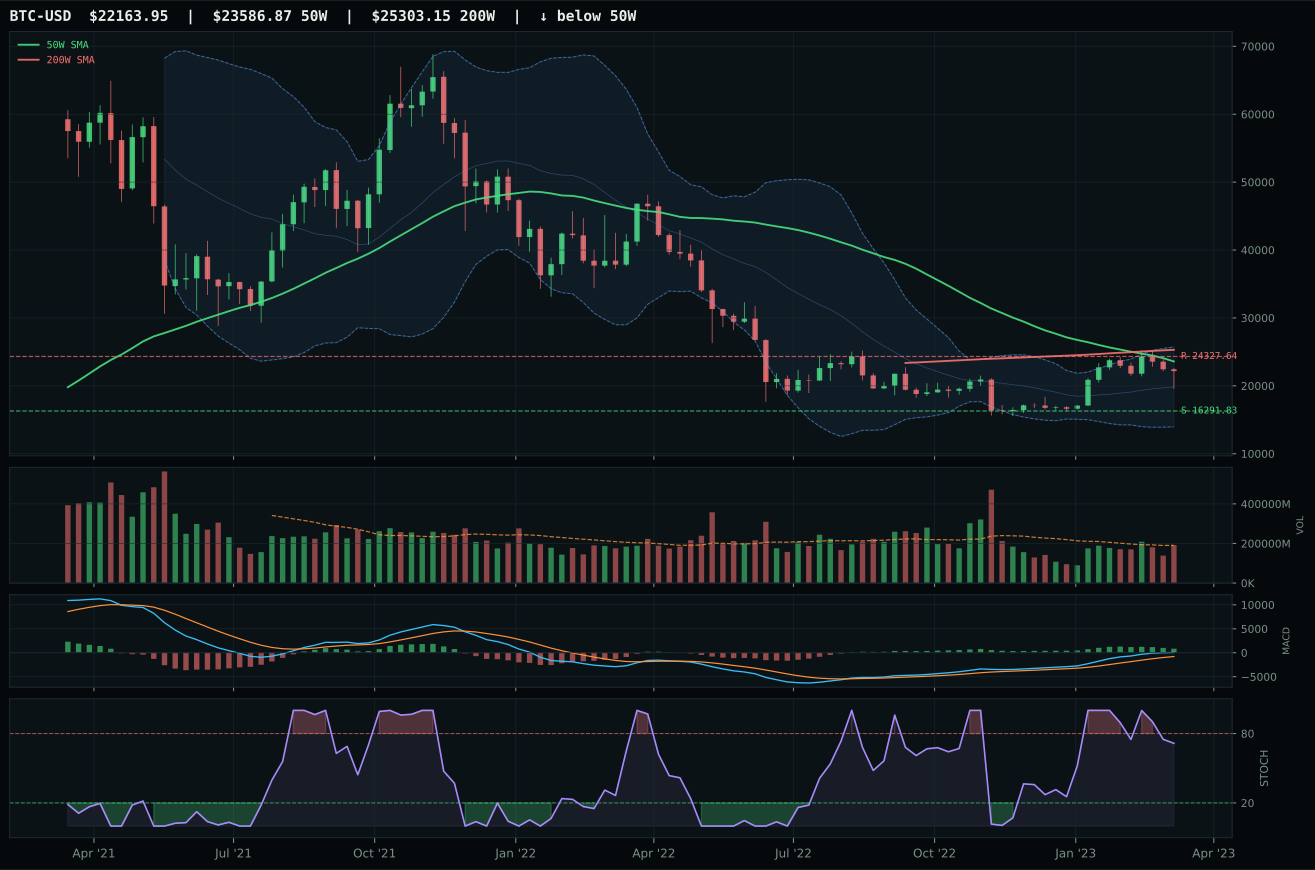
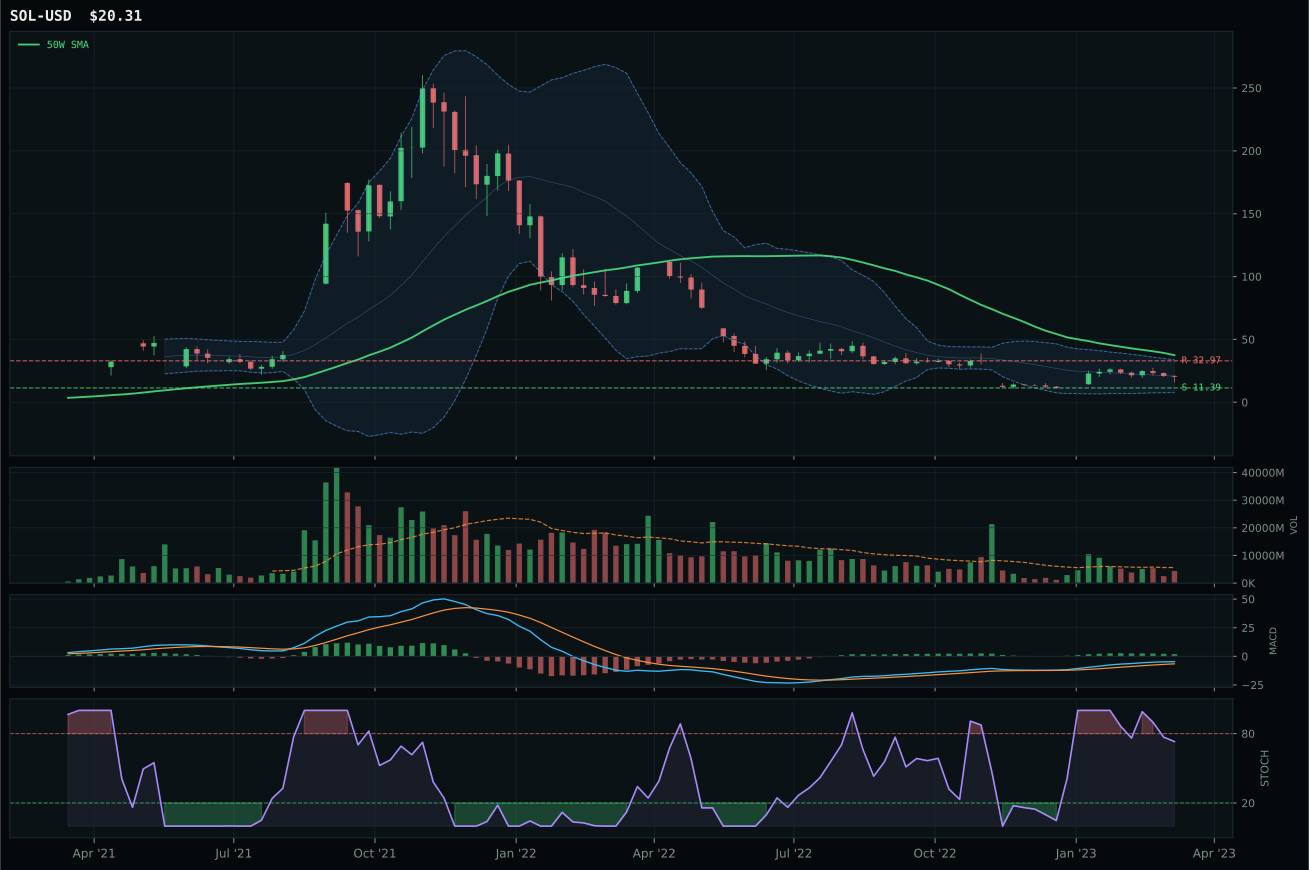
ValueBTC armed; waiting for 50W reclaim, decisive close above post-touch range resistance by 3%, close above 200W
TrendBTC not confirmed
one or more available conditions failed
Category Rankings
| Rank | Category | Winner | Score | Alloc | 4W Ret | Peers (4W) |
|---|---|---|---|---|---|---|
| 1 | Defense & Aerospace | XAR | 58.2 | 20% | +1.03% | ITA +1.9% · ROKT -0.8% |
| 2 | Technology | XLK | 50.7 | 20% | +9.39% | CIBR +4.7% · IGV +10.2% |
| 3 | Utilities & Infrastructure | IGF | 48.8 | 10% | +4.98% | PAVE -3.8% · XLU +7.9% |
| 4 | AI | SMH | 45.9 | 10% | +6.55% | BOTZ +6.2% · AIQ +9.7% |
| 5 | Nuclear Energy | URA | 39.6 | 10% | -3.01% | NLR +2.9% · URNM -3.6% |
| 6 | Precious Metals | GLD | 36.9 | 10% | +4.82% | GDX +19.2% · SLV +15.8% |
| 7 | Industrial Metals | PICK | 18.9 | 10% | -0.72% | COPX +8.2% · REMX +0.7% |
| 8 | Agriculture & Livestock | MOO | 5.2 | 10% | -0.46% | VEGI -2.1% · WEAT +1.2% |
| 9 | Emerging Markets | INDA | 5.2 | 0% | +2.68% | ILF +1.6% · IEMG +3.9% |
| 10 | Traditional Energy | XLE | 4.0 | 0% | +5.94% | FCG +6.8% · XOP +5.8% |
Defense & Aerospace — XAR
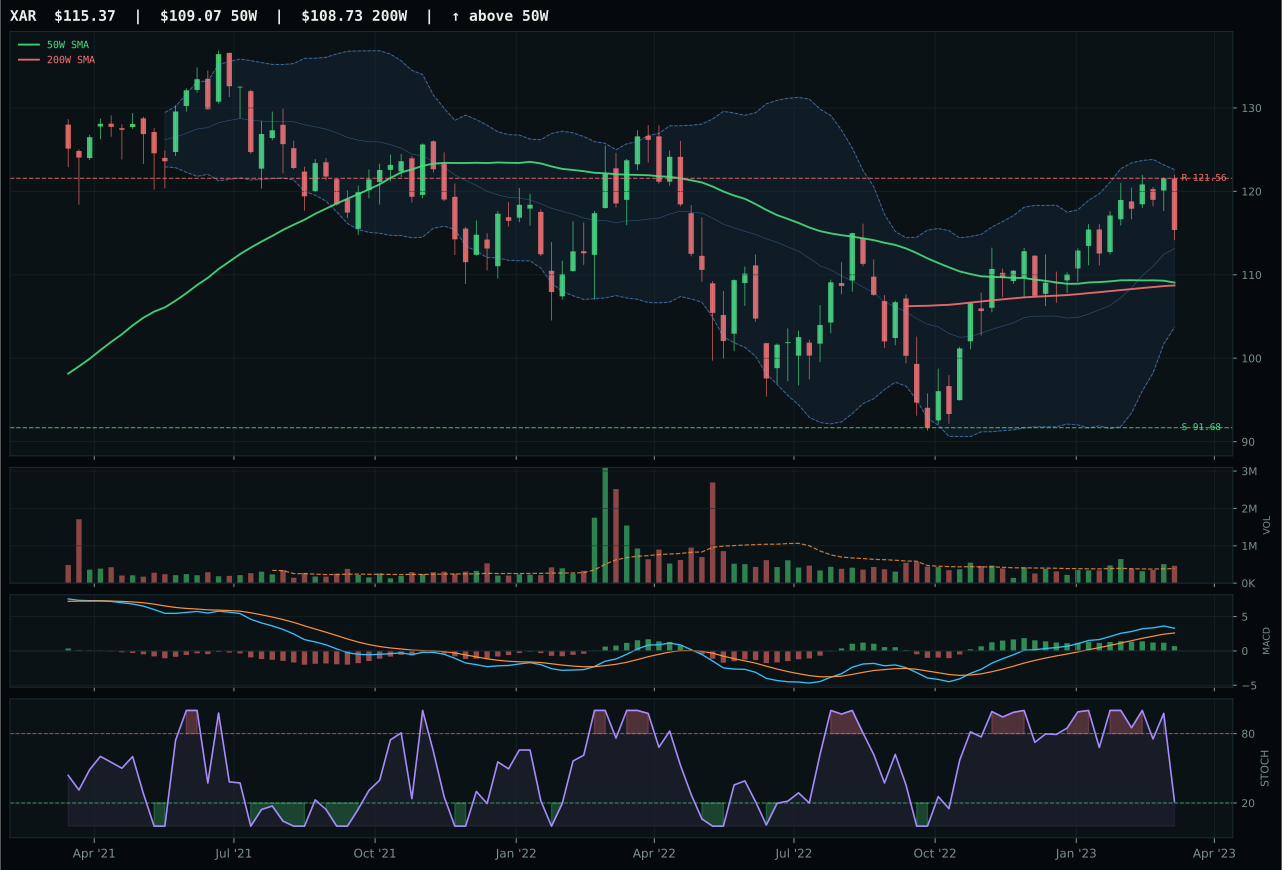
XAR has a neutral structure profile with 9.2% 13-week relative strength versus SPY.
A failed hold above support would weaken the setup.
Actionable but governed by invalidation levels.
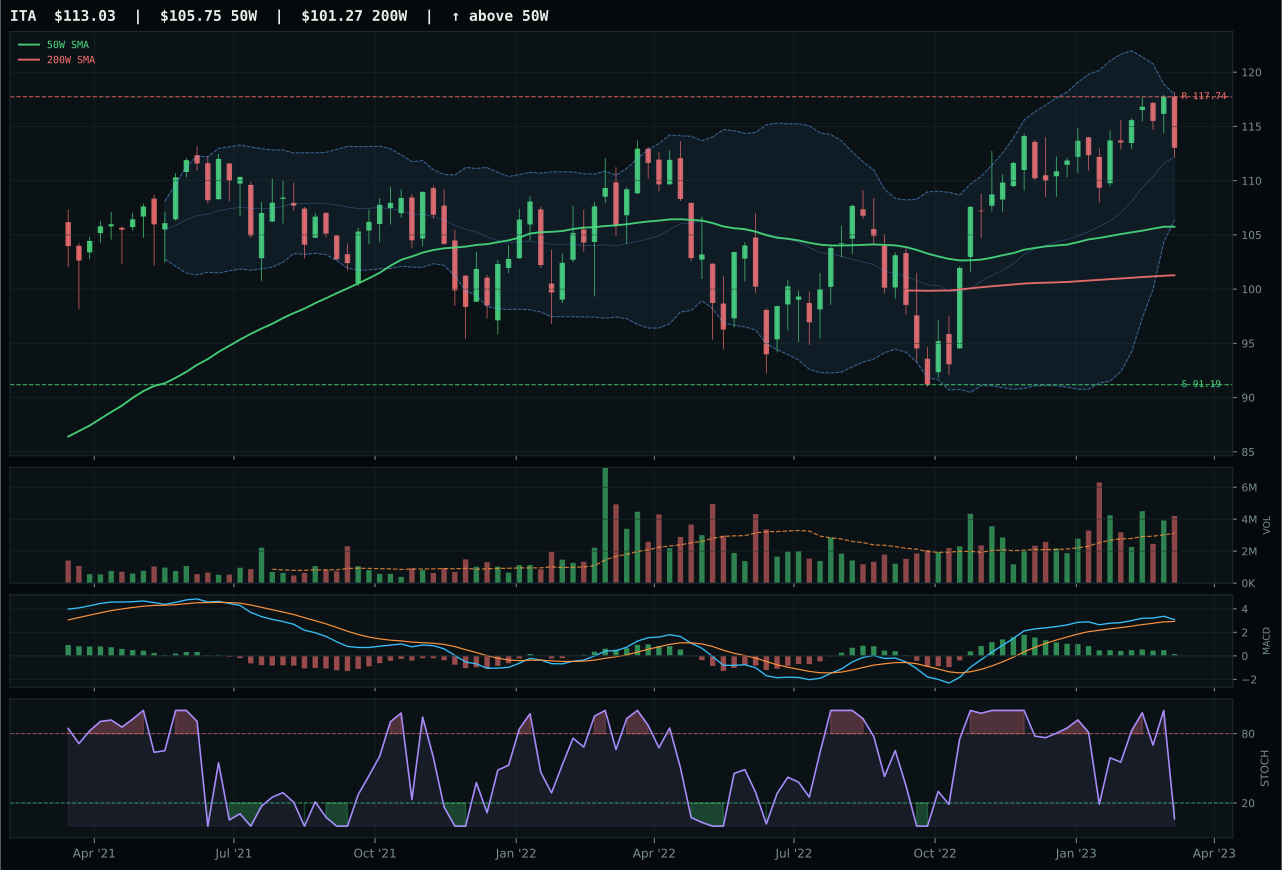
ITA has a neutral structure profile with 4.4% 13-week relative strength versus SPY.
A failed hold above support would weaken the setup.
Actionable but governed by invalidation levels.
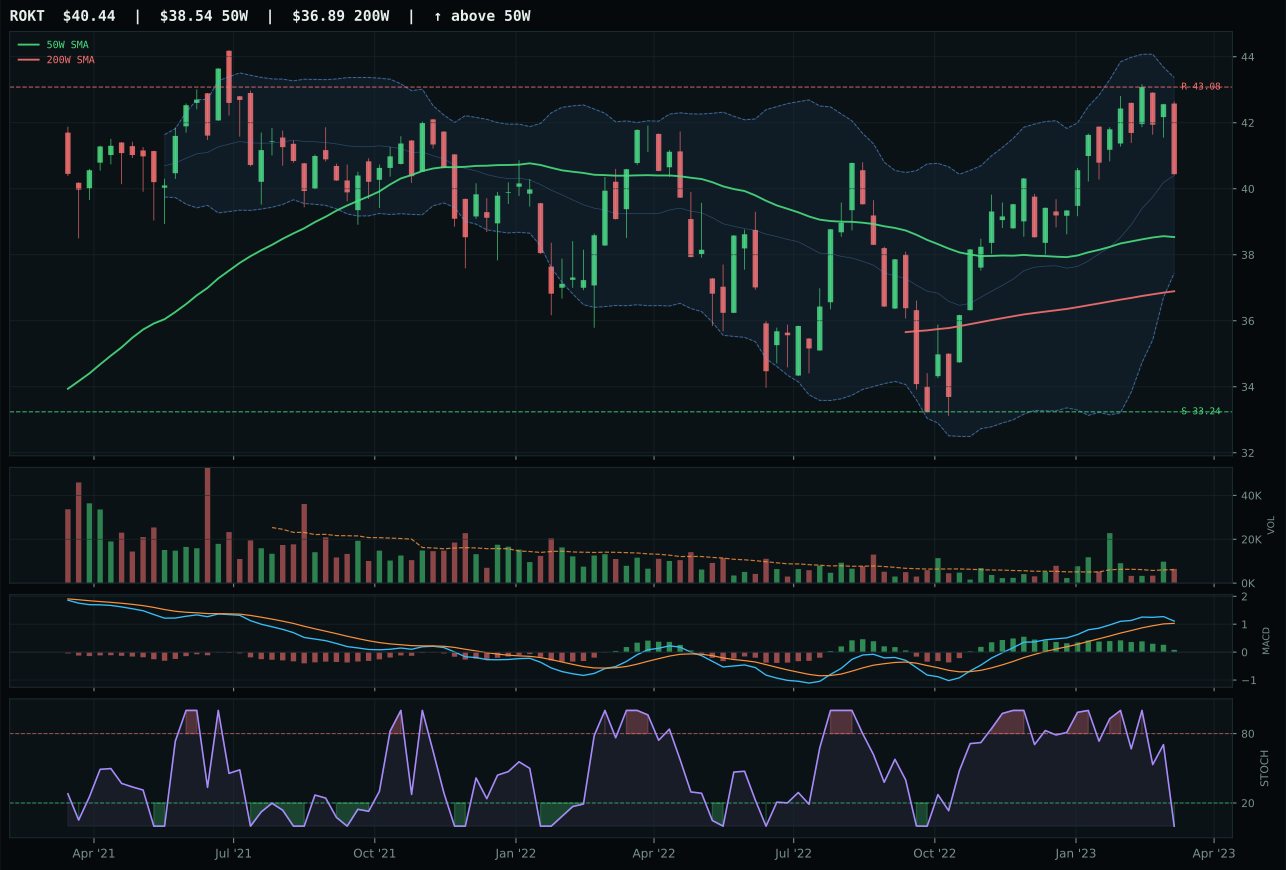
ROKT has a neutral structure profile with 6.8% 13-week relative strength versus SPY.
A failed hold above support would weaken the setup.
Tracked, but not top-2 eligible because: .
XAR captured Defense & Aerospace with a commanding 2.4-point category-relative strength advantage over ITA, the only tight margin among winners this week, indicating genuine peer competition rather than consensus leadership. The trade thesis rests on XAR's 9.2% relative strength versus SPY combined with above-average volume at 1.19x the 20-week average, both markers that new money is flowing into the broad aerospace ecosystem rather than just prime contractors. Price sits 5.8% above the 50-week moving average in the upper retracement zone near Fib 0.382, a zone that offers downside support without the overextension risk of deep breakouts. ITA's marginally better trend score of 100 (price action is cleaner) masks its category underperformance at -2.4% relative strength; buyers are choosing the diversified XAR over the defense-prime concentration of ITA, a meaningful shift in composition preference that the scoring system correctly captures.
Defense & Aerospace earned its 20% top-2 allocation on a final category score of 58.2, driven by strong technical evidence (71.2) and robust macro fit (63.0) in a disinflation regime. Defensive rotation is active at +8, broad market bear at +6, and liquidity stress at -4, creating a defensive positioning framework that appeals in uncertain macro conditions. The 7.3% 13-week return matches AI's SMH exactly, and the 2.4% category-relative strength shows internal strength; critically, the macro narrative—that risk-off conditions will favor defensive durability over cyclical upside—provides conviction for sustained allocation. The category's 76.9 structure score reflects clean compression with well-defined support and resistance, meaning that the setup can be defended if market conditions remain uncertain. Allocation here reflects genuine macro hedging value rather than momentum chasing, distinguishing it from speculative rotations into momentum extremes.
Technology — XLK
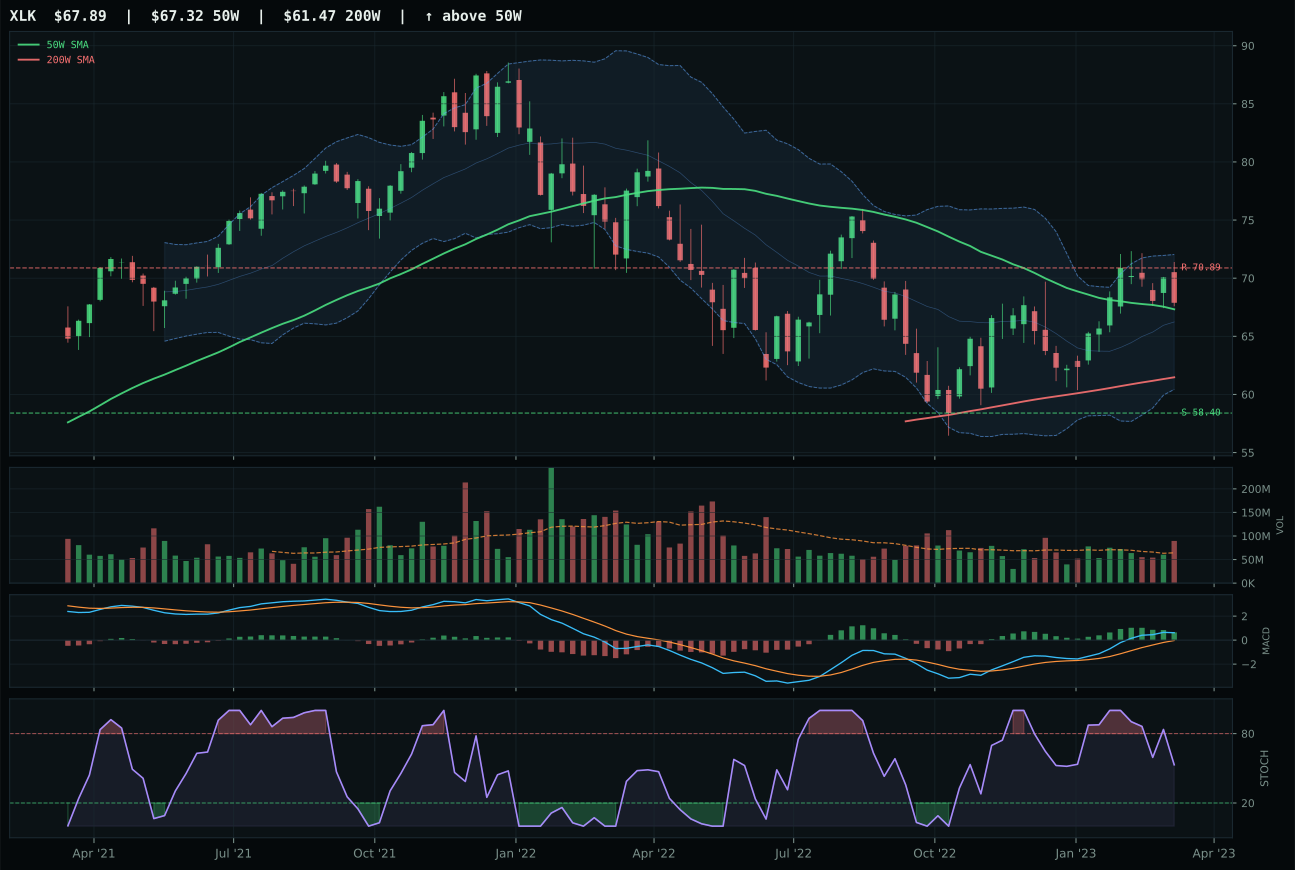
XLK has a compression near 50W profile with 5.6% 13-week relative strength versus SPY.
A failed hold above support would weaken the setup.
Actionable but governed by invalidation levels.
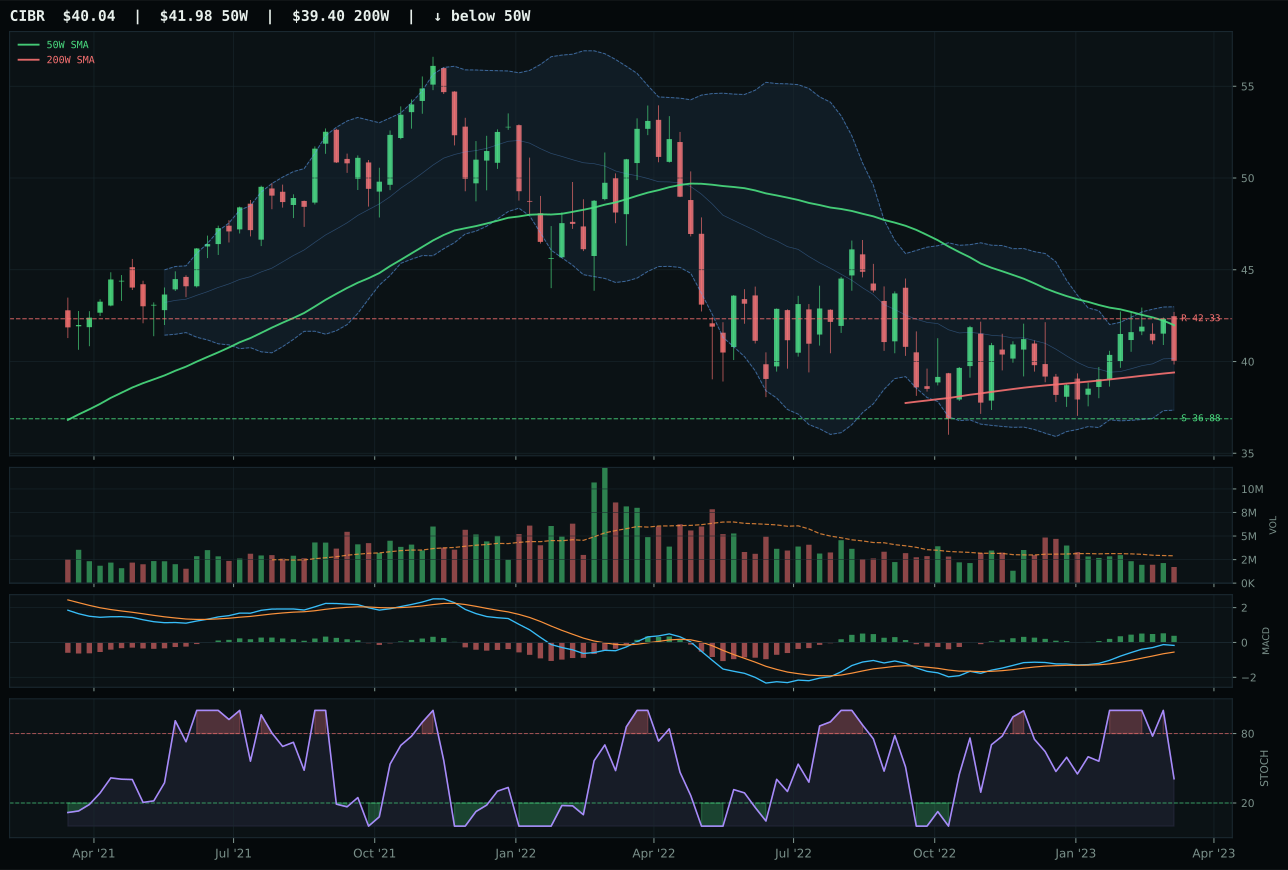
CIBR has a neutral structure profile with 2.5% 13-week relative strength versus SPY.
A failed hold above support would weaken the setup.
Actionable but governed by invalidation levels.
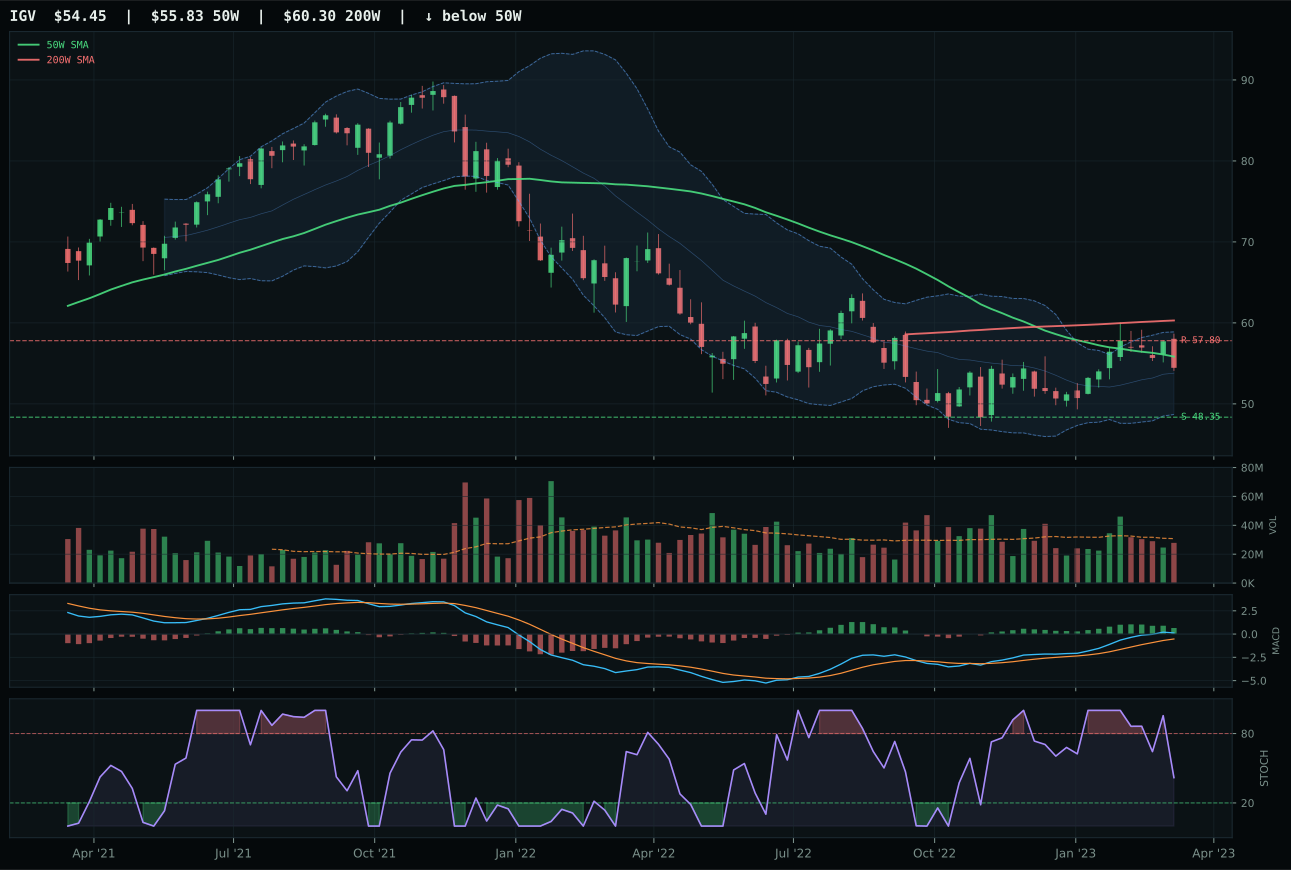
IGV has a compression near 50W profile with 6.9% 13-week relative strength versus SPY.
Extension and support failure are the main tactical risks.
Tracked, but not top-2 eligible because: structurally broken.
XLK secured the Technology slot by establishing clean leadership across the three-ETF basket with a 26.3-point gap over CIBR. The setup sits compressed near the 50-week moving average at just 0.8% distance, MACD remains bullish though flattening, and above-average volume participation at 1.39x the 20-week mean signals accumulation rather than distribution. The 5.6% relative strength advantage versus SPY combined with the neutral timing score of 100 (price in the Fibonacci decision zone) creates a textbook mean-reversion coil: new buyers are not yet exhausted, the structure is clean enough to expand, and the risk-reward at 57.7 reflects reasonable asymmetry given the tight positioning. CIBR's failure stems from thinner volume, weaker category relative strength at -3.1%, and a lower timing score of 85, leaving it vulnerable to whipsaws if the compression fails to resolve upward.
Technology earned its 20% top-2 allocation as the highest-ranked category after Defense & Aerospace, driven primarily by strong technical evidence at 67.7 and category-level macro fit of 67.0. In the disinflation regime, the active macro descriptors—risk appetite positive at +9, AI growth sponsorship at +6, and disinflation pressure at +5—outweigh the -10 liquidity stress penalty, creating net-positive macro tailwinds for profitable tech leadership. The category's 13-week return of 3.7% for the representative is the weakest among the top performers, which is why it ranks second rather than first, but the compression setup and above-average volume provide timing geometry that argues for holding alongside Defense. If liquidity stress were to intensify or risk appetite to flip negative, this allocation would face immediate pressure, but the AI sponsorship narrative remains active and has proven durable through disinflation cycles.
Utilities & Infrastructure — IGF
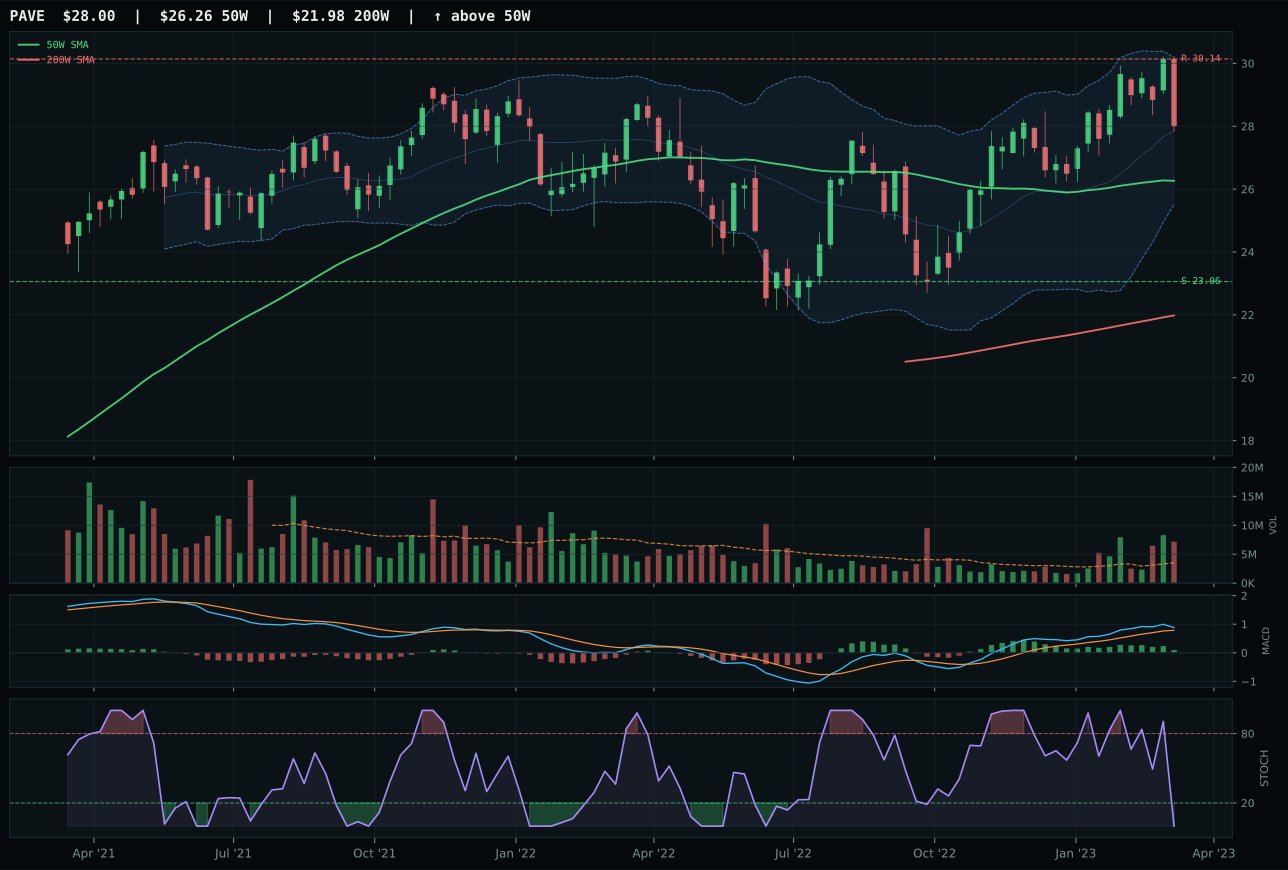
PAVE has a neutral structure profile with 4.4% 13-week relative strength versus SPY.
A failed hold above support would weaken the setup.
Actionable but governed by invalidation levels.
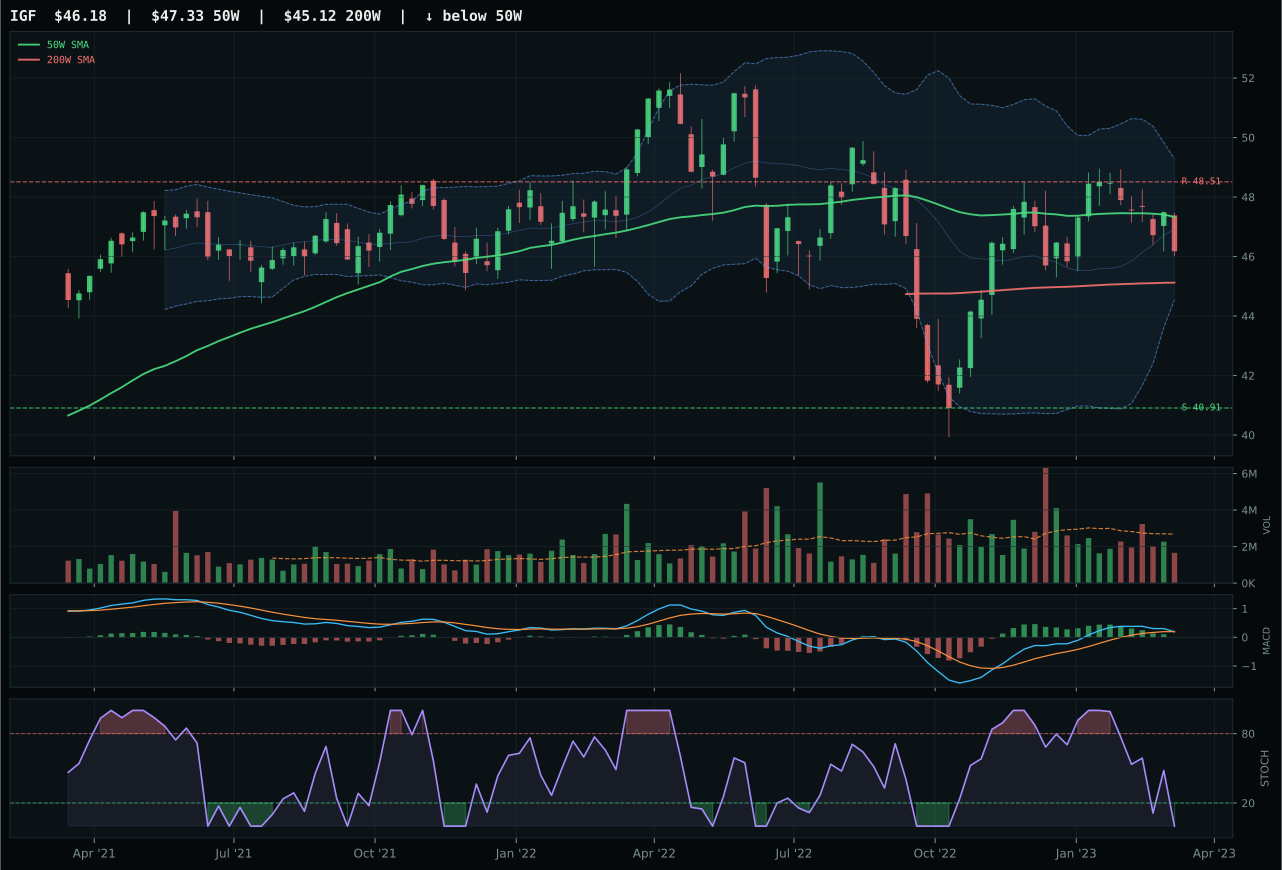
IGF has a compression near 50W profile with 0.1% 13-week relative strength versus SPY.
A failed hold above support would weaken the setup.
Actionable but governed by invalidation levels.
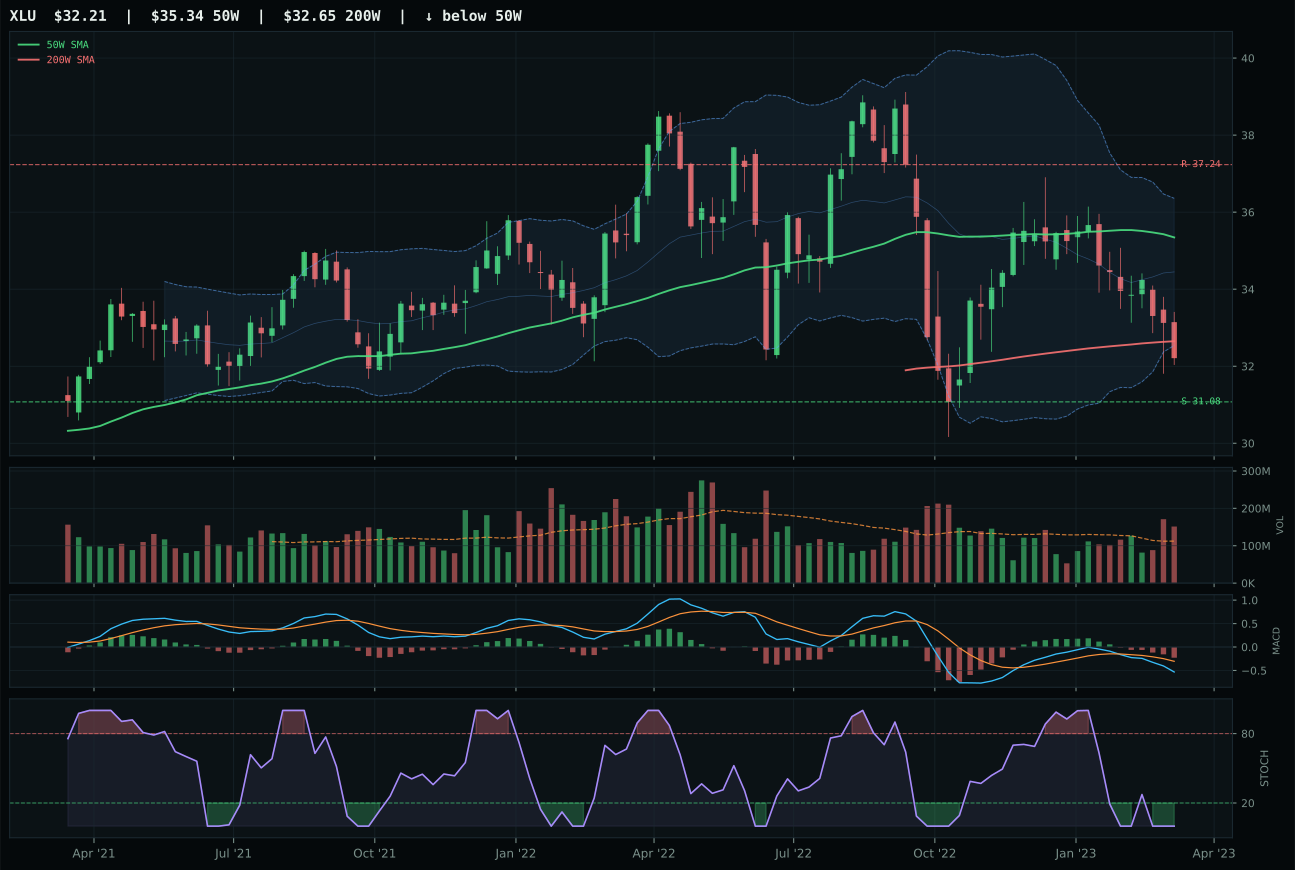
XLU has a pullback into support profile with -7.2% 13-week relative strength versus SPY.
A failed hold above support would weaken the setup.
Actionable but governed by invalidation levels.
IGF narrowly won Utilities & Infrastructure over PAVE, its runner-up, through superior timing (100.0 vs 70.0) and better risk-reward (59.7 vs 43.0) despite PAVE's superior trend (93 vs 47) and momentum (55 vs 24). The decision hinges on positioning: IGF sits 2.4% below the 50-week in a compression setup near the Fibonacci decision zone (Fib 0.500), offering minimal downside risk and defined re-entry geometry, while PAVE sits 6.6% above the 50-week with distribution-pressure volume (a warning that insiders are exiting), creating risk of mean reversion. IGF's thin volume at 0.62x the 20-week average reflects infrastructure's characteristic illiquidity, but in a defensive rotation, thin volume can be feature rather than bug—fewer forced sellers. PAVE's 2.5% 13-week return beats IGF's -1.8%, but the structure difference is decisive: PAVE is extended and vulnerable to profit-taking, while IGF offers a safe harbor entry with defined support at 40.91.
Utilities & Infrastructure earned 10% allocation driven almost entirely by exceptional macro fit (78.0), the second-highest category-level fit after Precious Metals. Defensive rotation is active at +12, disinflation at +7, broad market bear at +4, and transition-mixed regime support at +4, creating a robust defensive framework. In a disinflation regime, utility and infrastructure assets deliver two critical functions: predictable cash flows that compound during low-rate environments, and real-asset inflation hedges that protect if deflation reverses. IGF's 35.6 technical evidence is weak (price action is deteriorating), but the 59.0 macro fit and compression setup combine to justify allocation. The -1.8% 13-week return reflects the defensive sector's lag, but that lag is mean-reversion candidate rather than fundamental failure. Conviction here is pure macro hedging: defensive rotation should favor utilities, and if risk-off sentiment intensifies, defensive rotation will remain the dominant theme, supporting further allocation. If momentum suddenly reverses to risk-on, this position should be among the first to liquidate, as its technical weakness makes it vulnerable in rallies.
AI — SMH
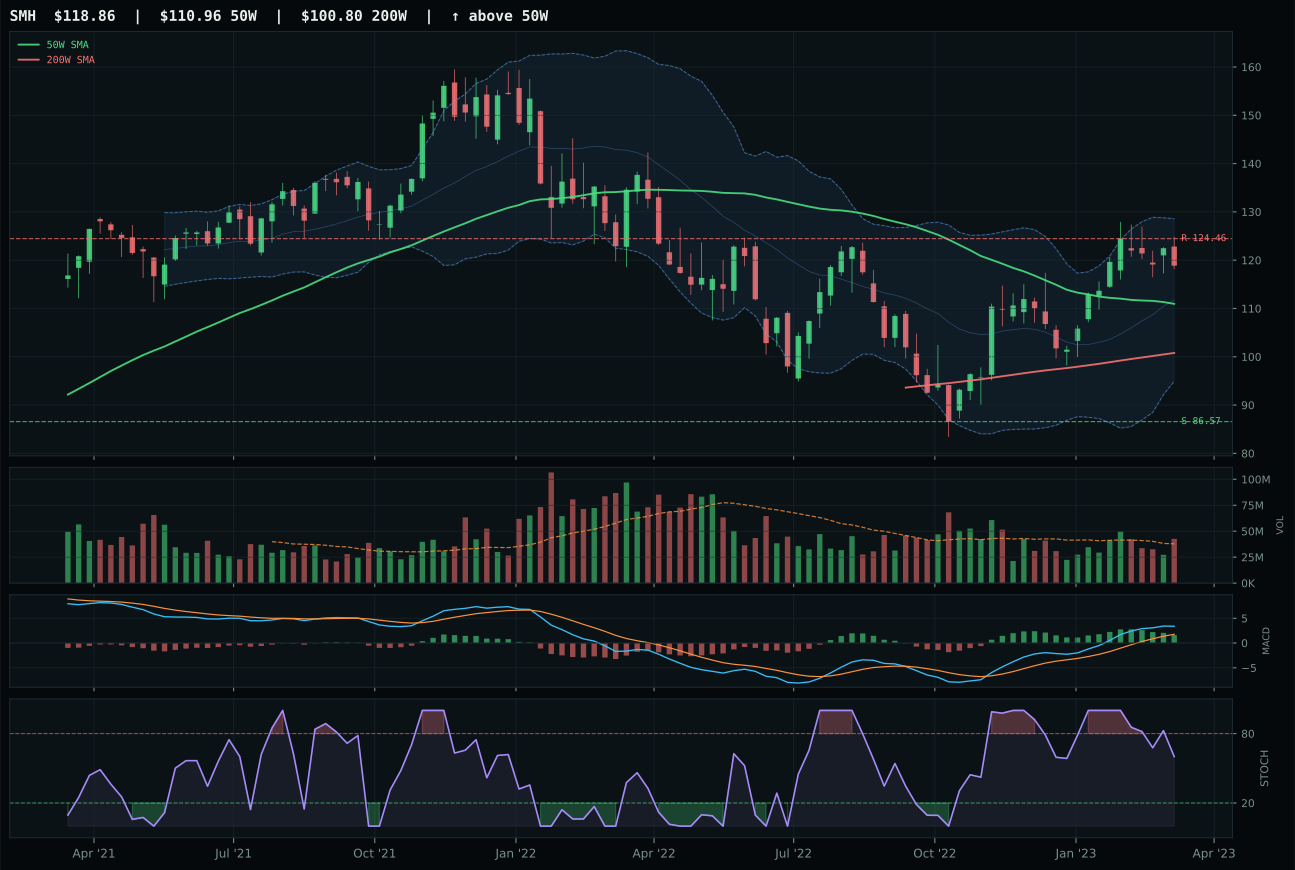
SMH has a neutral structure profile with 9.9% 13-week relative strength versus SPY.
A failed hold above support would weaken the setup.
Actionable but governed by invalidation levels.
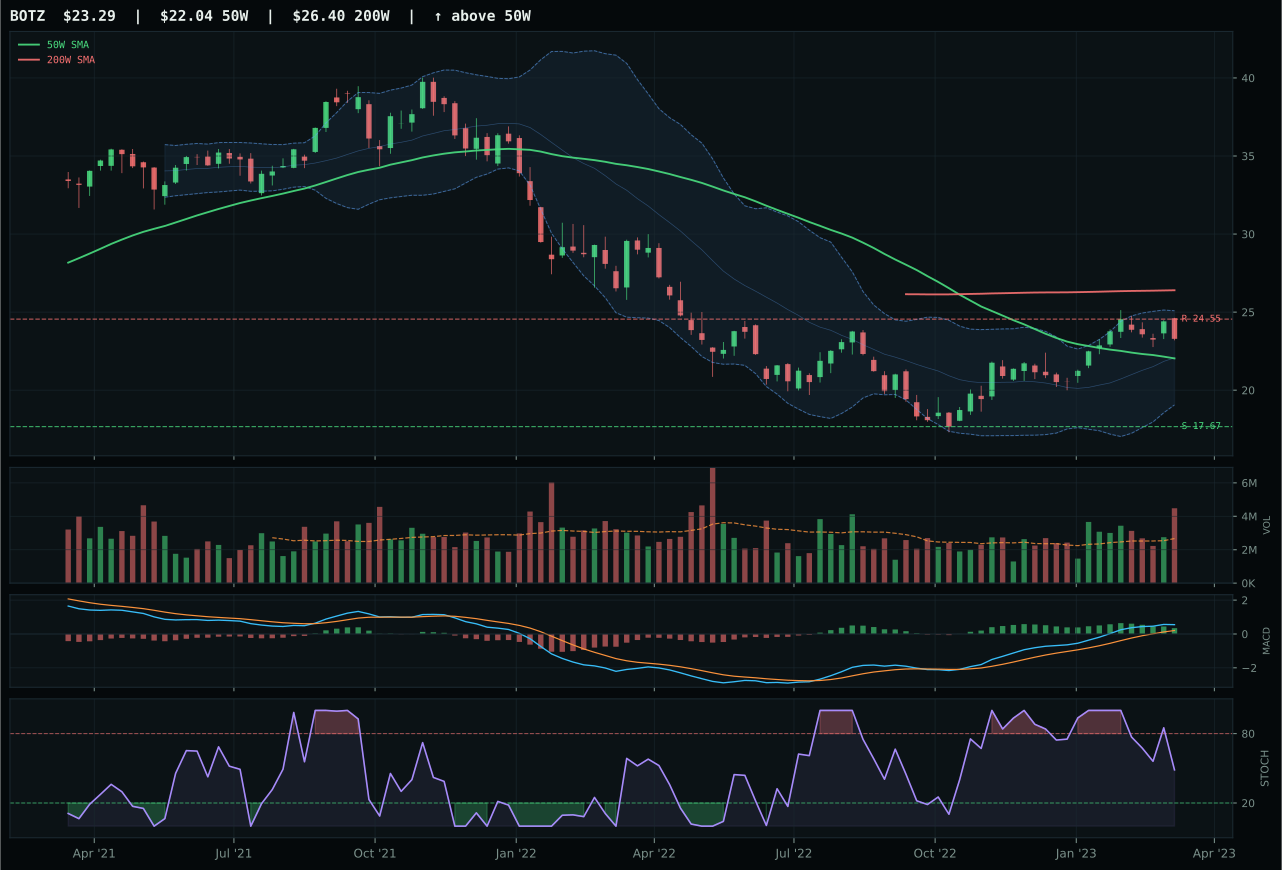
BOTZ has a neutral structure profile with 12.0% 13-week relative strength versus SPY.
A failed hold above support would weaken the setup.
Actionable but governed by invalidation levels.
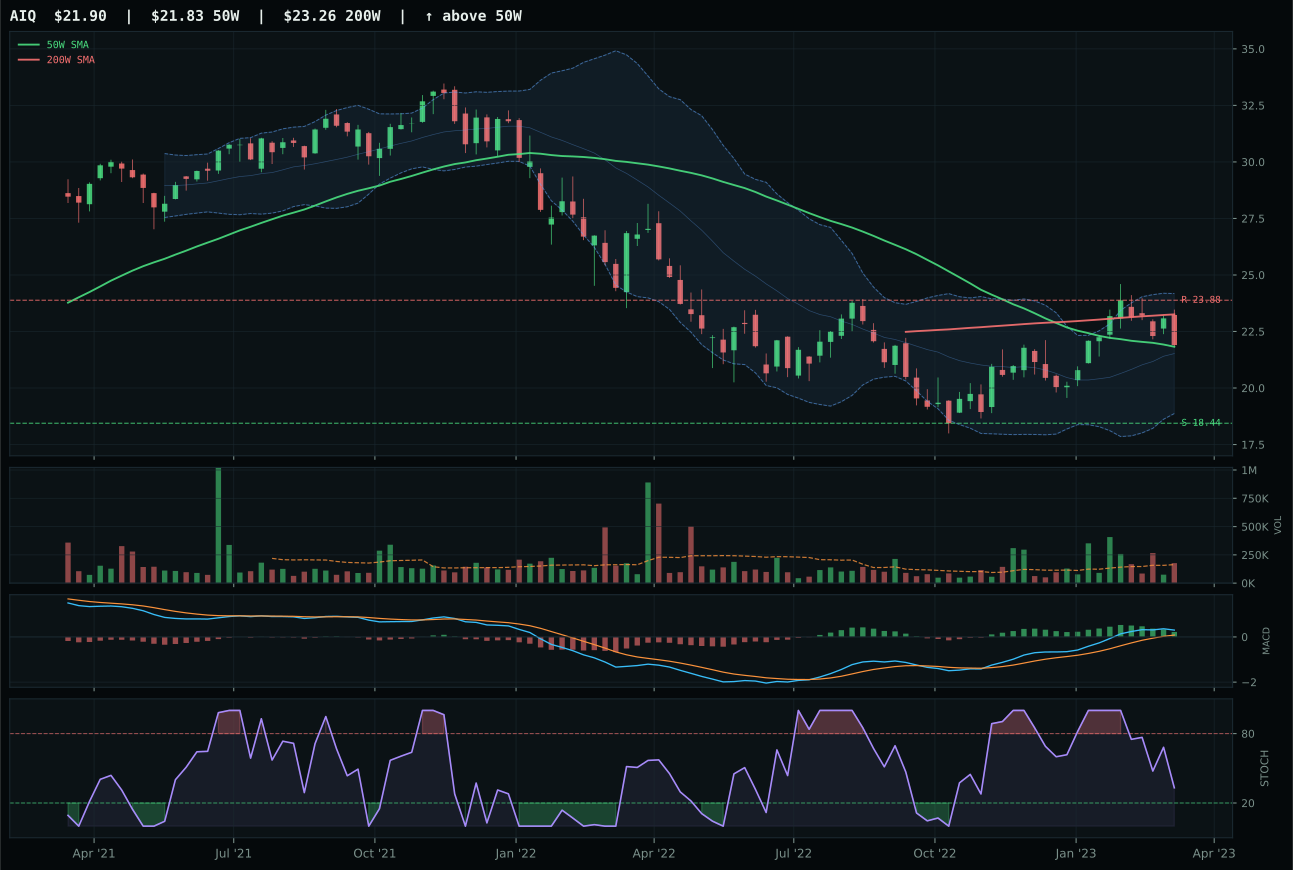
AIQ has a compression near 50W profile with 5.4% 13-week relative strength versus SPY.
A failed hold above support would weaken the setup.
Tracked, but not top-2 eligible because: .
SMH captured the AI category with a 6.7-point margin over BOTZ through superior timing (77 vs 70) and better risk-reward (55.2 vs 47.9) despite BOTZ's higher 13-week return of 10.1% versus SMH's 8.0%. The semiconductor play benefits from above-average volume participation and sits at a 7.1% distance from the 50-week moving average, placing it in a neutral-to-bullish structural zone that avoids the false breakout risk of overextended moves. Momentum confirmation is strong at 80.4, reflecting the 9.9% SPY-relative strength, and stochastic RSI remains in the falling-neutral zone, suggesting room for mean reversion before overbought conditions emerge. BOTZ's distribution pressure—a warning flag that large holders are reducing exposure—combined with weaker structure and timing, disqualifies it despite higher short-term momentum, revealing the difference between short-term price action and sustainable accumulation.
AI received 10% allocation as the third-ranked category, below the two 20% slots, reflecting adequate technical sponsorship (70.7) tempered by macro headwinds. Risk appetite remains positive at +10 and AI growth sponsorship is strong at +14, yet liquidity stress at -12 and broad market bear at -8 create competing currents that cap the macro fit at 59.0. The 8.0% 13-week return for SMH is respectable but trails Defense's 7.3% and Technology's 3.7% once risk-adjusted; the category's real edge lies in its extreme relative strength (9.9% vs SPY) and disinflation tailwinds, which offset the weak momentum confirmation on the BOTZ runner-up. To push AI into a 20% slot would require either deteriorating breadth in Tech or a pickup in risk appetite metrics; currently, it deserves core exposure but not top-tier capital allocation in a macro environment where liquidity is contested.
Nuclear Energy — URA
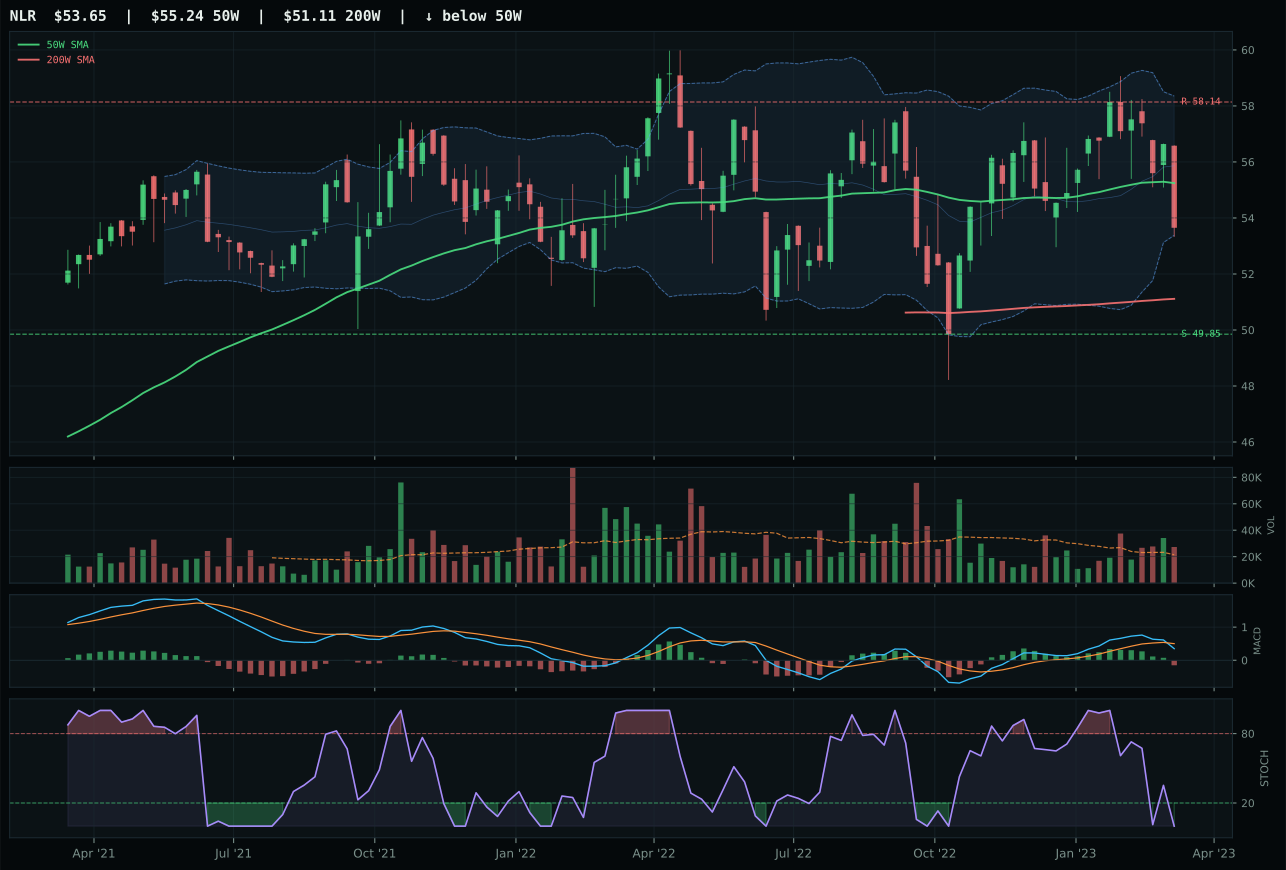
NLR has a compression near 50W profile with -0.7% 13-week relative strength versus SPY.
A failed hold above support would weaken the setup.
Tracked, but not top-2 eligible because: .
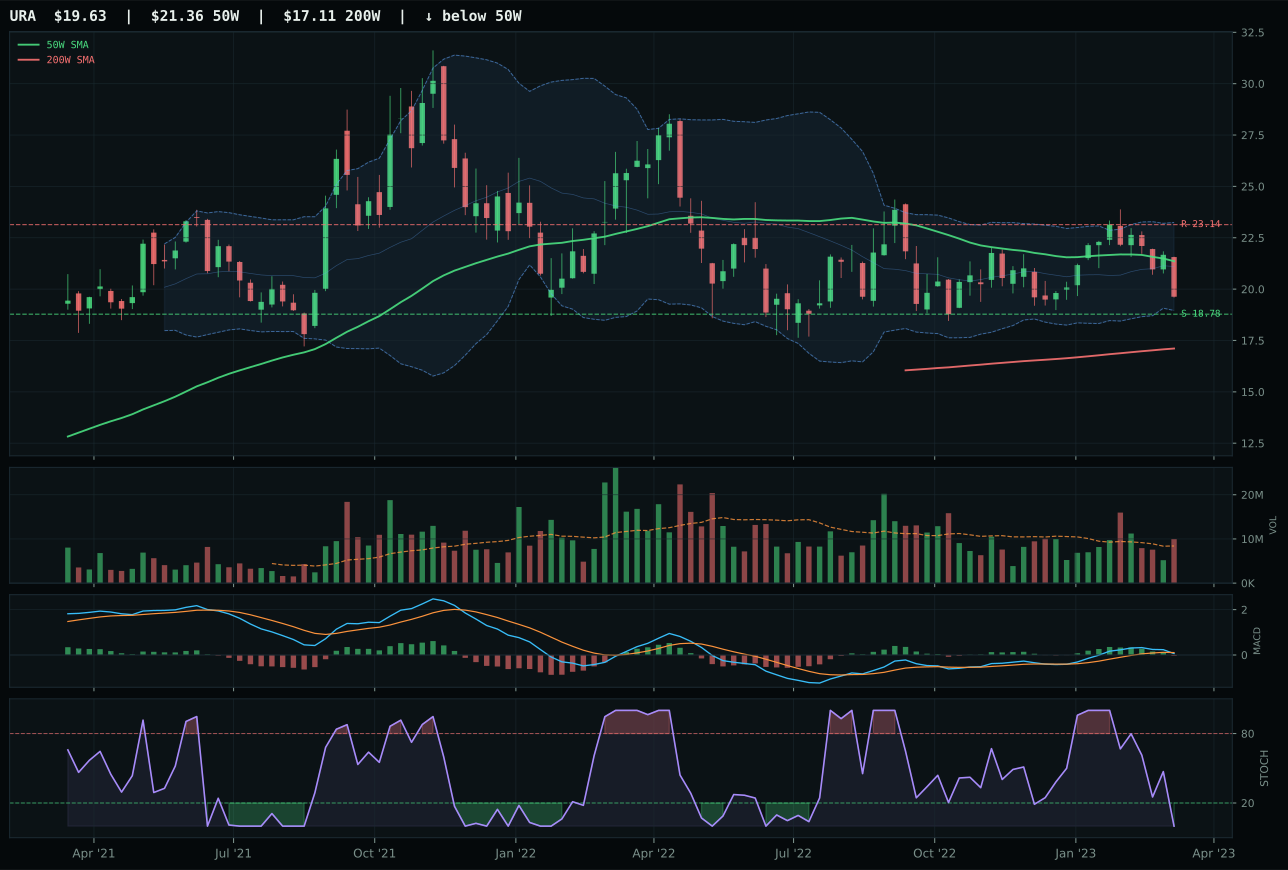
URA has a pullback into support profile with 2.0% 13-week relative strength versus SPY.
A failed hold above support would weaken the setup.
Actionable but governed by invalidation levels.
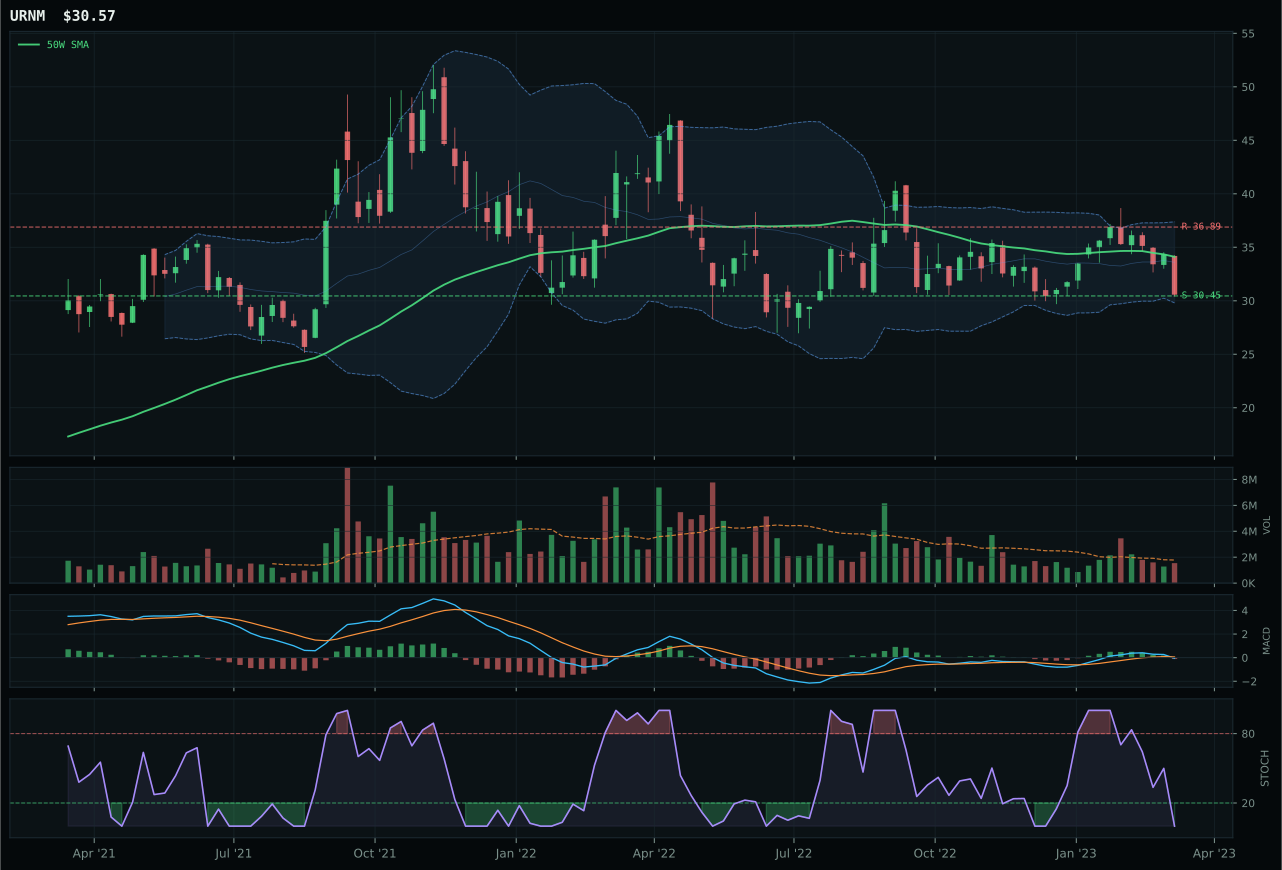
URNM has a pullback into support profile with 0.9% 13-week relative strength versus SPY.
A failed hold above support would weaken the setup.
Actionable but governed by invalidation levels.
URA captured Nuclear Energy over NLR primarily through superior risk-reward (90.0 vs 71.2) and better pullback-into-support structure (76.3 vs 74.6), though momentum is weak across the basket. URA sits 8.1% below the 50-week moving average near the 52-week low, with stochastic RSI deeply oversold at 0.00 and MACD bearish but beginning to stabilize. The downside support at 18.78 is only 4.5% below current price, creating a defined-invalidation floor, while resistance at 23.14 offers -15.2% upside room—a skewed asymmetry that rewards buyers who tolerate short-term pain. Above-average volume at 1.19x participates in the downside, a concerning sign, but the structure is clean enough to merit a 76.3 score. NLR's compression near the 50-week at -2.9% looks cleaner on paper but delivers weaker risk-reward and less upside optionality; the selloff in URA has been more violent but also more honest, leaving less room for further capitulation.
Nuclear Energy received 10% as the fourth-ranked category, justified by strong macro alignment despite weak technicals. Energy scarcity is active at +9, AI growth sponsorship at +5, and defensive rotation providing support, creating a 57.0 category-level macro fit. The macro thesis is straightforward: energy security concerns combined with AI power-consumption demands position nuclear as a long-duration structural play, and disinflation actually helps by reducing discount rates on future cash flows. URA's 39.6 category score reflects 36.6 technical evidence (weak) paired with 50.0 macro fit (neutral because no category-specific descriptor exists), a combination that merits allocation only for macro reasons. The -13.3% four-week return indicates capitulation selling, and when fear reaches extremes, pullbacks into support become entry opportunities if the thesis remains intact. Conviction here is macro-directional rather than technical, meaning the position is vulnerable to macro reversals (if energy scarcity eases or AI growth forecasts dim) and should be reassessed if support at 18.78 breaks.
Precious Metals — GLD
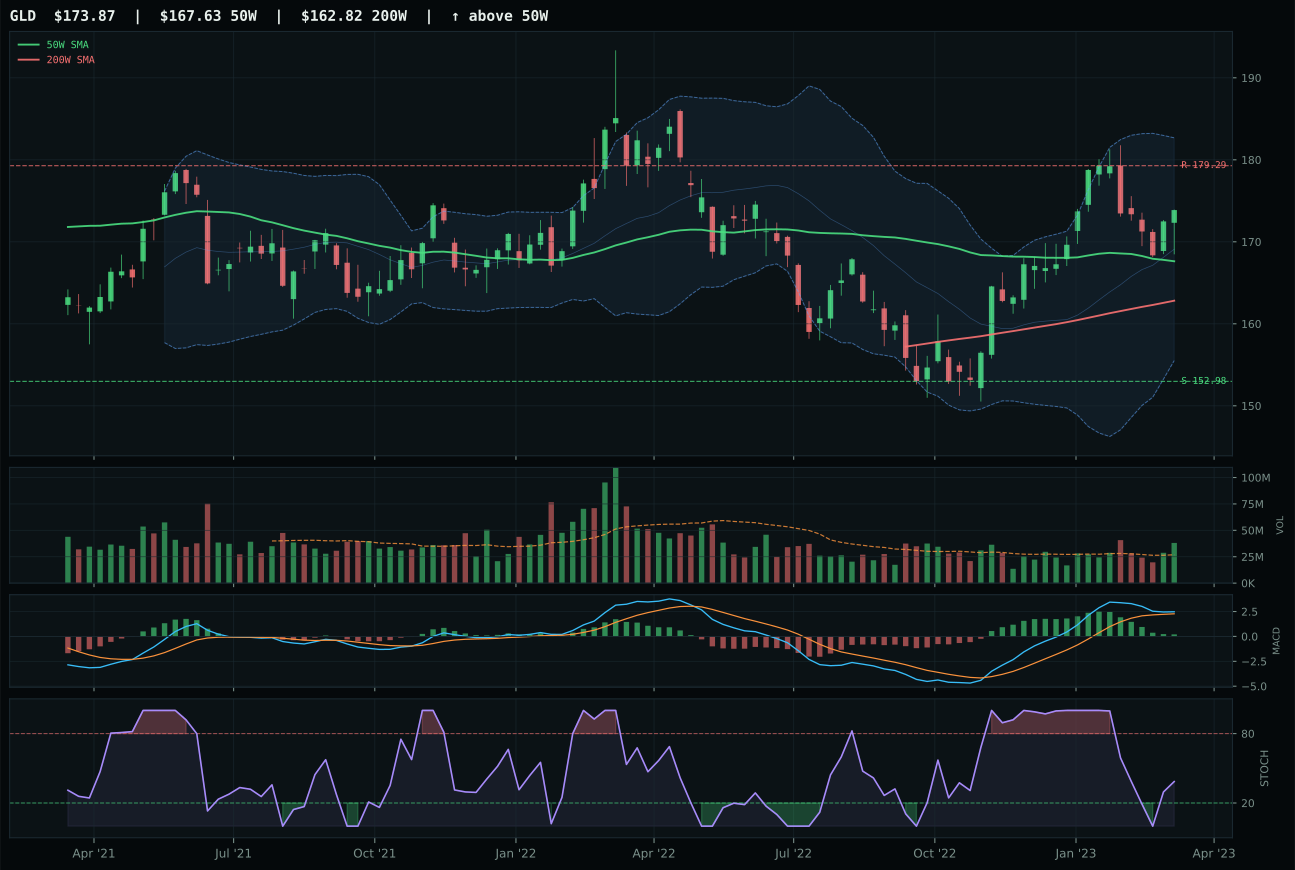
GLD has a neutral structure profile with 6.0% 13-week relative strength versus SPY.
A failed hold above support would weaken the setup.
Actionable but governed by invalidation levels.
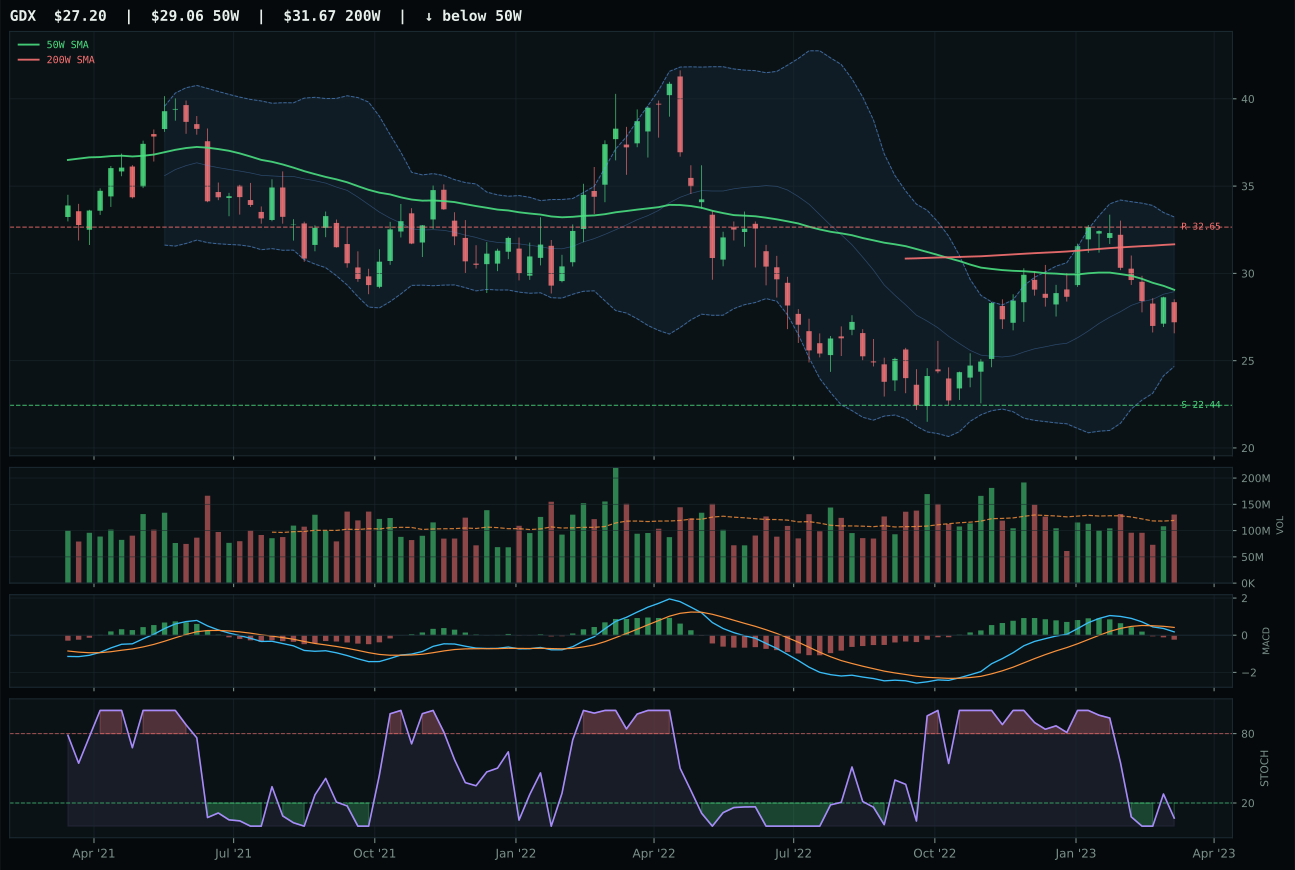
GDX has a neutral structure profile with -4.6% 13-week relative strength versus SPY.
Extension and support failure are the main tactical risks.
Tracked, but not top-2 eligible because: structurally broken.
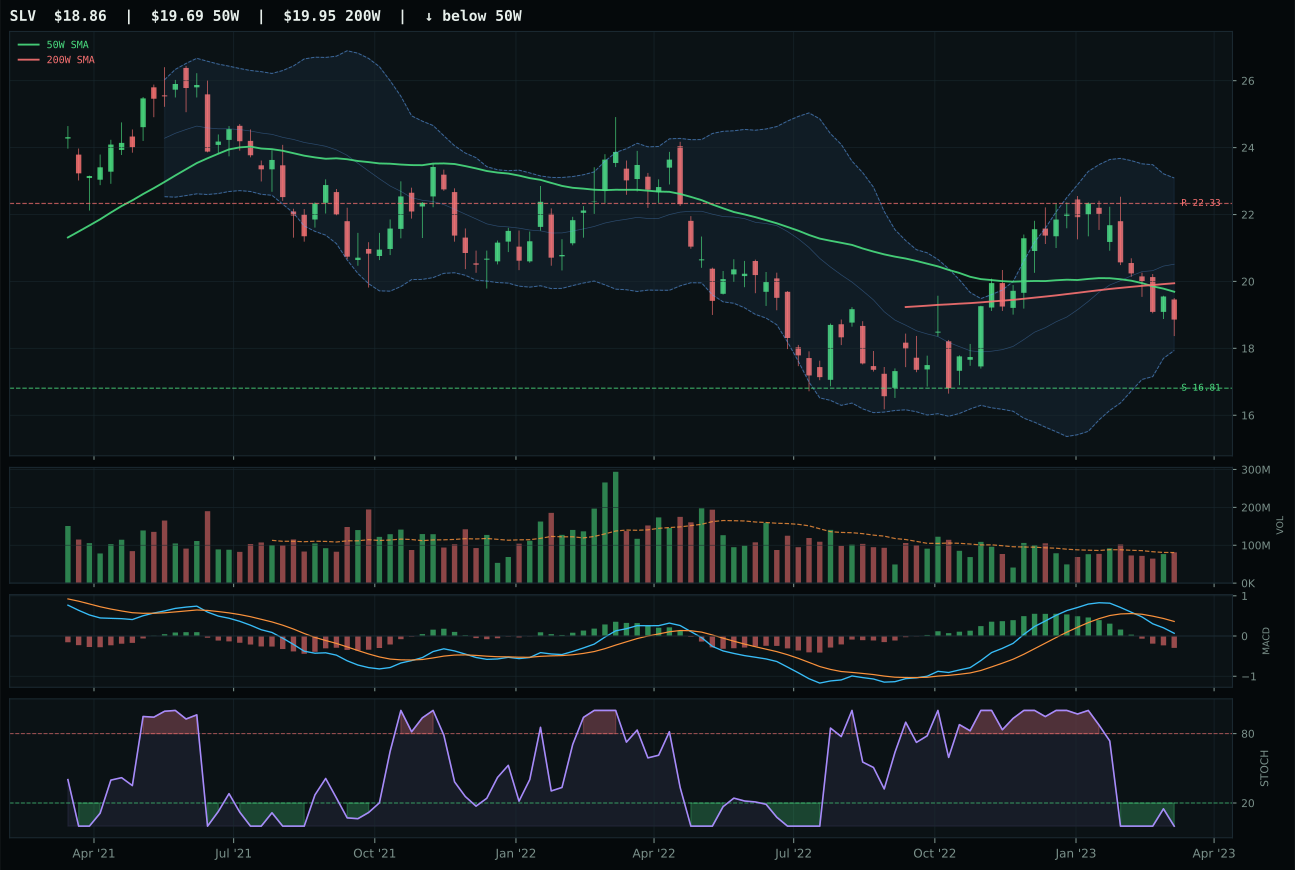
SLV has a neutral structure profile with -10.6% 13-week relative strength versus SPY.
Extension and support failure are the main tactical risks.
Tracked, but not top-2 eligible because: structurally broken.
GLD demolished the Precious Metals category with a 75.4-point gap over GDX, the largest single-category win-margin this week, reflecting a fundamental structural divergence between the clean monetary hedge (gold bullion) and leveraged mining exposure. GLD's 82-point composite score stems from exceptional trend (94.9), timing (93.0), and momentum confirmation (91.1), all powered by the 6.0% SPY-relative strength and 10.5% category-relative dominance. Price sits 3.7% above the 50-week moving average in the upper Fibonacci zone with above-average volume at 1.42x, meaning new accumulation is occurring at slightly elevated levels—a marker of conviction rather than panic buying near the low. MACD is bullish though flattening, stochastic RSI is rising in the mid-zone at 0.39, and the setup offers technical extension potential with defined support at 152.98. GDX's failure is catastrophic: MACD bearish, stochastic RSI oversold at 0.00, structure broken (33.2 score), and -4.6% SPY-relative weakness, marking it as a leveraged bet on mining cycle recovery that buyers have rejected.
Precious Metals earned 10% allocation as the highest-macro-fit category (81.0) despite its middle technical rank, a decision that reflects the portfolio's current regime interpretation. Monetary hedge bid is active at +14, the strongest single macro descriptor in the entire system, and disinflation at +8 and defensive rotation at +7 create a protective halo around gold. In a disinflation regime with liquidity stress present (-12 in AI, -10 in Tech, -4 here), gold serves as a real-asset hedge that generates positive returns when currency and credit conditions tighten. GLD's 84.8 technical evidence combined with 74.0 macro fit creates a robust setup that doesn't require momentum extremes; the 4.1% 13-week return is modest but steady, and the risk-reward of 49.0 reflects genuine protection (downside support at 13.7%) rather than downside trap. This allocation reflects institutional risk management—buying insurance through a high-quality carry asset—rather than speculative conviction, which is appropriate given the contested macro backdrop.
Industrial Metals — PICK
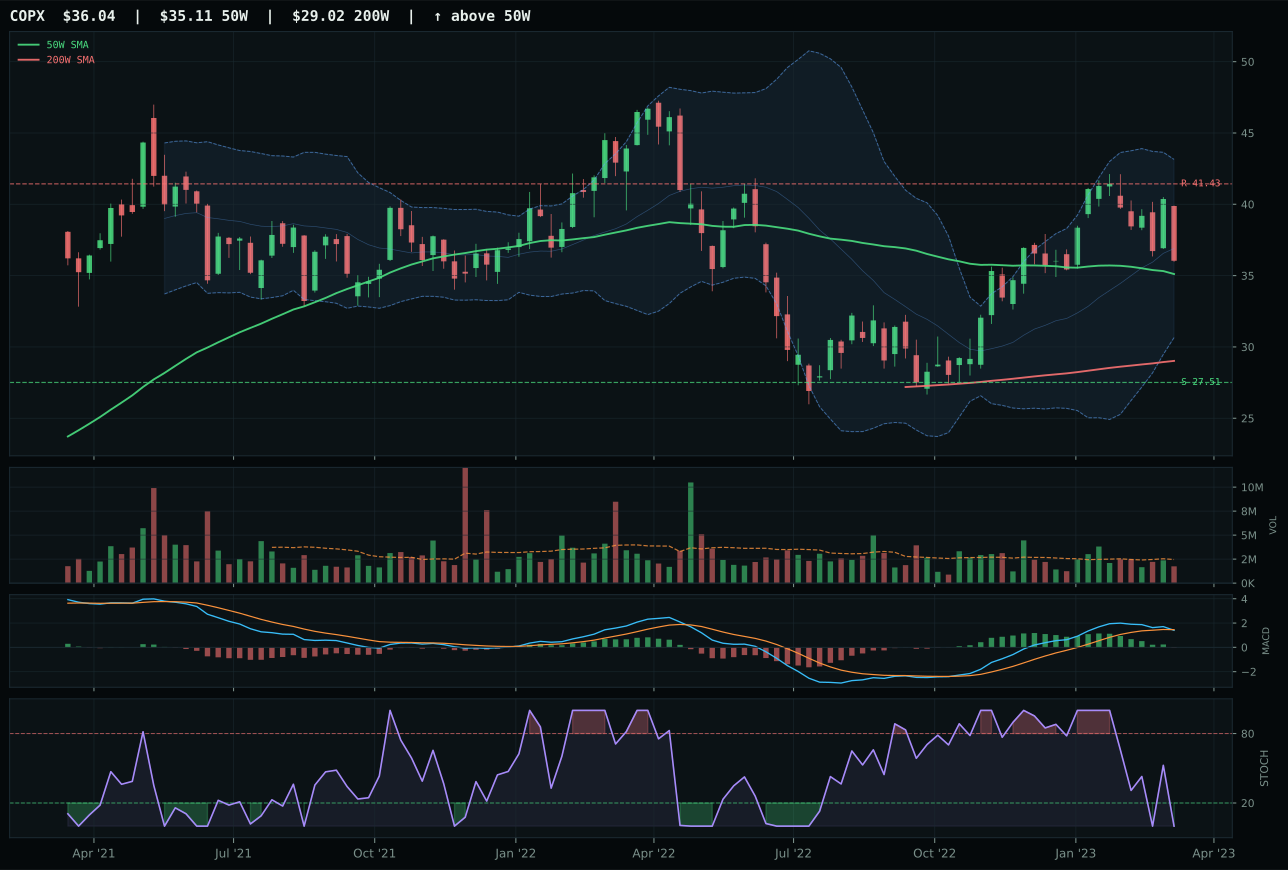
COPX has a compression near 50W profile with 0.5% 13-week relative strength versus SPY.
A failed hold above support would weaken the setup.
Actionable but governed by invalidation levels.
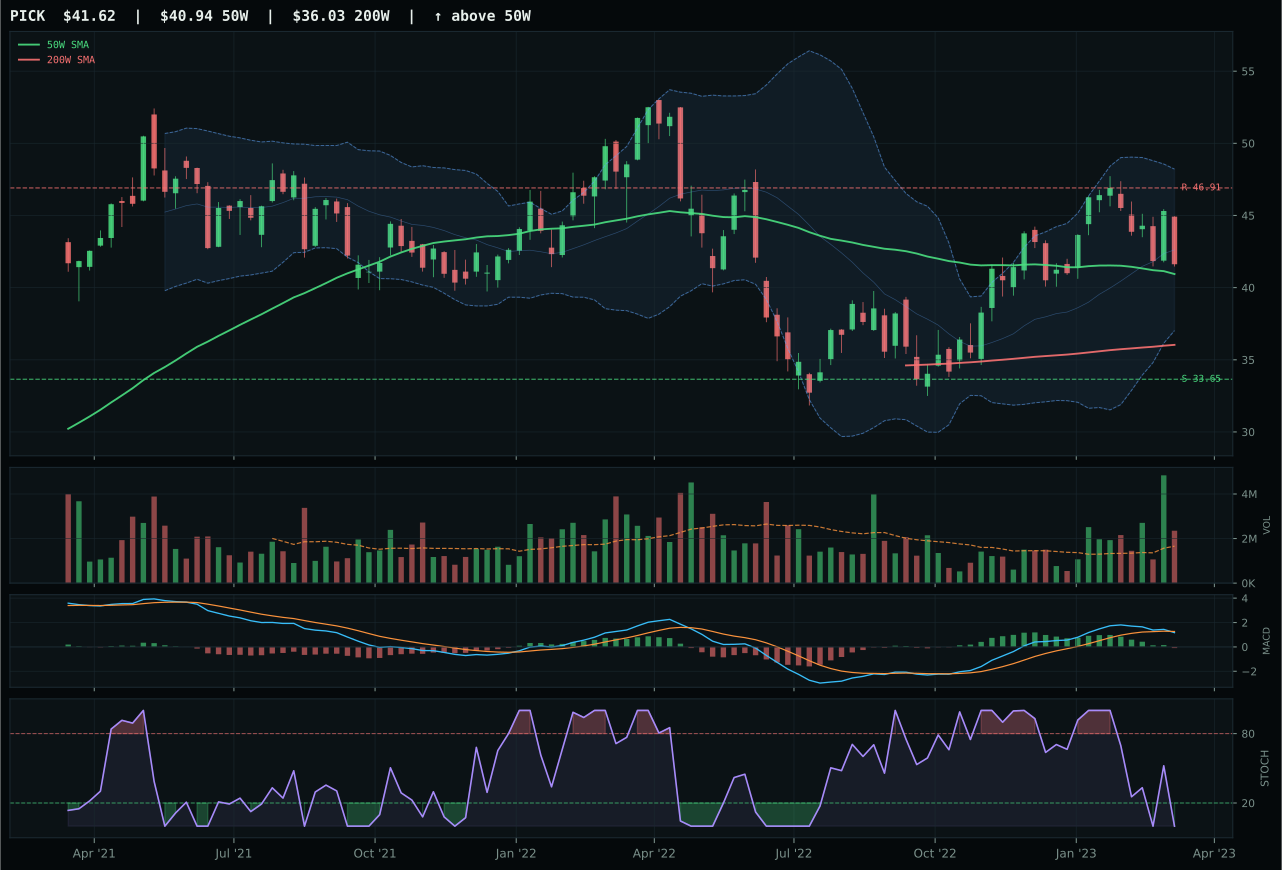
PICK has a compression near 50W profile with -1.7% 13-week relative strength versus SPY.
A failed hold above support would weaken the setup.
Actionable but governed by invalidation levels.
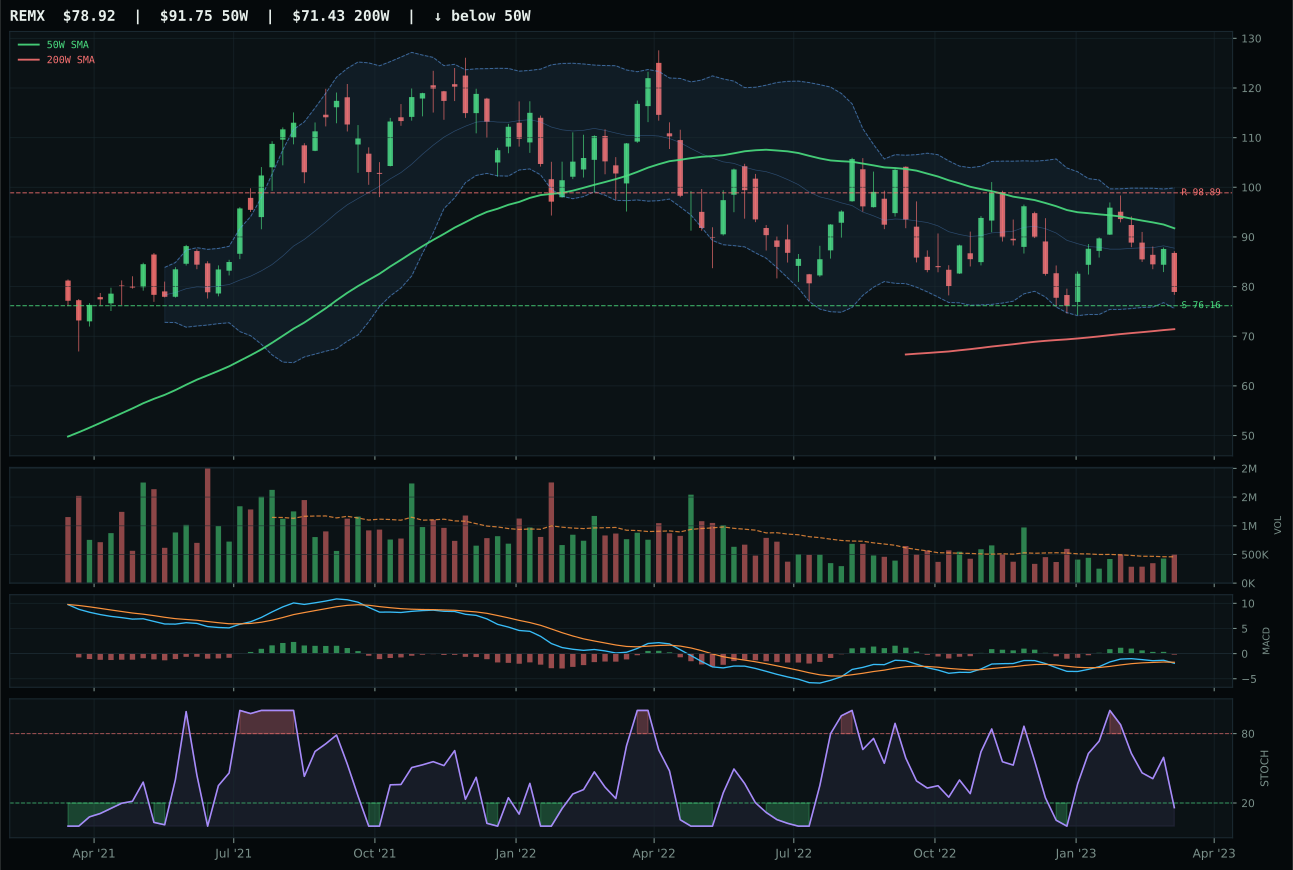
REMX has a pullback into support profile with -10.4% 13-week relative strength versus SPY.
A failed hold above support would weaken the setup.
Actionable but governed by invalidation levels.
PICK edged COPX by 7.5 points in a category where both representatives are damaged goods fighting over scraps. PICK's composite 68 versus COPX's 60 hinges on COPX's thin volume participation versus PICK's above-average participation, and marginally superior structure (74.9 vs 69.2), not on any fundamental strength differential. Both carriers sit compressed near the 50-week moving average with oversold stochastic RSI, both carry bearish MACD, and both sport negative 13-week momentum (PICK at -3.6%, COPX at -1.4%). PICK's timing score is perfect at 100 because distance to the 50-week is ideal (1.7%), placing it in the Fibonacci decision zone, but this is a neutral setup that offers a coiled spring for either direction. The 61.6 risk-reward score reflects 23.7% downside to support versus -11.3% upside to resistance, a skewed risk profile that tells the full story: this category is in a corrective phase, and winning means being the least broken of broken things.
Industrial Metals received 10% as a minimum-allocation category, justified only by timing geometry and the need for portfolio completeness. Category-level macro fit is 42.0, weighed down by liquidity stress at -8, with no positive descriptors active (risk appetite, energy scarcity, monetary hedge all neutral or absent). The 37.6 technical evidence for PICK combined with the neutral 50.0 macro fit produces the lowest reasoning-layer score for a positioned category, yet the portfolio holds it because position sizing is equal across the non-top-2 slots. PICK's -3.6% 13-week return and compression setup suggest mean-reversion potential if buyers defend the 50-week, but there is no conviction narrative attached. This allocation is contingent: if industrial demand surprises to the downside or liquidity stress intensifies further, PICK should be one of the first cuts; conversely, if cyclical recovery emerges and risk appetite rebounds, the oversold setup and clean compression provide edge. For now, it is core allocation secured by technical setup, not macro conviction.
Agriculture & Livestock — MOO
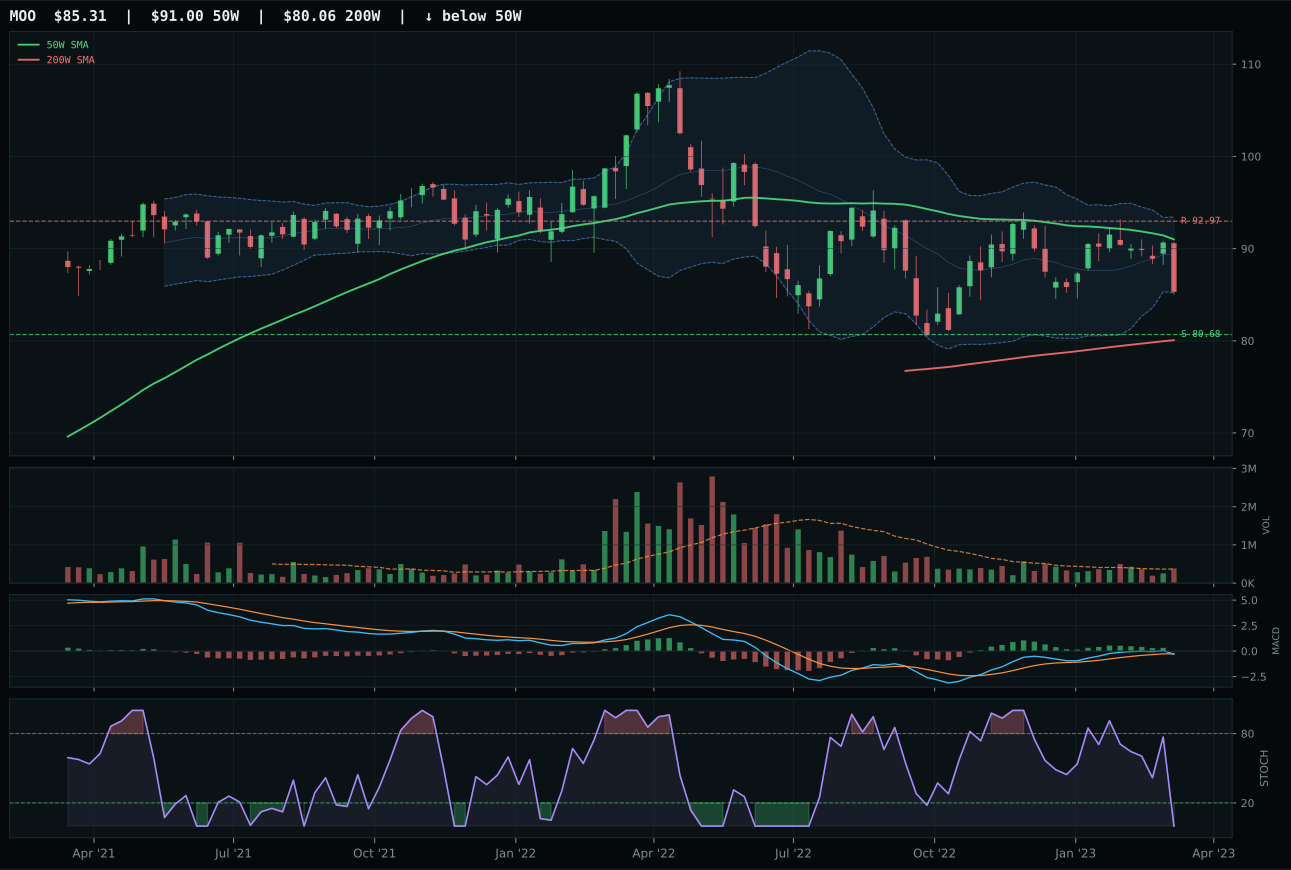
MOO has a neutral structure profile with -3.3% 13-week relative strength versus SPY.
A failed hold above support would weaken the setup.
Actionable but governed by invalidation levels.
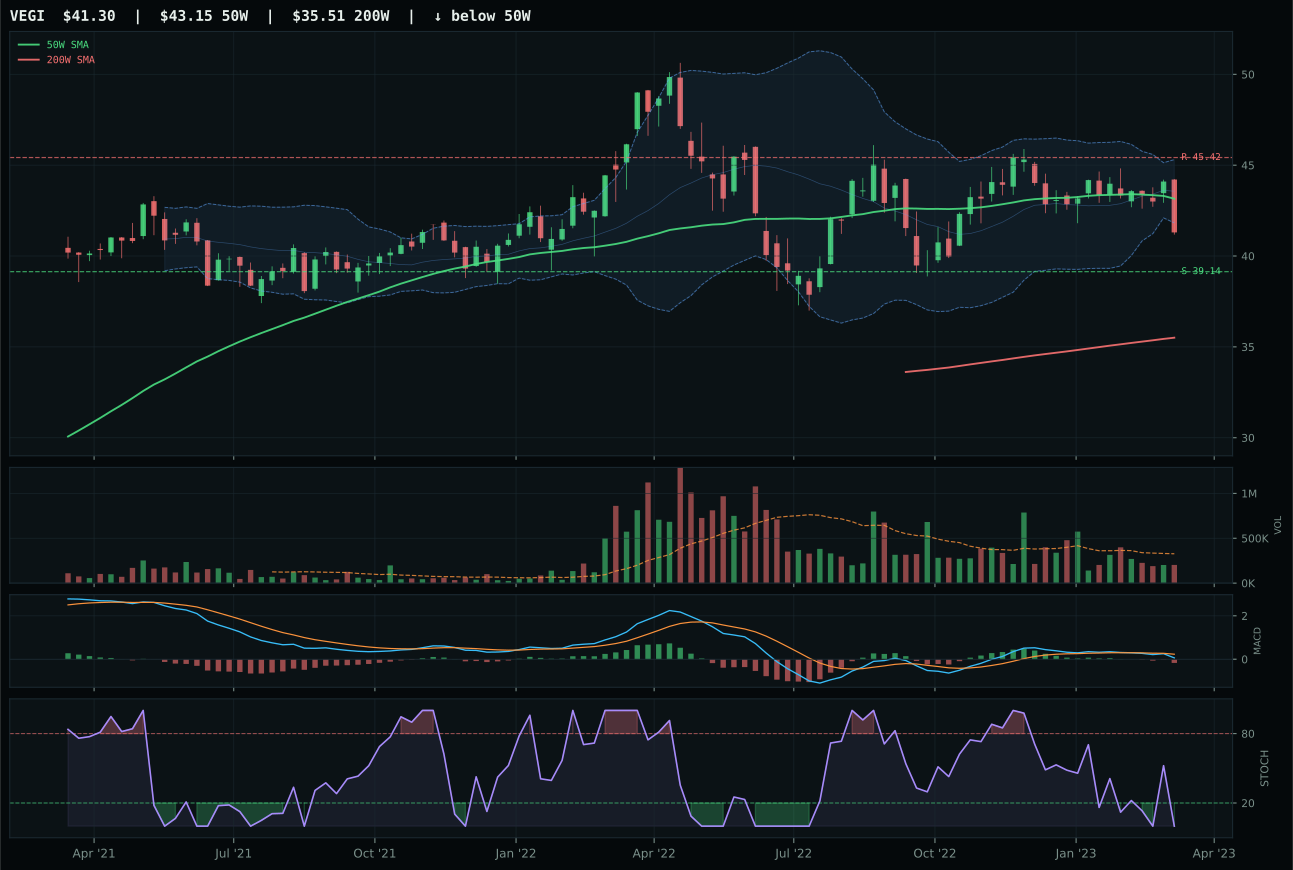
VEGI has a neutral structure profile with -4.3% 13-week relative strength versus SPY.
A failed hold above support would weaken the setup.
Actionable but governed by invalidation levels.
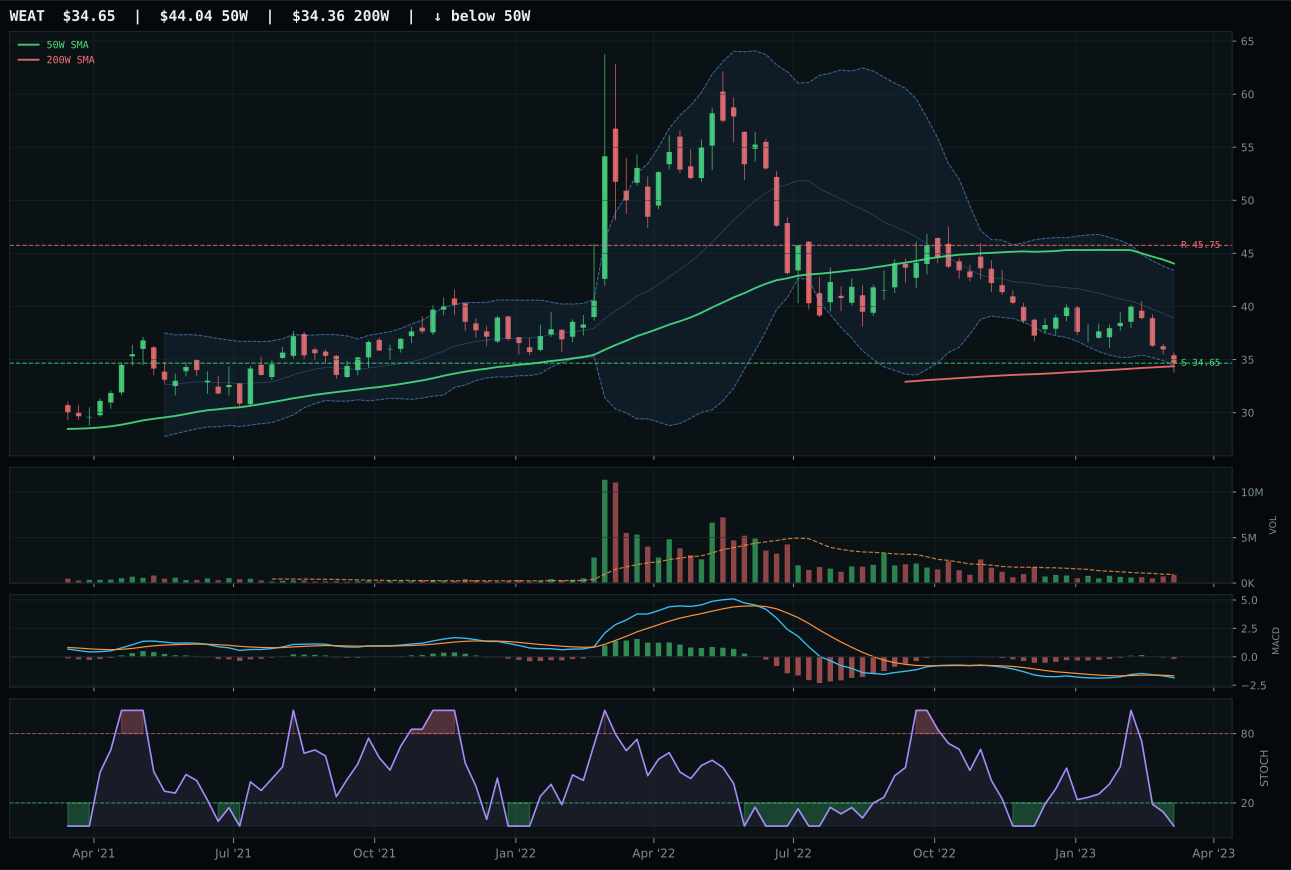
WEAT has a pullback into support profile with -5.1% 13-week relative strength versus SPY.
A failed hold above support would weaken the setup.
Actionable but governed by invalidation levels.
MOO won Agriculture by a 3.2-point margin over VEGI, but the victory carries little conviction: both carriers scored 30.5 and 30.3 in technical evidence, a statistical dead heat that reveals category-wide distress rather than champion selectivity. MOO's 1.0% category-relative strength barely edges VEGI's 0.0%, and the real decision factor was volume participation (neutral at 1.04x vs thin at VEGI), a thin reed of differentiation. Price sits 6.3% below the 50-week moving average, MACD is bearish and weakening, and stochastic RSI is oversold at 0.00, painting a technical landscape of capitulation. The risk-reward of 70.8 is the highest in the basket, meaning downside to support at 5.7% is tight, but that reflects a near-term floor rather than conviction in upside. MOO's -5.2% 13-week return and -3.3% SPY-relative weakness demonstrate that this entire category is underwater, and winning the category vote is akin to being voted best student in a failing school.
Agriculture received 10% as a fill-level allocation despite its 5.2 final score, the lowest among all eight portfolio positions. Disinflation actively hurts this exposure at -6, disinflation pressure at -8, and liquidity stress at -4, creating a macro headwind that no technical setup can overcome. The category-level macro fit is just 32.0, reflecting structural headwinds in a disinflationary environment where commodity prices compress and agricultural input costs remain sticky. No descriptor works in favor; defensive rotation at zero, risk appetite at neutral, energy scarcity at zero—all the themes that are helping precious metals and utilities are absent here. MOO's -1.8% composite 13-week return and the entire basket's negative momentum confirmation mean that this is a portfolio anchor, held only for diversification and as a potential beneficiary if disinflation reverses or if agricultural supply shocks emerge. Liquidating this to the minimum 10% should be priority one if macro conditions shift toward inflation or risk-on sentiment.
Emerging Markets — INDA
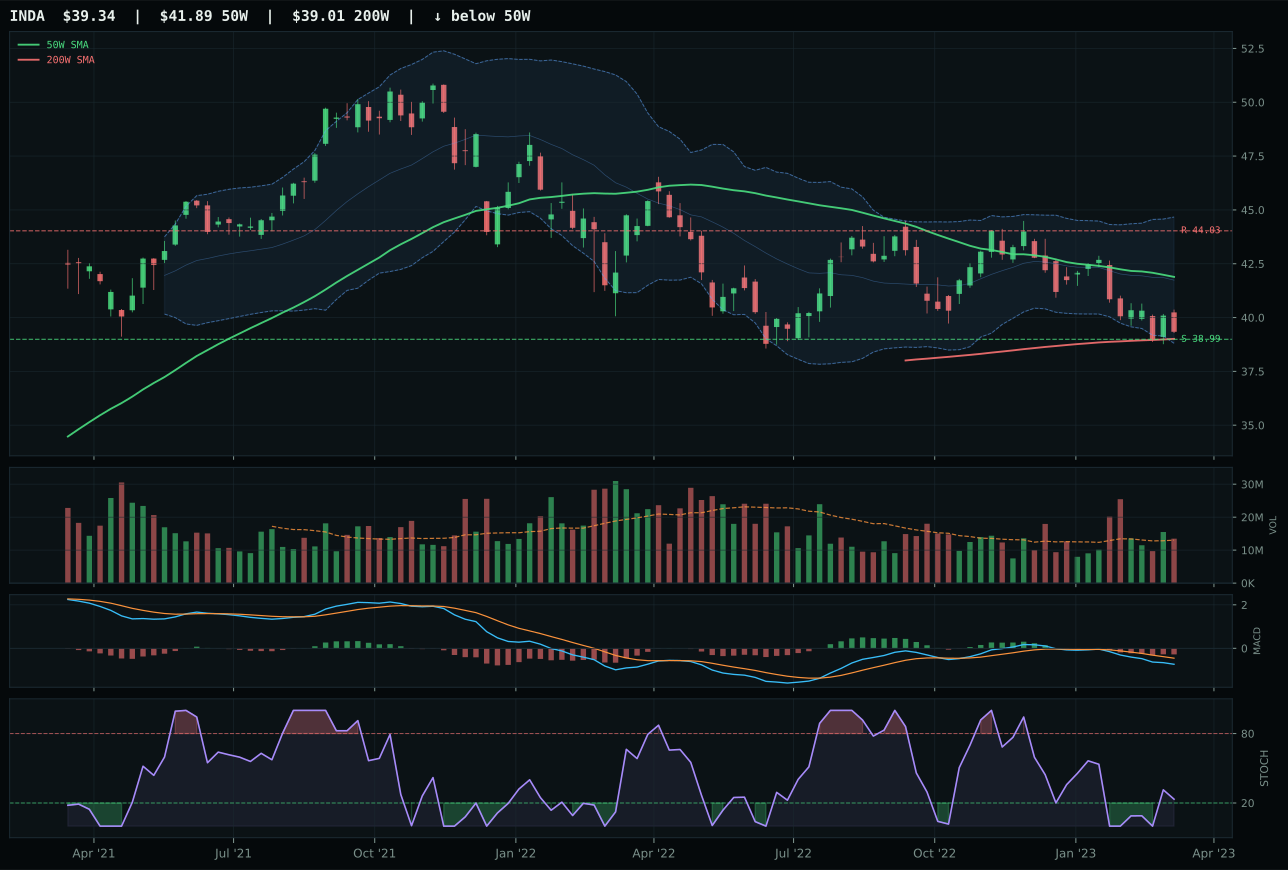
INDA has a pullback into support profile with -6.2% 13-week relative strength versus SPY.
A failed hold above support would weaken the setup.
Actionable but governed by invalidation levels.
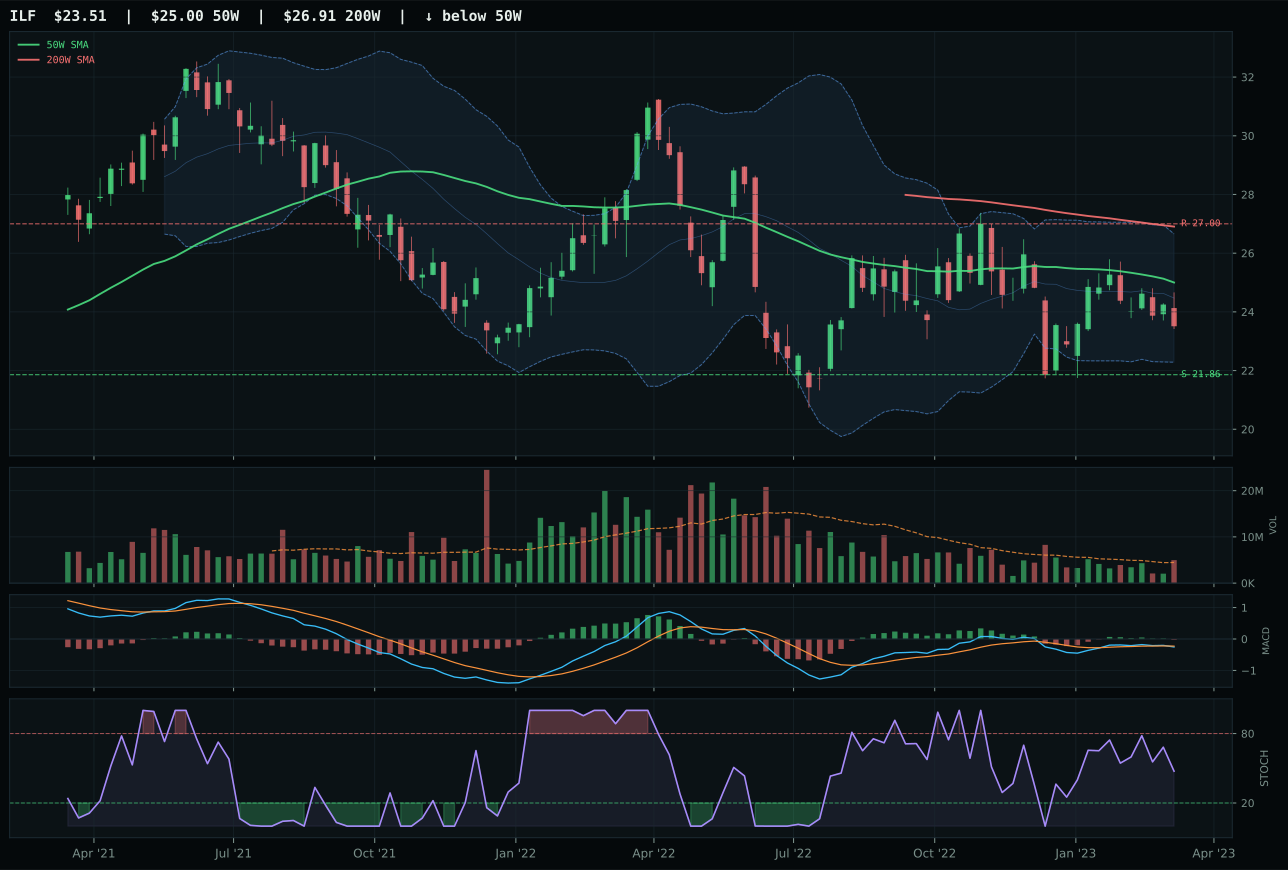
ILF has a neutral structure profile with -3.4% 13-week relative strength versus SPY.
Extension and support failure are the main tactical risks.
Tracked, but not top-2 eligible because: structurally broken.
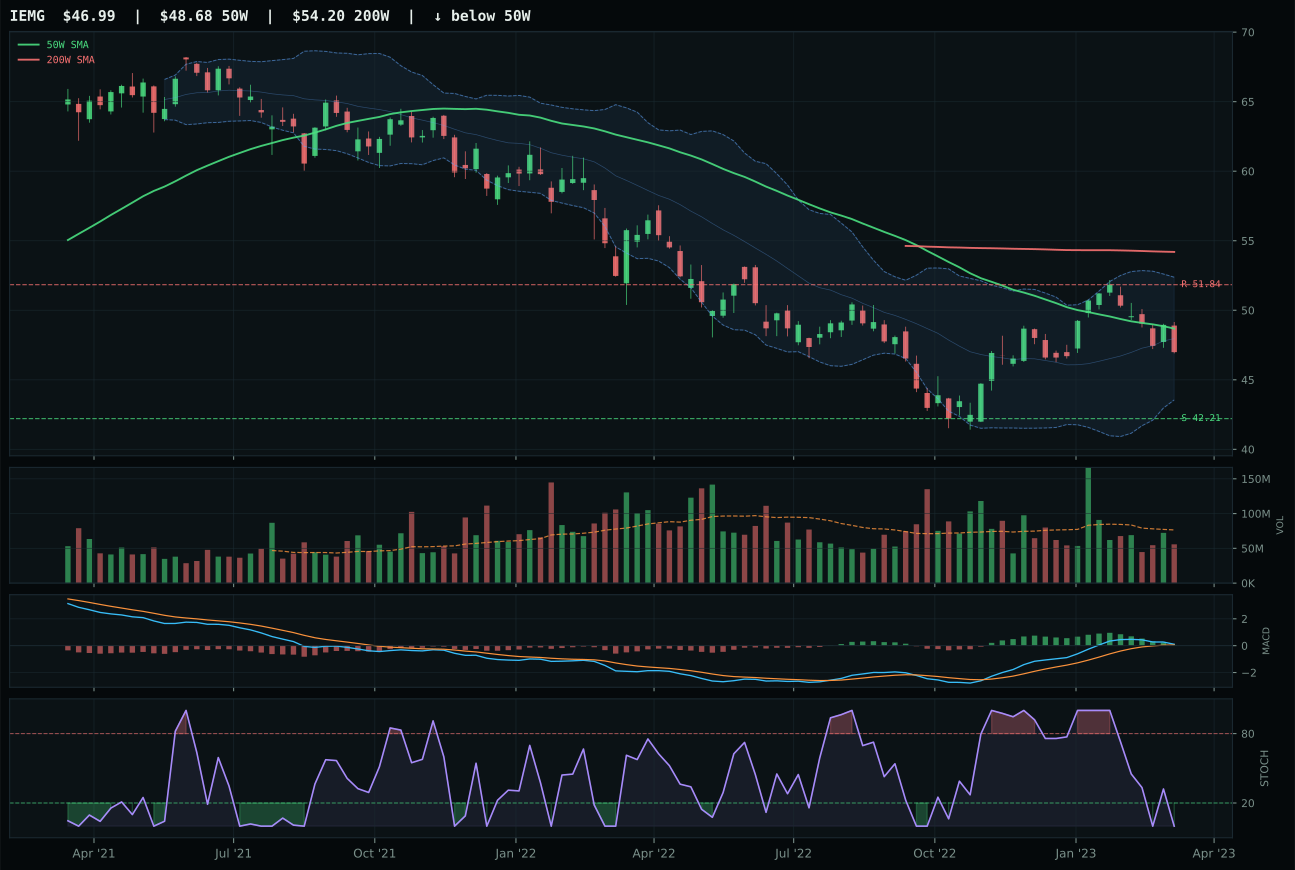
IEMG has a neutral structure profile with -0.3% 13-week relative strength versus SPY.
Extension and support failure are the main tactical risks.
Tracked, but not top-2 eligible because: structurally broken.
INDA claimed Emerging Markets on structure and timing advantage despite IEMG's 42.0 technical evidence versus INDA's 10.0, revealing the power of positioning: INDA sits in a pullback-into-support setup at 38.99, placing it 6.1% below the 50-week with defined downside protection, while IEMG is ambiguously positioned in neutral structure with less tactical clarity. INDA's timing score of 88 reflects the optimal compression zone, stochastic RSI rising from oversold (0.23), and Fibonacci support in the deep value zone—a combination suggesting that panic has been wrung out and bottom-picking is becoming plausible. The risk-reward of 90.0 offers -10.7% upside potential against just 0.9% downside to support, the most asymmetric risk profile in the entire portfolio. Against this, IEMG's -0.3% SPY-relative strength and INDA's -6.2% relative weakness reveal that emerging markets are broadly rejected, making this a contrarian bet rather than a conviction allocation. Momentum confirmation of 9.7 is barely alive, reflecting the -8.0% 13-week return, so INDA wins by offering the cleanest entry geometry, not by momentum.
Emerging Markets earned 0% allocation this week because liquidity stress (-10), broad market bear (-9), and the passive risk-on environment all work against emerging market exposure despite risk-appetite-positive being nominally active (+8). The category's 39% macro fit and 5.2 final score represent the portfolio's worst opportunity: INDA's pullback-into-support and 90-point risk-reward sound attractive in isolation, but the 10% technical evidence tells the real story—this is a bounce candidate in a multi-month breakdown, not a genuine reversal setup. Emerging market correlations to US equity risk have risen sharply in this regime, meaning the portfolio gets concentration rather than diversification from this exposure, and INDA's thin volume (1.03x) signals that specialized emerging-market capital hasn't stepped in to support India despite the tactical setup. For Emerging Markets to re-enter allocation, you need either emerging currency stabilization (reducing capital flow concerns) or INDA to show volume-based accumulation while the stochastic RSI rises through mid-zone—neither condition exists. This is a zero-allocation decision that reflects macro regime alignment rather than chart weakness; if risk appetite deteriorates further, emerging markets might trap short-sellers, but that's a mean-reversion trade, not a strategic portfolio position.
Traditional Energy — XLE
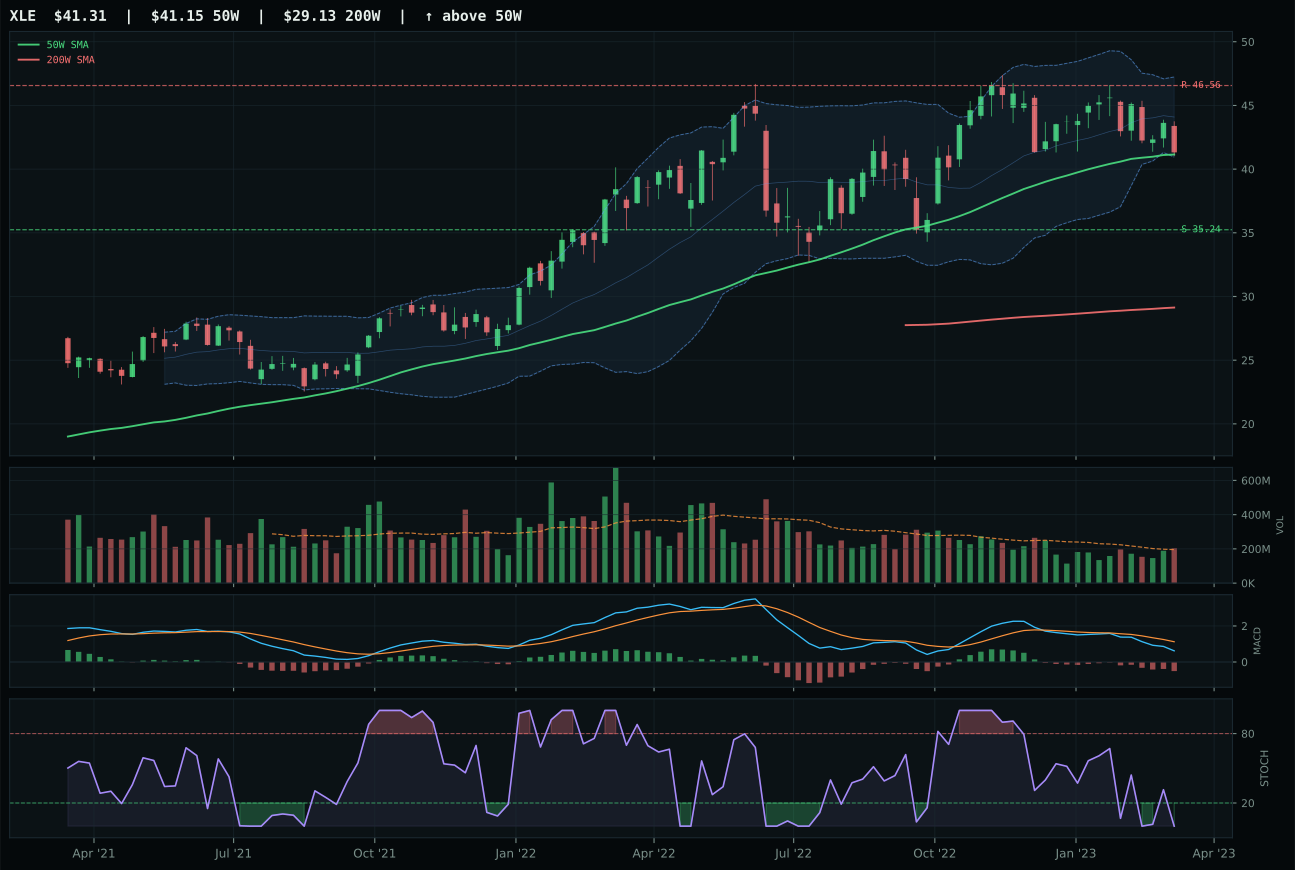
XLE has a compression near 50W profile with 1.8% 13-week relative strength versus SPY.
A failed hold above support would weaken the setup.
Actionable but governed by invalidation levels.
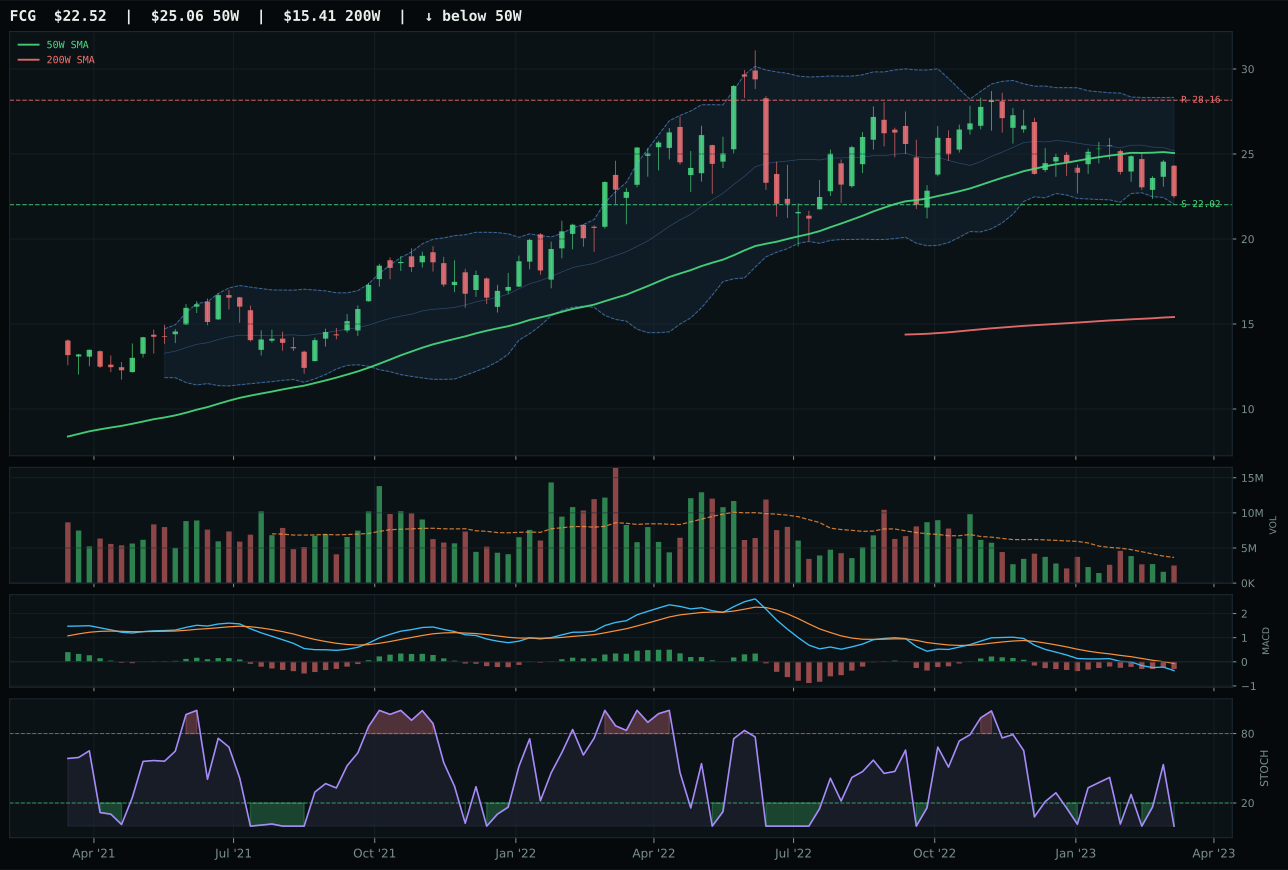
FCG has a pullback into support profile with -3.6% 13-week relative strength versus SPY.
A failed hold above support would weaken the setup.
Actionable but governed by invalidation levels.
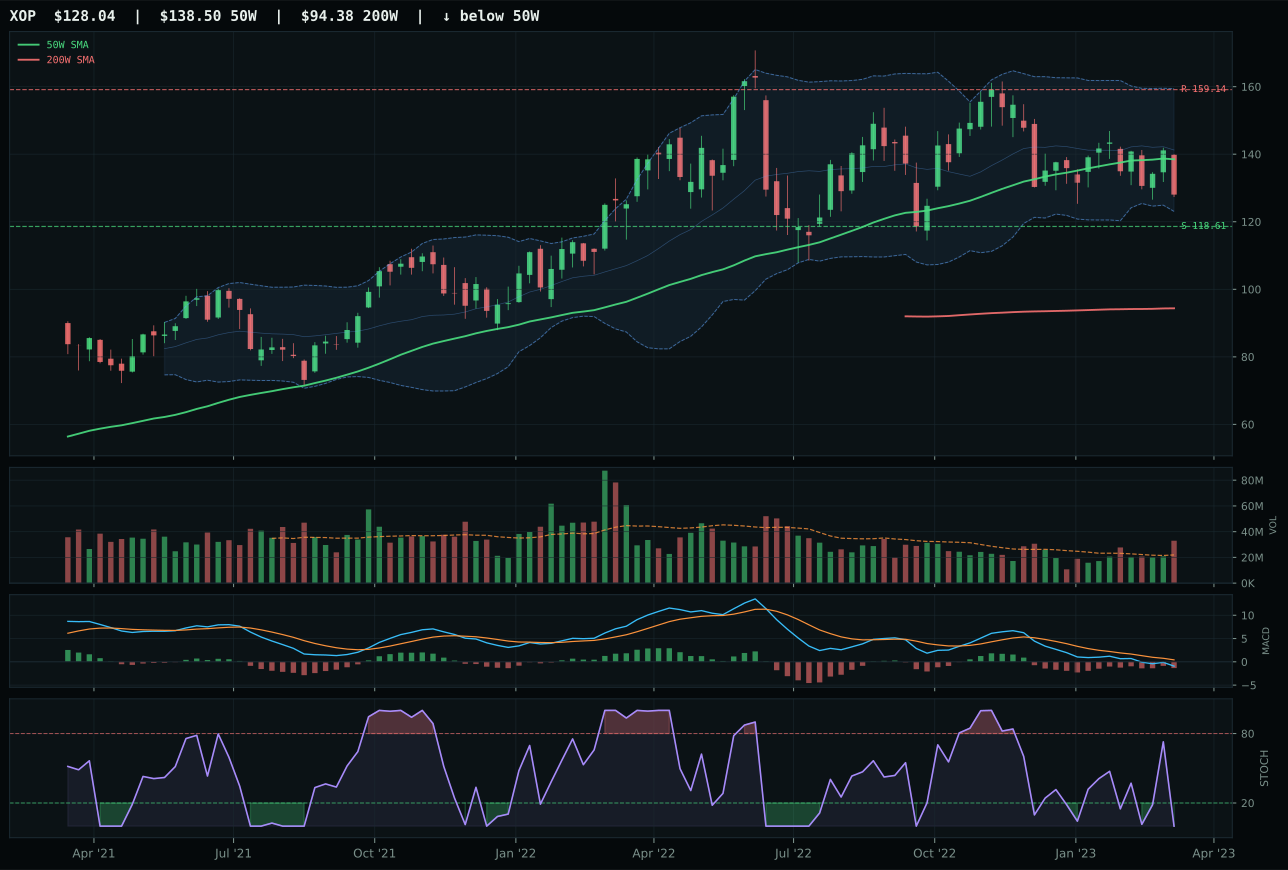
XOP has a neutral structure profile with 0.1% 13-week relative strength versus SPY.
A failed hold above support would weaken the setup.
Actionable but governed by invalidation levels.
XLE won Traditional Energy with a 43.3-point demolition of FCG, the second-largest category margin this week, but the victory is pyrrhic because the entire category scored just 4.0. XLE's technical evidence of 51.1 comes from the clean compression near the 50-week (0.4% distance) with perfect timing (100.0), but the momentum confirmation is anemic at 26.4, reflecting the -0.1% 13-week return and -8.4% four-week sell-off. Price action is compression, not accumulation; MACD is bearish and weakening, stochastic RSI is oversold, and volume is neutral at 1.05x, meaning buyers have not yet returned with conviction. Disinflation pressure is crushing energy at -10, and while energy scarcity is active at +14, this macro positive is more than offset by the -10 disinflation headwind, a net -10 macro burden that no technical setup can overcome. FCG fails on timing (67 vs 100), structure (68.6 vs 76.9), and worse timing to entry (pullback into support versus compression), but the real issue is that the entire energy complex is fighting macro conditions.
Traditional Energy earned 0% allocation this week because the disinflation macro regime actively hurts oil and gas exposure (-10) while disinflation pressure compounds the headwinds (-10), even as energy scarcity tries to provide a +16 offset that proves insufficient. The category's 39% macro fit and 4.0 final score reflect a fundamental regime mismatch: falling inflation removes the psychological bid for energy hedges while reducing demand expectations, and while energy scarcity as a descriptor is active, it cannot overcome the gravitational pull of deflating energy prices and weakening corporate demand. XLE's 51.1 technical evidence fails to inspire confidence because the momentum confirmation (26.4) and volume-price sponsorship (43.8) are both weak—the setup reads as a technical coil that could snap either direction, not a high-conviction accumulation zone. For Traditional Energy to re-enter the portfolio allocation, you need either disinflation expectations to reverse (creating inflation fears again) or oil price action to produce genuine volume-based acceleration above the $46.56 resistance level paired with SPY outperformance. Neither condition is present, making this a zero-allocation decision despite XLE's technical window-dressing.