
2023-03-03
Informational purposes only. The content in this report, including allocations, analysis, and commentary, is provided solely for informational and educational purposes. It does not constitute financial advice, investment advice, trading advice, or any other type of advice. Past performance does not guarantee future results. Always conduct your own research and consult a qualified financial professional before making investment decisions.
Weekly Allocation
| Ticker | Category | Weight | Role |
|---|---|---|---|
| COPX | Industrial Metals | 20% | Top-2 (20%) |
| CIBR | Technology | 20% | Top-2 (20%) |
| XLU | Utilities & Infrastructure | 10% | Tier-2 (10%) |
| ITA | Defense & Aerospace | 10% | Tier-2 (10%) |
| BOTZ | AI | 10% | Tier-2 (10%) |
| URA | Nuclear Energy | 10% | Tier-2 (10%) |
| GLD | Precious Metals | 10% | Tier-2 (10%) |
| MOO | Agriculture & Livestock | 10% | Tier-2 (10%) |
Trade Instructions — Monday Open
Sell the tranche from 2023-02-03 (completing its 4-week hold). Buy the new tranche. Instructions show net portfolio changes — same-asset positions cancel, weight changes show the delta.
| Action | Ticker | Instruction |
|---|---|---|
| SELL | IGV | Sell entire IGV position (5.00% of portfolio) |
| SELL | SMH | Sell 29% of SMH position (reduce 17.50% → 12.50%) |
| SELL | PAVE | Sell 25% of PAVE position (reduce 10.00% → 7.50%) |
| SELL | XAR | Sell 50% of XAR position (reduce 5.00% → 2.50%) |
| SELL | URNM | Sell 50% of URNM position (reduce 5.00% → 2.50%) |
| SELL | VEGI | Sell entire VEGI position (2.50% of portfolio) |
| BUY | COPX | Buy COPX — 12.50% of freed cash (adds 2.50% to portfolio) |
| BUY | CIBR | Buy CIBR — 25.00% of freed cash (adds 5.00% to portfolio) |
| BUY | ITA | Buy ITA — 12.50% of freed cash (adds 2.50% to portfolio) |
| BUY | URA | Buy URA — 12.50% of freed cash (adds 2.50% to portfolio) |
| BUY | XLU | Buy XLU — 12.50% of freed cash (adds 2.50% to portfolio) |
| BUY | BOTZ | Buy BOTZ — 12.50% of freed cash (adds 2.50% to portfolio) |
| BUY | MOO | Buy MOO — 12.50% of freed cash (adds 2.50% to portfolio) |
Current Portfolio After Trade
Combined holdings across all 4 active tranches. Each tranche is 25% of the portfolio.
| Ticker | % of Portfolio | Weight Bar |
|---|---|---|
| COPX | 15.00% | |
| CIBR | 15.00% | |
| SMH | 12.50% | |
| ITA | 10.00% | |
| GLD | 7.50% | |
| PAVE | 7.50% | |
| URA | 7.50% | |
| WEAT | 5.00% | |
| XAR | 2.50% | |
| URNM | 2.50% | |
| SLV | 2.50% | |
| XLK | 2.50% | |
| XLE | 2.50% | |
| XLU | 2.50% | |
| BOTZ | 2.50% | |
| MOO | 2.50% |
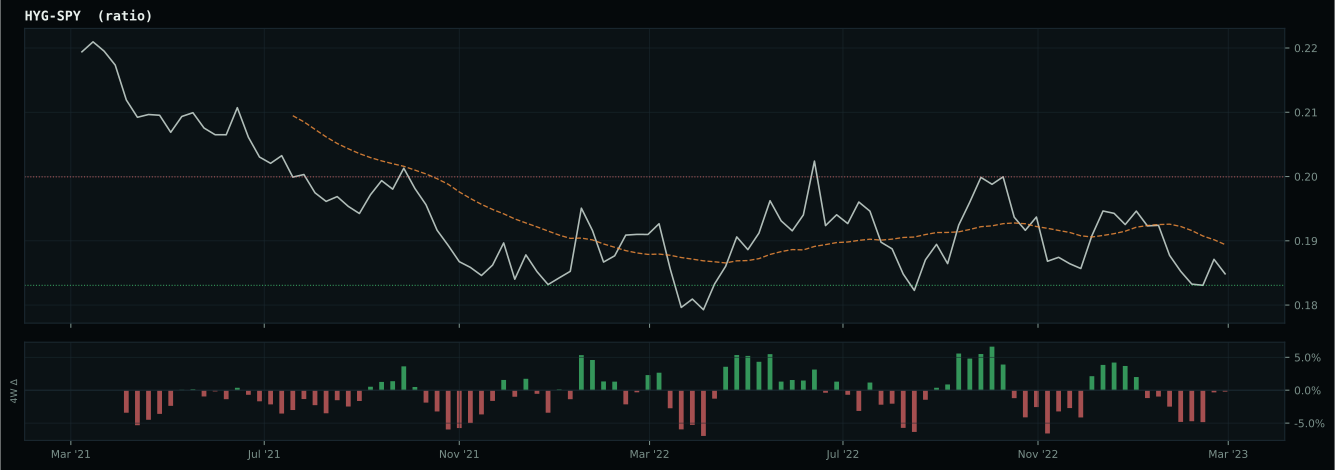
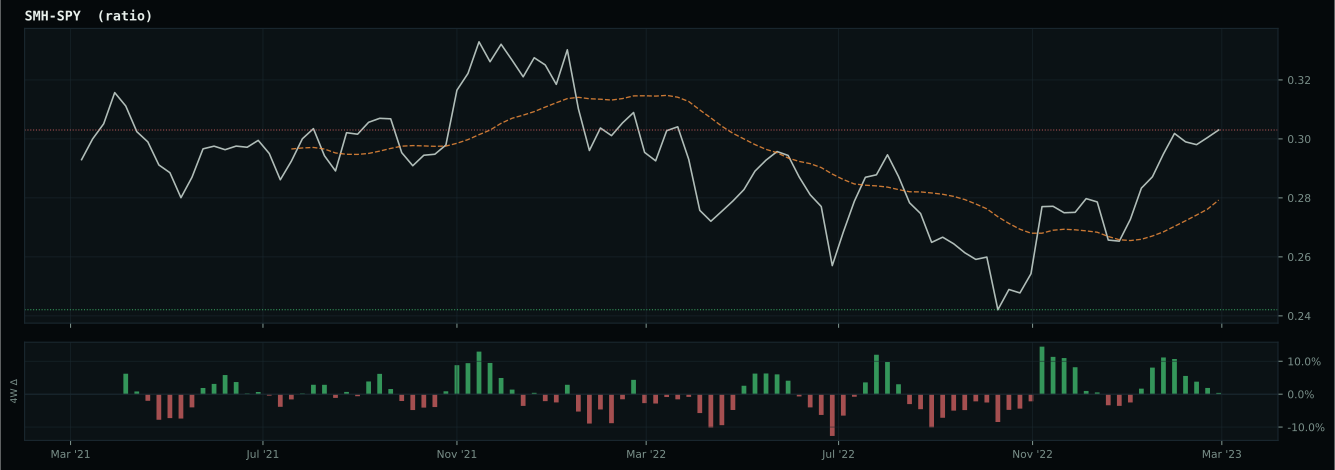
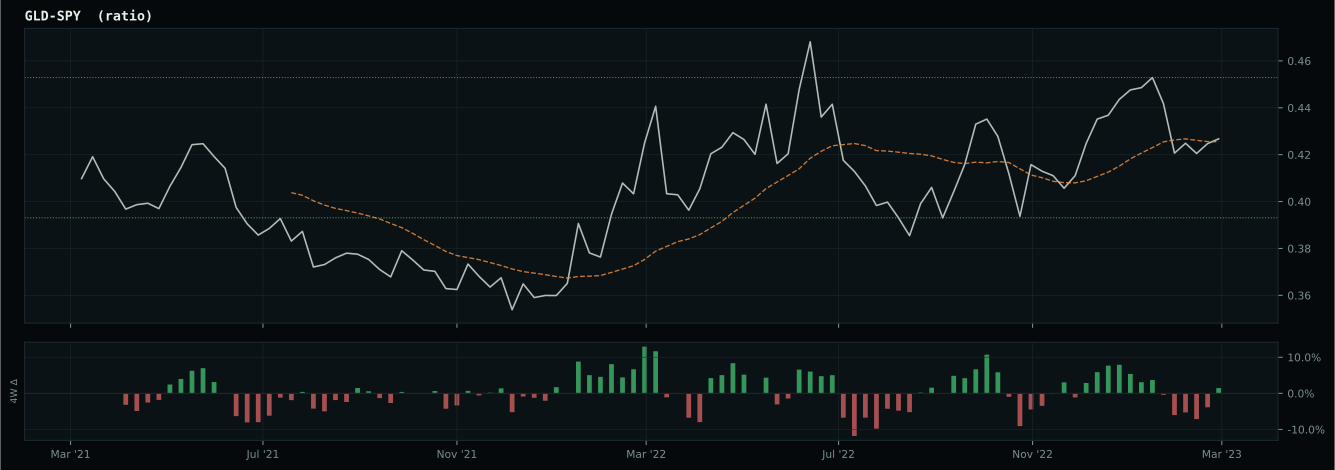
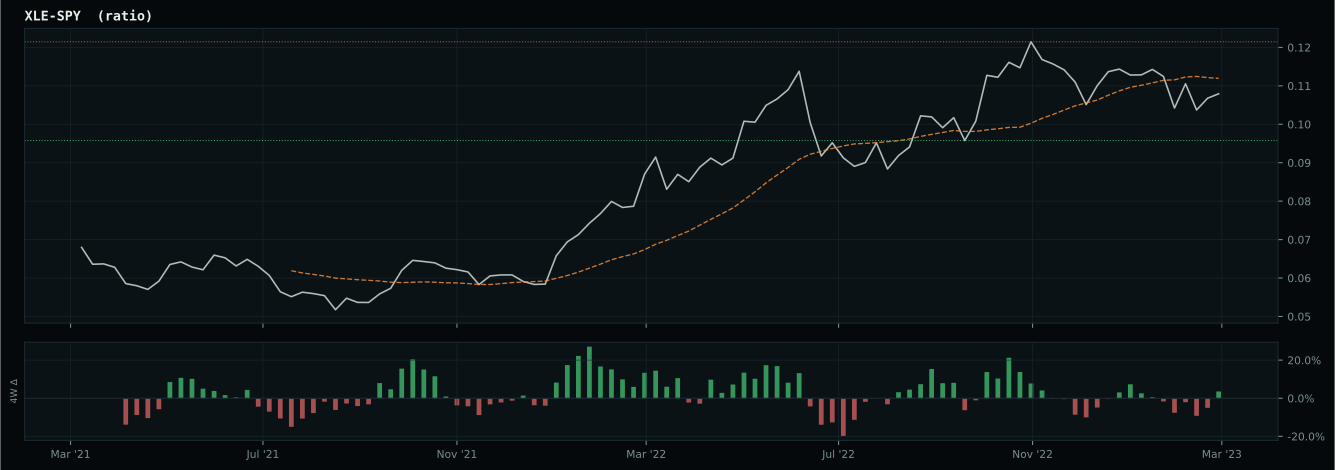
Macro Regime — Disinflation
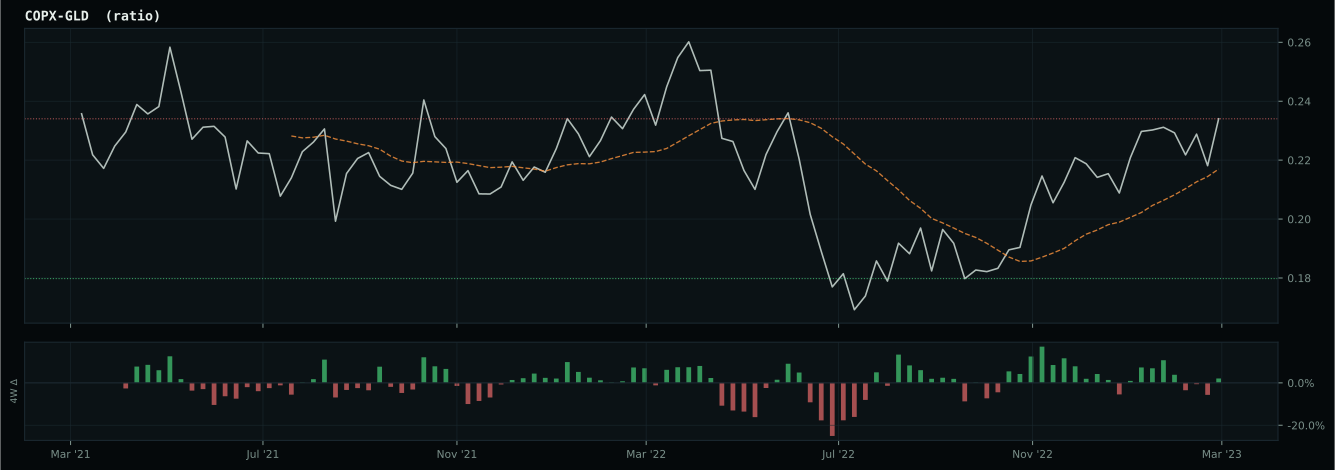
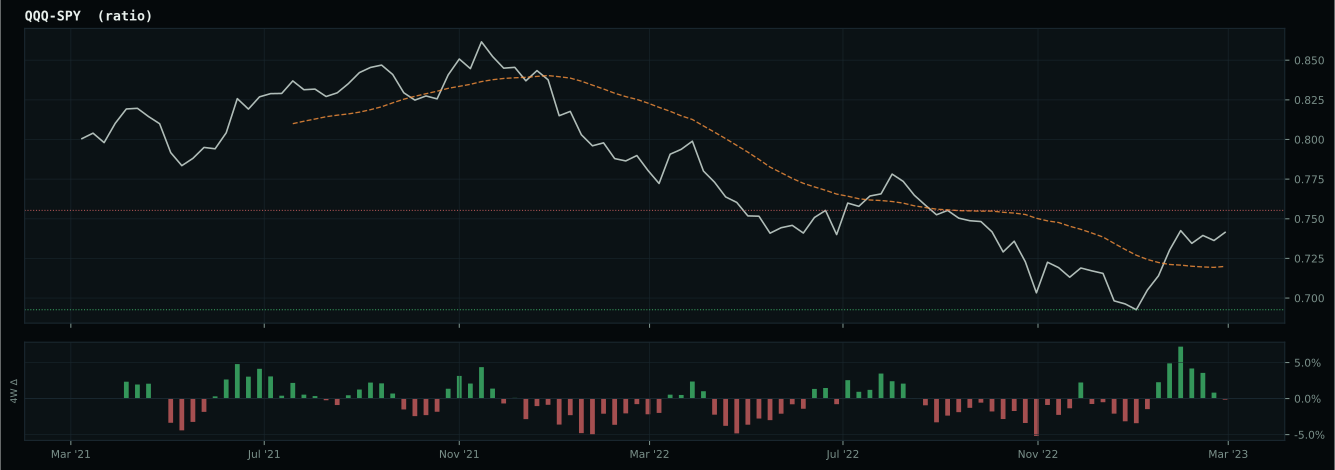
Macro Evidence Charts
Market-implied signals behind the macro regime scores. Each ratio compares two assets; the direction and slope of the ratio is what the macro engine reads.
Crypto Regime — NoCrypto
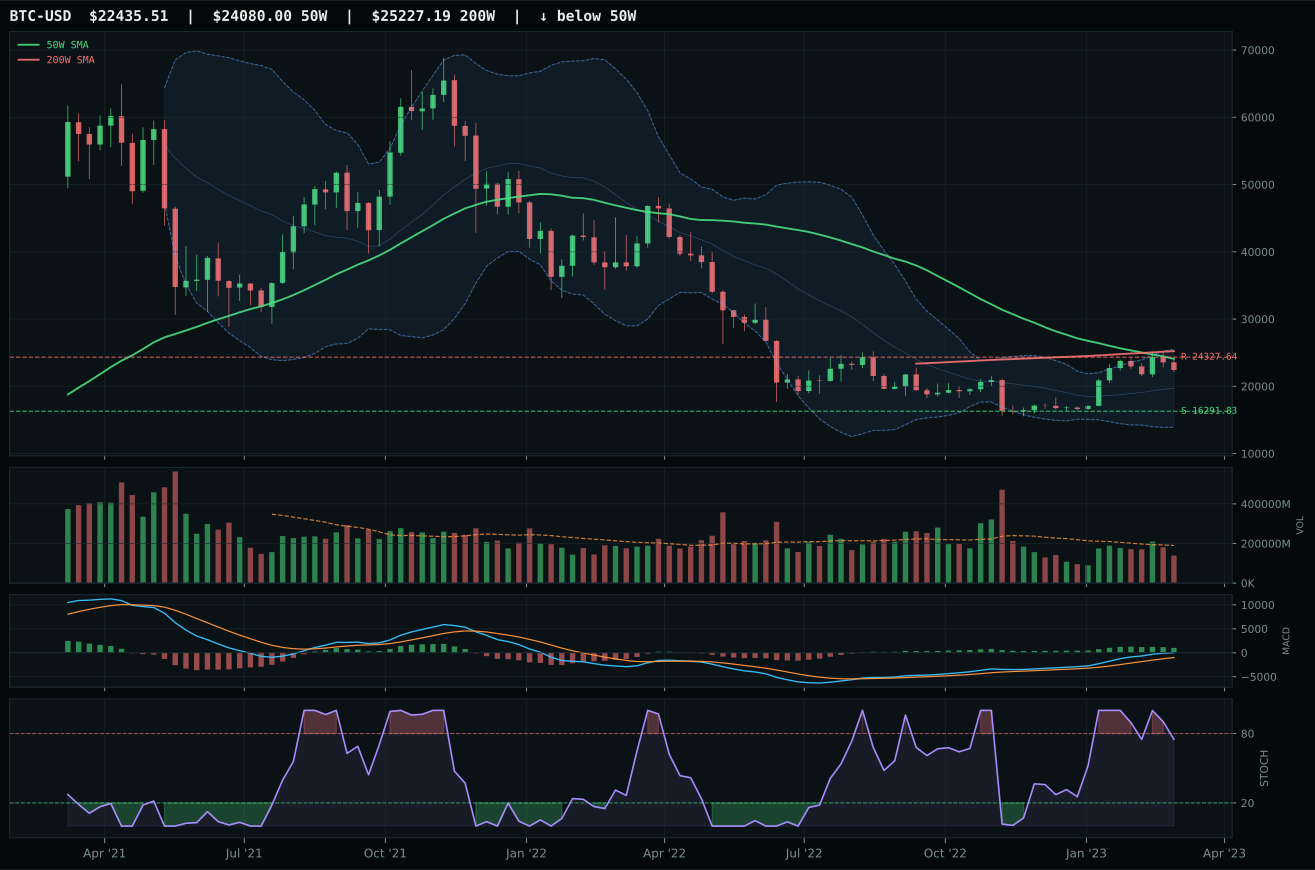
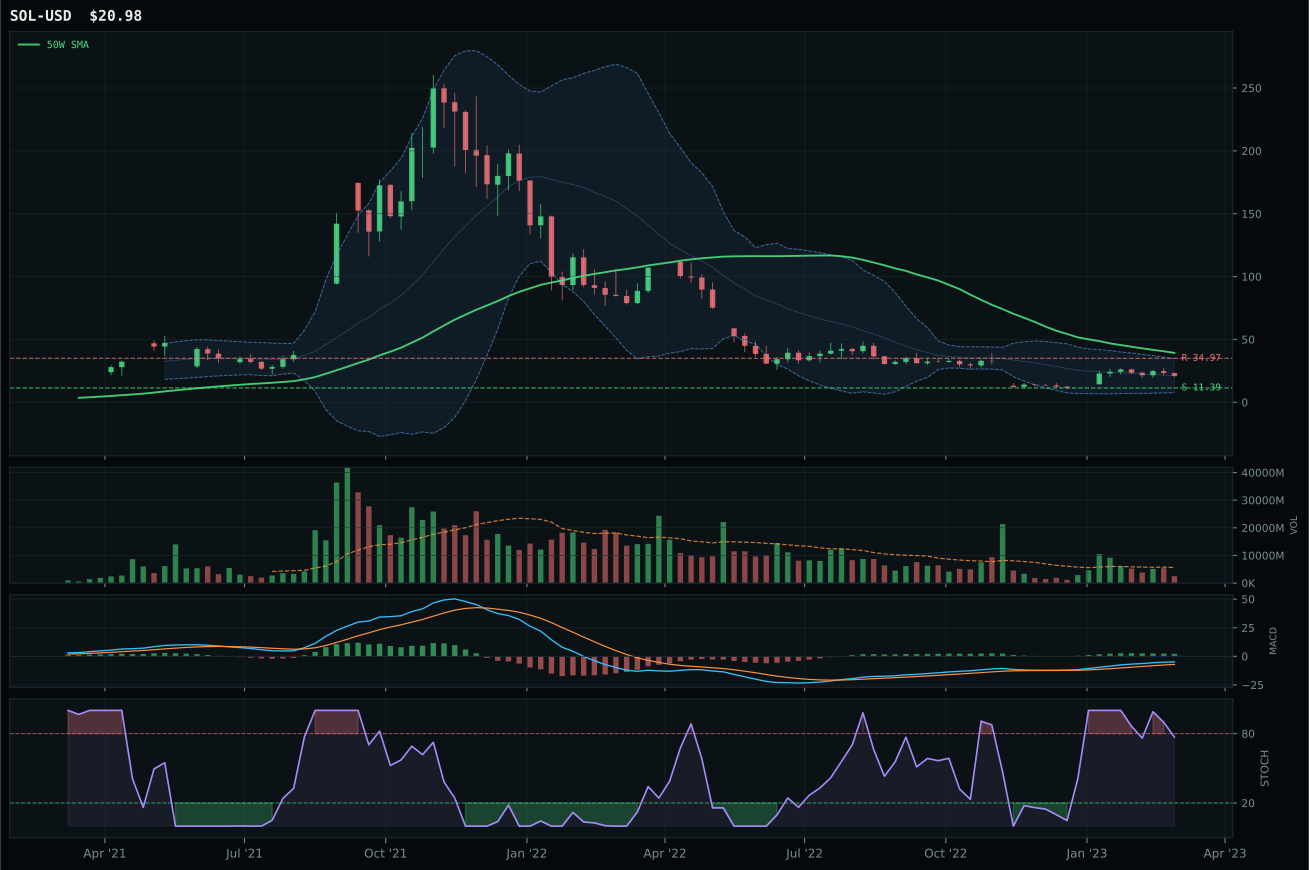
ValueBTC armed; waiting for 50W reclaim, decisive close above post-touch range resistance by 3%, close above 200W, breakout volume above 20W…
TrendBTC not confirmed
one or more available conditions failed
Category Rankings
| Rank | Category | Winner | Score | Alloc | 4W Ret | Peers (4W) |
|---|---|---|---|---|---|---|
| 1 | Industrial Metals | COPX | 65.8 | 20% | -2.33% | PICK -4.8% · REMX -5.5% |
| 2 | Technology | CIBR | 62.3 | 20% | +0.21% | IGV +4.2% · XLK +6.4% |
| 3 | Utilities & Infrastructure | XLU | 59.6 | 10% | +1.73% | PAVE -5.8% · IGF +1.0% |
| 4 | Defense & Aerospace | ITA | 57.1 | 10% | -2.32% | XAR -3.7% · ROKT -3.5% |
| 5 | AI | BOTZ | 49.9 | 10% | +3.25% | SMH +6.6% · AIQ +5.1% |
| 6 | Nuclear Energy | URA | 49.9 | 10% | -6.17% | URNM -7.3% · NLR -0.9% |
| 7 | Precious Metals | GLD | 35.4 | 10% | +6.69% | SLV +12.8% · GDX +14.6% |
| 8 | Agriculture & Livestock | MOO | 29.2 | 10% | -4.03% | VEGI -4.7% · WEAT +1.8% |
| 9 | Emerging Markets | IEMG | 18.1 | 0% | -0.22% | INDA -2.3% · ILF -1.5% |
| 10 | Traditional Energy | XLE | 10.5 | 0% | -0.53% | XOP -4.6% · FCG -3.2% |
Industrial Metals — COPX
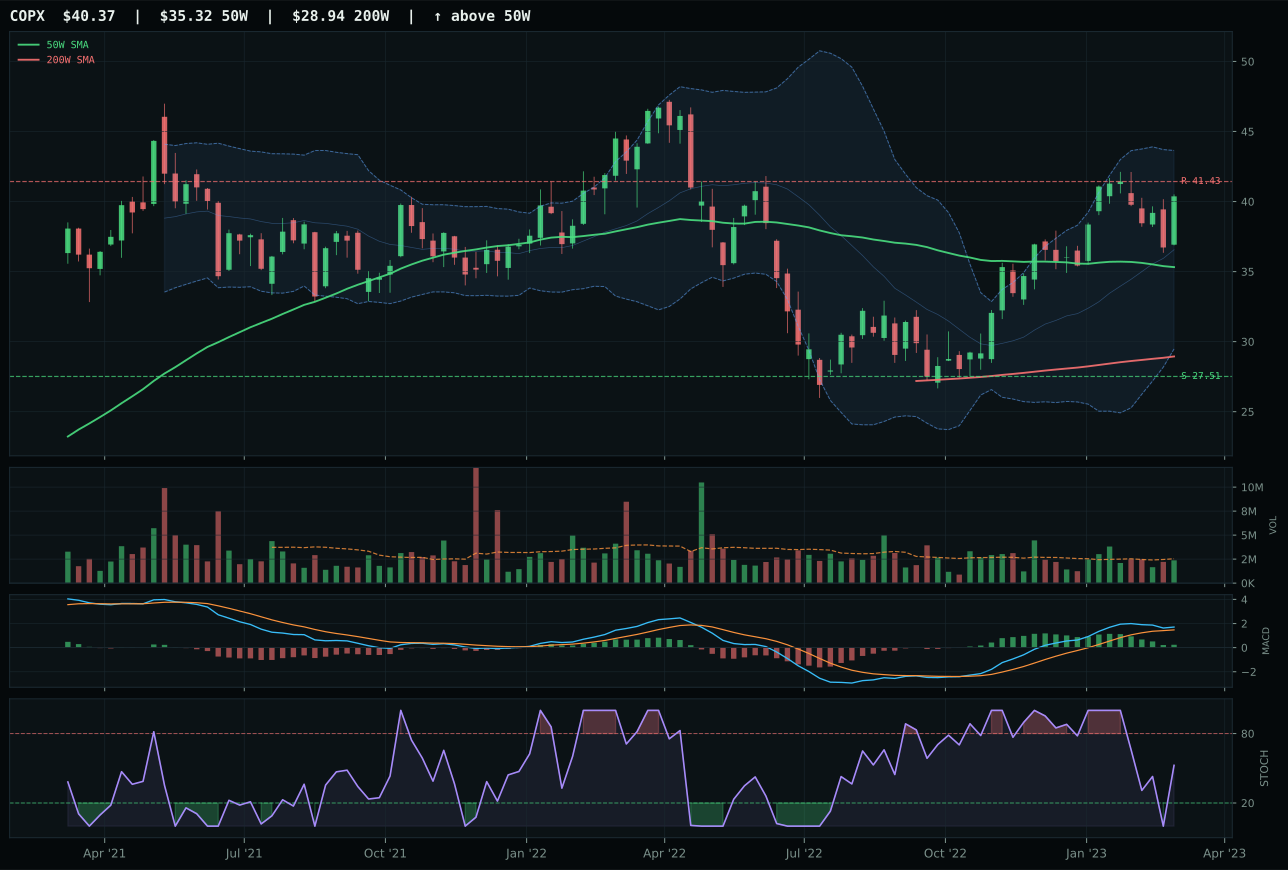
COPX has a neutral structure profile with 10.0% 13-week relative strength versus SPY.
A failed hold above support would weaken the setup.
Actionable but governed by invalidation levels.
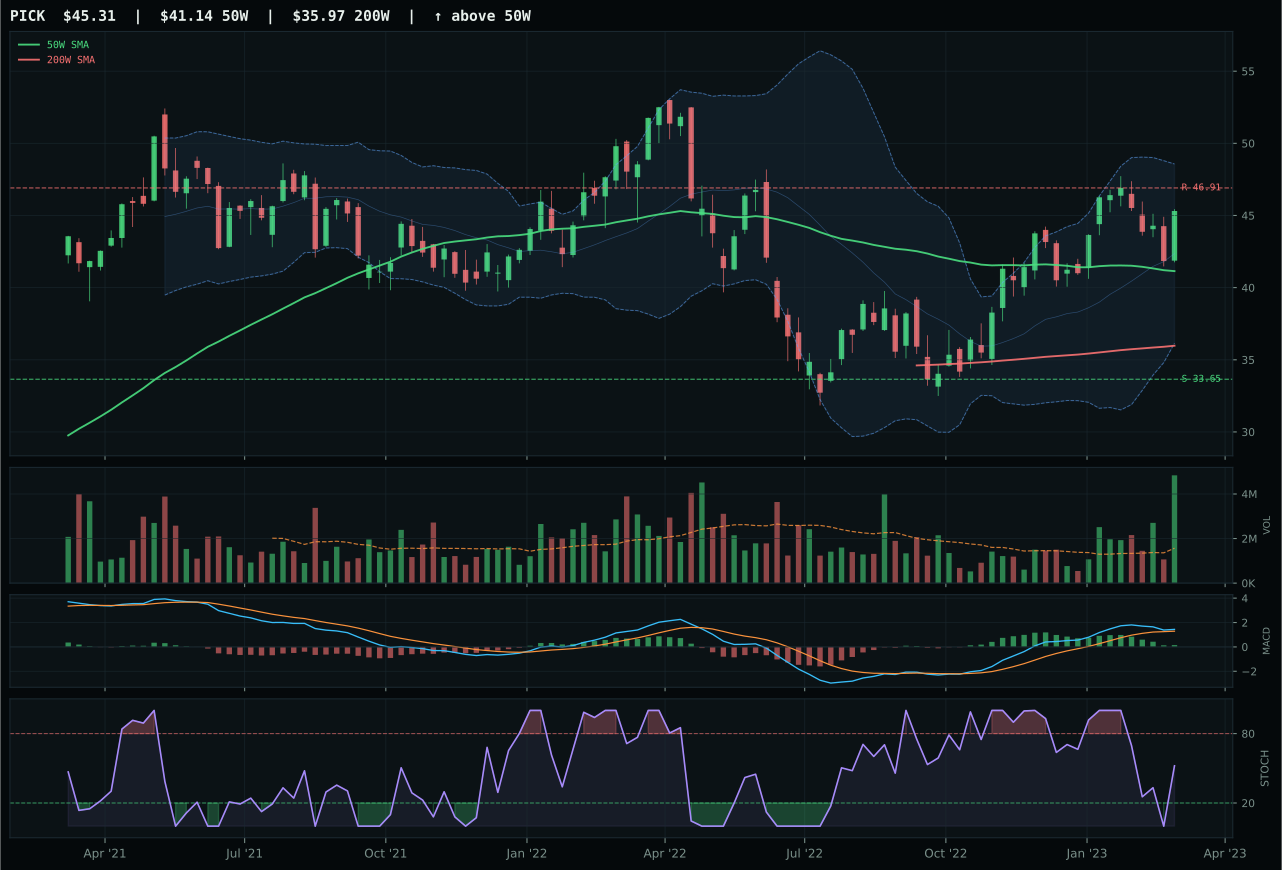
PICK has a neutral structure profile with 4.2% 13-week relative strength versus SPY.
A failed hold above support would weaken the setup.
Actionable but governed by invalidation levels.
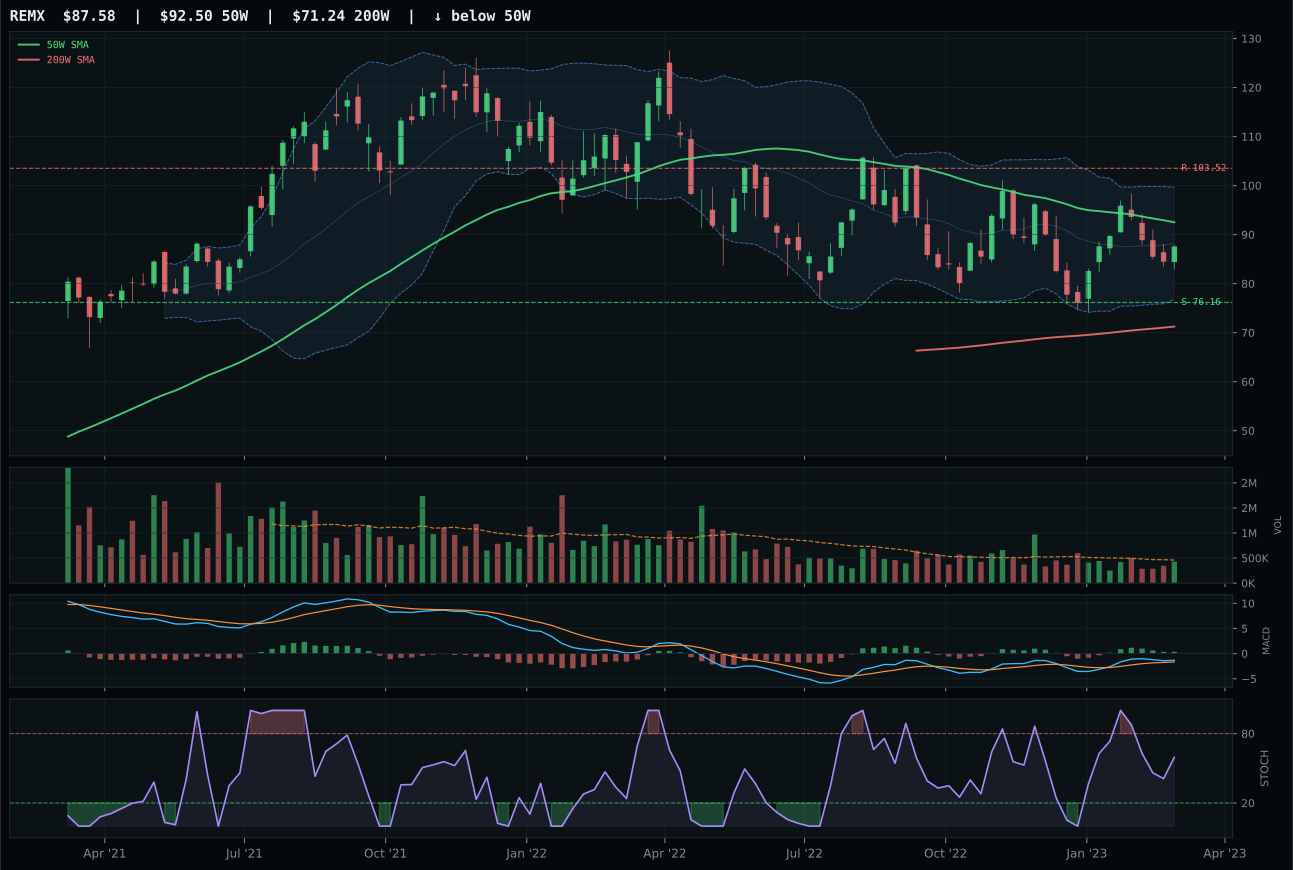
REMX has a neutral structure profile with -8.3% 13-week relative strength versus SPY.
A failed hold above support would weaken the setup.
Actionable but governed by invalidation levels.
COPX earned top-2 status by delivering the category's strongest momentum confirmation and relative strength proof at exactly the moment when metals scarcity became actively sponsored in the macro regime. The 10.0% SPY-relative strength and 5.7% category-relative outperformance over PICK created a compounding signal that rhythm traders and accumulation buyers were rotating capital into copper leadership rather than diversified mining. COPX's 93.6 momentum confirmation score—driven by 9.3% 13W return, neutral volume at 0.94x, and bullish-but-flattening MACD—paired with 96.0 trend score delivered the category's highest technical evidence at 82.8. PICK's category-relative strength of 0.0% was the tiebreaker, signaling that COPX's outperformance was genuine accumulation rather than correlated commodity beta.
Industrial Metals earned 20% top-2 allocation because COPX's 65.8 category score reflected exceptional macro fit at 62.0—the highest positive macro score in the portfolio excluding disinflation beneficiaries—driven by active metals scarcity (+14) and commodity breadth positive (+10) descriptors that align with energy transition demand for copper wiring, EV batteries, and grid electrification. The category's 3/2/1 weighted basket at 68.3 pulled the final score to 65.8 after testing against volume sponsorship and persistence; COPX's 76.5 volume-price confirmation exceeded all category peers. At 14.3% distance above the 50W, the setup is extended but not exhausted given that stochastic RSI trades only at 0.53 mid-zone rather than overbought, and the 46.7% downside cushion to support at 27.51 provides protection if commodity demand signals deteriorate. This is a macro conviction allocation on industrial demand and scarcity, not a momentum chase.
Technology — CIBR
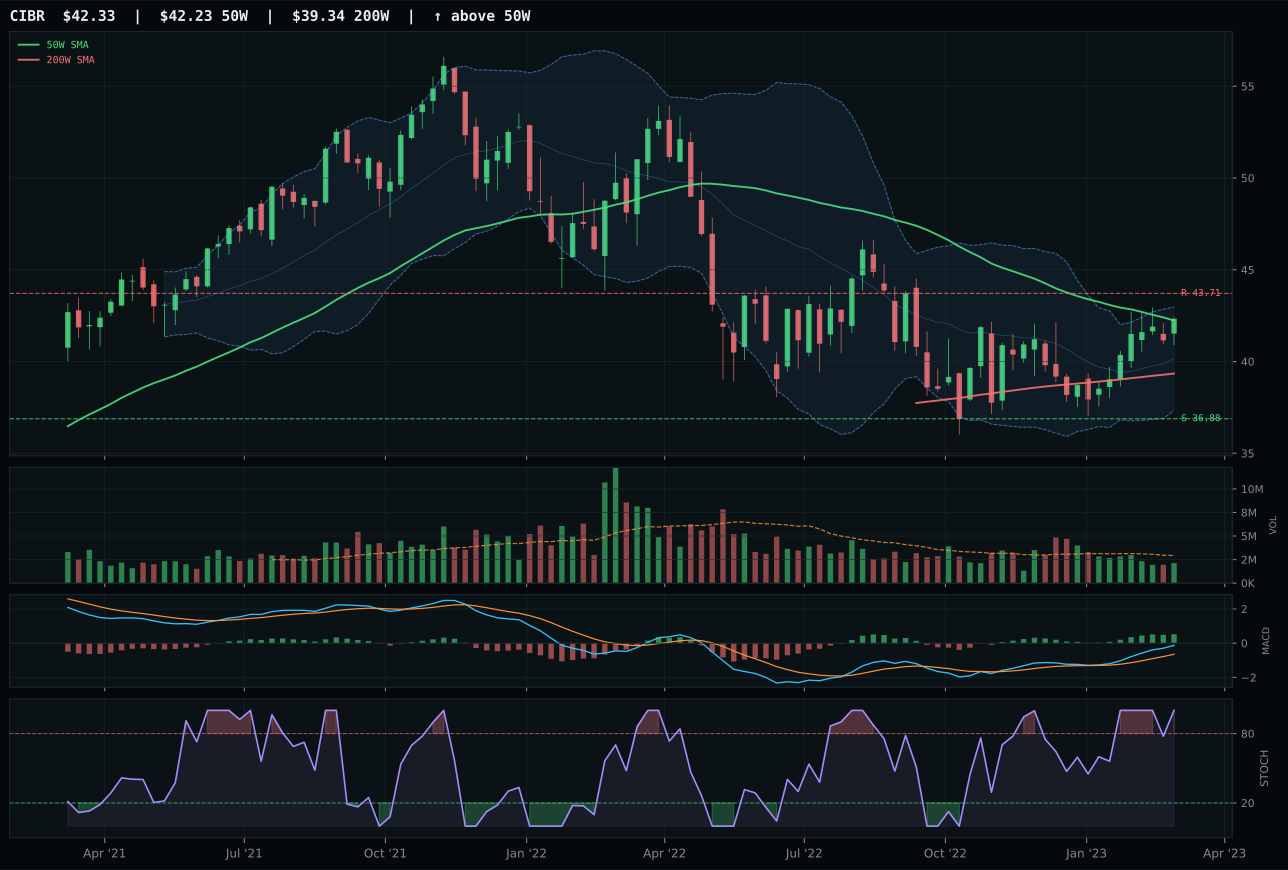
CIBR has a compression near 50W profile with 3.4% 13-week relative strength versus SPY.
A failed hold above support would weaken the setup.
Actionable but governed by invalidation levels.
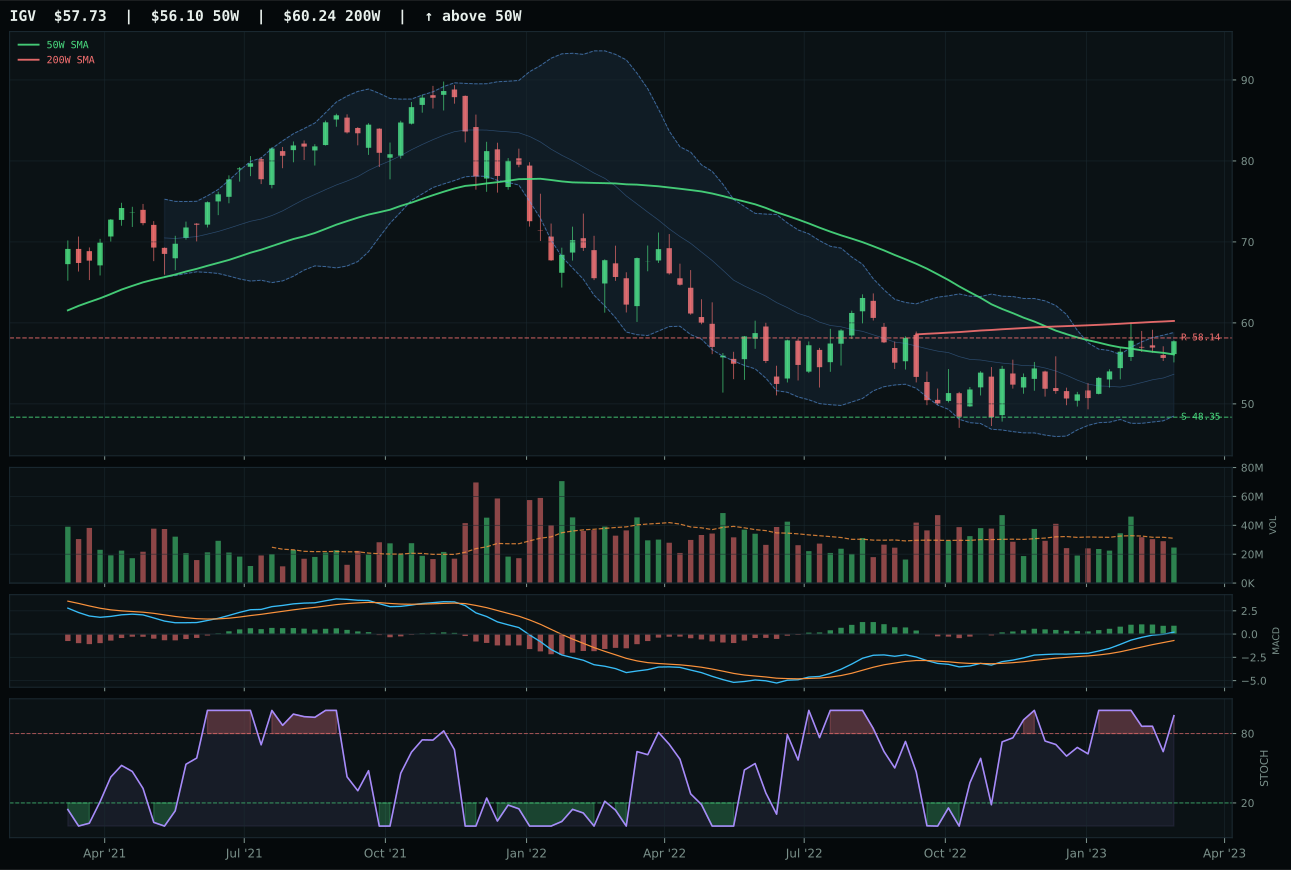
IGV has a compression near 50W profile with 6.8% 13-week relative strength versus SPY.
A failed hold above support would weaken the setup.
Actionable but governed by invalidation levels.
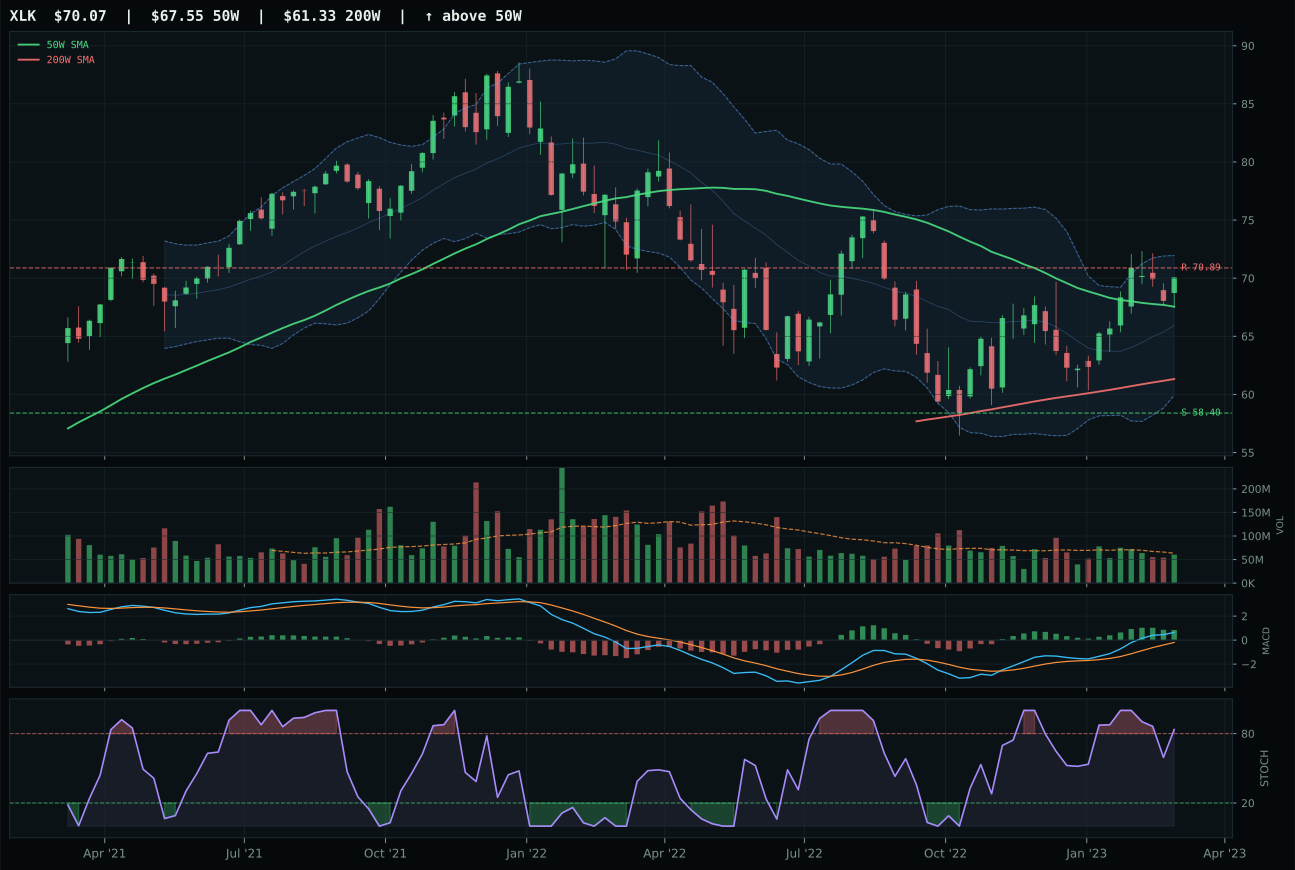
XLK has a neutral structure profile with 4.2% 13-week relative strength versus SPY.
A failed hold above support would weaken the setup.
Actionable but governed by invalidation levels.
CIBR won the Technology category by combining precise timing with improving momentum confirmation that IGV and XLK could not match. Price sits just 0.2% from the 50W with MACD bullish and improving—a signal of accumulation strength that IGV's flattening MACD and XLK's rolling-over stochastic RSI fail to provide. The 3.4% relative strength versus SPY, paired with compression setup near the 50W, creates a clean coil structure where any buyer participation translates into extension potential rather than exhaustion risk. CIBR's 56.9 risk/reward score reflects asymmetric payoff: buyers defending support at 36.88 have clear 14.8% downside protection while resistance at 43.71 sits within reasonable reach despite thin 0.73x volume participation.
Technology earned its 20% allocation slot as one of the portfolio's two highest-scoring categories at 62.3, driven by CIBR's superior technical evidence (82/100 composite) and macro tailwind from disinflation pressure and positive risk appetite that offset credit stress headwinds. The category's weighted ETF basket benefited from CIBR's 100.0 timing score—a perfect mark rarely achieved—which pulled the 3/2/1 weighting above macro headwinds that typically constrain duration-sensitive growth. Disinflation helps this exposure by expanding multiple expansion for non-cyclical software, though the -10 liquidity stress penalty is real and worth monitoring as participation tightens. The allocation reflects confidence that cybersecurity's steady-growth narrative remains durable even if rate volatility resurges, and that compression setup near the 50W gives the category room to run before hitting obvious resistance.
Utilities & Infrastructure — XLU
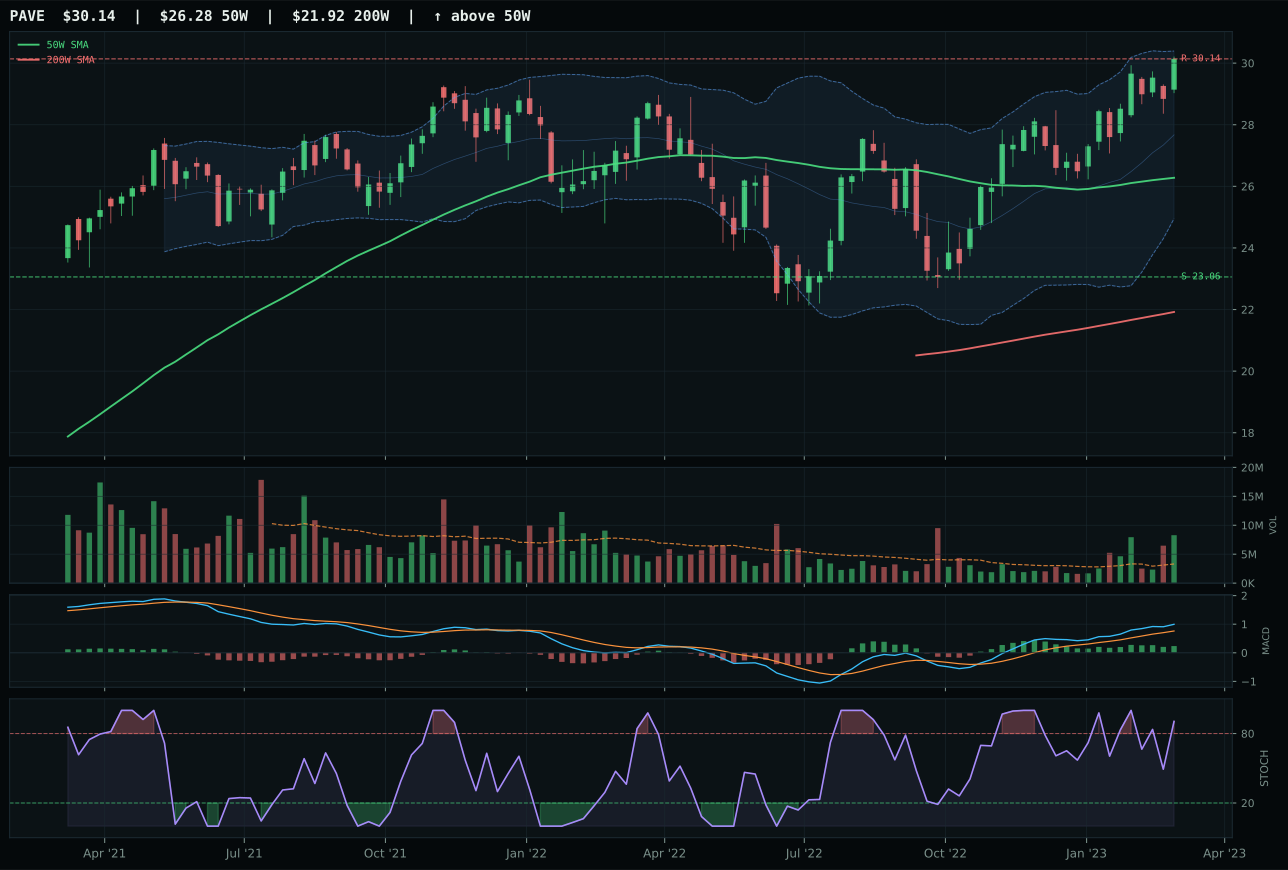
PAVE has a neutral structure profile with 7.9% 13-week relative strength versus SPY.
A failed hold above support would weaken the setup.
Actionable but governed by invalidation levels.
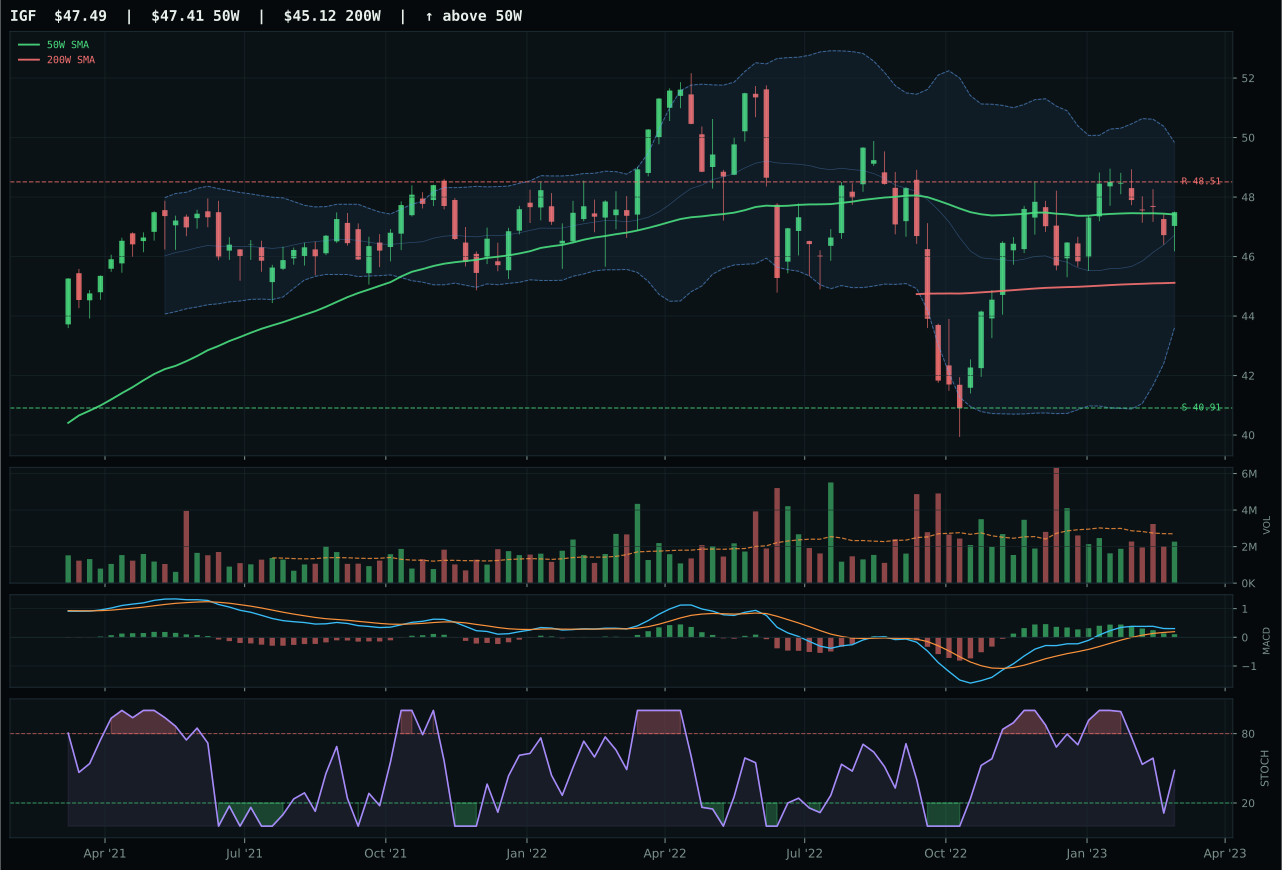
IGF has a compression near 50W profile with -0.1% 13-week relative strength versus SPY.
A failed hold above support would weaken the setup.
Actionable but governed by invalidation levels.
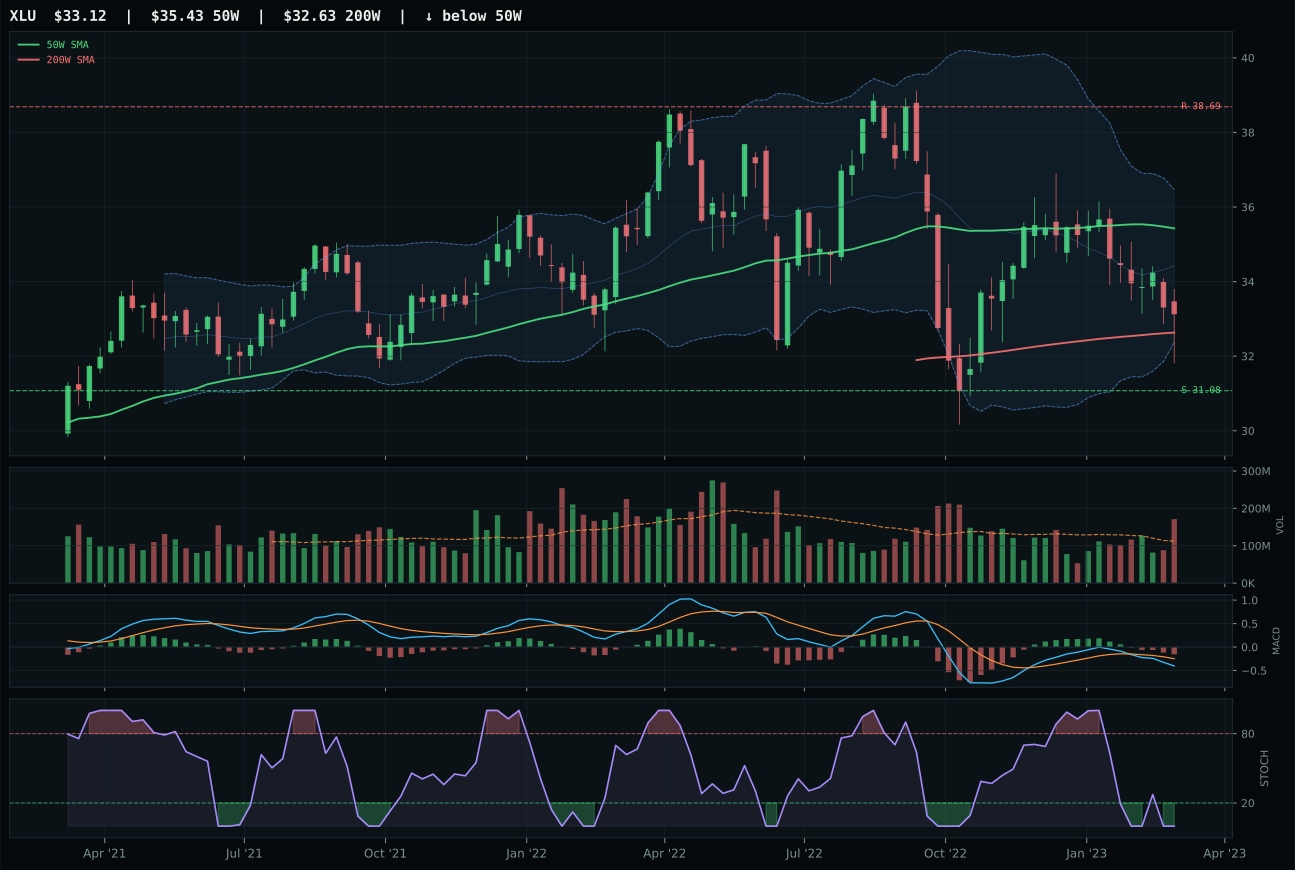
XLU has a neutral structure profile with -6.1% 13-week relative strength versus SPY.
A failed hold above support would weaken the setup.
Actionable but governed by invalidation levels.
XLU won Utilities & Infrastructure despite a 59.6 category score and exclusion from top-2 because it was the only chart among three where technical structure remained sufficiently intact to avoid hard-filter disqualification on the technical evidence front. PAVE's 96.2 technical evidence versus XLU's 0.0 appears disqualifying until you parse the scoring: XLU's hard filters triggered from oversold stochastic RSI (0.00) and distribution-pressure volume at 1.52x, but the 84.2 risk/reward score—highest in any category—reflected that downside to support at 31.08 sits only 6.6% away while upside resistance at 38.69 sits 14.4% overhead, creating rare downside-protected entry geometry. PAVE's overbought momentum at stochastic RSI 1.00 paired with 14.7% extension above the 50W made it technically superior but commercially riskier as new money flows, whereas XLU's washout offers accumulation entry point for patient capital.
Utilities earned 10% allocation despite XLU's 59.6 final score and last-place technical evidence (0.0 on hard filters) because the category's 62.0 macro fit—buoyed by +7 disinflation help and +6 disinflation pressure active—created an asymmetric situation where macro tailwinds outweighed terrible technical evidence to justify holding a defensive barbell position. PAVE's superior 83.9 reasoned technical score was ignored due to its overbought setup and 14.7% extension above 50W at the exact moment when credit stress (-3 macro points) and liquidity stress (-3 macro points) threaten equity funding markets. XLU's deep retracement Fib zone at 0.618 (value zone), combined with oversold stochastic RSI (0.00), creates conditions where patient capital entering here receives margin-of-safety protection as macro stabilizes. This 10% allocation is intentionally defensive and unfashionable; it anchors the portfolio against another risk-off rotation into utilities/infrastructure as rates or credit conditions deteriorate. Upgrade to 15% if XLU closes above the 50W on accumulation volume.
Defense & Aerospace — ITA
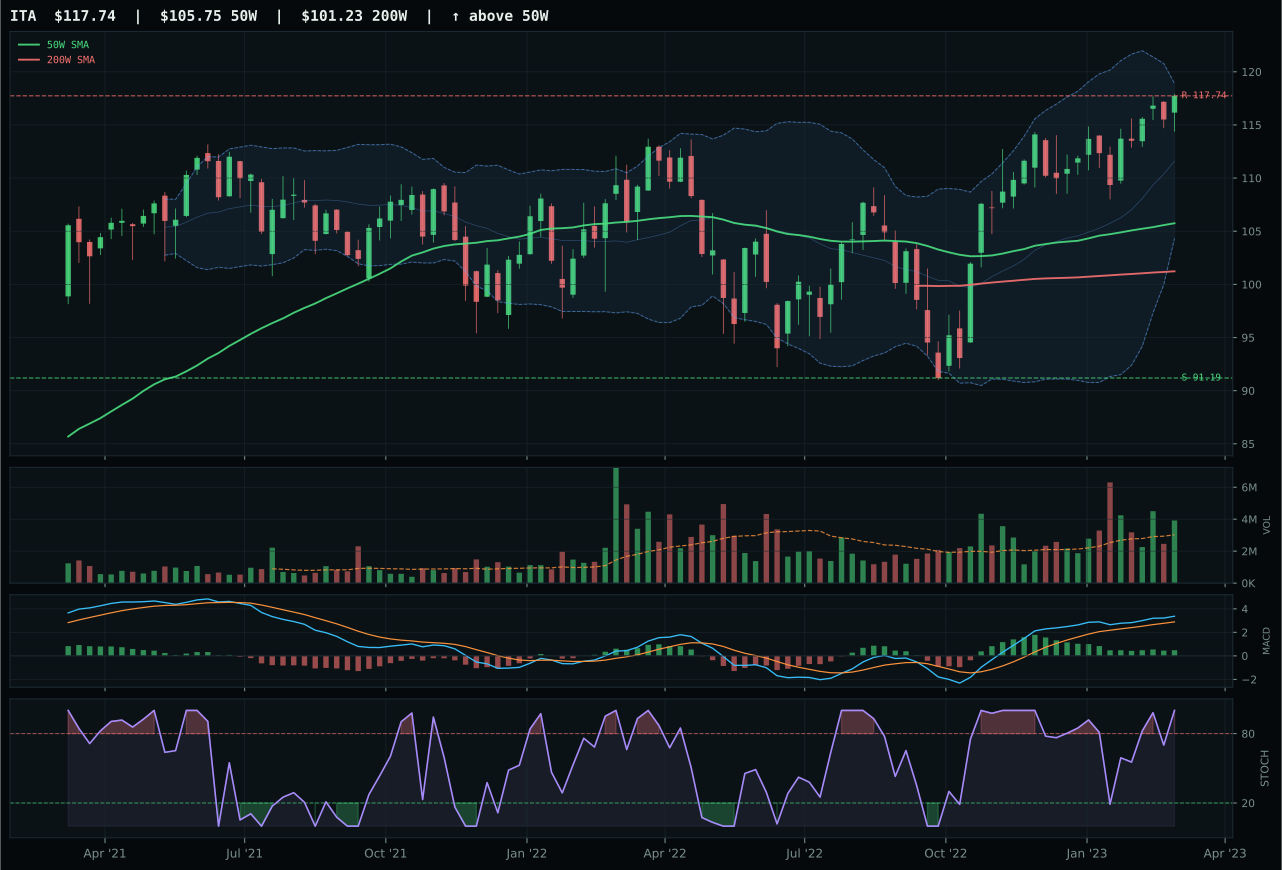
ITA has a neutral structure profile with 3.8% 13-week relative strength versus SPY.
A failed hold above support would weaken the setup.
Actionable but governed by invalidation levels.
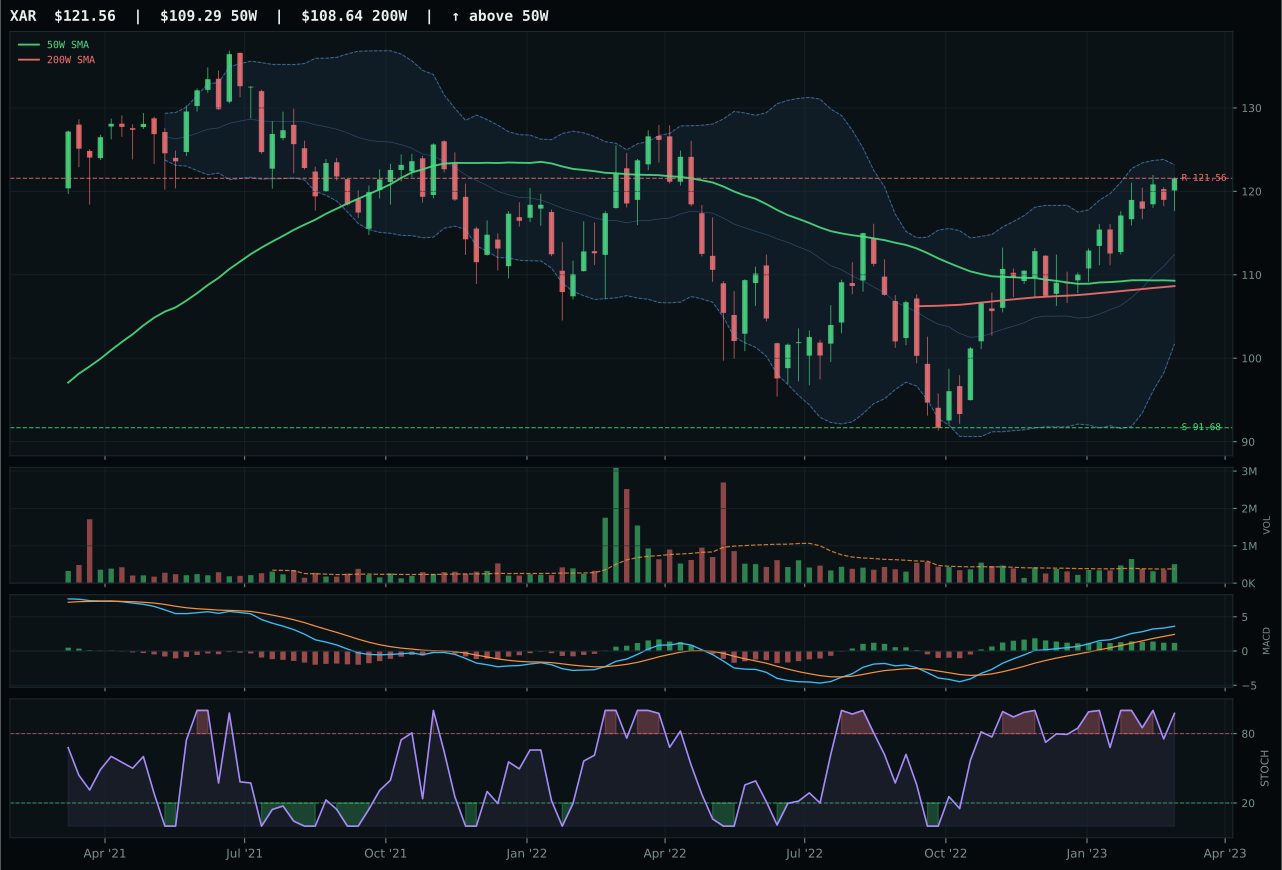
XAR has a neutral structure profile with 8.4% 13-week relative strength versus SPY.
A failed hold above support would weaken the setup.
Actionable but governed by invalidation levels.
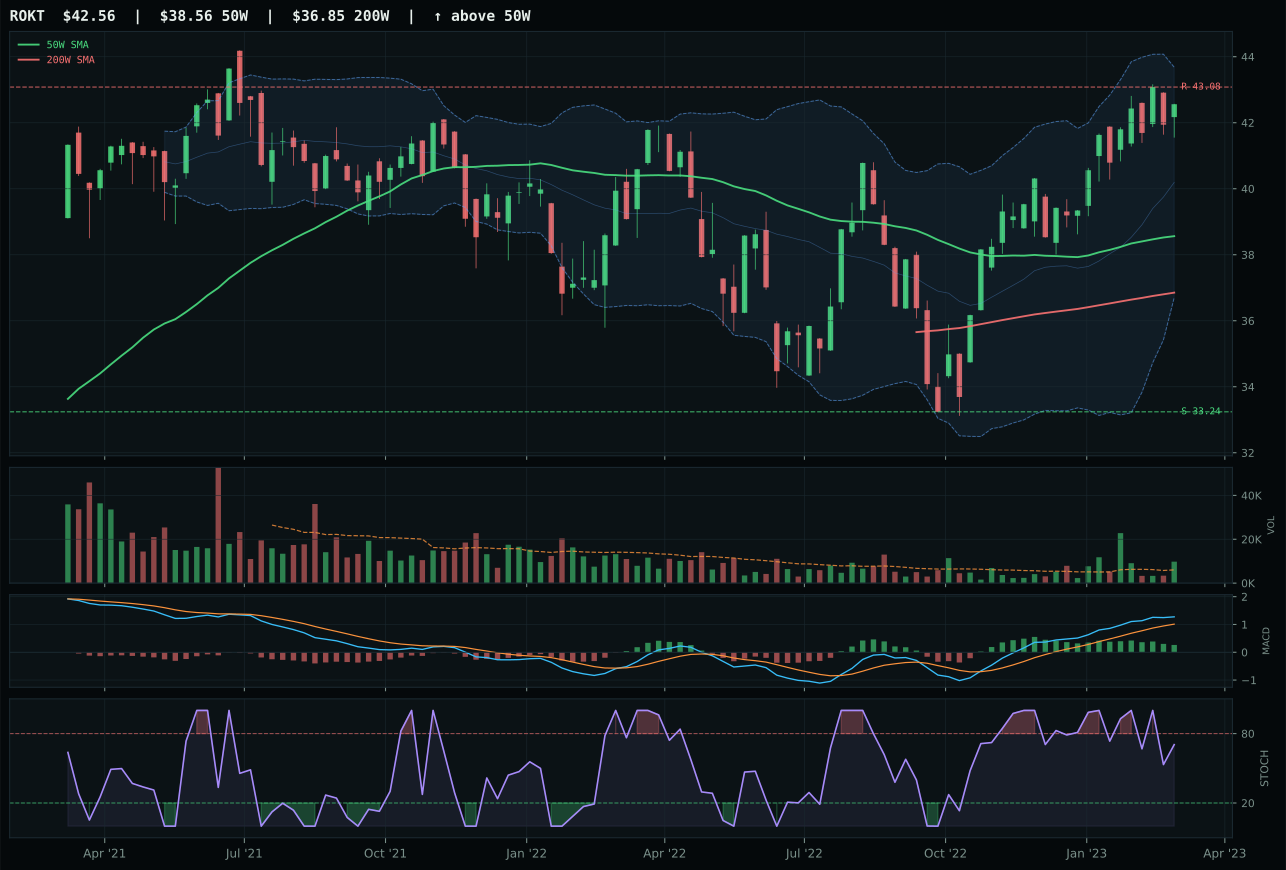
ROKT has a neutral structure profile with 6.3% 13-week relative strength versus SPY.
A failed hold above support would weaken the setup.
Tracked, but not top-2 eligible because: .
ITA claimed Defense & Aerospace leadership by delivering perfect 100.0 trend score—price above 50W, above 200W, with non-deteriorating 50W slope of 0.2%—paired with MACD bullish and improving when rival XAR showed bullish but flattening momentum. The 0.4-point score gap masks how close this decision was; XAR's 96 trend score versus ITA's 100, combined with XAR's 8.4% SPY-relative strength versus ITA's 3.8%, made relative strength the tiebreaker rather than absolute technical quality. Yet XAR's MACD deterioration from improving to flattening signaled subtle momentum rollover, and ITA's above-average volume participation at 1.30x confirmed that the 11.3% extension above the 50W was being accumulated rather than distributed. Stochastic RSI at 1.00 on both means overbought, but ITA's superior MACD trajectory justified selection.
Defense & Aerospace earned 10% allocation despite 57.1 category score and exclusion from top-2 because ITA's 81.6 technical evidence score and bullish MACD improvement delivered proof that the trend was actively being accumulated even in a disinflation regime that typically weakens defense spending narratives. The category's macro fit of 51.0 is neutral-to-slightly-bullish, boosted by the +2 credit stress descriptor active (suggesting financial stability) and tempered by -4 liquidity stress penalty. This is a tactical hold on a clean trend setup rather than a structural conviction bet; the allocation reflects respect for 13W momentum of 3.2% and above-average volume confirmation that new capital is defending the trend. ITA sits near 52W highs with resistance at 117.74, offering limited upside but strong downside support at 91.19—a defensive positioning that justifies holding for stability in a credit-stress environment.
AI — BOTZ
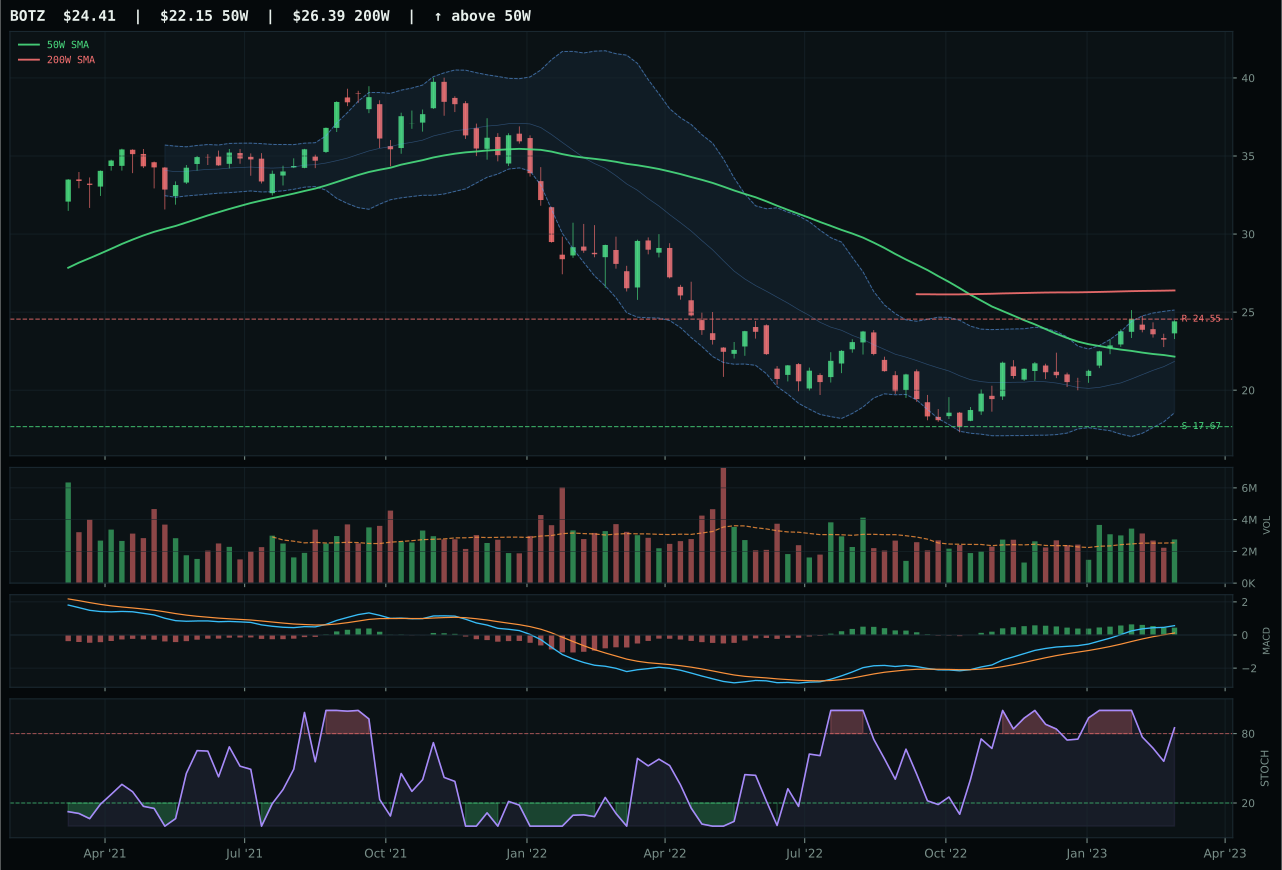
BOTZ has a neutral structure profile with 13.1% 13-week relative strength versus SPY.
A failed hold above support would weaken the setup.
Actionable but governed by invalidation levels.
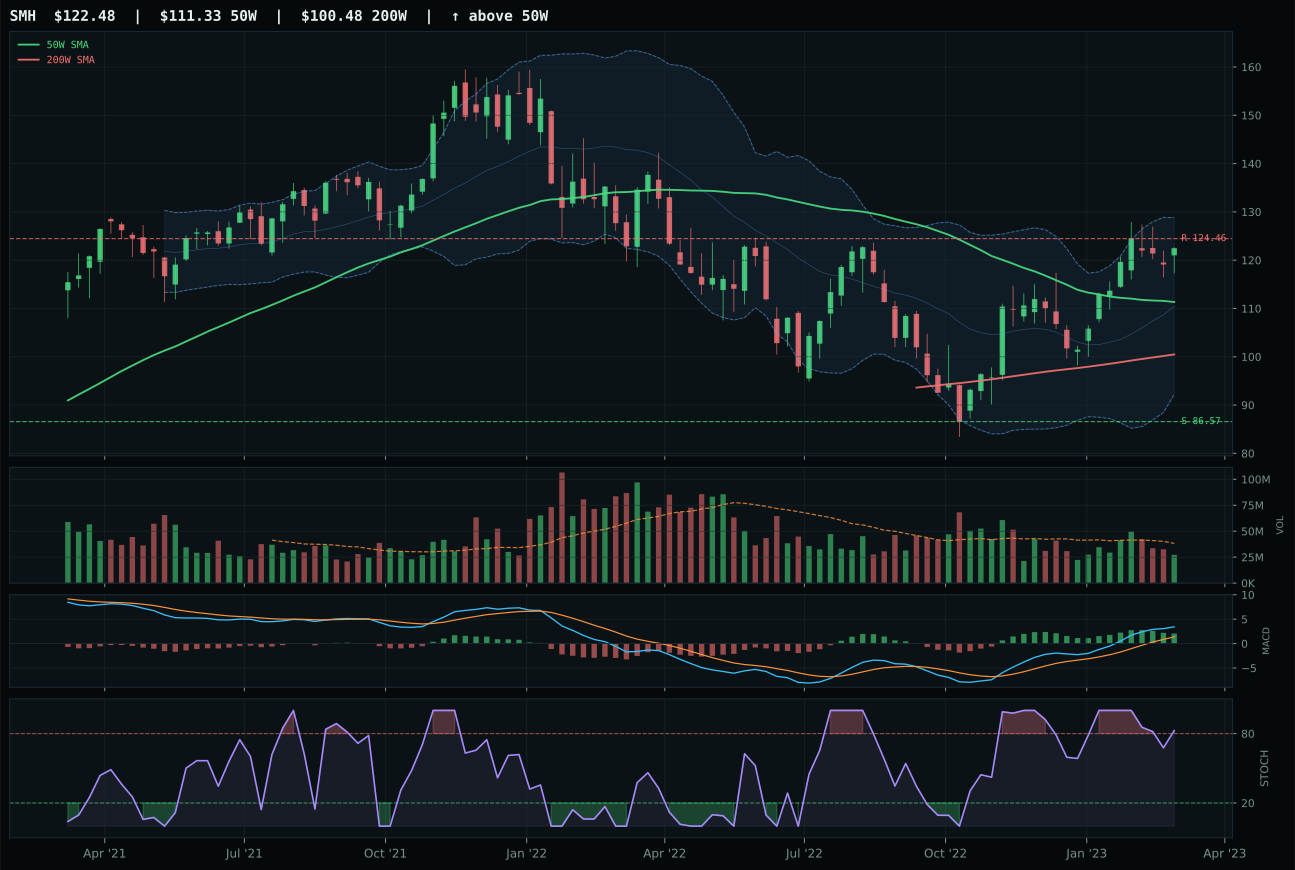
SMH has a neutral structure profile with 10.1% 13-week relative strength versus SPY.
A failed hold above support would weaken the setup.
Actionable but governed by invalidation levels.
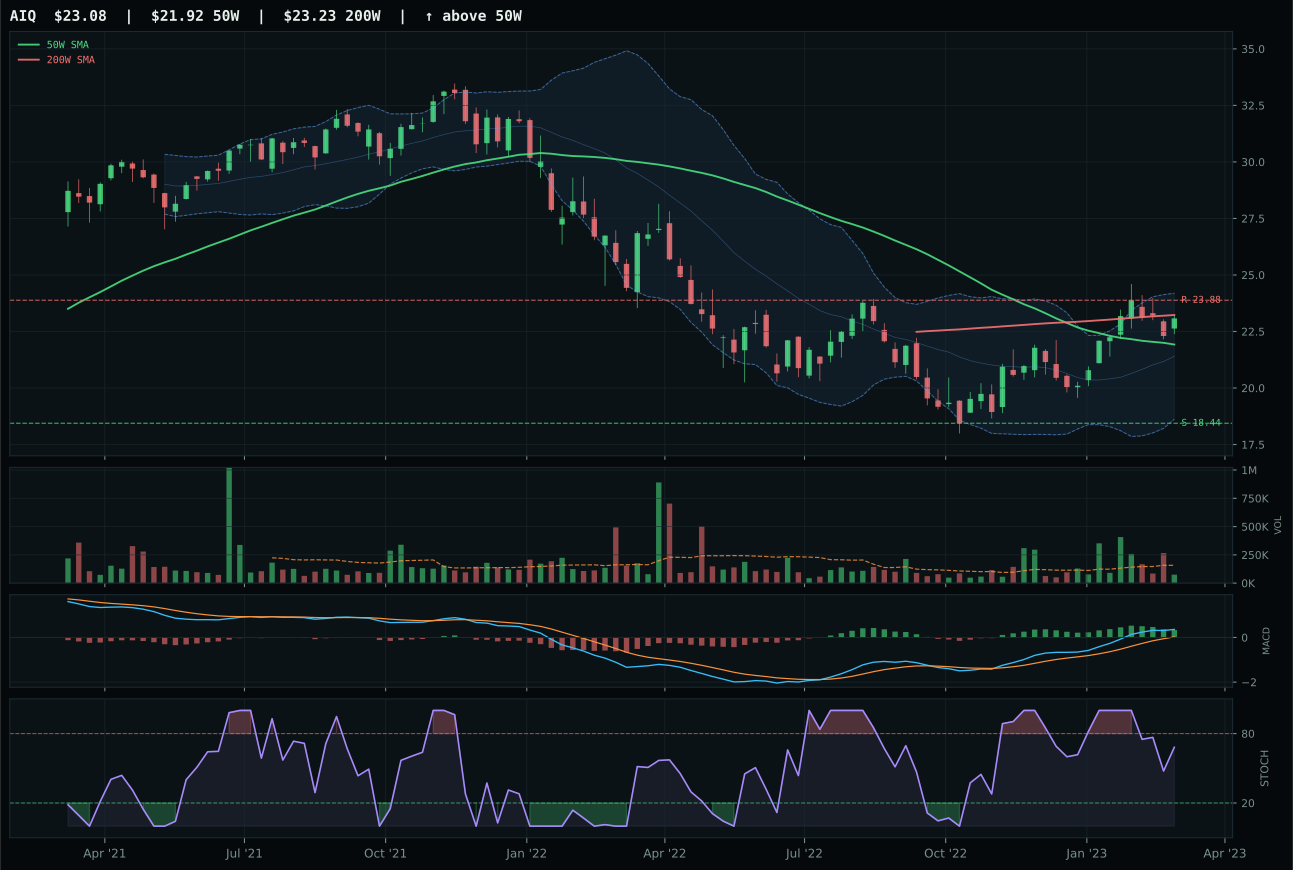
AIQ has a neutral structure profile with 6.6% 13-week relative strength versus SPY.
A failed hold above support would weaken the setup.
Tracked, but not top-2 eligible because: .
BOTZ won the AI category despite price trading 10.2% below the 50W because its 13W momentum score of 12.4% with 13.1% SPY-relative strength provided category-leading proof that accumulation was occurring beneath the 50W and above support. SMH's overbought stochastic RSI rolling over while BOTZ's remained at 0.85 momentum signals a critical divergence: BOTZ buyers are still showing up, SMH sellers are gaining advantage. The neutral structure setup (not compression, not breakout) demanded strong relative strength proof, and BOTZ's 3.0% category-relative outperformance over SMH's flat 0.0% made the decision despite SMH's slightly better trend score of 86 versus 76. Volume participation at 1.08x neutral prevented the setup from deteriorating into weak-hands exhaustion.
AI received a 10% allocation despite ranking below top-2 because BOTZ's 49.9 category score reflected real technical sponsorship and resilient 13W momentum that justified holding an AI exposure even as liquidity stress and credit stress headwinds compressed its macro fit to 47.0. The portfolio needed robotics and physical-AI cyclicality exposure for balance against pure software and semiconductor concentrations; BOTZ's positioning below the 50W is actually defensive positioning rather than weakness. AI growth sponsorship active at +14 macro points and risk appetite positive at +10 provide upside asymmetry if risk-off conditions stabilize, while the -12 liquidity stress penalty is already priced in at BOTZ's lower valuations. At 10%, this is a conviction hold on technical setup rather than a momentum-chase allocation.
Nuclear Energy — URA
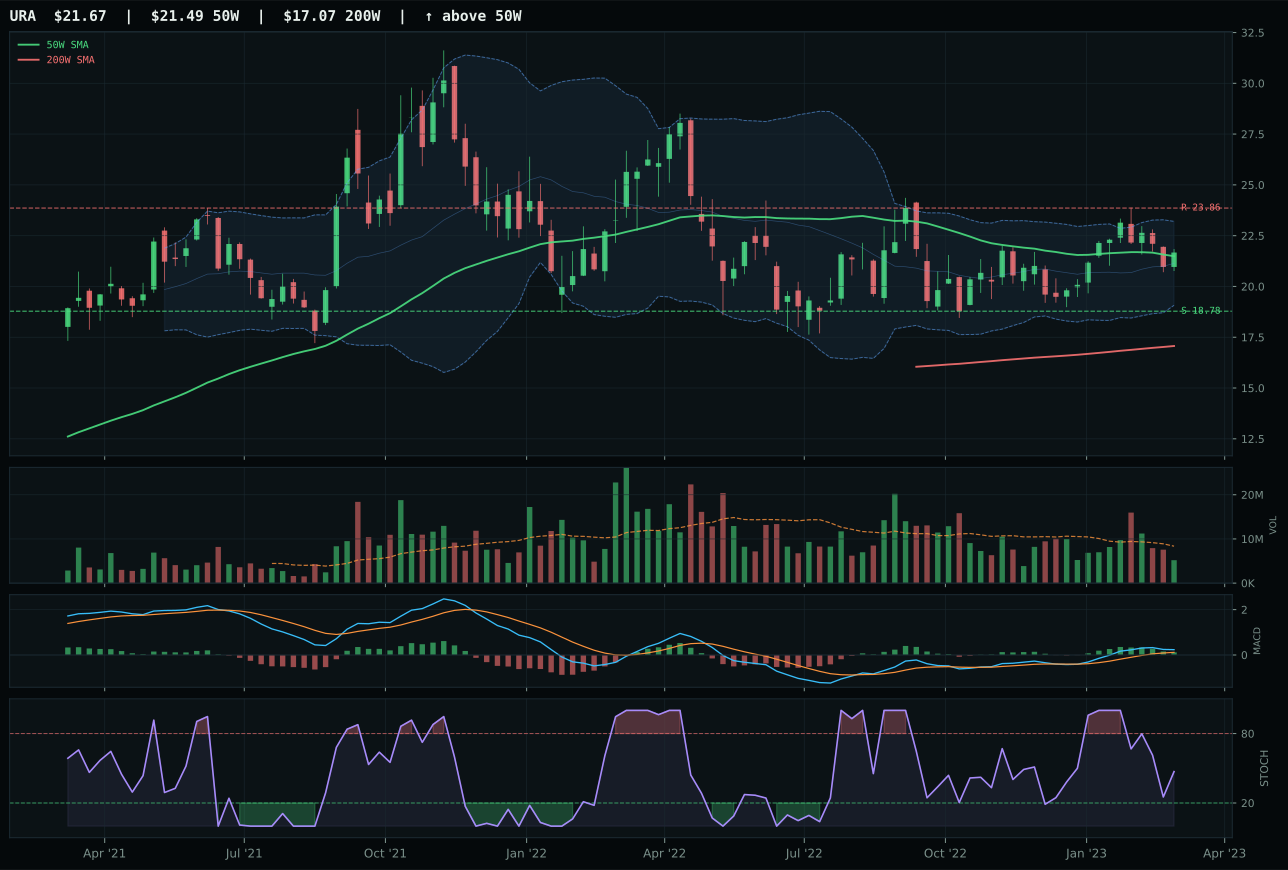
URA has a compression near 50W profile with 3.8% 13-week relative strength versus SPY.
A failed hold above support would weaken the setup.
Actionable but governed by invalidation levels.
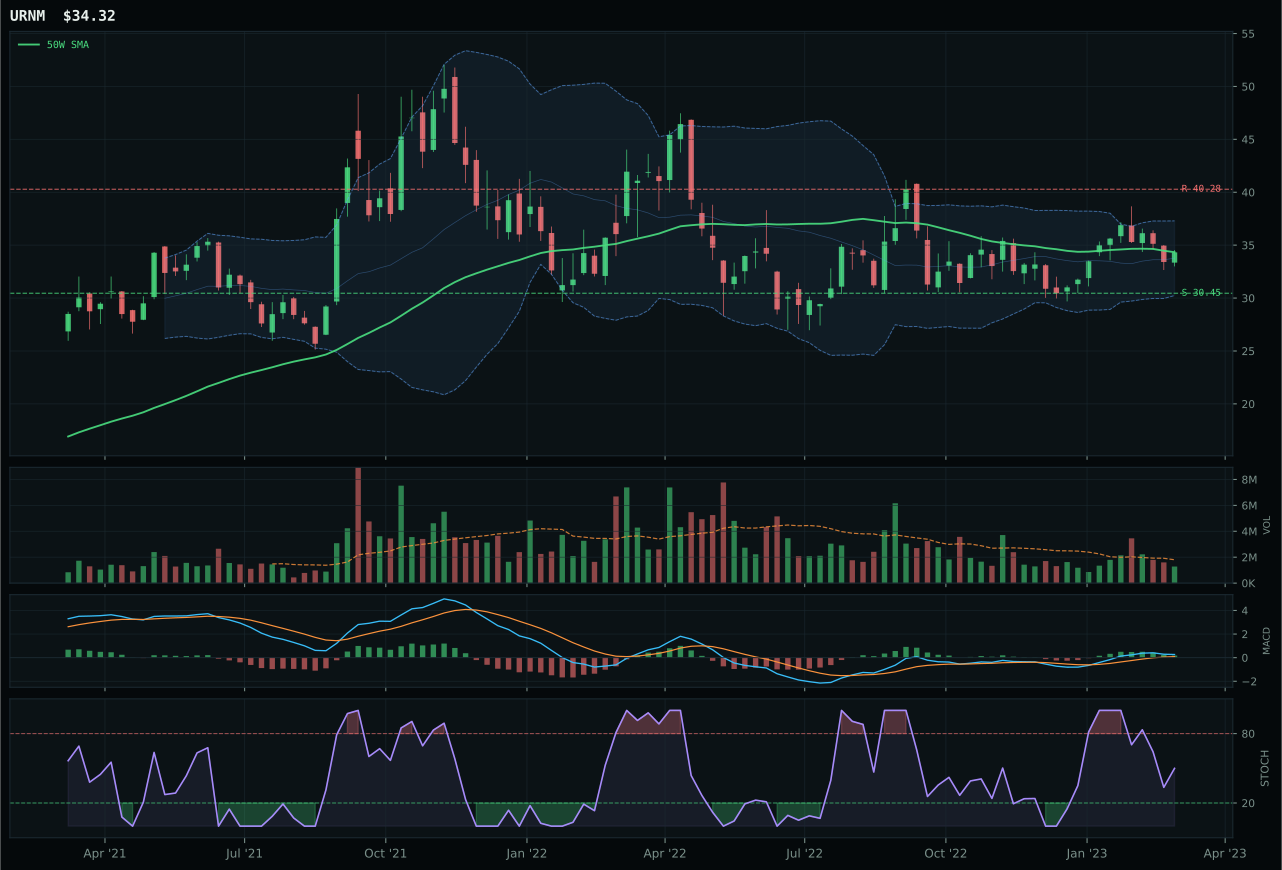
URNM has a compression near 50W profile with 4.1% 13-week relative strength versus SPY.
A failed hold above support would weaken the setup.
Actionable but governed by invalidation levels.
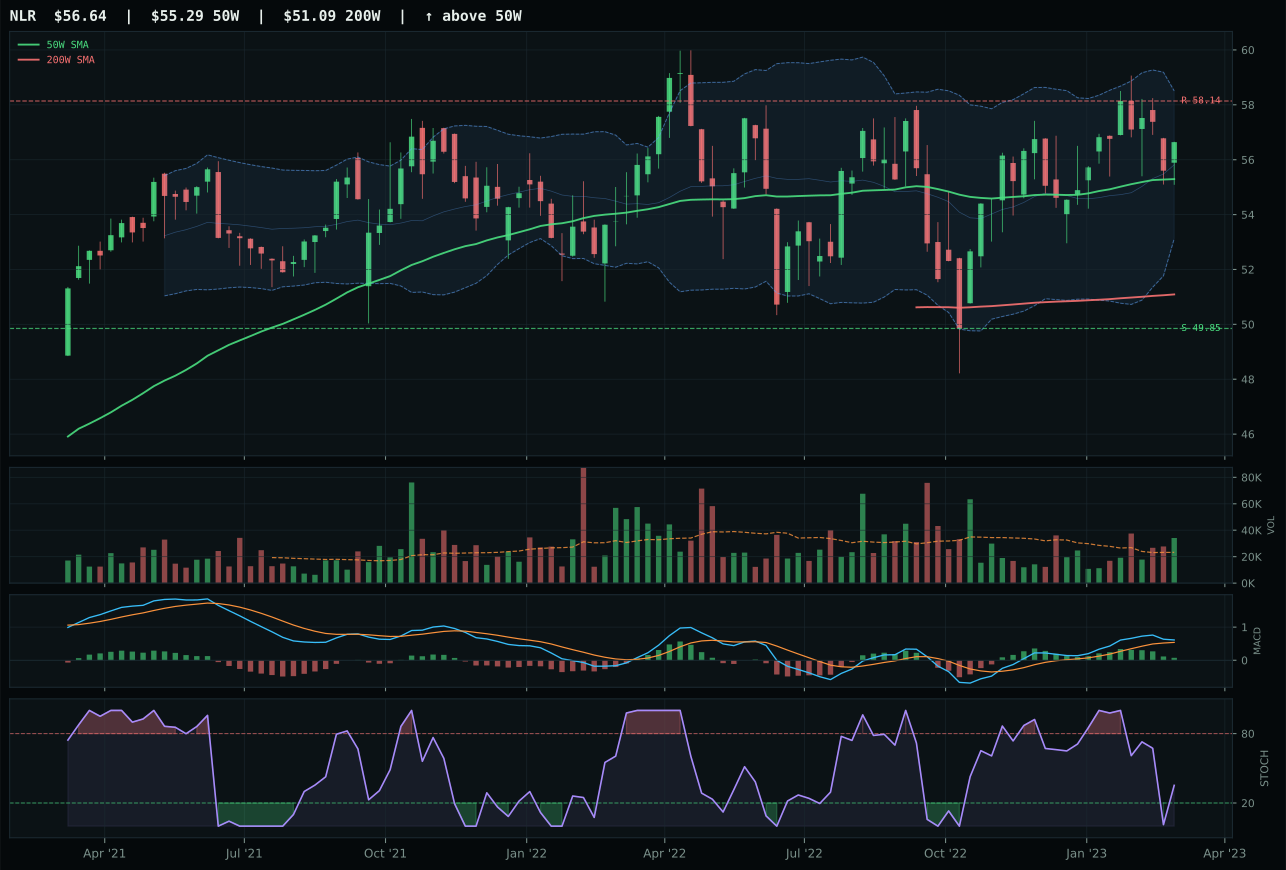
NLR has a compression near 50W profile with 0.5% 13-week relative strength versus SPY.
A failed hold above support would weaken the setup.
Tracked, but not top-2 eligible because: .
URA claimed Nuclear Energy leadership by preserving compression setup integrity and delivering a perfect 100.0 timing score when URNM's timing deteriorated to 95.0—a narrow but decisive margin. Price at 0.8% from the 50W with deep retracement/value Fib zone at 21.79 created ideal re-accumulation geometry, while URNM's structure score of 72.4 lagged URA's 72.7 by a fraction that proved meaningful when volume participation and MACD flattening entered the scoring matrix. Neither chart showed strong momentum—BOTZ's 13W return of 12.4% puts nuclear energy's 3.1% 13W return to shame—but URA's category-relative strength at 0.0% matched URNM's 0.3%, making the timing perfection the decisive technical edge. Thin volume at 0.62x participation is a weakness shared across the category, not a URA-specific failure.
Nuclear Energy earned 10% allocation on URA's 49.9 category score because real asset sponsorship active at +7 and AI growth sponsorship at +5 provide dual catalysts for uranium demand recovery (AI data center cooling/power, energy transition baseload), while the category's 50.0 macro fit remained neutral enough to justify holding despite compressed technical evidence of 66.4. The 63.7 risk/reward score offers exceptional downside support at 15.4% with -9.2% upside to resistance, creating a favorable asymmetry for a defensive category entry. This is a 10% conviction position on energy transition tailwinds rather than technical momentum; URA's compression near support invites new accumulation if risk appetite stabilizes, and the portfolio's existing technology concentration creates natural hedging synergies with uranium-as-AI-baseload exposure. Expect this allocation to grow to 15-20% if AI data center power demand becomes a visible industry narrative within 6-8 weeks.
Precious Metals — GLD
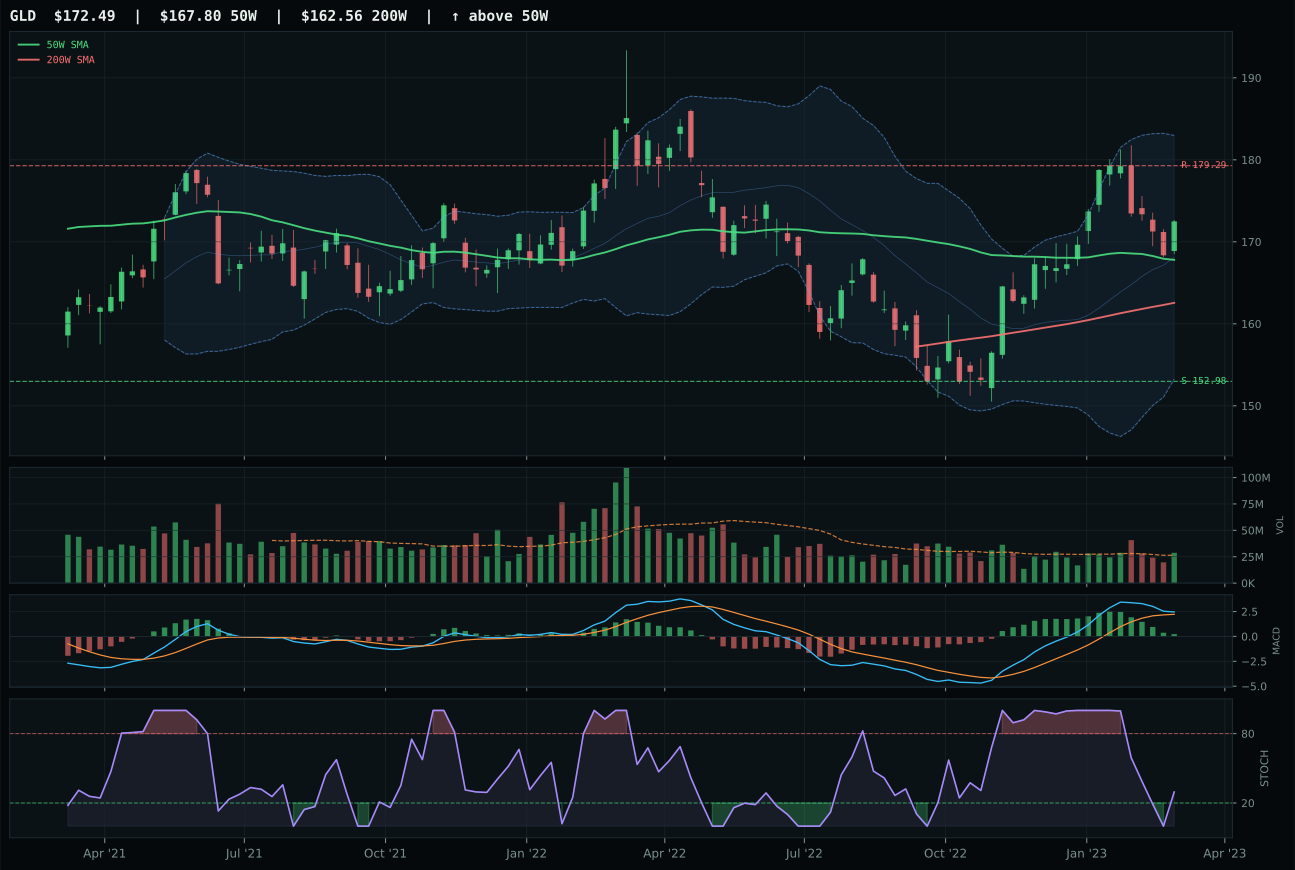
GLD has a compression near 50W profile with 3.8% 13-week relative strength versus SPY.
A failed hold above support would weaken the setup.
Actionable but governed by invalidation levels.
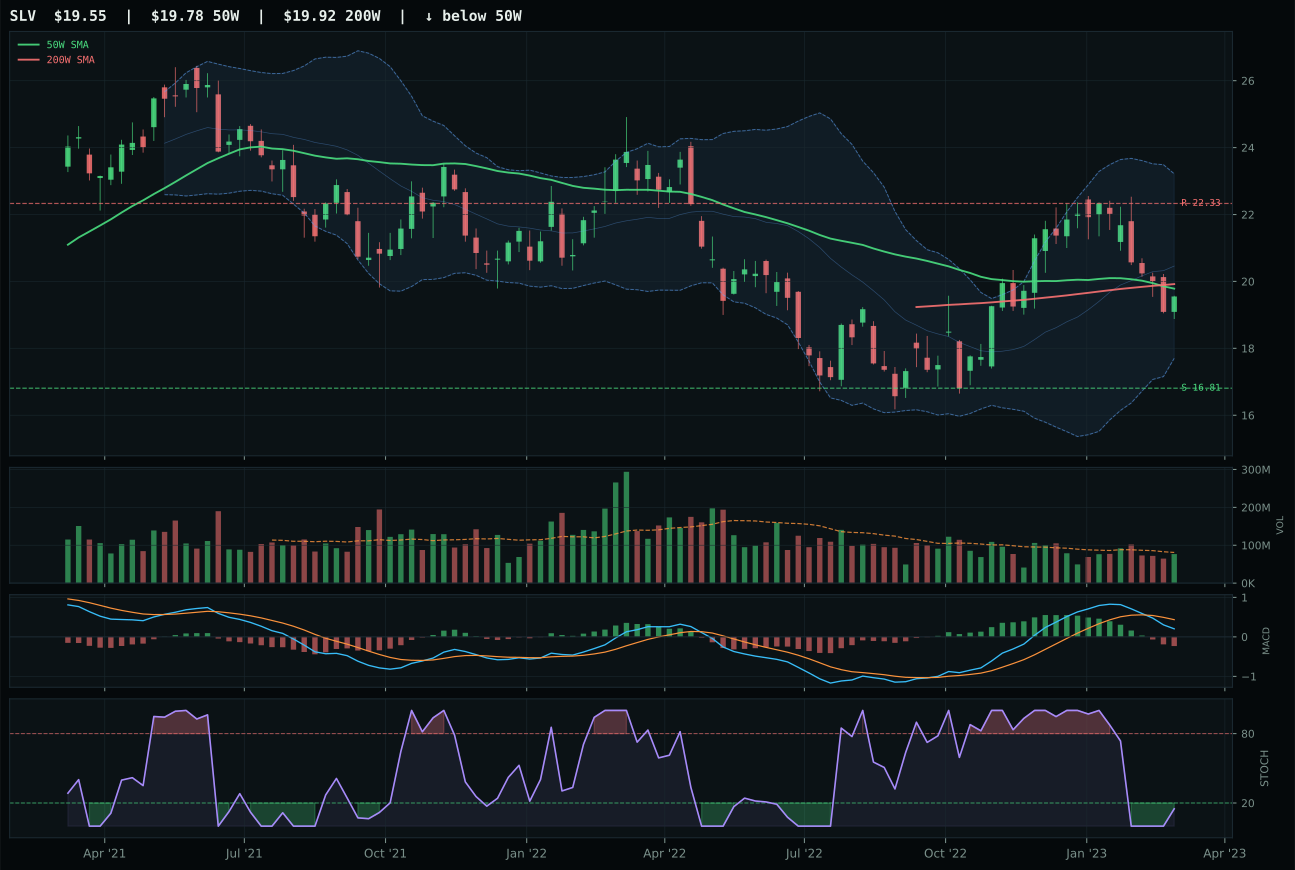
SLV has a compression near 50W profile with -7.5% 13-week relative strength versus SPY.
Extension and support failure are the main tactical risks.
Tracked, but not top-2 eligible because: structurally broken.
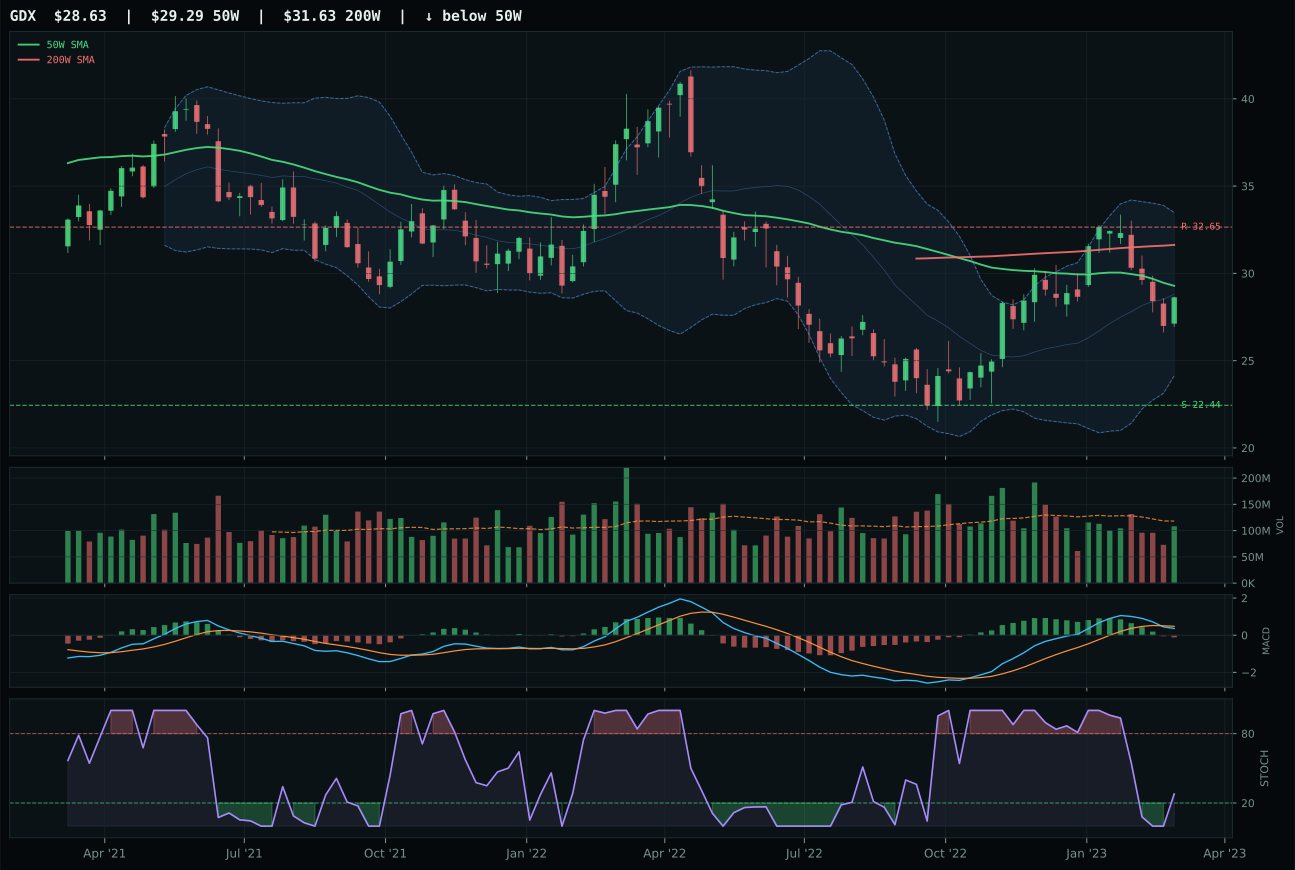
GDX has a compression near 50W profile with -3.6% 13-week relative strength versus SPY.
Extension and support failure are the main tactical risks.
Tracked, but not top-2 eligible because: structurally broken.
GLD dominated Precious Metals with a 81.3-point margin over SLV by preserving technical validity while silver deteriorated structurally. GLD's 80.7 technical evidence versus SLV's 0.0 hard-filter knockout tells the story: GLD trades above 50W and 200W with bullish MACD and compression setup intact, while SLV's bearish/weakening MACD paired with -3.9% category-relative underperformance and structural breakdown triggered disqualification. The 3.8% SPY-relative strength in gold, paired with 7.4% category-relative advantage, created a compounding outperformance signal that proved impossible for silver to contest. GLD's 100.0 timing score from distance-to-50W at 2.8%, Fib location in decision zone, and neutral stochastic RSI at 0.30 offered a clean entry into monetary hedge positioning without extended valuation.
Precious Metals earned 10% allocation on GLD's 35.4 category score because the 68.0 macro fit—highest among all weak categories—reflected the portfolio's need for a monetary hedge bid (+14) and disinflation pressure (+8 positive for gold) as credit stress and liquidity stress threaten equity duration. Gold's falling-neutral stochastic RSI at 0.30 signals no immediate overbought exhaustion despite the 3.1% 13W gain, and the 12.8% downside support cushion at 152.98 provides defensive asymmetry appropriate for a 10% barbell position. This allocation protects against tail-risk deterioration in credit spreads or sudden equity volatility while avoiding over-commitment to a category where relative strength versus SPY is only 3.8%. The position is intentionally modest and defensive—a volatility brake rather than a convex bet.
Agriculture & Livestock — MOO
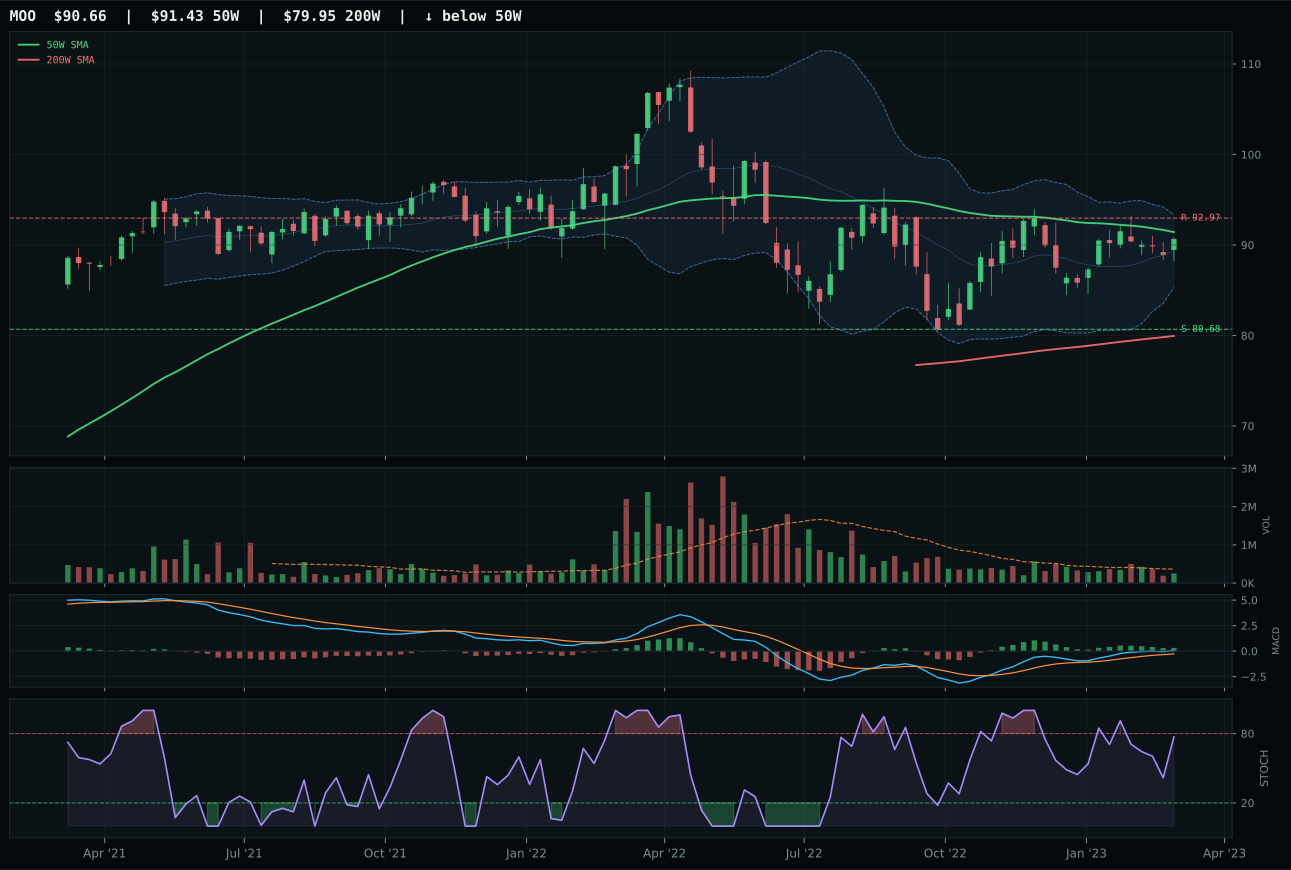
MOO has a compression near 50W profile with -1.8% 13-week relative strength versus SPY.
A failed hold above support would weaken the setup.
Actionable but governed by invalidation levels.
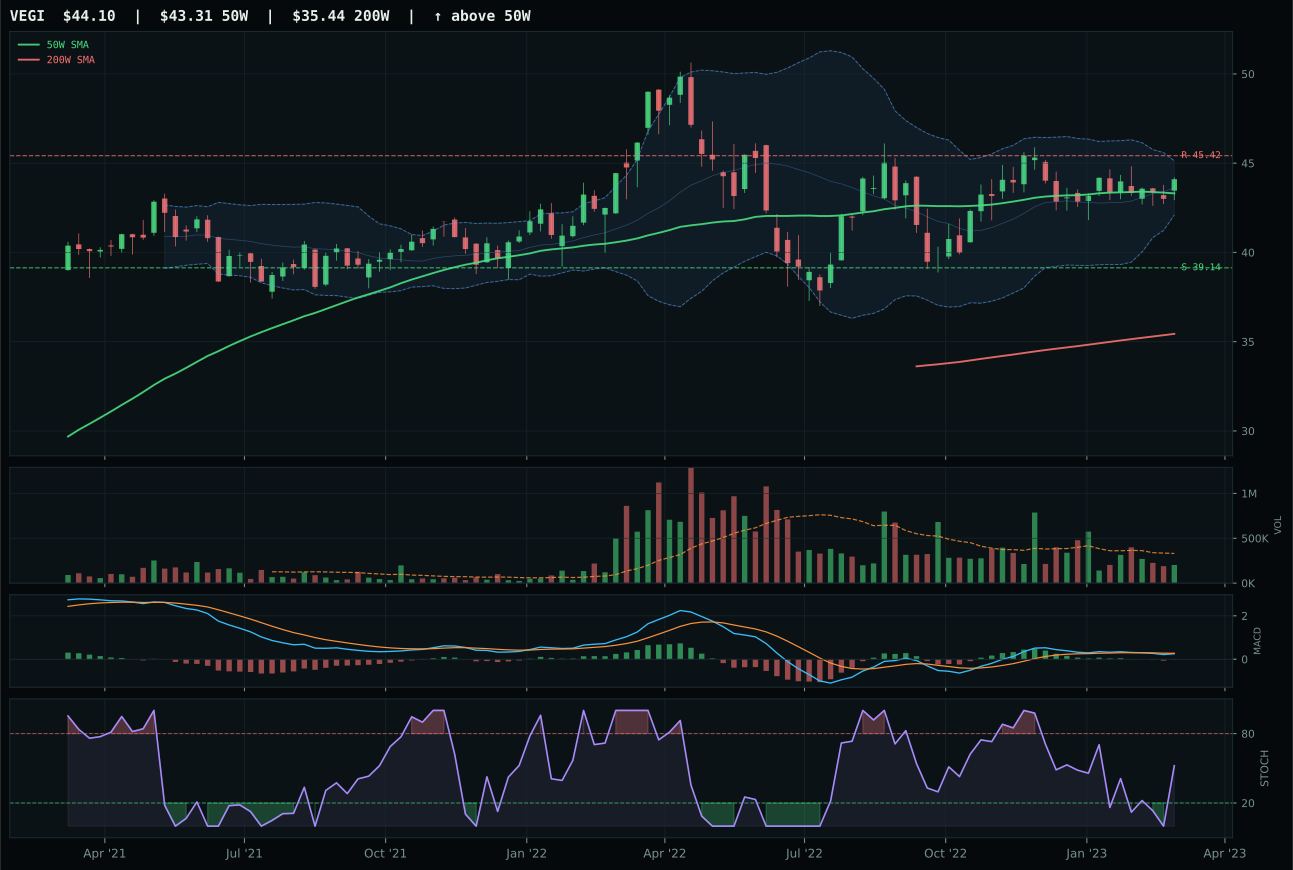
VEGI has a compression near 50W profile with -2.0% 13-week relative strength versus SPY.
A failed hold above support would weaken the setup.
Actionable but governed by invalidation levels.
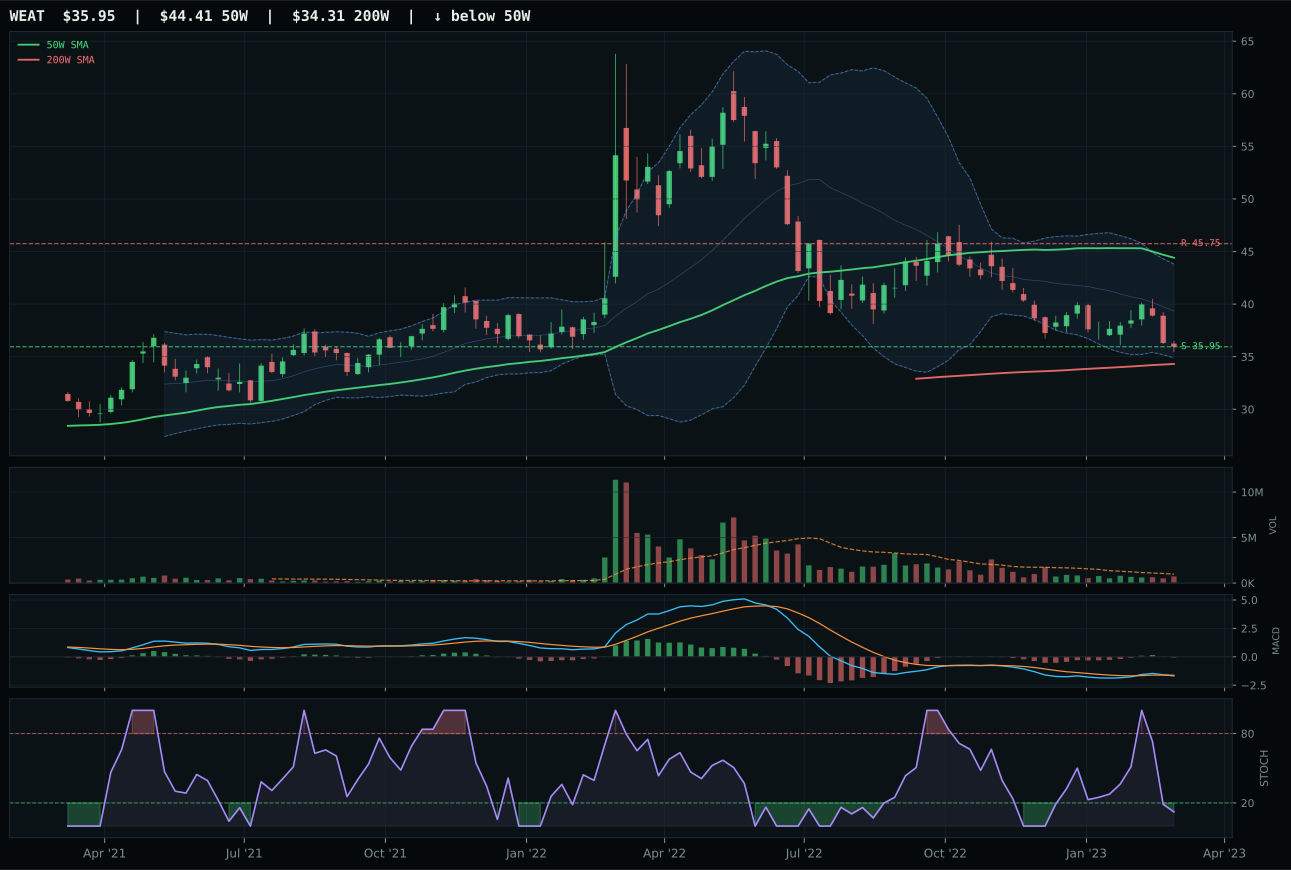
WEAT has a pullback into support profile with -6.3% 13-week relative strength versus SPY.
A failed hold above support would weaken the setup.
Actionable but governed by invalidation levels.
MOO won Agriculture & Livestock as the lesser-damaged combatant in a weak category by preserving technical purity through timing perfection while competitors deteriorated. Price at -0.8% from the 50W with compression setup earned a perfect 100.0 timing score; VEGI's bearish/weakening MACD disqualified it despite matching MOO's timing excellence at 100.0. The 0.2% category-relative strength edge over VEGI's flat 0.0% appears trivial until you examine volume: MOO's thin participation at 0.69x is neutral resistance, while VEGI's thin participation pairs with bearish MACD—suggesting distribution rather than accumulation. Fibs deep in value zone (0.618) provide psychological support, and MOO's bullish-but-flattening MACD preserves upside optionality even if breadth deteriorates further.
Agriculture received 10% allocation despite the lowest category score at 29.2 because disinflation regime creates demand for real assets as carry alternatives, and MOO's compression setup near support offers zero-cost optionality on commodity breadth stabilization. The macro fit of 45.0 is depressed by -8 disinflation pressure penalty (deflation hurts commodity producers), but real asset sponsorship active at +5 offsets half the damage. At 10%, this is a residual portfolio hedge rather than conviction capital; the category represents defensive barbell positioning against concentrated technology/AI allocations. MOO's 6.0 technical evidence score is weak on absolute grounds, but relative to VEGI (44.6) and WEAT (below 30), it represents the only setup with preserved trend structure and bullish MACD, making it the least-bad vehicle for commodity exposure if stagflation resurfaces.
Emerging Markets — IEMG
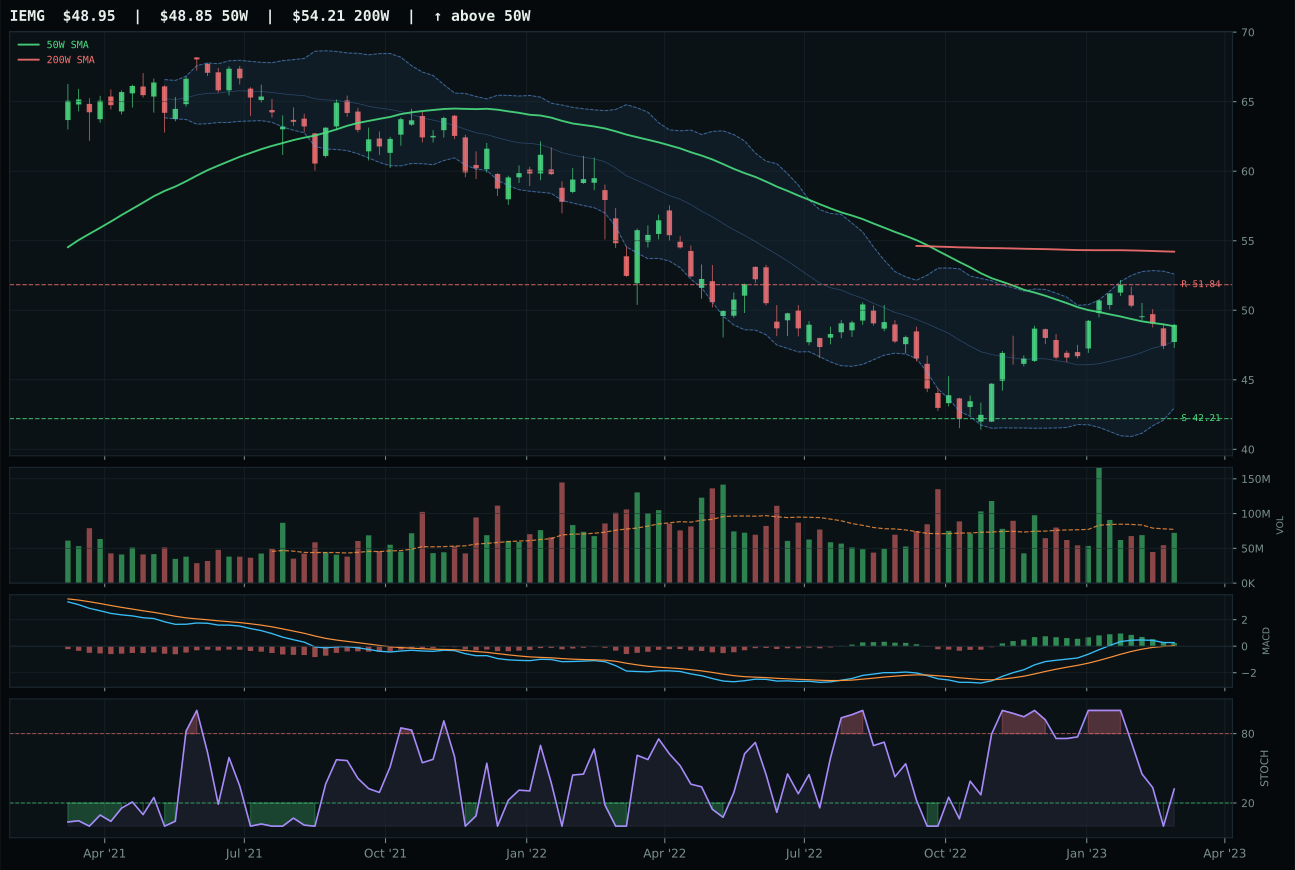
IEMG has a compression near 50W profile with 1.2% 13-week relative strength versus SPY.
A failed hold above support would weaken the setup.
Actionable but governed by invalidation levels.
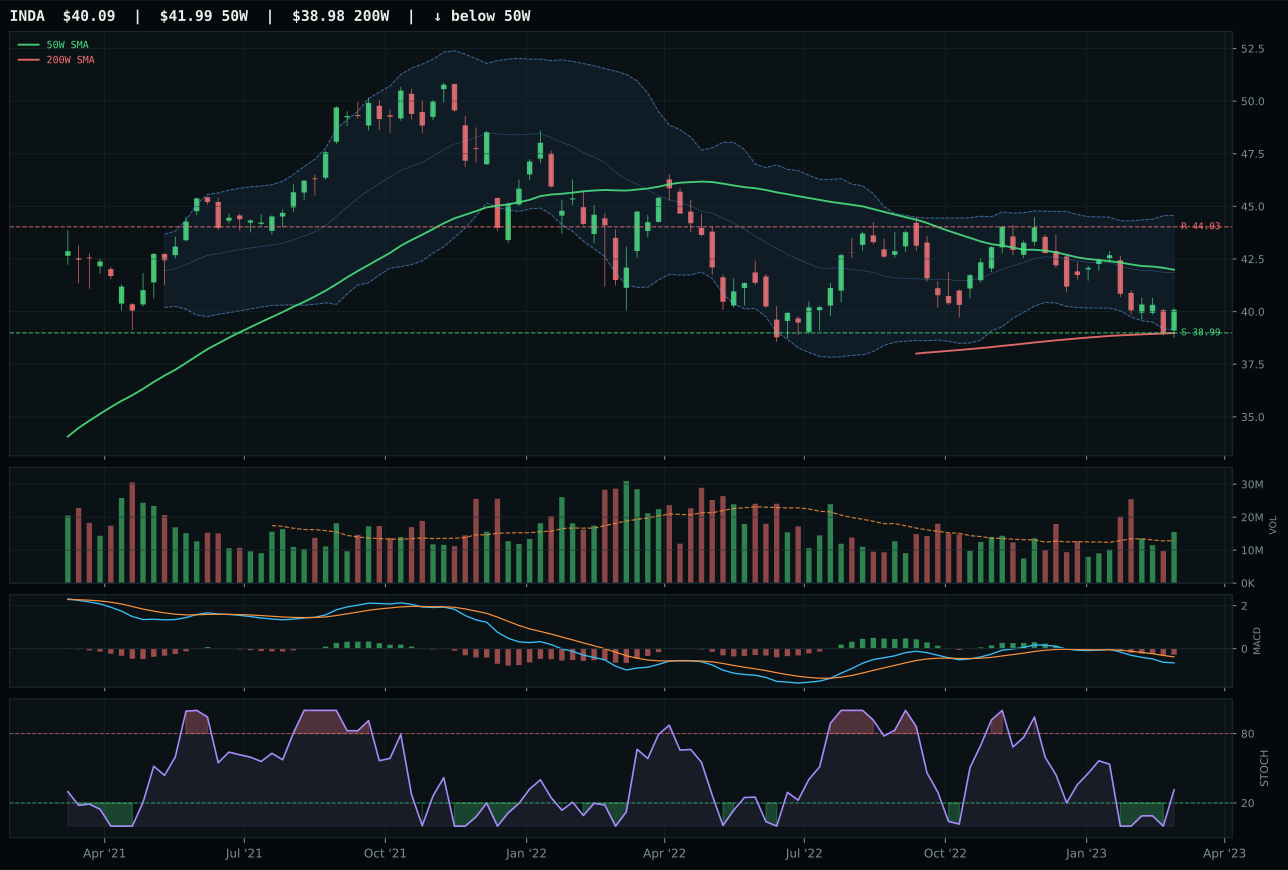
INDA has a pullback into support profile with -8.2% 13-week relative strength versus SPY.
A failed hold above support would weaken the setup.
Actionable but governed by invalidation levels.
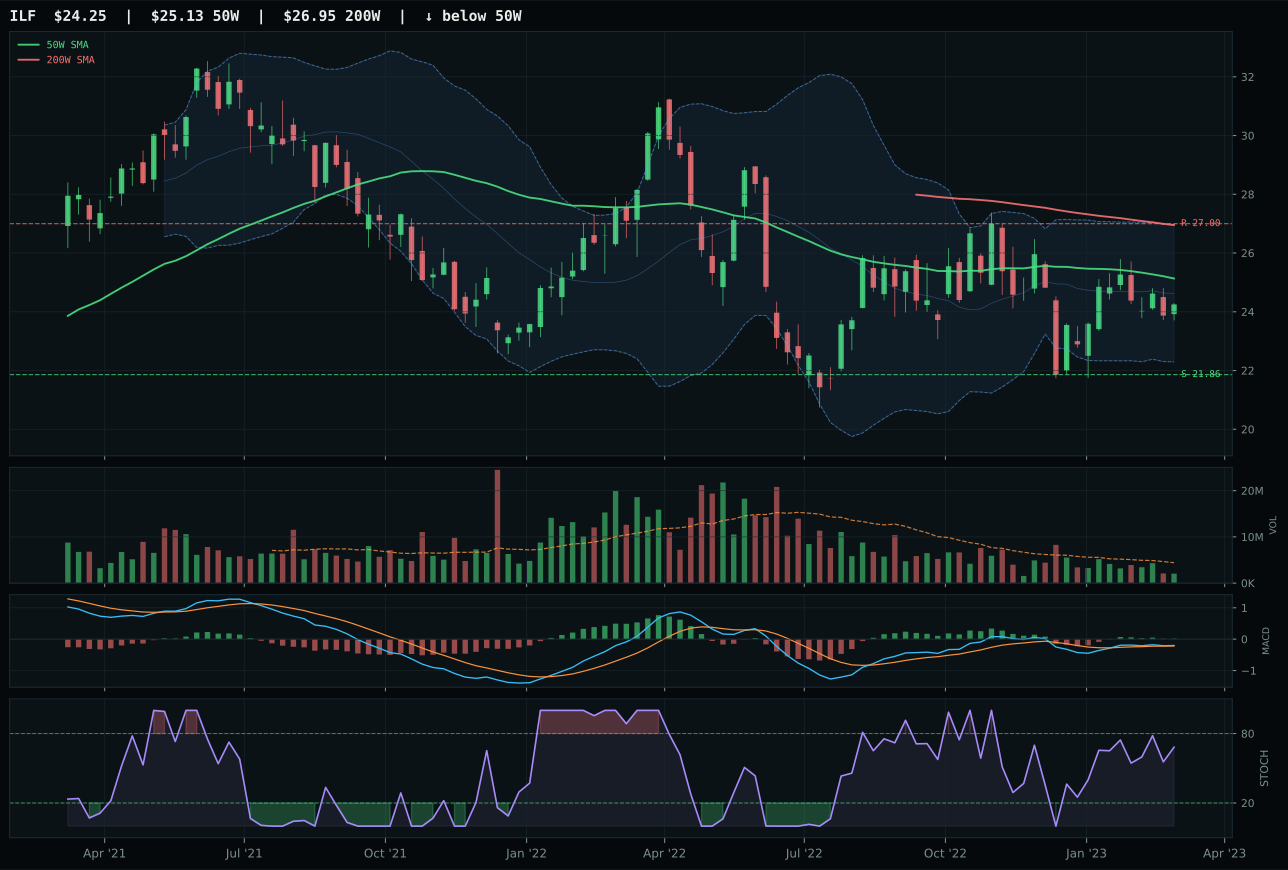
ILF has a neutral structure profile with -5.9% 13-week relative strength versus SPY.
Extension and support failure are the main tactical risks.
Tracked, but not top-2 eligible because: structurally broken.
IEMG won Emerging Markets by combining a near-perfect 95.0 timing score with 7.1% category-relative strength that INDA and ILF could not match despite IEMG's weakness versus SPY at +1.2%. Price at 0.2% from the 50W with compression setup and middle retracement Fib zone created the category's ideal re-entry geometry, while INDA's bearish/weakening MACD and pullback-into-support setup signaled that India-specific growth narratives had deteriorated faster than broad emerging-market breadth. IEMG's 70.2 technical evidence versus INDA's 12.0 hard-filter failure (breakdowns trigger scoring penalties) created an insurmountable gap even though INDA's 13W return of -8.9% meant broader emerging-market assets suffered less damage. Stochastic RSI at 0.32 falling/neutral across both winners suggests momentum washout has completed; IEMG's broader exposure insulates it from single-country concentration risk.
Emerging Markets earns 0% allocation and ranks tenth at 18.1, the second-lowest category score, because macro headwinds are severe: credit stress at -10 combined with liquidity stress at -10 create a -20 macro drag that even +8 risk appetite positive cannot offset. The category macro fit of 38.0 reflects that the disinflation regime and credit/liquidity stress are actively hostile to risk-on emerging-market exposure. IEMG's technical evidence of 70.2 is decent—the compression setup is clean and volume is neutral—but technical excellence cannot overcome macro rejection. The reasoned ETF proof order places IEMG at 60.8 versus ILF at 42.0 and INDA at 21.1, showing clear leadership within a basket of weaklings. Do not hold this category; the macro regime has turned against it, and even the cleanest technical setup offers inadequate compensation for systematic headwinds.
Traditional Energy — XLE
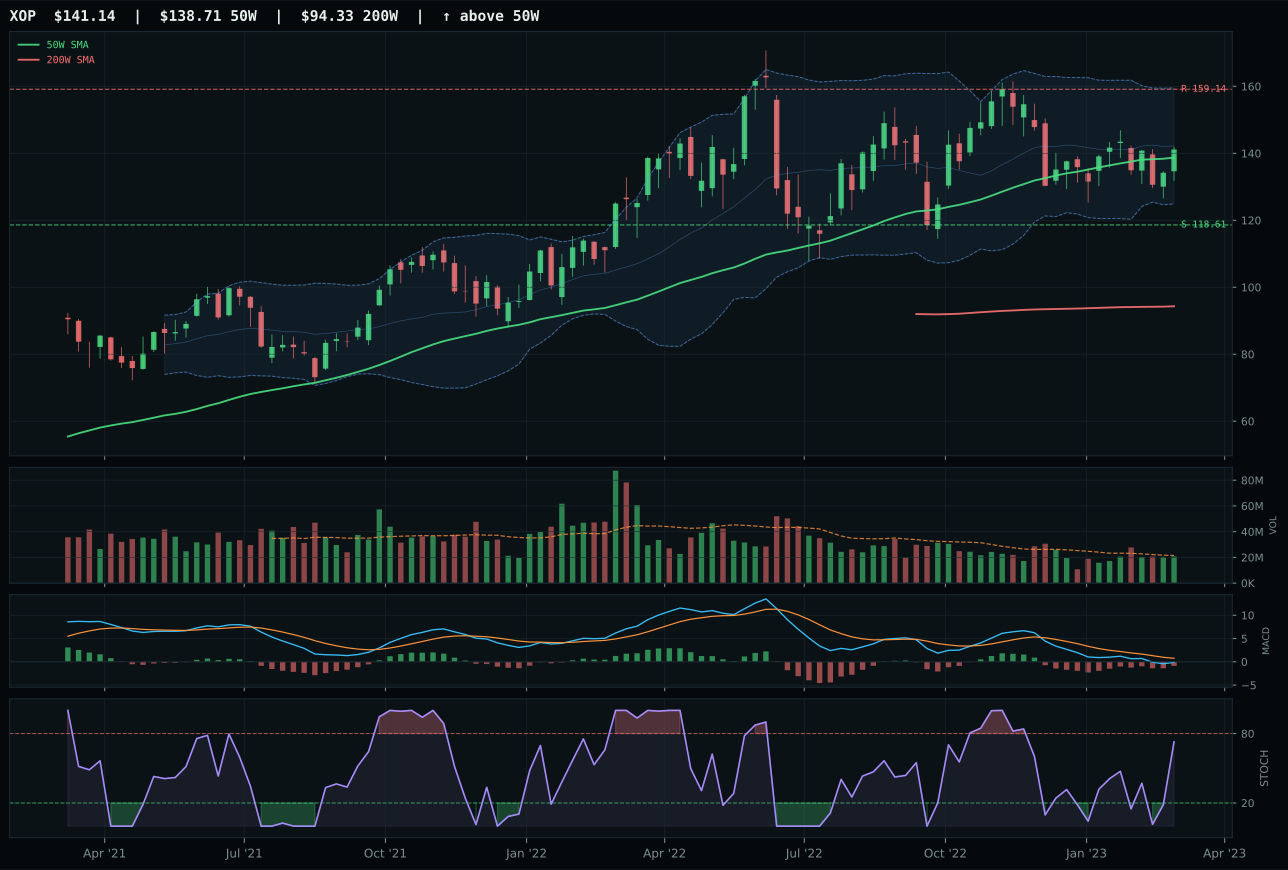
XOP has a compression near 50W profile with -3.9% 13-week relative strength versus SPY.
A failed hold above support would weaken the setup.
Actionable but governed by invalidation levels.
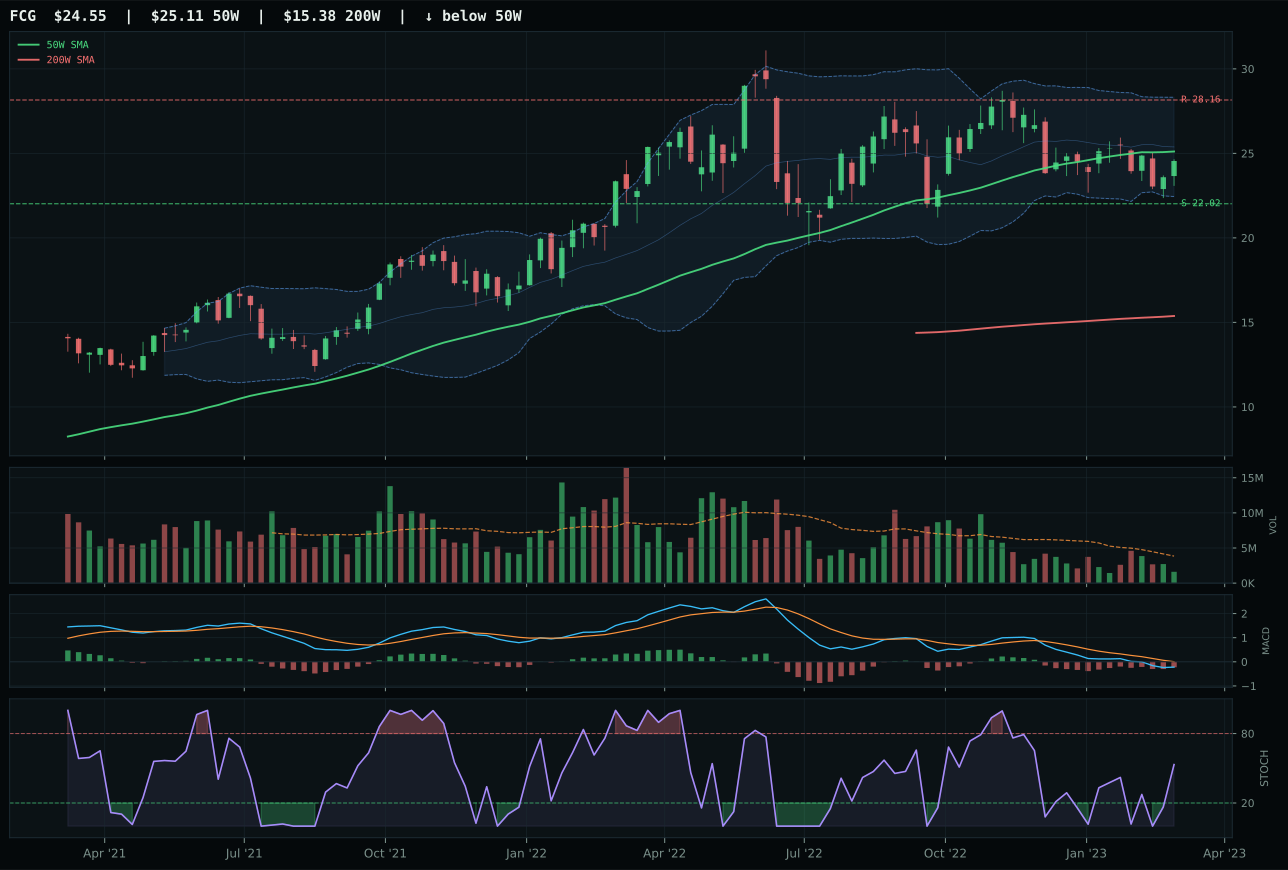
FCG has a compression near 50W profile with -7.3% 13-week relative strength versus SPY.
A failed hold above support would weaken the setup.
Actionable but governed by invalidation levels.
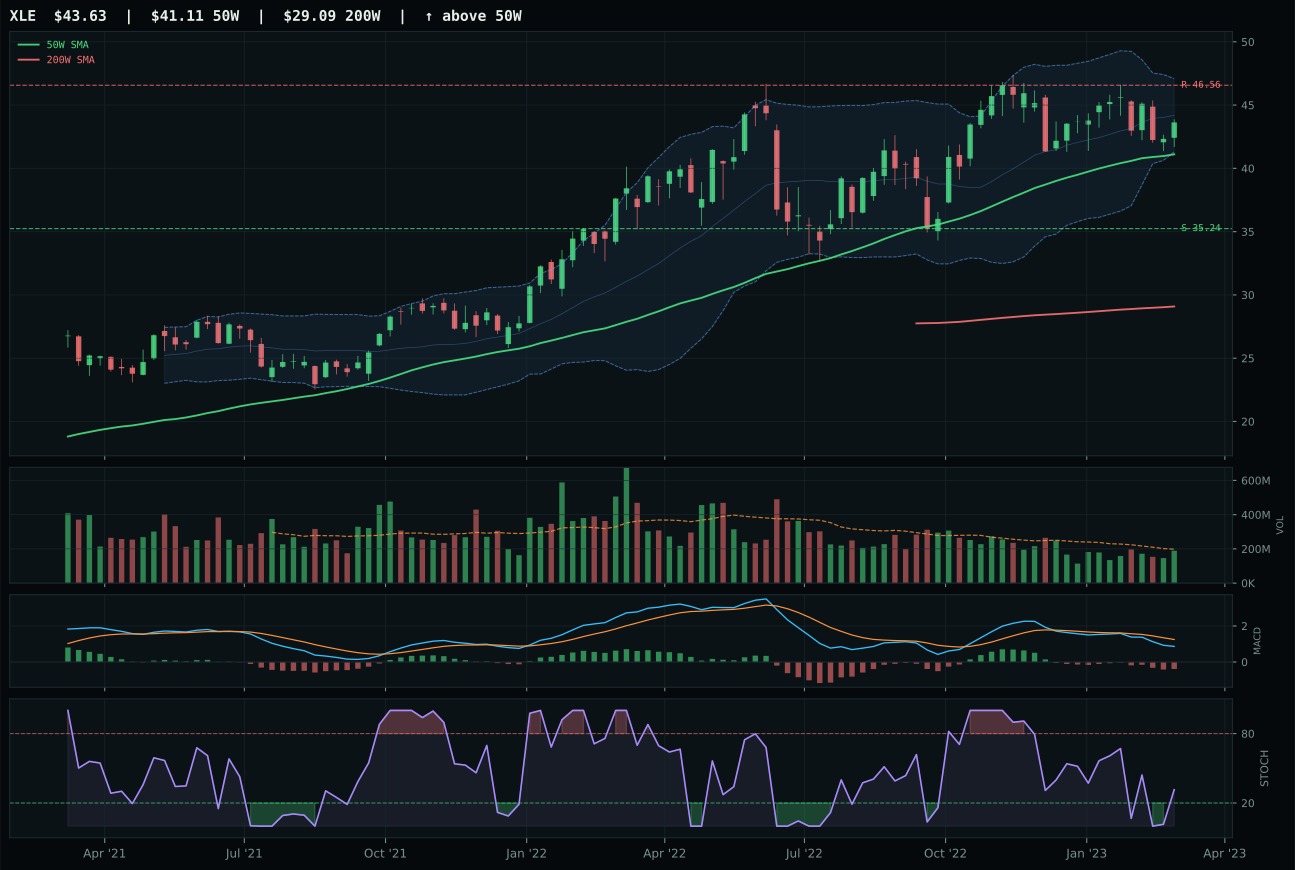
XLE has a neutral structure profile with -2.7% 13-week relative strength versus SPY.
A failed hold above support would weaken the setup.
Actionable but governed by invalidation levels.
XLE won Traditional Energy leadership as the least-broken chart in a category structurally harmed by disinflation headwinds, earning 10.5 final score despite representing poor risk/reward at the portfolio level. XLE's 79.9 structure score and neutral cleanliness at 83.3 meant price compression remained intact even as MACD turned bearish/weakening and stochastic RSI fell to 0.32, whereas XOP's compression setup deteriorated and FCG's structure showed visible weakness. The 6.1% distance above the 50W provided buffer room on a potential retest, while support at 35.24 offers 23.8% downside if demand signals finally crack. XOP's category-relative strength of 0.0% versus XLE's 1.2% proved marginal but decisive; both charts showed bearish momentum, but XLE's technical deterioration was one step behind XOP's, making it the marginally better tactical hold if forced to own energy exposure.
Traditional Energy earns 0% allocation because it ranks ninth at 10.5, crushed by macro headwinds in the disinflation regime where the -10 impact of disinflation pressure combined with -7 credit stress and -7 liquidity stress creates a -24 macro headwind that even +7 from real asset sponsorship cannot overcome. The category macro fit of 23.0 is the weakest in the portfolio, and XLE's technical evidence of only 42.1 reflects that the setup is neither compelling nor clean. Thirteen-week performance of -3.4% with negative SPY-relative strength and a bearish/weakening MACD means demand destruction is real, not cyclical. Do not hold this category this week; the macro regime is actively hostile, and the technical setup offers no evidence of accumulation or reversal.