
2023-02-24
Informational purposes only. The content in this report, including allocations, analysis, and commentary, is provided solely for informational and educational purposes. It does not constitute financial advice, investment advice, trading advice, or any other type of advice. Past performance does not guarantee future results. Always conduct your own research and consult a qualified financial professional before making investment decisions.
Weekly Allocation
| Ticker | Category | Weight | Role |
|---|---|---|---|
| SMH | AI | 20% | Top-2 (20%) |
| ITA | Defense & Aerospace | 20% | Top-2 (20%) |
| XLK | Technology | 10% | Tier-2 (10%) |
| PAVE | Utilities & Infrastructure | 10% | Tier-2 (10%) |
| URA | Nuclear Energy | 10% | Tier-2 (10%) |
| COPX | Industrial Metals | 10% | Tier-2 (10%) |
| GLD | Precious Metals | 10% | Tier-2 (10%) |
| XLE | Traditional Energy | 10% | Tier-2 (10%) |
Trade Instructions — Monday Open
Sell the tranche from 2023-01-27 (completing its 4-week hold). Buy the new tranche. Instructions show net portfolio changes — same-asset positions cancel, weight changes show the delta.
| Action | Ticker | Instruction |
|---|---|---|
| SELL | REMX | Sell entire REMX position (5.00% of portfolio) |
| SELL | GLD | Sell 25% of GLD position (reduce 10.00% → 7.50%) |
| SELL | XAR | Sell 33% of XAR position (reduce 7.50% → 5.00%) |
| SELL | URNM | Sell 33% of URNM position (reduce 7.50% → 5.00%) |
| SELL | VEGI | Sell 50% of VEGI position (reduce 5.00% → 2.50%) |
| BUY | SMH | Buy SMH — 16.67% of freed cash (adds 2.50% to portfolio) |
| BUY | COPX | Buy COPX — 16.67% of freed cash (adds 2.50% to portfolio) |
| BUY | ITA | Buy ITA — 33.33% of freed cash (adds 5.00% to portfolio) |
| BUY | URA | Buy URA — 16.67% of freed cash (adds 2.50% to portfolio) |
| BUY | XLK | Buy XLK — 16.67% of freed cash (adds 2.50% to portfolio) |
Current Portfolio After Trade
Combined holdings across all 4 active tranches. Each tranche is 25% of the portfolio.
| Ticker | % of Portfolio | Weight Bar |
|---|---|---|
| SMH | 17.50% | |
| COPX | 12.50% | |
| PAVE | 10.00% | |
| CIBR | 10.00% | |
| GLD | 7.50% | |
| ITA | 7.50% | |
| XAR | 5.00% | |
| URNM | 5.00% | |
| IGV | 5.00% | |
| WEAT | 5.00% | |
| URA | 5.00% | |
| VEGI | 2.50% | |
| SLV | 2.50% | |
| XLK | 2.50% | |
| XLE | 2.50% |
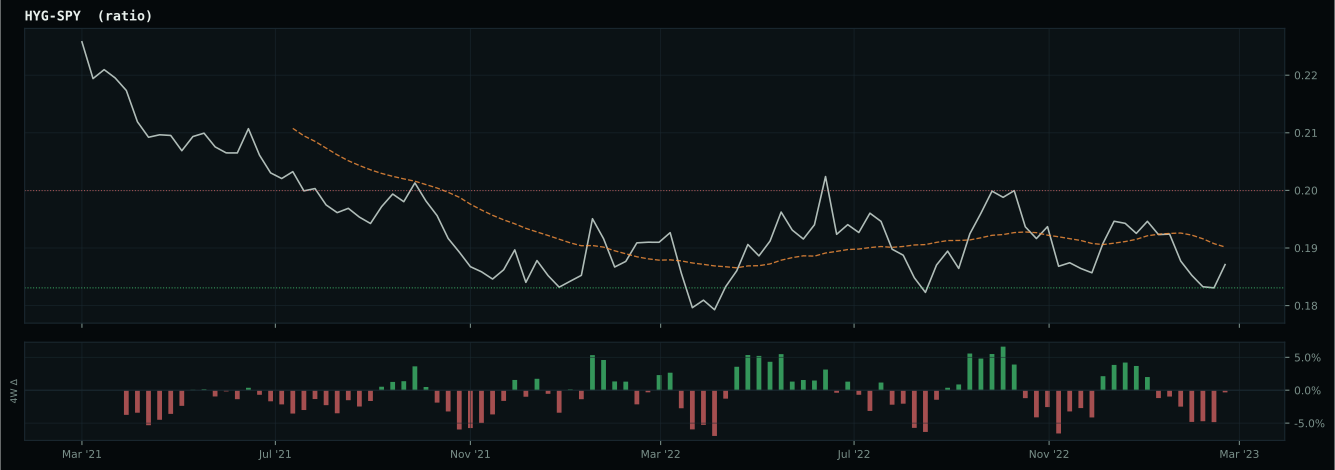
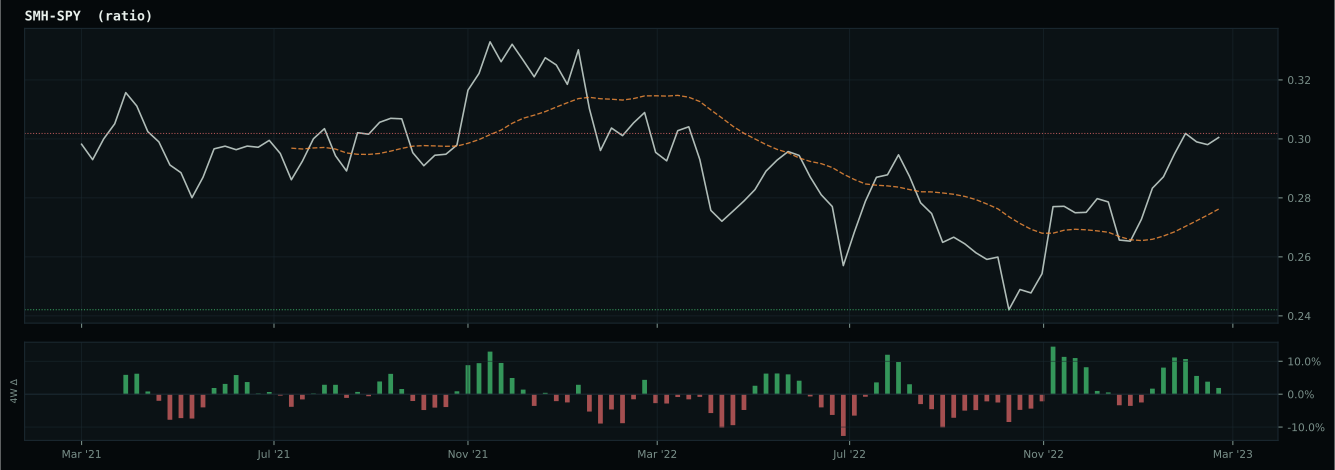
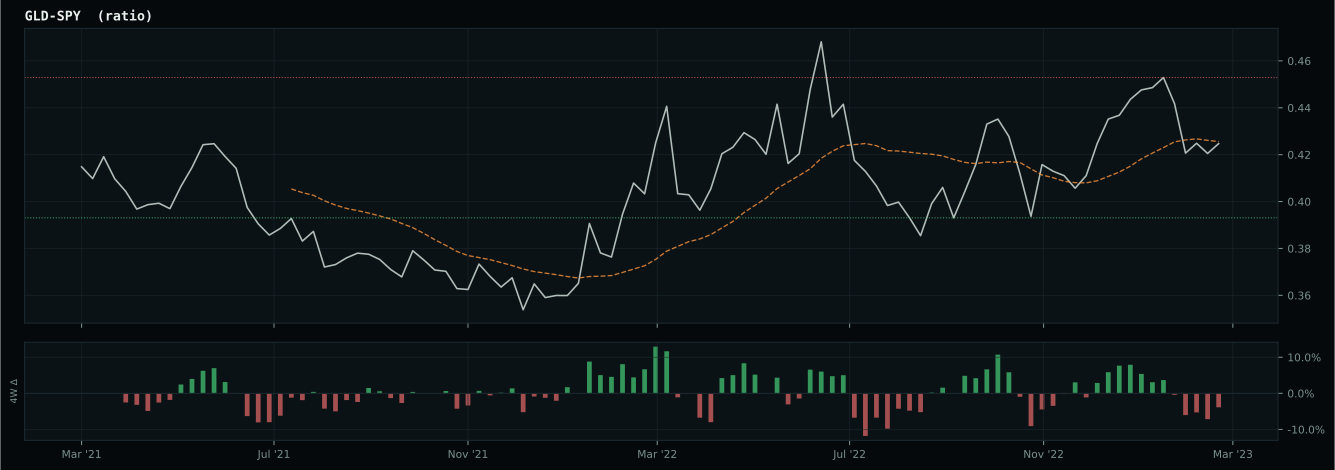
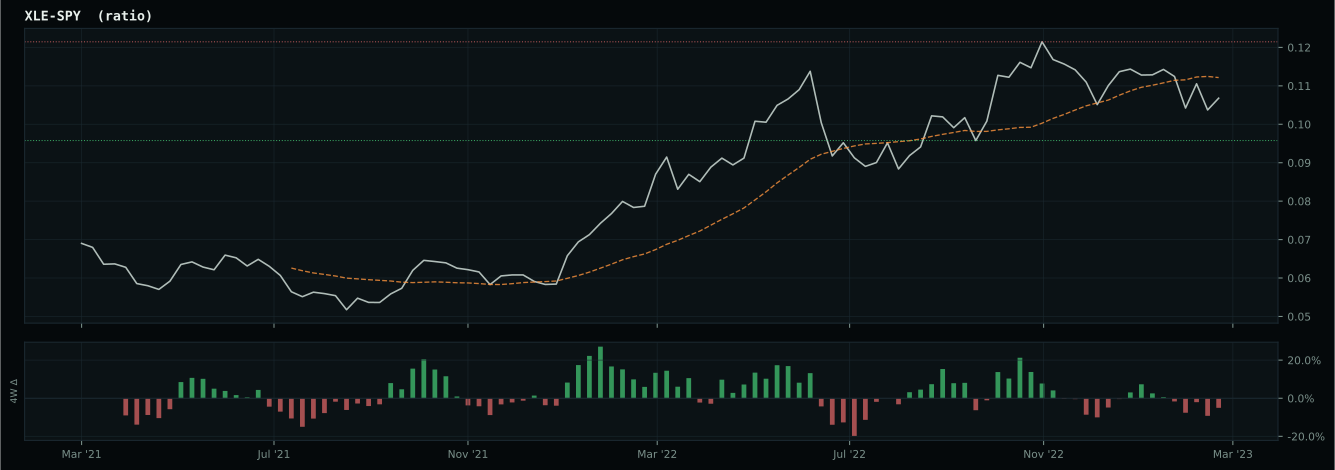
Macro Regime — Disinflation
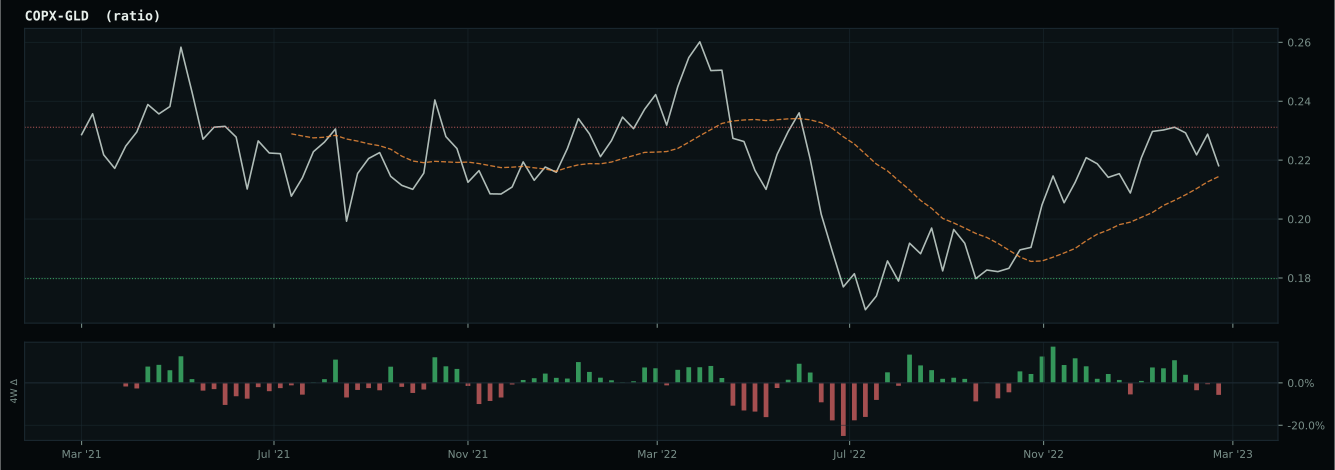
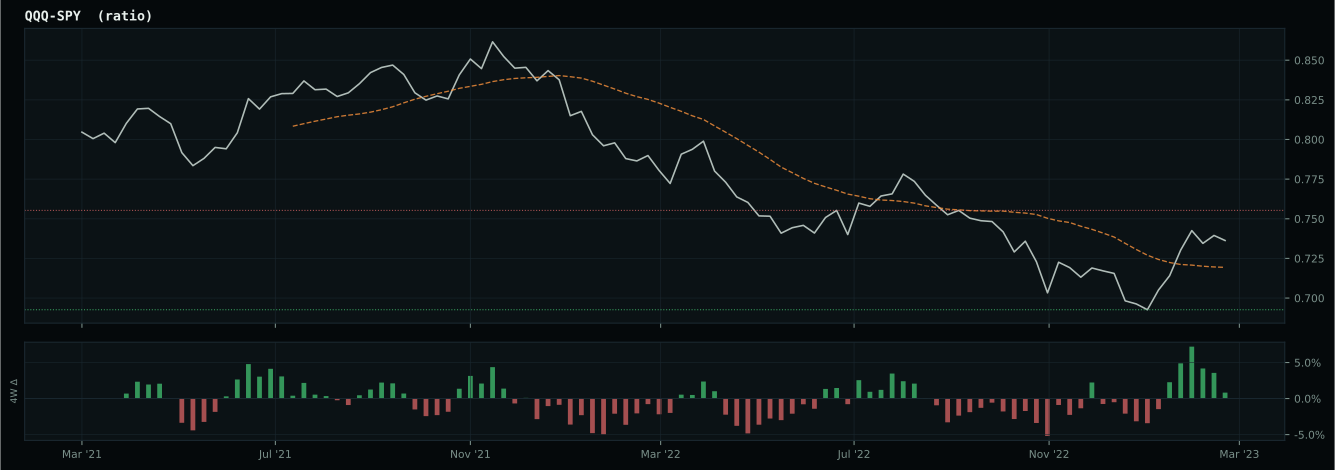
Macro Evidence Charts
Market-implied signals behind the macro regime scores. Each ratio compares two assets; the direction and slope of the ratio is what the macro engine reads.
Crypto Regime — NoCrypto
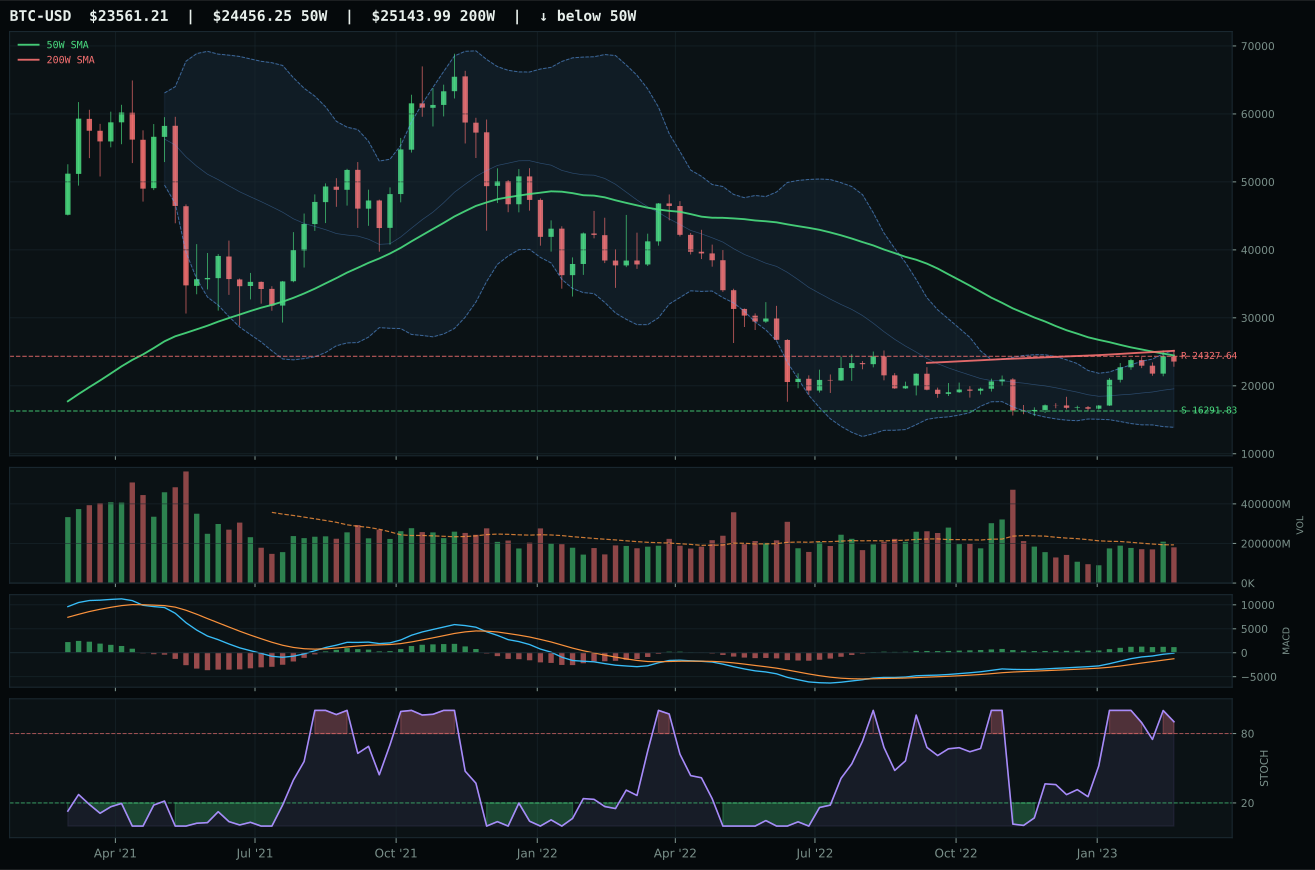
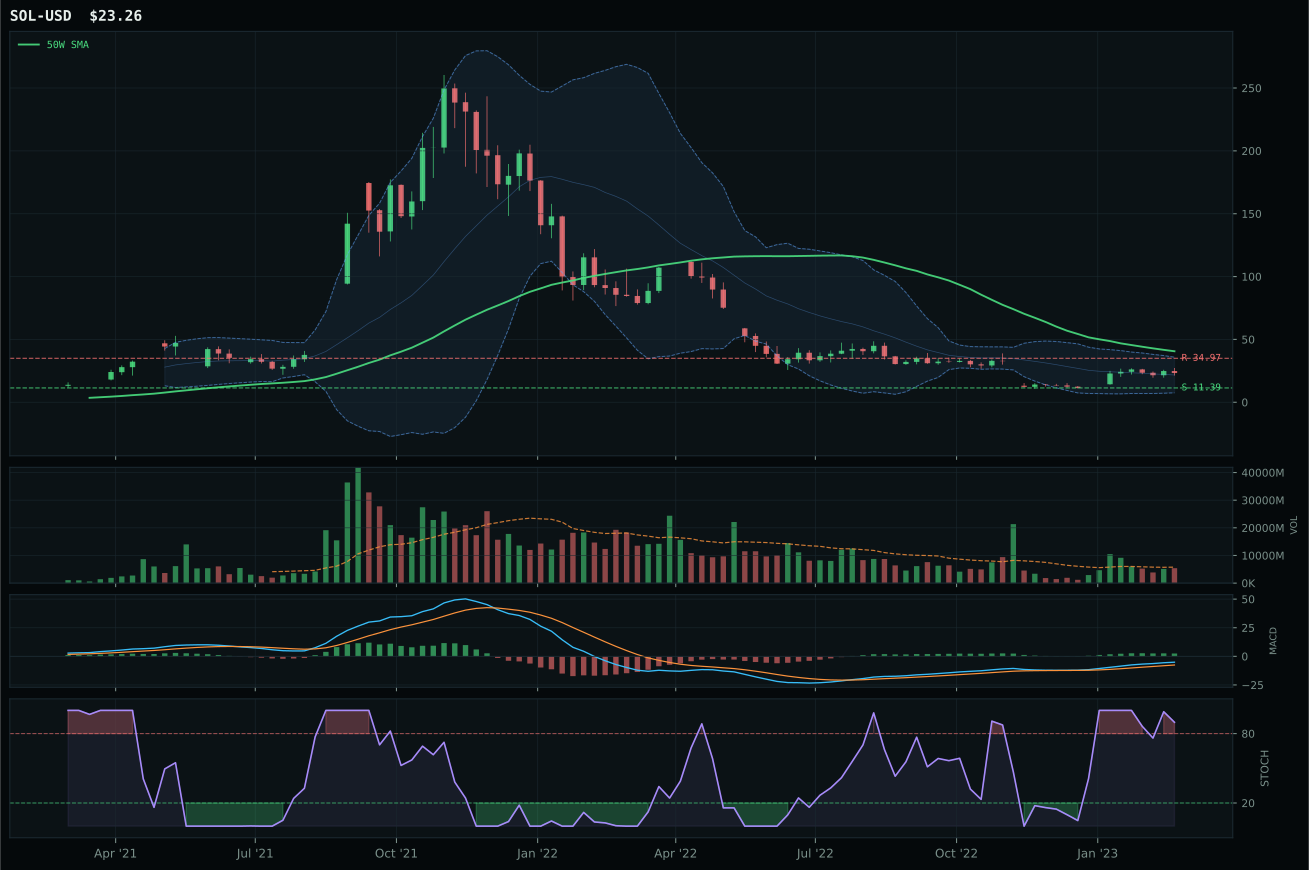
ValueBTC armed; waiting for 50W reclaim, decisive close above post-touch range resistance by 3%, close above 200W, breakout volume above 20W…
TrendBTC not confirmed
one or more available conditions failed
Category Rankings
| Rank | Category | Winner | Score | Alloc | 4W Ret | Peers (4W) |
|---|---|---|---|---|---|---|
| 1 | AI | SMH | 56.3 | 20% | +5.49% | BOTZ +3.6% · AIQ +3.8% |
| 2 | Defense & Aerospace | ITA | 54.4 | 20% | -3.36% | XAR -5.2% · ROKT -5.9% |
| 3 | Technology | XLK | 50.1 | 10% | +6.34% | CIBR -0.4% · IGV +3.7% |
| 4 | Utilities & Infrastructure | PAVE | 46.3 | 10% | -6.49% | IGF -1.6% · XLU -1.6% |
| 5 | Nuclear Energy | URA | 43.6 | 10% | -10.50% | URNM -13.1% · NLR -5.4% |
| 6 | Industrial Metals | COPX | 43.3 | 10% | -0.70% | PICK -3.3% · REMX -11.1% |
| 7 | Precious Metals | GLD | 35.2 | 10% | +7.27% | SLV +10.4% · GDX +13.8% |
| 8 | Agriculture & Livestock | MOO | 10.9 | 10% | -6.04% | WEAT -4.0% · VEGI -6.7% |
| 9 | Emerging Markets | INDA | 6.3 | 0% | -1.51% | ILF -4.9% · IEMG -0.3% |
| 10 | Traditional Energy | XLE | — | 0% | -7.21% | XOP -9.7% · FCG -9.2% |
AI — SMH
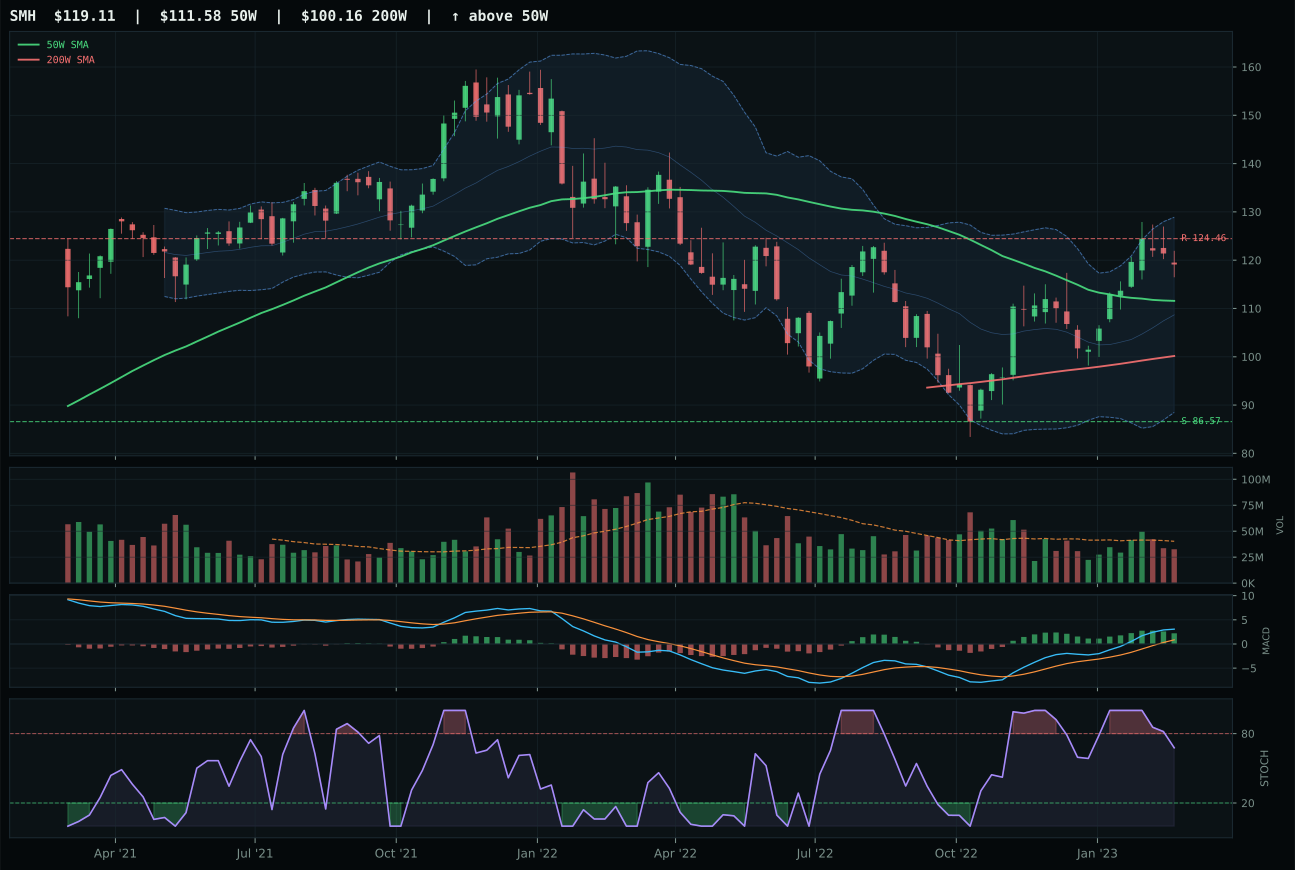
SMH has a neutral structure profile with 9.1% 13-week relative strength versus SPY.
A failed hold above support would weaken the setup.
Actionable but governed by invalidation levels.
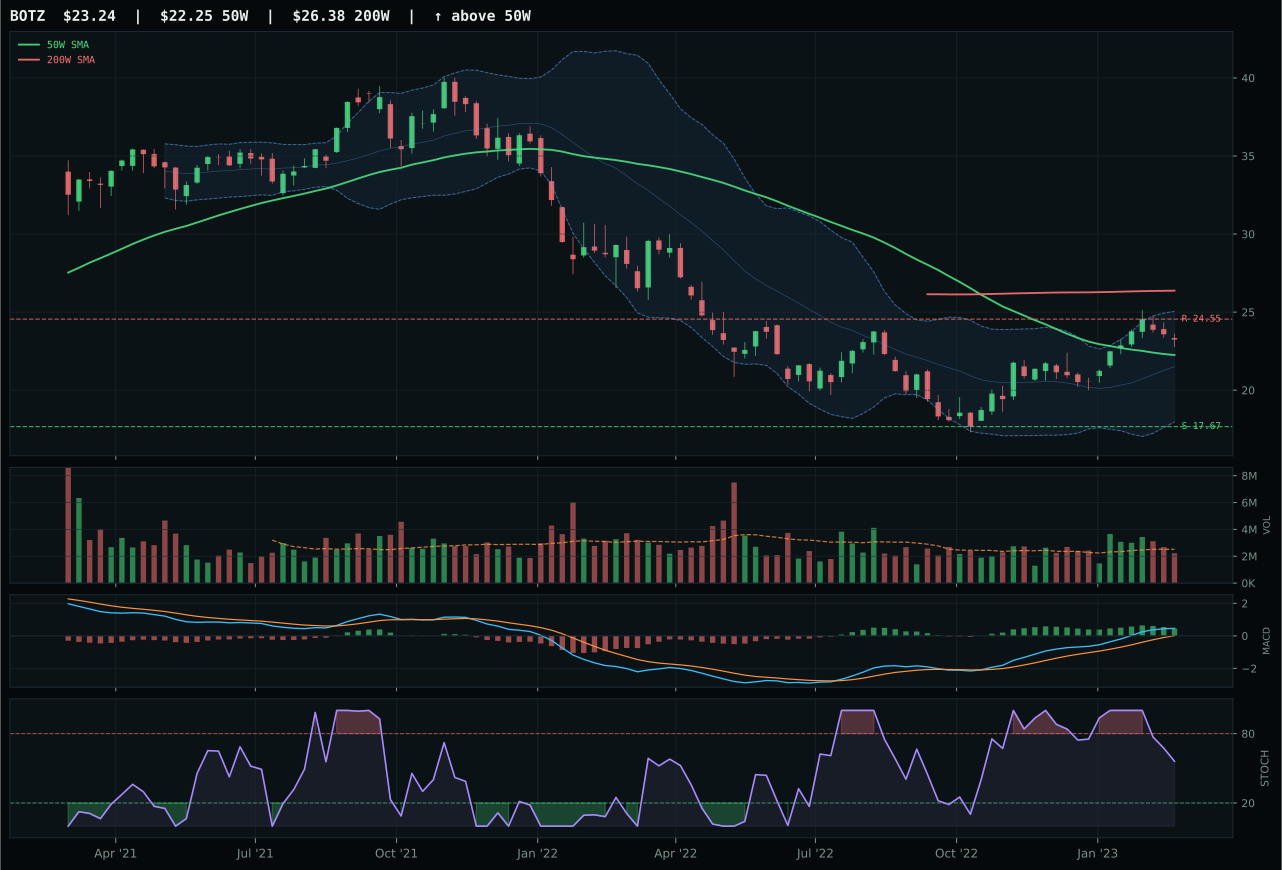
BOTZ has a neutral structure profile with 10.2% 13-week relative strength versus SPY.
A failed hold above support would weaken the setup.
Actionable but governed by invalidation levels.
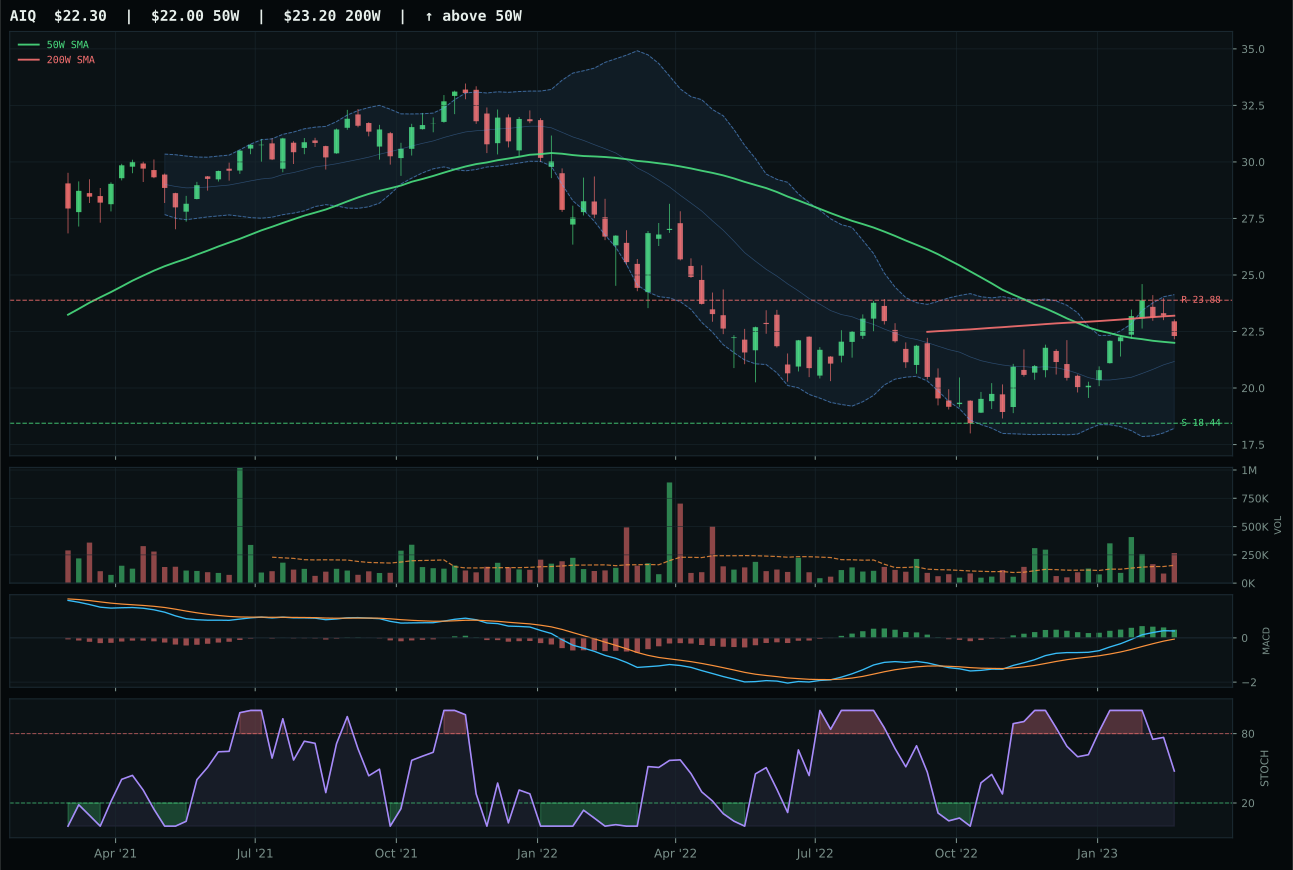
AIQ has a compression near 50W profile with 7.8% 13-week relative strength versus SPY.
A failed hold above support would weaken the setup.
Tracked, but not top-2 eligible because: .
SMH wins by executing the narrowest margin—just 1.0 point over BOTZ—yet it wins on technical rhythm and macro narrative fit. At 9.1% relative strength versus SPY and 7.7% thirteen-week return, SMH is pulling leadership with real conviction; BOTZ's 10.2% SPY relative strength superficially looks stronger, but it's paired with category-relative outperformance of 1.1%, meaning it's leaving SMH behind within its own peer cluster. The 6.7% distance from the 50W and neutral structure are identical setups, but SMH's superior macro fit—58.0 versus 47.0—tips the decision. Both have flattening MACD; the difference is that SMH's trend score of 86 reflects sustained positioning while BOTZ's 76 shows momentum already dispersing.
AI earned 20% allocation because it ranked second among all ten categories at 56.3, anchored by a deterministic technical read and the active macro descriptor 'AI growth sponsorship' worth plus 14 points. Disinflation actually helps this category—adding 5 points—because pricing power matters less when input costs are falling and capital remains patient. Liquidity stress subtracts 12, yet the macro fit still hits 59.0 out of 100. Risk appetite positive is active at plus 10. The combination of SMH's 7.7% thirteen-week return, broad chip demand from cloud capex, and the absence of credit stress in the semiconductor complex makes this the second-best risk-adjusted entry point in the portfolio this week.
Defense & Aerospace — ITA
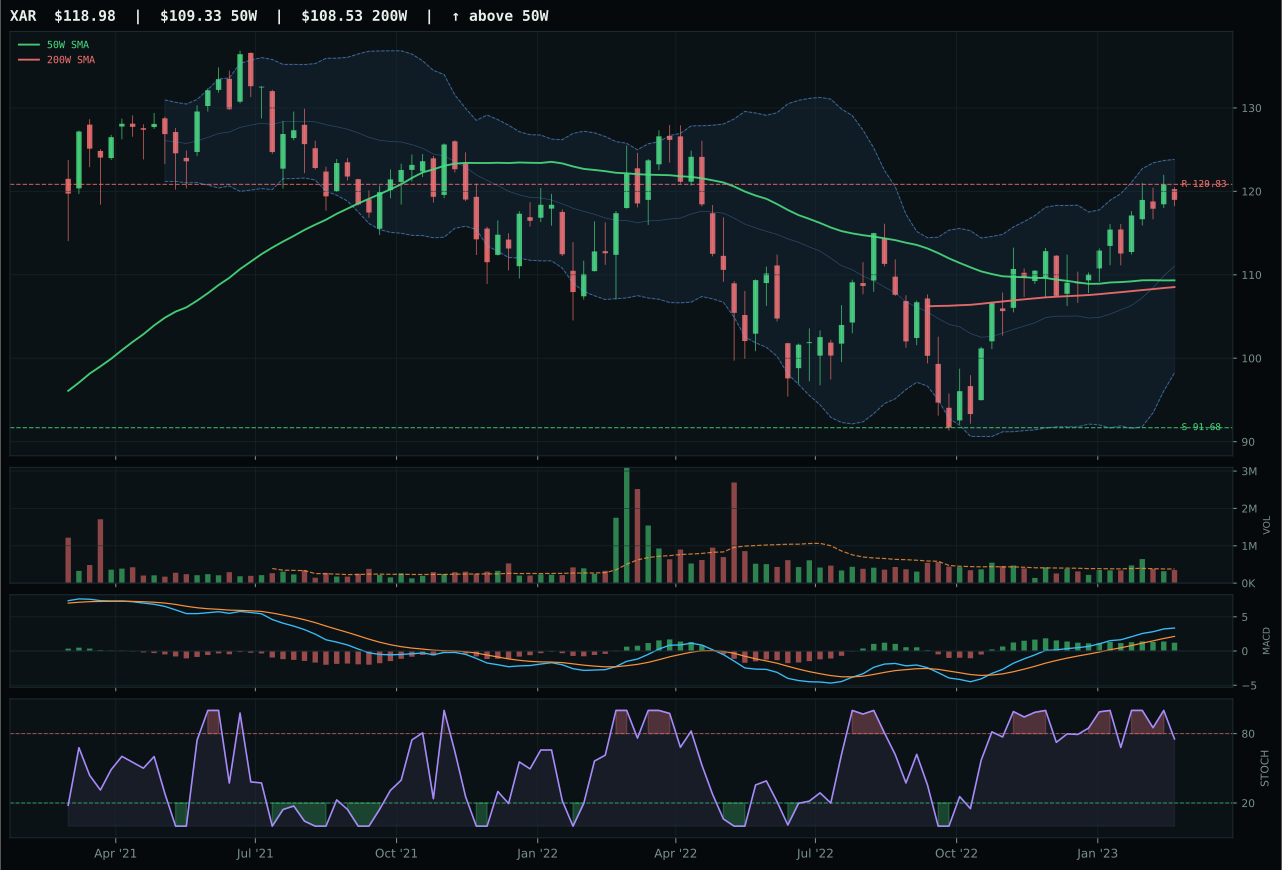
XAR has a neutral structure profile with 9.2% 13-week relative strength versus SPY.
A failed hold above support would weaken the setup.
Actionable but governed by invalidation levels.
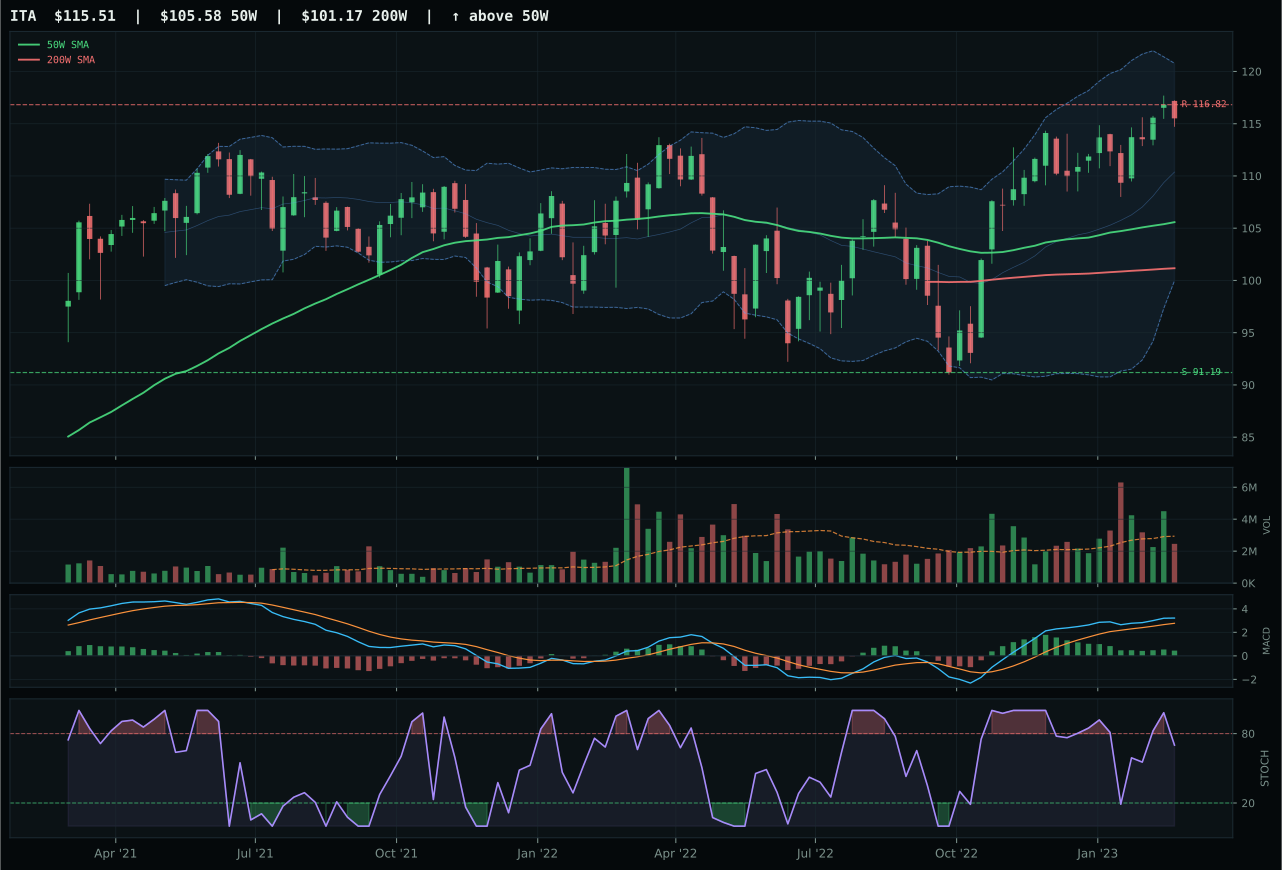
ITA has a neutral structure profile with 5.0% 13-week relative strength versus SPY.
A failed hold above support would weaken the setup.
Actionable but governed by invalidation levels.
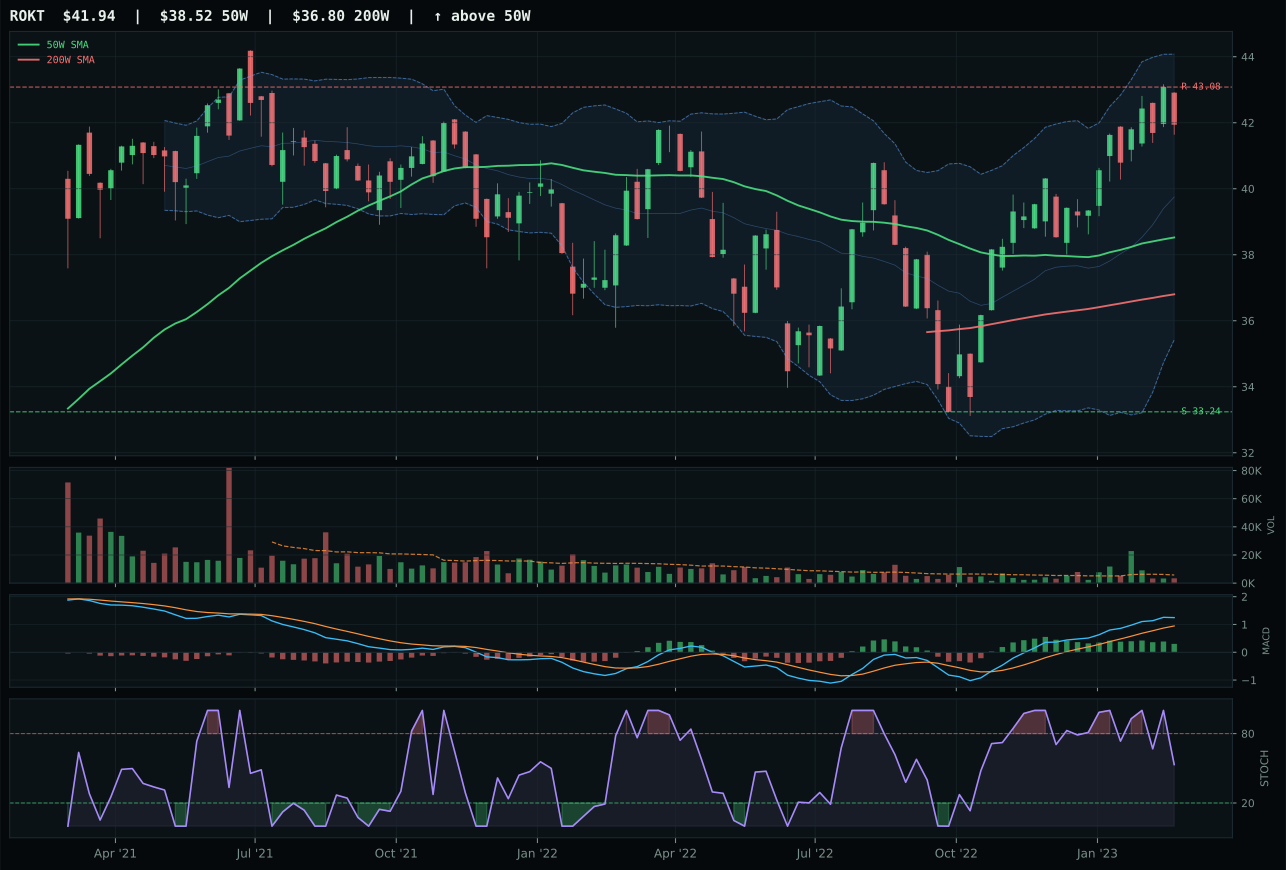
ROKT has a neutral structure profile with 7.6% 13-week relative strength versus SPY.
A failed hold above support would weaken the setup.
Tracked, but not top-2 eligible because: .
ITA wins because it has achieved something rarer than momentum—it has executed a perfect trend setup at an extended distance. Price is 9.4% above the 50W with a positive slope of 0.2%, and stochastic RSI is rising mid-zone, all signaling that the move is still in control despite the extension. The 100.0 trend score is earned, not lucky. XAR looks superior on first inspection—9.2% SPY relative strength and a composite score of 80—but it failed on timing: its stochastic RSI is falling/neutral, and timing scored just 70 versus ITA's 78. When an extended name is still showing rising stochastic RSI and a positive 50W slope, it's commanding the trend. XAR's falling oscillator tells us the wave is weakening even if price is still high.
Defense & Aerospace earned 20% allocation because it ranked first among all categories at 54.4, propelled by ITA's flawless trend setup and a neutral macro environment where defensive positioning does not require a specific tailwind. The category macro fit of 51.0 is unremarkable—no strong bull case, no recession panic—but the technical evidence from a 3/2/1 weighted basket is decisive at 72.5. Credit stress is slightly positive at plus 2, and liquidity stress subtracts only 4 points. With ITA showing a perfect 100 trend score and 5.0% SPY relative strength, this is the portfolio's only pure technical winner this week, requiring no macro conviction or narrative justification.
Technology — XLK
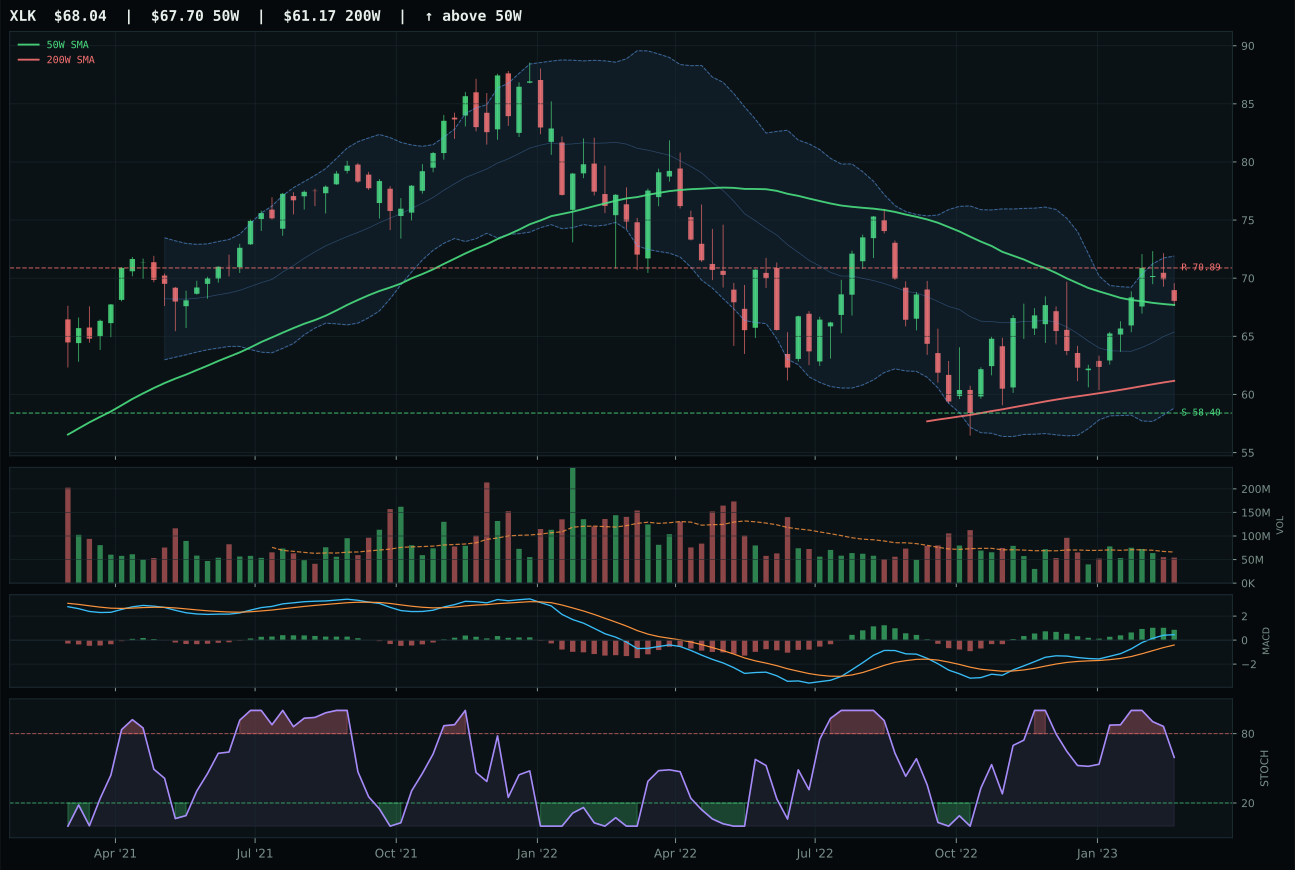
XLK has a compression near 50W profile with 3.3% 13-week relative strength versus SPY.
A failed hold above support would weaken the setup.
Actionable but governed by invalidation levels.
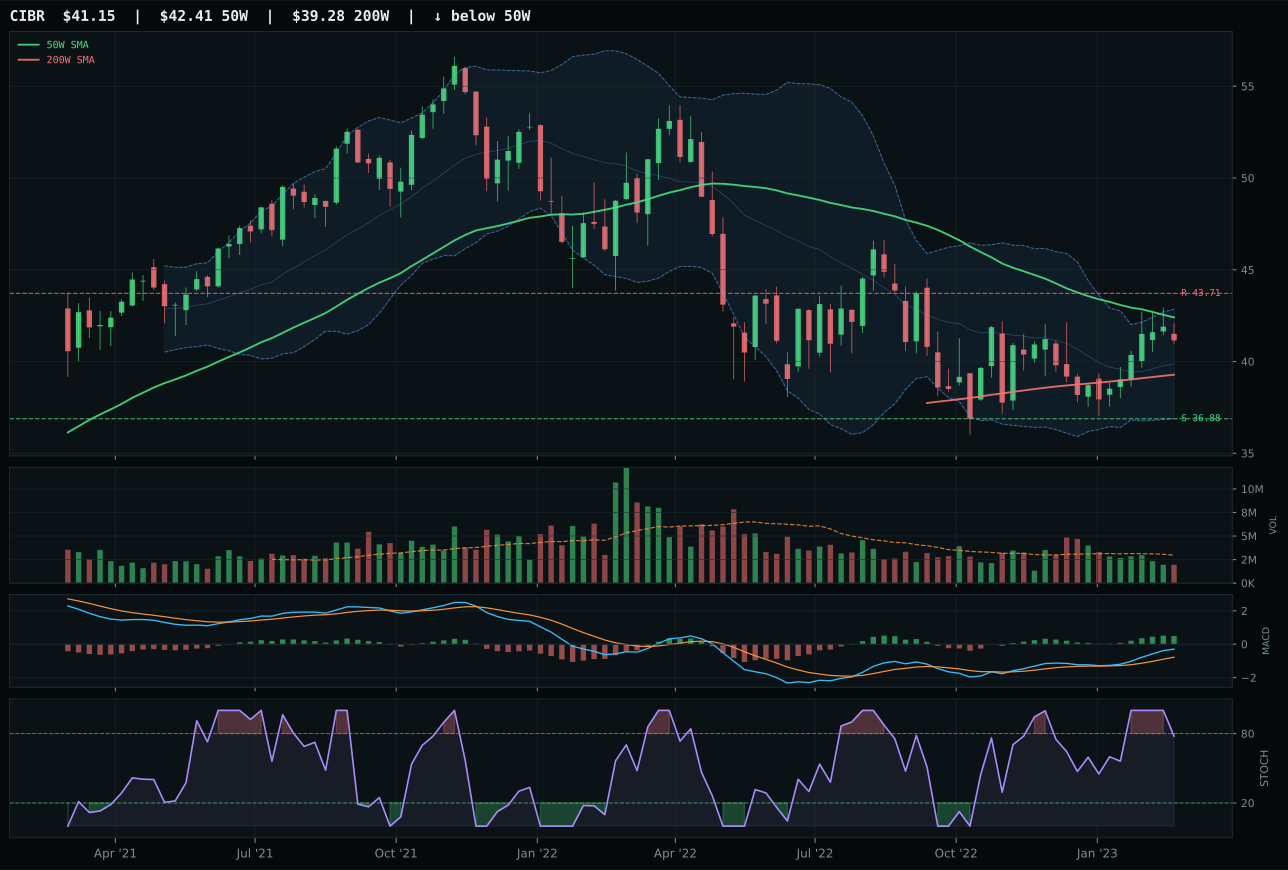
CIBR has a compression near 50W profile with 2.0% 13-week relative strength versus SPY.
A failed hold above support would weaken the setup.
Actionable but governed by invalidation levels.
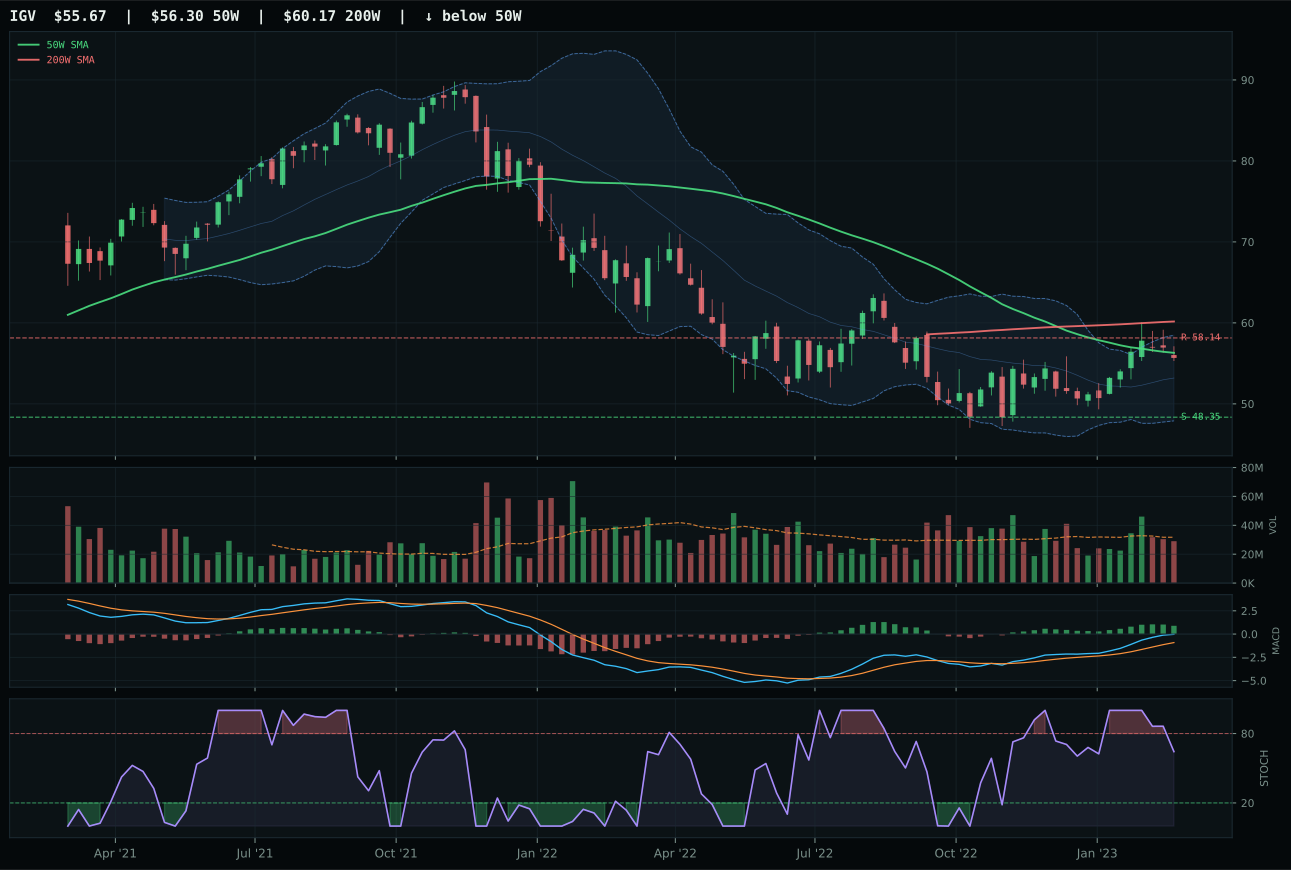
IGV has a compression near 50W profile with 5.9% 13-week relative strength versus SPY.
Extension and support failure are the main tactical risks.
Tracked, but not top-2 eligible because: structurally broken.
XLK wins because it sits precisely at the 50W with neutral volume—a setup that rewards patience rather than aggression. The 3.3% relative strength versus SPY combined with bullish but flat MACD tells us this is orderly accumulation, not capitulation or euphoria. CIBR lost on two counts: its -1.3% category-relative strength signals it's trailing its own peer set, and its thin participation at the volume level suggests conviction is missing. The compression near the 50W across both charts is identical, but XLK's category-neutral RS and SPY-relative outperformance by 1.3 points give it the edge in a regime where technical evidence carries 64% weight.
Technology earned 10% allocation because its 50.1 category score ranks sixth among ten eligible categories—below the two 20% slots but ahead of sectors that are technically or macro-broken. The macro regime is actively unhelpful: disinflation pressure adds 5 points while liquidity stress subtracts 10, netting minus 5 versus the macro headline of AI growth sponsorship at plus 6. This category survives on breadth and relative strength, not on tailwinds. If credit stress parameters flip or liquidity normalizes, Technology could reclaim a 20% seat, but today it's a holding for portfolio breadth rather than a core conviction.
Utilities & Infrastructure — PAVE
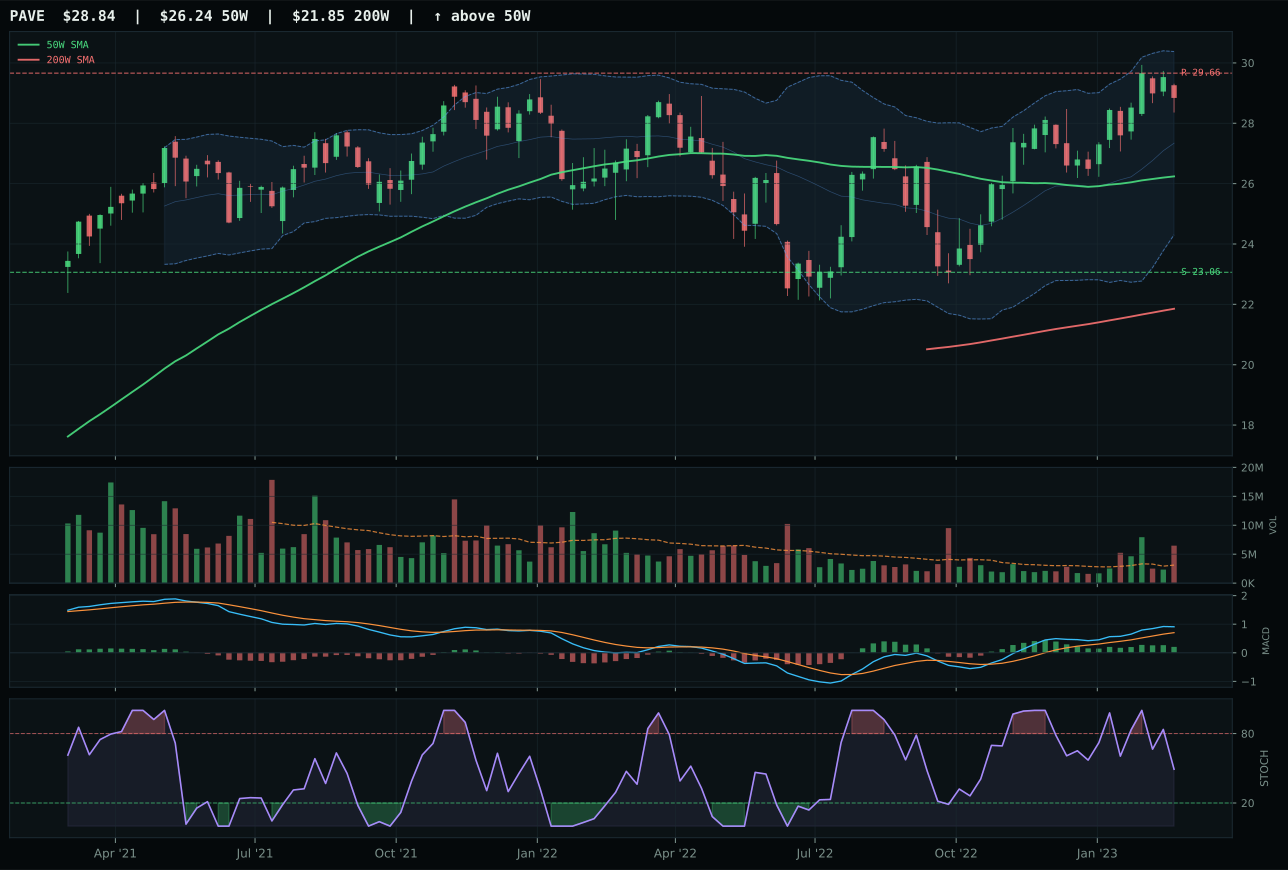
PAVE has a neutral structure profile with 5.1% 13-week relative strength versus SPY.
A failed hold above support would weaken the setup.
Actionable but governed by invalidation levels.
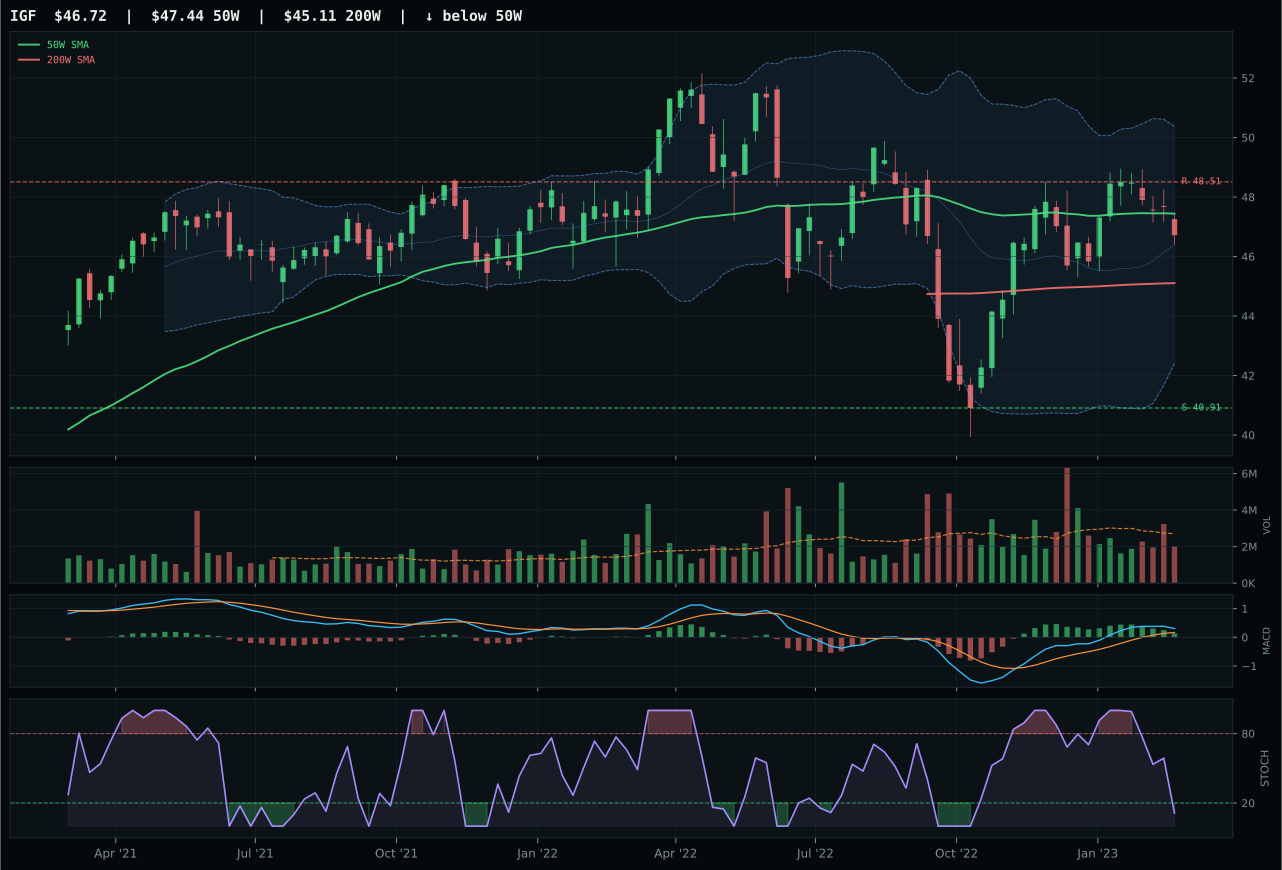
IGF has a compression near 50W profile with -0.4% 13-week relative strength versus SPY.
A failed hold above support would weaken the setup.
Actionable but governed by invalidation levels.
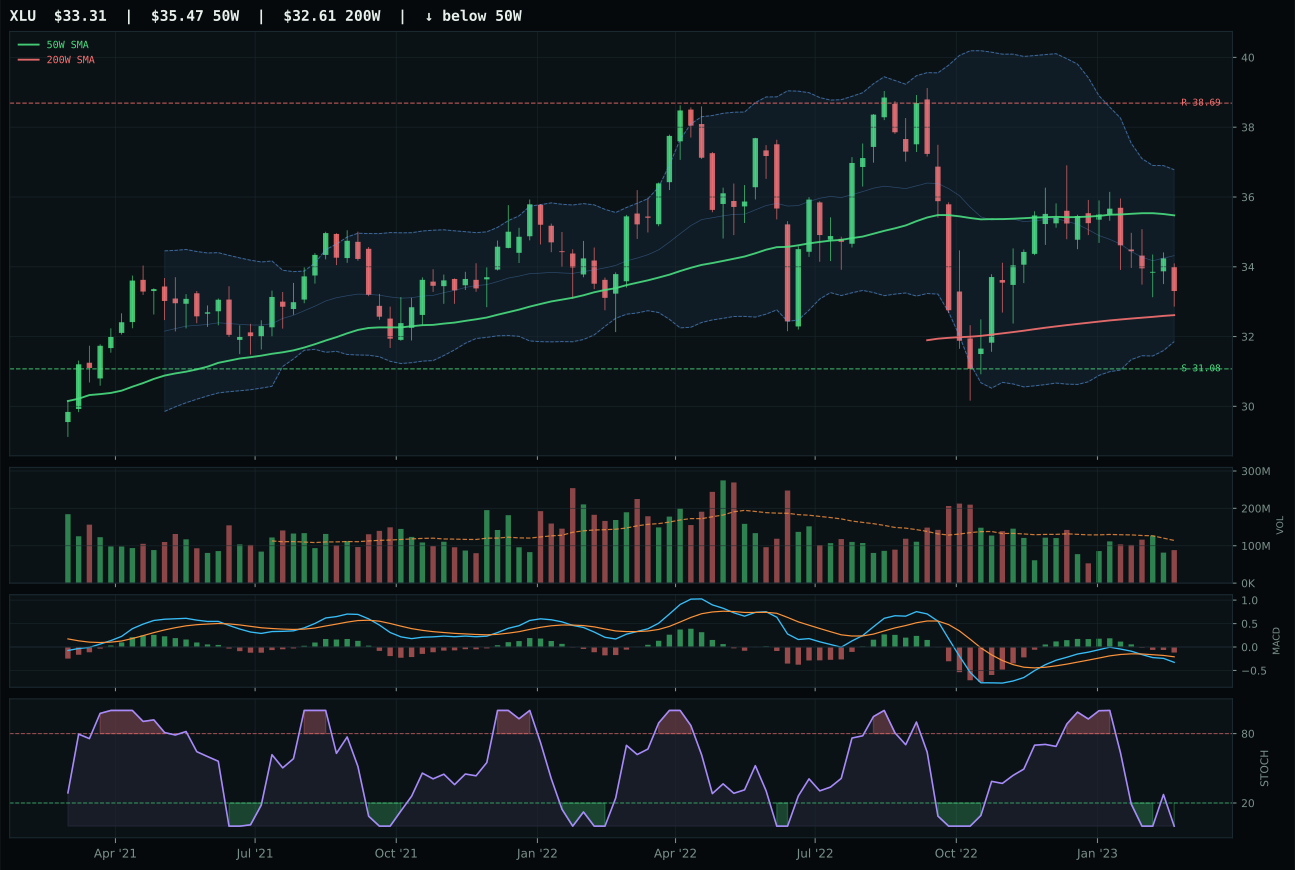
XLU has a neutral structure profile with -4.6% 13-week relative strength versus SPY.
A failed hold above support would weaken the setup.
Actionable but governed by invalidation levels.
PAVE wins because it is the only name showing bullish and improving MACD in a category of deteriorating technical setups. At 100.0 trend score with positive 50W slope of 0.1%, PAVE has achieved what others have not—upward momentum while extended 9.9% from the 50W. Distribution pressure at 2.08x the twenty-week volume average is a warning flag, but in a rising trend with improving MACD, distribution pressure that climbs with price is accumulation, not exhaustion. IGF's compression near 50W and bullish but flattening MACD suggest it is struggling at a pivot point. Category-relative strength of 5.5% means PAVE is winning its peer set while extended. Risk/reward of 39.0 is weak, but the trend integrity and volume pattern offset the compressed upside.
Utilities & Infrastructure earned 10% allocation because PAVE's 46.3 category score ranks fifth, supported by a macro fit of 62.0—the second-best category-level macro fit after Precious Metals. Disinflation helps this category at plus 7 points, and the transition/mixed regime adds 4 more. PAVE's distribution pressure and extended distance from the 50W argue for smaller position sizing, but the combination of intact trend, improving MACD, and supportive macro makes it a legitimate rotational candidate. If technology momentum slows or interest rates compress further, infrastructure capex exposure becomes attractive. This allocation is held as a secondary position pending validation of the distribution pattern at higher levels.
Nuclear Energy — URA
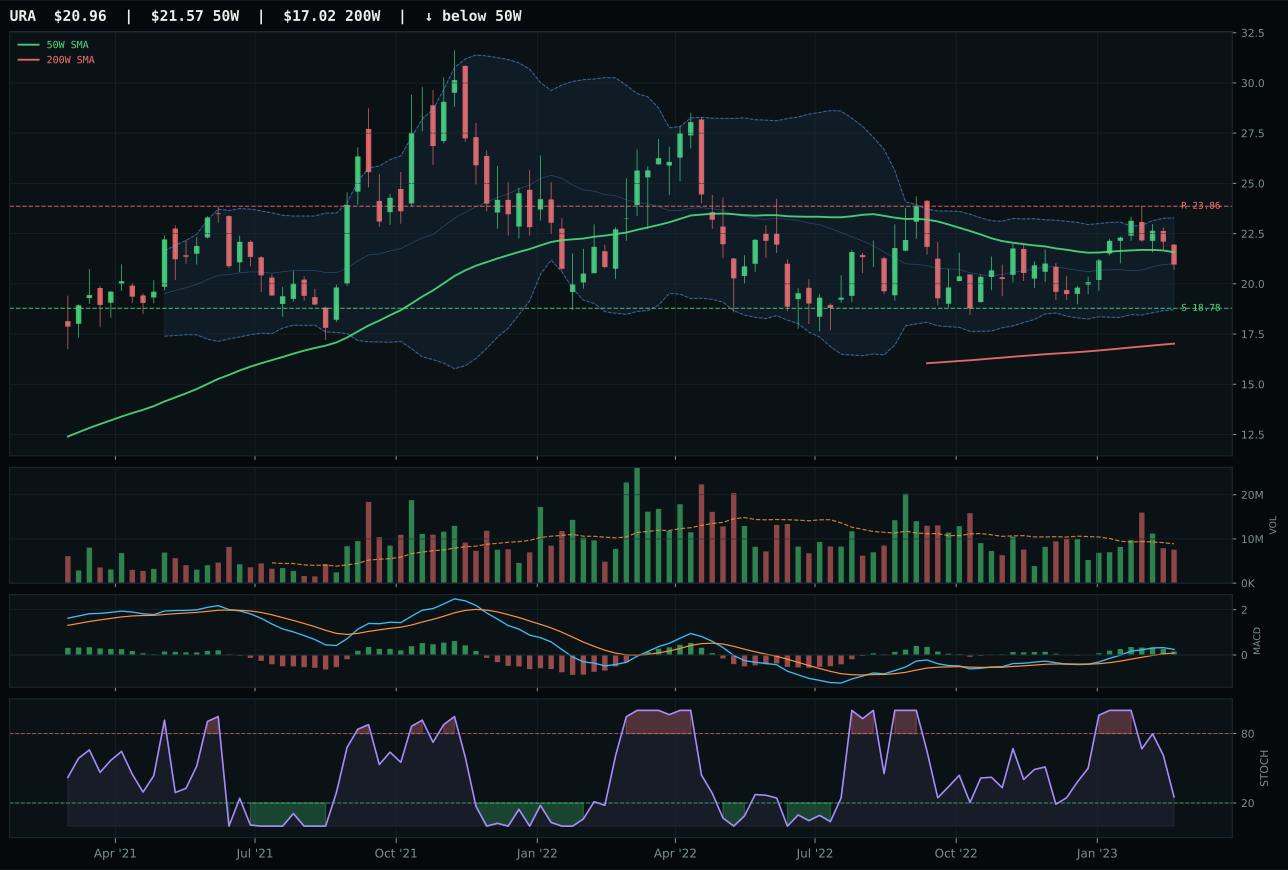
URA has a compression near 50W profile with 1.7% 13-week relative strength versus SPY.
A failed hold above support would weaken the setup.
Actionable but governed by invalidation levels.
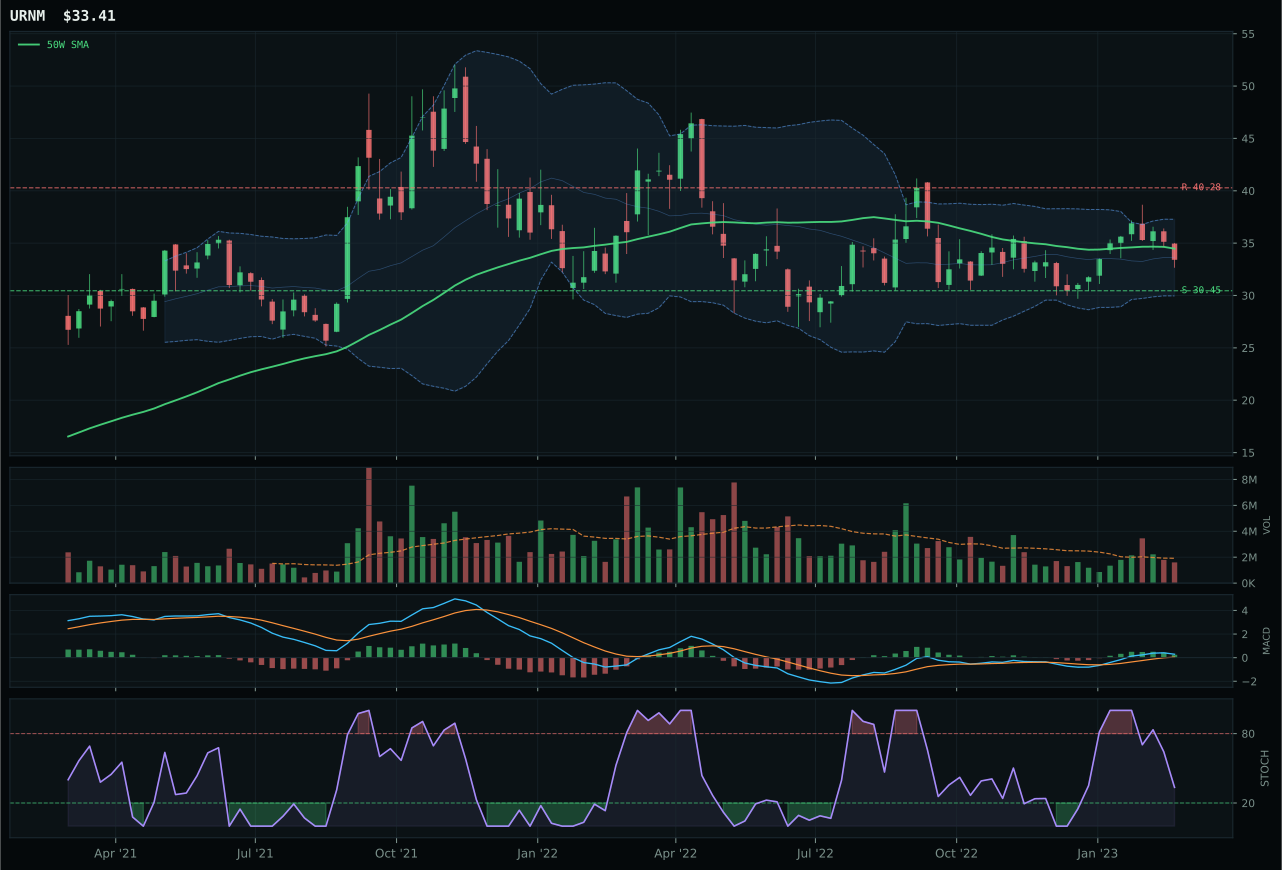
URNM has a neutral structure profile with 2.2% 13-week relative strength versus SPY.
A failed hold above support would weaken the setup.
Actionable but governed by invalidation levels.
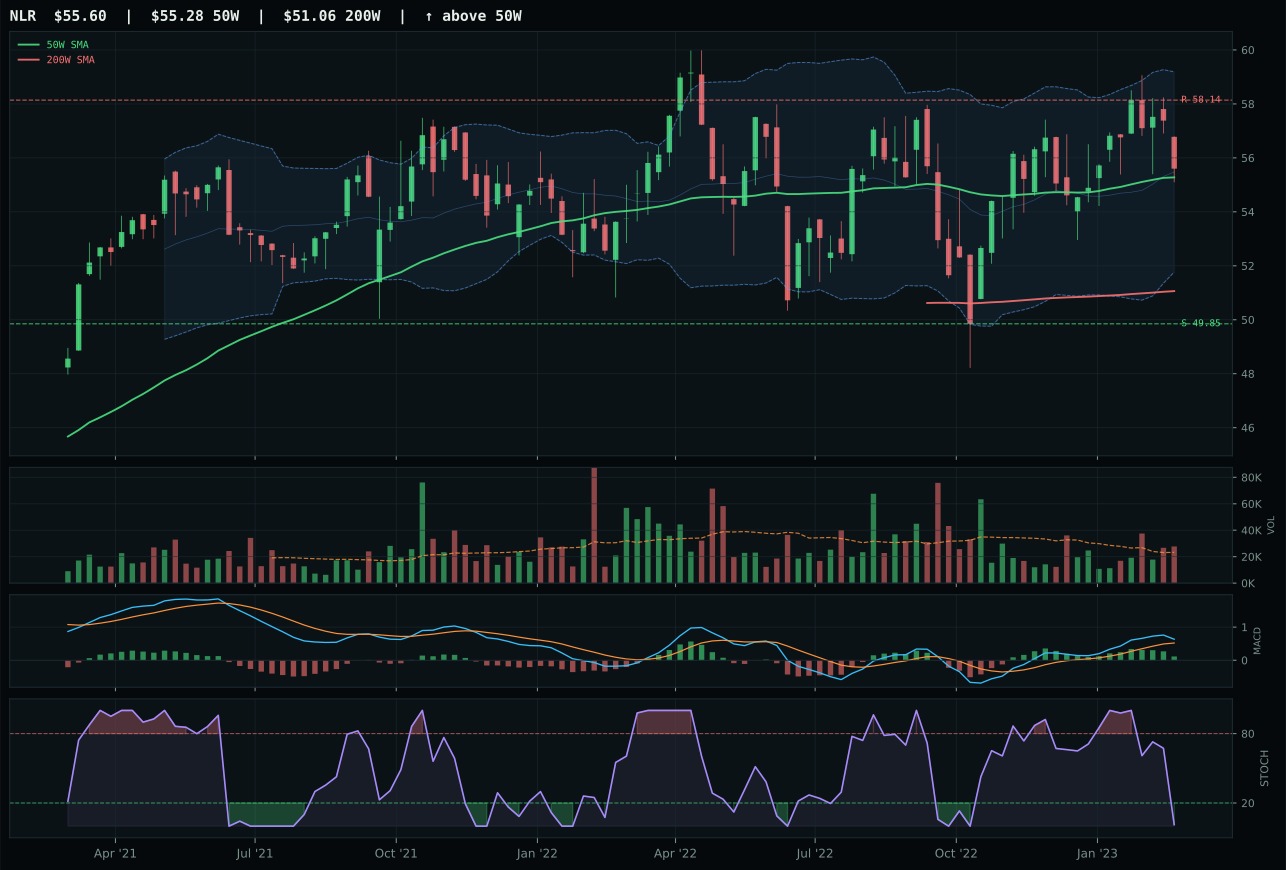
NLR has a compression near 50W profile with 0.2% 13-week relative strength versus SPY.
A failed hold above support would weaken the setup.
Tracked, but not top-2 eligible because: .
URA wins by offering the best-defined pullback-into-support setup in a technically strained category. Price is minus 2.8% from the 50W and trading above the 200W, which is the textbook mean-reversion structure. The timing score of 100.0 derives from oversold stochastic at 0.25 combined with deep Fibonacci retracement at 0.618, giving the entry a clear technical rationale. URNM's neutral structure and weaker timing score of 85 mean it lacks the same compelling invalidation level. Both have flattening MACD and category-relative strength near neutral. URA's compressed setup at the 50W offers tighter stops than URNM's broader structure. In a category where macro fit is neutral, the name with the cleanest technical invalidation level wins.
Nuclear Energy earned 10% allocation because URA's timing setup of 100.0 combined with a 43.6 category score—fourth-best overall—justifies inclusion despite weak momentum confirmation at 43.0. The macro fit of 43.0 is neutral territory; no active descriptor strongly sponsors or penalizes the category. AI growth sponsorship adds 5 points, but liquidity stress subtracts 7. This allocation is tactical: URA is priced for mean reversion at the 50W, offering defined downside risk if support breaks at 18.78 while carrying upside exposure if nuclear energy scarcity becomes a real capex theme. The position is held as a volatility hedge and a small-cap value opportunity, not as a permanent strategic core.
Industrial Metals — COPX
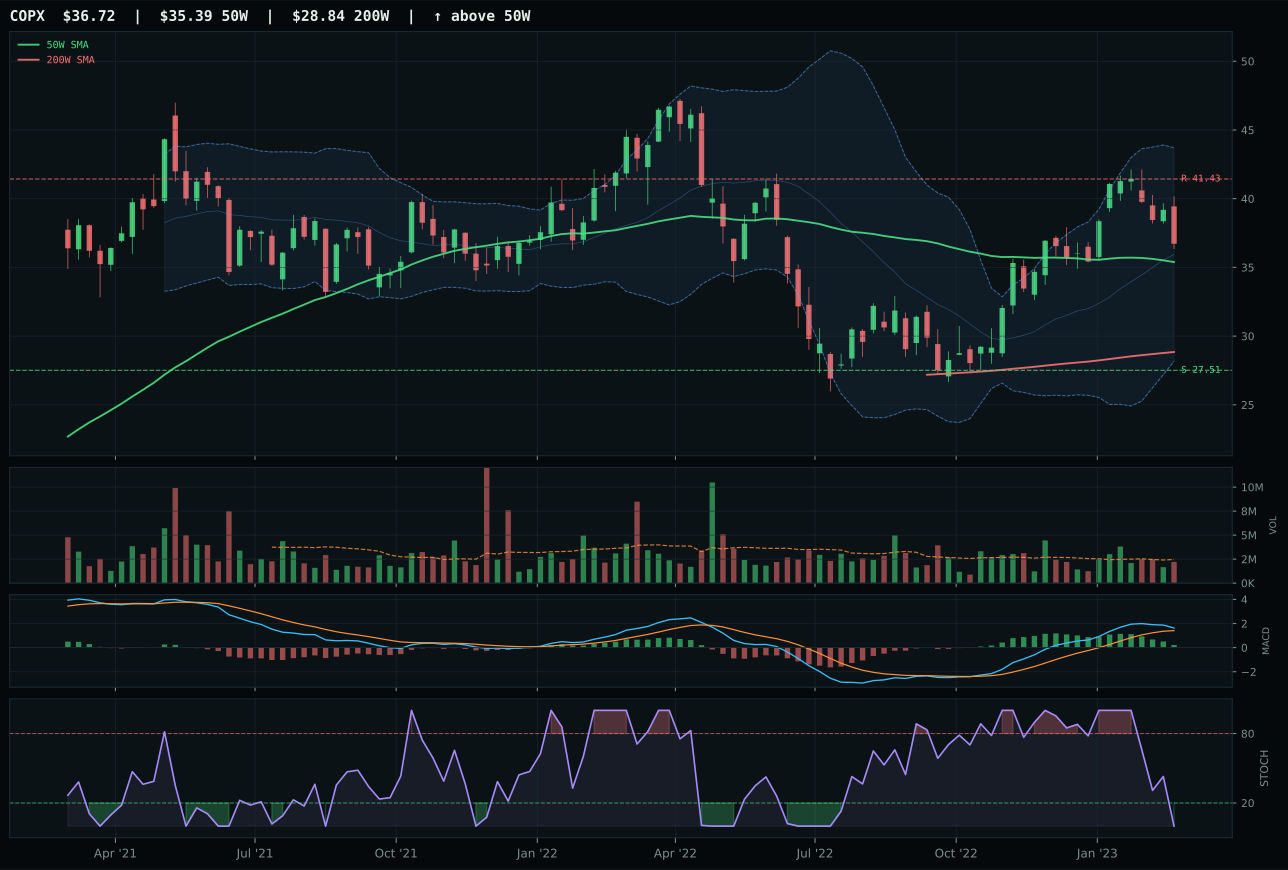
COPX has a neutral structure profile with 7.4% 13-week relative strength versus SPY.
A failed hold above support would weaken the setup.
Actionable but governed by invalidation levels.
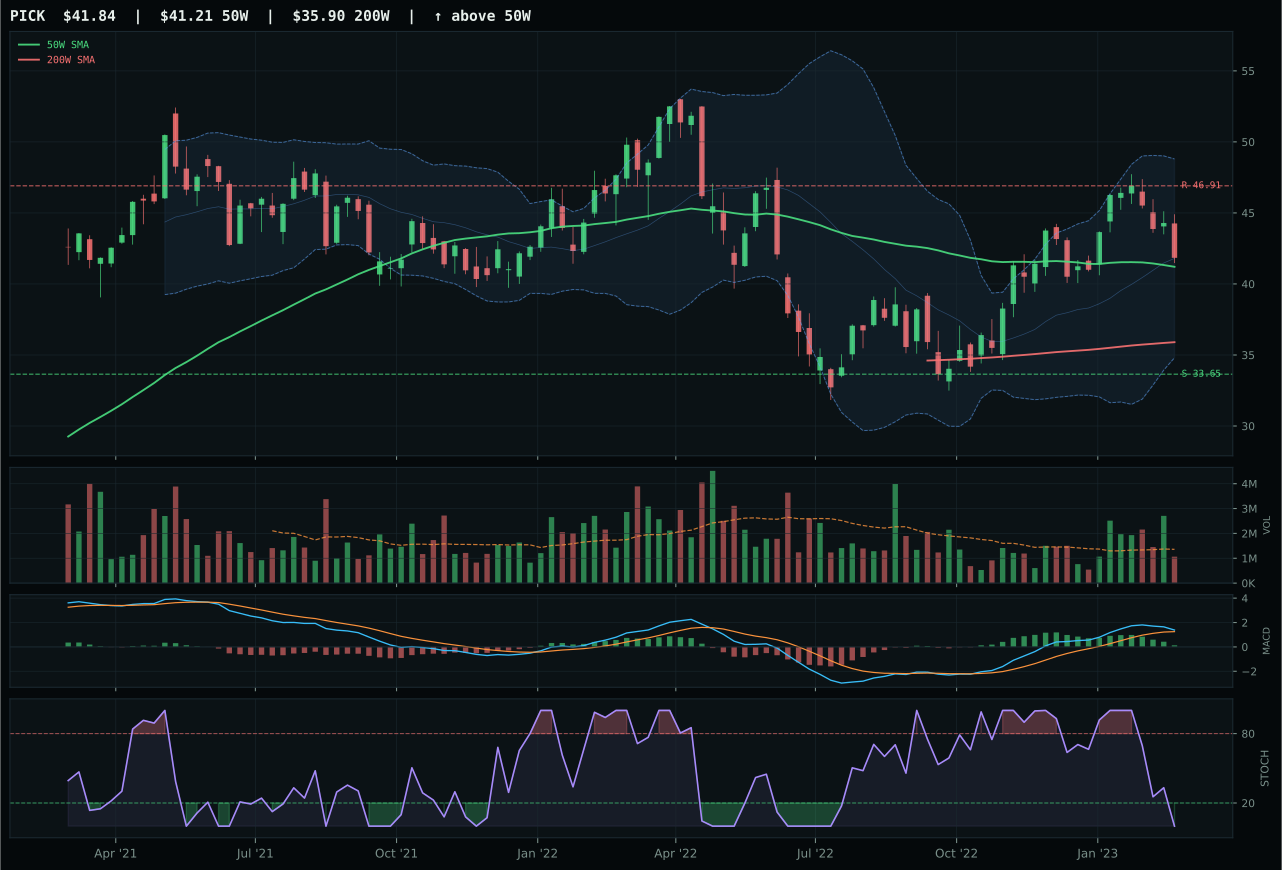
PICK has a compression near 50W profile with 2.5% 13-week relative strength versus SPY.
A failed hold above support would weaken the setup.
Actionable but governed by invalidation levels.
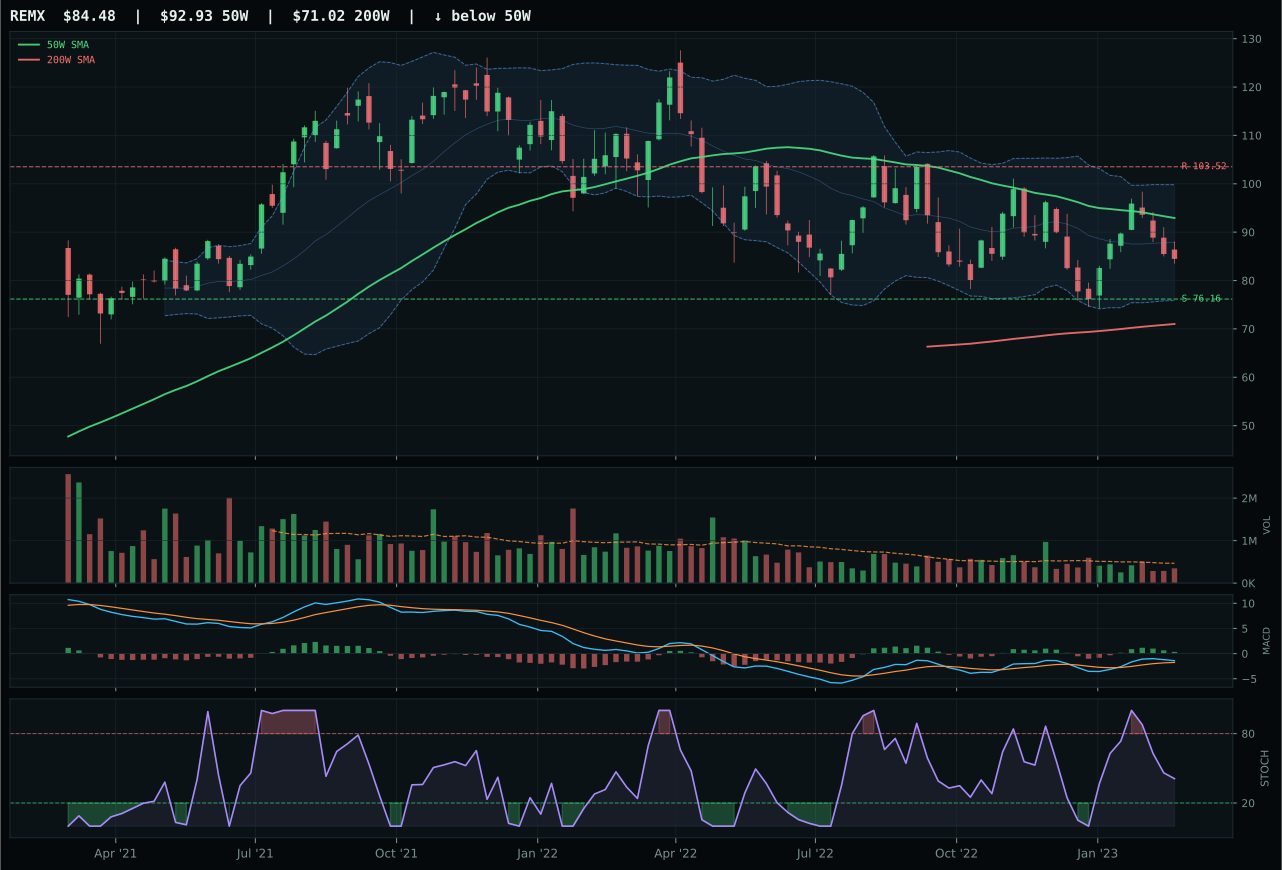
REMX has a neutral structure profile with -3.9% 13-week relative strength versus SPY.
A failed hold above support would weaken the setup.
Actionable but governed by invalidation levels.
COPX wins by executing a superior trend and leadership narrative despite a 96.0 trend score that matches PICK's at 80. COPX stands 3.8% above the 50W with a negative slope of minus 0.3%, meaning the setup is extended but still orderly. The 7.4% relative strength versus SPY combined with 4.9% category-relative strength tells the story: COPX is the preferred copper play when metal scarcity is the narrative. PICK's compression setup is tighter, but its 0.0% category-relative strength means it's not winning within its own basket. Volume is neutral in both; MACD is flattening in both. The difference is that COPX's thirteen-week return of 5.9% is outperforming PICK's 1.0%, and that momentum difference determines allocation in a coil setup.
Industrial Metals earned 10% allocation because COPX's technical evidence of 72.3 combined with a powerful 55.0 macro fit—driven by the active descriptor 'metals scarcity' at plus 12 points—yields a 43.3 category score that ranks fourth. Liquidity stress subtracts 8 points and credit stress subtracts 7, yet the category survives because scarcity narratives are durable. Disinflation pressure is absent from the descriptor list, meaning falling input costs do not directly handicap mining equity. COPX at 3.8% extension with 7.4% SPY relative strength offers moderate upside before invalidation; this allocation is a proxy bet on continued industrial demand and limited near-term mine supply growth.
Precious Metals — GLD
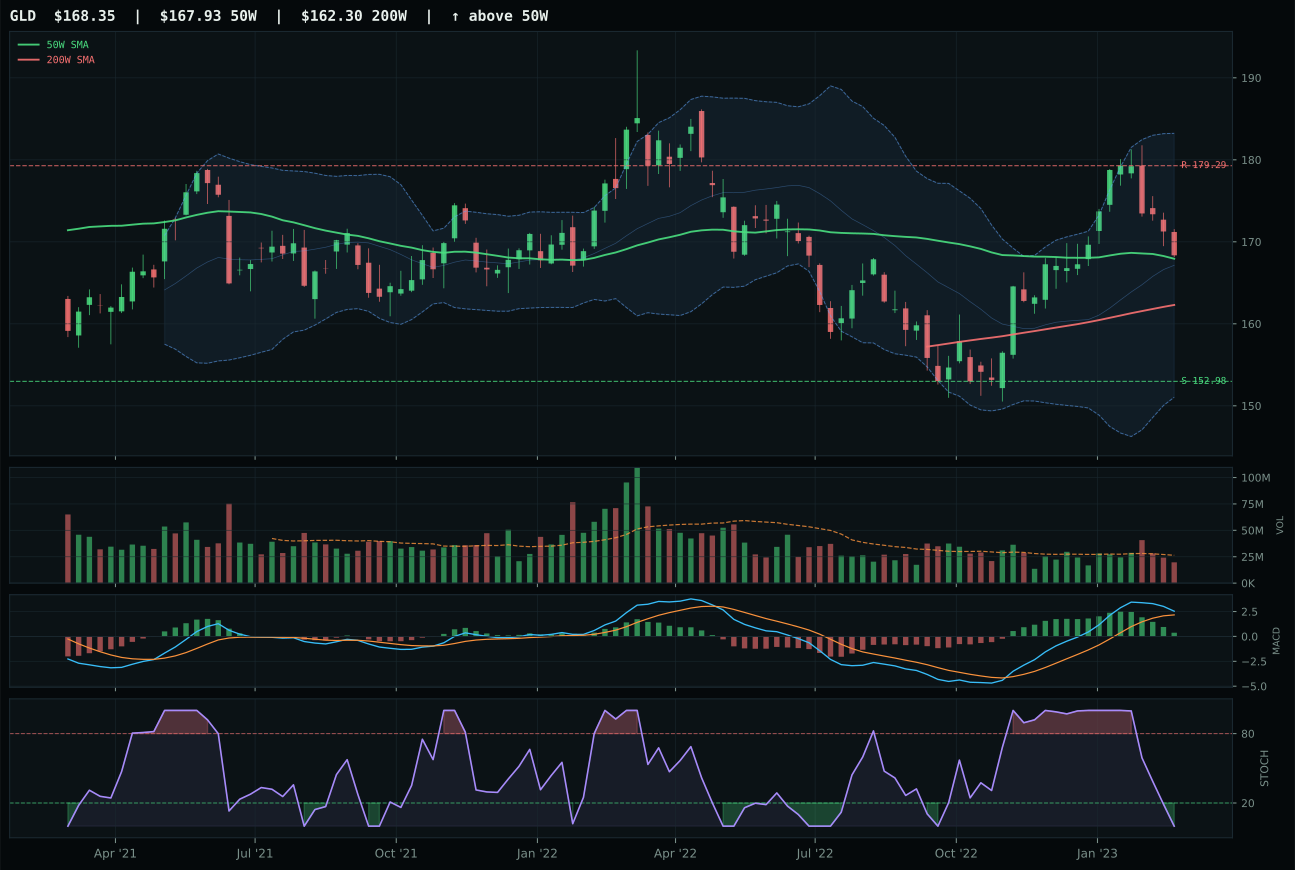
GLD has a compression near 50W profile with 4.6% 13-week relative strength versus SPY.
A failed hold above support would weaken the setup.
Actionable but governed by invalidation levels.
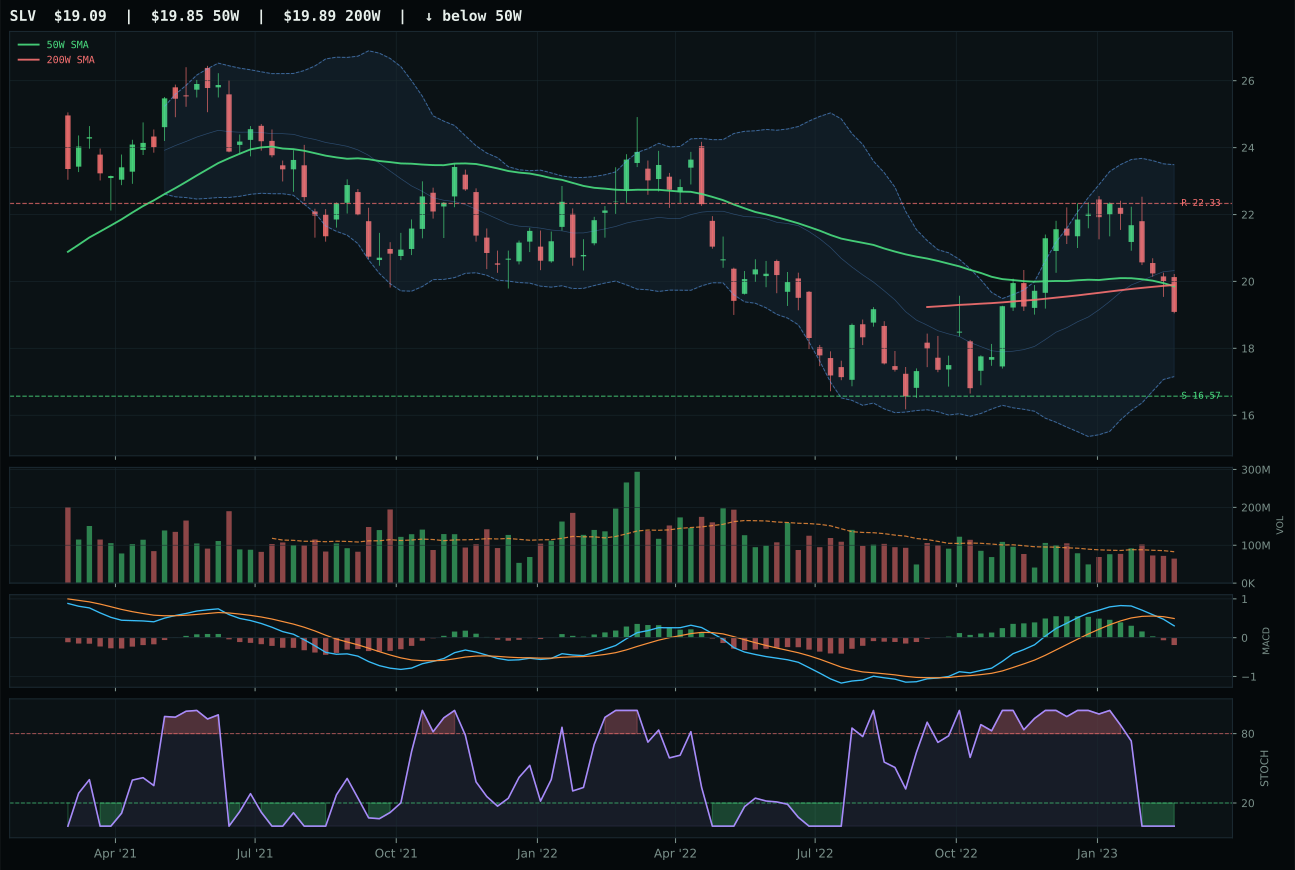
SLV has a neutral structure profile with -1.7% 13-week relative strength versus SPY.
Extension and support failure are the main tactical risks.
Tracked, but not top-2 eligible because: structurally broken.
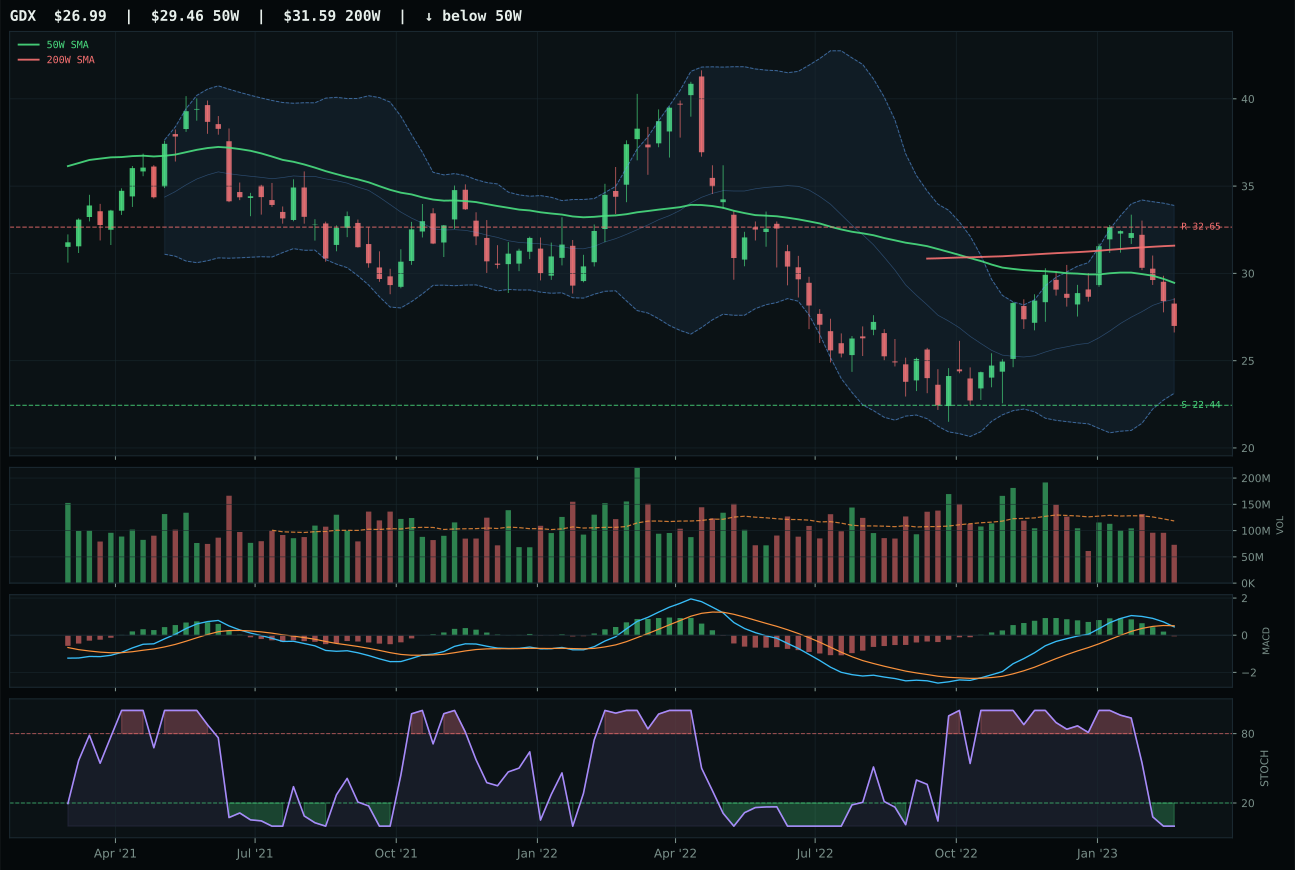
GDX has a neutral structure profile with -3.6% 13-week relative strength versus SPY.
Extension and support failure are the main tactical risks.
Tracked, but not top-2 eligible because: structurally broken.
GLD wins decisively with a 63.3-point gap over SLV because it is the only name in the category with intact trend, sound structure, and macro sponsorship working together. Gold is compressed at the 50W with neutral volume and a perfect 100.0 timing score—this is textbook coil setup. SLV failed structurally: its MACD is bearish/weakening while GLD's is bullish but flattening, and SLV's structure score collapsed to 34.2 versus GLD's 69.0. SLV is trading as an industrial commodity despite its name; in a disinflation regime, that matters. GLD's 6.3% category-relative strength signals it is the preferred monetary hedge within its own peer set. The oversold stochastic in both names is identical, but GLD's trend superiority and positive MACD make it the clean entry.
Precious Metals earned 10% allocation despite a middling 35.2 category score because the macro descriptor 'monetary hedge bid' is active at plus 14 points, adding 5.3 percentage points to category-level macro fit. Disinflation actually aids gold—adding 8 points—because when real rates compress, fiat currency hedges gain relative appeal. The 74.0 macro fit is the third-best among all categories, yet technical evidence at 74.4 is weak, creating tension: GLD wins on technicals but the category only survives on macro narrative. This is a macro hedge allocation, not a momentum play. If Fed policy shifts or credit stress activates, monetary hedge bid will strengthen and this category's allocation could double.
Traditional Energy — XLE
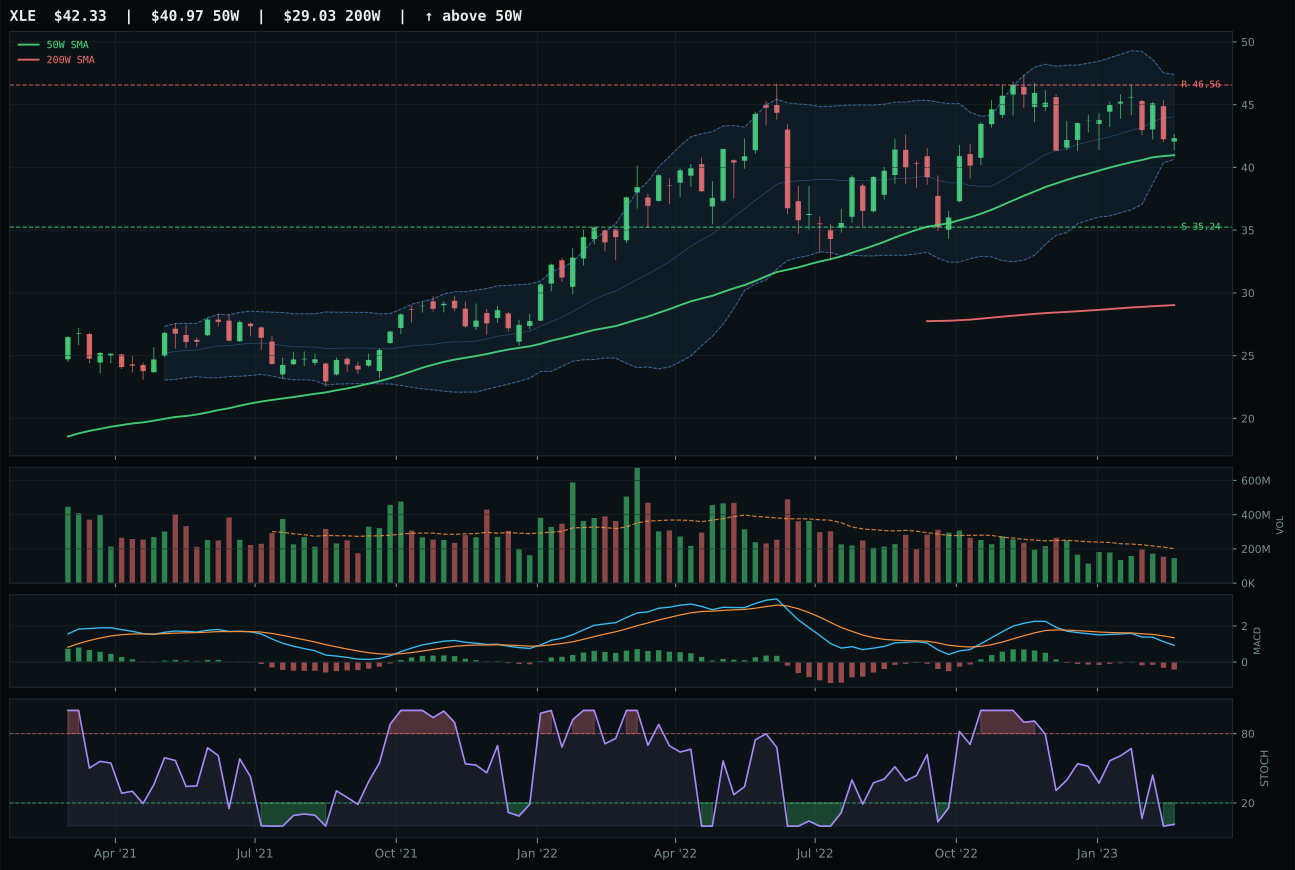
XLE has a neutral structure profile with -6.4% 13-week relative strength versus SPY.
A failed hold above support would weaken the setup.
Actionable but governed by invalidation levels.
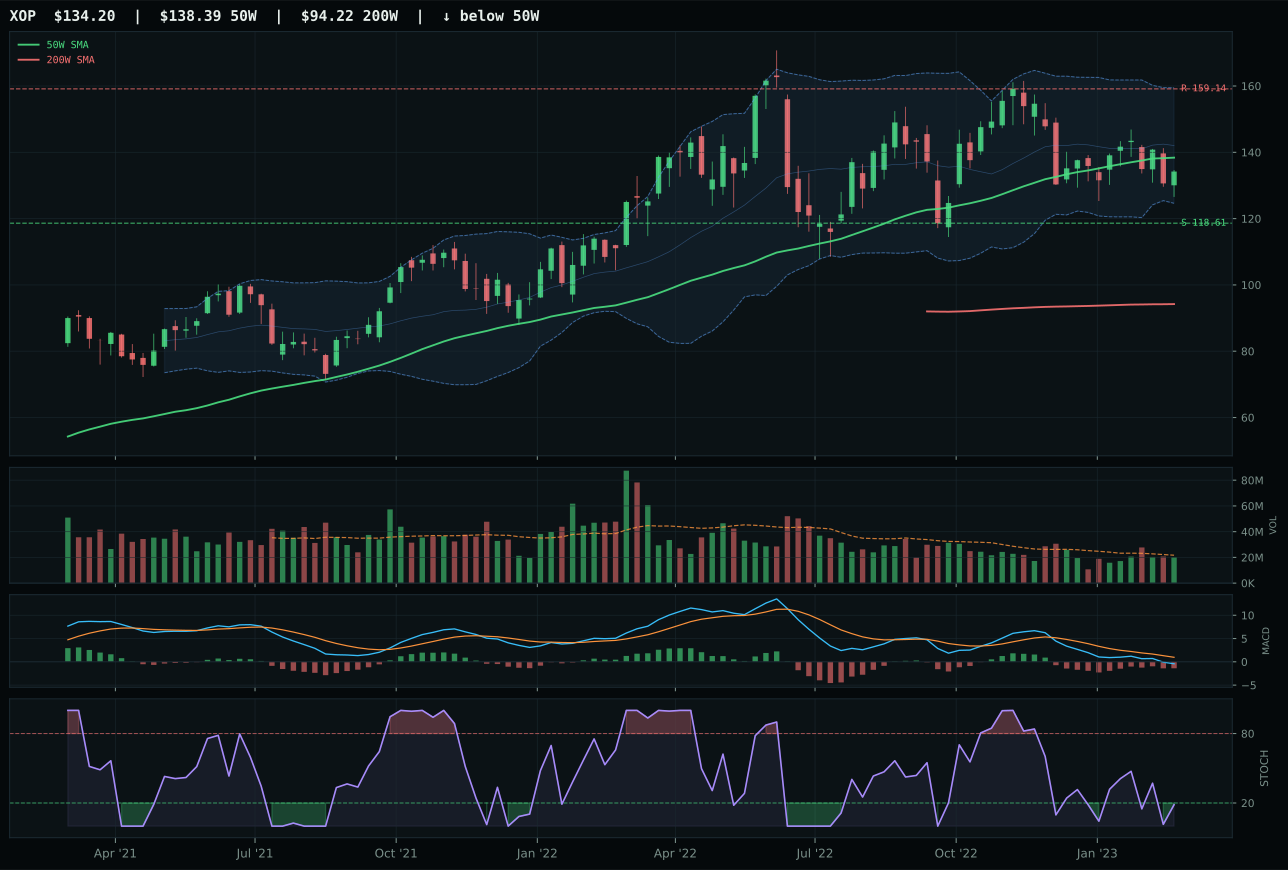
XOP has a neutral structure profile with -11.7% 13-week relative strength versus SPY.
A failed hold above support would weaken the setup.
Actionable but governed by invalidation levels.
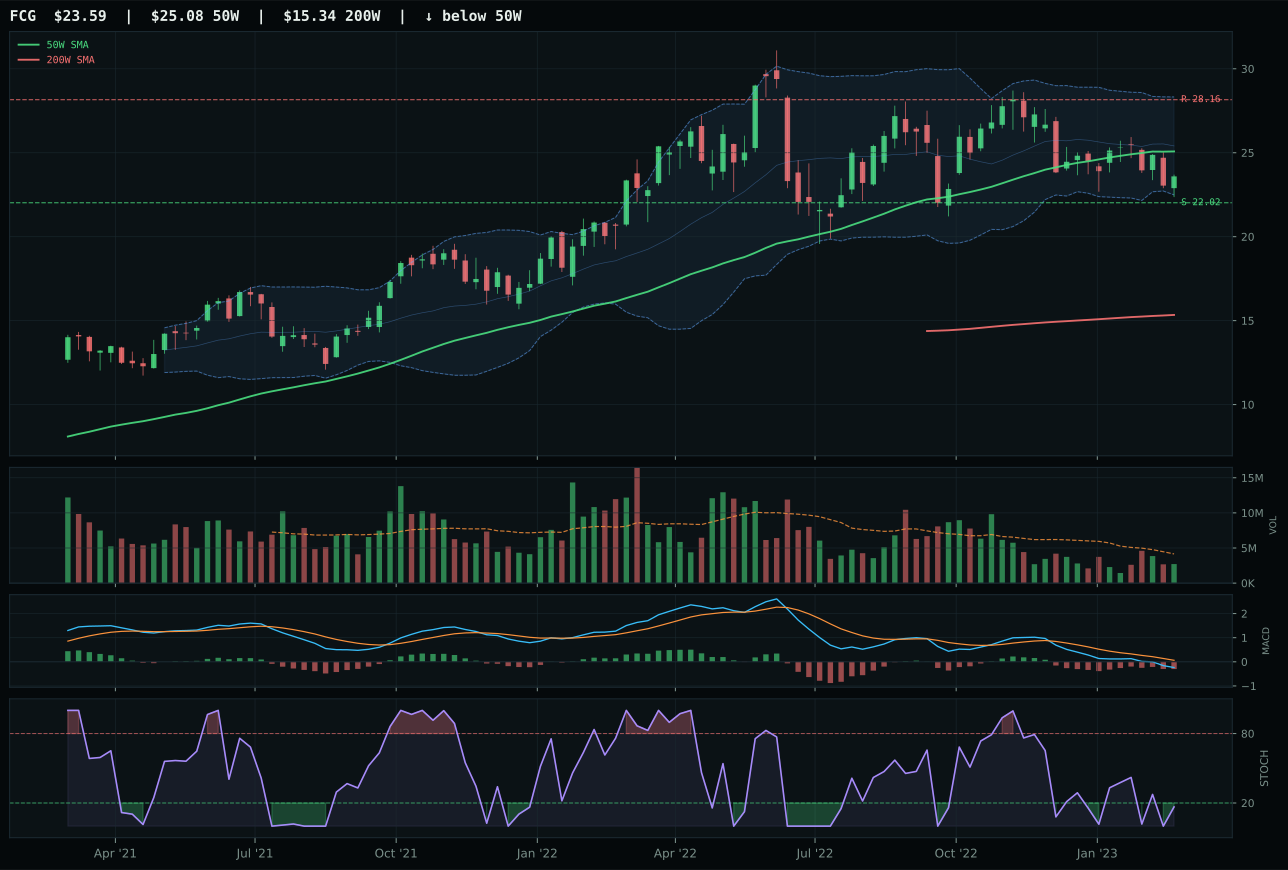
FCG has a neutral structure profile with -12.0% 13-week relative strength versus SPY.
A failed hold above support would weaken the setup.
Actionable but governed by invalidation levels.
XLE wins by default in a category that scored 0.0 overall—a technical disaster where XLE's 34.1 reasoned score is only marginally better than XOP's 28.7. XLE trades 3.3% above the 50W, but its minus 7.8% thirteen-week return and minus 6.4% relative strength versus SPY are disqualifying metrics masked by a trend score of 72.5. The MACD is bearish/weakening and momentum confirmation is a catastrophic 8.2 out of 100. Volume participation is thin at 0.73x the twenty-week average. XOP loses on category-relative strength, but the real failure is systemic: with disinflation pressure active at minus 10 and credit stress at minus 7, traditional energy has no macro sponsor. This is allocation by process elimination, not conviction.
Traditional Energy earned 10% allocation despite a zero-point category score because the allocation framework requires portfolio diversification and XLE remains technically eligible. The 16.0 macro fit is the lowest among all ten categories, and the sixteen-point gap between XLE's baseline technical evidence and the category score reflects penalty filters firing. Disinflation hurts energy valuations by minus 10 points. This is a holding position only: XLE is kept at 10% as a hedge against recession and credit stress reversal, scenarios where energy demand stabilizes and valuation multiples stop contracting. The position is structured to be sold into any five-point rally before macro conditions change.
Agriculture & Livestock — MOO
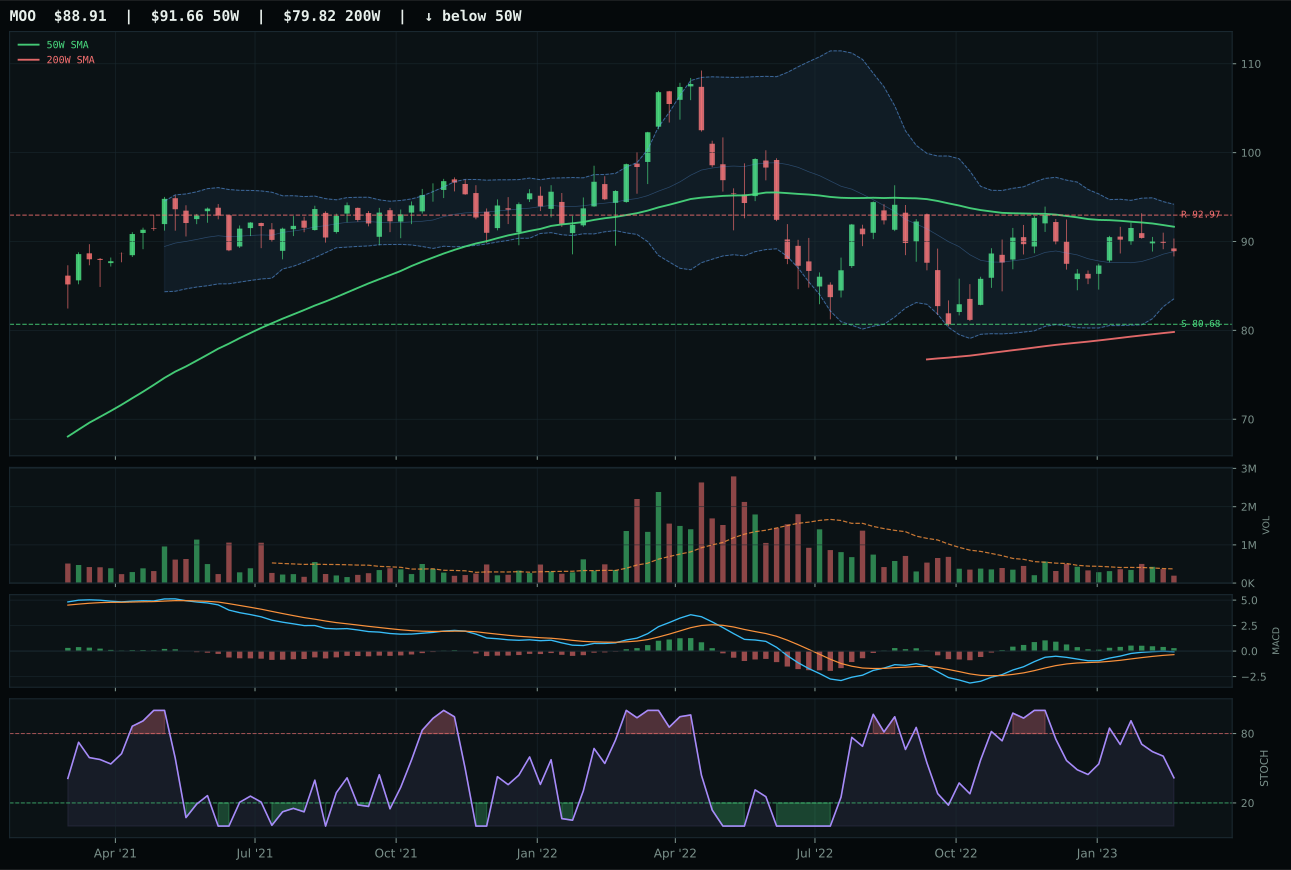
MOO has a neutral structure profile with -2.6% 13-week relative strength versus SPY.
A failed hold above support would weaken the setup.
Actionable but governed by invalidation levels.
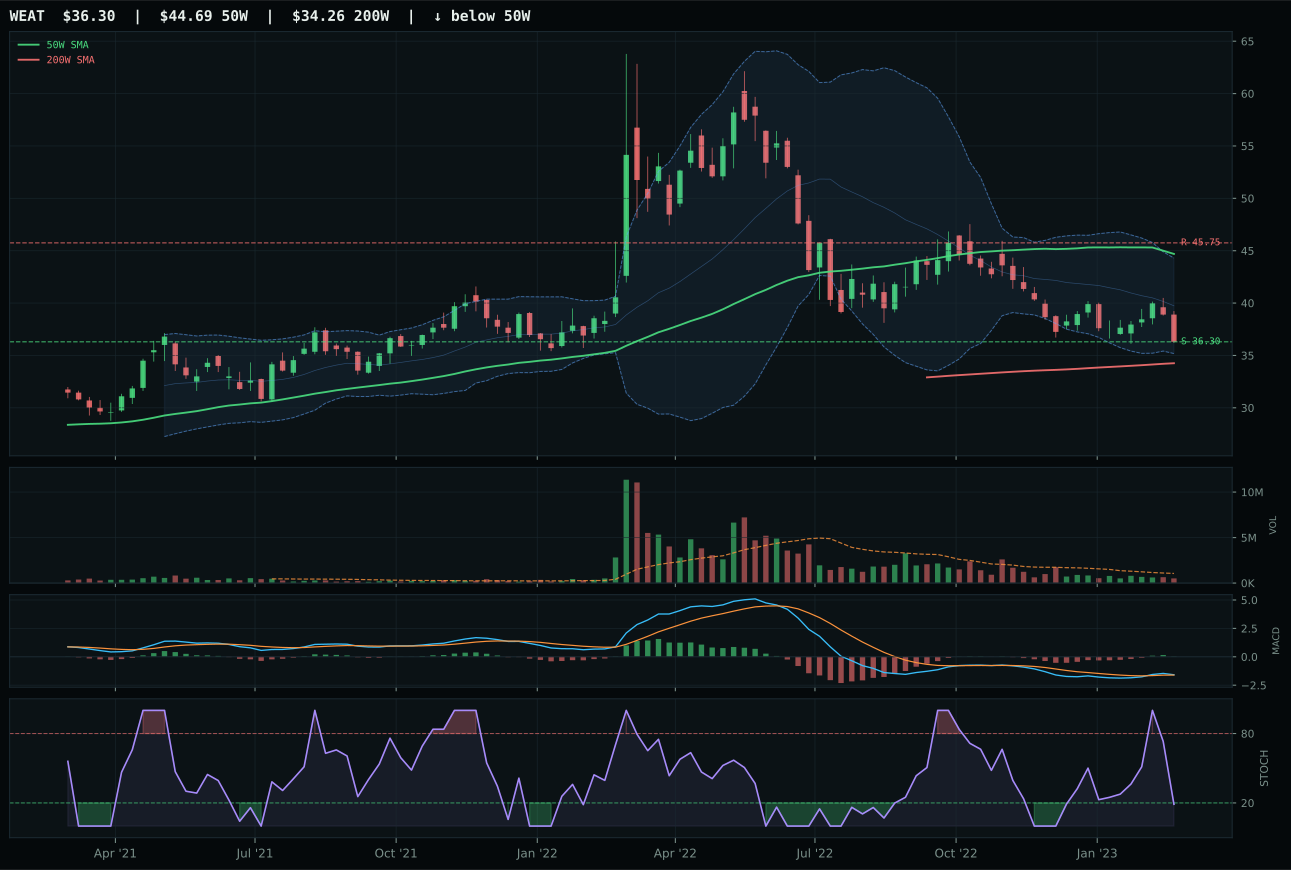
WEAT has a pullback into support profile with -8.6% 13-week relative strength versus SPY.
A failed hold above support would weaken the setup.
Actionable but governed by invalidation levels.
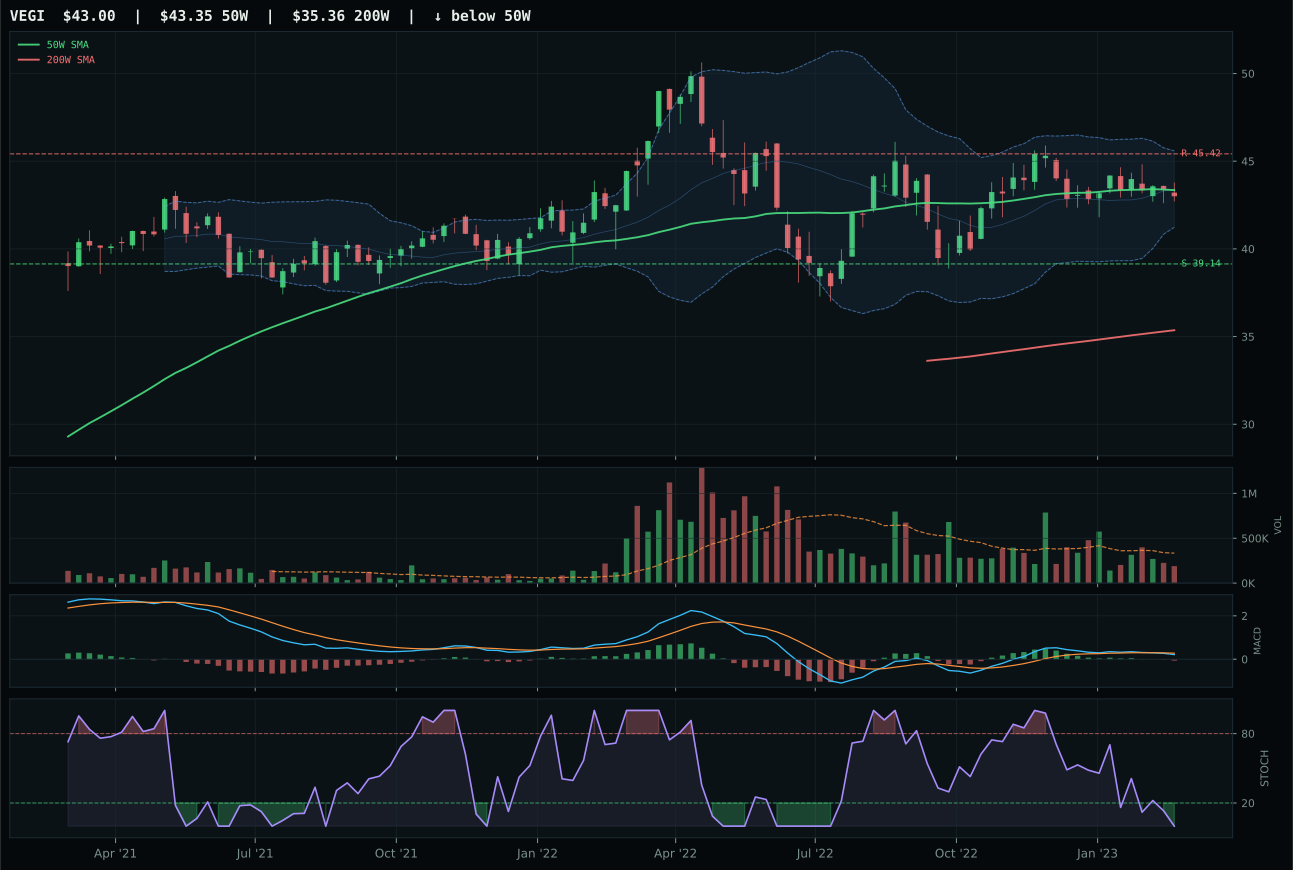
VEGI has a compression near 50W profile with -3.8% 13-week relative strength versus SPY.
A failed hold above support would weaken the setup.
Actionable but governed by invalidation levels.
MOO wins a weak category by winning on timing despite being down 4.0% over thirteen weeks and trading 3.0% below the 50W. Its 92.0 timing score dominates because it sits in a deep retracement zone with oversold stochastic and a defined support level at 80.68, meaning the invalidation level is clear and the risk is bounded. WEAT lost on momentum confirmation—its 13W return of minus 10.0% and category-relative underperformance of minus 4.7% disqualify it despite bullish improving MACD. The category-relative strength gap of 6.0 points between MOO and WEAT is decisive; MOO's 1.3% advantage means it's the least broken name in a broken category. Both have thin volume, but MOO's timing and support structure offer a pullback narrative rather than WEAT's decay pattern.
Agriculture & Livestock earned 0% allocation this week, ranked ninth or tenth among the ten categories with a final score of just 10.9. This exclusion is unambiguous: the category's macro fit of 32.0 reflects disinflation pressure active at -8 basis points and category-level disinflation help at -6, creating a structural headwind that no amount of technical valuation can overcome. MOO's 57.1 trend score—below the 50-week, despite still above the 200—combines with volume participation at only 0.52x the twenty-week average to signal a pullback without conviction. The momentum confirmation of 40.8 and volume-price confirmation of 47.0 reveal that buyers are not accumulating here; they are testing a floor. For this category to earn allocation, disinflation pressure would need to reverse or cycle data would need to surprise sustainably higher, neither of which current macro descriptors suggest.
Emerging Markets — INDA
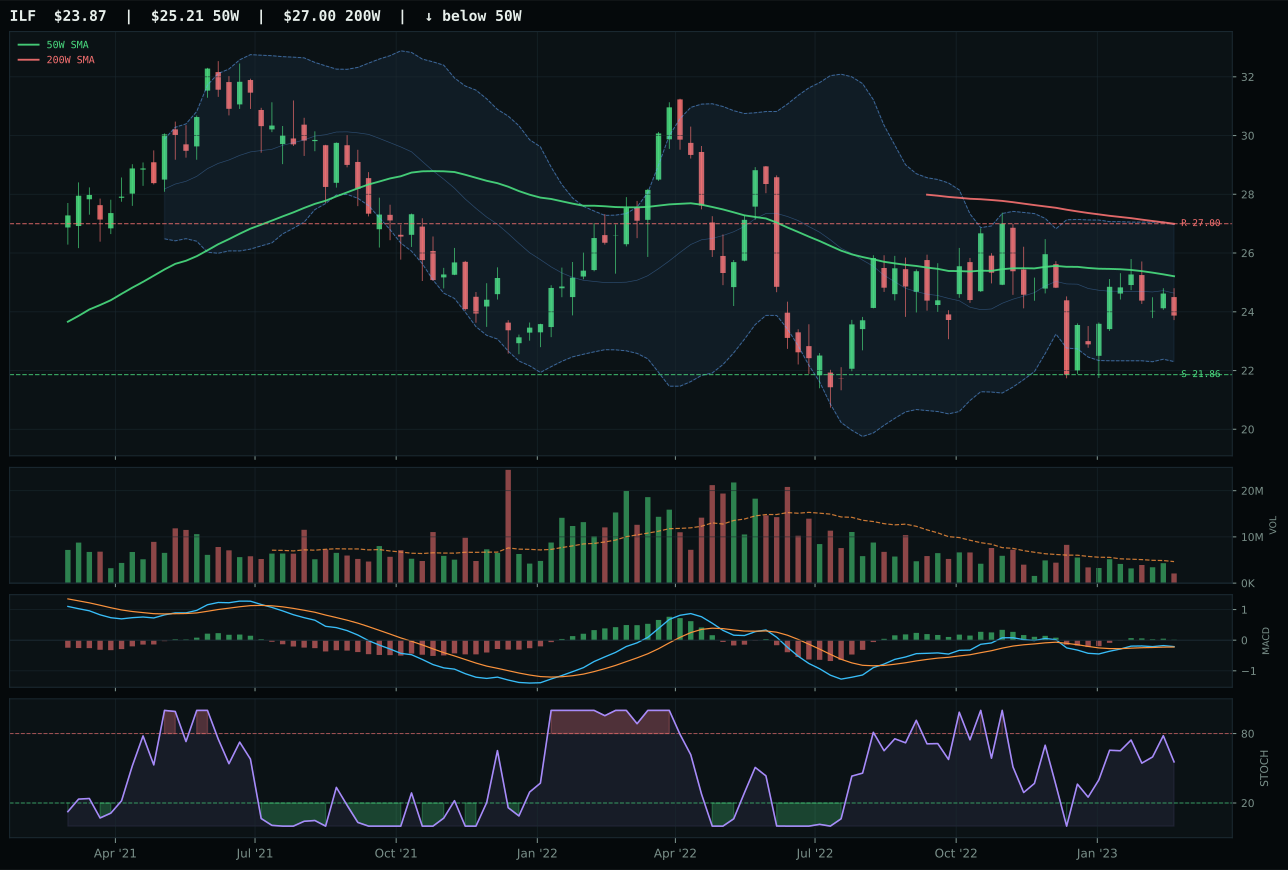
ILF has a neutral structure profile with -2.4% 13-week relative strength versus SPY.
Extension and support failure are the main tactical risks.
Tracked, but not top-2 eligible because: structurally broken.
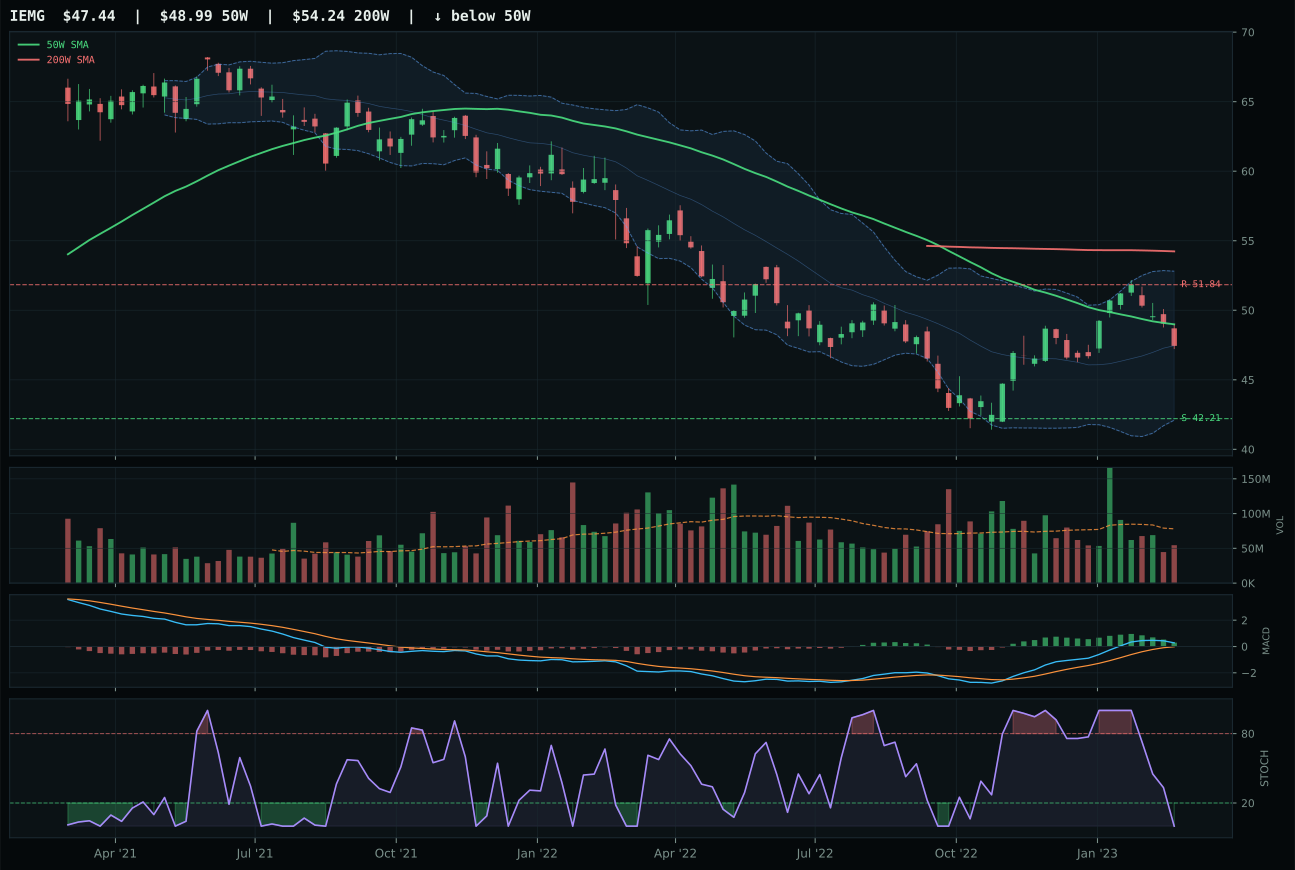
IEMG has a neutral structure profile with 3.4% 13-week relative strength versus SPY.
Extension and support failure are the main tactical risks.
Tracked, but not top-2 eligible because: structurally broken.
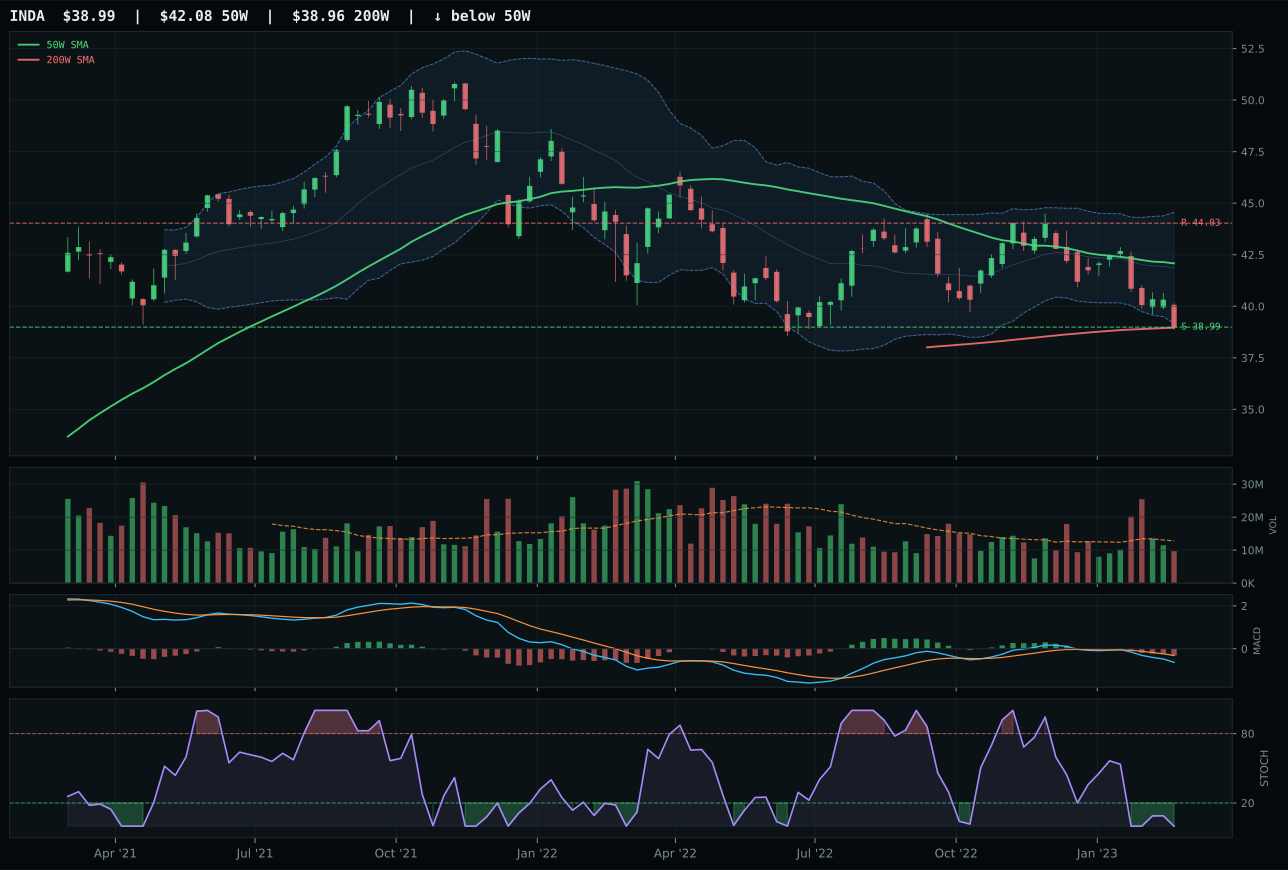
INDA has a pullback into support profile with -8.4% 13-week relative strength versus SPY.
A failed hold above support would weaken the setup.
Actionable but governed by invalidation levels.
INDA wins a category that scored 6.3 overall—the worst in the portfolio—by offering the only setup with a defined risk-management level. Price sits at the 52-week low in a pullback-into-support structure with zero downside to support at 38.99, meaning invalidation is at the same level as entry. IEMG and ILF both trade above their respective support levels with more room to fall. INDA's MACD is bearish/weakening and momentum confirmation is zero, but its timing score of 80 compensates because oversold stochastic and proximity to the 52W low create a technical floor. IEMG at 2.0% thirteen-week return and ILF at minus 3.9% offer no conviction; INDA's minus 9.9% is extreme enough to qualify as capitulation.
Emerging Markets earned 0% allocation this week with a bottom-tier 6.3 final category score, reflecting a category under structural pressure from credit stress (-10), liquidity stress (-10), and negative risk appetite bias. INDA's technical evidence of 0.0 signals hard filters active; the chart is oversold and near lows, but momentum confirmation at 0.0 and volume-price confirmation at 10.2 confirm that there is no conviction buying. Risk appetite positive at +8 cannot offset the category headwinds; emerging markets are the first casualty of a tightening cycle, and disinflation does not change this asymmetry. For this category to earn allocation, credit stress would need to reverse, liquidity conditions would need to stabilize, and relative strength would need to inflect above SPY—none of which are present this week. This is a zero-allocation call with high conviction.