
2023-02-17
Informational purposes only. The content in this report, including allocations, analysis, and commentary, is provided solely for informational and educational purposes. It does not constitute financial advice, investment advice, trading advice, or any other type of advice. Past performance does not guarantee future results. Always conduct your own research and consult a qualified financial professional before making investment decisions.
Weekly Allocation
| Ticker | Category | Weight | Role |
|---|---|---|---|
| COPX | Industrial Metals | 20% | Top-2 (20%) |
| CIBR | Technology | 20% | Top-2 (20%) |
| PAVE | Utilities & Infrastructure | 10% | Tier-2 (10%) |
| XAR | Defense & Aerospace | 10% | Tier-2 (10%) |
| SMH | AI | 10% | Tier-2 (10%) |
| URA | Nuclear Energy | 10% | Tier-2 (10%) |
| SLV | Precious Metals | 10% | Tier-2 (10%) |
| WEAT | Agriculture & Livestock | 10% | Tier-2 (10%) |
Trade Instructions — Monday Open
Sell the tranche from 2023-01-20 (completing its 4-week hold). Buy the new tranche. Instructions show net portfolio changes — same-asset positions cancel, weight changes show the delta.
| Action | Ticker | Instruction |
|---|---|---|
| SELL | GLD | Sell 33% of GLD position (reduce 15.00% → 10.00%) |
| SELL | URNM | Sell 25% of URNM position (reduce 10.00% → 7.50%) |
| SELL | XLE | Sell 50% of XLE position (reduce 5.00% → 2.50%) |
| SELL | VEGI | Sell 33% of VEGI position (reduce 7.50% → 5.00%) |
| SELL | IEMG | Sell entire IEMG position (2.50% of portfolio) |
| BUY | XAR | Buy XAR — 16.67% of freed cash (adds 2.50% to portfolio) |
| BUY | CIBR | Buy CIBR — 33.33% of freed cash (adds 5.00% to portfolio) |
| BUY | WEAT | Buy WEAT — 16.67% of freed cash (adds 2.50% to portfolio) |
| BUY | URA | Buy URA — 16.67% of freed cash (adds 2.50% to portfolio) |
| BUY | SLV | Buy SLV — 16.67% of freed cash (adds 2.50% to portfolio) |
Current Portfolio After Trade
Combined holdings across all 4 active tranches. Each tranche is 25% of the portfolio.
| Ticker | % of Portfolio | Weight Bar |
|---|---|---|
| SMH | 15.00% | |
| COPX | 10.00% | |
| PAVE | 10.00% | |
| CIBR | 10.00% | |
| GLD | 10.00% | |
| URNM | 7.50% | |
| XAR | 7.50% | |
| VEGI | 5.00% | |
| REMX | 5.00% | |
| IGV | 5.00% | |
| WEAT | 5.00% | |
| XLE | 2.50% | |
| ITA | 2.50% | |
| URA | 2.50% | |
| SLV | 2.50% |
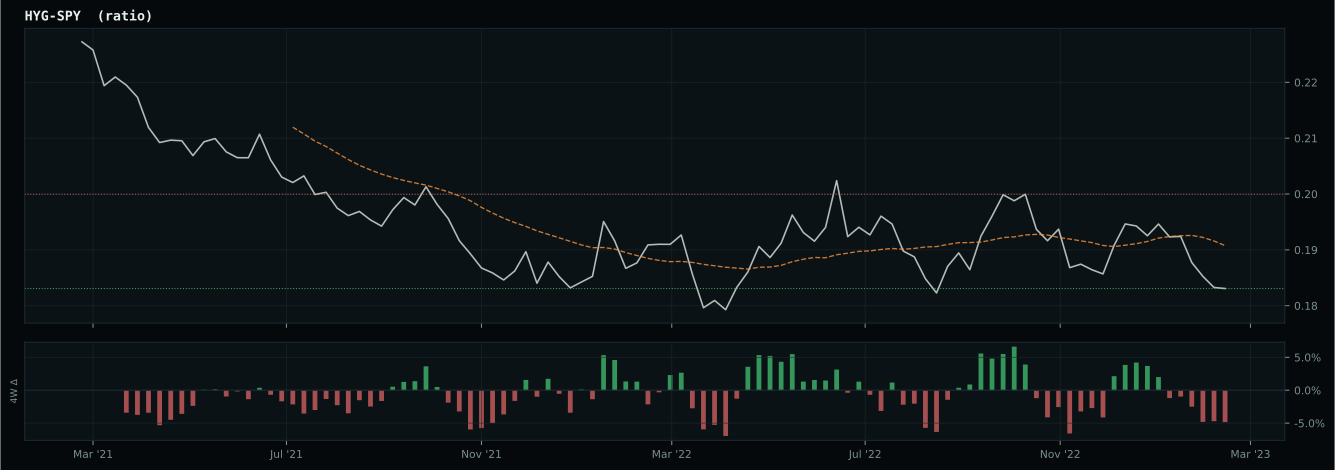
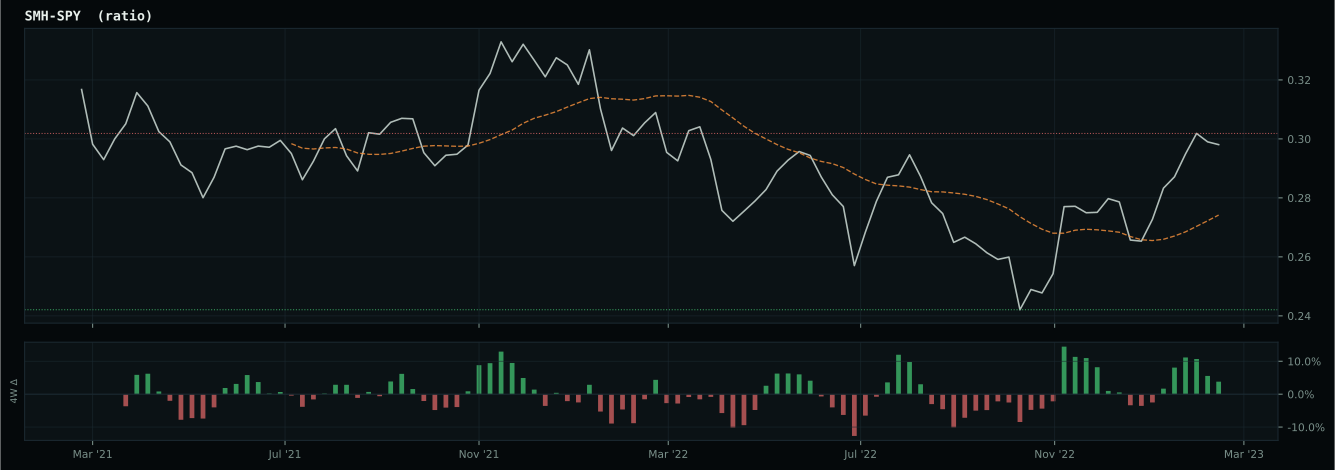
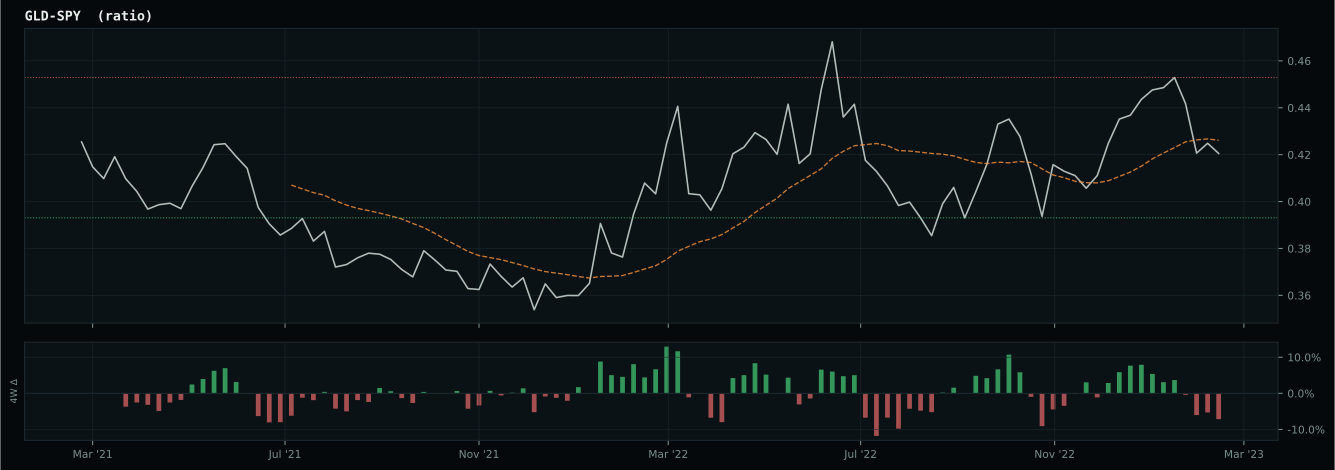
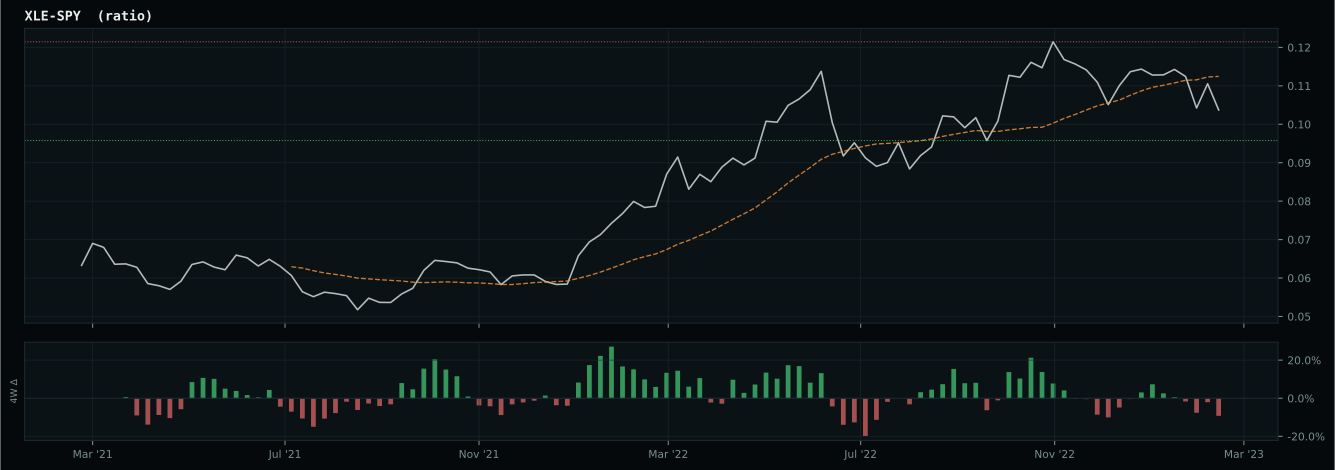
Macro Regime — Disinflation
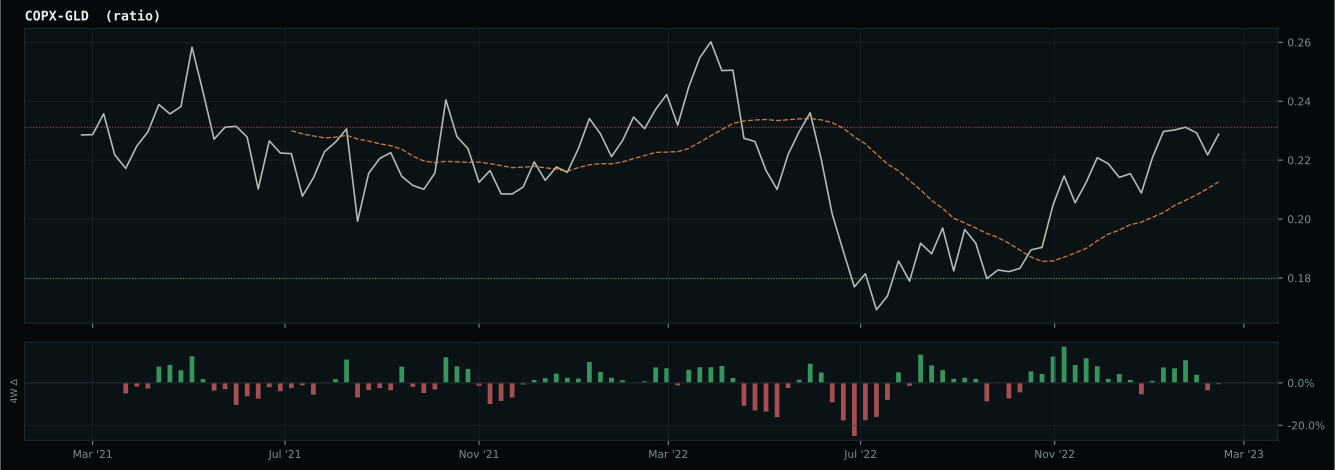
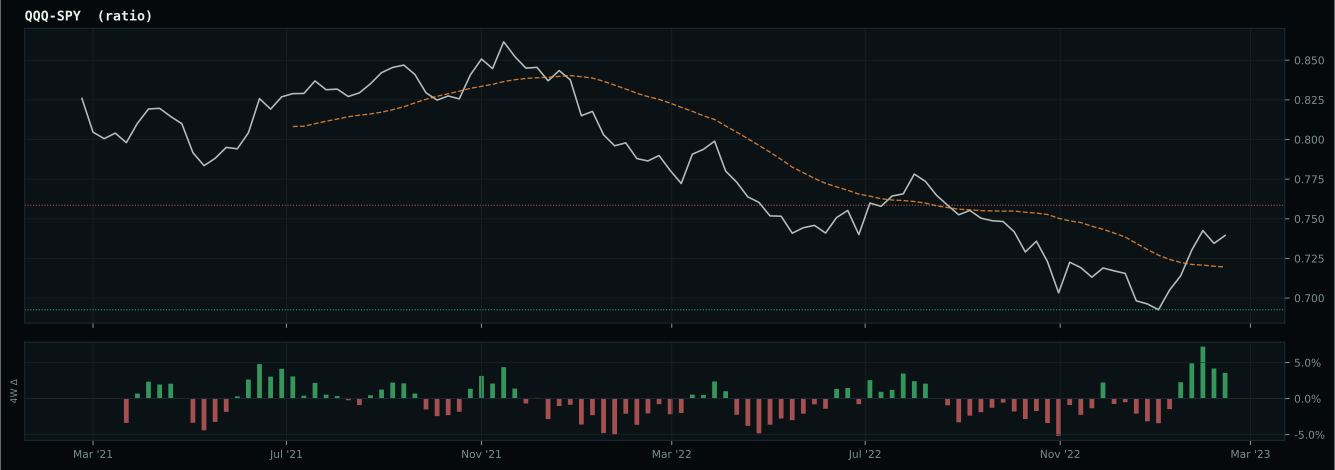
Macro Evidence Charts
Market-implied signals behind the macro regime scores. Each ratio compares two assets; the direction and slope of the ratio is what the macro engine reads.
Crypto Regime — NoCrypto
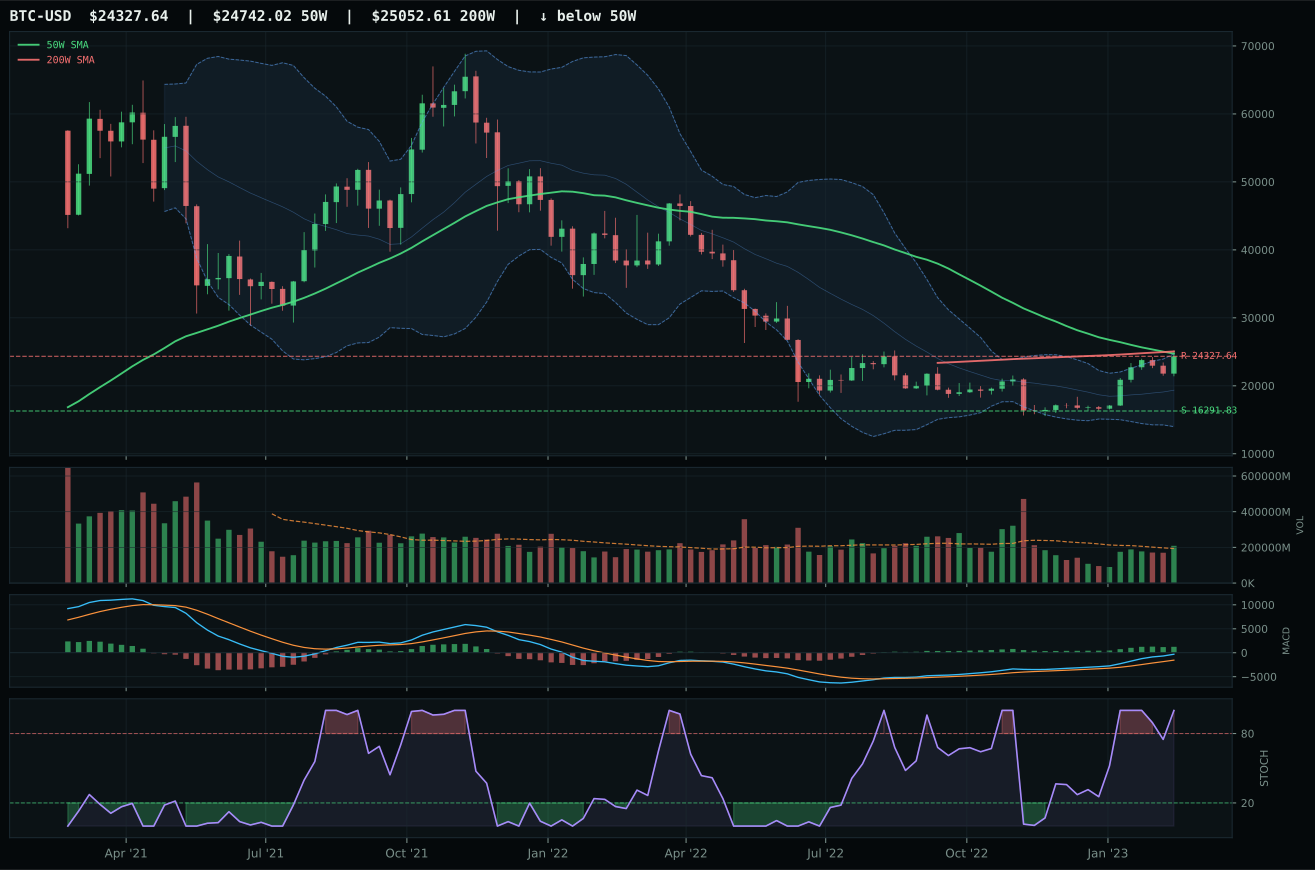
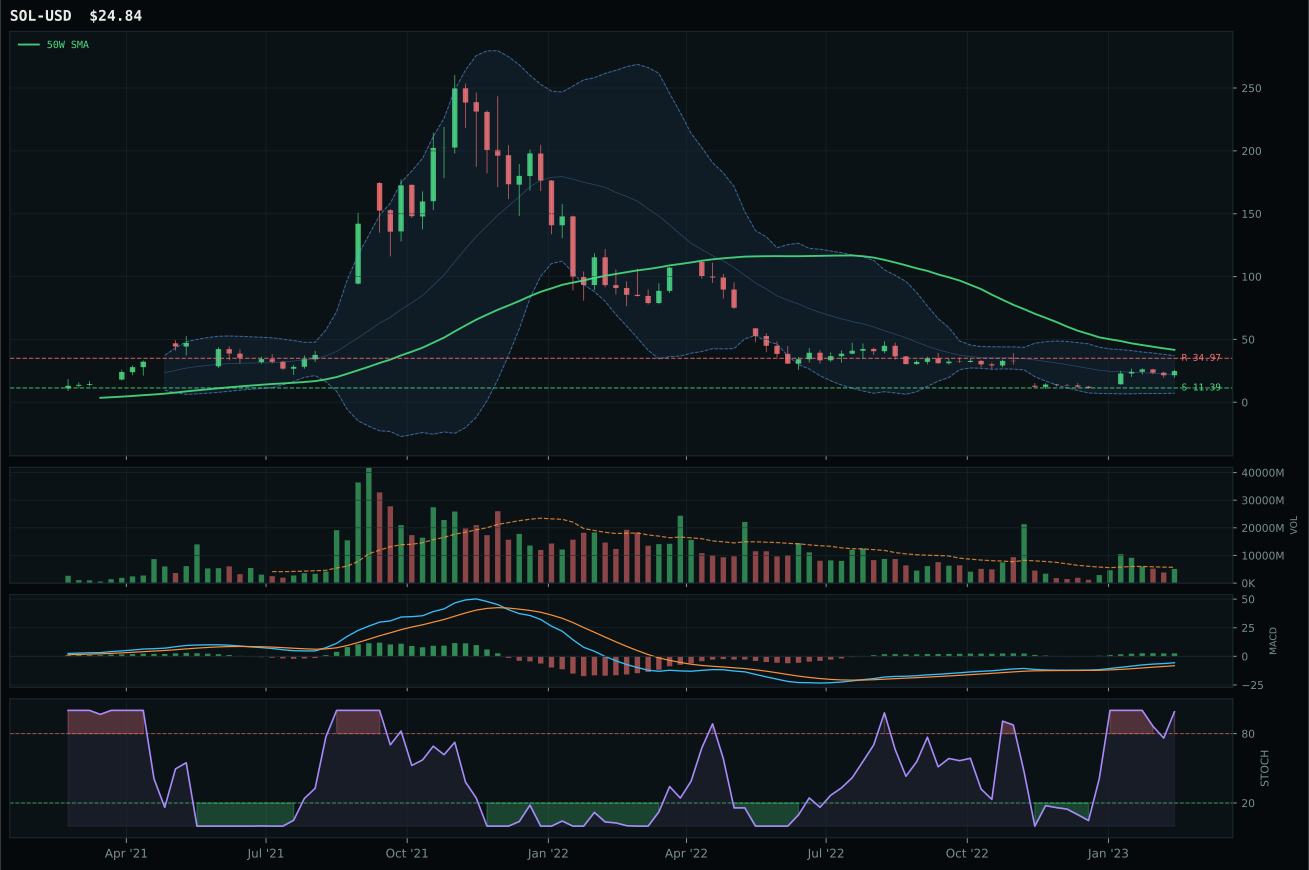
ValueBTC armed; waiting for 50W reclaim, decisive close above post-touch range resistance by 3%, close above 200W
TrendBTC not confirmed
one or more available conditions failed
Category Rankings
| Rank | Category | Winner | Score | Alloc | 4W Ret | Peers (4W) |
|---|---|---|---|---|---|---|
| 1 | Industrial Metals | COPX | 63.0 | 20% | -9.41% | PICK -10.0% · REMX -13.2% |
| 2 | Technology | CIBR | 60.6 | 20% | -2.07% | IGV +2.0% · XLK +3.6% |
| 3 | Utilities & Infrastructure | PAVE | 58.1 | 10% | -8.61% | IGF -2.4% · XLU -2.1% |
| 4 | Defense & Aerospace | XAR | 58.0 | 10% | -7.22% | ITA -5.3% · ROKT -7.8% |
| 5 | AI | SMH | 57.8 | 10% | +5.02% | BOTZ +2.3% · AIQ -0.6% |
| 6 | Nuclear Energy | URA | 54.8 | 10% | -12.12% | URNM -14.4% · NLR -5.5% |
| 7 | Precious Metals | SLV | 49.0 | 10% | +2.24% | GLD +7.6% · GDX +9.7% |
| 8 | Agriculture & Livestock | WEAT | 29.9 | 10% | -8.74% | MOO -7.0% · VEGI -7.7% |
| 9 | Emerging Markets | INDA | 6.9 | 0% | -4.19% | ILF -7.7% · IEMG -4.5% |
| 10 | Traditional Energy | XLE | 1.3 | 0% | -9.53% | XOP -9.6% · FCG -9.1% |
Industrial Metals — COPX
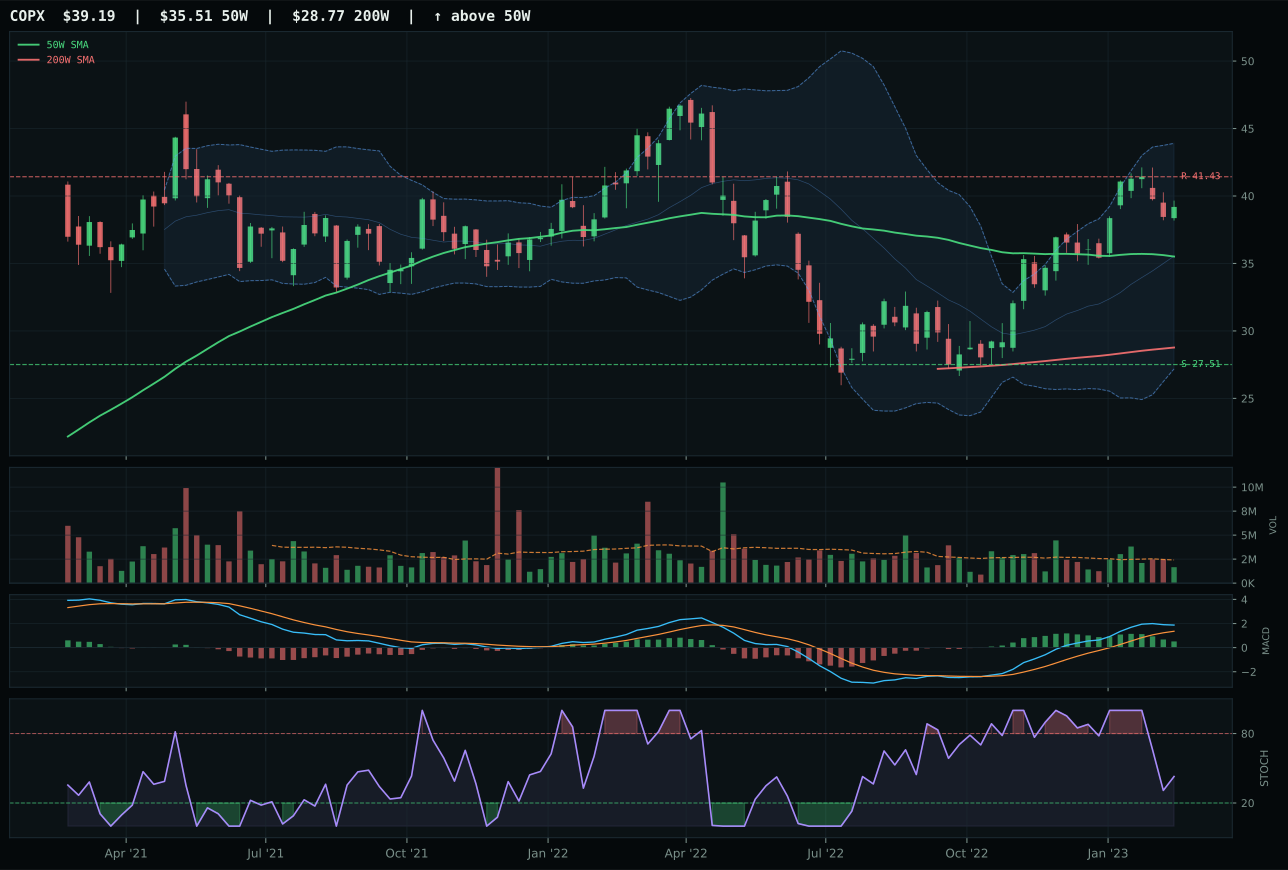
COPX has a neutral structure profile with 14.3% 13-week relative strength versus SPY.
A failed hold above support would weaken the setup.
Actionable but governed by invalidation levels.
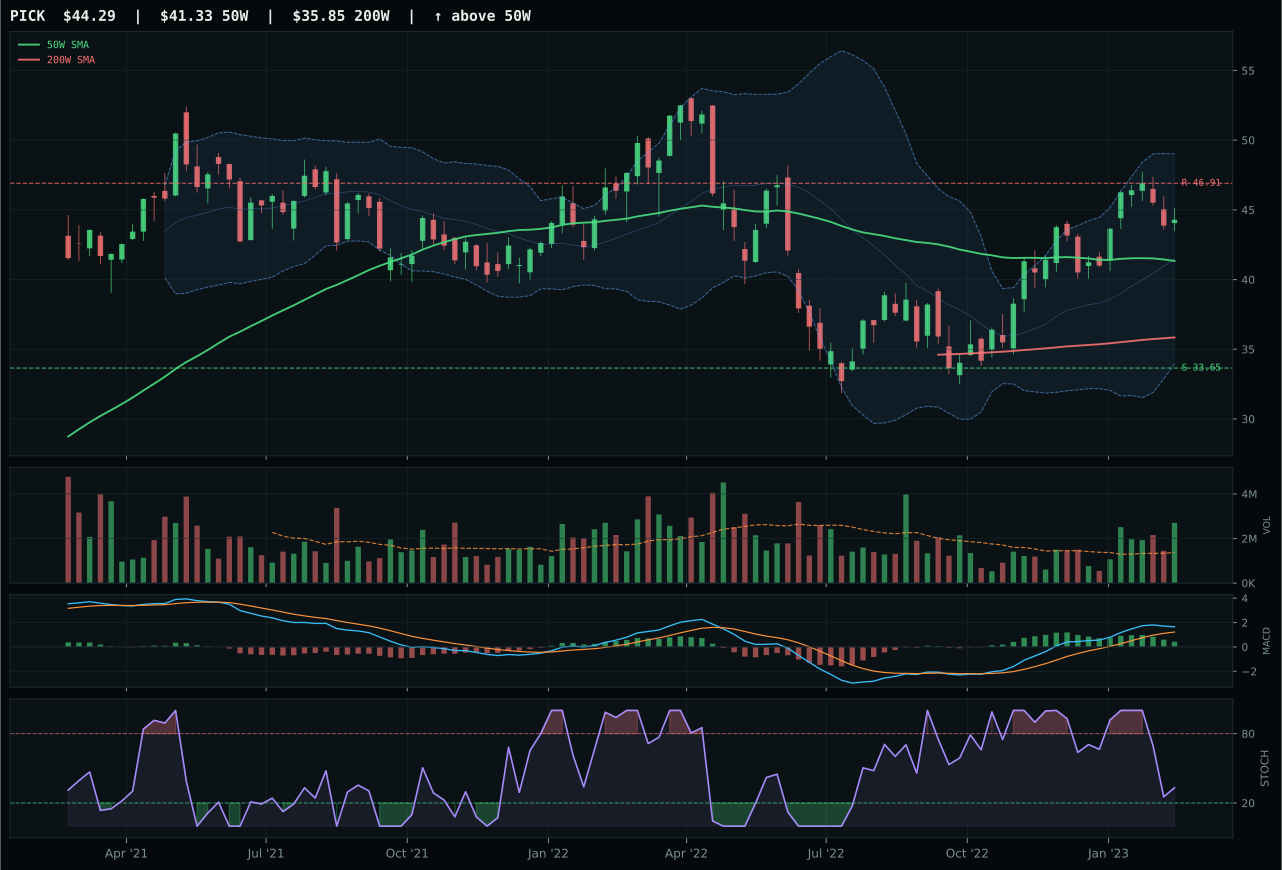
PICK has a neutral structure profile with 6.5% 13-week relative strength versus SPY.
A failed hold above support would weaken the setup.
Actionable but governed by invalidation levels.
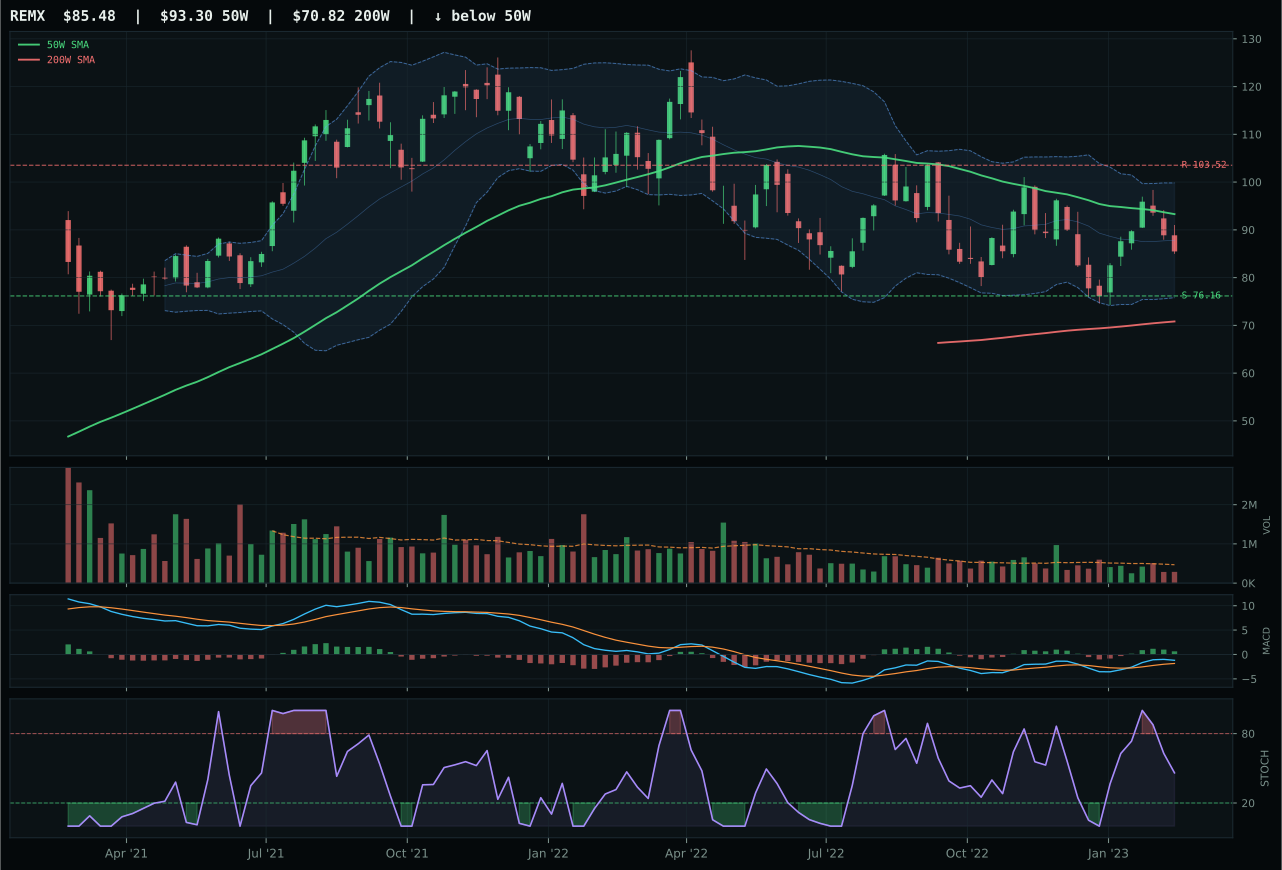
REMX has a neutral structure profile with -7.8% 13-week relative strength versus SPY.
A failed hold above support would weaken the setup.
Actionable but governed by invalidation levels.
COPX captured Industrial Metals by translating raw 13-week momentum of 17.1% and 14.3% SPY-relative outperformance into sustainable technical confirmation across multiple planes. The copper story trades above both moving averages with a near-flat 50W slope at -0.3%, setting up as a controlled breakout rather than a climactic extension; 10.4% above the 50W provides breathing room but avoids the overextension penalty. Momentum confirmation reached 94.3, driven by category-relative strength of 7.8% versus PICK's 0.0%—this spread reflects that copper scarcity narratives are outpacing the broader mining complex. PICK offered better volume participation at 0.84x (versus COPX's 0.69x), and its technical evidence of 77.1 ranked higher, but COPX's superior relative strength within the category and macro sponsorship from metals scarcity (+12) and commodity breadth positive (+7) created an irreversible decision. Risk-reward is modest at 47.3 for COPX, but the 42.5% downside to support absorbs normal drawdowns in a commodity uptrend.
Industrial Metals earned its 20% top-2 allocation by ranking second among all eligible categories at 63.0, supported by a category-level macro fit of 65.0 that reflects three active tailwinds: metals scarcity at +14, commodity breadth positive at +10, and real asset sponsorship at +6. The reasoned ETF proof order (COPX 74.4, PICK 72.6, REMX 34.4) demonstrates robust category health—the top two candidates are separated by only 1.8 points and both exceed the 70.0 threshold. COPX's final score of 63.0, combined with CIBR's 60.6, provides balanced 20% allocations to themes with opposing macro sensitivities: technology benefits from disinflation and positive risk appetite, while industrial metals benefit from commodity scarcity and real asset sponsorship. The positioning reflects that in early disinflation cycles, infrastructure and transition demand can sustain commodity prices even as growth expectations compress. COPX's thin volume participation is the only technical reservation, but the 94.3 momentum confirmation and category-relative leadership overcome this concern.
Technology — CIBR
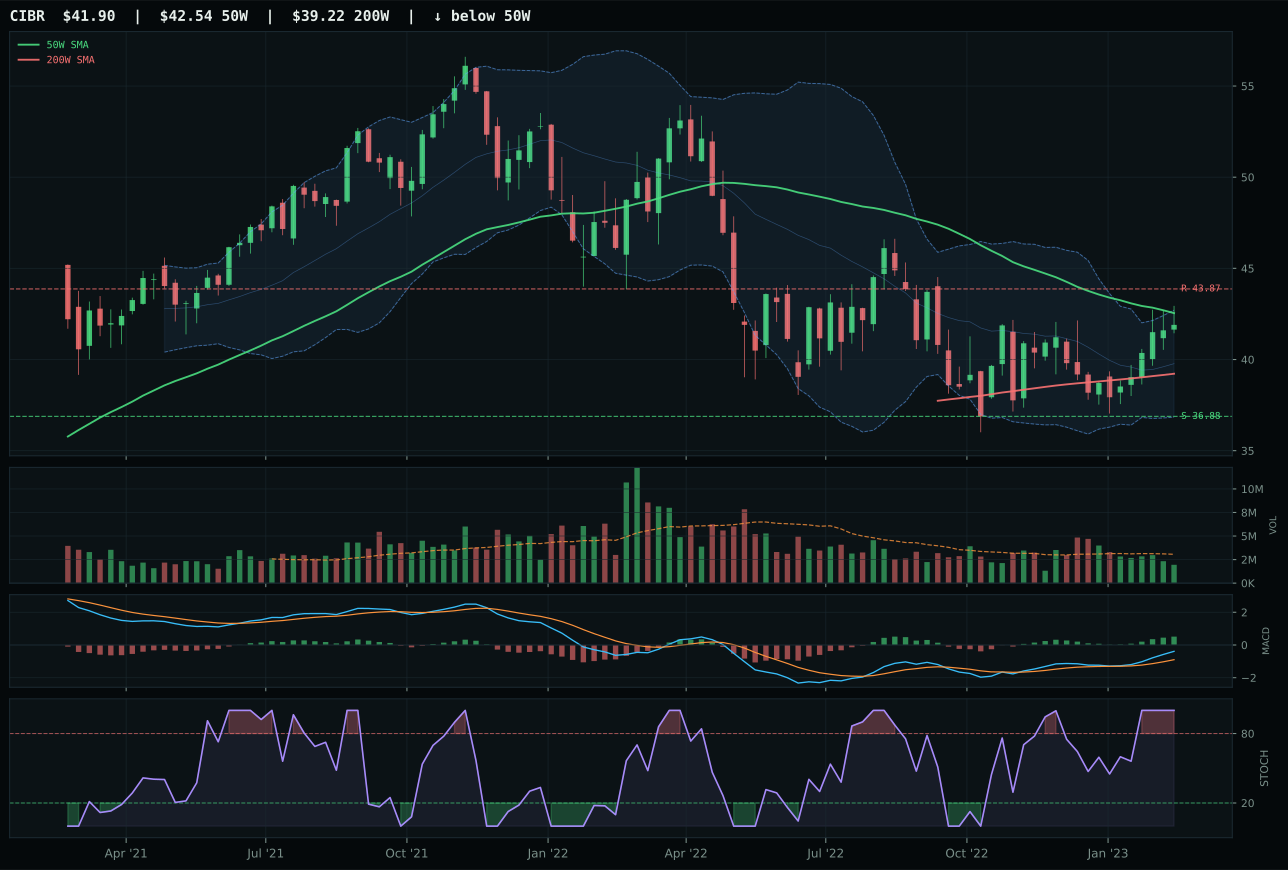
CIBR has a compression near 50W profile with 0.9% 13-week relative strength versus SPY.
A failed hold above support would weaken the setup.
Actionable but governed by invalidation levels.
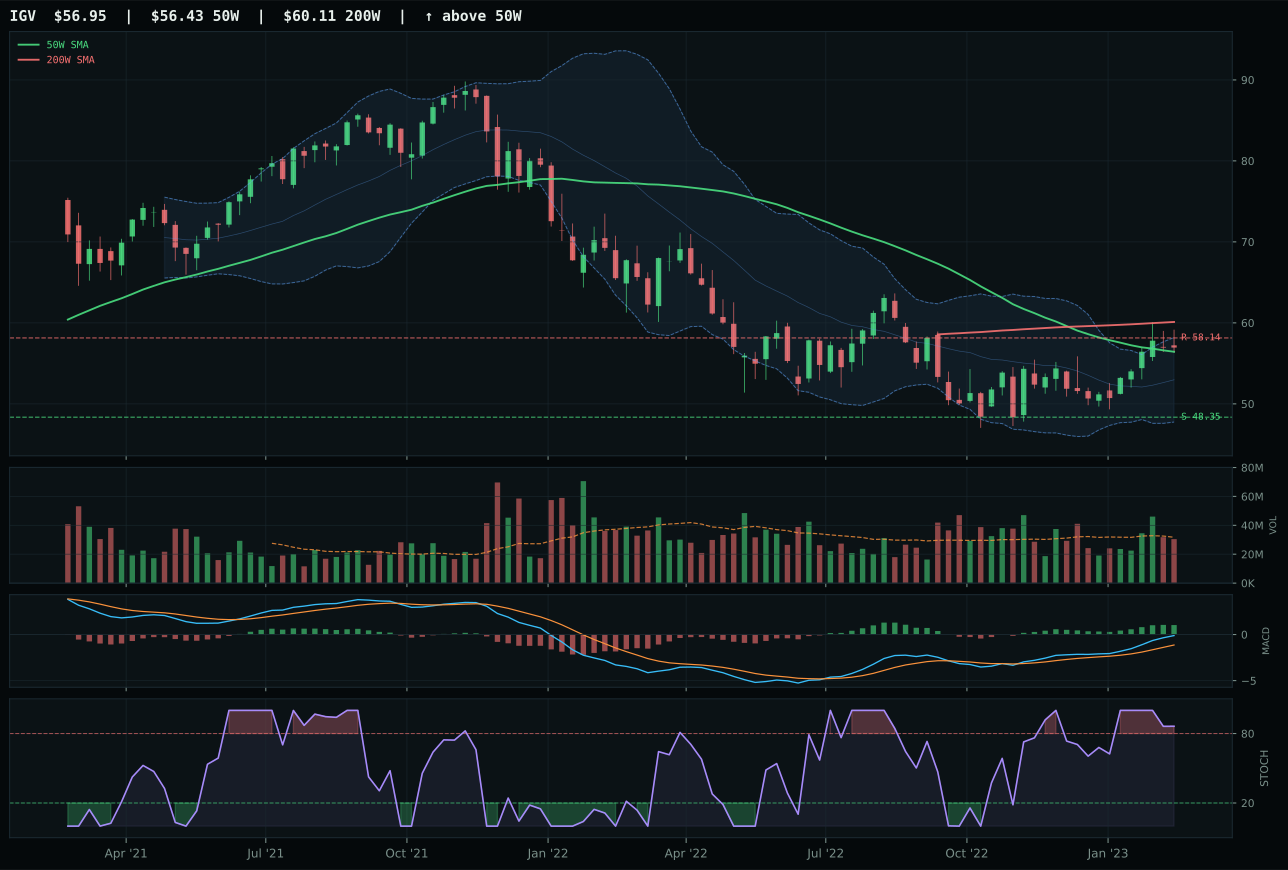
IGV has a compression near 50W profile with 5.9% 13-week relative strength versus SPY.
A failed hold above support would weaken the setup.
Actionable but governed by invalidation levels.
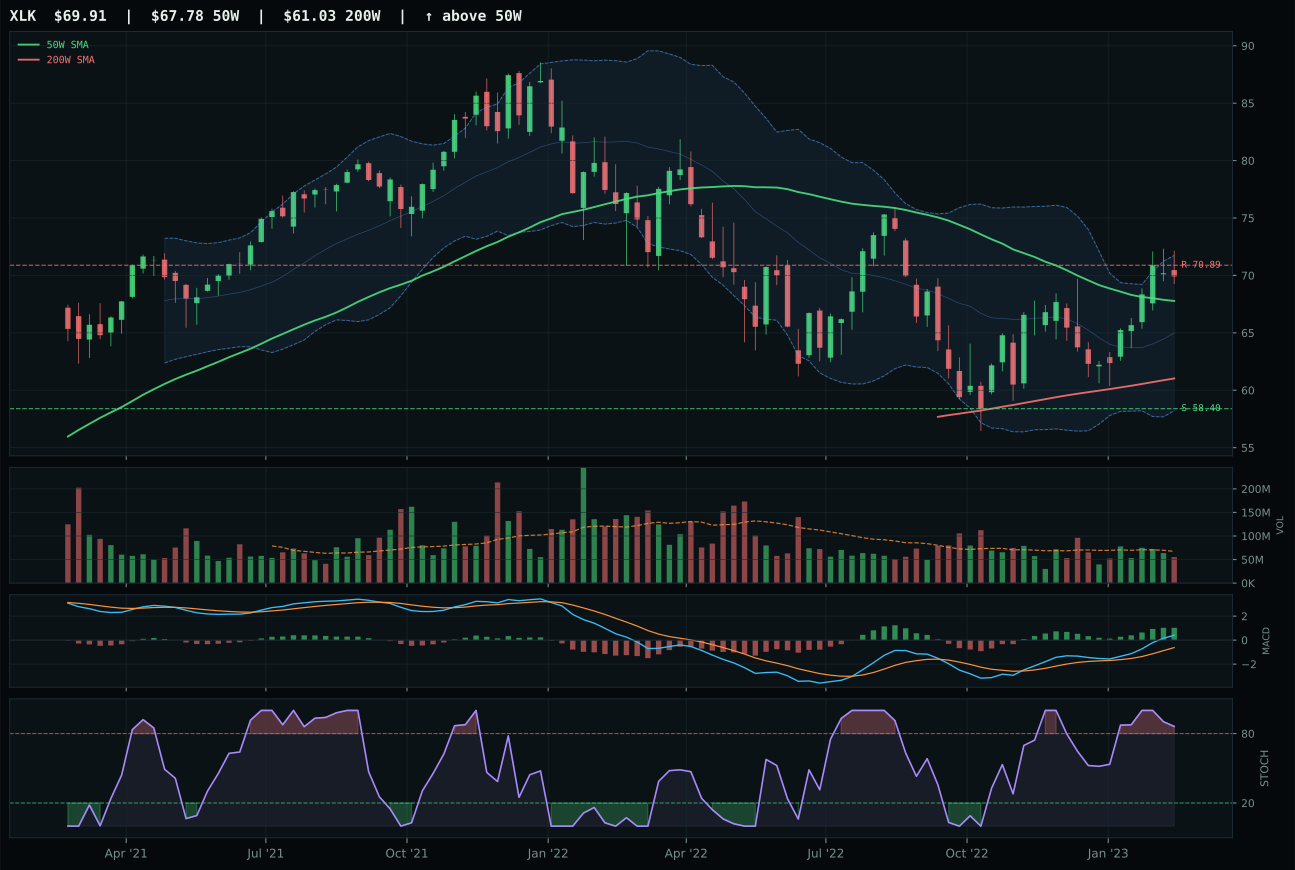
XLK has a neutral structure profile with 3.0% 13-week relative strength versus SPY.
A failed hold above support would weaken the setup.
Actionable but governed by invalidation levels.
CIBR captured the category by trading closer to its 50-week moving average—just 1.5% below it—while maintaining MACD confirmation and an overbought stochastic RSI reading that signals momentum concentration rather than exhaustion. The cybersecurity narrative benefits from credit stress fears in the current macro regime, and the setup's deep retracement into the Fibonacci 0.618 zone at 42.87 creates a defined entry with limited downside risk. IGV, the runner-up, suffered from weaker timing mechanics: its stochastic RSI was rolling over rather than sustainably elevated, and it sits further from support, giving it a riskier risk-reward profile of 55.1 versus CIBR's 58.9. The category's compression near the 50W across both candidates suggests controlled entry conditions, but CIBR's thinner volume participation at 0.64x the 20-week average—though counterintuitive—reflects selective accumulation by committed buyers rather than broad retail chase.
Technology earned its 20% allocation slot by ranking second among all eligible categories at 60.6, driven by a potent combination of technical cleanliness and macro tailwinds. Disinflation pressure and positive risk appetite are both active descriptors, and they directly support technology's structural appeal in a regime where growth trades get repriced higher. The category's 3/2/1 weighted ETF basket scored 63.3 before stress-testing, and CIBR's compressed, near-support setup reduces the probability of a false breakout. However, this allocation reflects tight timing rather than conviction—credit stress is a -4 headwind, and liquidity stress subtracts another 10 points from the macro fit score. The position holds because the technical proof order (IGV at 66.5, XLK at 61.0, CIBR at 58.3) demonstrates that even the category's third-ranked representative still qualifies on price action and momentum confirmation; Technology's macro fit of 60.0 is above neutral, making it defensible as a top-2 bet.
Utilities & Infrastructure — PAVE
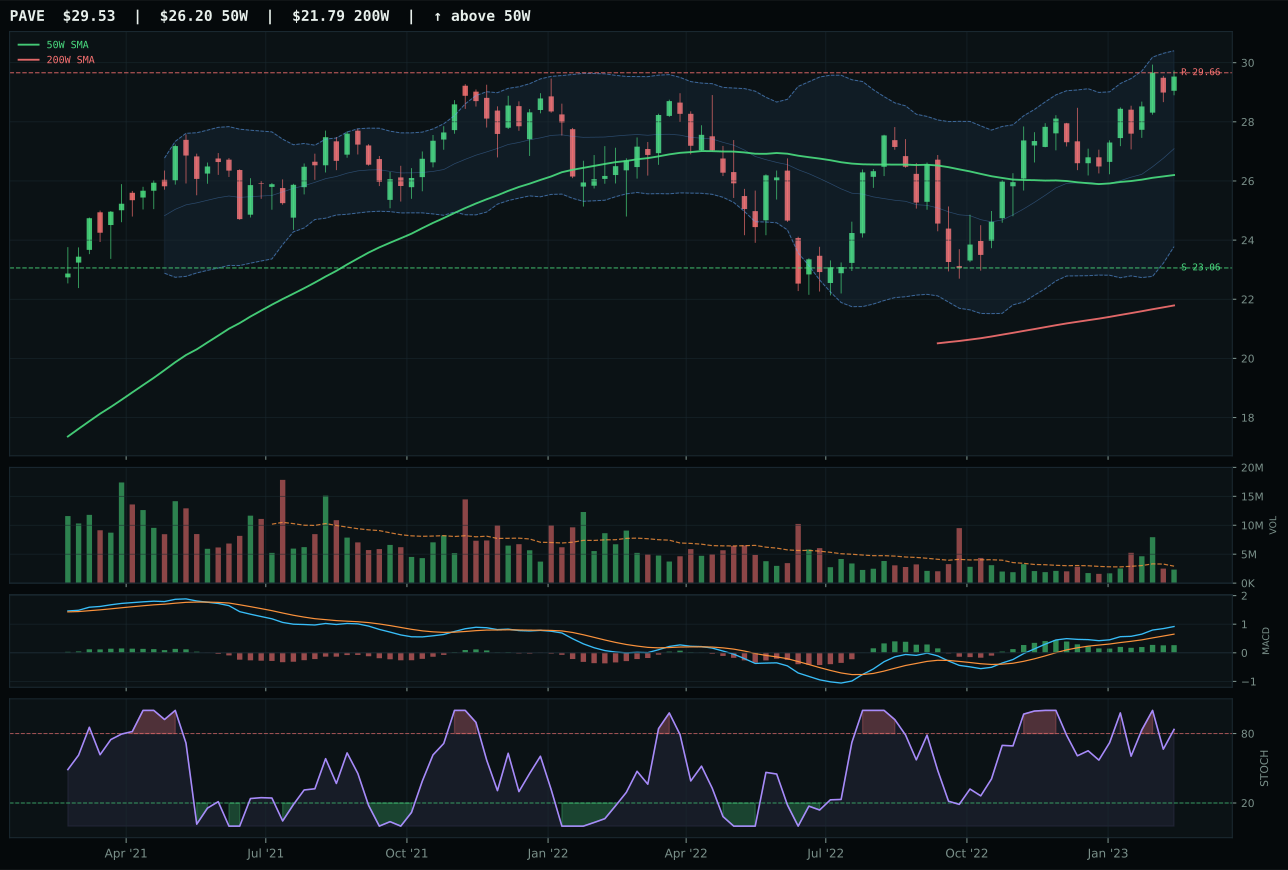
PAVE has a neutral structure profile with 5.1% 13-week relative strength versus SPY.
A failed hold above support would weaken the setup.
Actionable but governed by invalidation levels.
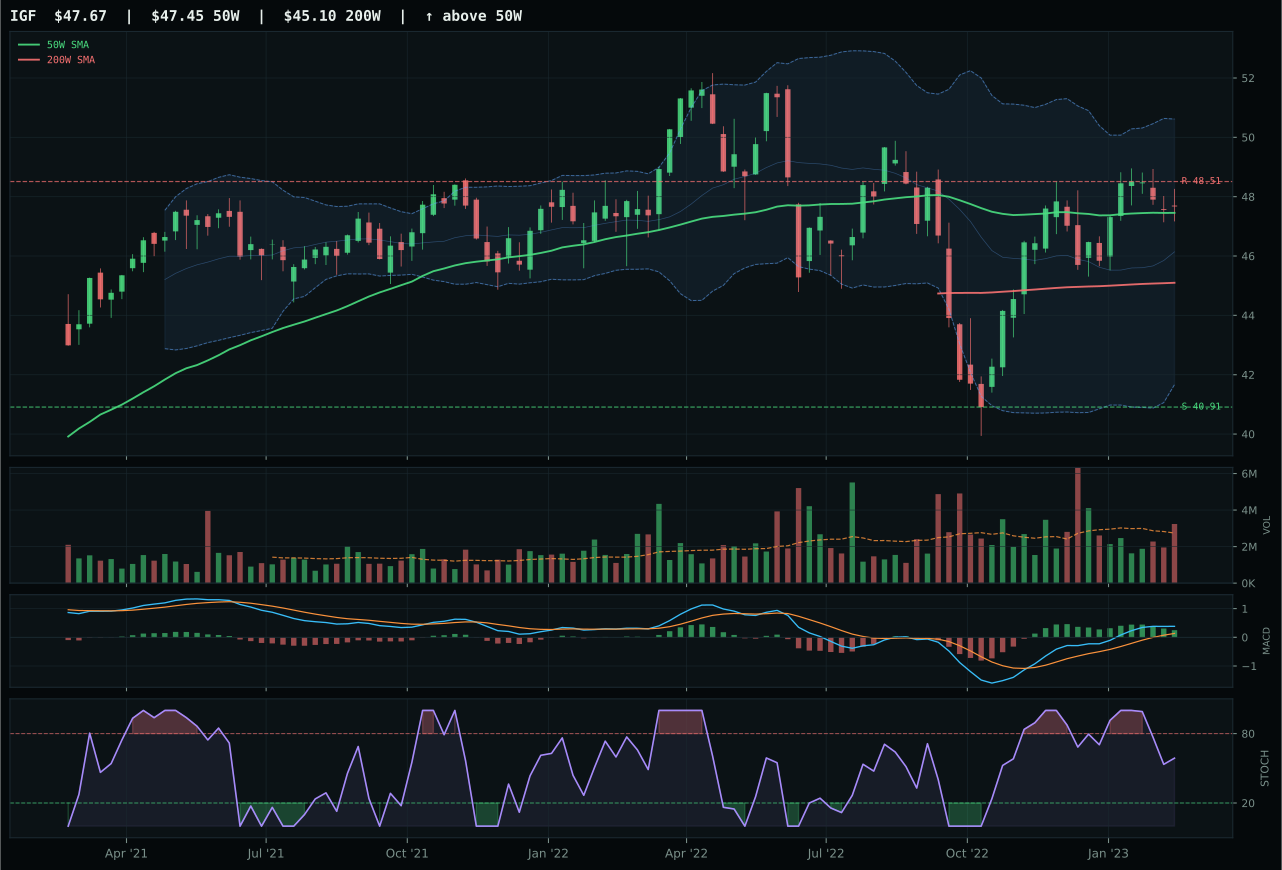
IGF has a compression near 50W profile with -0.2% 13-week relative strength versus SPY.
A failed hold above support would weaken the setup.
Actionable but governed by invalidation levels.
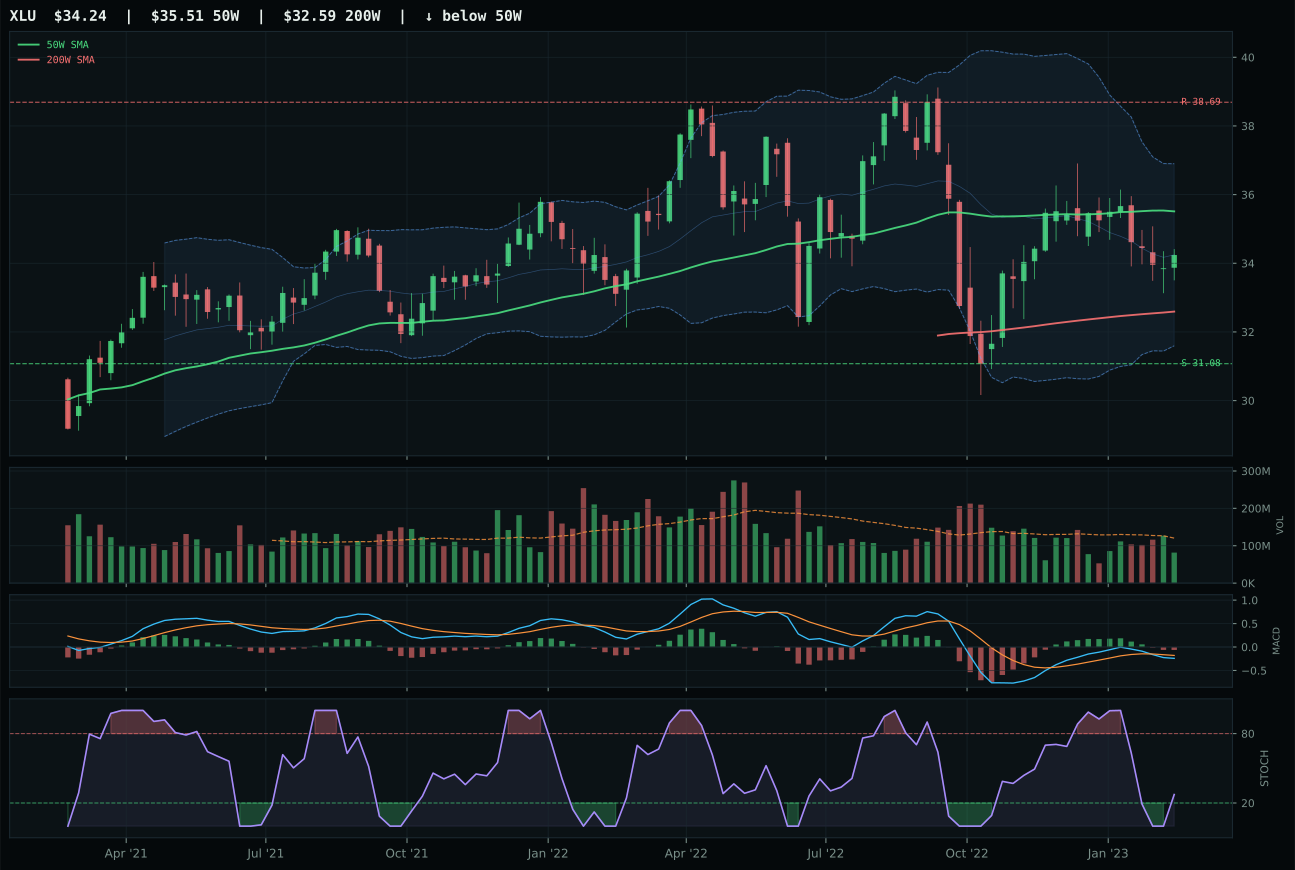
XLU has a neutral structure profile with -3.4% 13-week relative strength versus SPY.
A failed hold above support would weaken the setup.
Actionable but governed by invalidation levels.
PAVE captured utilities and infrastructure by combining a perfect 100.0 trend score—price above both moving averages with a 0.2% slope—with exceptional momentum confirmation of 98.4 and 80.0 volume-price confirmation. The domestic infrastructure story is extended 12.7% above the 50W, placing it near the 52-week high, but the neutral structure and compression metrics at 80.5 suggest this is accumulation at a new level rather than climactic extension. Category-relative strength of 5.3% indicates PAVE is the consensus long in the infrastructure cohort, and MACD bullish and improving provides conviction that the move is sponsored. IGF, the runner-up, ranked higher on absolute technical evidence at 67.4 versus PAVE's 83.6 after stress-testing, but IGF's MACD is only bullish but flattening—a momentum degradation signal—and its stochastic RSI is falling/neutral, indicating less active accumulation. The 1.5-point score gap is tight, but PAVE's volume-price confirmation at 80.0 versus IGF's 58.0 demonstrates superior institutional sponsorship.
Utilities & Infrastructure earned 10% despite a final category score of 58.1 because the macro fit of 62.0 is among the highest in the non-top-2 cohort, supported by disinflation helping this exposure at +7 and Transition/Mixed helping at +4. The reasoned ETF proof order (PAVE 75.1, IGF 64.7, XLU 25.9) shows a meaningful gap between the top two and the anchor, creating category confidence. PAVE's selection reflects that domestic infrastructure capex benefits from a low-rate disinflation environment where real yields decompress and long-duration assets reprice; the +5.1% SPY-relative strength over 13 weeks confirms this rotation is underway. Risk-reward at 37.3 is the lowest in the portfolio, meaning PAVE is at resistance with limited upside room, but the 98.4 momentum confirmation and 72.2 persistence scores indicate the move is self-reinforcing. This allocation balances the technology theme (growth-sensitive) with infrastructure (rate-sensitive), providing diversification across macro sensitivities within the growth-oriented top four categories. PAVE's extended positioning requires discipline: a close below the 50W support at 23.06 would trigger downgrade.
Defense & Aerospace — XAR
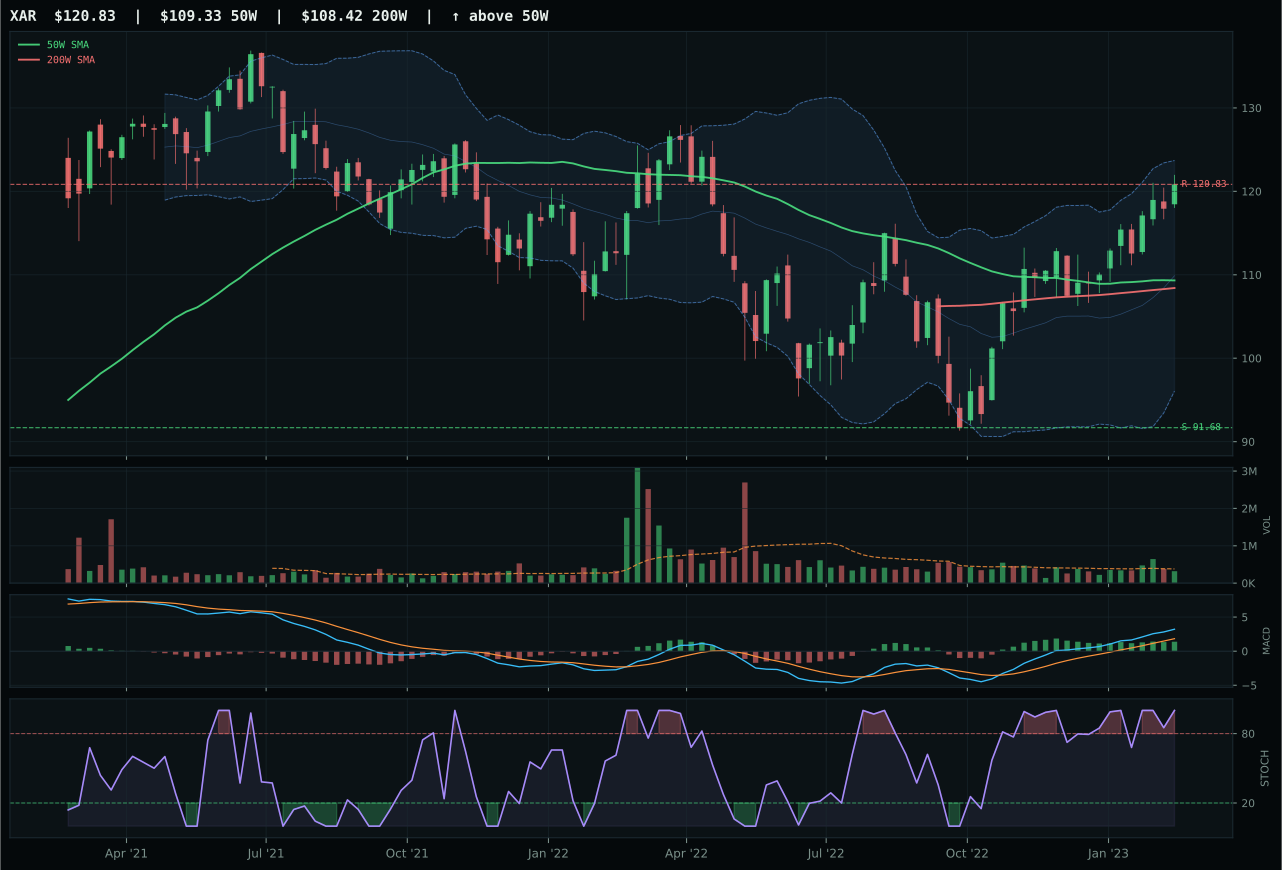
XAR has a neutral structure profile with 7.4% 13-week relative strength versus SPY.
A failed hold above support would weaken the setup.
Actionable but governed by invalidation levels.
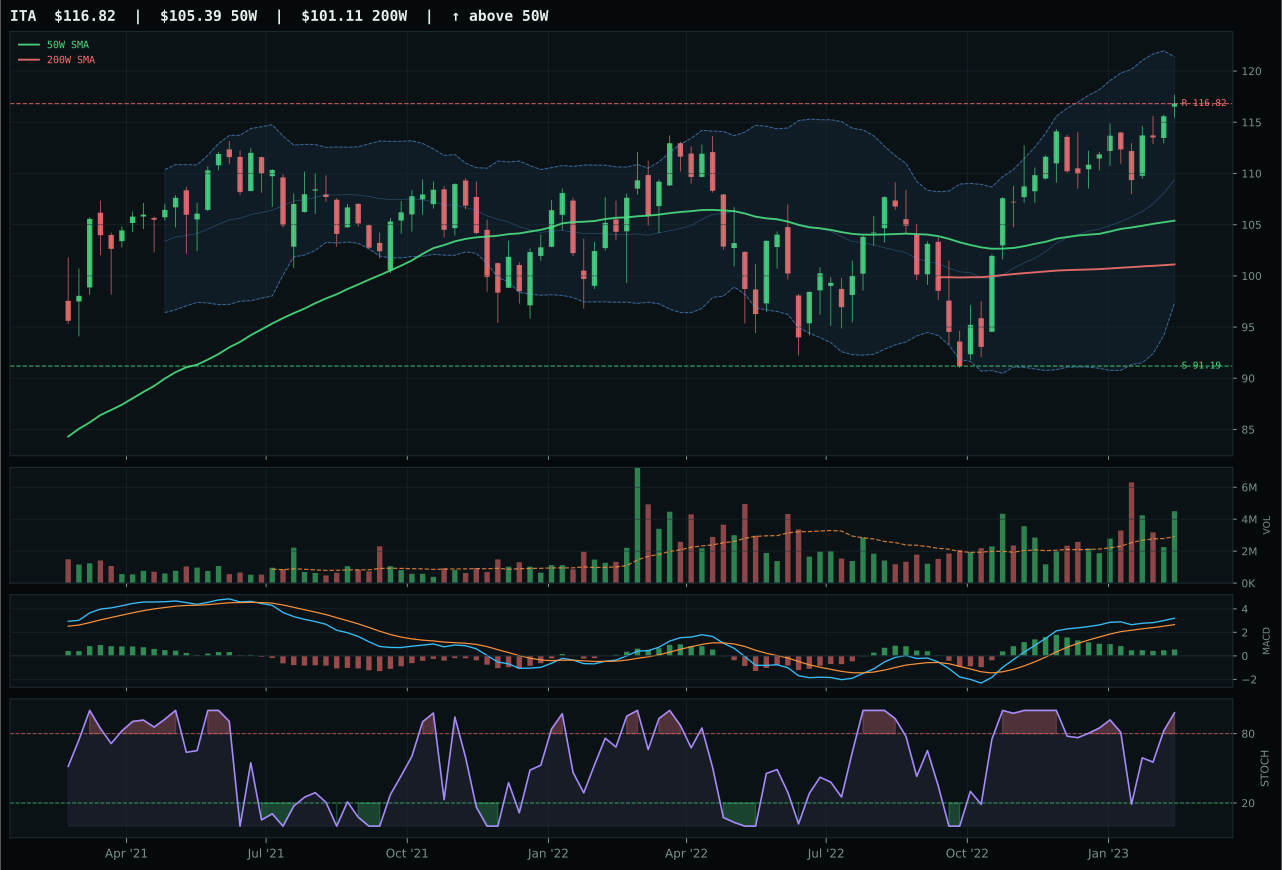
ITA has a neutral structure profile with 3.5% 13-week relative strength versus SPY.
A failed hold above support would weaken the setup.
Actionable but governed by invalidation levels.
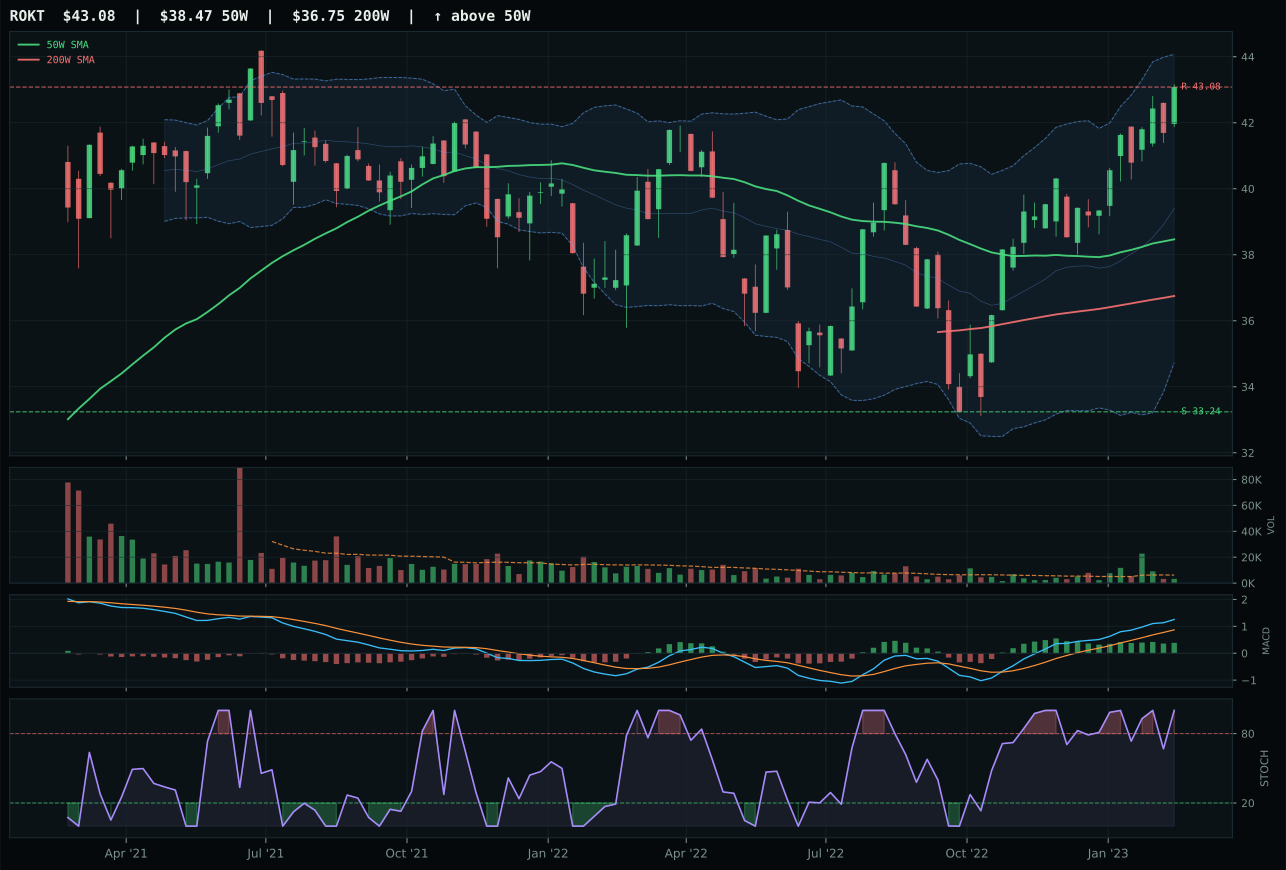
ROKT has a neutral structure profile with 7.2% 13-week relative strength versus SPY.
A failed hold above support would weaken the setup.
Tracked, but not top-2 eligible because: .
XAR edged out the competition by delivering a perfect 100.0 trend score—price at the 50W slope of exactly -0.0%, trading above both moving averages with superior SPY-relative strength at 7.4% versus ITA's 3.5%. The machinery of the setup is neutral structure with mid-zone compression, but XAR's 13-week momentum of 10.2% and category-relative strength of exactly 0.0% signal that this is the category-median performer, not an outlier. Risk-reward is modest at 49.5 versus ITA's 47.1, but the real advantage lies in timing: XAR's stochastic RSI is overbought and sustained, while ITA's is rolling over, and XAR's price sits at the 0.236 Fibonacci near the recent high, keeping it in the accumulation zone. ITA suffered a 3-point structural penalty despite higher volume confirmation and better macro narrative fit, losing primarily on timing degradation and the category-relative strength headwind.
Defense & Aerospace earned 10% despite a final category score of 58.0 because its macro fit of 51.0 is held back by neutral descriptor conditions rather than outright headwinds. The reasoned ETF proof order (ITA 79.2, XAR 73.4, ROKT 45.0) shows that the category's top representative is technically robust on an absolute basis, but after the 3/2/1 weighting and stress-testing against current macro state, the category rank fell below the top-two threshold. Credit stress delivers a +2 macro benefit, unusual in a disinflation regime, suggesting some demand for durability and cash flow; liquidity stress is only a -4 penalty, lighter than many categories. XAR holds the allocation because its 97.4 momentum confirmation score indicates strong volume-price sponsorship despite the neutral structure. Tactically, this position benefits from any risk-appetite recovery or defense spending narratives; strategically, it's a lower-conviction 10% slot that could rotate if liquidity stress accelerates or if XAR breaks below its 91.68 support.
AI — SMH
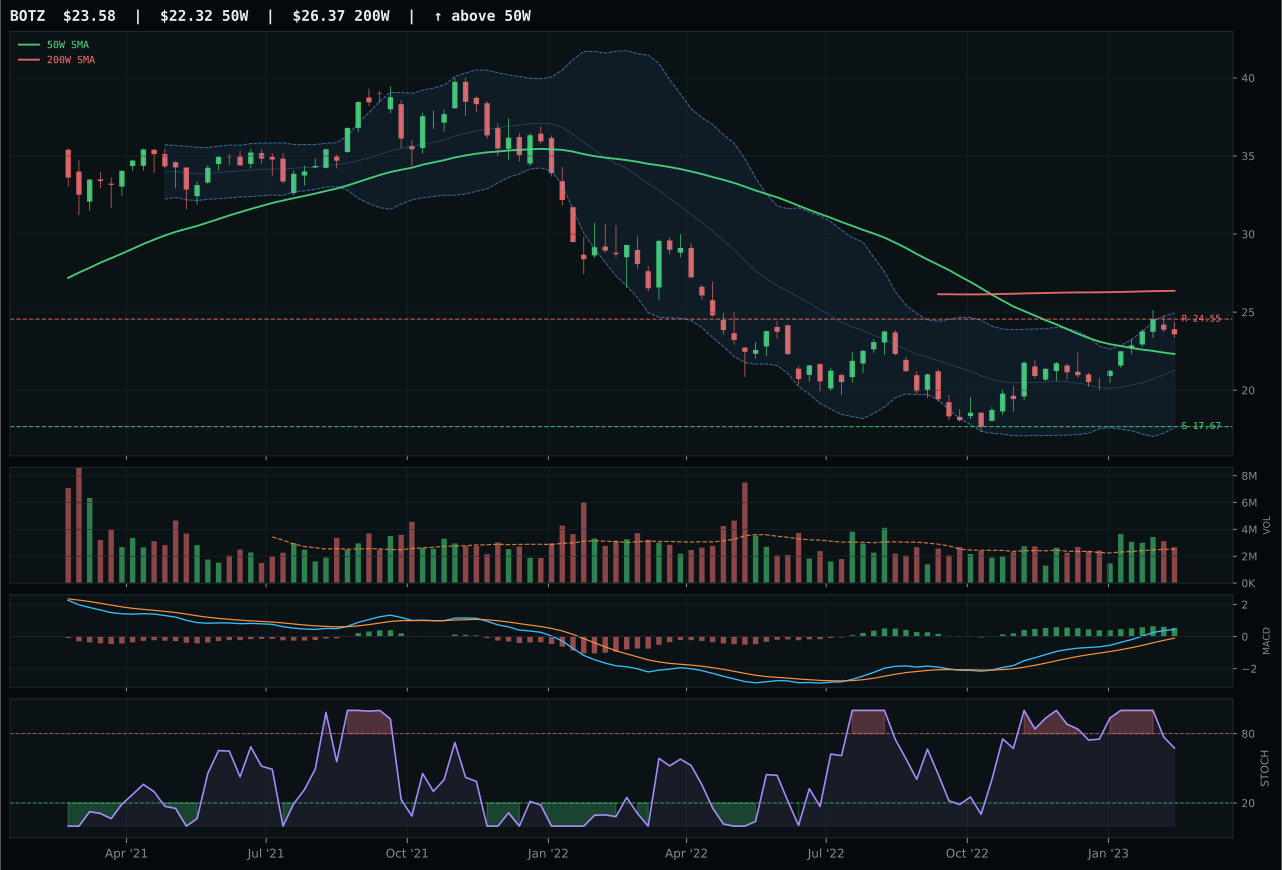
BOTZ has a neutral structure profile with 9.9% 13-week relative strength versus SPY.
A failed hold above support would weaken the setup.
Actionable but governed by invalidation levels.
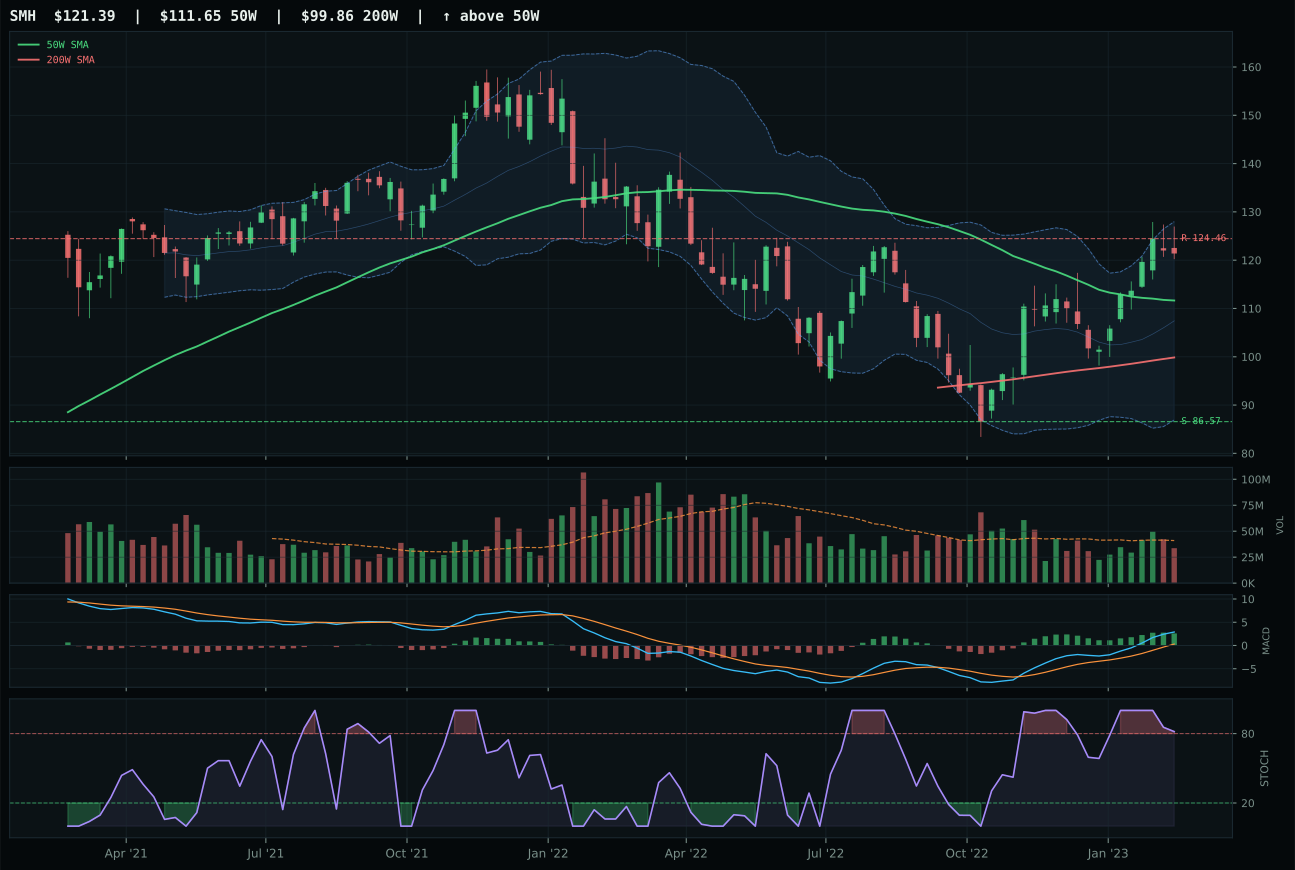
SMH has a neutral structure profile with 7.8% 13-week relative strength versus SPY.
A failed hold above support would weaken the setup.
Actionable but governed by invalidation levels.
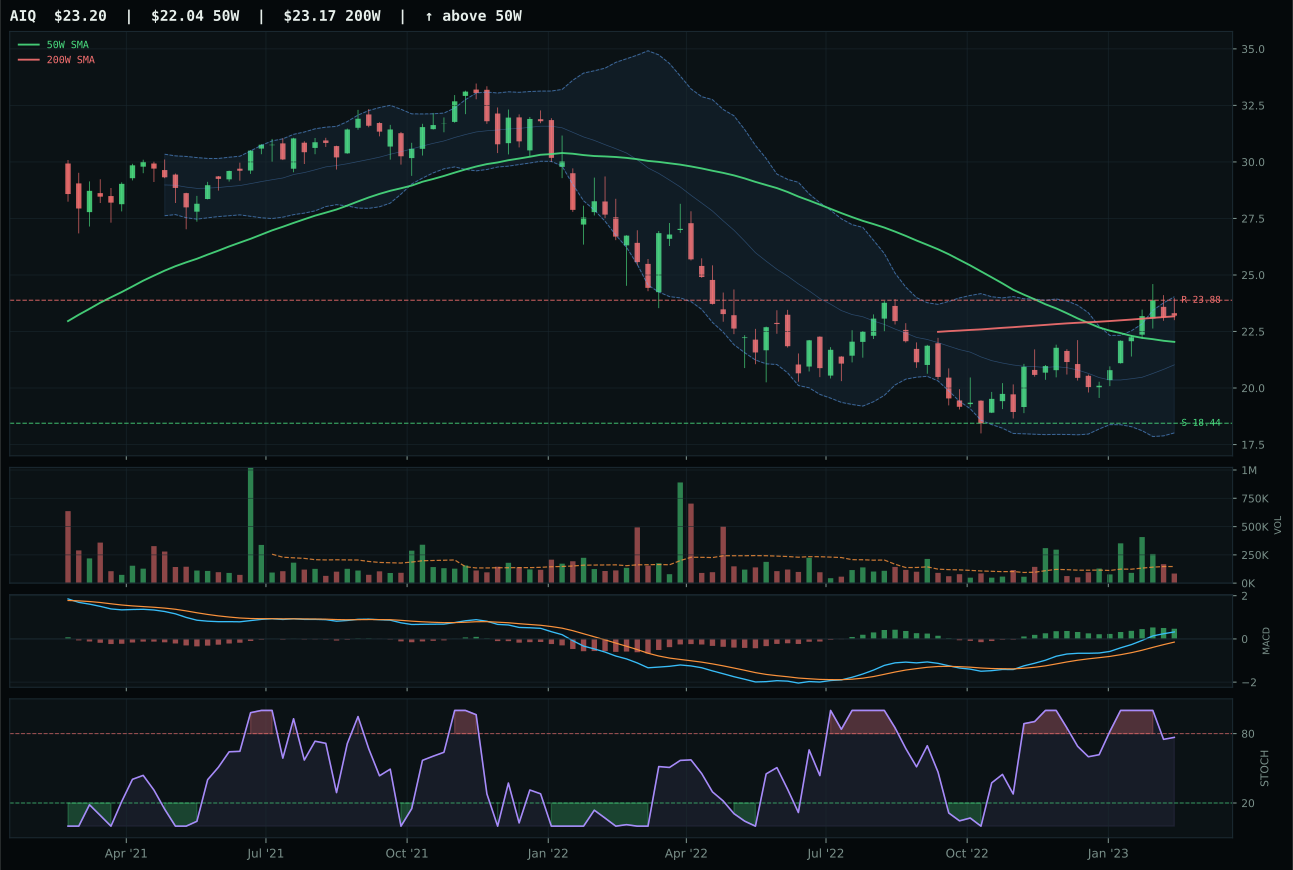
AIQ has a neutral structure profile with 9.9% 13-week relative strength versus SPY.
A failed hold above support would weaken the setup.
Tracked, but not top-2 eligible because: .
SMH won the AI category despite trailing BOTZ in absolute technical evidence (64.7 vs. 80.0) because it balanced superior trend confirmation with a cleaner price structure relative to its risk-reward setup. The semiconductor ETF's 90.0 trend score reflects price solidly above both the 50W and 200W, with a near-flat 50W slope that provides stability; its 13-week return of 10.6% combined with 7.8% outperformance versus SPY demonstrates that AI compute leadership is actively owned. BOTZ, trading at 12.8% over 13 weeks, appeared stronger on momentum but scored lower on timing (57.0 vs. 75.0 for BOTZ) because SMH sits in the sweet spot of the decision zone rather than stretched into extension. Volume participation at 0.82x the 20-week average is neutral for both, but SMH's overbought stochastic rolling over rather than falling cleanly creates a less exhausted setup—one that has room to consolidate before the next leg.
AI held its 10% allocation despite ranking third among the eight active categories (57.8 final score) because the macro descriptor for AI growth sponsorship is firing at +14, offset only partially by liquidity stress at -12. The category's macro fit of 59.0 is respectable enough to keep pace with more economically sensitive themes, and SMH's technical evidence of 64.7 meets a reasonable threshold for a non-top-2 position. This is not a conviction call; it reflects that semiconductor and robotics exposures remain supported by structural spending on AI infrastructure despite near-term credit and liquidity headwinds. The reasoning layer tested the 3/2/1 basket at 64.5 (BOTZ ranked first at 72.1, SMH second at 62.9) and found that after stress-testing against volume-price confirmation and persistence metrics, neither ETF could break into the top two category rankings. SMH holds the allocation slot because it represents the cleanest entry; a deterioration in the AI growth sponsorship descriptor or a violation of SMH's 82.57 support level would warrant downgrade.
Nuclear Energy — URA
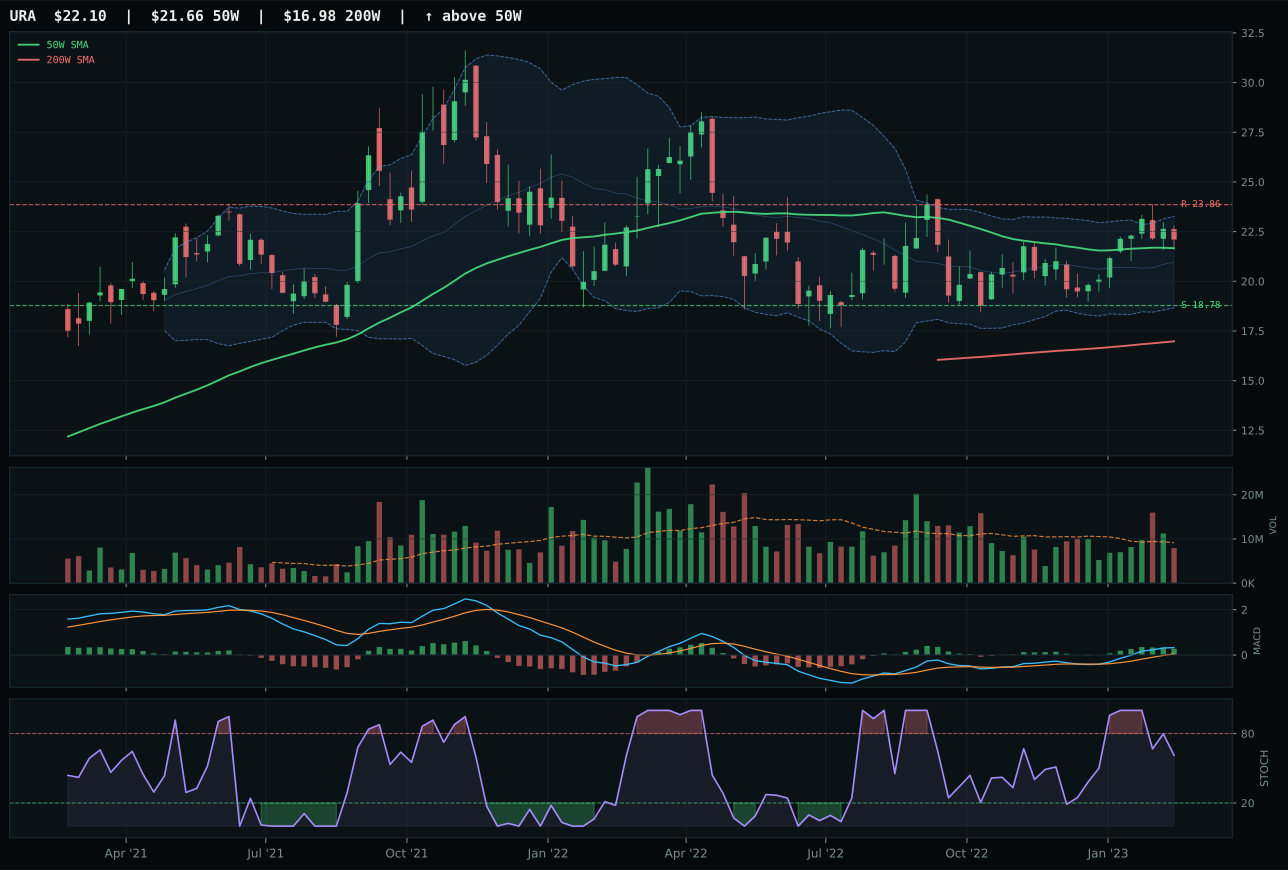
URA has a compression near 50W profile with 4.8% 13-week relative strength versus SPY.
A failed hold above support would weaken the setup.
Actionable but governed by invalidation levels.
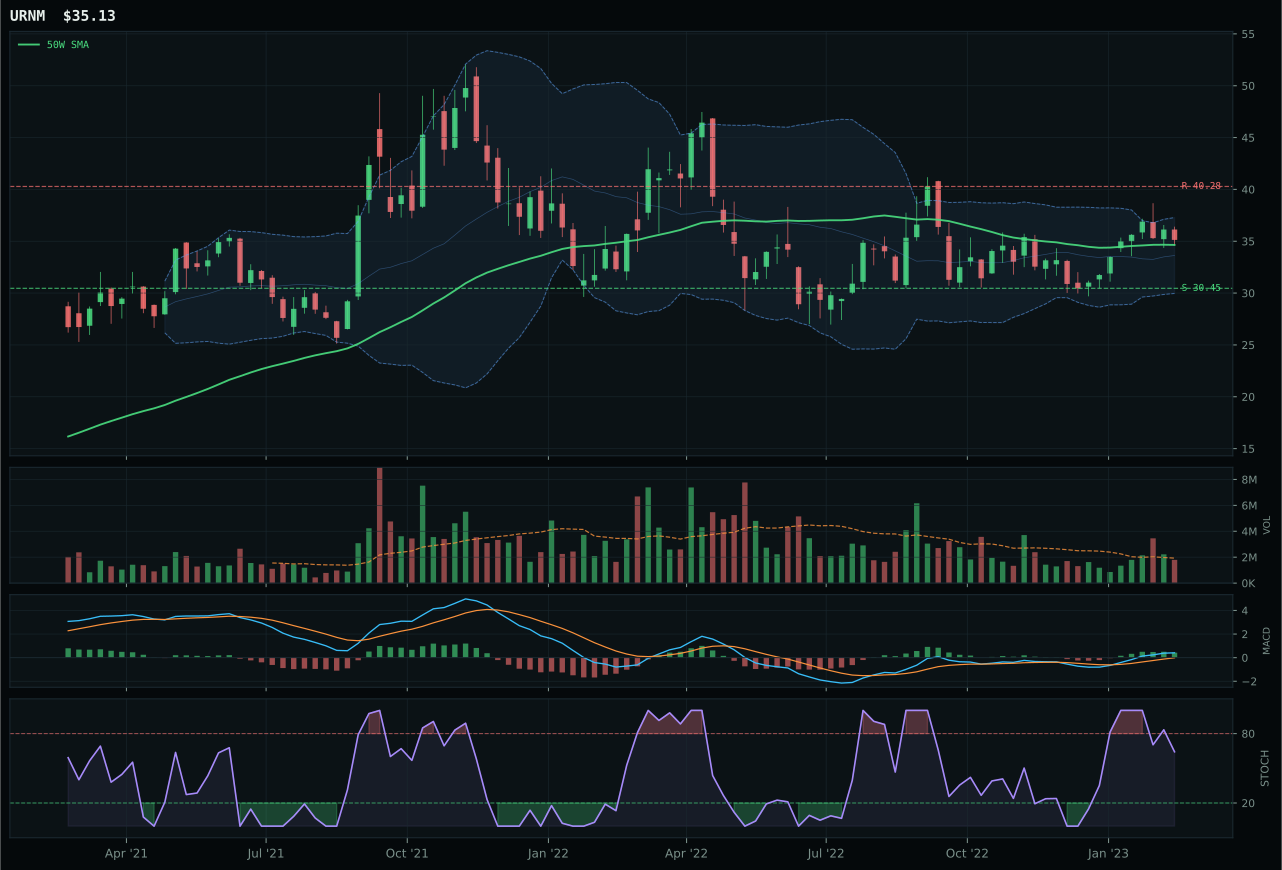
URNM has a compression near 50W profile with 5.1% 13-week relative strength versus SPY.
A failed hold above support would weaken the setup.
Actionable but governed by invalidation levels.
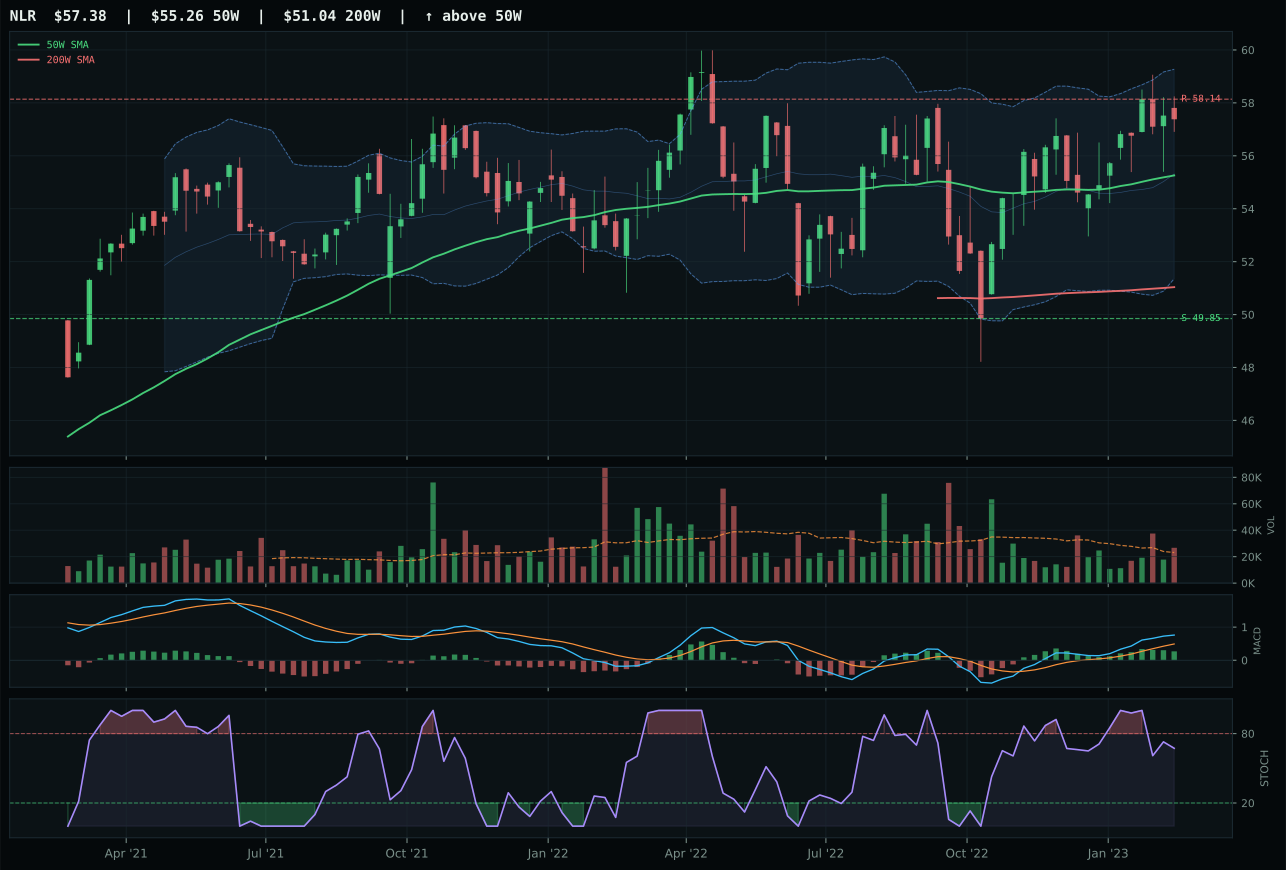
NLR has a neutral structure profile with 1.1% 13-week relative strength versus SPY.
A failed hold above support would weaken the setup.
Tracked, but not top-2 eligible because: .
URA won the nuclear energy category by a narrow 3-point margin over URNM, capitalizing on slightly cleaner structure (74.4 vs. 74.1) and identical timing perfection at 100.0. Both ETFs trade at compression near the 50W with bullish and improving MACD confirmation, and their 13-week returns (URA 7.6%, URNM 7.9%) are nearly identical, making this a decision between technical elegance and macro narrative strength. URA's 2.0% distance to the 50W is tighter than URNM's implied position, placing it in the exact middle retracement zone where risk-reward is most balanced. Stochastic RSI is falling/neutral for both, which actually strengthens the setup: neither candidate is overbought, so sustained accumulation can occur without requiring a momentum breakout. Category-relative strength at 0.0% for URA versus 0.3% for URNM is negligible, but URNM's superior risk-reward at 68.0 versus URA's 60.5 reflects URNM's stronger technical evidence; the margin of victory here is genuinely tight.
Nuclear Energy earned 10% despite ranking third in the non-top-2 cohort (54.8 final score) because its macro fit of 50.0 is neutral rather than headwind-laden, and two active descriptors support the category: real asset sponsorship at +7 and AI growth sponsorship at +5. The reasoned ETF proof order (URNM 73.0, URA 70.4, NLR 45.0) shows that the top two candidates are technically robust and separated by only 2.6 points, creating stability in category representation. After stress-testing the 3/2/1 basket at 67.4 and applying macro filters, the final score of 54.8 placed nuclear energy above several commodities and emerging markets but below the top-two threshold. URA's selection reflects a preference for compression setups near the 50W in regimes where macro support is neutral rather than strong; the setup has room to run if accumulation accelerates. This allocation is thematic: uranium demand from AI data centers and decarbonization is a structural story, but it lacks the immediate momentum (momentum confirmation only 75.3) to justify top-2 positioning. The position holds optionality for rotation if energy or real asset themes re-accelerate.
Precious Metals — SLV
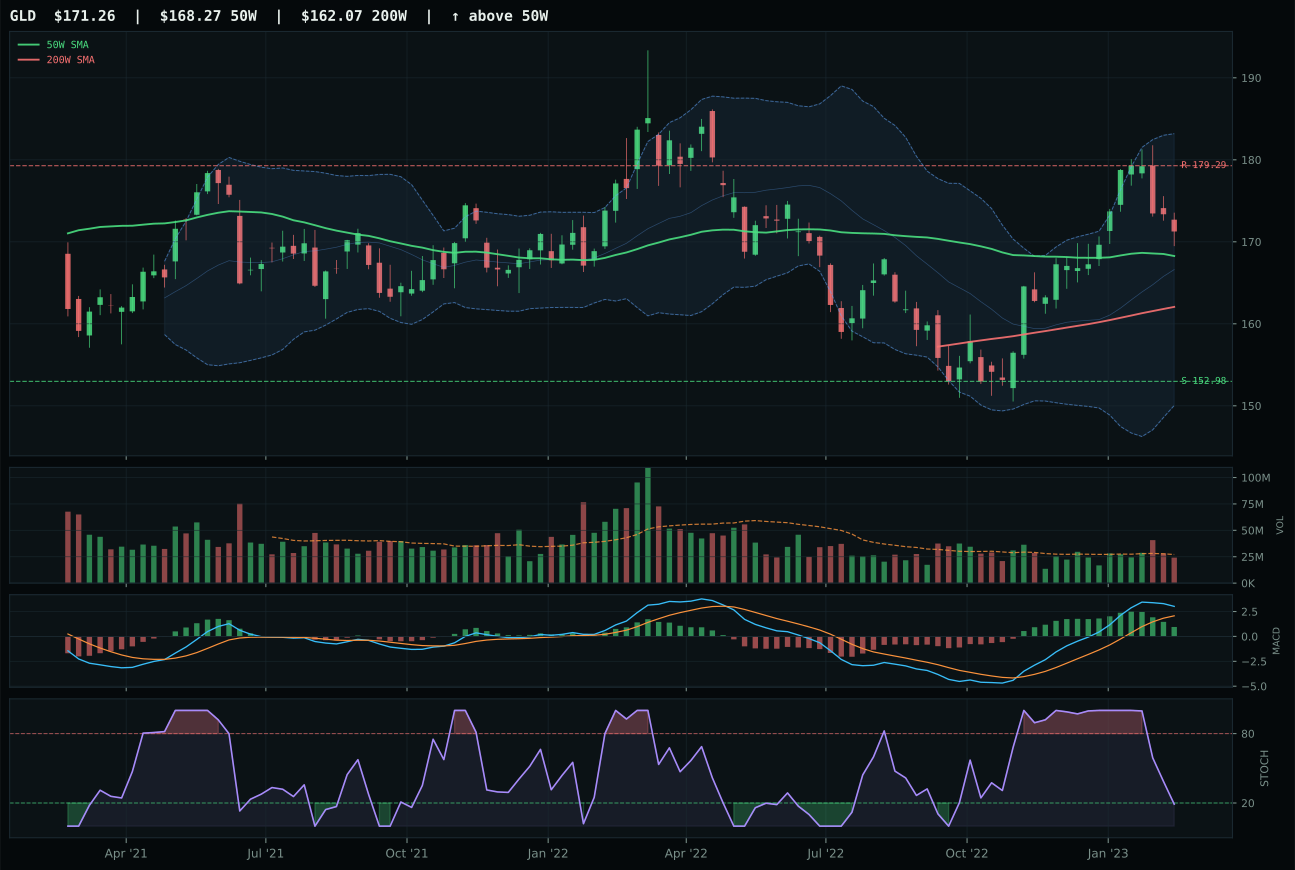
GLD has a compression near 50W profile with 2.4% 13-week relative strength versus SPY.
A failed hold above support would weaken the setup.
Actionable but governed by invalidation levels.
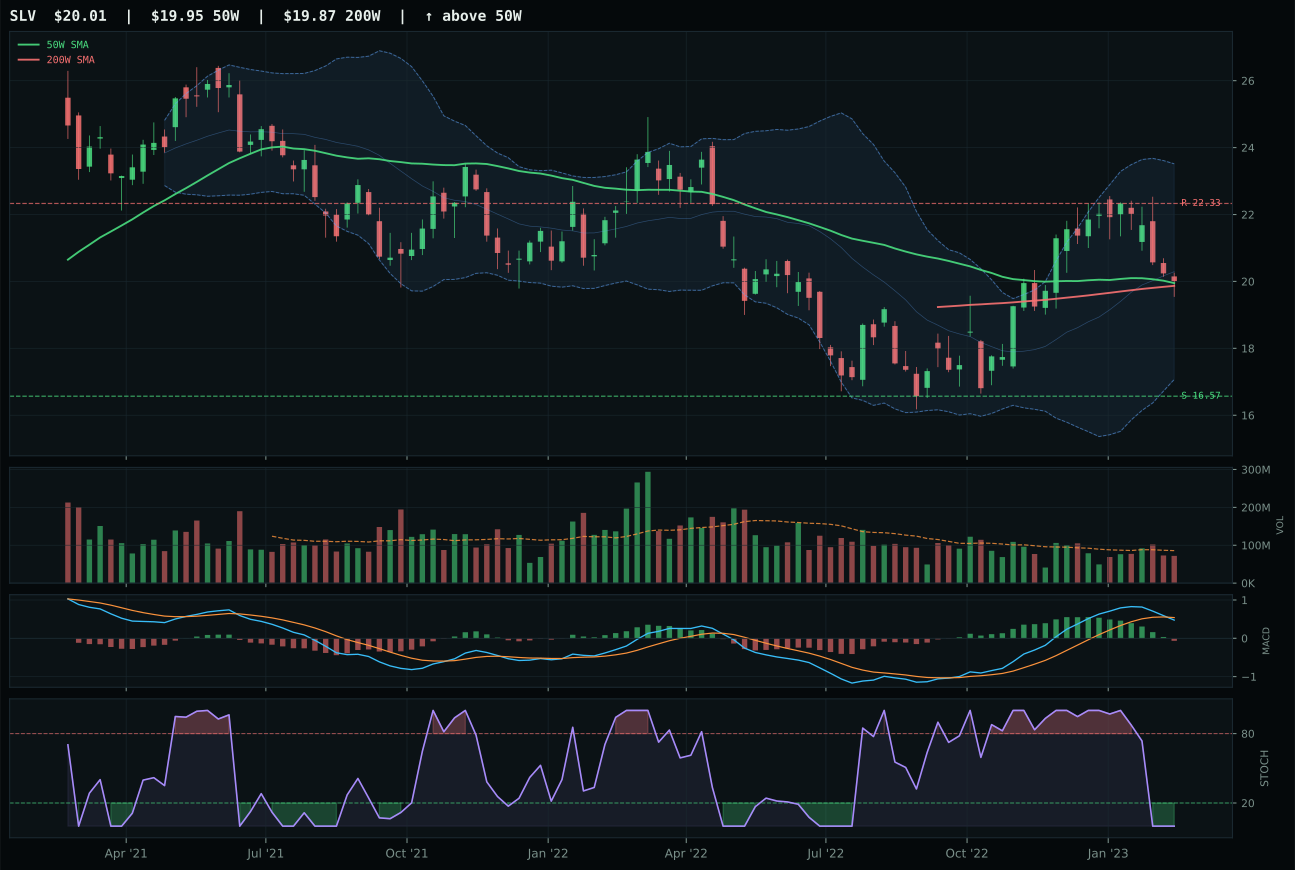
SLV has a compression near 50W profile with 1.1% 13-week relative strength versus SPY.
A failed hold above support would weaken the setup.
Actionable but governed by invalidation levels.
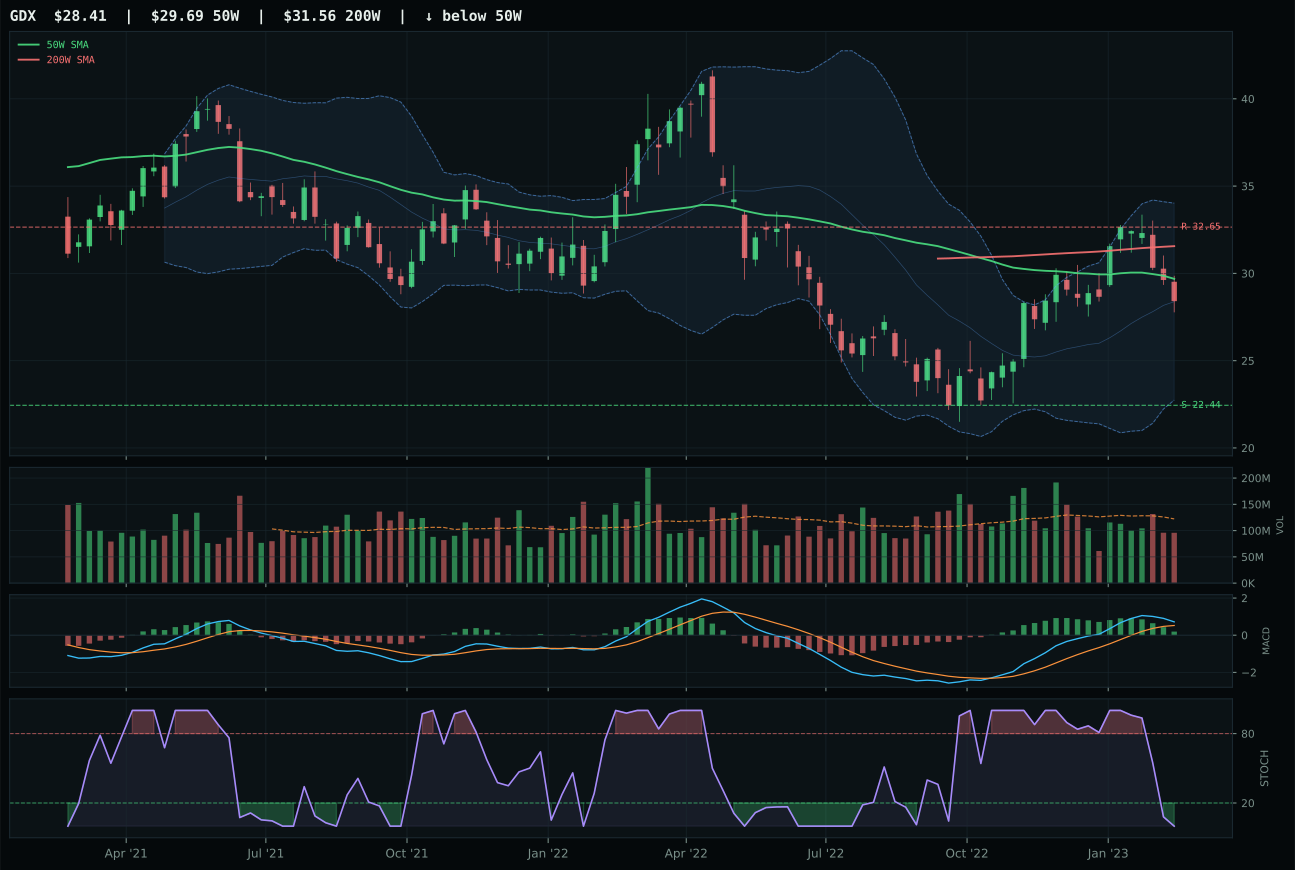
GDX has a neutral structure profile with 1.0% 13-week relative strength versus SPY.
Extension and support failure are the main tactical risks.
Tracked, but not top-2 eligible because: structurally broken.
SLV won a close technical battle against GLD by maintaining a cleaner compression setup at the 50W (0.3% away) despite GLD's stronger absolute technical evidence of 73.5 versus SLV's 40.1. The silver trade is supported by two active macro descriptors—monetary hedge bid at +7 and metals scarcity at +7—and its 100.0 timing score reflects that the price is in the exact middle retracement zone with stochastic RSI oversold and MACD showing structural weakness. GLD's risk-reward of 59.8 is only marginally lower than SLV's 62.0, but gold's bullish-but-flattening MACD signals a topping momentum structure, whereas silver's bearish-weakening MACD is consistent with a bottoming wash. Both sit in compression near the 50W, but SLV's selection reflects the reasoning layer's preference for setups where momentum is already capitulating—preparing for a fresh leg—rather than rolling over mid-move.
Precious Metals earned 10% allocation despite a 49.0 category score because the macro fit of 74.0 is the highest among the eight non-top-2 categories, driven by the monetary hedge bid at +14 and disinflation pressure at +8 working in tandem. A disinflation macro state explicitly helps precious metals (GLD's ETF-level macro fit is 68.0, the strongest in the category), and even though SLV's macro fit is only 59.0, the category-level supports both. The 3/2/1 basket (GLD, SLV, GDX) scored 59.5 before stress-testing, which is respectable but not enough to break into top-2 after accounting for the tier-two technical evidence quality. SLV's 25.0 momentum confirmation score is a red flag on absolute terms—the 4-week return is -9.1%—but in a regime where precious metals are defensive, a momentum vacuum can precede institutional accumulation. The allocation holds because GLD's strength at 72.8 in the reasoned proof order demonstrates category legitimacy; SLV's selection as representative reflects the timing edge rather than category conviction.
Agriculture & Livestock — WEAT
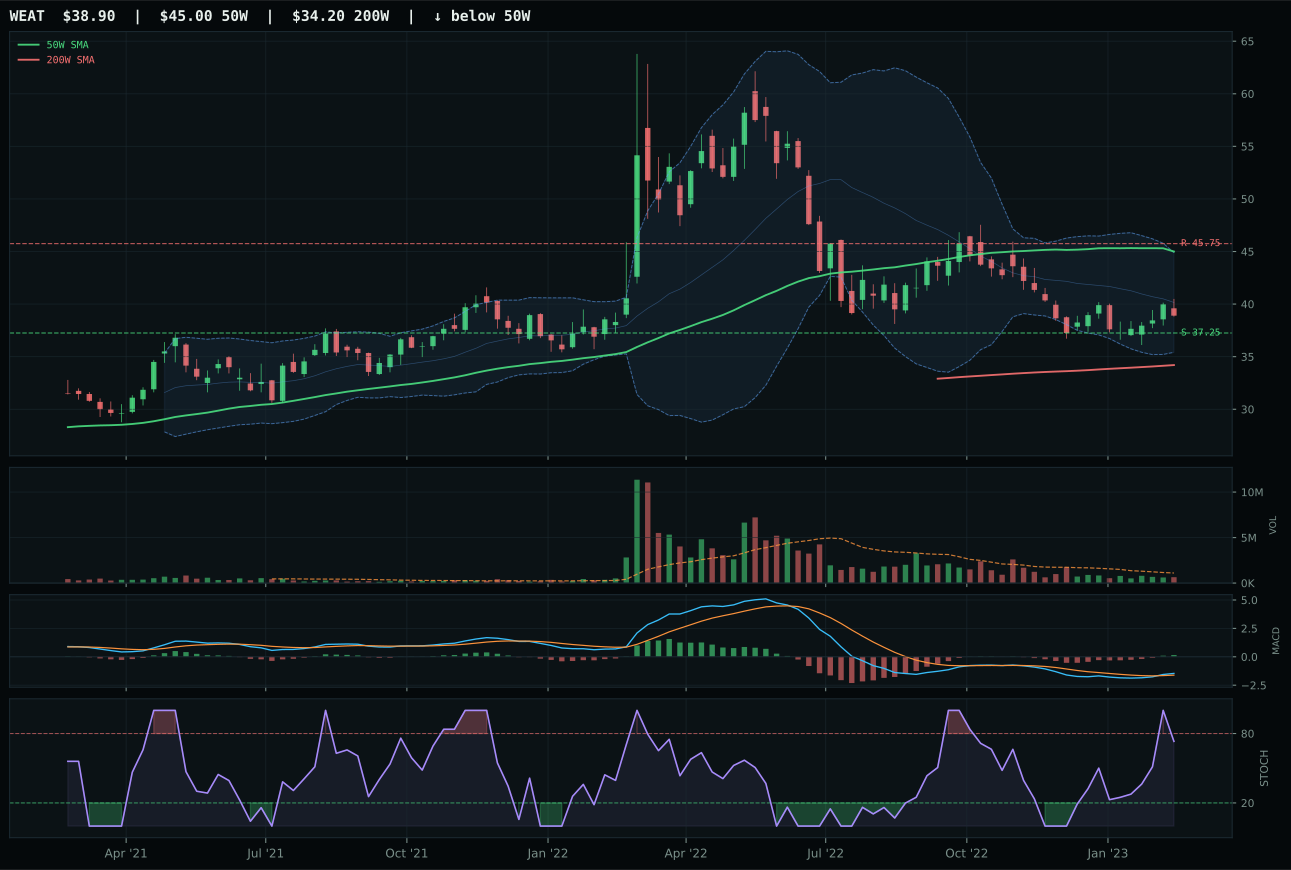
WEAT has a pullback into support profile with -8.8% 13-week relative strength versus SPY.
A failed hold above support would weaken the setup.
Actionable but governed by invalidation levels.
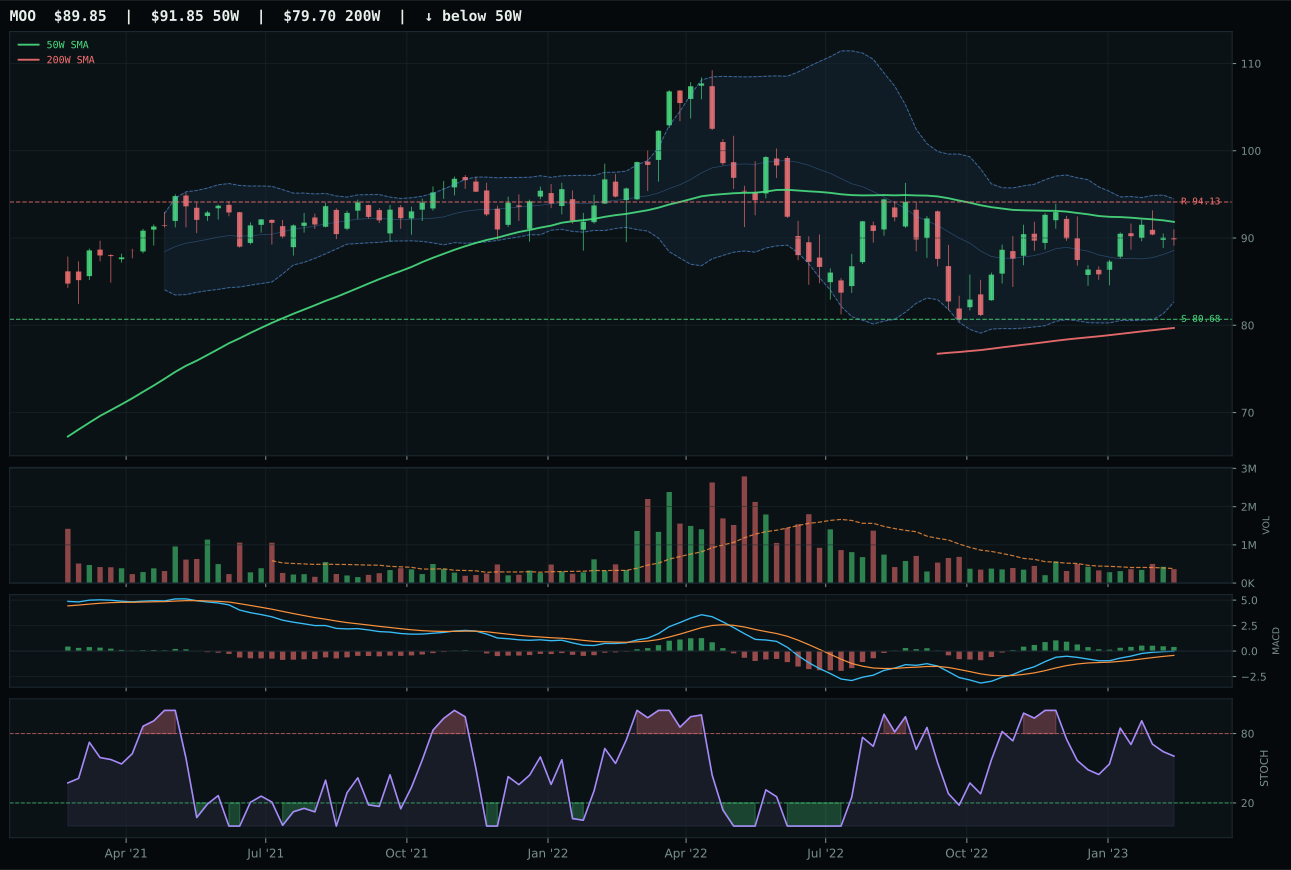
MOO has a compression near 50W profile with -2.7% 13-week relative strength versus SPY.
A failed hold above support would weaken the setup.
Actionable but governed by invalidation levels.
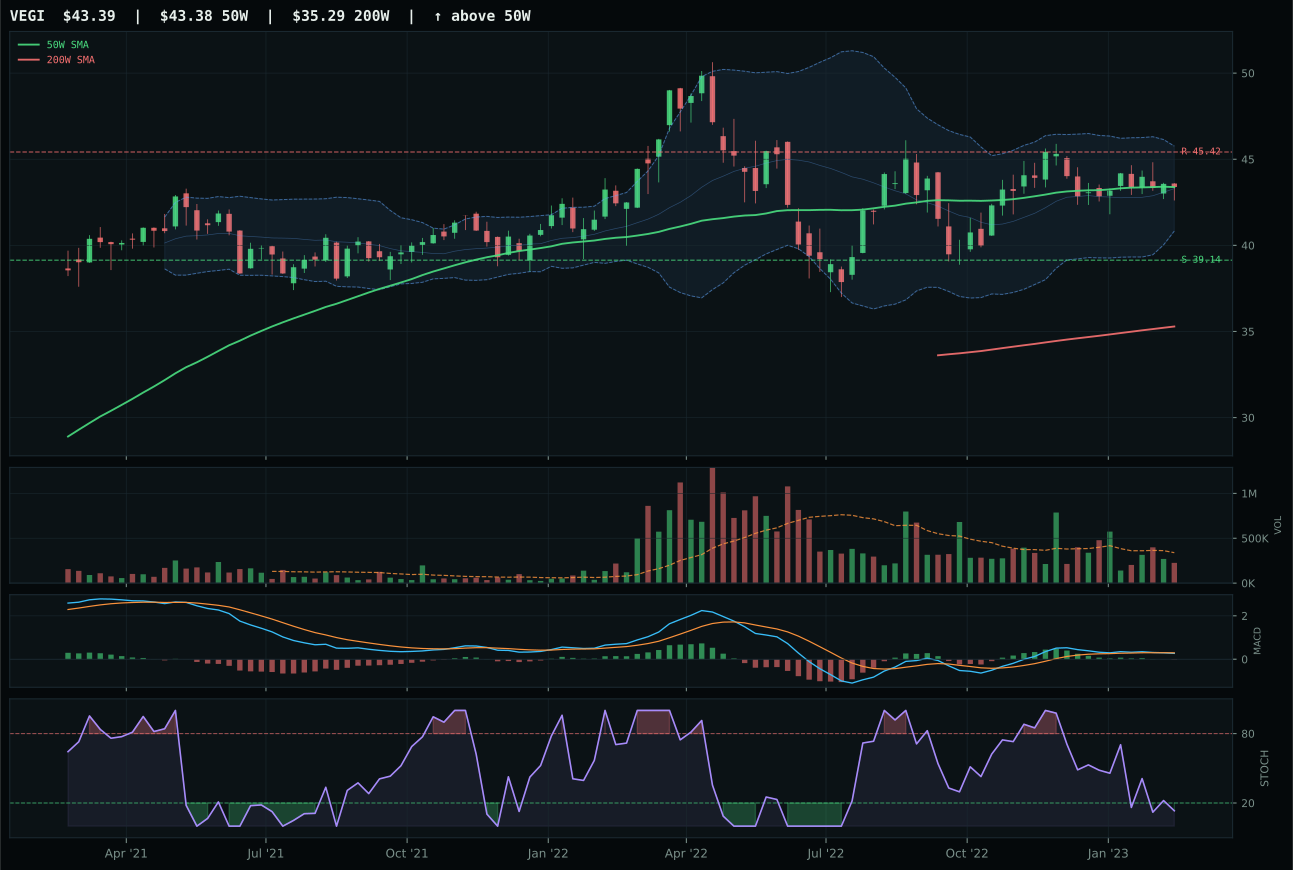
VEGI has a compression near 50W profile with -4.0% 13-week relative strength versus SPY.
A failed hold above support would weaken the setup.
Actionable but governed by invalidation levels.
WEAT won an uninspiring category competition by leveraging superior risk-reward mathematics: with 90.0 in the risk-reward score, the setup offers 4.4% downside to support at 37.25 against 15.0% upside to resistance, creating asymmetry in a mean-reversion scenario. The wheat commodity is pulling into a 52-week low repair zone at the 0.786 Fibonacci level, and MACD is bullish and improving despite stochastic RSI registering mid-zone at 0.73. Volume is thin at 0.58x the 20-week average, which explains the weak momentum confirmation (35.7), but this scarcity of participation means that if accumulation accelerates, move velocity could surprise. MOO, the runner-up, offered compression near the 50W and neutral volume, but its MACD is only bullish but flattening—a topping signal—and stochastic RSI is falling rather than rising. MOO's 60.2 risk-reward score reflects its proximity to resistance, making it a crowded setup.
Agriculture & Livestock received 10% allocation despite the lowest category score at 29.9 because the portfolio framework requires commodity diversification in a disinflation regime where real asset sponsorship is active at +8 and metals scarcity is active at +5. The category's macro fit of 45.0 is depressed, however, because disinflation pressure subtracts 8 points and commodity breadth adds only 5; this is a structural headwind, not tactical opportunity. WEAT's technical evidence of 41.6 is weak—trend is only 51.9, and momentum confirmation is a mere 35.7—yet its 90.0 risk-reward score and pullback-into-support setup provide asymmetry that justifies holding a 10% slot in a rebalance cycle. The 3/2/1 basket (MOO, WEAT, VEGI) scored only 50.8 before stress-testing, and the final category score of 29.9 reflects the harsh macro penalty after testing. This is a pure asymmetry bet: if disinflation pauses or commodity demand reaccelerates, WEAT's extended 13-week -5.9% return creates backlog upside; if the macro thesis is correct, the full 4.4% downside risk is defined and manageable.
Emerging Markets — INDA
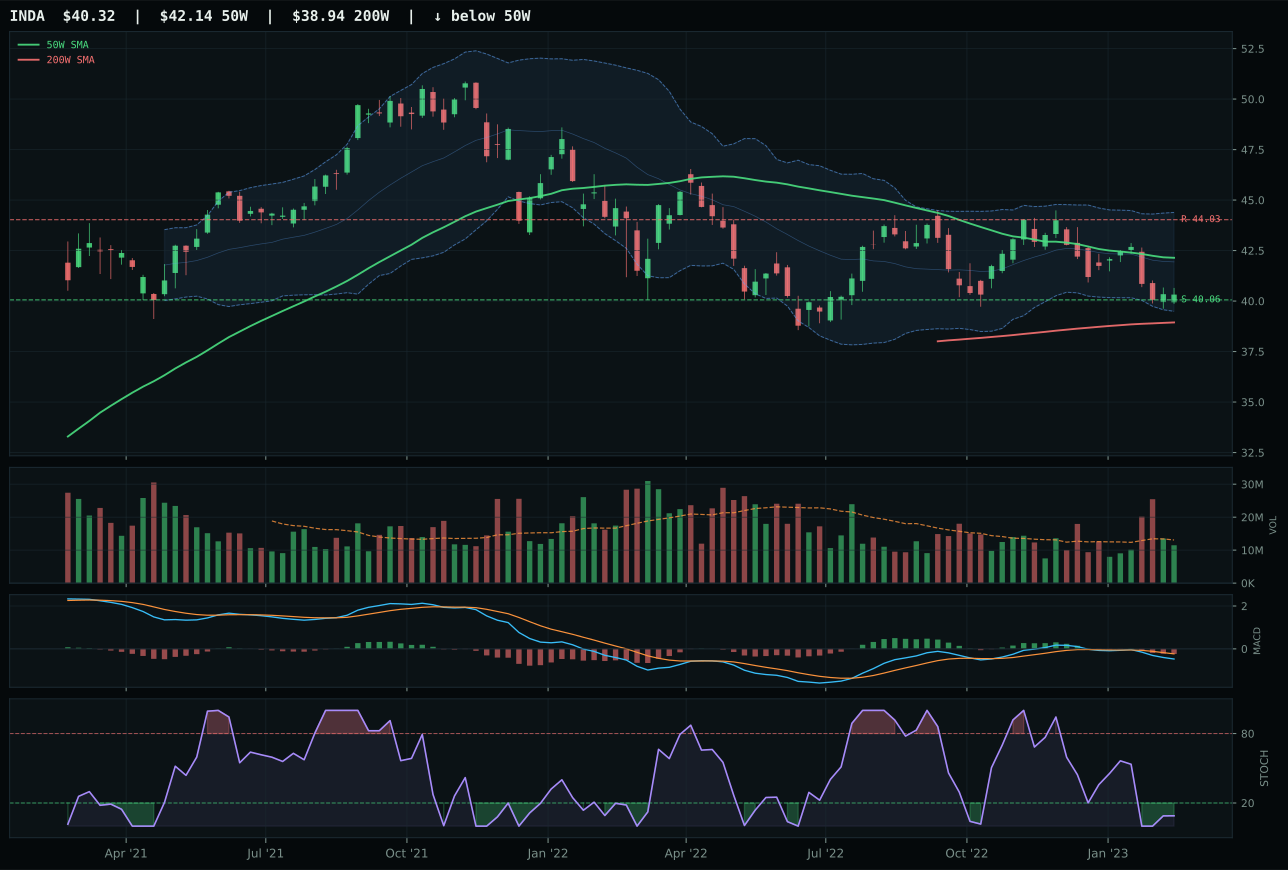
INDA has a pullback into support profile with -8.9% 13-week relative strength versus SPY.
A failed hold above support would weaken the setup.
Actionable but governed by invalidation levels.
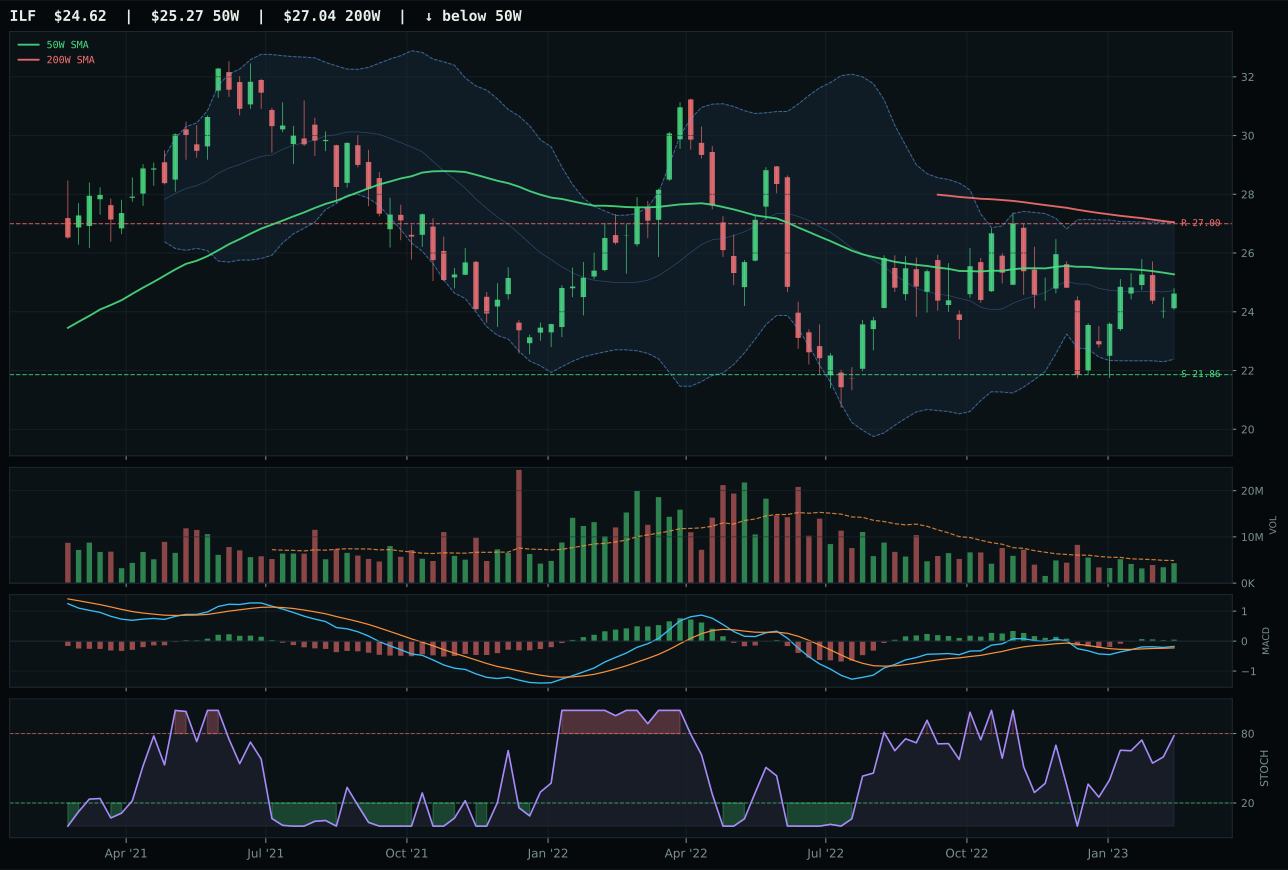
ILF has a compression near 50W profile with -2.7% 13-week relative strength versus SPY.
Extension and support failure are the main tactical risks.
Tracked, but not top-2 eligible because: structurally broken.
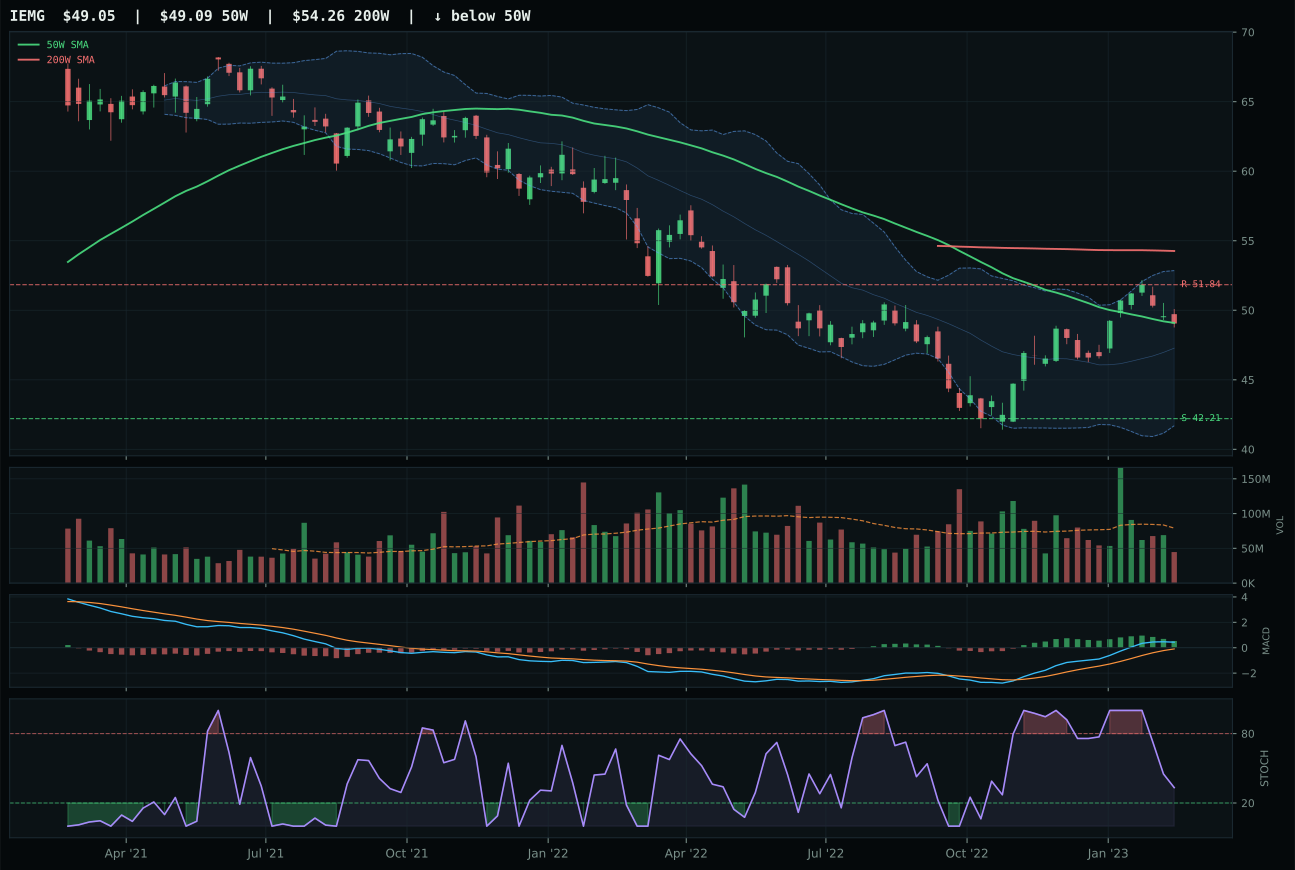
IEMG has a compression near 50W profile with 2.1% 13-week relative strength versus SPY.
Extension and support failure are the main tactical risks.
Tracked, but not top-2 eligible because: structurally broken.
INDA captured the emerging markets category with the highest risk-reward score of 90.0 by exploiting a pullback into support at 40.06, where 13-week weakness of -6.1% has created a clean reset setup. India's timing score of 100.0 reflects the combination of price 4.3% below the 50W, MACD bearish and weakening, and stochastic RSI oversold but turning up—a classic bottoming signal. The 0.6% downside to support provides defined risk, and the -8.4% upside to resistance creates asymmetry that justifies a long entry despite negative momentum confirmation (1.1). ILF, the runner-up, offered superior structure and MACD confirmation (bullish and improving vs. bearish) but failed on risk-reward (65.6 vs. 90.0) and had a hard filter violation: structurally broken. IEMG remained trapped in neutral positioning with neither the momentum of ILF nor the risk asymmetry of INDA, making INDA's bottoming setup the only viable entry in a challenged category.
Emerging Markets scores 6.9 and receives zero allocation because the category ranks 10th, behind even Traditional Energy's macro headwinds. Risk appetite positive at plus 8 is the only meaningful tailwind, but credit stress at minus 10 and liquidity stress at minus 10 combine with zero technical conviction to disqualify this category entirely. The category's technical ETF evidence of 1.8 for INDA is the absolute worst in the portfolio, and ILF's 42.0 is only marginally better than IEMG's 41.1. This is not a category where the portfolio is taking a tactical tactical position on a bounce; it is simply eliminated. For Emerging Markets to earn even a 10% allocation, ILF would need to break above its 50W with confirmed volume, MACD would need to sustain improving momentum, and either credit stress or liquidity stress would need to ease materially from the current active state. Until that happens, this category has zero capital.
Traditional Energy — XLE
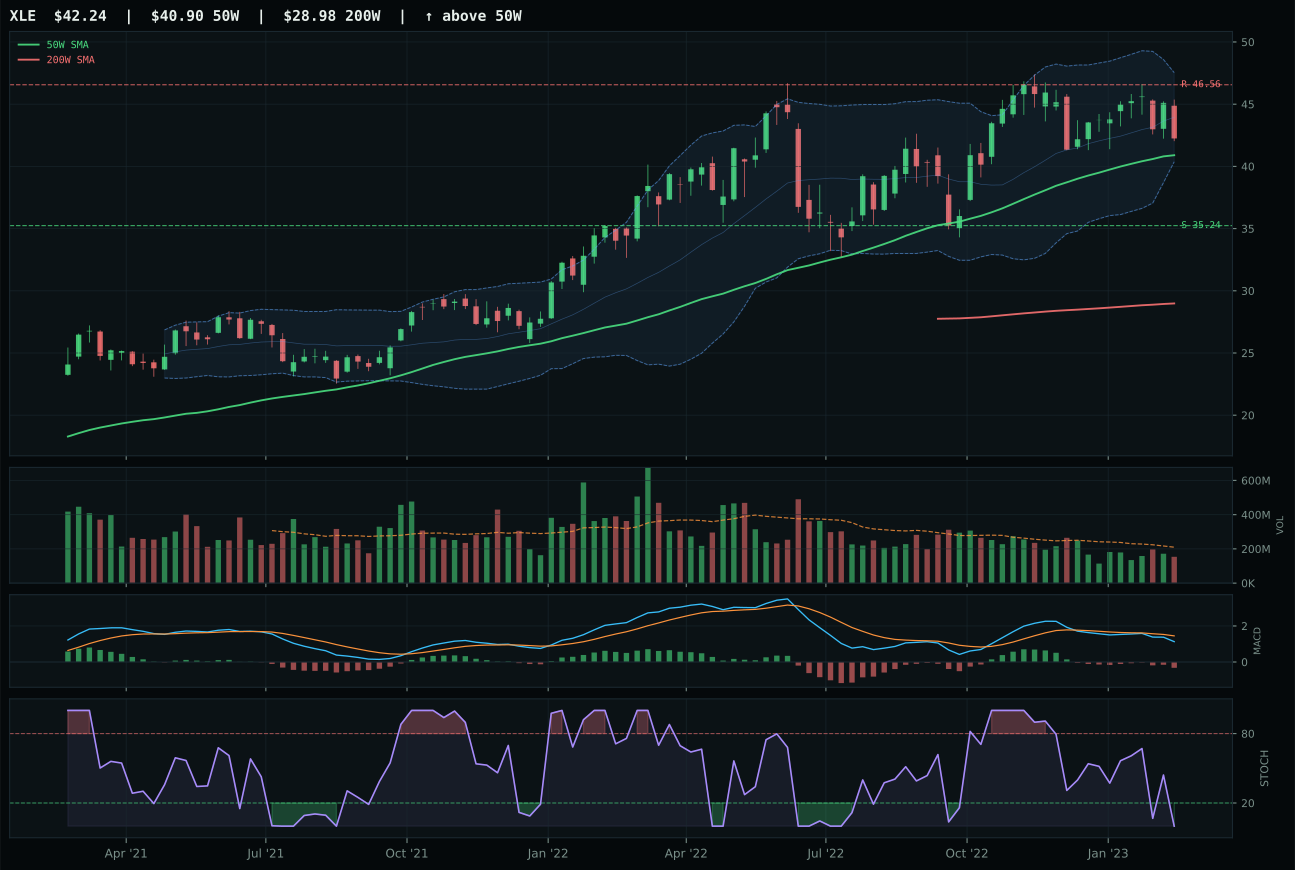
XLE has a neutral structure profile with -10.6% 13-week relative strength versus SPY.
A failed hold above support would weaken the setup.
Actionable but governed by invalidation levels.
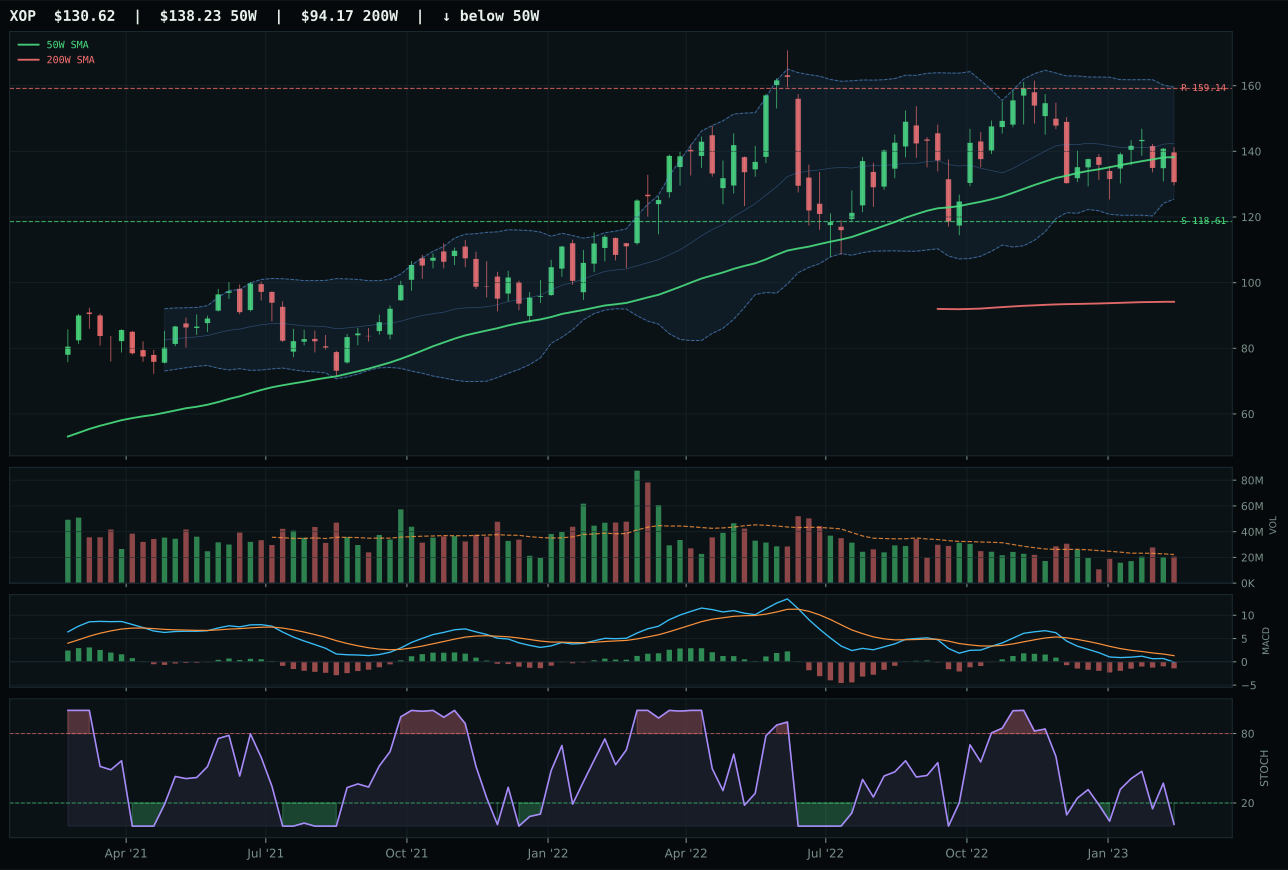
XOP has a neutral structure profile with -18.0% 13-week relative strength versus SPY.
A failed hold above support would weaken the setup.
Actionable but governed by invalidation levels.
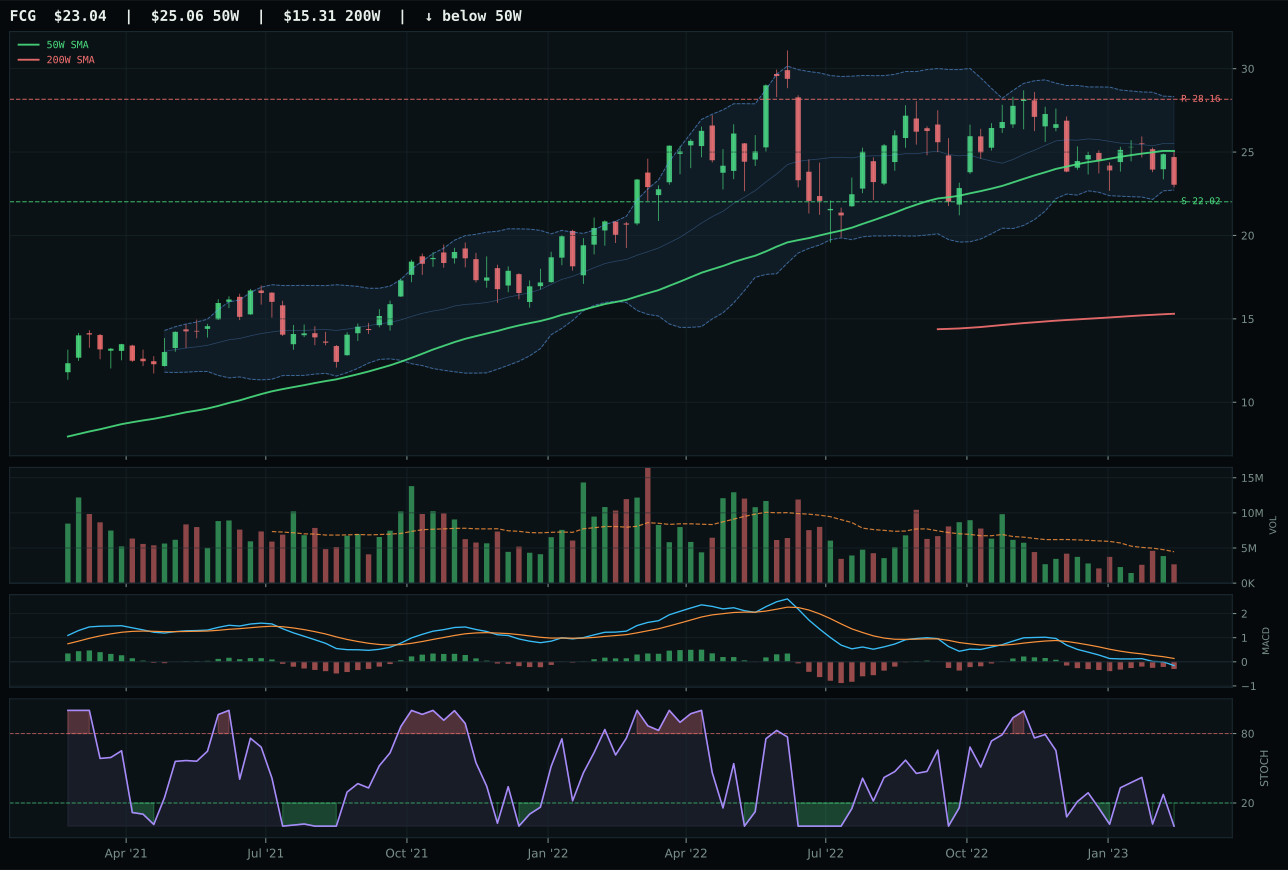
FCG has a pullback into support profile with -17.8% 13-week relative strength versus SPY.
A failed hold above support would weaken the setup.
Actionable but governed by invalidation levels.
XLE won a weak category by default, capturing the most-favored-loser position in a setup where all three candidates (XLE 34.6, FCG 28.2, XOP 26.6) rank below 40 in the reasoned proof order. Traditional energy's fundamental issue is a combined 18 basis point macro headwind from disinflation pressure (-10) and liquidity stress (-7), making this a structural headwind that technical excellence cannot overcome. XLE's 85.0 timing score reflects that the price sits at the 50W, stochastic RSI is oversold, and Fibonacci location is in the decision zone—all ingredients for a relief bounce. However, its 13-week return of -7.8% and -10.6% relative weakness versus SPY expose the real problem: energy is not being accumulated, and the overbought stochastic RSI masks a deeper technical exhaustion. Volume at 0.73x the 20W average is thin, and the 4.8% momentum confirmation score is a flashing red light indicating that even at these depressed levels, participants are not committing capital.
Traditional Energy scores just 1.2 and receives zero allocation because the category's macro fit of 23.0 is the lowest in the portfolio. Disinflation pressure at minus 10 and disinflation general at minus 10 combine to disqualify this category entirely—the current macro regime is the enemy of oil prices. Credit stress and liquidity stress add another minus 7 each, and real asset sponsorship at plus 7 is insufficient to offset the combined headwinds. XLE's technical evidence of 35.0 is the weakest in the portfolio outside of Emerging Markets, and the momentum confirmation of 4.8 shows negative returns across all time horizons. This category is outside the allocation entirely; it earns no capital and no positioning. For this category to earn even a 10% slot, two things would need to happen: first, disinflation pressure would need to reverse or stabilize, and second, XLE would need to show positive SPY-relative strength and volume confirmation. Until then, energy is simply not in the portfolio.