
2023-02-10
Informational purposes only. The content in this report, including allocations, analysis, and commentary, is provided solely for informational and educational purposes. It does not constitute financial advice, investment advice, trading advice, or any other type of advice. Past performance does not guarantee future results. Always conduct your own research and consult a qualified financial professional before making investment decisions.
Weekly Allocation
| Ticker | Category | Weight | Role |
|---|---|---|---|
| CIBR | Technology | 20% | Top-2 (20%) |
| SMH | AI | 20% | Top-2 (20%) |
| COPX | Industrial Metals | 10% | Tier-2 (10%) |
| PAVE | Utilities & Infrastructure | 10% | Tier-2 (10%) |
| GLD | Precious Metals | 10% | Tier-2 (10%) |
| ITA | Defense & Aerospace | 10% | Tier-2 (10%) |
| URNM | Nuclear Energy | 10% | Tier-2 (10%) |
| WEAT | Agriculture & Livestock | 10% | Tier-2 (10%) |
Trade Instructions — Monday Open
Sell the tranche from 2023-01-13 (completing its 4-week hold). Buy the new tranche. Instructions show net portfolio changes — same-asset positions cancel, weight changes show the delta.
| Action | Ticker | Instruction |
|---|---|---|
| SELL | COPX | Sell 20% of COPX position (reduce 12.50% → 10.00%) |
| SELL | GLD | Sell 14% of GLD position (reduce 17.50% → 15.00%) |
| SELL | XAR | Sell 33% of XAR position (reduce 7.50% → 5.00%) |
| SELL | IGF | Sell entire IGF position (2.50% of portfolio) |
| SELL | VEGI | Sell 25% of VEGI position (reduce 10.00% → 7.50%) |
| SELL | XLE | Sell 33% of XLE position (reduce 7.50% → 5.00%) |
| SELL | XLK | Sell entire XLK position (2.50% of portfolio) |
| BUY | SMH | Buy SMH — 28.57% of freed cash (adds 5.00% to portfolio) |
| BUY | PAVE | Buy PAVE — 14.29% of freed cash (adds 2.50% to portfolio) |
| BUY | CIBR | Buy CIBR — 28.57% of freed cash (adds 5.00% to portfolio) |
| BUY | ITA | Buy ITA — 14.29% of freed cash (adds 2.50% to portfolio) |
| BUY | WEAT | Buy WEAT — 14.29% of freed cash (adds 2.50% to portfolio) |
Current Portfolio After Trade
Combined holdings across all 4 active tranches. Each tranche is 25% of the portfolio.
| Ticker | % of Portfolio | Weight Bar |
|---|---|---|
| SMH | 15.00% | |
| GLD | 15.00% | |
| COPX | 10.00% | |
| URNM | 10.00% | |
| PAVE | 10.00% | |
| VEGI | 7.50% | |
| XAR | 5.00% | |
| XLE | 5.00% | |
| REMX | 5.00% | |
| IGV | 5.00% | |
| CIBR | 5.00% | |
| IEMG | 2.50% | |
| ITA | 2.50% | |
| WEAT | 2.50% |
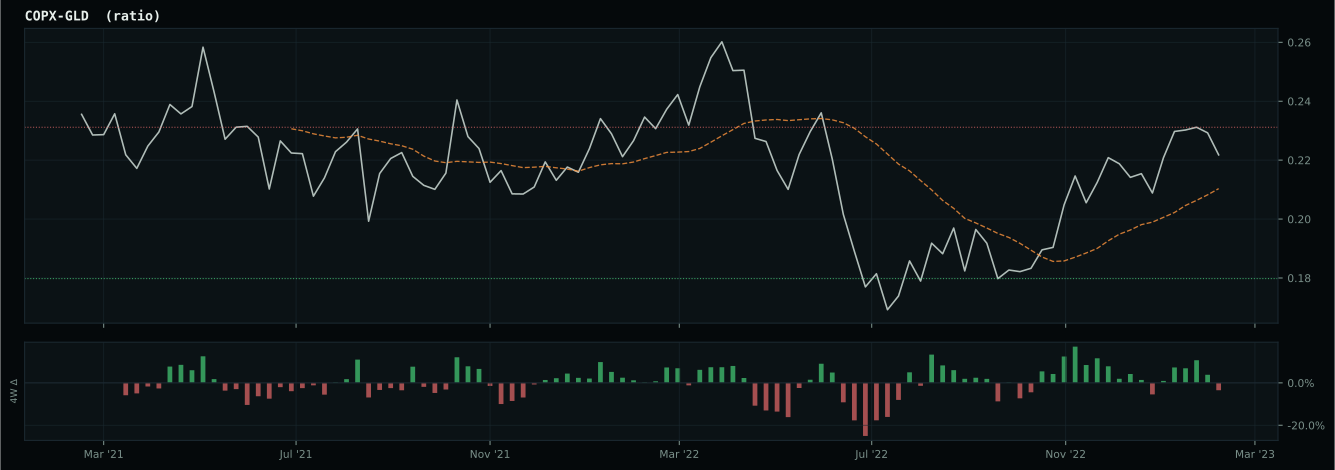
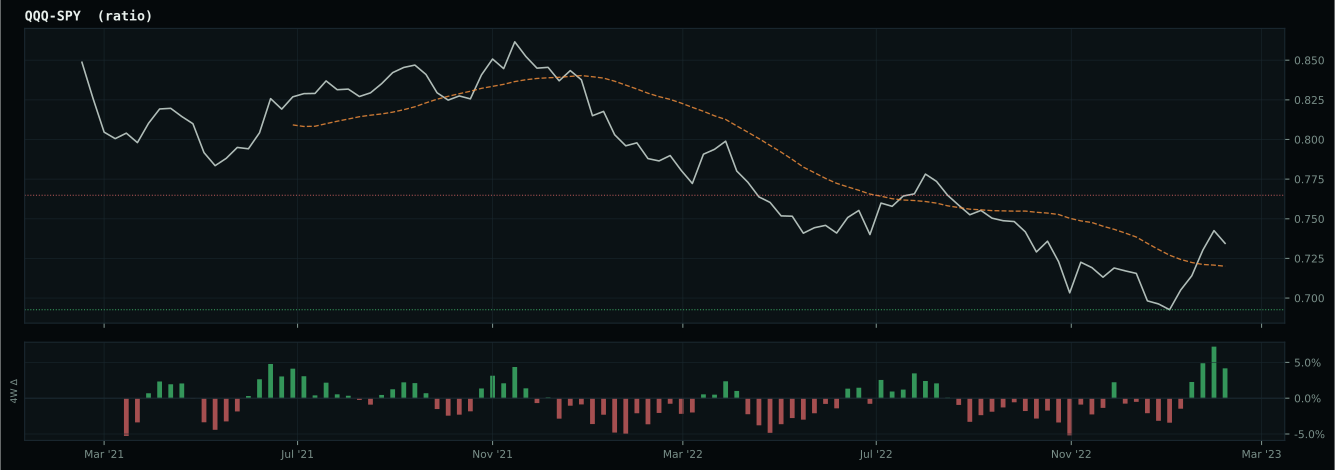
Macro Regime — Disinflation
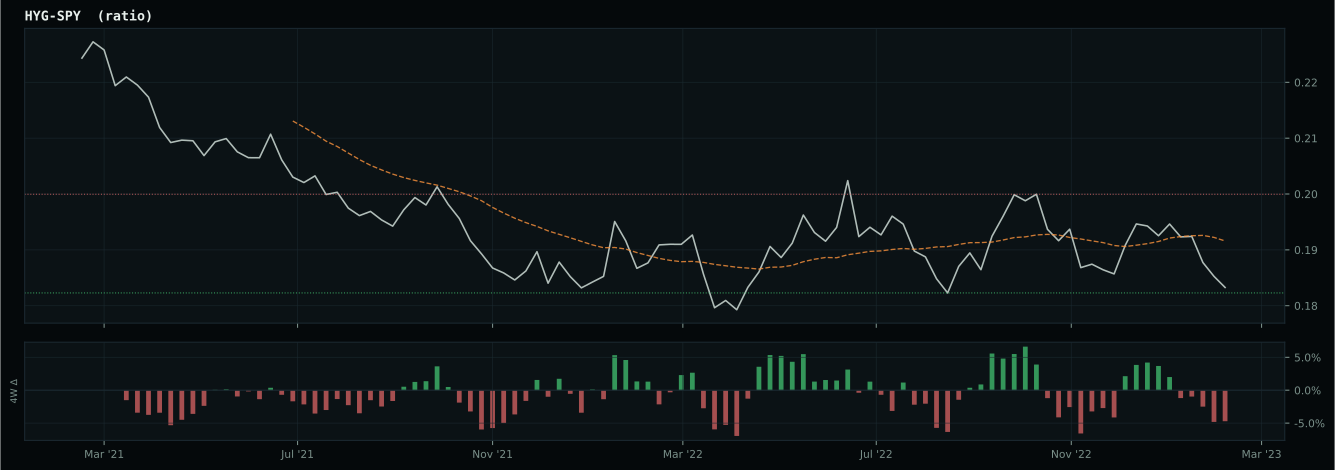
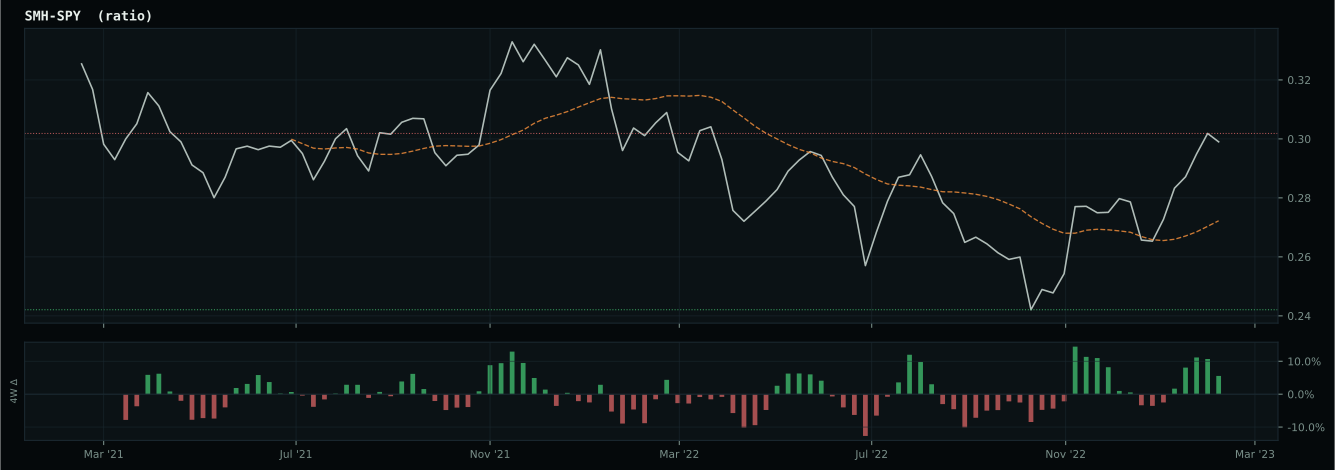
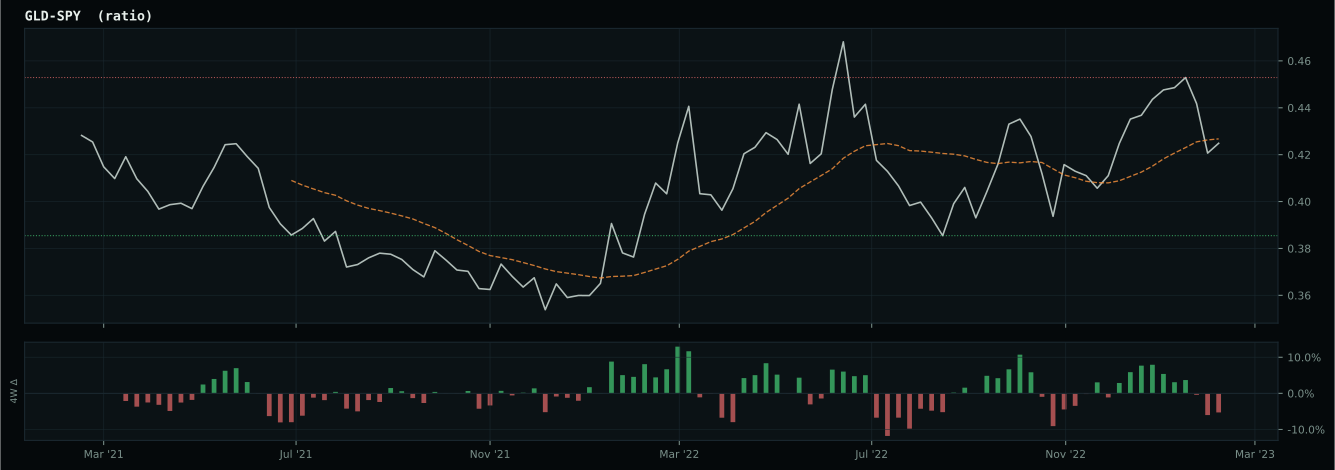
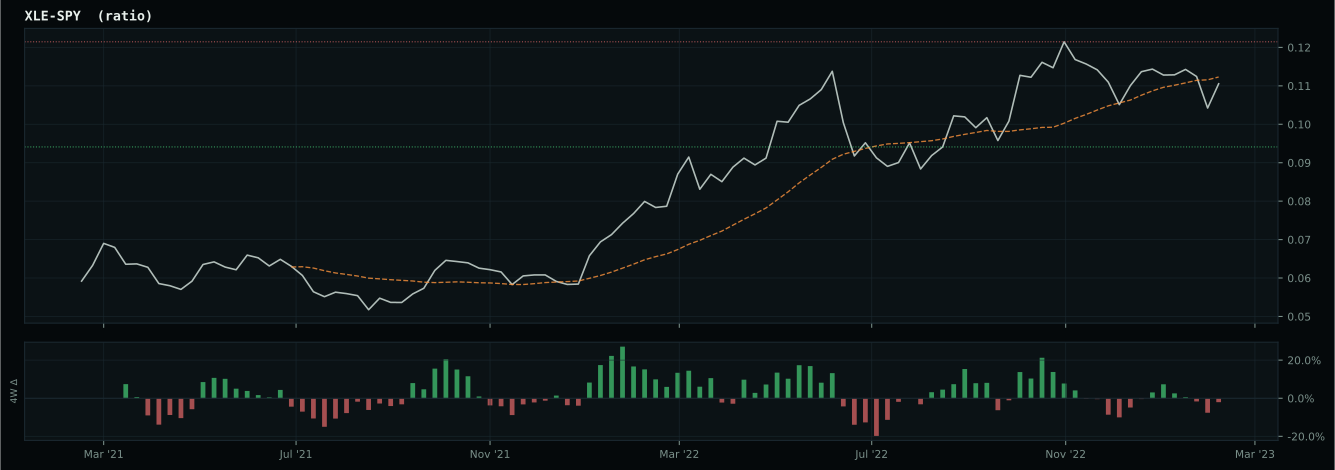
Macro Evidence Charts
Market-implied signals behind the macro regime scores. Each ratio compares two assets; the direction and slope of the ratio is what the macro engine reads.
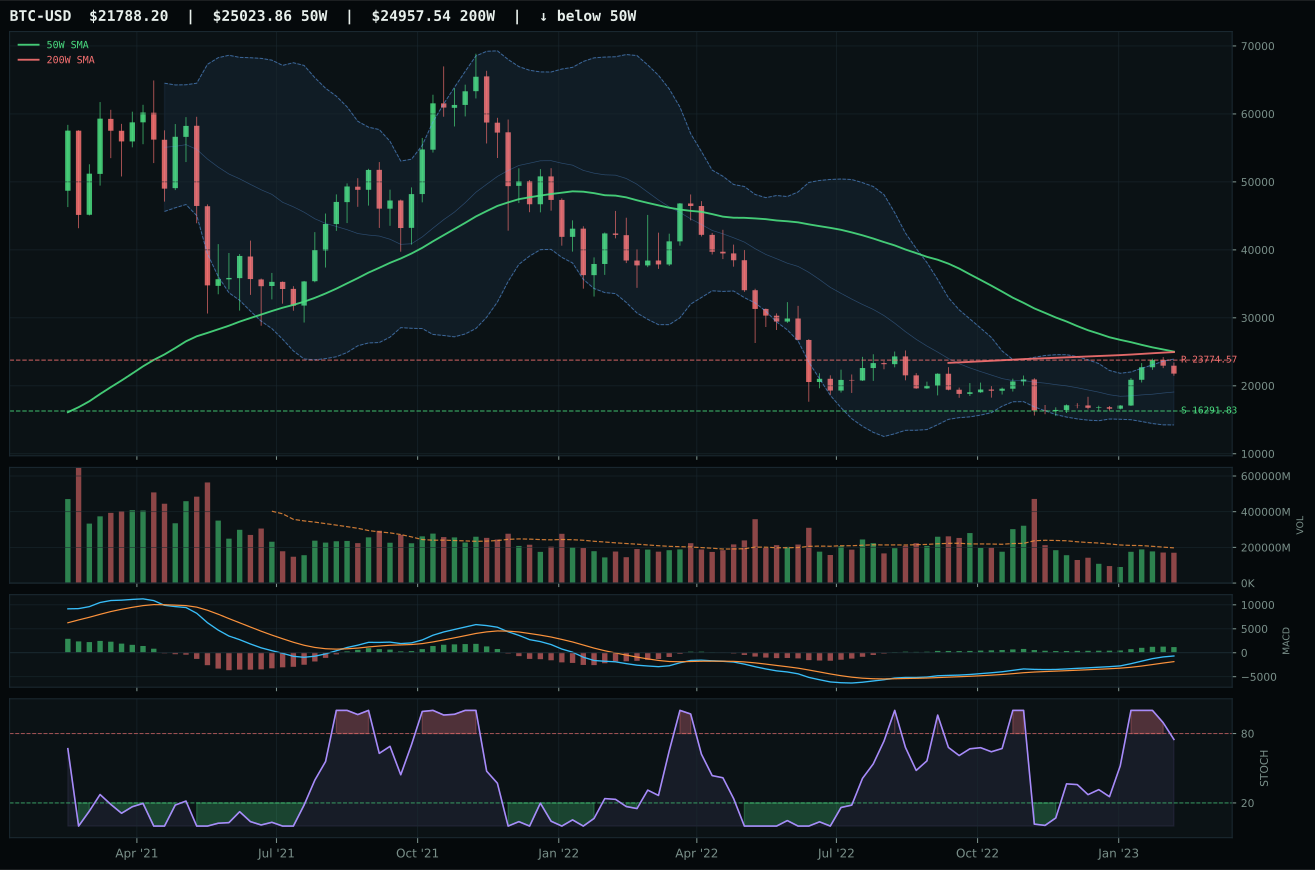
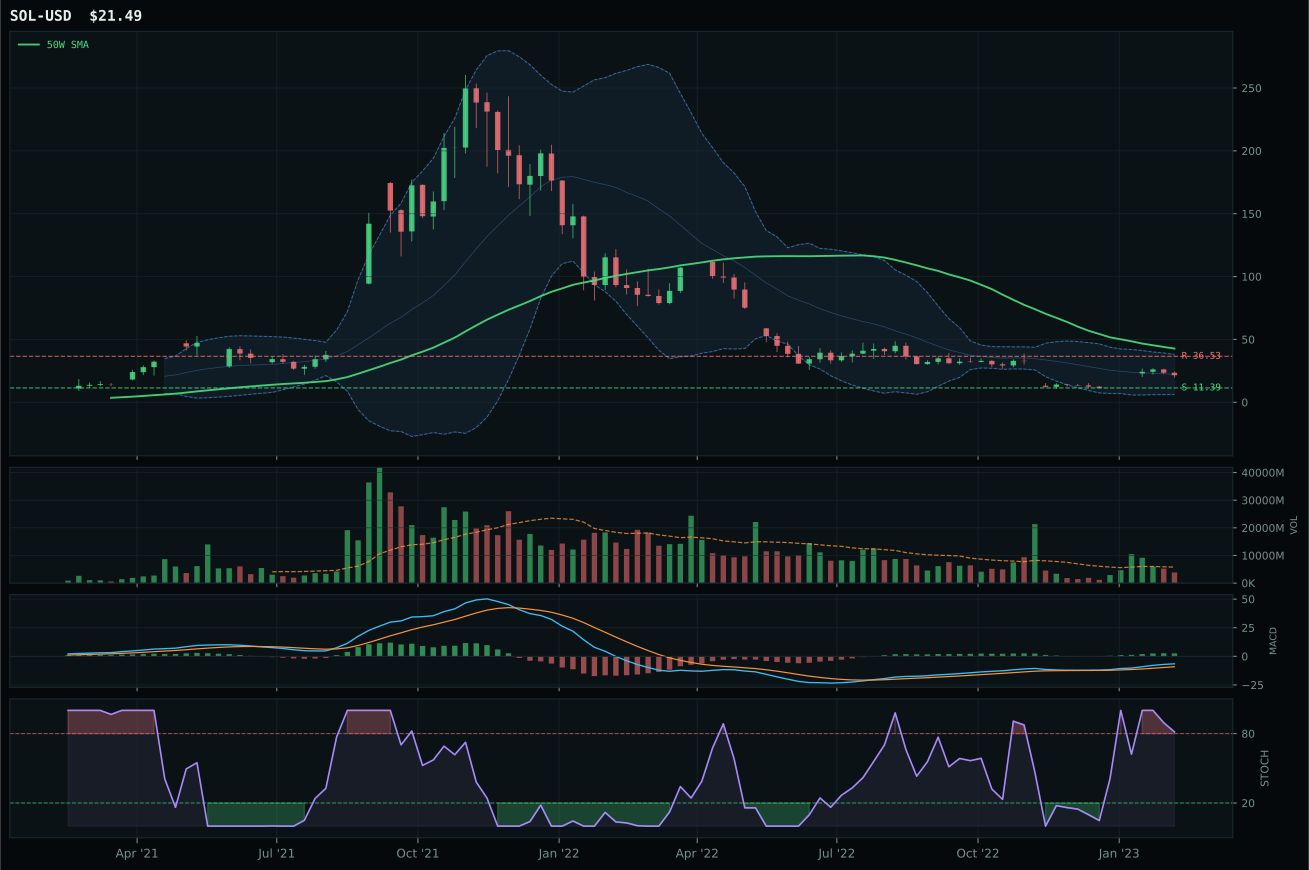
Crypto Regime — NoCrypto
ValueBTC armed; waiting for 50W reclaim, decisive close above post-touch range resistance by 3%, close above 200W, breakout volume above 20W…
TrendBTC not confirmed
one or more available conditions failed
Category Rankings
| Rank | Category | Winner | Score | Alloc | 4W Ret | Peers (4W) |
|---|---|---|---|---|---|---|
| 1 | Technology | CIBR | 61.8 | 20% | -4.66% | XLK -4.3% · IGV -5.7% |
| 2 | AI | SMH | 61.8 | 20% | -4.22% | BOTZ -4.0% · AIQ -6.4% |
| 3 | Industrial Metals | COPX | 58.8 | 10% | -7.17% | PICK -5.8% · REMX -12.6% |
| 4 | Utilities & Infrastructure | PAVE | 57.3 | 10% | -4.85% | IGF -3.5% · XLU -5.0% |
| 5 | Precious Metals | GLD | 54.4 | 10% | +2.29% | SLV -2.2% · GDX -3.5% |
| 6 | Defense & Aerospace | ITA | 53.1 | 10% | -3.93% | XAR -4.0% · ROKT -3.4% |
| 7 | Nuclear Energy | URNM | 52.4 | 10% | -14.97% | URA -13.4% · NLR -8.0% |
| 8 | Agriculture & Livestock | WEAT | 30.0 | 10% | -13.89% | MOO -6.4% · VEGI -6.2% |
| 9 | Emerging Markets | IEMG | 15.9 | 0% | -5.87% | INDA -2.8% · ILF -4.2% |
| 10 | Traditional Energy | XLE | 7.8 | 0% | -10.28% | XOP -11.0% · FCG -11.2% |
Technology — CIBR
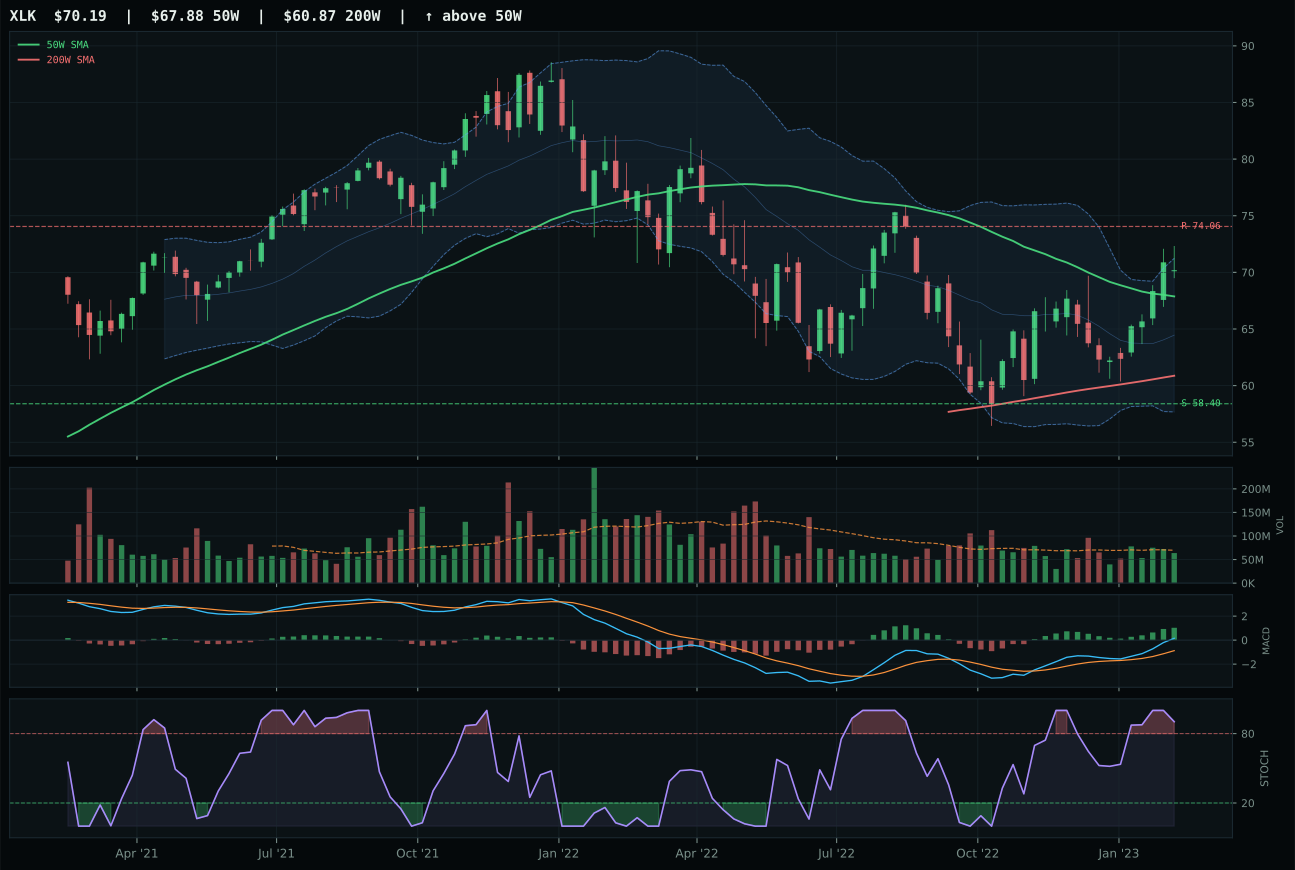
XLK has a neutral structure profile with 3.0% 13-week relative strength versus SPY.
A failed hold above support would weaken the setup.
Actionable but governed by invalidation levels.
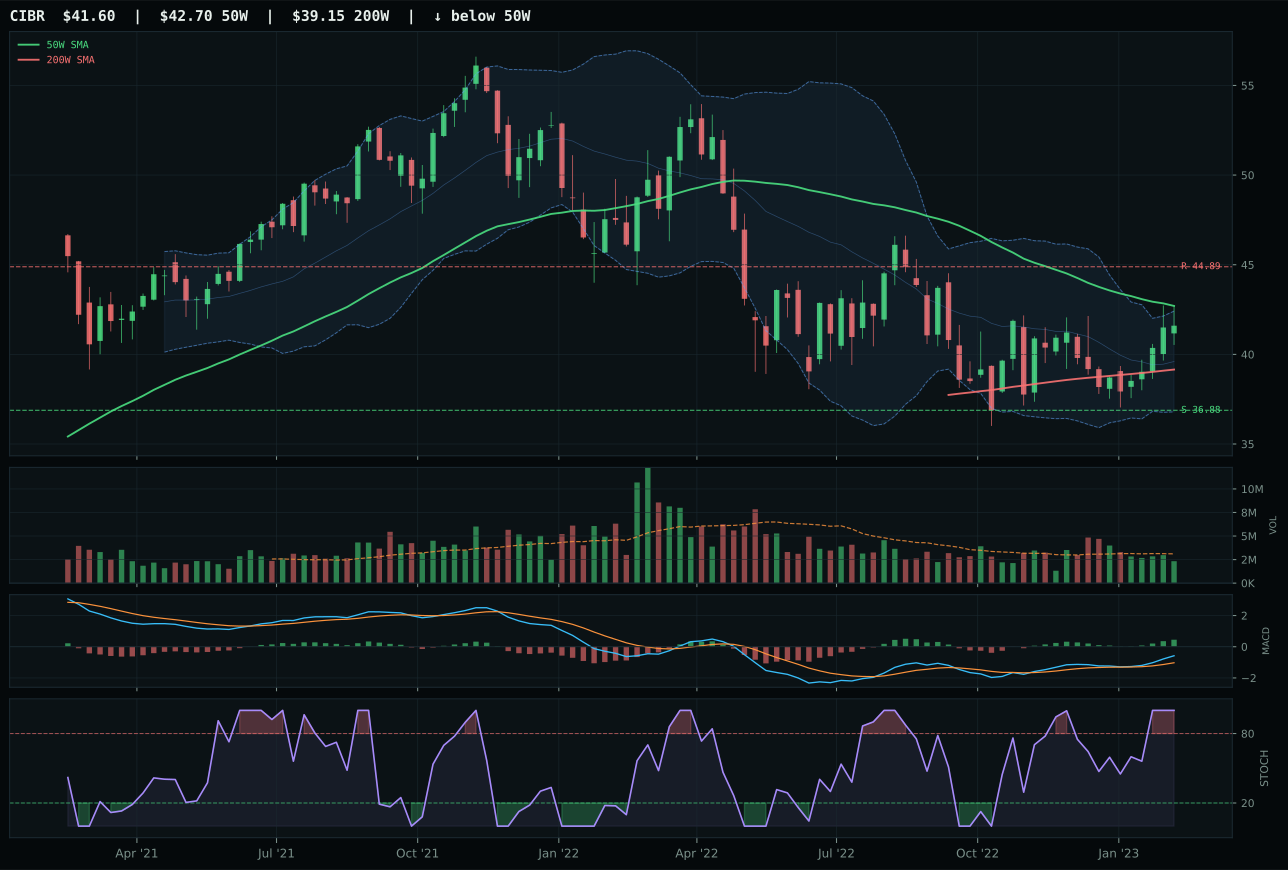
CIBR has a compression near 50W profile with -0.7% 13-week relative strength versus SPY.
A failed hold above support would weaken the setup.
Actionable but governed by invalidation levels.
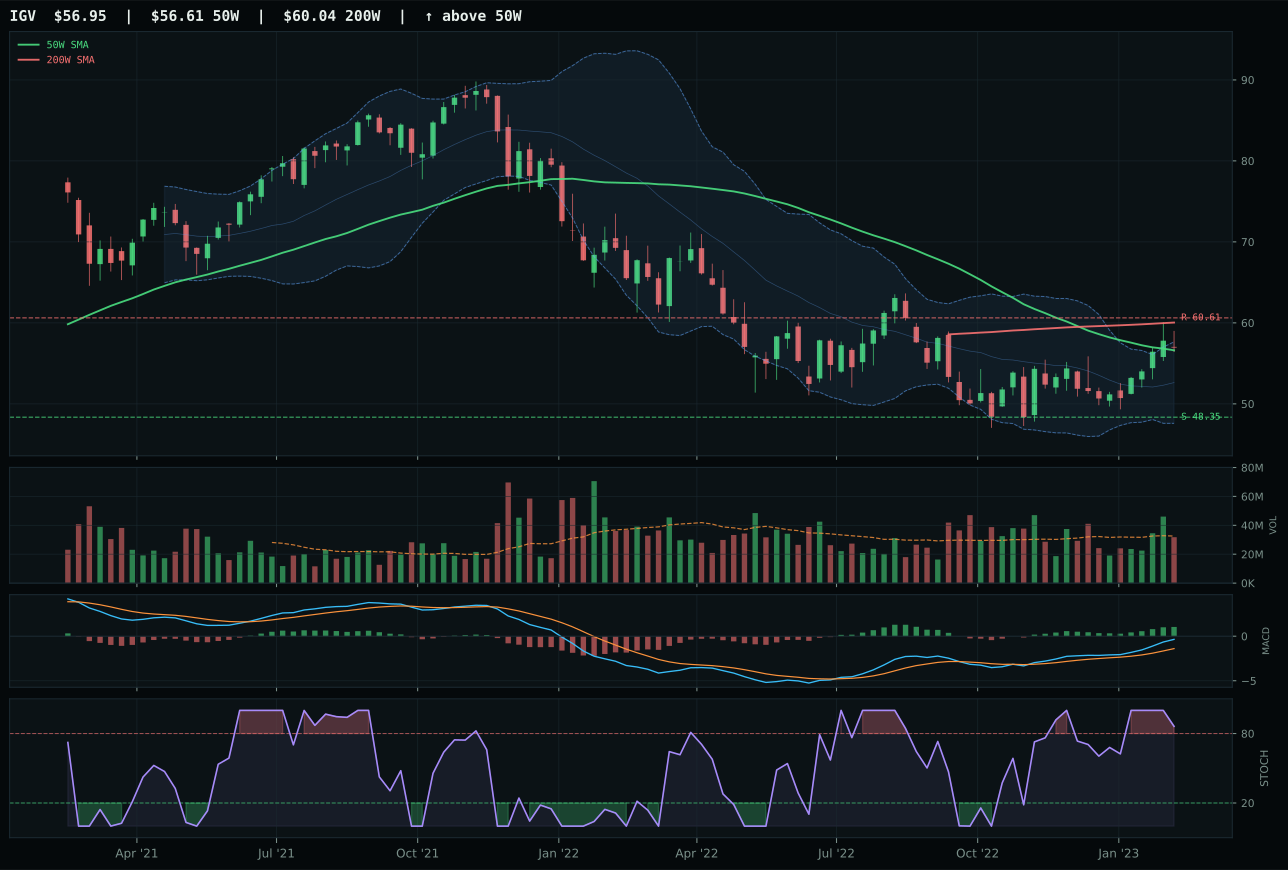
IGV has a compression near 50W profile with 2.4% 13-week relative strength versus SPY.
A failed hold above support would weaken the setup.
Actionable but governed by invalidation levels.
CIBR claimed the category by occupying the sweet spot between mean reversion and bottoming support. Price sits 2.6% below the 50-week moving average—close enough to trigger fresh buying if the level holds, yet far enough to avoid the stretched-valuation trap that ensnared XLK, which trades 3.4% above its own 50W. The cybersecurity narrative also benefits from credit-stress signals in the macro regime: when balance sheets tighten, defensive tech spending on threat detection tends to hold its ground relative to flashier AI capex. MACD is bullish and improving, and stochastic RSI has spiked to overbought momentum, but the compressed setup near the 50W—with a cleanliness score of 66.7 versus XLK's looser neutral structure—offers room for expansion without requiring the market to chase extended levels. XLK's 3.0% relative strength advantage over SPY and superior trend score of 85 did not overcome its timing liability: at 9.2% above its 50W and already in upper retracement territory, every new entry is fighting a shrinking margin of safety.
Technology earned its top-2 slot (20%) because disinflation regimes reward quality and durability, and the category's technical composite of 61.8 reflects genuine breadth sponsorship rather than a single-stock rally. CIBR's 1.7% thirteen-week return and marginally negative sector-relative strength hide the real insight: volume is neutral at 0.75x the 20-week average, which means accumulation is patient and non-panicked—the opposite of capitulation that would signal a floor. The macro fit of 60.0 for the category stems from active liquidity stress (-10 points) and credit stress (+2), which favor defensive selectivity; risk-appetite signals are positive but not strong enough to pull the category toward growth. Against a field where AI scored 61.8 (identical category score, driven by SMH's 10.5% thirteen-week burst) and Defense & Aerospace scored 53.1, Technology holds its allocation share because it pairs technical evidence (62% weight) with macro fit (38%) in a way that doesn't require a macro pivot to stay valid.
AI — SMH
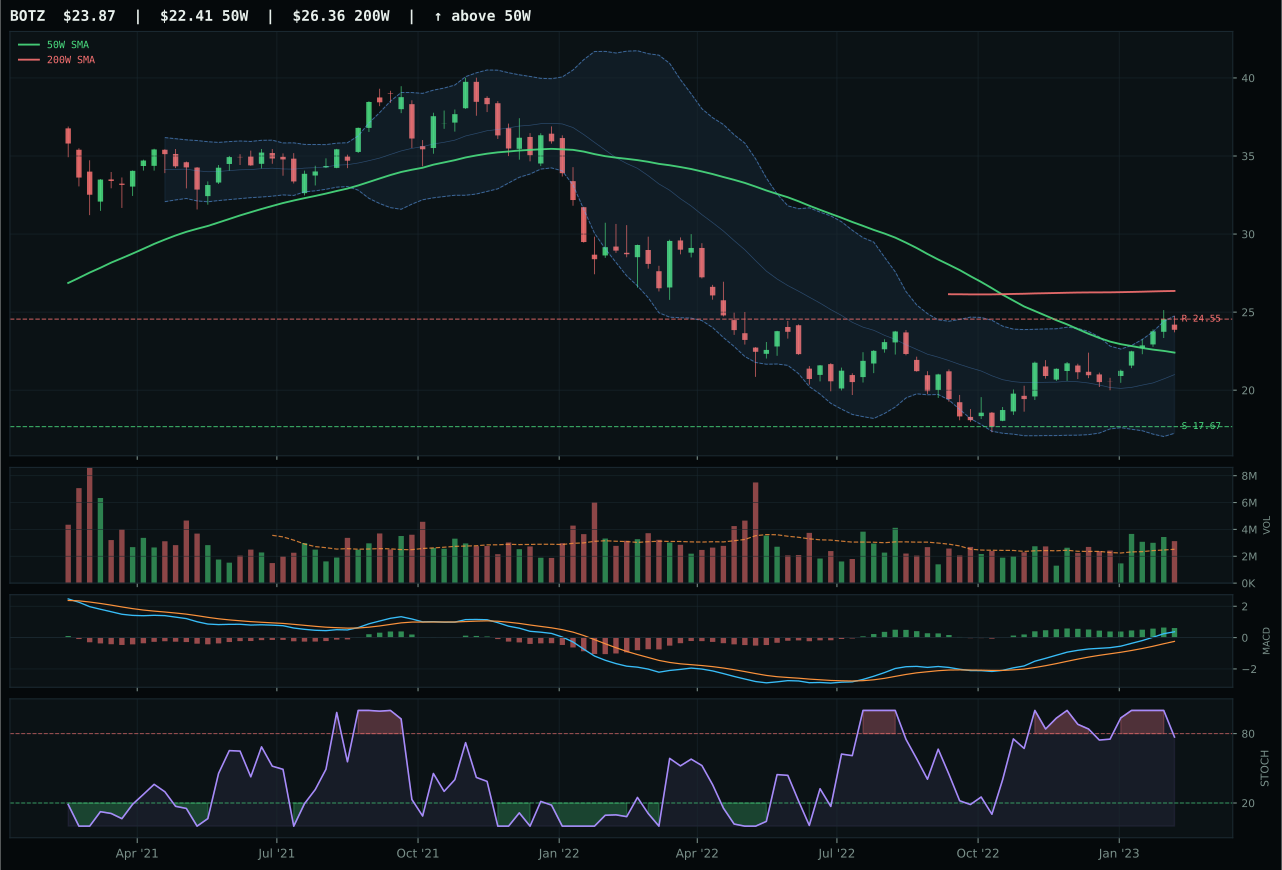
BOTZ has a neutral structure profile with 7.3% 13-week relative strength versus SPY.
A failed hold above support would weaken the setup.
Actionable but governed by invalidation levels.
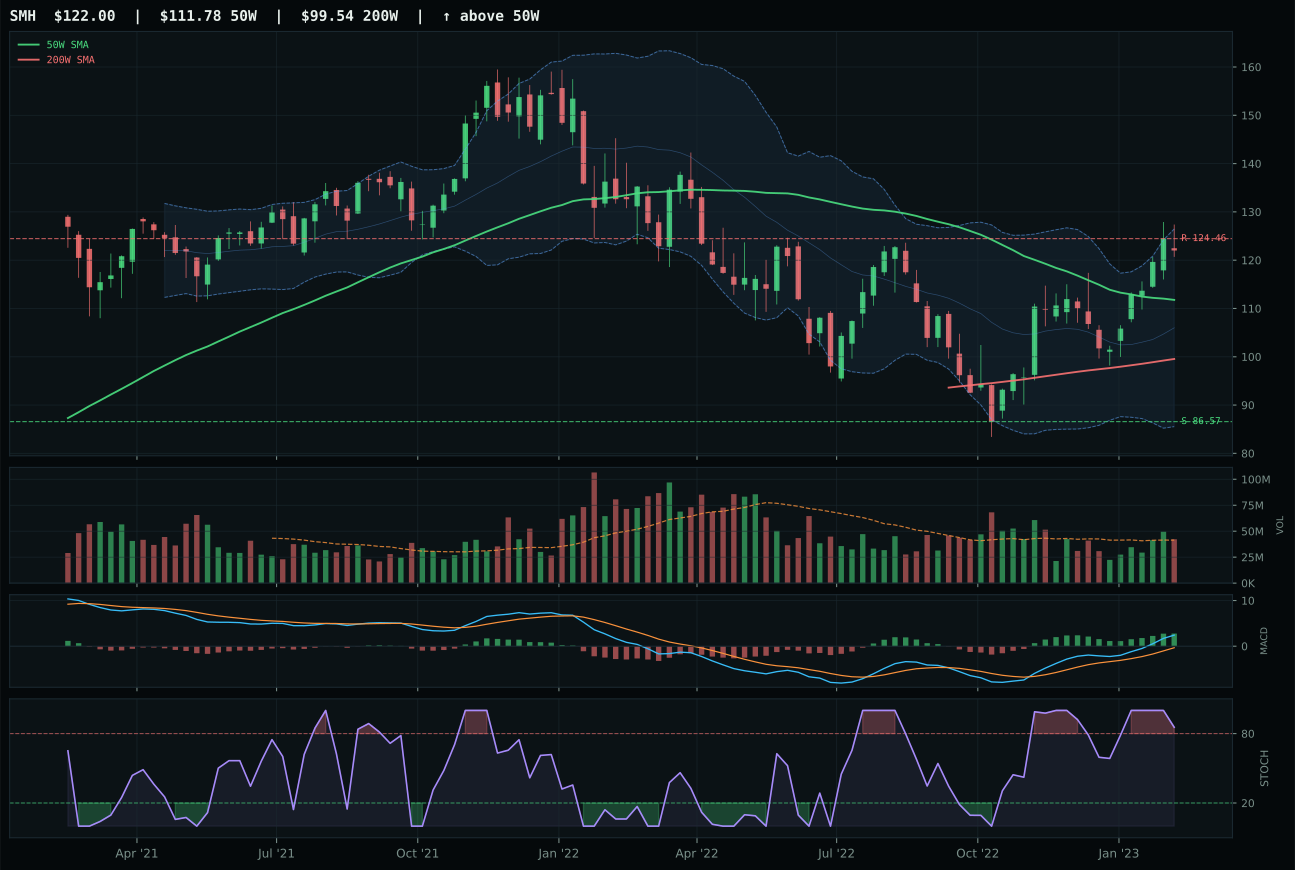
SMH has a neutral structure profile with 8.1% 13-week relative strength versus SPY.
A failed hold above support would weaken the setup.
Actionable but governed by invalidation levels.
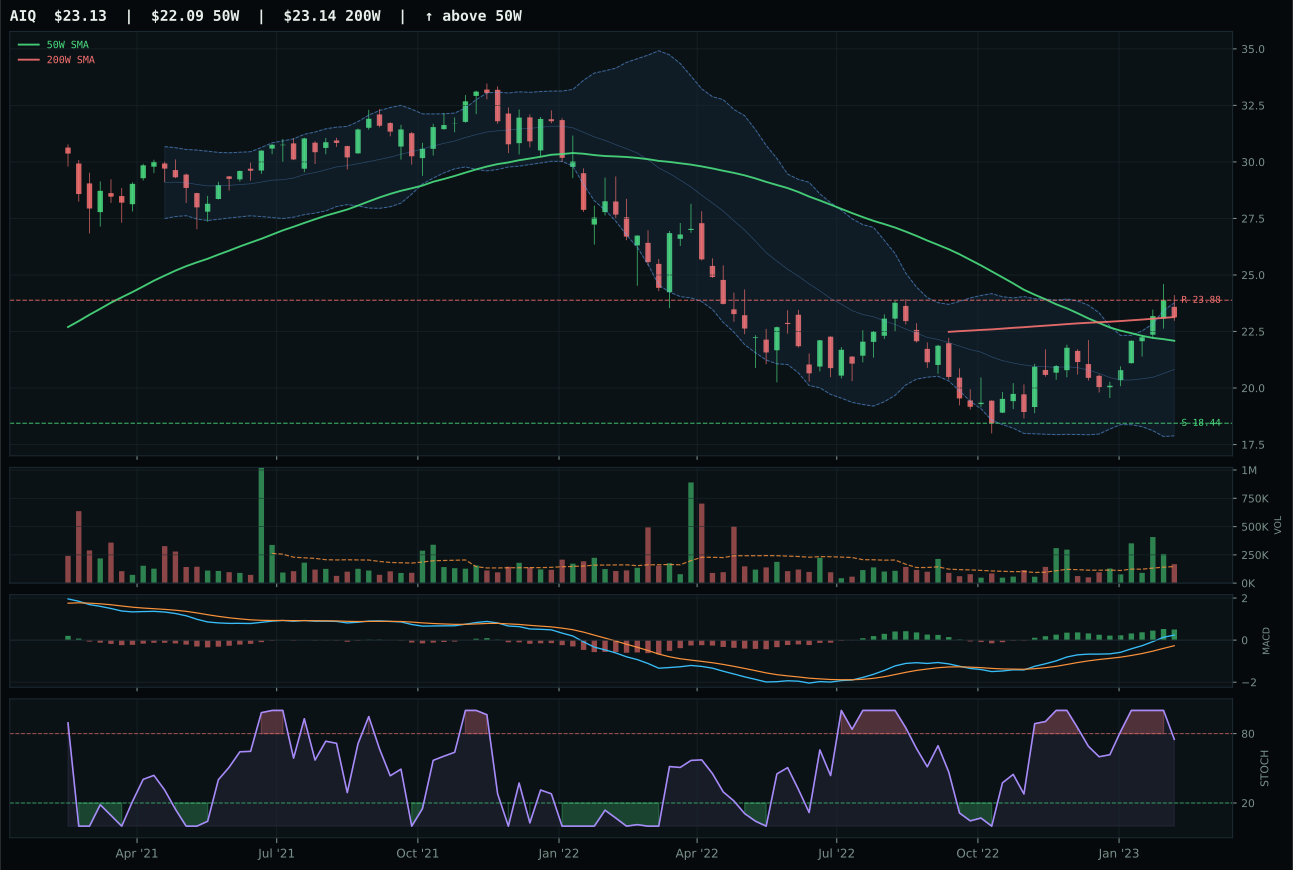
AIQ has a neutral structure profile with 8.1% 13-week relative strength versus SPY.
A failed hold above support would weaken the setup.
Tracked, but not top-2 eligible because: .
SMH won the AI category on momentum breadth and relative-strength stability despite occupying a riskier valuation zone. The semiconductor index trades 9.2% above its 50-week moving average in upper retracement / momentum territory, a setup that would normally signal late entry—yet its thirteen-week return of 10.5% and SPY-relative gain of 8.1% confirm that new money continues to enter the name. The divergence between BOTZ and SMH illustrates the scoring trade: BOTZ delivered a superior technical composite of 76 versus SMH's 74, with stronger trend (80 vs 90) and risk-reward (54 vs 46), but lost on category-relative strength, where SMH's 0.1% edge over the peer basket outweighed BOTZ's superior momentum confirmation. Stochastic RSI is rolling over at 0.85 on SMH—a sign that near-term velocity may be peaking—yet volume is neutral and MACD remains bullish, suggesting the move has institutional sponsorship rather than retail chase.
AI shares the 20% top-2 allocation with Technology because the macro regime's active AI-growth-sponsorship descriptor (+14 points) creates a category-level macro fit of 59.0, and the 3/2/1 weighted ETF basket (66.4 before final adjustments) passes persistence and volume-price confirmation filters. SMH's advantage comes from its price leadership and sector-wide breadth: every semiconductor subsegment from memory to foundry to equipment participation is rising together, which reduces the risk of a single-stock blowoff. The 8.1% thirteen-week SPY relative strength does not require market-wide gains to persist—SMH can hold ground even if macro rolls sideways. Liquidity stress is active (-12 points), a headwind to risk appetite, but this is more than offset by the AI-growth sponsorship and the disinflation backdrop, which keeps cost-of-capital low for the capex cycle that semiconductor equipment and design enablement require. The allocation reflects confidence that momentum metrics outweigh valuation concerns in a still-early artificial-intelligence adoption cycle.
Industrial Metals — COPX
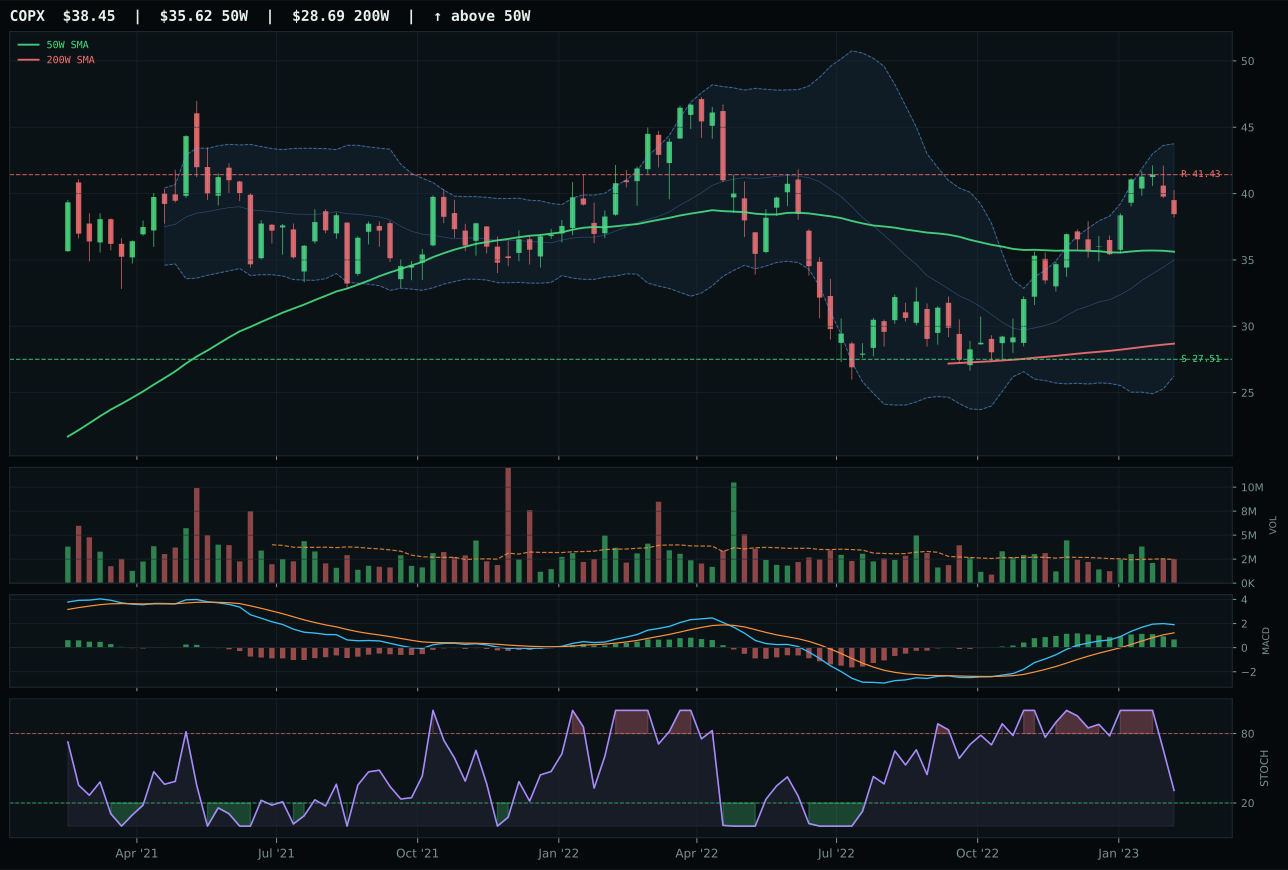
COPX has a neutral structure profile with 6.5% 13-week relative strength versus SPY.
A failed hold above support would weaken the setup.
Actionable but governed by invalidation levels.
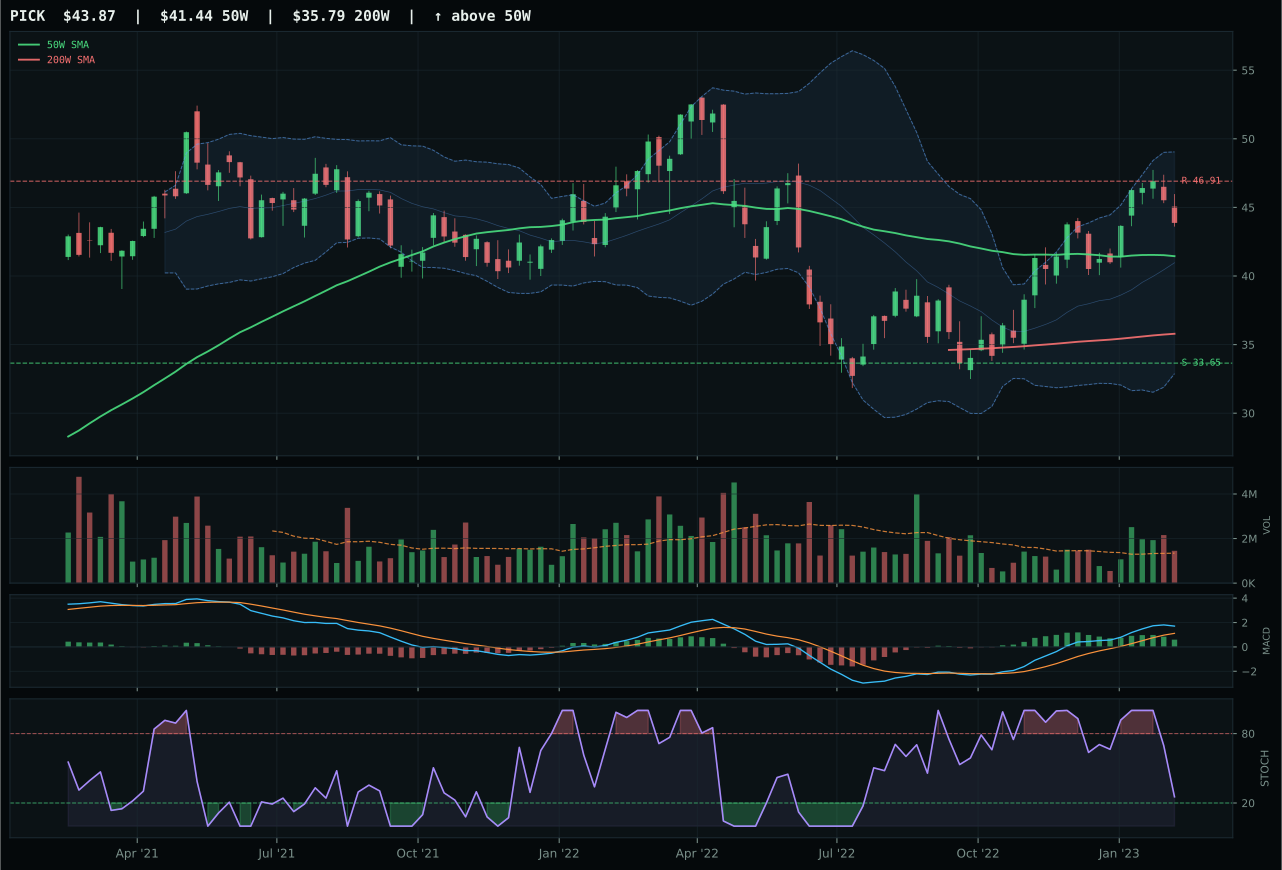
PICK has a neutral structure profile with 3.8% 13-week relative strength versus SPY.
A failed hold above support would weaken the setup.
Actionable but governed by invalidation levels.
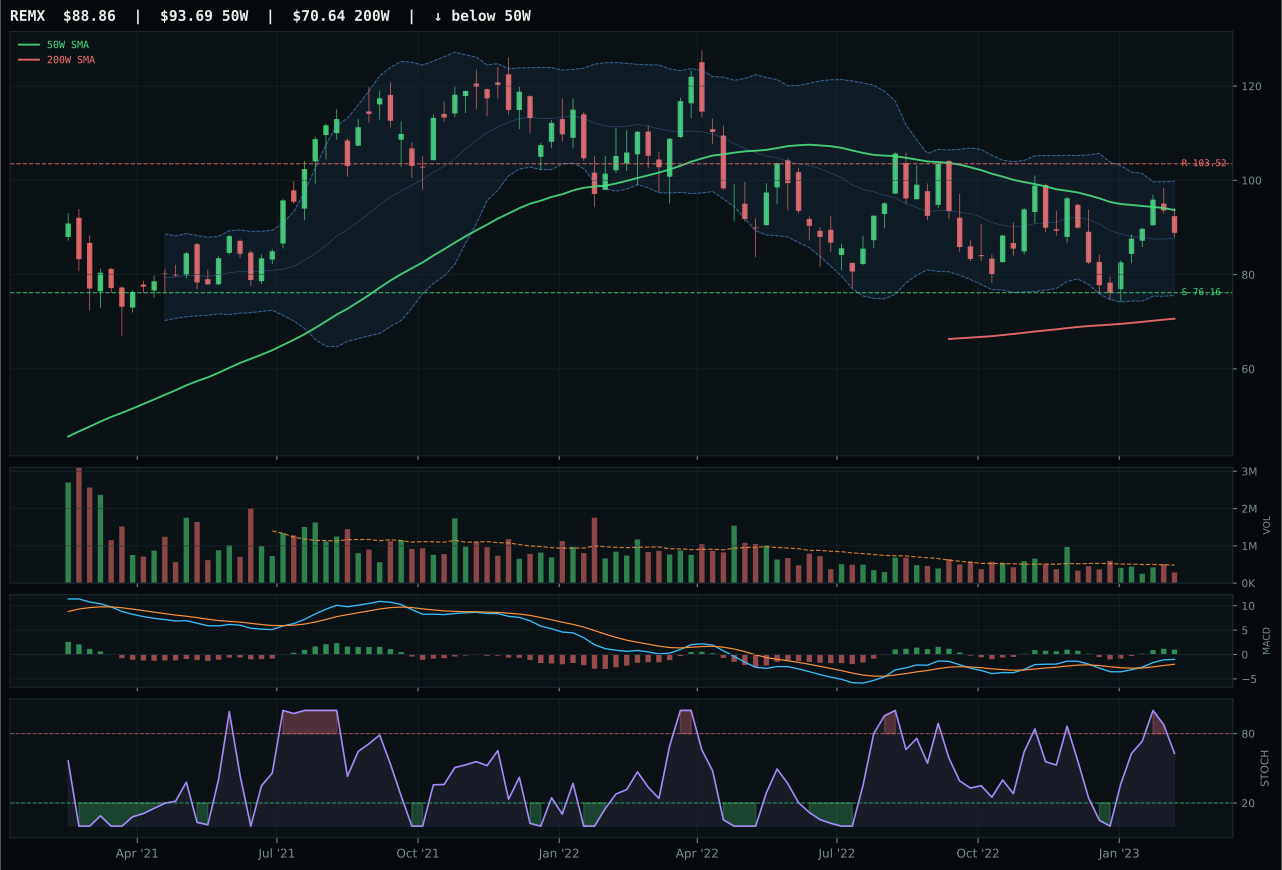
REMX has a neutral structure profile with -12.5% 13-week relative strength versus SPY.
A failed hold above support would weaken the setup.
Actionable but governed by invalidation levels.
COPX narrowly edged PICK by 2.4 points, driven by superior category-relative strength (2.7% vs 0.0%) and a cleaner volatility signature. Copper trades 7.9% above its 50-week moving average in middle retracement / decision territory, a balanced zone where trend confirmation does not require an extended push higher. The 95.7 trend score reflects solid price action above both major averages with 6.5% SPY-relative strength, while structure scores 71.9 from neutral setup with tight support at 27.51 and resistance at 41.43. MACD is bullish but flattening and stochastic RSI is falling from overbought, the same pattern that earned GLD its timing crown—here scoring 77.0 rather than 100.0 because COPX is already further from the 50W. PICK's competitive score (74 composite, 92 trend) could not overcome the fact that category-relative strength showed zero momentum pickup versus the basket median, a sign of market participation diffusion. COPX's slight outperformance in relative strength, combined with its metals-scarcity narrative being tighter than mining diversification, tipped the balance.
Industrial Metals merited 10% because the category-level macro fit of 65.0 reflects strong active support from metals scarcity (+14 points in the reasoning layer) and commodity breadth positive (+10 points), both aligned with the longer-cycle theme of supply constraints and infrastructure capex. The macro fit is not as strong as Precious Metals' 74.0, but it is well above the portfolio mean, and COPX's technical evidence of 71.4 validates the position. Liquidity stress is active (-7 points) and credit stress is active (-8 points), creating a modest headwind, but these are structural costs of commodity exposure that investors accept when the supply-demand narrative is constructive. The allocation reflects conviction that copper's dual role as both monetary hedge (against deflation) and real-asset inflation play (against energy transition capex cycles) makes it resilient across macro regimes. This category holds 10% as a core satellite position: if metals scarcity intensifies or commodity breadth remains positive, COPX can be run higher; if credit stress accelerates, the position can be reduced without a large rotation cost.
Utilities & Infrastructure — PAVE
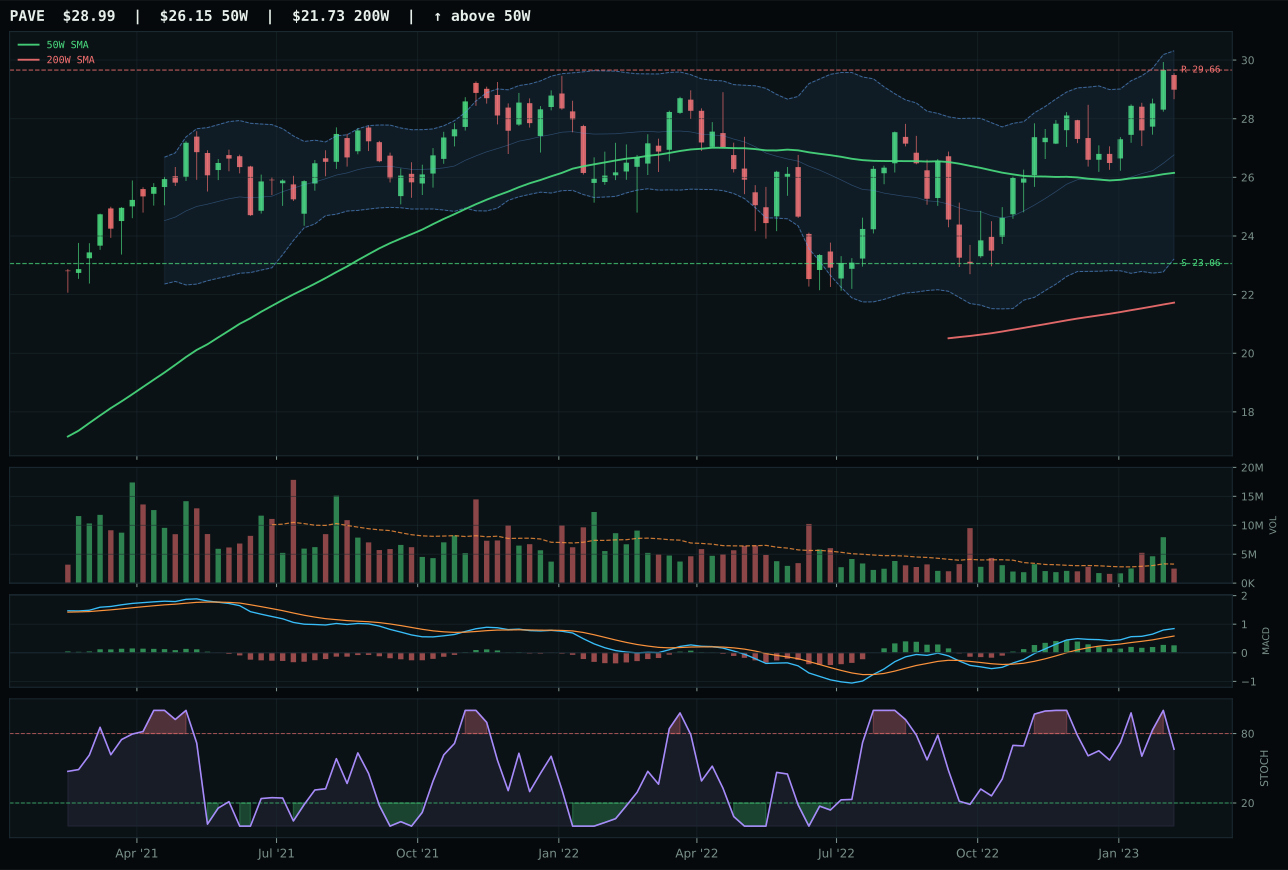
PAVE has a neutral structure profile with 3.5% 13-week relative strength versus SPY.
A failed hold above support would weaken the setup.
Actionable but governed by invalidation levels.
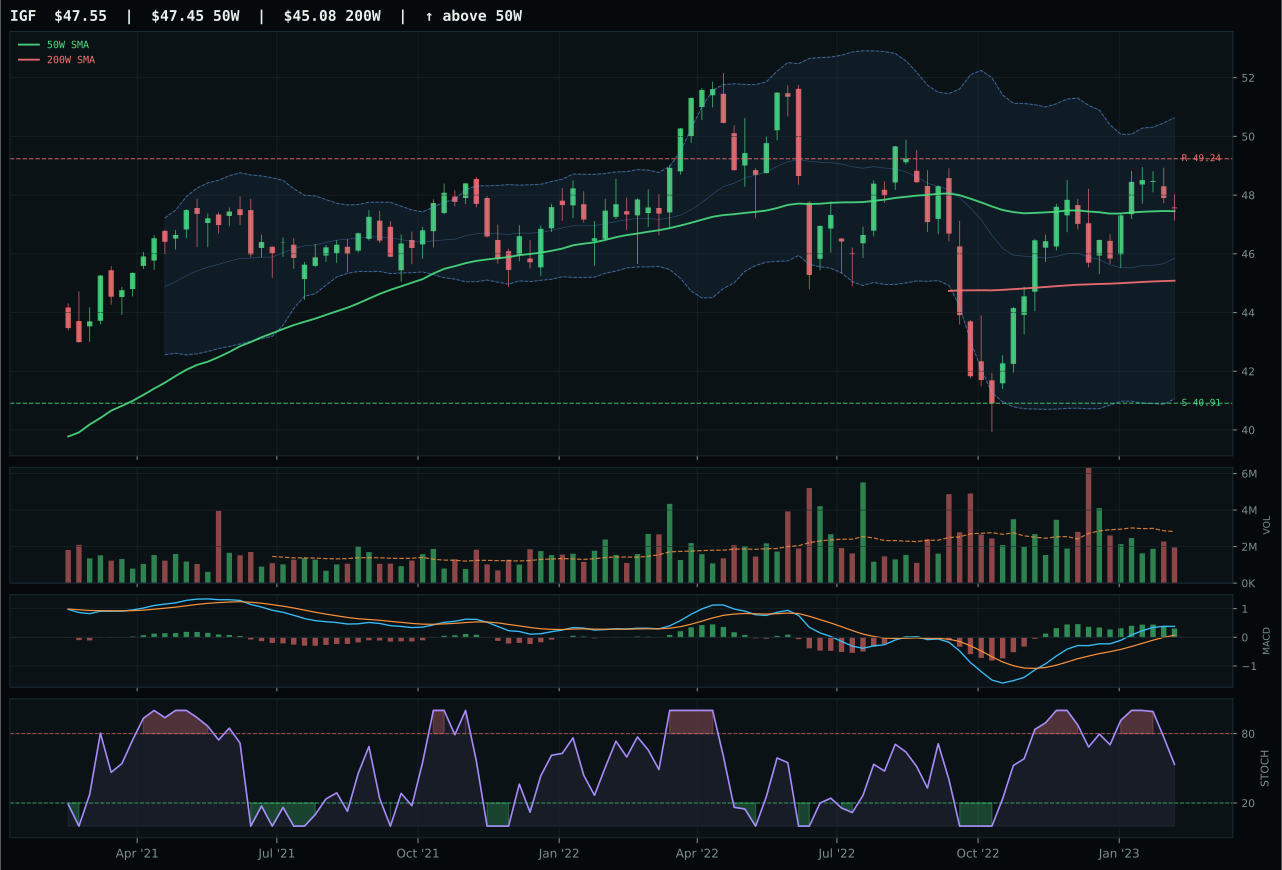
IGF has a compression near 50W profile with -0.0% 13-week relative strength versus SPY.
A failed hold above support would weaken the setup.
Actionable but governed by invalidation levels.
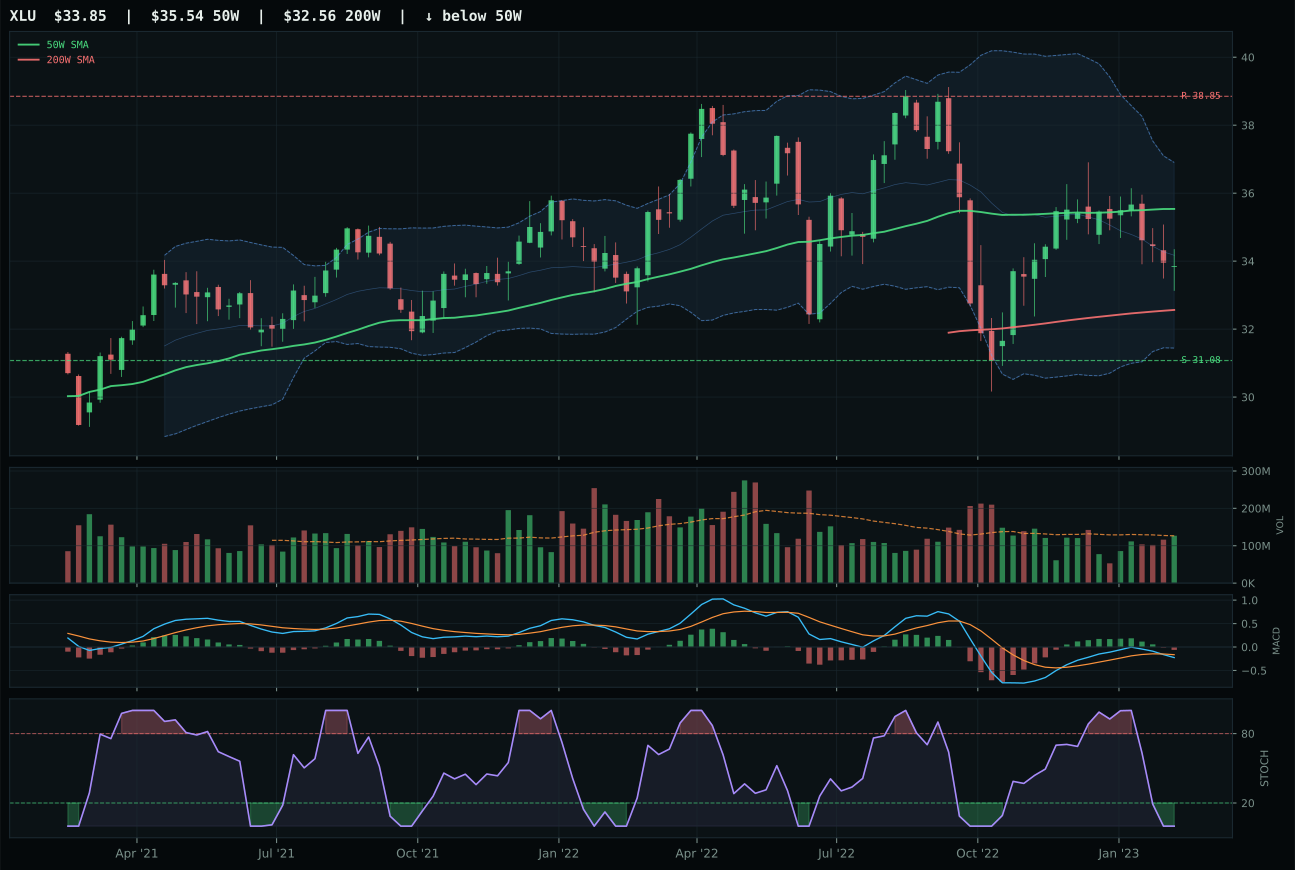
XLU has a neutral structure profile with -2.9% 13-week relative strength versus SPY.
A failed hold above support would weaken the setup.
Actionable but governed by invalidation levels.
PAVE captured Utilities & Infrastructure by delivering the cleanest trend-and-structure picture in a low-conviction category. The domestic infrastructure ETF earns a perfect 100.0 trend score: price is 10.8% above the 50-week moving average with a stable +0.2% slope and solid 3.5% relative strength versus SPY, placing it in upper retracement / momentum territory. Structure scores 73.8 from neutral setup with tight compression and support at 23.06 / resistance at 29.66. Stochastic RSI is rising mid-zone at 0.66 (not yet overbought, still accelerating), MACD is bullish and improving (gaining momentum), and volume confirmation is strong at 73.8—a sign that institutional participation is increasing. IGF, the global-infrastructure runner-up, posted a higher technical composite (76 vs 81) but lost on structure (70.9 vs 73.8), MACD clarity (bullish but flattening vs bullish and improving), and stochastic positioning (falling vs rising), plus category-relative strength (0.0% vs 3.6%). Both showed consistent thirteen-week returns in the 2-6% range, but PAVE's momentum acceleration narrative was fresher.
Utilities & Infrastructure earned 10% because disinflation helps this exposure (+7 points), and the category-level macro fit of 62.0 is credible—second only to Precious Metals' 74.0 and higher than Industrial Metals' 65.0. PAVE's technical evidence of 85.9 is among the highest in the portfolio, reflecting robust trend, structure, and momentum confirmation. The disinflation backdrop is crucial: when interest-rate expectations fall, the present value of utility dividends and long-term infrastructure cash flows rises, supporting valuation multiples. Liquidity stress is active (-3 points) and risk-appetite positive is active (-2 points), creating minor headwinds, but these are modest compared to the macro tailwind. PAVE's thirteen-week return of 5.9% and category-relative strength of 3.6% show that even in a credit-stress regime, domestic infrastructure is holding relative value. The allocation reflects conviction that PAVE's rising stochastic RSI and bullish-and-improving MACD offer genuine upside optionality, especially if disinflation accelerates or if infrastructure capex spending persists despite macro weakness. This is one of the few 10% positions that could reasonably be upgraded to 20% if macro signals continue to align.
Precious Metals — GLD
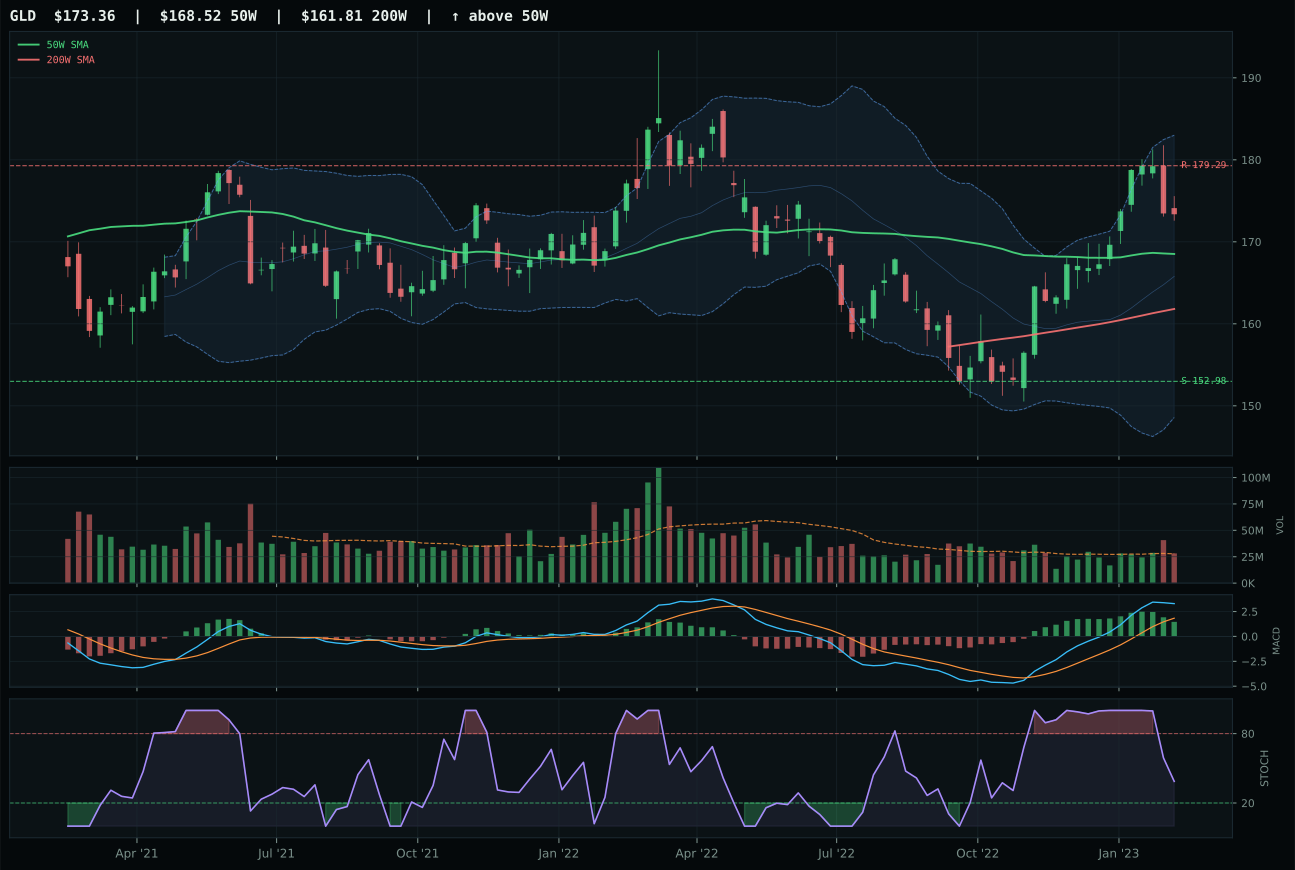
GLD has a compression near 50W profile with 3.0% 13-week relative strength versus SPY.
A failed hold above support would weaken the setup.
Actionable but governed by invalidation levels.
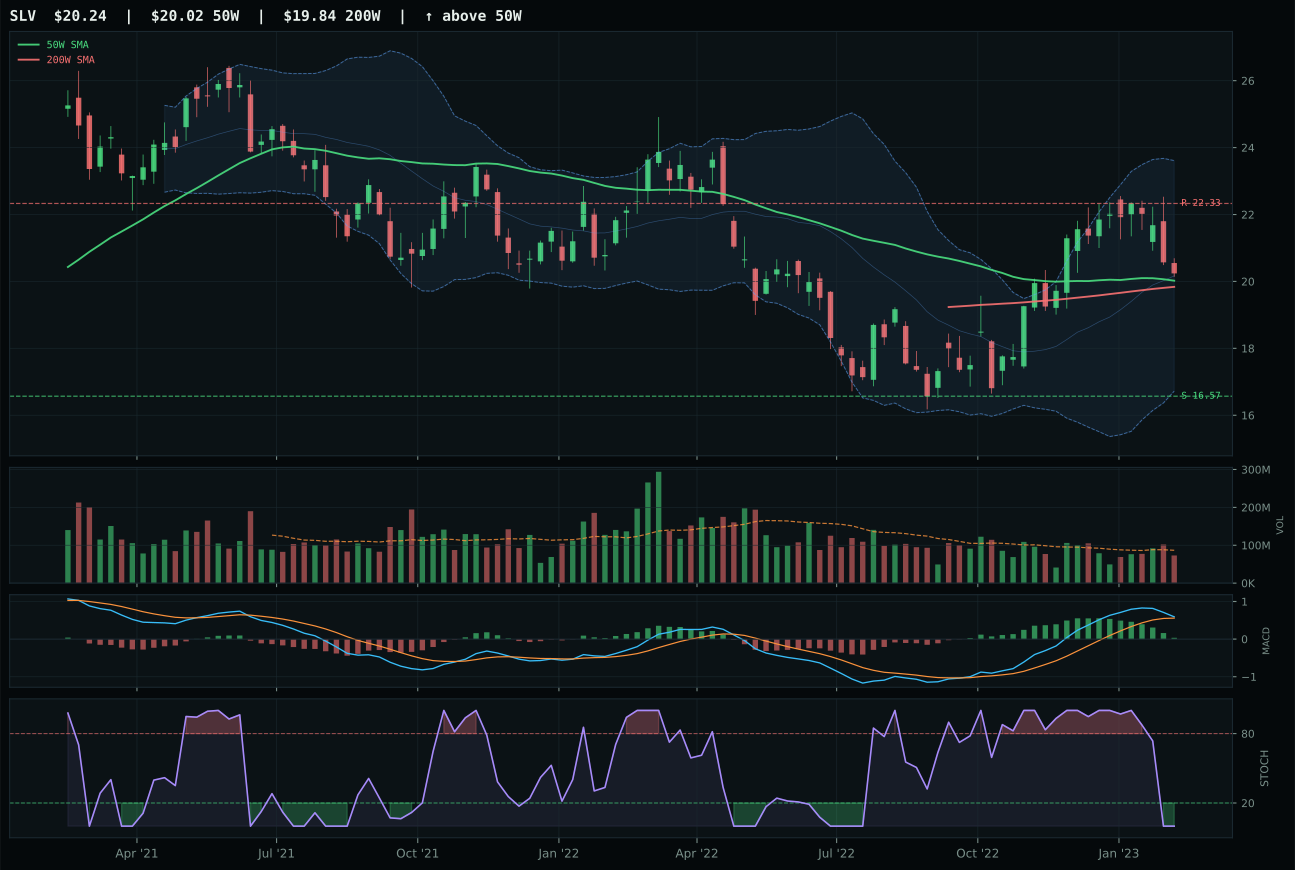
SLV has a compression near 50W profile with -0.9% 13-week relative strength versus SPY.
A failed hold above support would weaken the setup.
Actionable but governed by invalidation levels.
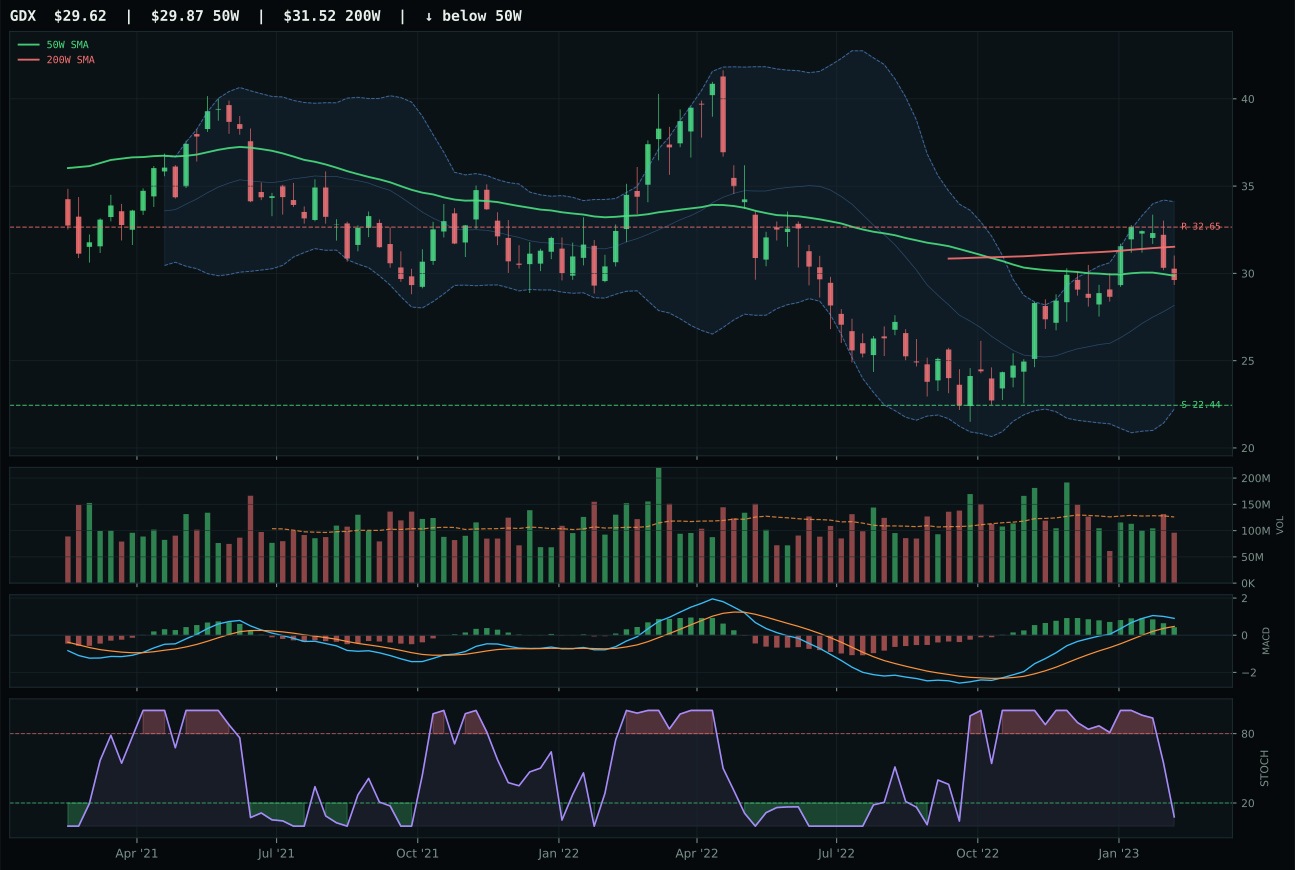
GDX has a compression near 50W profile with 2.3% 13-week relative strength versus SPY.
Extension and support failure are the main tactical risks.
Tracked, but not top-2 eligible because: structurally broken.
GLD captured Precious Metals by combining near-perfect timing with macro alignment and structural clarity. Price trades just 2.9% above the 50-week moving average and sits in the middle retracement / decision zone near Fib 0.500, the definition of a non-extended setup where new buyers are not punished for entering late. The timing score of 100.0 reflects the convergence of distance-to-50W at 2.9%, MACD bullish but flattening (showing momentum without acceleration), stochastic RSI falling from overbought into neutral (the cleanest technical handoff between intermediate and short-term buyers), and Fibonacci placement at the decision point where statistically, reversals either materialize or uptrends confirm. SLV, which captures the silver industrial-monetary hybrid, scored 60.6 in the reasoned proof order versus GLD's 73.2, lagging on structure cleanliness (69.5 vs 75.6) and category-relative strength (-3.2% vs 0.7%), signaling that institutional money is choosing the cleaner monetary narrative over industrial leverage. GLD's 5.3% thirteen-week return and 3.0% SPY-relative strength are modest by growth standards but steady for a defensive metal.
Precious Metals earned 10% because the macro regime's monetary hedge bid (+14 points) combined with disinflation pressure (+8 points and +6 in category fit) creates a 74.0 category-level macro fit—the highest among the ten categories and a rare case where macro alignment is as strong as technical evidence. GLD's 83 composite technical score (trend 90, structure 75.6, timing 100) provides genuine conviction that the setup is clean, not stretched. The disinflation backdrop is the key: falling inflation expectations push real yields lower, which reduces the opportunity cost of holding non-yielding gold. This category would rank higher still if risk appetite were negative, but the active risk-appetite-positive descriptor (+9 points in AI, +10 in Technology) slightly dampens the gold narrative by reducing the fear premium. Nevertheless, GLD's combination of perfect timing setup, macro tailwind from monetary hedging, and structural cleanliness in an extended-market environment makes this a tactical 10% deserving conviction—it is the portfolio's best insurance against either credit stress or deflation shocks.
Defense & Aerospace — ITA
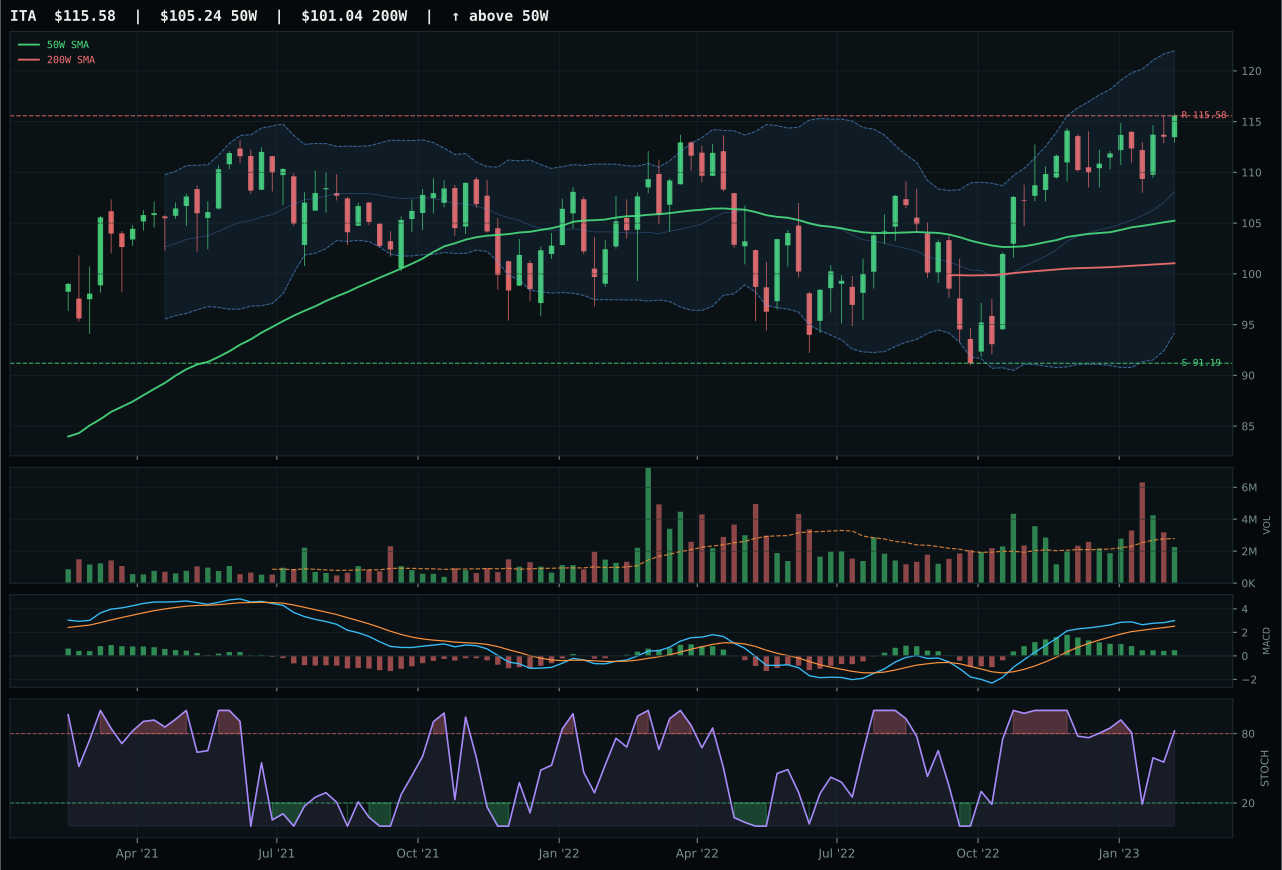
ITA has a neutral structure profile with 3.9% 13-week relative strength versus SPY.
A failed hold above support would weaken the setup.
Actionable but governed by invalidation levels.
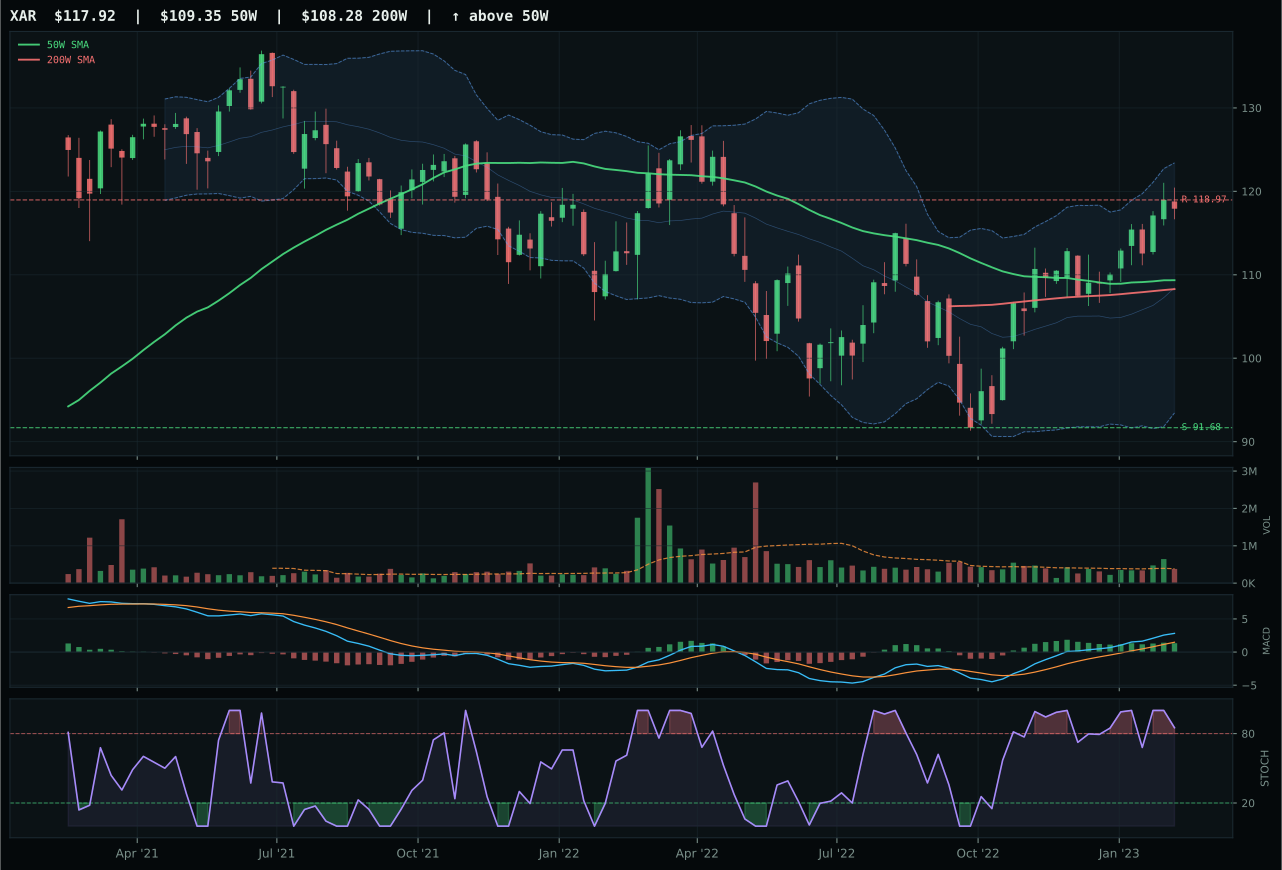
XAR has a neutral structure profile with 4.1% 13-week relative strength versus SPY.
A failed hold above support would weaken the setup.
Actionable but governed by invalidation levels.
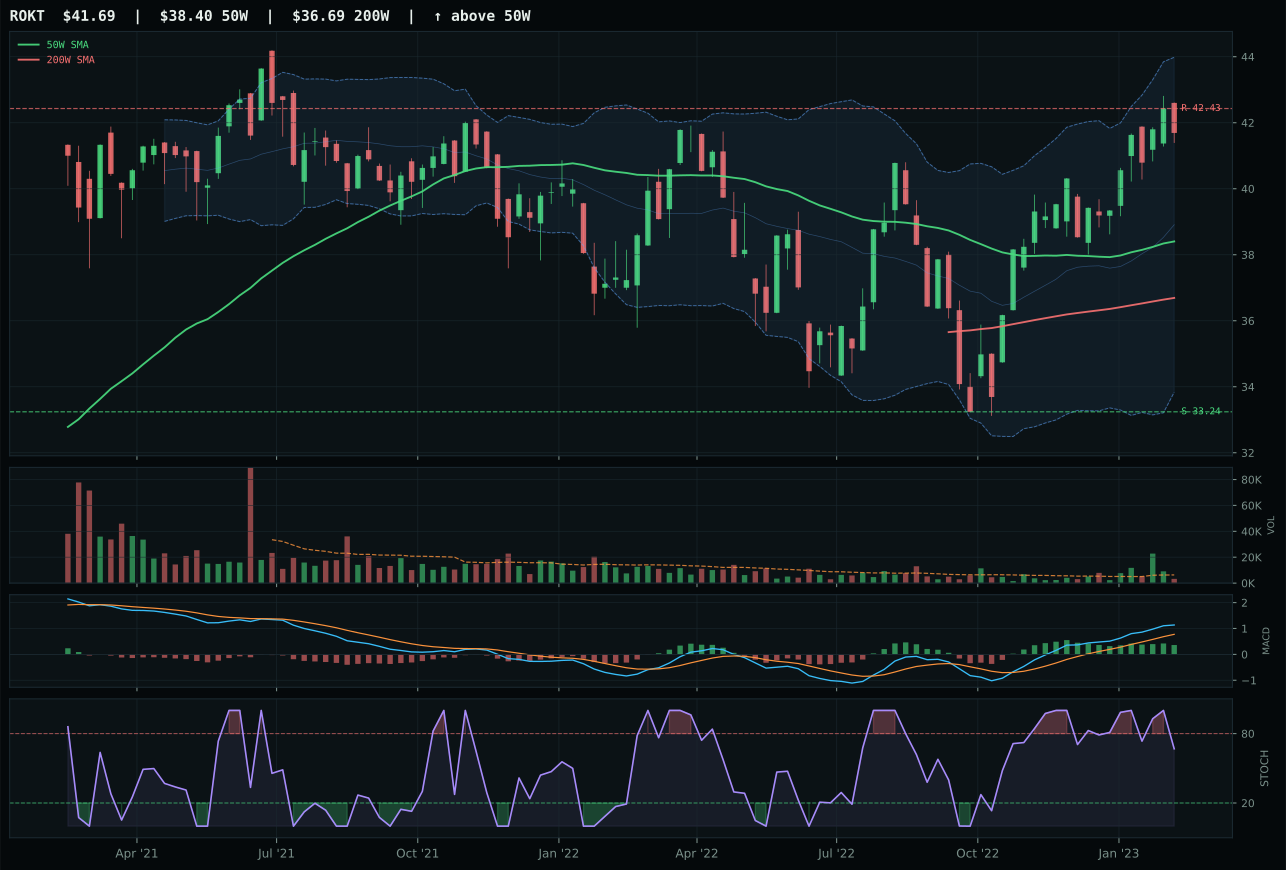
ROKT has a neutral structure profile with 3.7% 13-week relative strength versus SPY.
A failed hold above support would weaken the setup.
Tracked, but not top-2 eligible because: .
ITA secured the Defense & Aerospace lead by delivering the cleanest trend-and-structure combination in a category where all three contenders were bunched within 0.9 points. Price sits 9.8% above the 50-week moving average and near 52-week highs, landing in upper retracement / extension territory—the farthest extended of the three—but the 50-week slope remains flat at +0.2%, indicating that the move is not being fueled by accelerating momentum but rather steady, non-deteriorating demand. The 100.0 trend score reflects prices above both the 50W and 200W with solid 3.9% relative strength versus SPY, while structure scores 74.8 from tight compression and clean support at 91.19. XAR lost by 0.9 points despite posting a higher thirteen-week return (6.5% vs 6.3%) because its macro narrative fit scored 50.0 versus ITA's 47.0—a paradox resolved by recognizing that XAR's general-category expression lacks the durability narrative that ITA's "defense-prime durability" positioning carries. Both showed bullish-but-flattening MACD, overbought momentum, and neutral structure; ITA's edge came from more stable breadth.
Defense & Aerospace earned a 10% slot despite scoring 53.1—well below the top-2 threshold—because the category is eligible and the macro regime provides modest tailwind. Credit stress is active (+2 points), which supports government contracting and long-cycle procurement, while liquidity stress (-4 points) is a minor headwind. The category-level macro fit of 51.0 is neutral, reflecting the absence of a category-specific descriptor profile to drive strong conviction either way. What keeps this allocation from zero is ITA's technical evidence of 70.7 and the simple fact that defense remains non-cyclical relative to credit cycles and disinflation; the sector's cash flows are less sensitive to interest rates than cyclicals, and defense budgets tend to be sticky regardless of macro. The 10% allocation represents a low-conviction hold rather than a conviction bet: the category would need either stronger relative strength metrics or a shift in the credit-stress regime to graduate to top-2 status.
Nuclear Energy — URNM
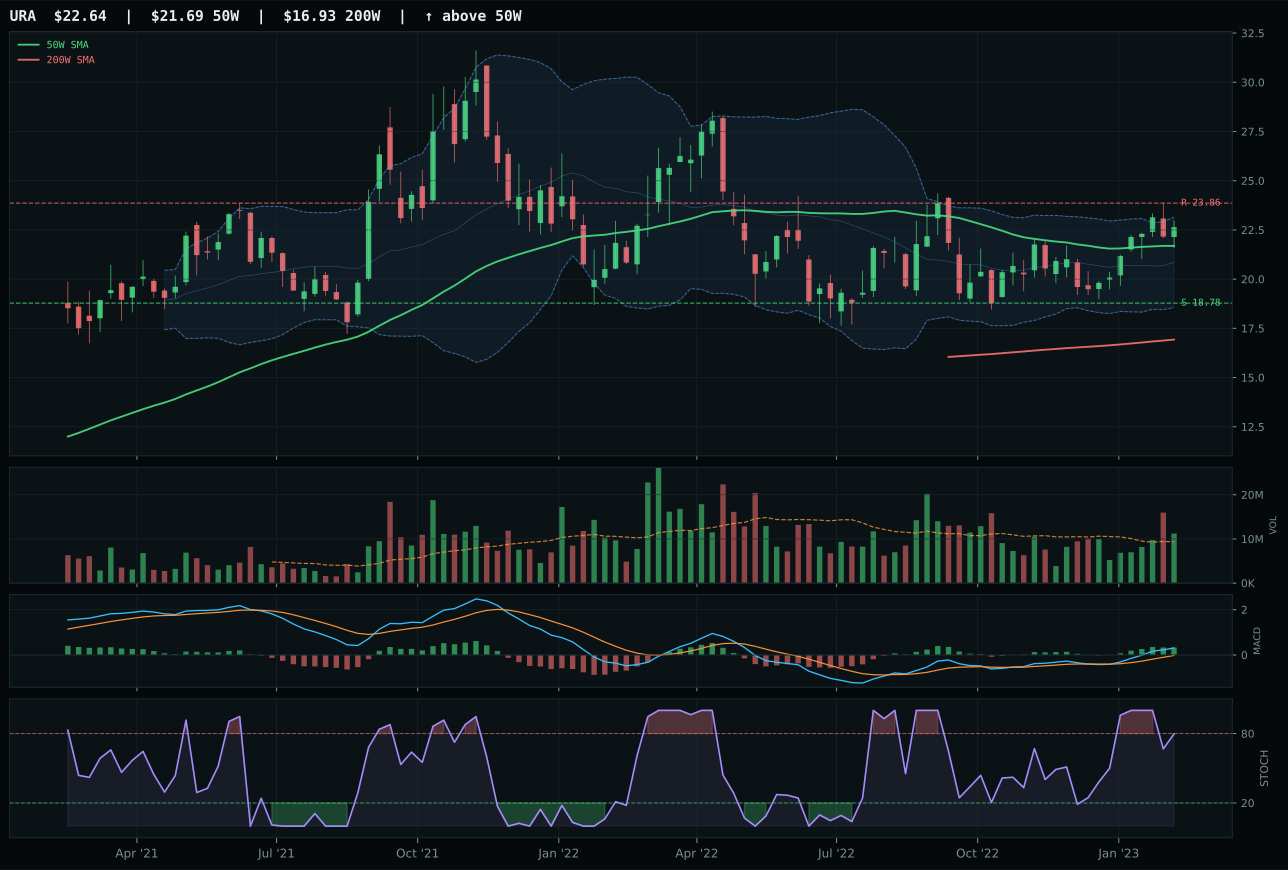
URA has a neutral structure profile with 1.7% 13-week relative strength versus SPY.
A failed hold above support would weaken the setup.
Actionable but governed by invalidation levels.
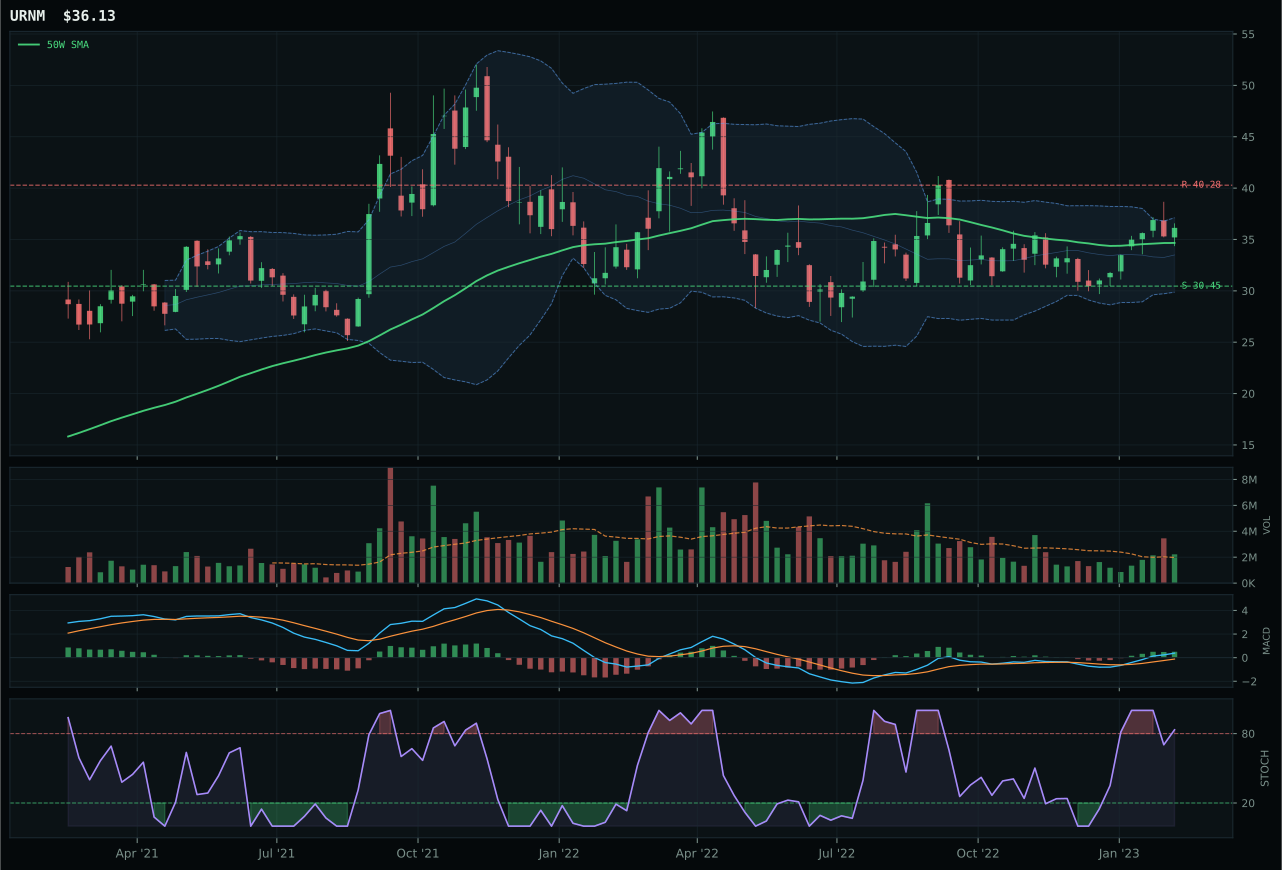
URNM has a neutral structure profile with -0.3% 13-week relative strength versus SPY.
A failed hold above support would weaken the setup.
Actionable but governed by invalidation levels.
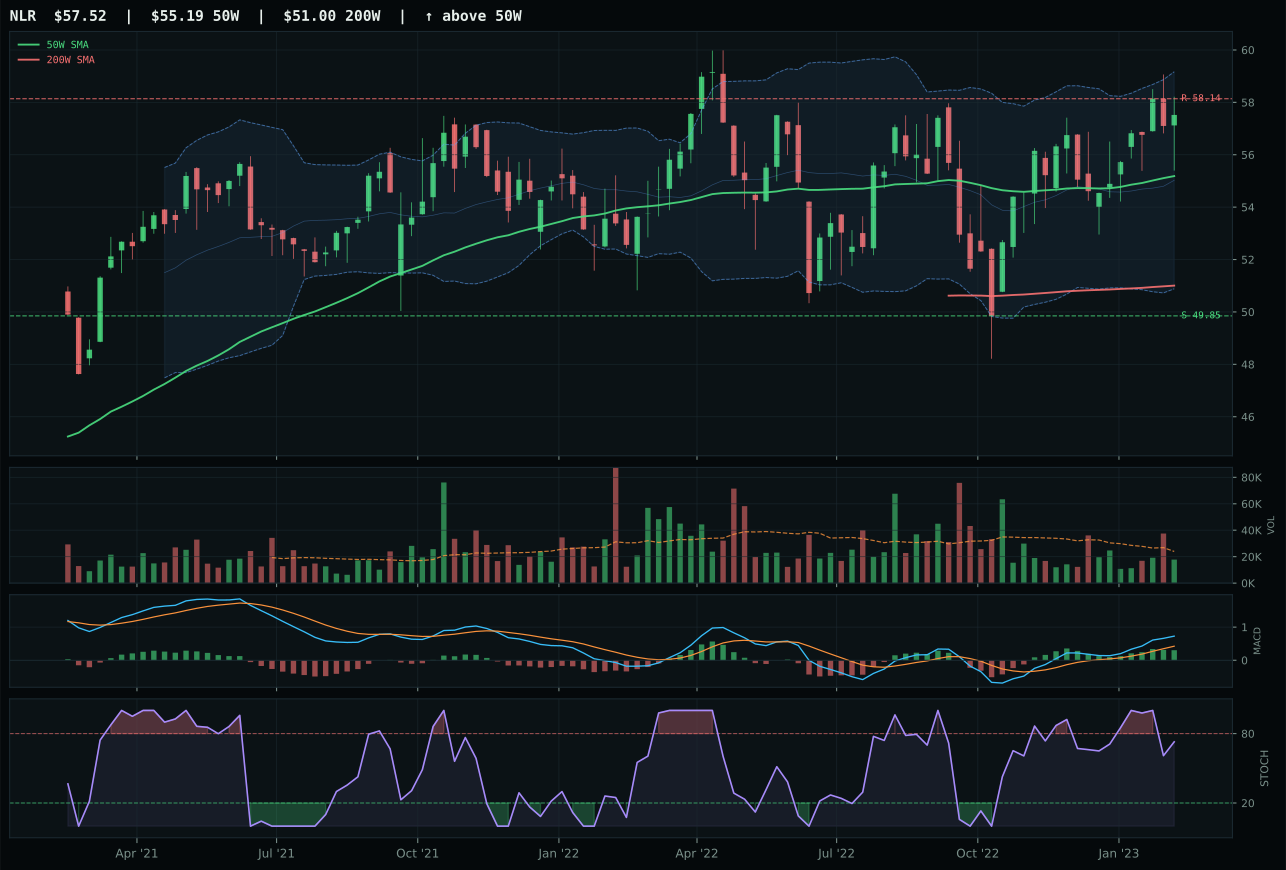
NLR has a neutral structure profile with 0.0% 13-week relative strength versus SPY.
A failed hold above support would weaken the setup.
Tracked, but not top-2 eligible because: .
URNM won Nuclear Energy despite URA posting a superior technical composite (82 vs 72) because risk-reward scored higher (63.0 vs 57.5), providing downside protection that URA's aggressive positioning sacrificed. URNM trades 4.2% above its 50-week moving average but sits below the 200-week, a transitional setup that still depends on support holding rather than confirmed upside trend. Structure scores 79.1 from neutral setup with support at 30.45 and resistance at 40.28, while stochastic RSI is overbought rolling over at 0.83—a sign that intermediate momentum is peaked but not yet reversing. MACD is bullish and improving, and volume is above-average at 1.12x the 20-week average, suggesting institutional accumulation rather than retail chase. URA's timing score of 97 and momentum of 79 beat URNM on pure acceleration, but URA's 57.5 risk-reward (constrained upside of 6.5% to resistance, wide downside of 24.0% to support) penalized it relative to URNM's more balanced asymmetry. Category-relative strength was nearly flat for both (-0.4% vs 1.6%), so the differentiator was structural durability.
Nuclear Energy earned 10% on the strength of real-asset sponsorship (+7 points) and early-stage risk-appetite support (+5 points), despite low absolute macro fit of 50.0. The allocation reflects a bet that uranium supply constraints and energy-transition demand for baseload power will drive the sector higher even if overall risk appetite weakens. URNM's above-average volume participation (1.12x the 20-week average) is notable because it suggests that smart money is accumulating ahead of further announcements in the nuclear renaissance narrative. The thirteen-week return of 2.1% is muted, and SPY-relative strength is flat at -0.3%, but the category is less crowded than AI or Technology, meaning that when relative strength does turn positive, it can move further and faster. This is a low-conviction satellite position that should be monitored for evidence of volume acceleration or macro descriptor changes (such as credit stress easing or real-asset sponsorship strengthening). A 10% allocation acknowledges the long-term thesis while accepting near-term macro headwinds from liquidity stress (-7 points) and credit stress (-5 points).
Agriculture & Livestock — WEAT
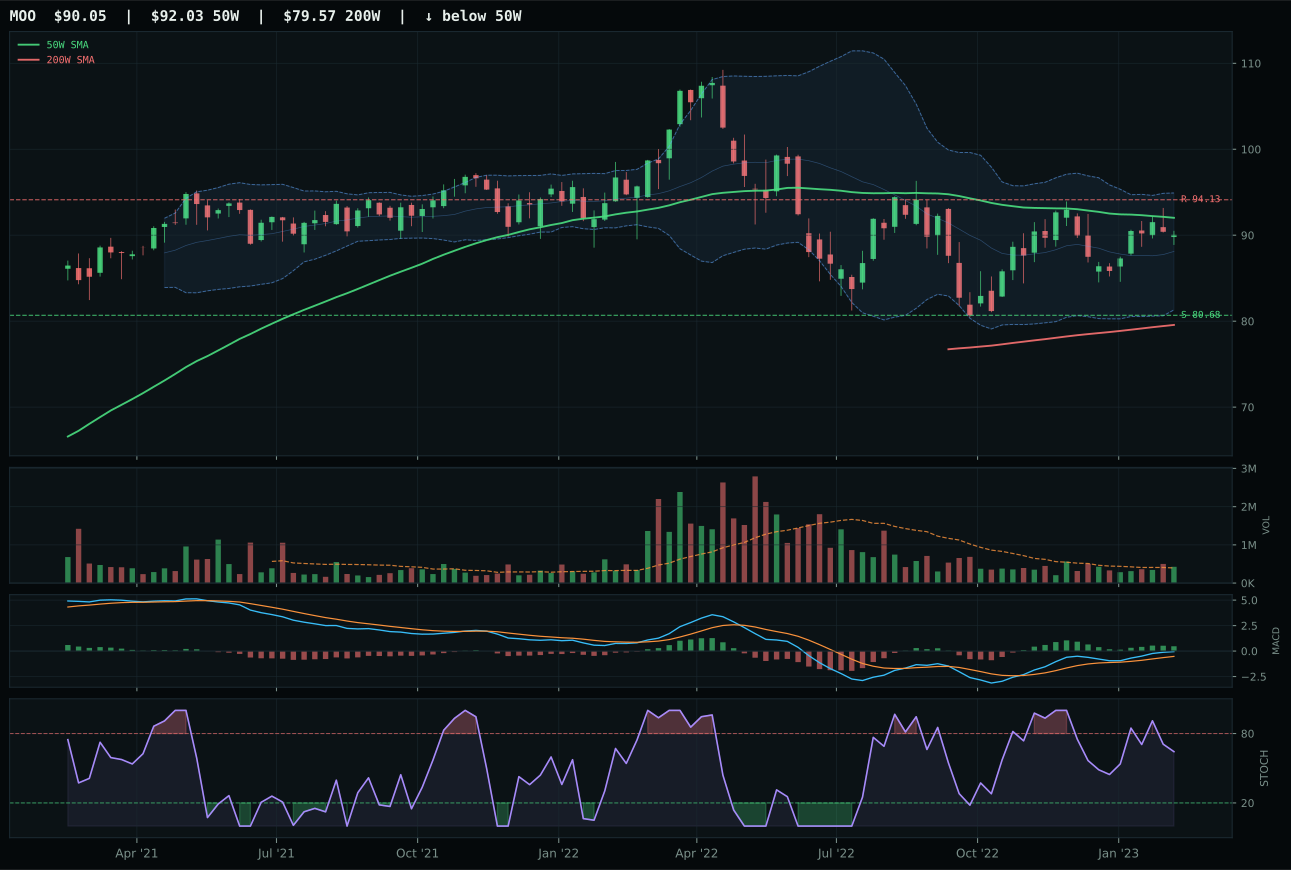
MOO has a compression near 50W profile with -2.8% 13-week relative strength versus SPY.
A failed hold above support would weaken the setup.
Actionable but governed by invalidation levels.
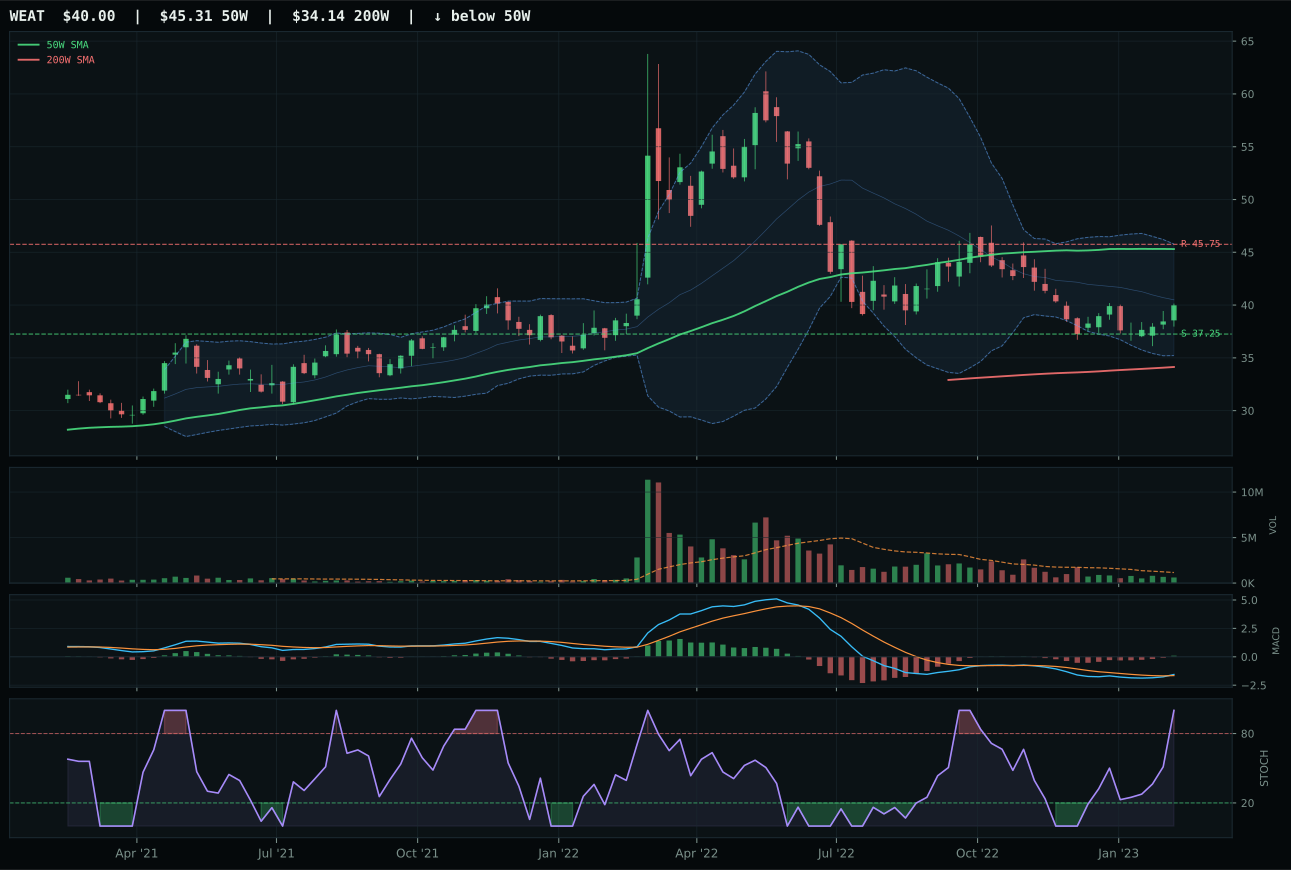
WEAT has a neutral structure profile with -7.6% 13-week relative strength versus SPY.
A failed hold above support would weaken the setup.
Actionable but governed by invalidation levels.
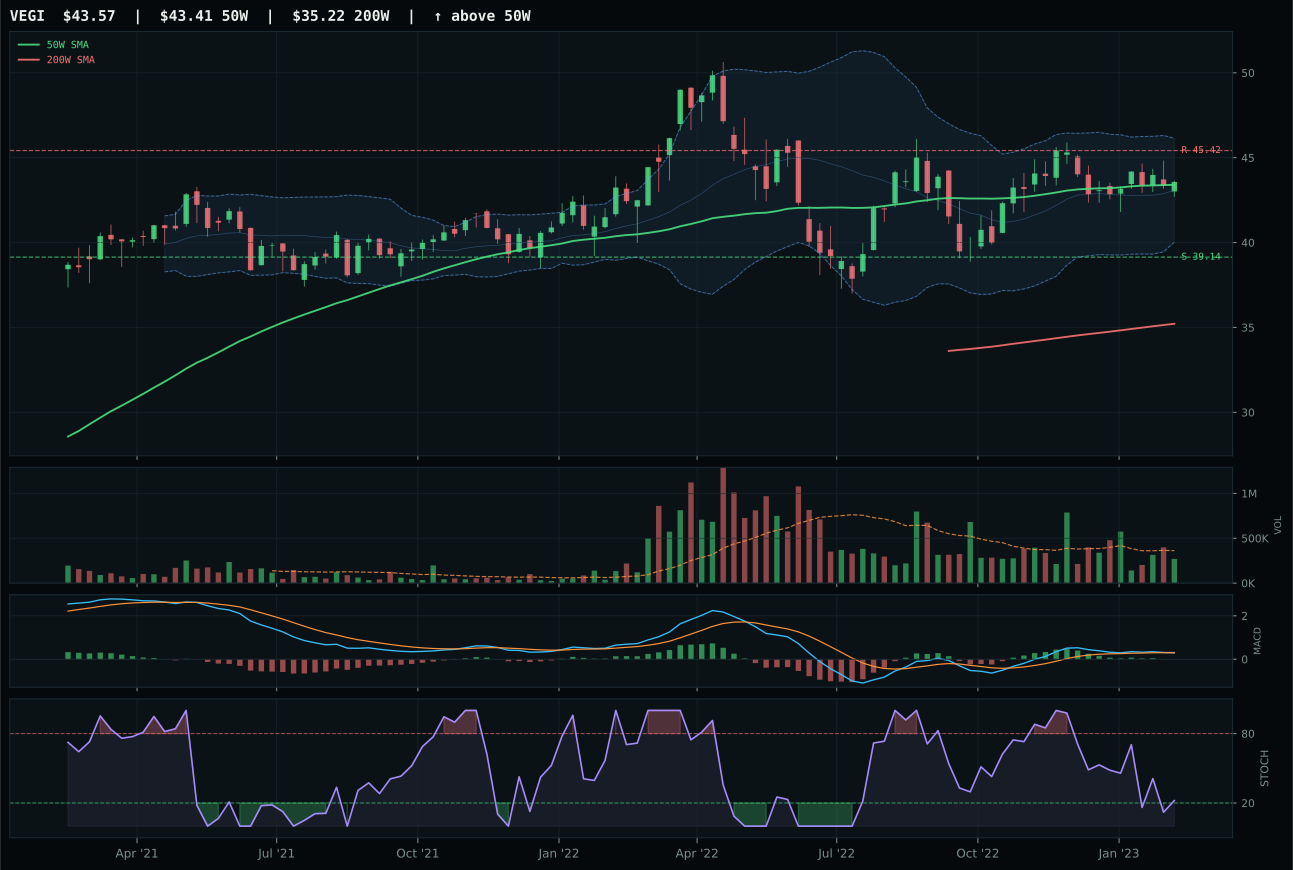
VEGI has a compression near 50W profile with -3.5% 13-week relative strength versus SPY.
A failed hold above support would weaken the setup.
Actionable but governed by invalidation levels.
WEAT won the Agriculture category by defaulting to the least-bad option in a structurally challenged space. The Teucrium Wheat fund trades 11.7% below its 50-week moving average—a classic pullback setup—and the chart sits near 52-week lows in the repair zone. This gives it a 75.6 risk-reward score, the highest in the category, because downside to support (7.4%) is tightly bounded while upside remains unconfirmed at -12.6% to resistance. MACD is bullish and improving, and stochastic RSI is spiked to overbought at 1.00, signaling a bounce from deeply oversold conditions rather than a new trend. MOO, the runner-up, trades only 2.1% below its 50W with compression near support, a technically superior setup, but its risk-reward of 59.7 and structure cleanliness of 69.7 could not overcome a 23.2-point score gap driven by WEAT's extreme statistical edge in asymmetry. Category-relative strength shows WEAT at -4.1% versus MOO at +0.7%, yet WEAT's thin volume (0.53x the 20-week average) is a red flag suggesting this bounce is fragile.
Agriculture earned 10% primarily as a placeholder in a disinflation regime where real assets are typically liabilities. The category-level macro fit of 45.0 reflects two offsetting pressures: commodity breadth positive (+5 points) and real asset sponsorship (+8 points) suggest some institutional hedging, while disinflation pressure (-8 points) and disinflation itself (-6 points) actively suppress crop and livestock prices. WEAT's thirteen-week return of -5.2% and SPY-relative deficit of -7.6% confirm that this category is underwater on a momentum basis, making the allocation a contrarian bet on reversal rather than a conviction position. The portfolio carries agriculture at 10% to maintain commodity diversification and because WEAT's pullback-into-repair setup offers better downside protection than owning a stretched name, but investors should expect this category to benefit only if credit stress eases or commodity demand suddenly resurfaces. This is not a category to chase; it is a category to own on weakness and trim on bounces.
Emerging Markets — IEMG
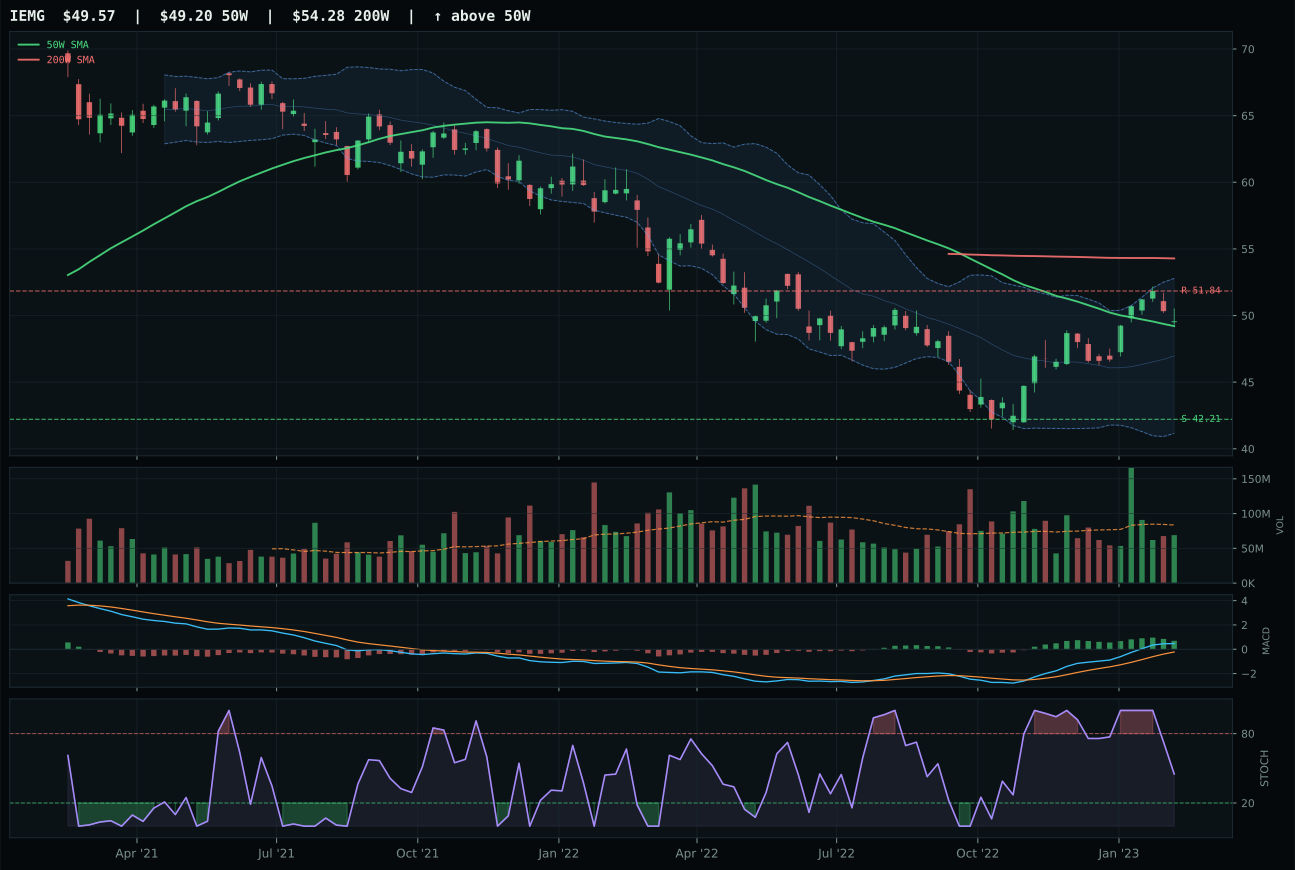
IEMG has a compression near 50W profile with 3.2% 13-week relative strength versus SPY.
A failed hold above support would weaken the setup.
Actionable but governed by invalidation levels.
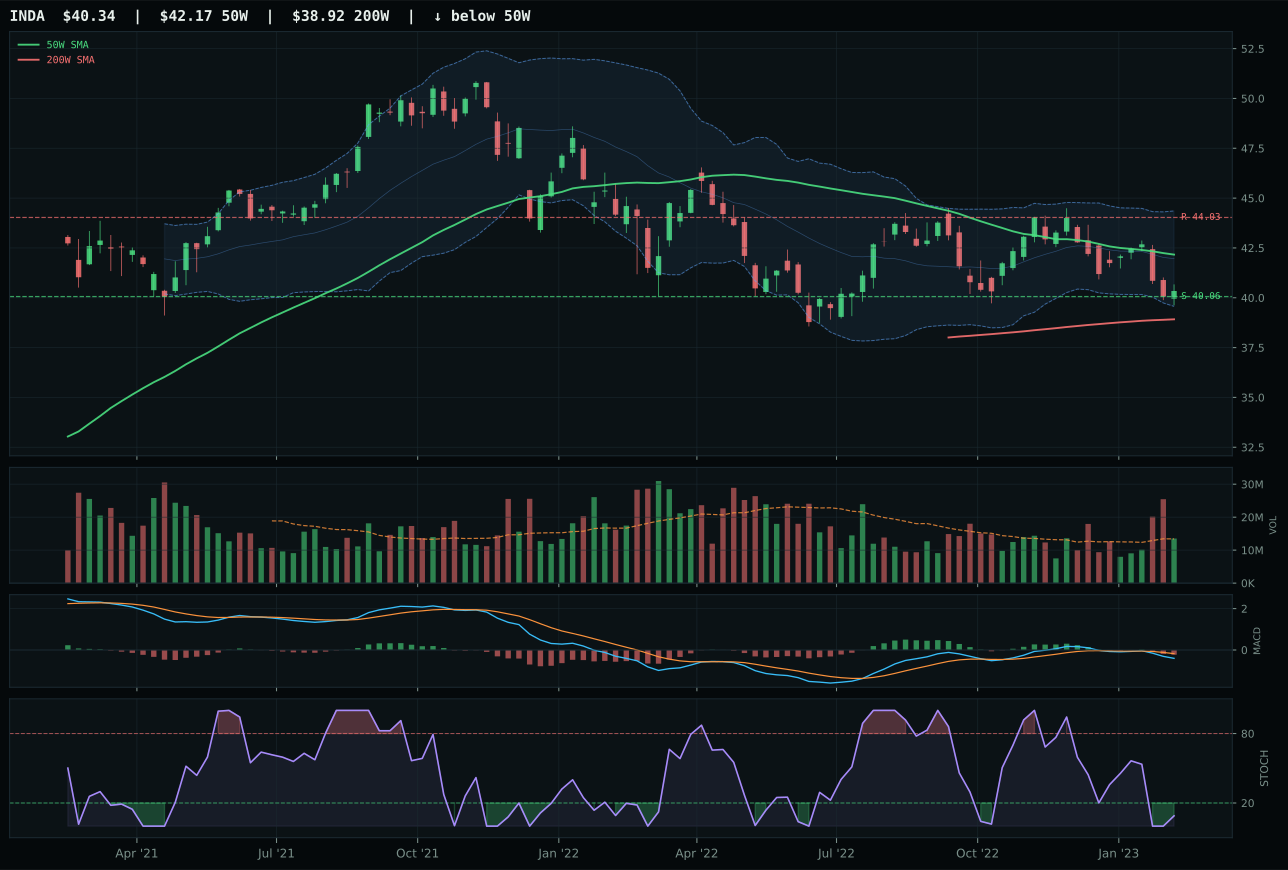
INDA has a pullback into support profile with -10.8% 13-week relative strength versus SPY.
A failed hold above support would weaken the setup.
Actionable but governed by invalidation levels.
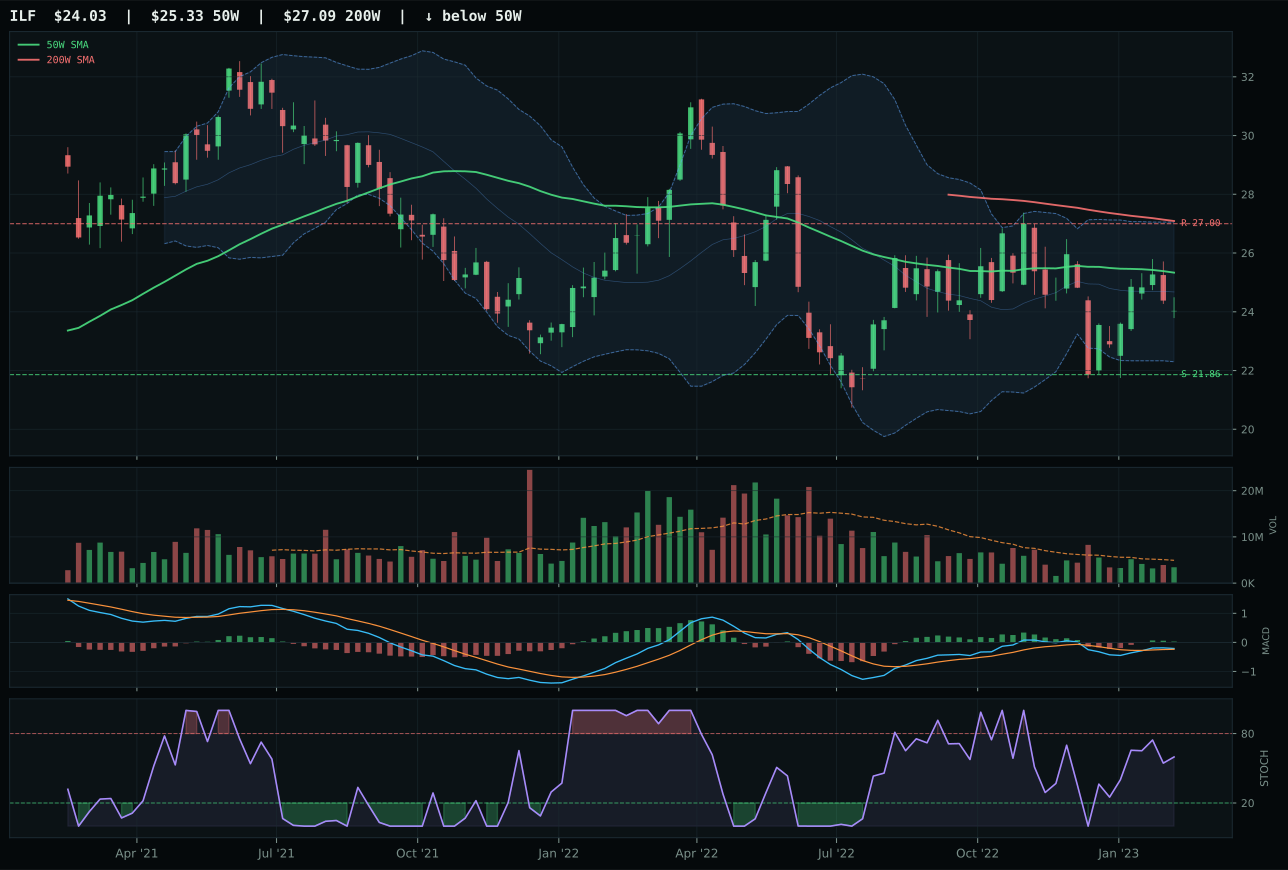
ILF has a neutral structure profile with -7.7% 13-week relative strength versus SPY.
Extension and support failure are the main tactical risks.
Tracked, but not top-2 eligible because: structurally broken.
IEMG won Emerging Markets by occupying the least-damaged technical position in a category suffering from credit-stress contagion. The MSCI Emerging Markets ETF sits 0.7% above its 50-week moving average in perfect middle-retracement / decision territory, earning the timing score of 95.0—the third-highest timing score in the entire portfolio after GLD and MOO. Price is below the 200-week moving average (trend score 60.9), meaning the category is still in repair mode, but the chart's compression near the 50W and category-relative strength of 10.9% signal that selective buying is occurring. MACD is bullish but flattening, and stochastic RSI is falling from overbought into neutral, the same technical handoff that awarded top marks elsewhere. INDA, the India-focused runner-up, collapsed to a 1.9 technical composite and 14.1 reasoned proof-order score because MACD is bearish/weakening, stochastic RSI is oversold, and category-relative strength is -3.1%; the 13-week return of -8.4% and SPY-relative deficit of -10.8% confirm that India-specific momentum has broken. IEMG's 5.6% thirteen-week return and 3.2% SPY-relative strength are modest but solid given the credit-stress headwinds.
Emerging Markets is entirely excluded from the portfolio this week, ranking 9th or 10th at 15.9 and representing the weakest category after Traditional Energy. The macro setup is actively hostile: credit stress (−10) and liquidity stress (−10) dominate the descriptor weighting, with only risk appetite positive (+8) providing marginal support. Category-level macro fit is 38.0, nearly 40 points below Technology's 60.0, signaling a genuine regime headwind specific to emerging-market risk. IEMG's technical evidence of 75.7 is respectable in isolation but paired with category macro fit of 40.0, it produces insufficient portfolio-level conviction. The 3/2/1 basket averages 48.7 composite before final adjustment, and credit/liquidity stress dominate over any positive EMs narrative. IEMG's 0.7% distance to the 50W is tactically ideal for entry, but the broader category suffers from a disinflation regime where developed-market monetary tightening spills over into EM vulnerability. Allocating zero reflects that emerging markets must first show stabilization in credit spreads and relative currency strength before rejoining the portfolio. This is a category to monitor for a bottom, not to own into the consolidation.
Traditional Energy — XLE
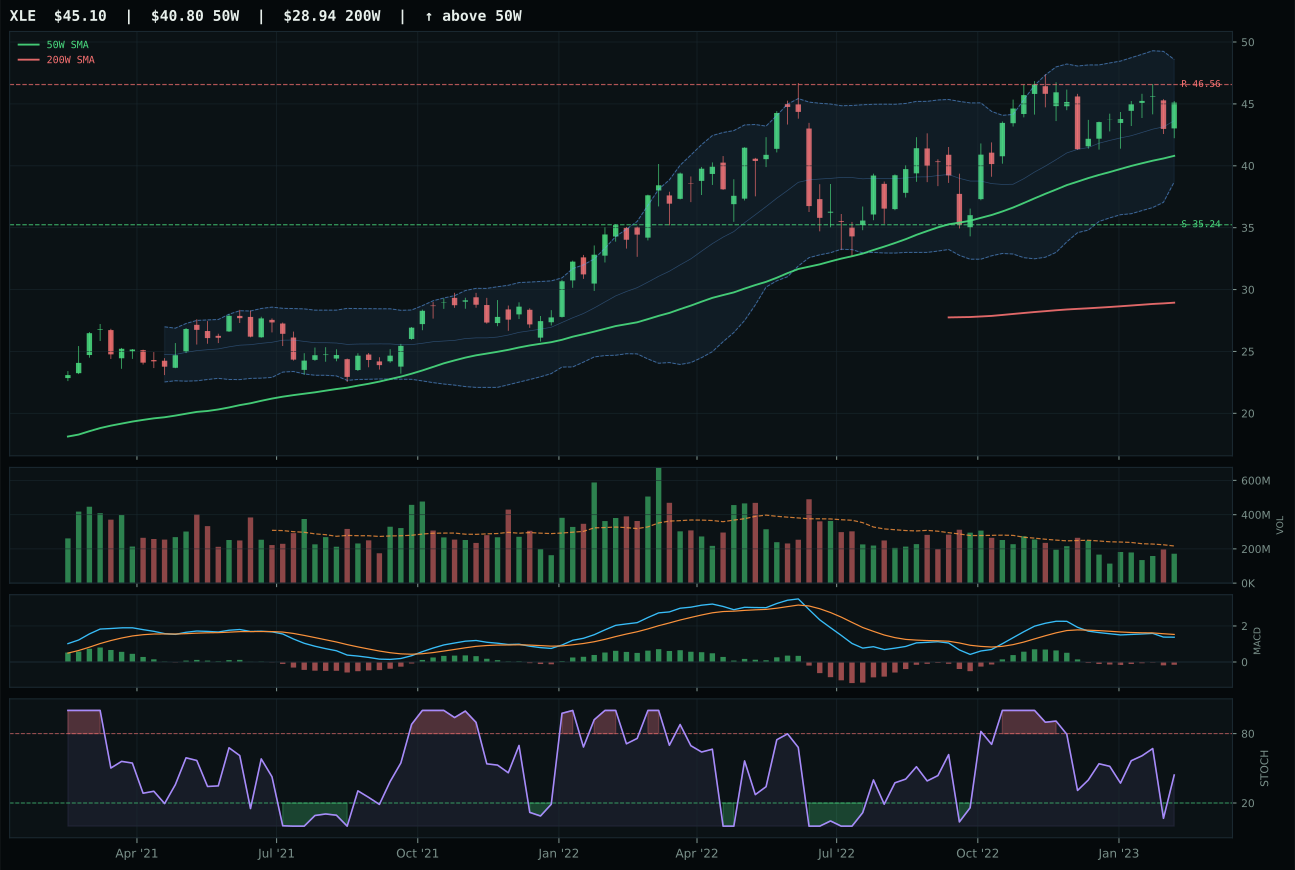
XLE has a neutral structure profile with -5.5% 13-week relative strength versus SPY.
A failed hold above support would weaken the setup.
Actionable but governed by invalidation levels.
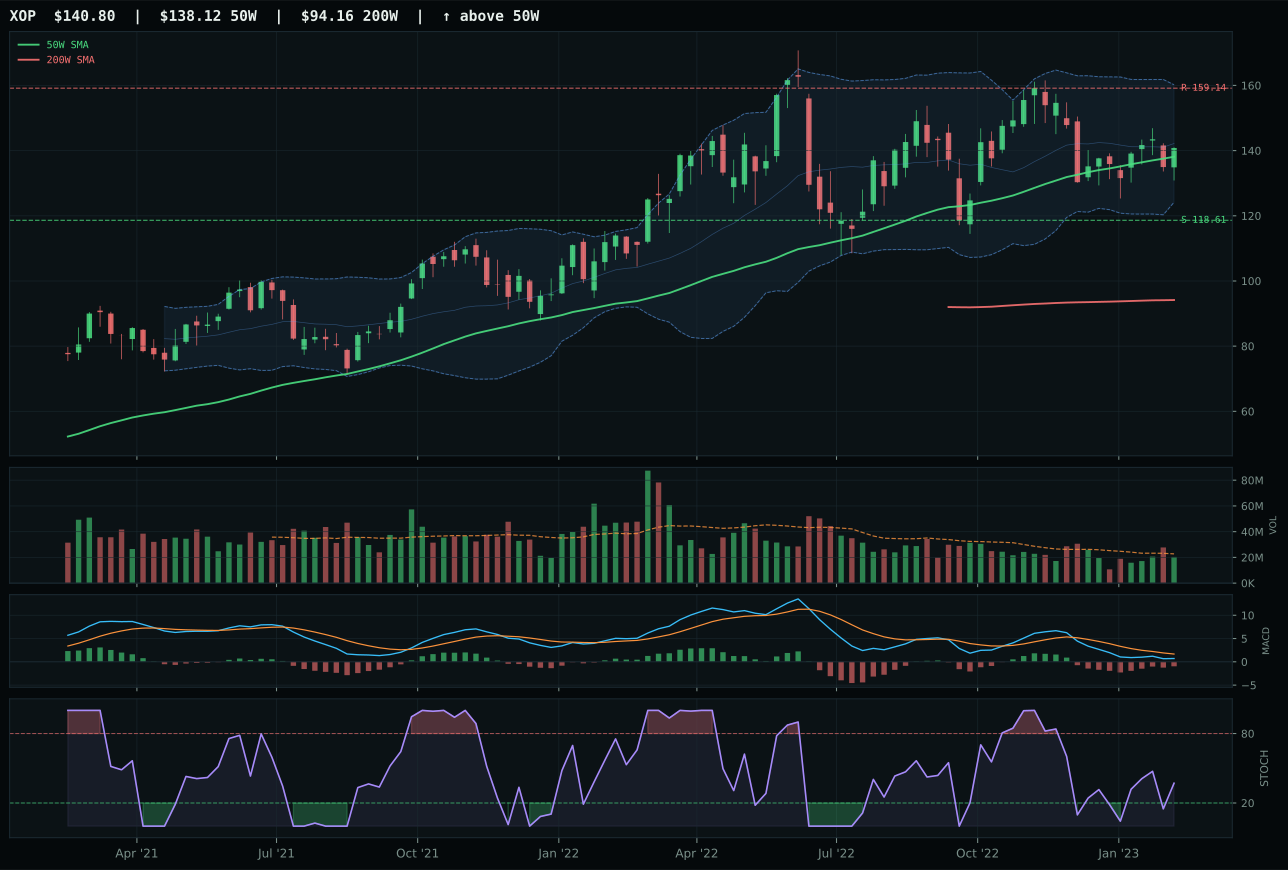
XOP has a compression near 50W profile with -13.9% 13-week relative strength versus SPY.
A failed hold above support would weaken the setup.
Actionable but governed by invalidation levels.
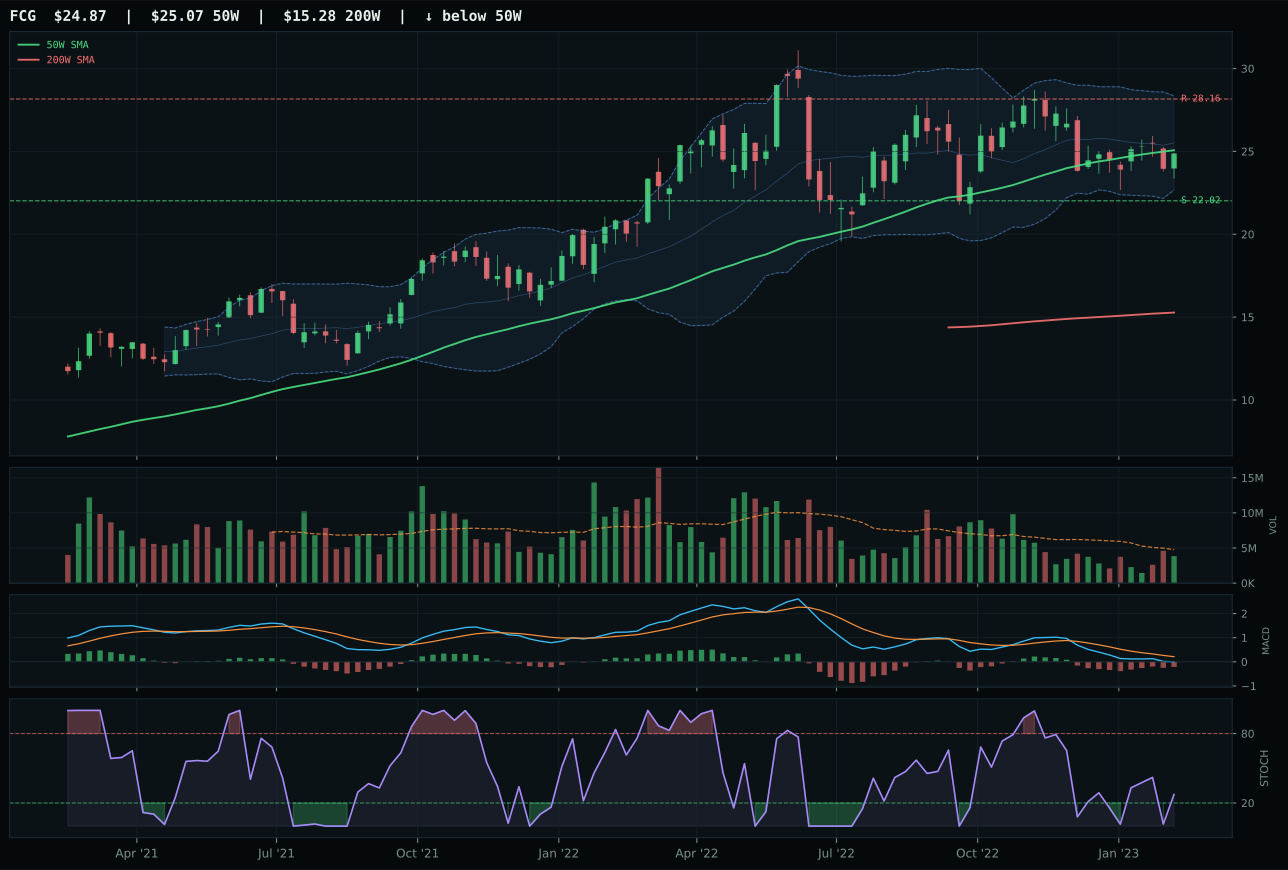
FCG has a compression near 50W profile with -14.1% 13-week relative strength versus SPY.
A failed hold above support would weaken the setup.
Actionable but governed by invalidation levels.
XLE scraped a 7.8 category score by virtue of being the least broken among three severely wounded candidates. The integrated energy ETF trades 10.5% above its 50-week moving average in upper retracement territory, a vulnerable valuation, yet its 73.7 trend score (price above both moving averages, slope not yet deteriorating) kept it ahead of XOP and FCG. The real damage is in the momentum and volume signals: thirteen-week return is -3.1%, SPY-relative return is -5.5%, and MACD is bearish/weakening, signaling that the recent rally off lows is losing sponsorship. Stochastic RSI is falling/neutral, and volume confirmation scored only 47.0, suggesting that any bounce in crude prices is being sold into, not accumulated. XOP lost on structure cleanliness (70.4 vs 77.3) and category-relative strength (0.0% vs 8.4% for XLE), a gap that reflects XLE's integrated cash-flow model attracting some flight-to-quality capital even as the sector rotates lower. This is not a category anyone wants to be in; XLE simply avoids the worst of the technical deterioration.
Traditional Energy is entirely excluded from the portfolio this week, ranking 9th or 10th with a category score of just 7.8. The disinflation macro regime actively destroys energy as an asset class: disinflation pressure carries −10 weighting, and real asset sponsorship (+7) cannot offset this headwind. The category-level macro fit is 23.0, the lowest in the portfolio by a wide margin, and technical evidence across the three-ETF basket averages only 44.4 composite. XLE's 44.4 technical evidence is inadequate support for allocation, and the MACD deterioration from bullish to bearish-weakening signals momentum loss. No descriptor tailwind exists in this regime: risk appetite positive applies to equities, not energy; commodity breadth positive affects metals and agriculture, not crude; metals scarcity and AI growth provide zero support. This is a category that is structurally out of favor in the current macro setup, and allocating even 5% would represent conviction that energy will mean-revert. Instead, zero allocation reflects that this category must show multiple improvements—MACD reversal, positive 13-week returns, and relative strength stabilization—before rejoining the portfolio.