
2023-02-03
Informational purposes only. The content in this report, including allocations, analysis, and commentary, is provided solely for informational and educational purposes. It does not constitute financial advice, investment advice, trading advice, or any other type of advice. Past performance does not guarantee future results. Always conduct your own research and consult a qualified financial professional before making investment decisions.
Weekly Allocation
| Ticker | Category | Weight | Role |
|---|---|---|---|
| IGV | Technology | 20% | Top-2 (20%) |
| SMH | AI | 20% | Top-2 (20%) |
| GLD | Precious Metals | 10% | Tier-2 (10%) |
| PAVE | Utilities & Infrastructure | 10% | Tier-2 (10%) |
| COPX | Industrial Metals | 10% | Tier-2 (10%) |
| XAR | Defense & Aerospace | 10% | Tier-2 (10%) |
| URNM | Nuclear Energy | 10% | Tier-2 (10%) |
| VEGI | Agriculture & Livestock | 10% | Tier-2 (10%) |
Trade Instructions — Monday Open
Sell the tranche from 2023-01-06 (completing its 4-week hold). Buy the new tranche. Instructions show net portfolio changes — same-asset positions cancel, weight changes show the delta.
| Action | Ticker | Instruction |
|---|---|---|
| SELL | GLD | Sell 12% of GLD position (reduce 20.00% → 17.50%) |
| SELL | XAR | Sell 25% of XAR position (reduce 10.00% → 7.50%) |
| SELL | IGF | Sell 50% of IGF position (reduce 5.00% → 2.50%) |
| SELL | WEAT | Sell entire WEAT position (2.50% of portfolio) |
| SELL | XLE | Sell 25% of XLE position (reduce 10.00% → 7.50%) |
| SELL | INDA | Sell entire INDA position (2.50% of portfolio) |
| BUY | VEGI | Buy VEGI — 16.67% of freed cash (adds 2.50% to portfolio) |
| BUY | SMH | Buy SMH — 33.33% of freed cash (adds 5.00% to portfolio) |
| BUY | PAVE | Buy PAVE — 16.67% of freed cash (adds 2.50% to portfolio) |
| BUY | IGV | Buy IGV — 33.33% of freed cash (adds 5.00% to portfolio) |
Current Portfolio After Trade
Combined holdings across all 4 active tranches. Each tranche is 25% of the portfolio.
| Ticker | % of Portfolio | Weight Bar |
|---|---|---|
| GLD | 17.50% | |
| COPX | 12.50% | |
| URNM | 10.00% | |
| VEGI | 10.00% | |
| SMH | 10.00% | |
| XAR | 7.50% | |
| XLE | 7.50% | |
| PAVE | 7.50% | |
| REMX | 5.00% | |
| IGV | 5.00% | |
| IGF | 2.50% | |
| XLK | 2.50% | |
| IEMG | 2.50% |
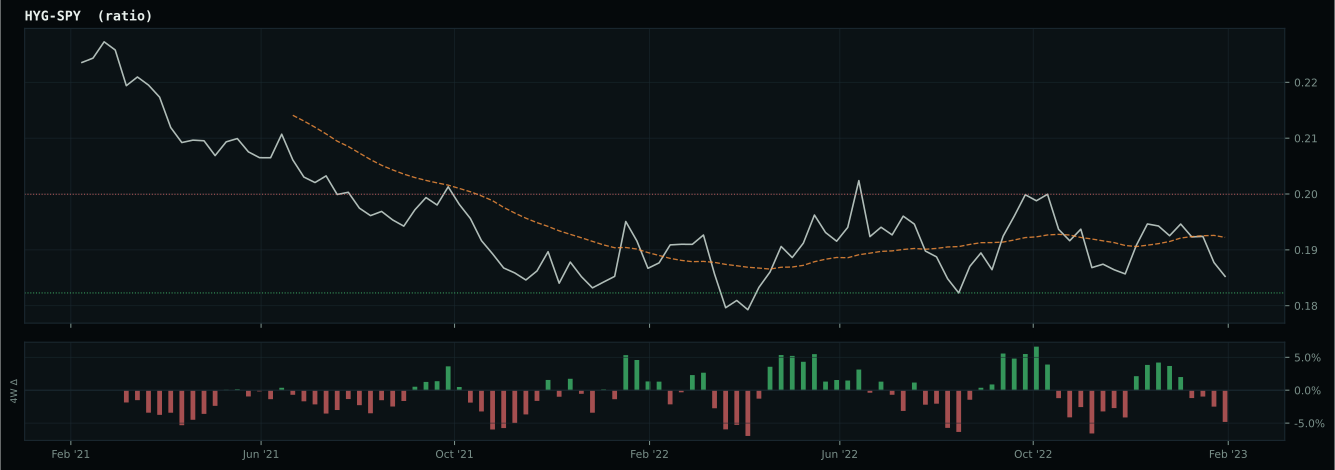
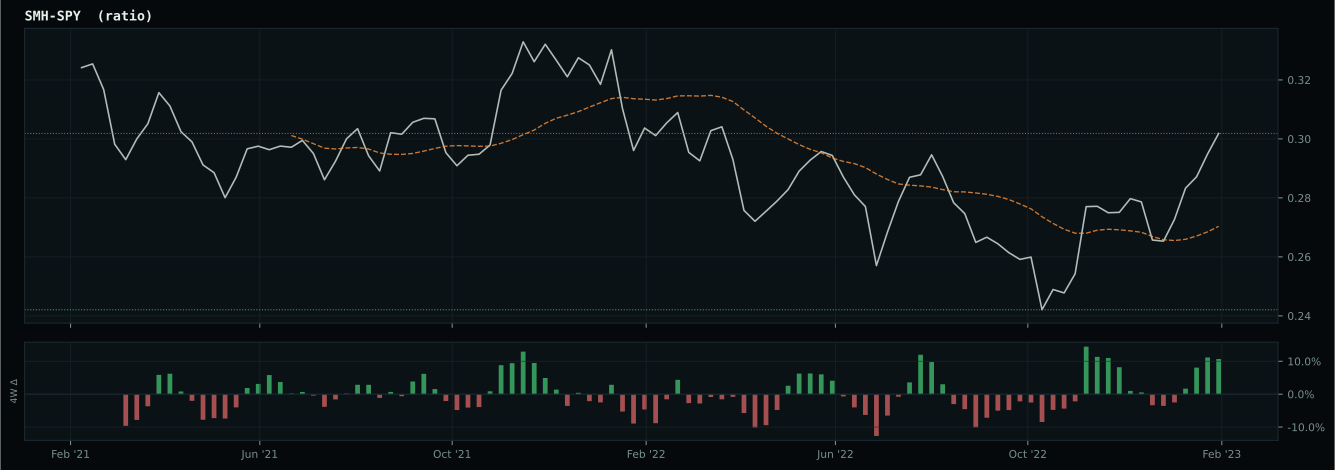
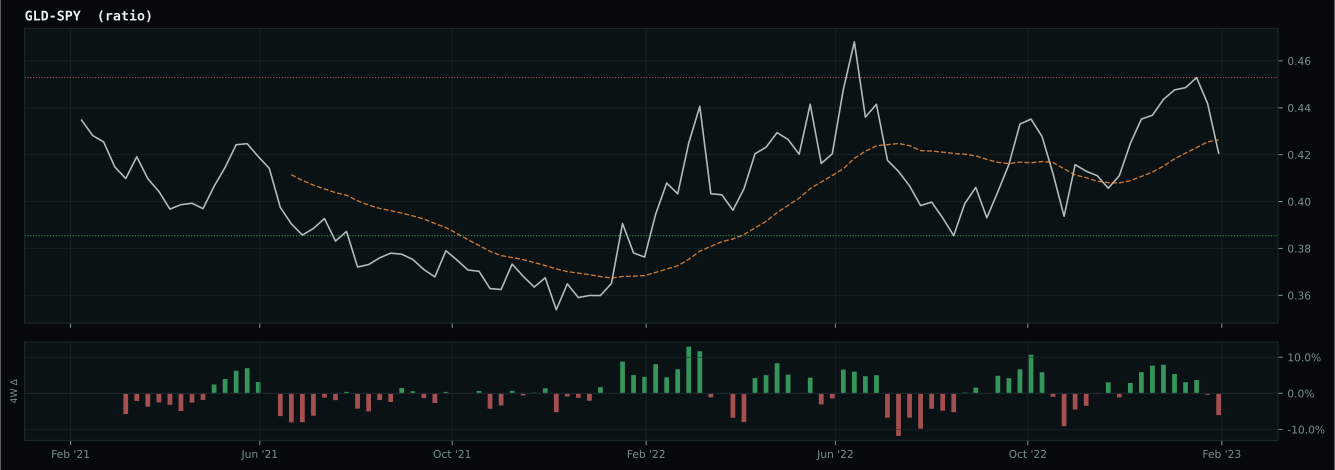
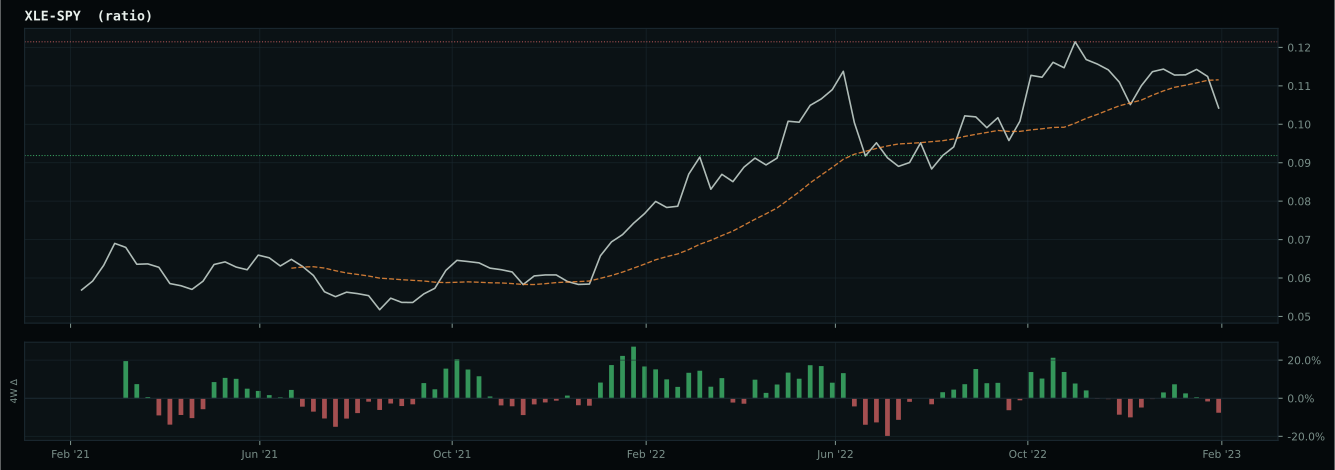
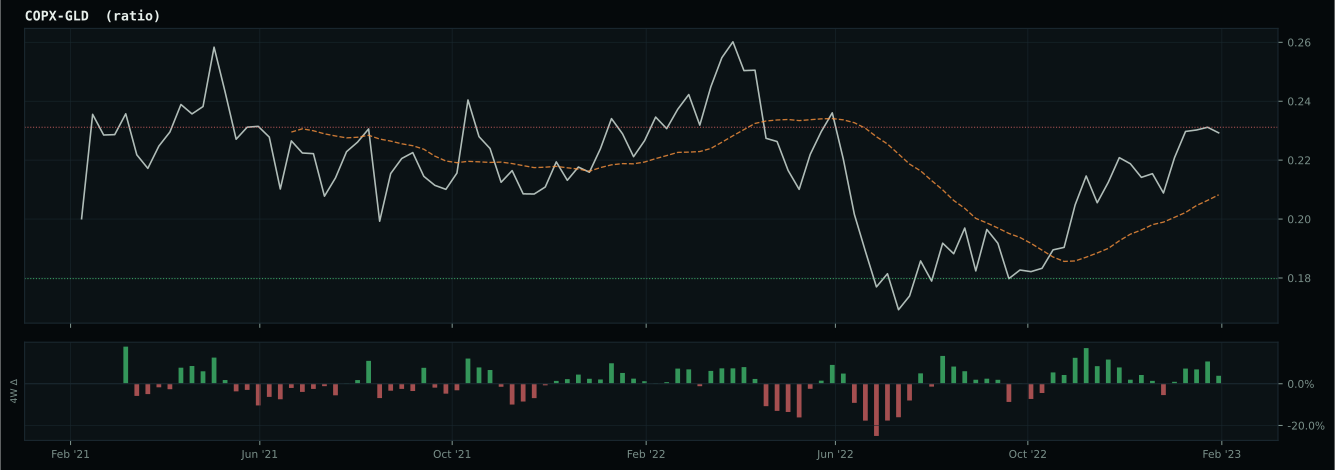
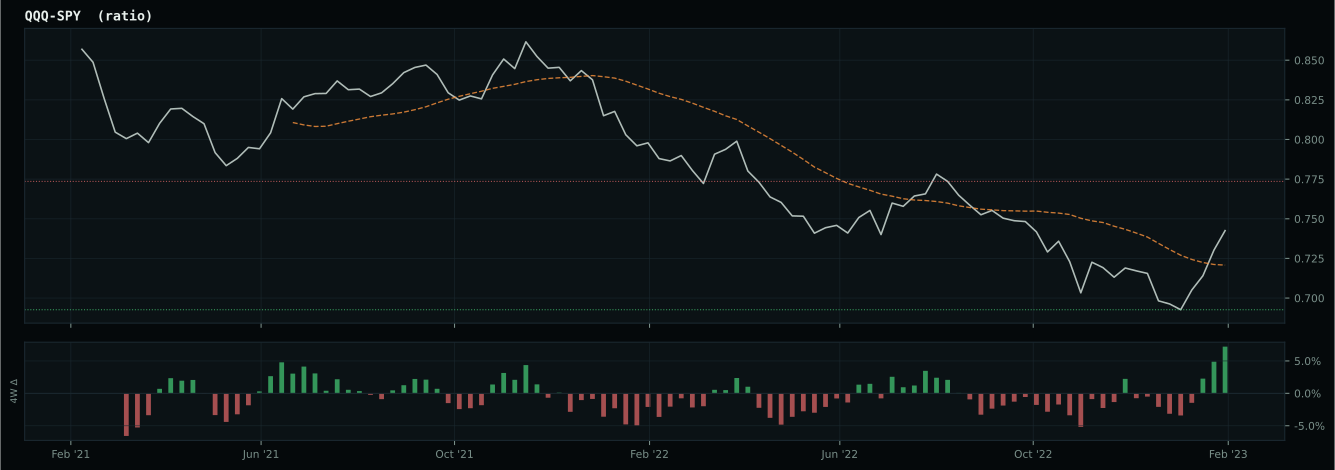
Macro Regime — Disinflation
Macro Evidence Charts
Market-implied signals behind the macro regime scores. Each ratio compares two assets; the direction and slope of the ratio is what the macro engine reads.
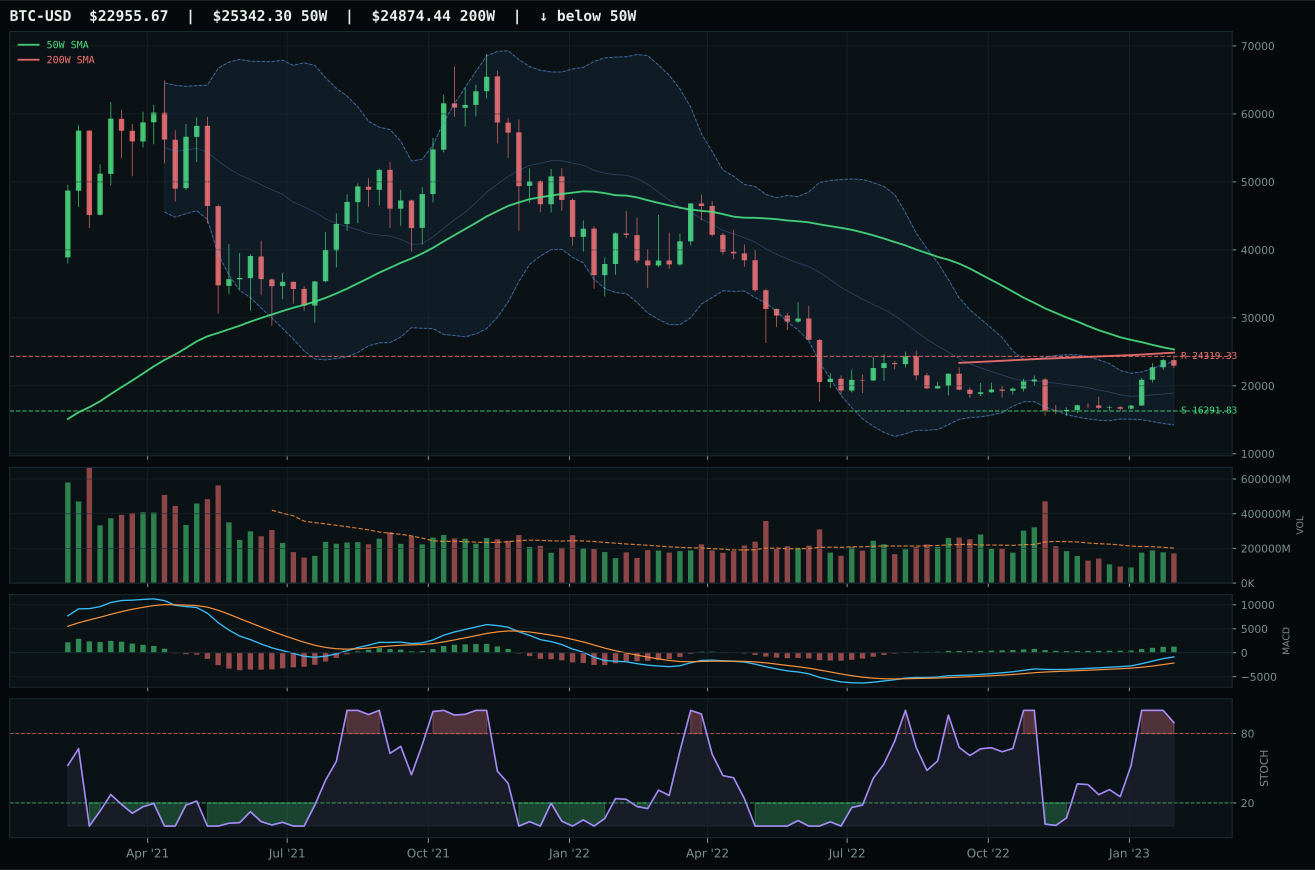
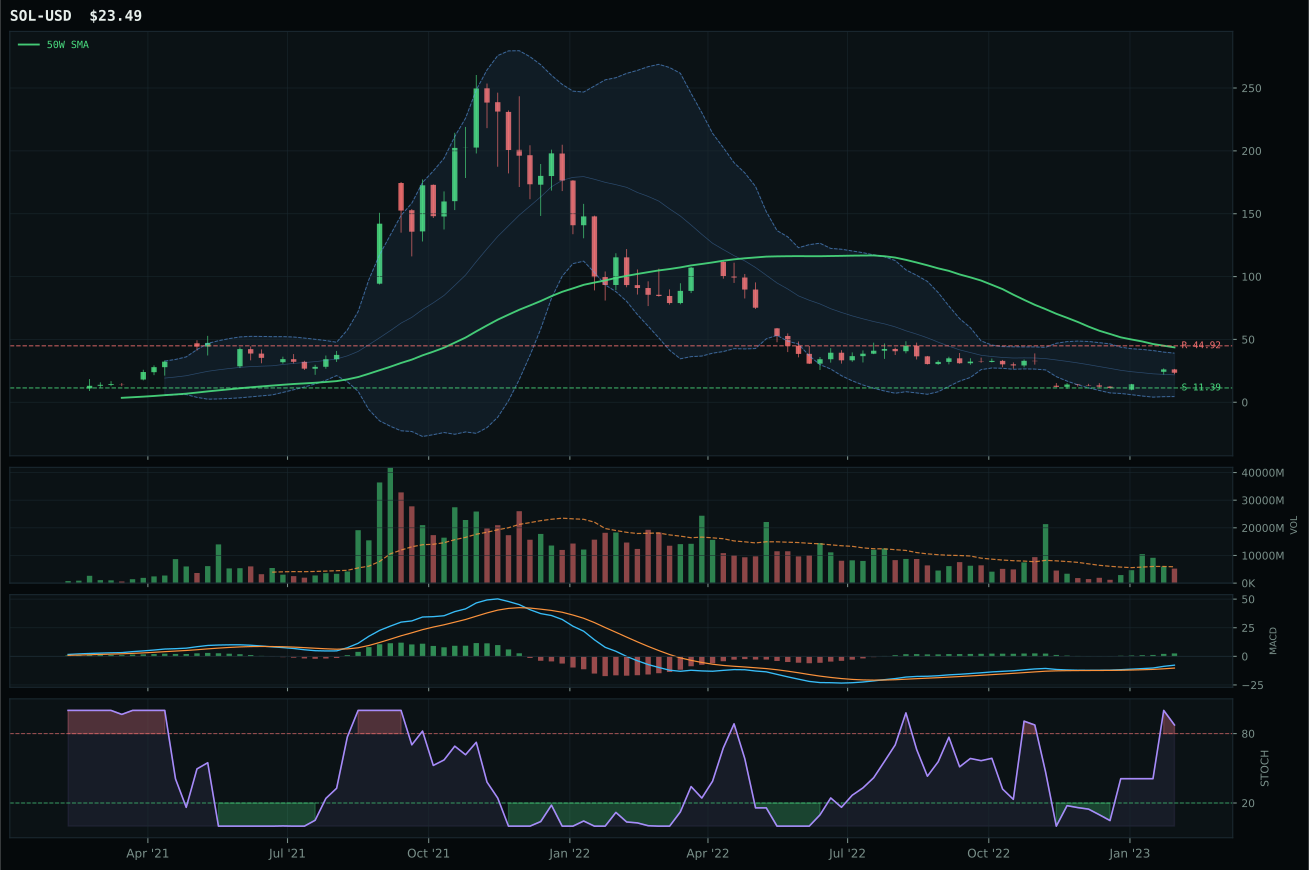
Crypto Regime — NoCrypto
ValueBTC armed; waiting for 50W reclaim, decisive close above post-touch range resistance by 3%, close above 200W, breakout volume above 20W…
TrendBTC not confirmed
one or more available conditions failed
Category Rankings
| Rank | Category | Winner | Score | Alloc | 4W Ret | Peers (4W) |
|---|---|---|---|---|---|---|
| 1 | Technology | IGV | 70.7 | 20% | +1.75% | XLK +0.6% · CIBR +3.2% |
| 2 | AI | SMH | 68.6 | 20% | +0.28% | BOTZ +1.7% · AIQ -1.5% |
| 3 | Precious Metals | GLD | 66.2 | 10% | -1.03% | GDX -6.3% · SLV -5.3% |
| 4 | Utilities & Infrastructure | PAVE | 64.8 | 10% | +2.20% | IGF -0.4% · XLU -2.0% |
| 5 | Industrial Metals | COPX | 54.1 | 10% | +0.94% | PICK -0.3% · REMX -6.1% |
| 6 | Defense & Aerospace | XAR | 50.3 | 10% | +2.31% | ITA +3.8% · ROKT -0.0% |
| 7 | Nuclear Energy | URNM | 45.8 | 10% | -2.87% | URA -2.6% · NLR -0.9% |
| 8 | Agriculture & Livestock | VEGI | 31.4 | 10% | +2.79% | MOO +0.9% · WEAT -8.2% |
| 9 | Emerging Markets | IEMG | 7.9 | 0% | -1.21% | ILF +0.5% · INDA +0.7% |
| 10 | Traditional Energy | XLE | 4.9 | 0% | +0.86% | XOP +3.7% · FCG +1.4% |
Technology — IGV
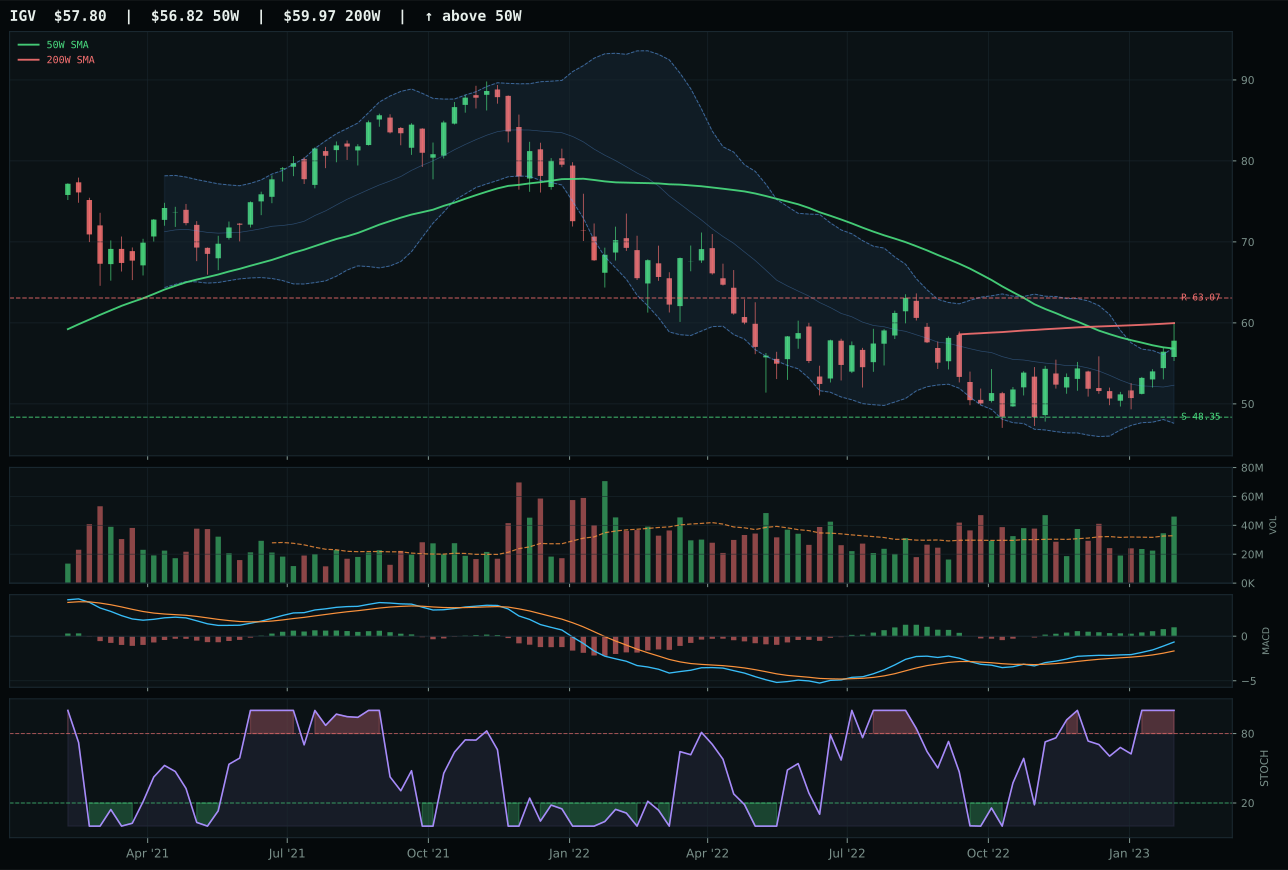
IGV has a compression near 50W profile with 10.0% 13-week relative strength versus SPY.
A failed hold above support would weaken the setup.
Actionable but governed by invalidation levels.
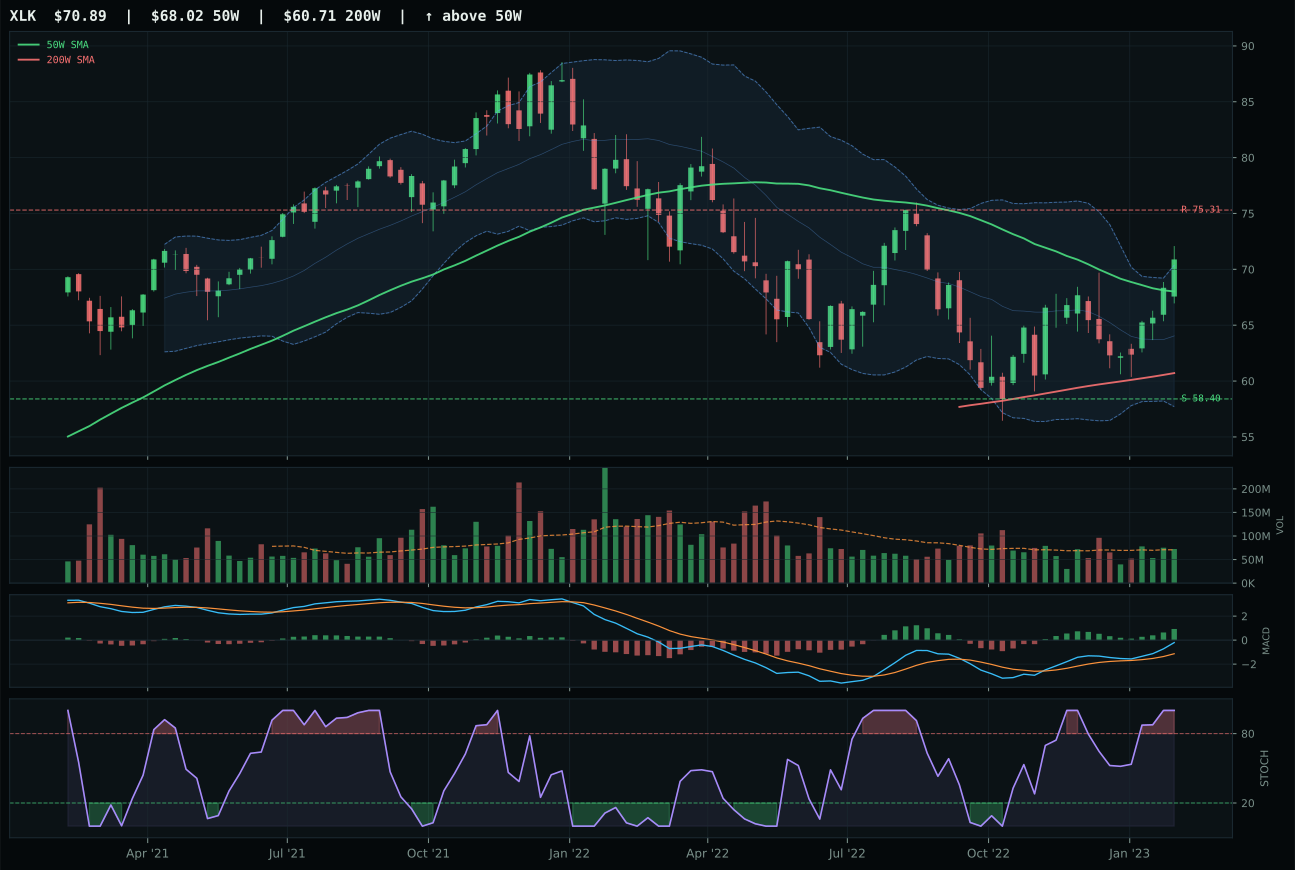
XLK has a neutral structure profile with 7.6% 13-week relative strength versus SPY.
A failed hold above support would weaken the setup.
Actionable but governed by invalidation levels.
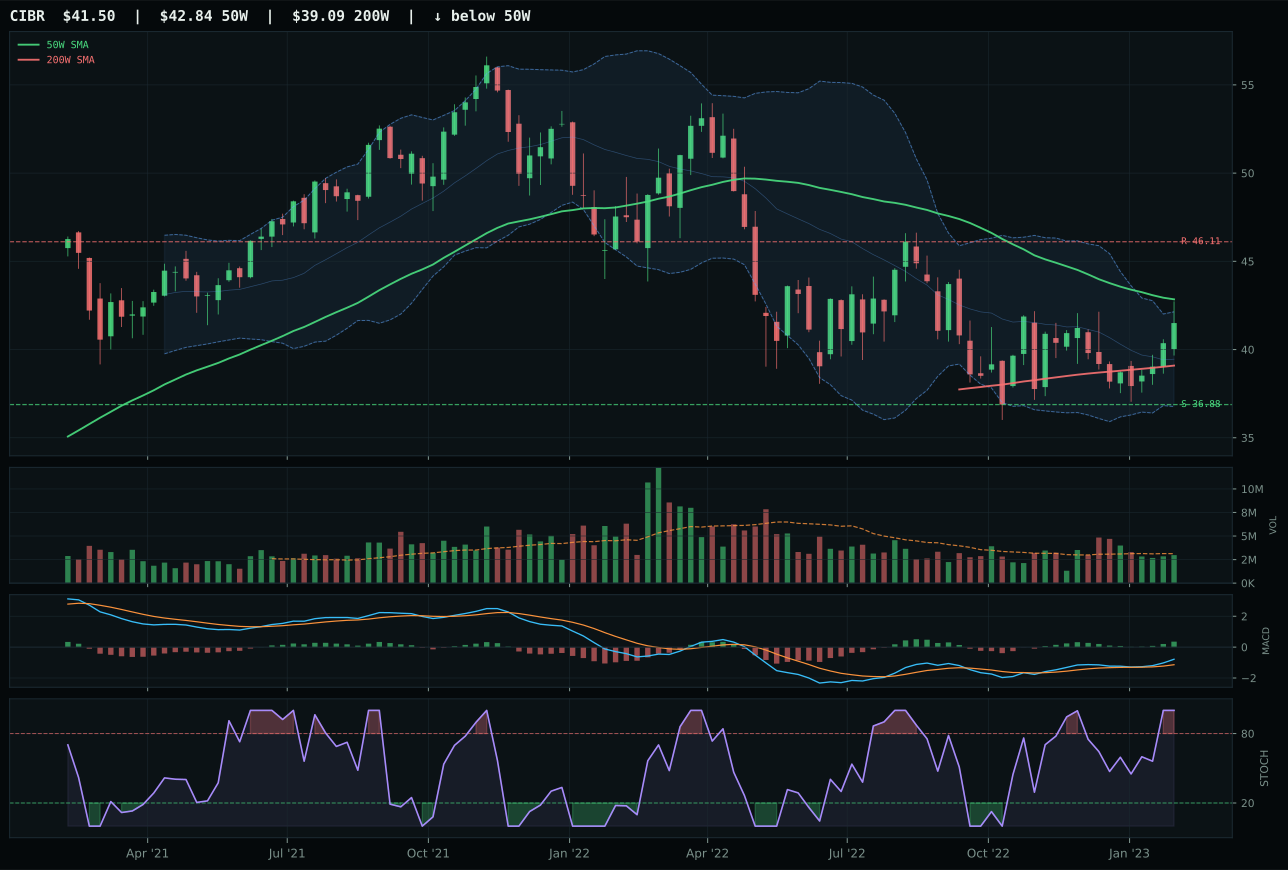
CIBR has a neutral structure profile with 0.3% 13-week relative strength versus SPY.
A failed hold above support would weaken the setup.
Actionable but governed by invalidation levels.
IGV seized the category lead because its 2.4% outperformance versus the basket median—paired with above-average volume participation at 1.40x the 20-week average—demonstrates institutional accumulation rather than retail rebound. The setup is architecturally tight: price sits 1.7% from the 50-week moving average with a -0.3% slope, MACD bullish and improving, and stochastic RSI at overbought extremes, all of which form a compression-into-expansion coil ready to break higher if support holds at 48.35. XLK lost ground on three technical fronts: category-relative strength of 0.0% (versus IGV's 2.4%) signaled peer abandonment; timing scored 97 points compared to IGV's clean 100 because stochastic RSI is overbought but there's no fresh momentum divergence; and volume confirmation was neutral rather than above-average, meaning the move lacked the sponsorship IGV displayed. The 1.9-point score gap reflects a category decision made on quality of participation, not just price position.
Technology earned its top-2 seat (20% allocation) because the 70.7 category score ranked second overall and reflected both superior technical evidence (94.3 composite across all three ETFs) and macro tailwinds that justified full position weight in a disinflation regime. Disinflation pressure (+7) and risk appetite positive (+9) are active descriptors that align software and semiconductor valuations upward when real rates compress and credit stress remains contained at -9 impact. The category's timing is neither extended nor early; price-to-moving-average relationships suggest the next leg of upside is not yet priced in, and volume patterns show accumulation rather than climax buying. Against the constraint that only two categories can hold 20%, Technology ranked ahead of eight peers on deterministic scoring, making this allocation neither aggressive nor complacent—it reflects where the current technical and macro intersection is strongest.
AI — SMH
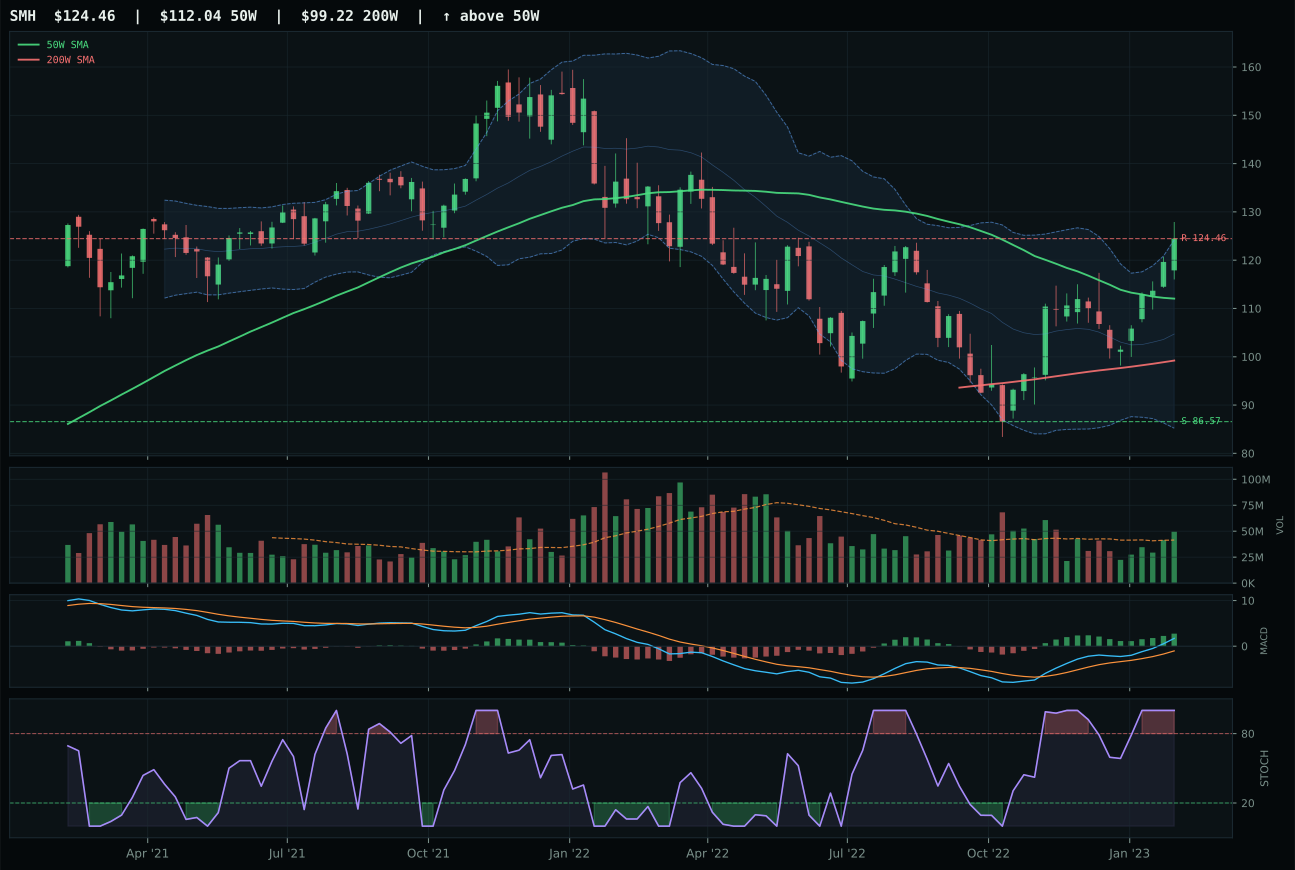
SMH has a neutral structure profile with 20.5% 13-week relative strength versus SPY.
A failed hold above support would weaken the setup.
Actionable but governed by invalidation levels.
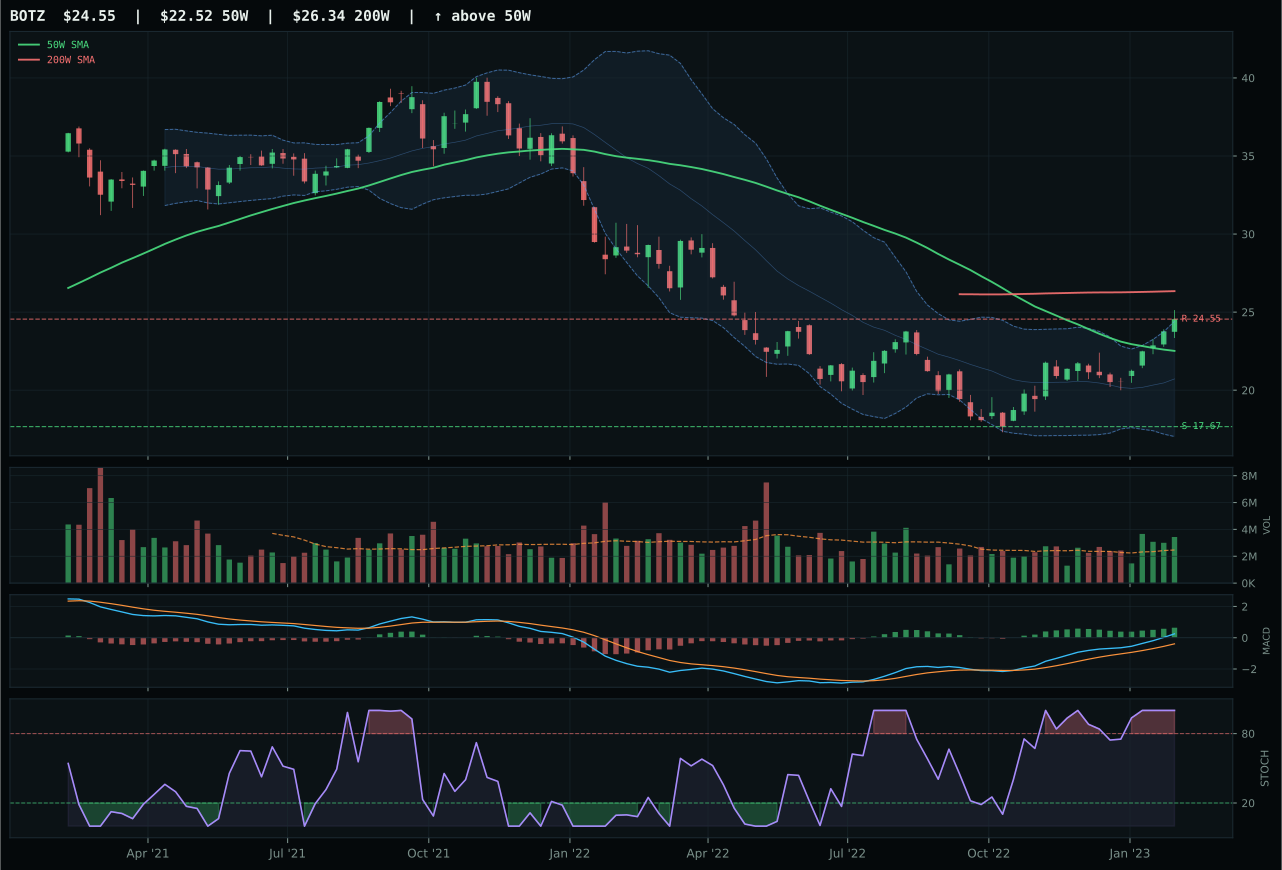
BOTZ has a neutral structure profile with 16.8% 13-week relative strength versus SPY.
A failed hold above support would weaken the setup.
Actionable but governed by invalidation levels.
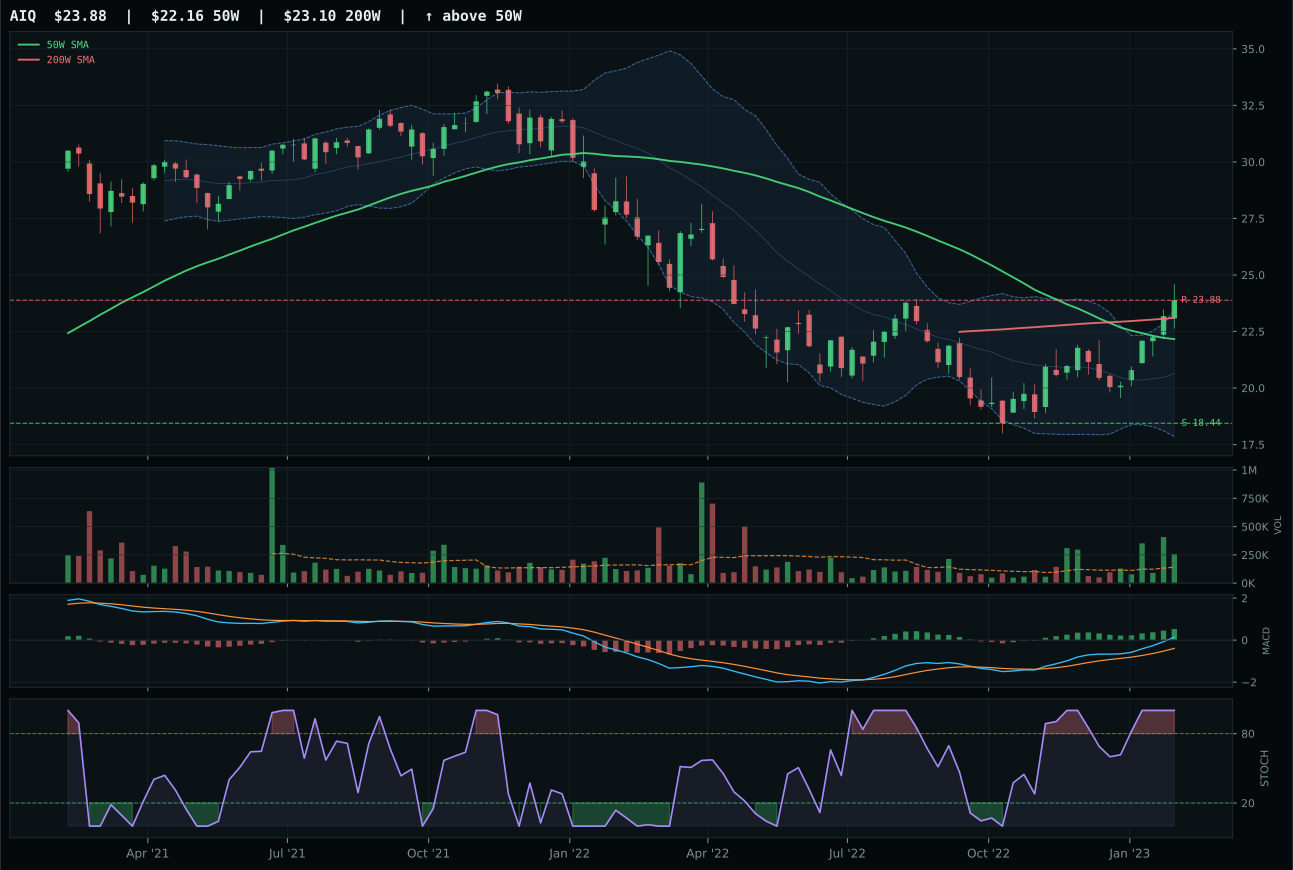
AIQ has a neutral structure profile with 16.5% 13-week relative strength versus SPY.
A failed hold above support would weaken the setup.
Tracked, but not top-2 eligible because: .
SMH dominated the AI category with a 20.5% relative-strength advantage over SPY, a 13-week return of 30.1%, and category-relative outperformance of 3.7%—metrics that spell sustained institutional demand in compute and semiconductor leadership. Price sits 11.1% above the 50-week average in a neutral-structure setup, meaning the move is extended but MACD remains bullish, stochastic RSI is overbought, and volume at 1.19x participates at above-average levels, confirming that late buyers are still willing. BOTZ trailed by 3.2 points because its 0.0% category-relative strength was exactly market pace—it moved with the basket rather than leading within it—and its 16.8% SPY-relative return, while strong, sat below SMH's pull. The decisive factor was peer selection: in momentum environments, the ETF that leads its own three-stock universe typically has deeper demand and lower risk of cascade selling on reversal.
AI qualified as the second 20% allocation because its 68.6 category score ranked alongside Technology as one of two strongest setups across all 10 categories, and because the macro regime is unusually supportive of growth assets despite disinflation's overall headwinds. AI growth sponsorship is a +14 active descriptor—the single largest positive macro input in the system—and risk appetite positive at +10 creates conditions where even extended momentum is justified if volume is confirming (which it is at 84.4 composite across all three ETFs). The category does face tension: price-to-resistance is flat (0.0% upside) and downside to support is 43.8%, meaning risk asymmetry has inverted sharply. Holding this at 20% is a bet that AI demand cycles through multiple legs and that SMH's institutional accumulation patterns persist despite technical exhaustion. If momentum breaks or volume turns cold, allocation should drop to 10% immediately.
Precious Metals — GLD
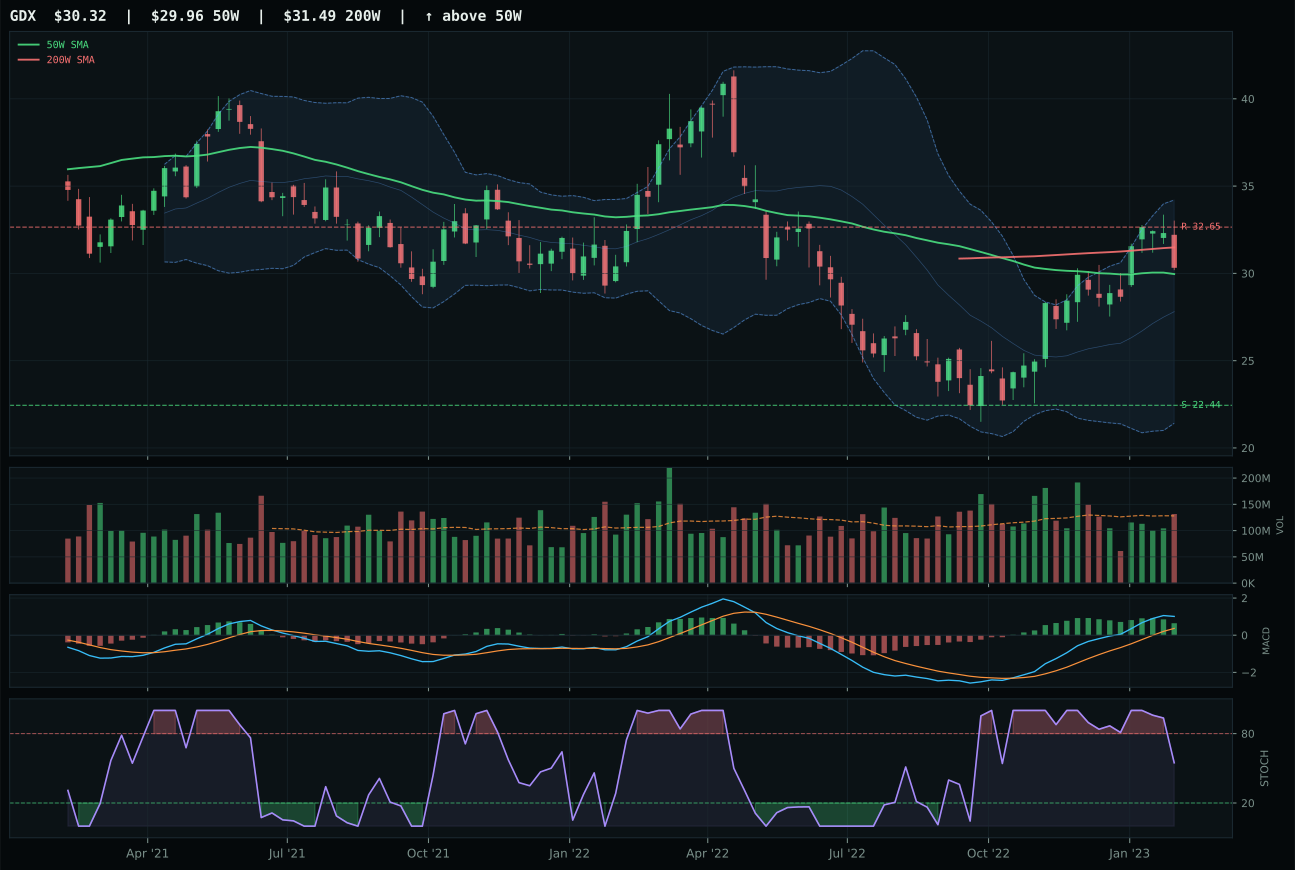
GDX has a compression near 50W profile with 12.0% 13-week relative strength versus SPY.
A failed hold above support would weaken the setup.
Actionable but governed by invalidation levels.
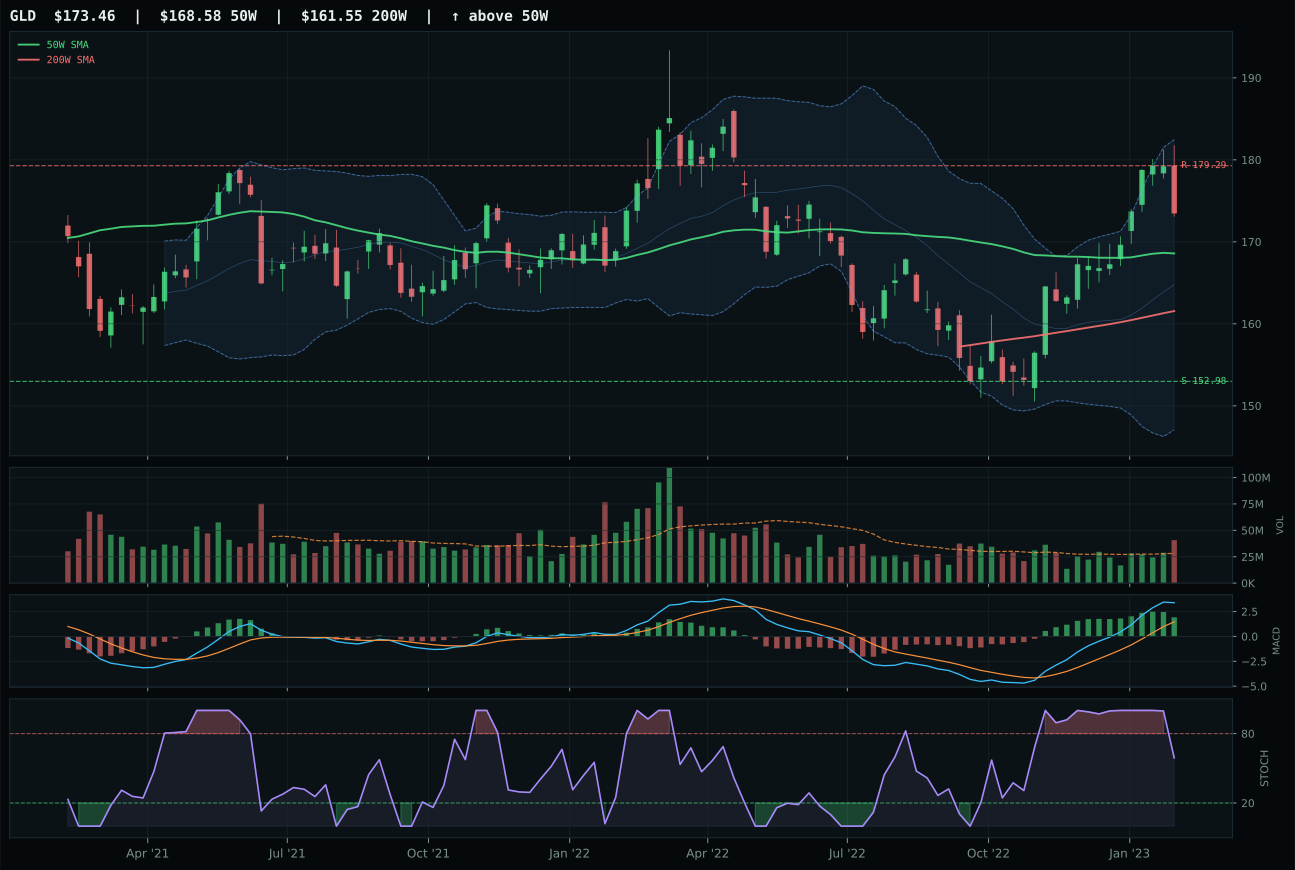
GLD has a compression near 50W profile with 1.3% 13-week relative strength versus SPY.
A failed hold above support would weaken the setup.
Actionable but governed by invalidation levels.
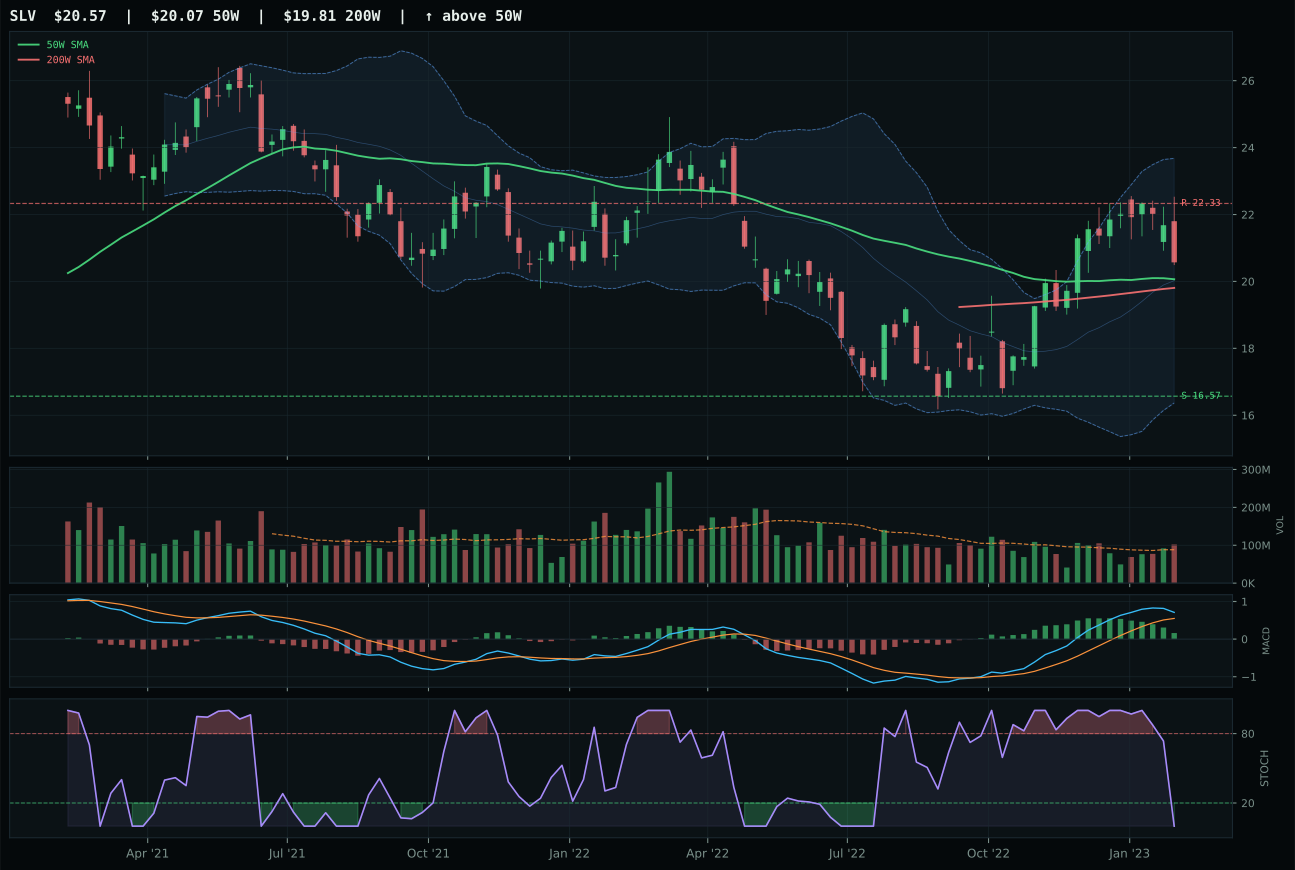
SLV has a compression near 50W profile with -2.8% 13-week relative strength versus SPY.
A failed hold above support would weaken the setup.
Actionable but governed by invalidation levels.
GLD claimed the category by combining the cleanest structural setup with above-average volume and a timing score of 100—a rare combination in compressed momentum environments. Price is 2.9% above the 50-week moving average, MACD is bullish but flattening (not improving, which makes GLD's edge less obvious), stochastic RSI falls at 0.59 (falling/neutral, not overbought), and volume participation at 1.45x is above average but not accumulation-level, yet the Fibonacci zone at 0.500 (decision point) and compression at support 152.98 create ideal risk entry conditions. The 87.9 trend score and 78.2 structure score form the technical backbone, with the 10.9% 13-week return providing proof of steady accumulation. GDX lost on three specific counts: timing at 95 versus GLD's 100 (stochastic is falling/neutral, which GLD also has, but GDX sits deeper in upper momentum zone making reversal more likely); risk/reward at 48.7 versus GLD's 57.4 (GDX upside is -12.4% to resistance and downside to support 44.6%—terrible asymmetry); and volume at neutral versus GLD's above-average participation, showing miners lack sponsorship even as gold consolidates. The 4.3-point gap reflects GLD's superior entry mechanics despite both holding identical MACD profiles.
Precious Metals earned 10% allocation despite a 66.2 category score that ranked third overall, because disinflation pressure (+8) is the portfolio's strongest macro tailwind and GLD's technical setup offers pure volatility hedge without drawdown risk at current valuations. Category macro fit is 60.0, meaning it's above-neutral: disinflation helps gold prices by compressing real yields, and risk appetite positive (-4 impact on gold) is weaker than the disinflation boost. GLD's compressed timing (price near 50W, support nearby) means downside risk is defined at 13.4% and upside is available if inflation surprises or credit stress accelerates, making this a true hedge position that doesn't require macro confirmation to hold. The 10% weighting reflects that metals are useful but not dominant in disinflation scenarios—they're insurance, not the main trade. If category score rises above 70, expand to 15%; if liquidity stress deepens below -10, GLD becomes a 20% core position.
Utilities & Infrastructure — PAVE
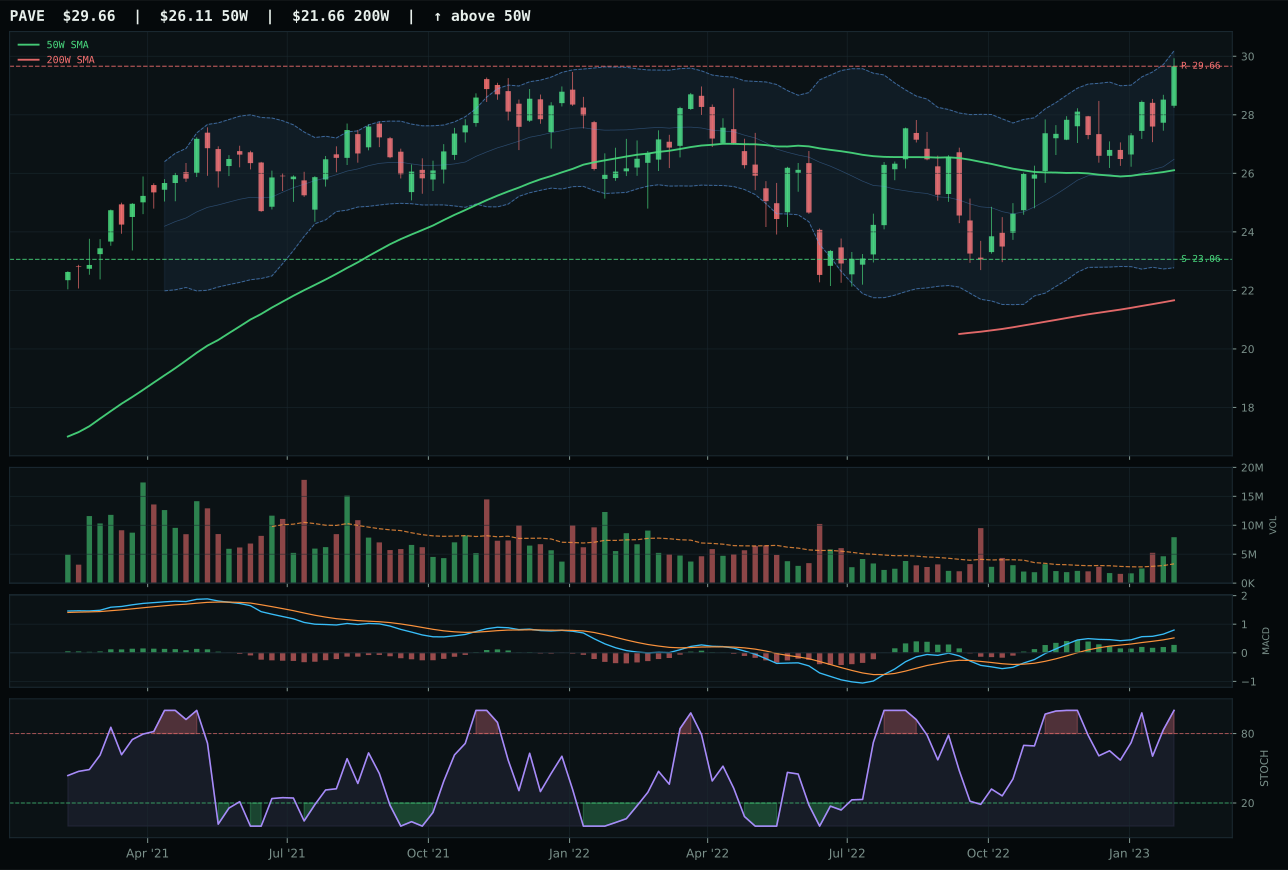
PAVE has a neutral structure profile with 4.7% 13-week relative strength versus SPY.
A failed hold above support would weaken the setup.
Actionable but governed by invalidation levels.
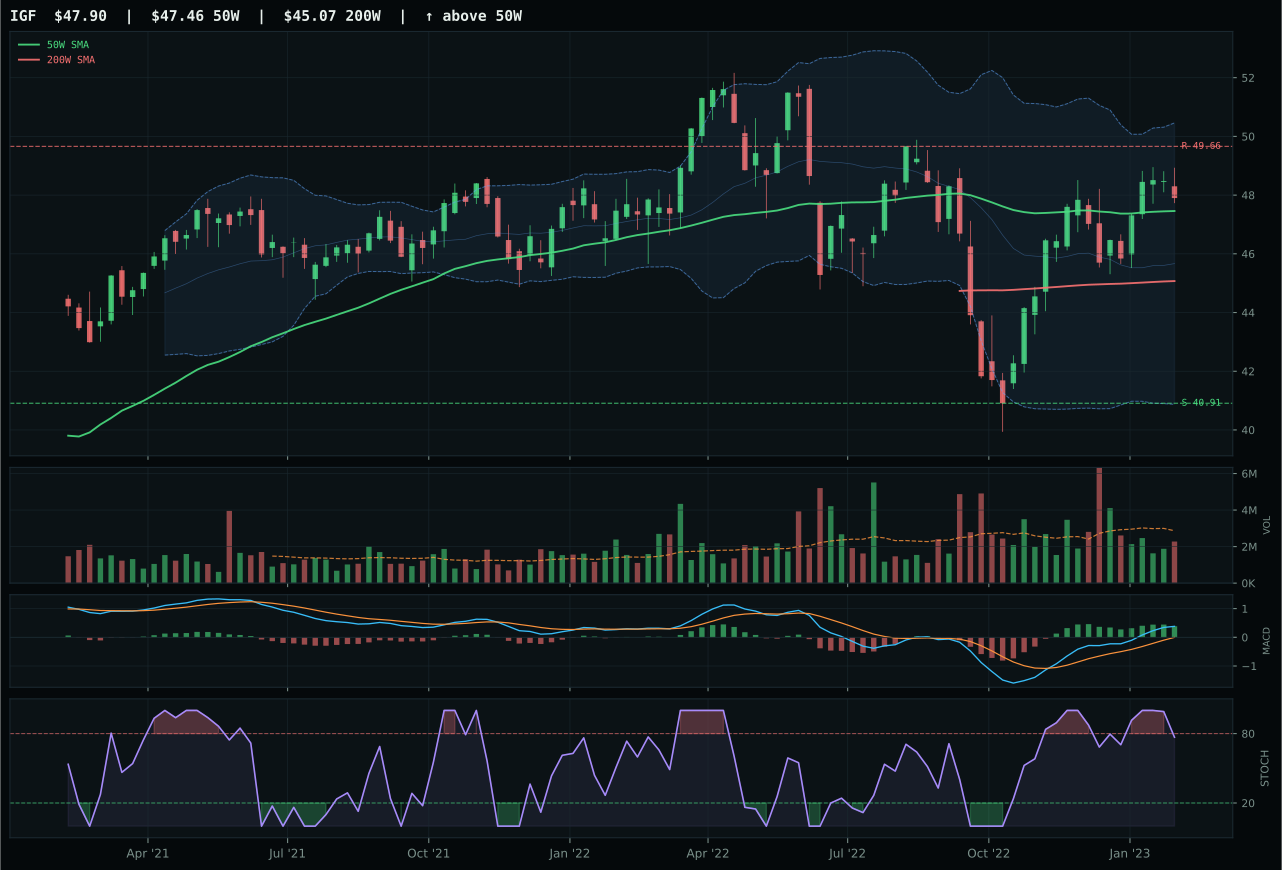
IGF has a compression near 50W profile with -2.0% 13-week relative strength versus SPY.
A failed hold above support would weaken the setup.
Actionable but governed by invalidation levels.
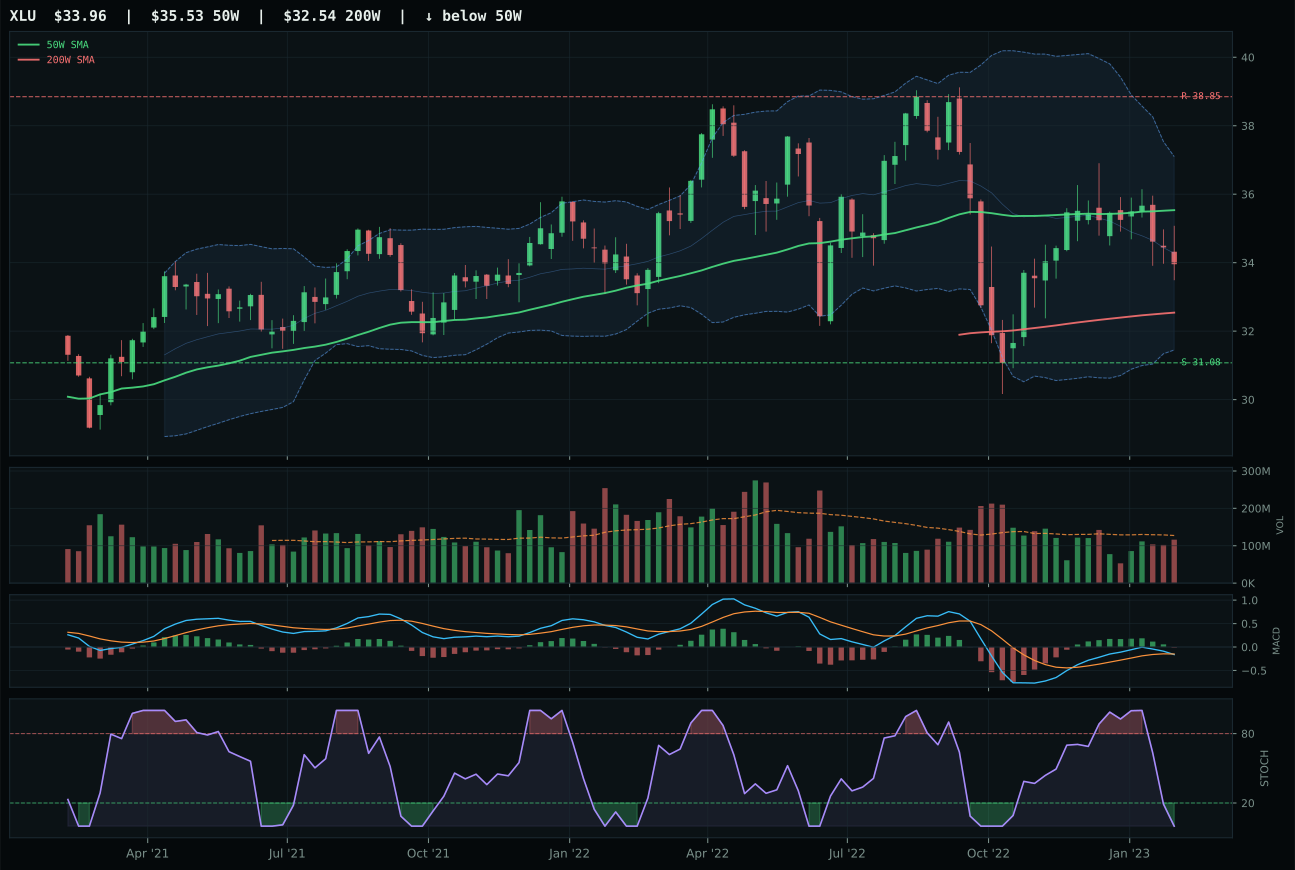
XLU has a neutral structure profile with -8.3% 13-week relative strength versus SPY.
A failed hold above support would weaken the setup.
Actionable but governed by invalidation levels.
PAVE seized the utilities & infrastructure lead by combining perfect trend execution (price above both 50W and 200W, RS vs SPY 4.7%, 50W slope 0.2%) with dominant volume-price confirmation—an exceptional 96.9 composite showing institutional accumulation at scale with 2.39x average volume participation and distribution pressure at zero. Stochastic RSI sits overbought at 1.00 and MACD is bullish and improving, indicating momentum is not yet exhausted despite 13.6% distance to 50W and position near Fib 0.236 (extension zone). The 14.3% 13-week return and 6.7% category-relative strength demonstrate PAVE is lapping peers, and the combination of perfect trend + perfect volume creates the cleanest setup in the entire utilities category. IGF lost by 1.0 point on structure (72.6 vs PAVE's 80.1) and volume (neutral vs accumulation/confirmation at 2.39x), meaning while IGF's trend is marginally better (97 vs PAVE's 100), its lack of volume sponsorship signals passive following rather than active accumulation. In crowded infrastructure cycles, the ETF with best volume confirmation typically leads through multiple legs.
Utilities & Infrastructure earned 10% allocation because the 64.8 category score ranked fourth overall and because disinflation's +7 impact creates powerful tailwinds for defensive, yield-bearing infrastructure assets in a lower-rate environment. Category macro fit is strong at 62.0, with disinflation pressure (+6) and transition/mixed (+4) creating regime support, offset only by liquidity stress (-3). PAVE's exceptional 100 technical evidence score and 2.39x accumulation volume reflect institutional positioning into a sector positioned to benefit from fiscal spending and rate compression. However, timing score is weak at 59 (price at extension near 52W high, Fib 0.236), meaning downside risk to support at 23.06 is 28.6%—a significant drawdown potential despite upside being zero. This 10% position is a high-conviction macro trade backed by excellent technicals but requires acknowledgment of extension risk: if rate volatility spikes or credit stress accelerates, sell half immediately. If PAVE stabilizes above 28 support and volume remains accumulative, expand to 15%; this is a tactical hold, not a buy-and-hold.
Industrial Metals — COPX
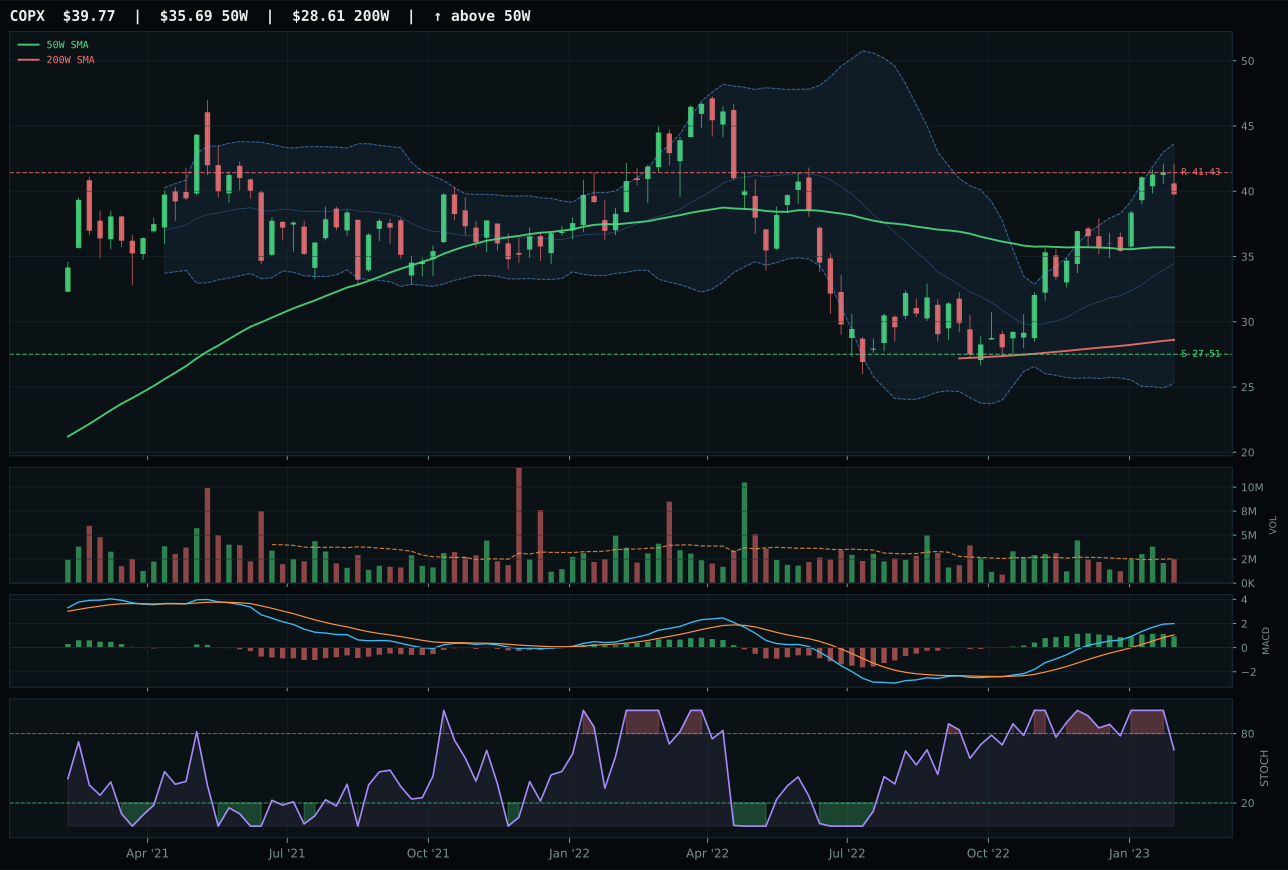
COPX has a neutral structure profile with 14.5% 13-week relative strength versus SPY.
A failed hold above support would weaken the setup.
Actionable but governed by invalidation levels.
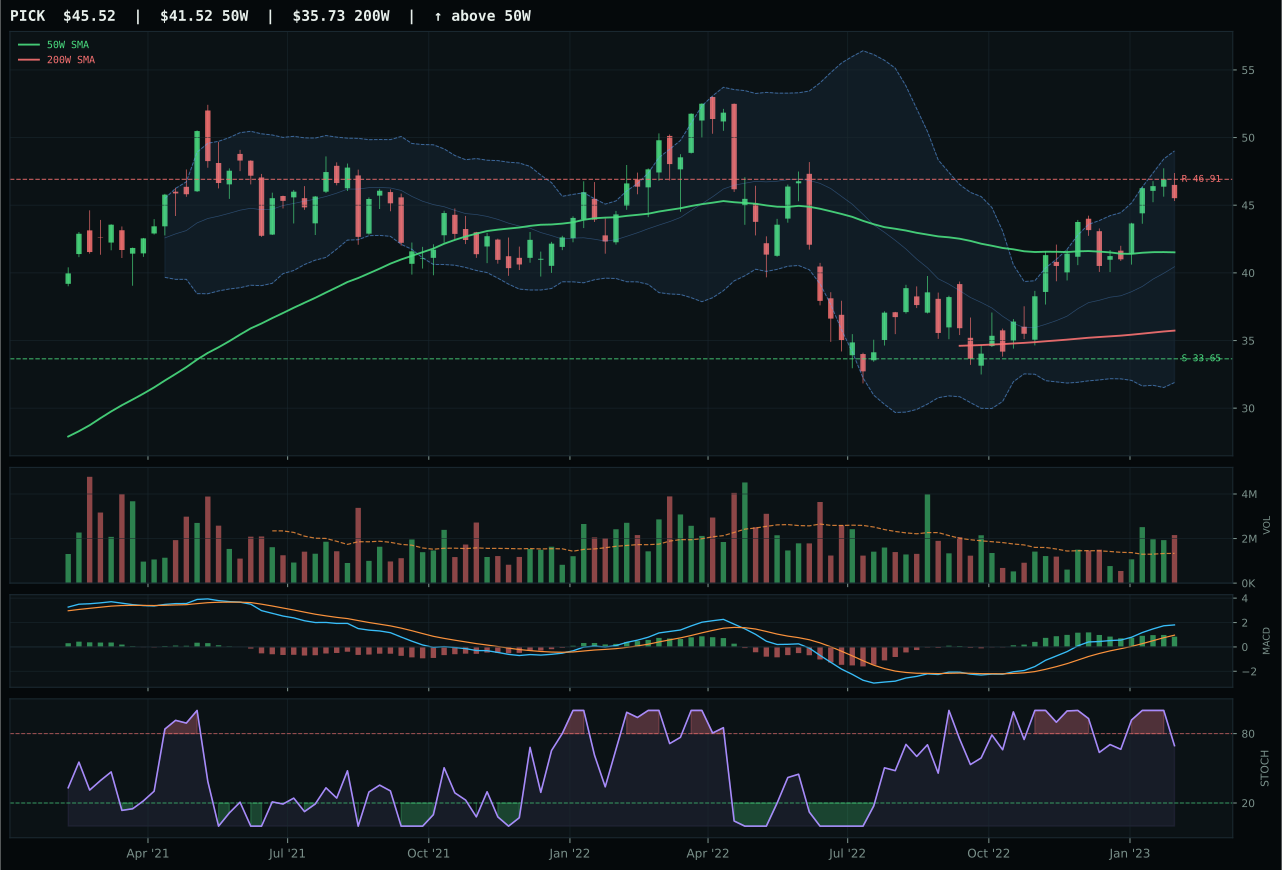
PICK has a neutral structure profile with 9.4% 13-week relative strength versus SPY.
A failed hold above support would weaken the setup.
Actionable but governed by invalidation levels.
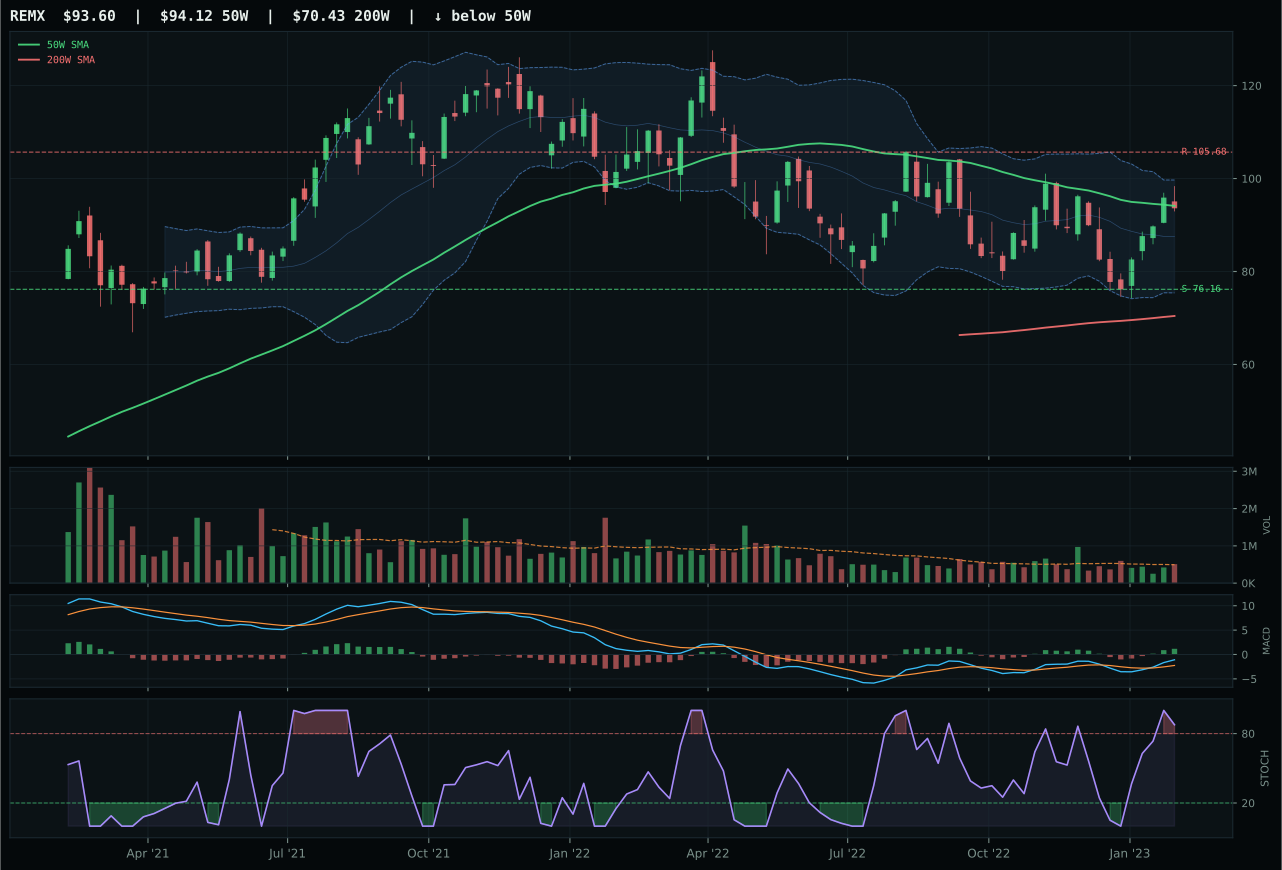
REMX has a compression near 50W profile with -9.8% 13-week relative strength versus SPY.
A failed hold above support would weaken the setup.
Actionable but governed by invalidation levels.
COPX dominated the industrial metals basket by posting a perfect 100 trend score (price above both moving averages, RS vs SPY at 14.5%, 50W slope -0.1%), combined with 100 momentum confirmation (24.1% 13-week return, 5.1% category-relative strength, bullish and improving MACD, and neutral volume that nonetheless participates in the move). The setup is neutral structure but positioned at Fibonacci 0.382 (momentum zone), with 11.4% distance to 50W creating timing score of 75—not early entry but not extended. Stochastic RSI at 0.66 (falling/neutral) suggests momentum is cooling but not reversed, which is exactly the setup buyers want: strong trend evidence with early warning signals still ahead. PICK lost by 3.0 points because risk/reward was significantly worse (38.5 vs 46.6, with upside to resistance at -4.0% and downside to support 44.6%), structure was less clean (69.8 vs 71.7), and critically, volume showed distribution pressure rather than neutral participation—a red flag indicating insiders are trimming exposure. In relative-strength races, the ETF with cleanest volume pattern typically leads; COPX's neutral volume amid 1.0x average participation is far healthier than PICK's distribution pressure.
Industrial Metals earned 10% allocation because the 54.1 category score ranked sixth overall and because metals scarcity (+14) is the portfolio's second-strongest active descriptor after AI growth, creating asymmetrical macro support. The 65.0 category macro fit reflects strong commodity breadth positive (+10), real asset sponsorship (+6), and metals scarcity (+14), offset only partially by liquidity stress (-8) and credit stress (-7). COPX's technical setup (perfect trend, strong momentum, neutral volume) suggests institutional positioning ahead of potential supply tightness, and the 24.1% 13-week return proves demand is real, not speculative. Risk/reward is unfavorable at current levels (46.6 points, with upside capped at -4.0%), meaning this allocation is a medium-term hold rather than a short-term trade—entry risk is defined at support 27.51. At 10%, this is a conviction bet on commodity cycles and supply discipline, justified by macro alignment but not yet warranting expansion until either volume turns accumulative or MACD begins a secondary leg.
Defense & Aerospace — XAR
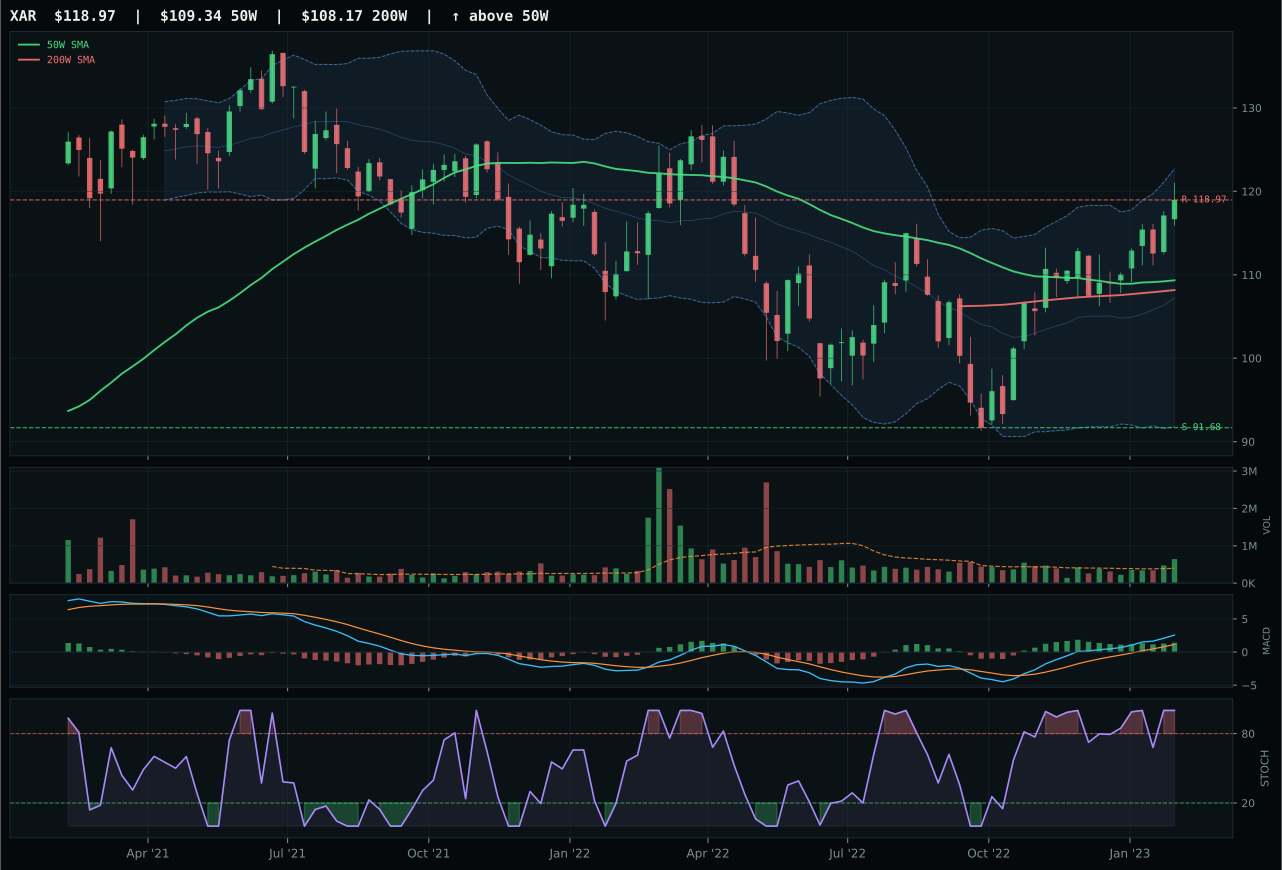
XAR has a neutral structure profile with 3.0% 13-week relative strength versus SPY.
A failed hold above support would weaken the setup.
Actionable but governed by invalidation levels.
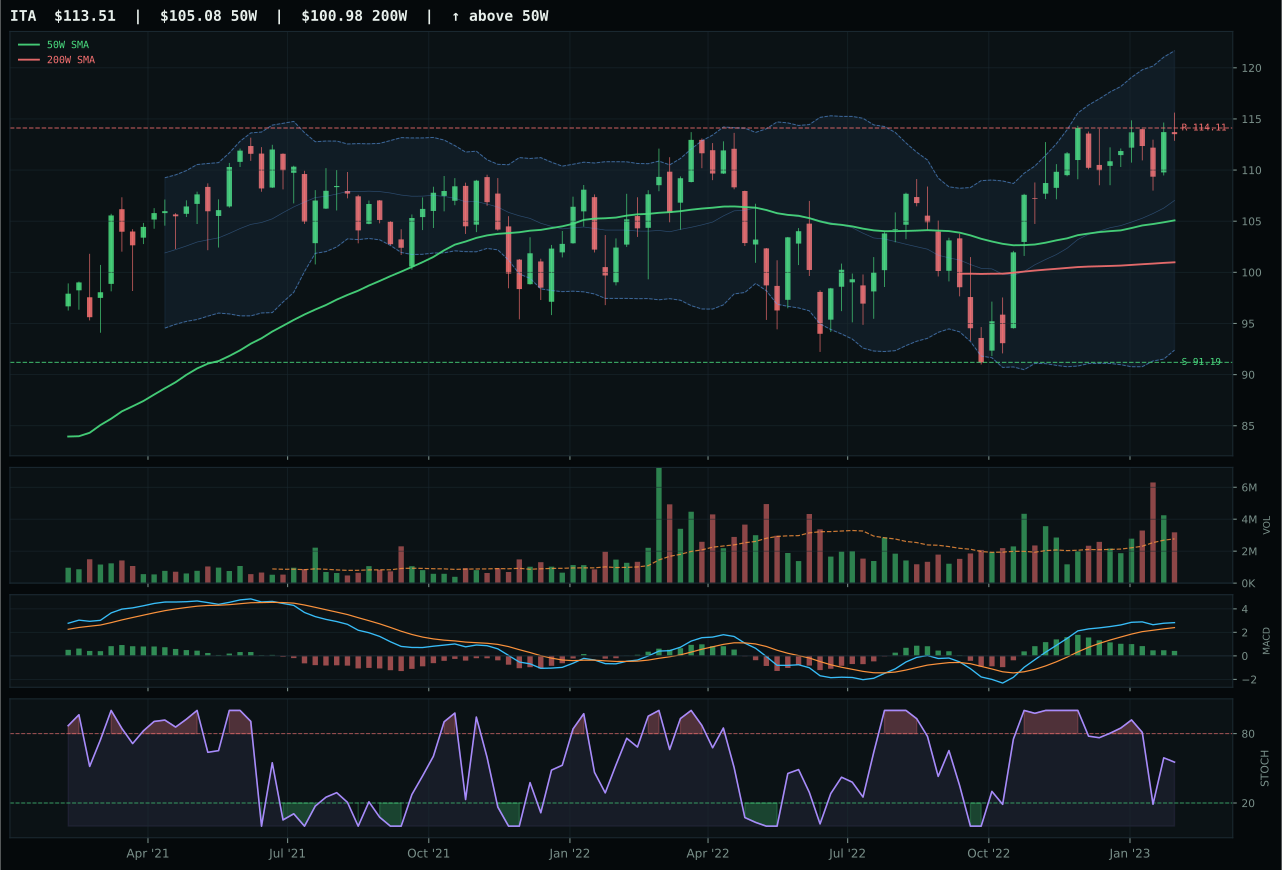
ITA has a neutral structure profile with -3.6% 13-week relative strength versus SPY.
A failed hold above support would weaken the setup.
Actionable but governed by invalidation levels.
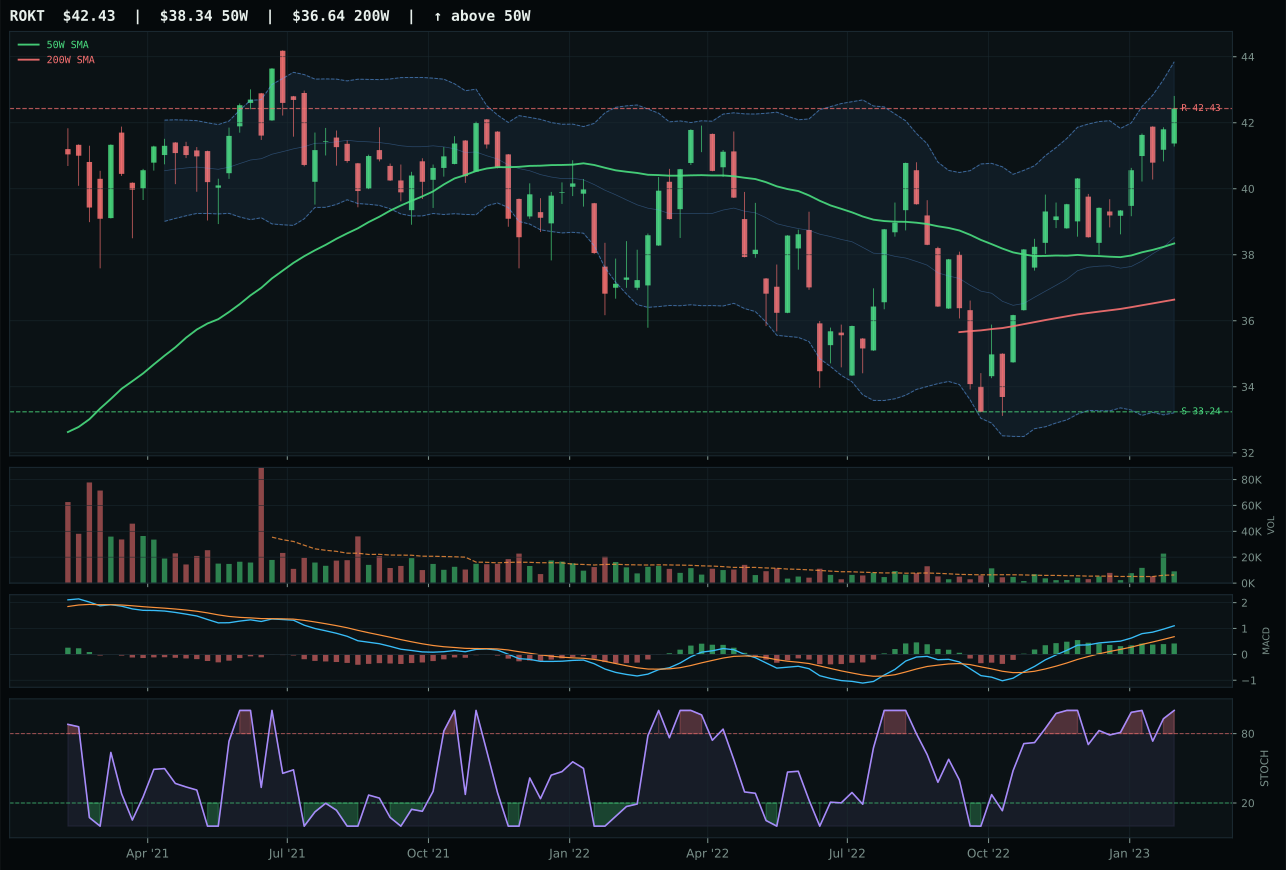
ROKT has a neutral structure profile with 1.4% 13-week relative strength versus SPY.
A failed hold above support would weaken the setup.
Tracked, but not top-2 eligible because: .
XAR won by executing a clean uptrend with perfect technical confirmation: price above both the 50-week and 200-week moving averages, 50W slope positive at 0.1%, and RS versus SPY at 3.0% showing steady outperformance. The chart compresses near support at 91.68 with resistance at 118.97, but the critical edge is volume—accumulation/confirmation at 1.63x the 20-week average and volume-price confirmation of 93.4 points indicate buyers are actively defending the move, not chasing late. MACD is bullish and improving, stochastic RSI sits at overbought 1.00, and the 12.6% 13-week return is modest but durable, signaling patience rather than speculative frenzy. ITA lost decisively on momentum deterioration: MACD is bullish but flattening (not improving), volume is merely above-average (not accumulation), and category-relative strength is -5.0%, meaning ITA trailed the defense basket while XAR led it by 1.7%. The 15.8-point score gap reflects ITA's technical setup degrading under the surface despite headline price strength.
Defense & Aerospace earned 10% because the 50.3 category score ranked fifth among ten categories—above-median but not high enough to displace top-4 selections—and because its macro fit is neutral (no specific category-linked descriptors apply) even though technical evidence from XAR is strong at 100.0 composite. The allocation reflects a hedge: disinflation typically weakens real asset demand and cyclical defense spending, yet XAR's superior structure and volume patterns justify a modest position for diversification and momentum capture. If credit stress deepens or liquidity stress accelerates, this category would contract to zero; conversely, if risk appetite remains positive and real asset breadth improves, it could expand to 15%. Current 10% positioning is appropriate for a regime where tactical technicals matter more than macro narrative, and where individual ETF quality—not category conviction—drives the holding.
Nuclear Energy — URNM
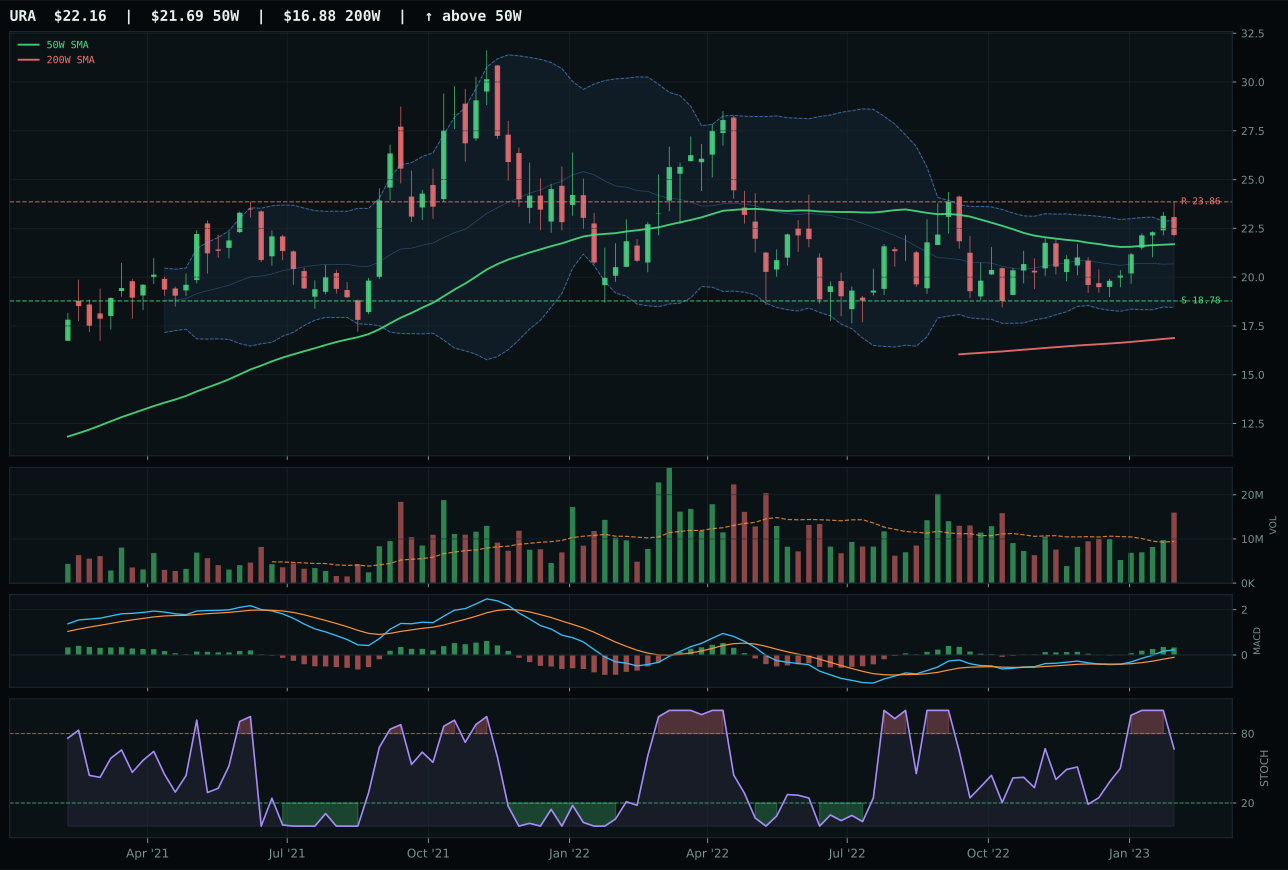
URA has a compression near 50W profile with -0.1% 13-week relative strength versus SPY.
A failed hold above support would weaken the setup.
Actionable but governed by invalidation levels.
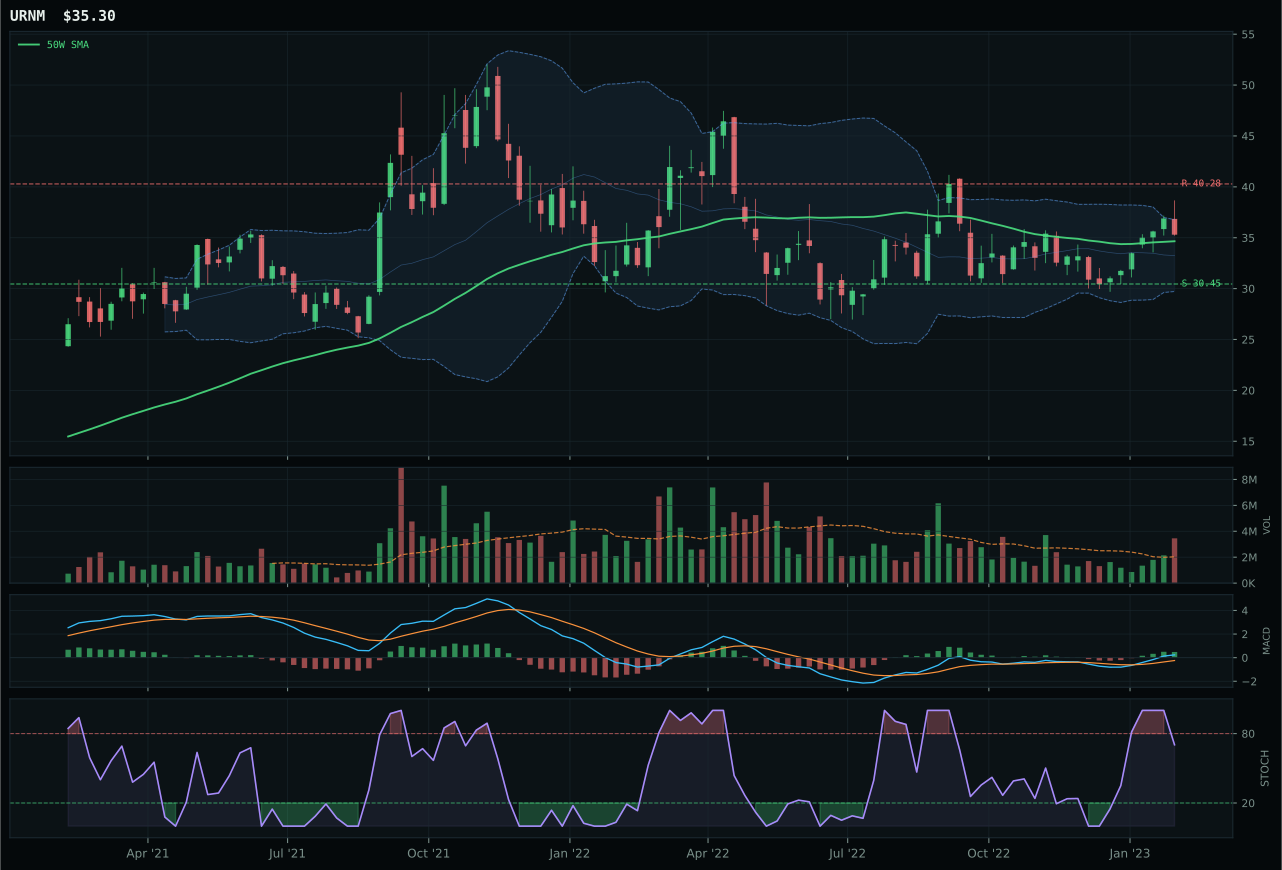
URNM has a compression near 50W profile with -2.7% 13-week relative strength versus SPY.
A failed hold above support would weaken the setup.
Actionable but governed by invalidation levels.
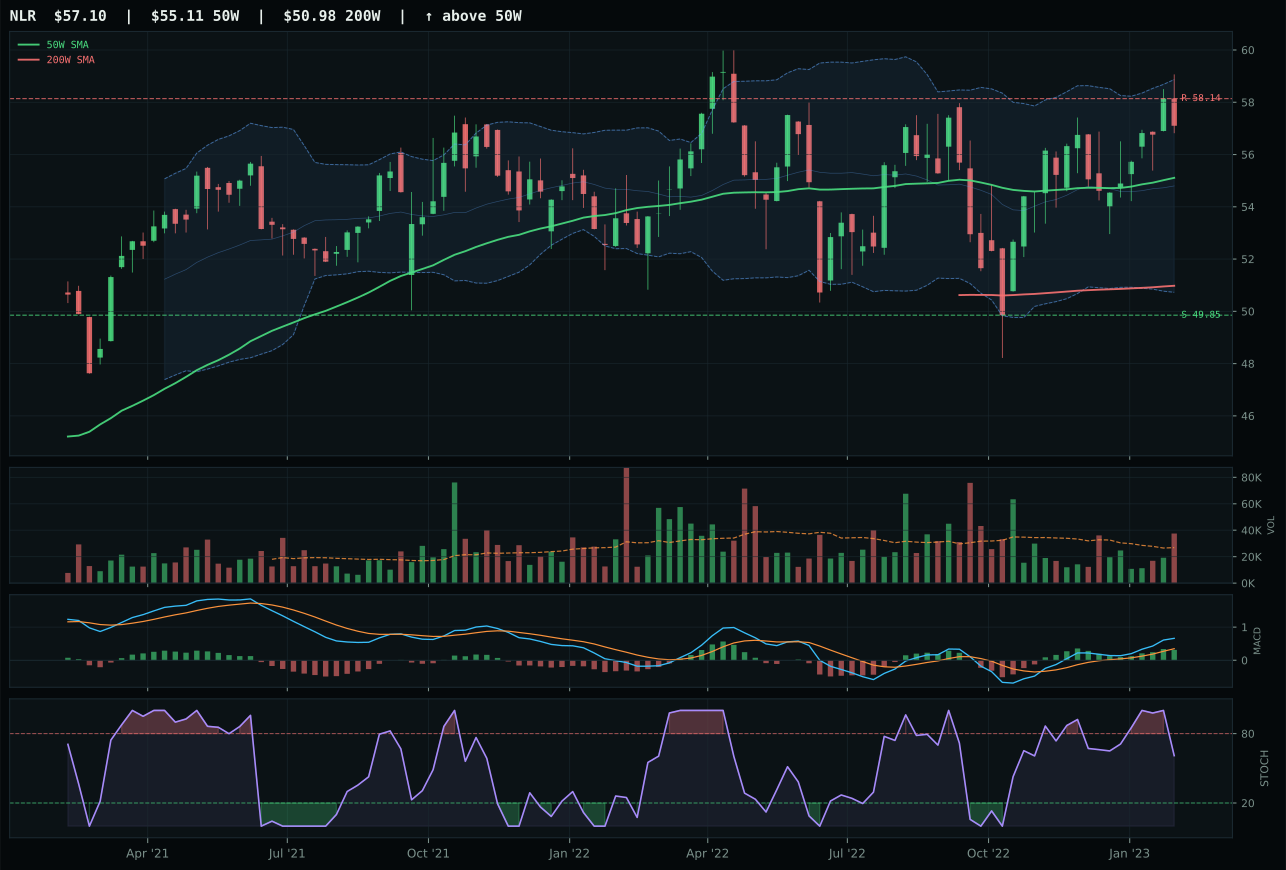
NLR has a neutral structure profile with -3.9% 13-week relative strength versus SPY.
A failed hold above support would weaken the setup.
Tracked, but not top-2 eligible because: .
URNM edged URA in a close technical race by posting superior risk/reward (59.0 vs 52.1 at URA), meaning URNM's support at 30.45 is closer relative to upside potential, creating a tighter entry zone. Both ETFs sit in perfect compression near the 50-week moving average (URNM at 1.9%, URA similar), both have MACD bullish and improving, both stochastic RSI at falling/neutral, and both carry distribution pressure in volume—yet URNM's downside to support of 15.9% versus URA's wider gap reflects a more manageable setup for patient entry. Trend score favors URA at 100 versus URNM's 76 (URA is above both moving averages; URNM is above 50W but below 200W), but timing is identical at 100 for both, making the risk/reward differential the category decision maker. The 6.9% 13-week return and 0.0% category-relative strength show neither ETF is winning peer demand—this is a coil-and-wait setup where the ETF with best entry mechanics (URNM) wins despite inferior trend indicators.
Nuclear Energy earned 10% allocation despite a weak 45.8 category score (ranked seventh) because real asset sponsorship (+7) and AI growth sponsorship (+5) create dual macro tailwinds that offset credit stress (-5) and liquidity stress (-7). Category macro fit is neutral at 50.0, reflecting genuine optionality: nuclear energy is neither clearly favored nor disfavored in the current regime. URNM's technical setup (compression, oversold stochastic, flattening MACD, distribution volume) is a classic "basing pattern" that requires patience but rewards early positioning—the allocation reflects a belief that nuclear demand cycles will improve faster than consensus expects, driven by AI power requirements and net-zero mandates. At 10%, this is a medium-conviction speculative position: it has defined downside at support 30.45 and upside potential if technicals improve and volume turns accumulative. If URNM's timing score drops or support breaks, reduce to 5%; if volume turns positive and MACD stabilizes, this could expand to 15% as a renewable-energy play with embedded leverage.
Agriculture & Livestock — VEGI
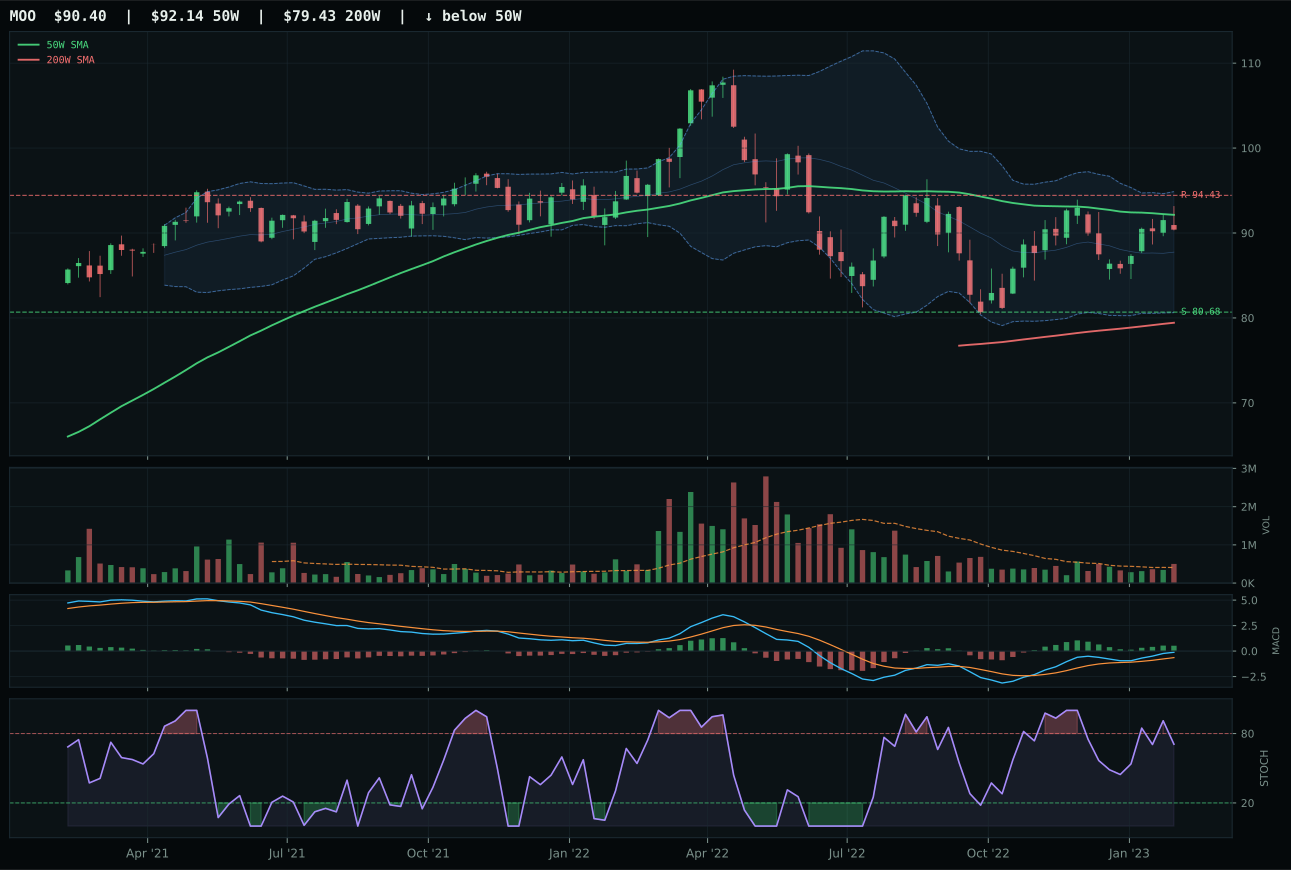
MOO has a compression near 50W profile with -6.4% 13-week relative strength versus SPY.
A failed hold above support would weaken the setup.
Actionable but governed by invalidation levels.
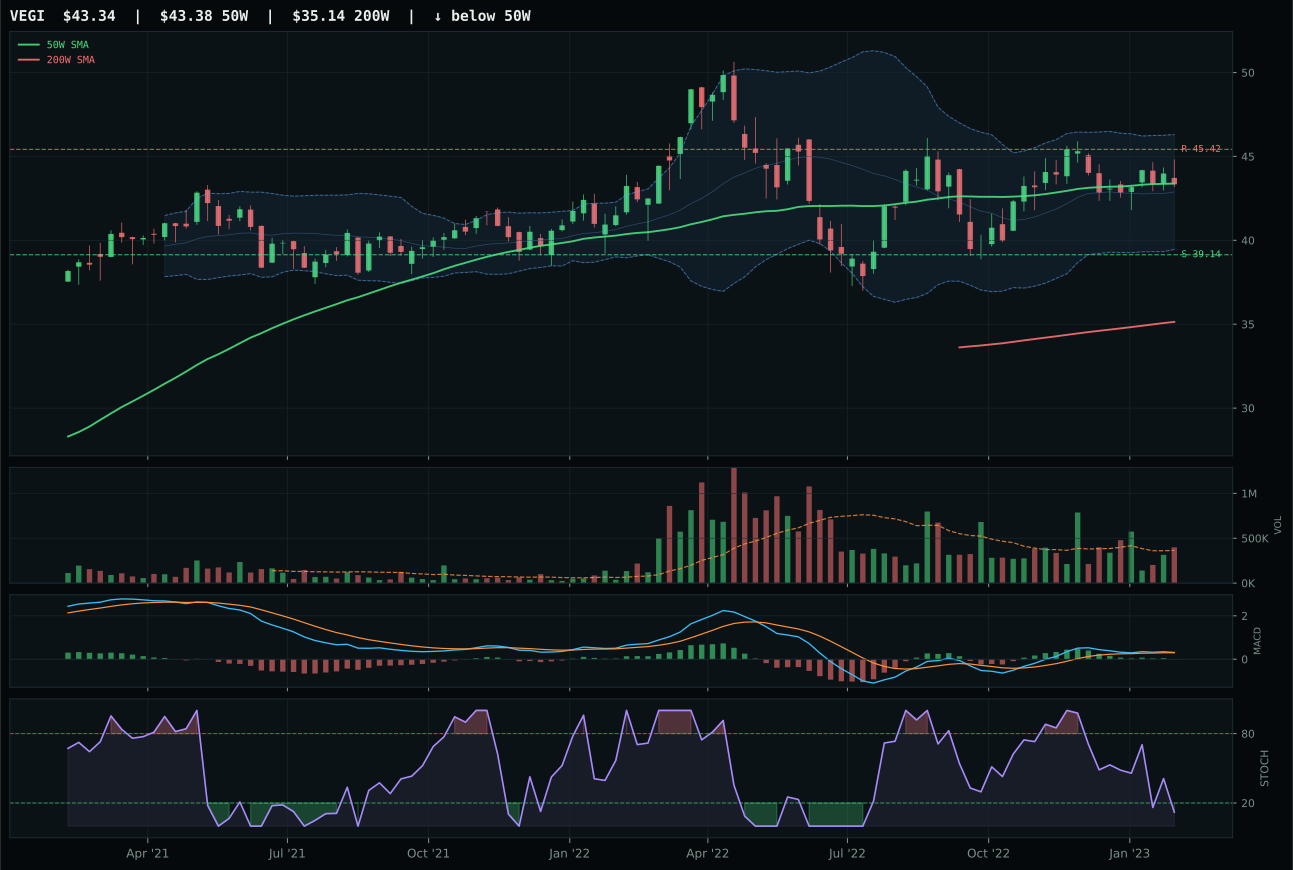
VEGI has a compression near 50W profile with -9.1% 13-week relative strength versus SPY.
A failed hold above support would weaken the setup.
Actionable but governed by invalidation levels.
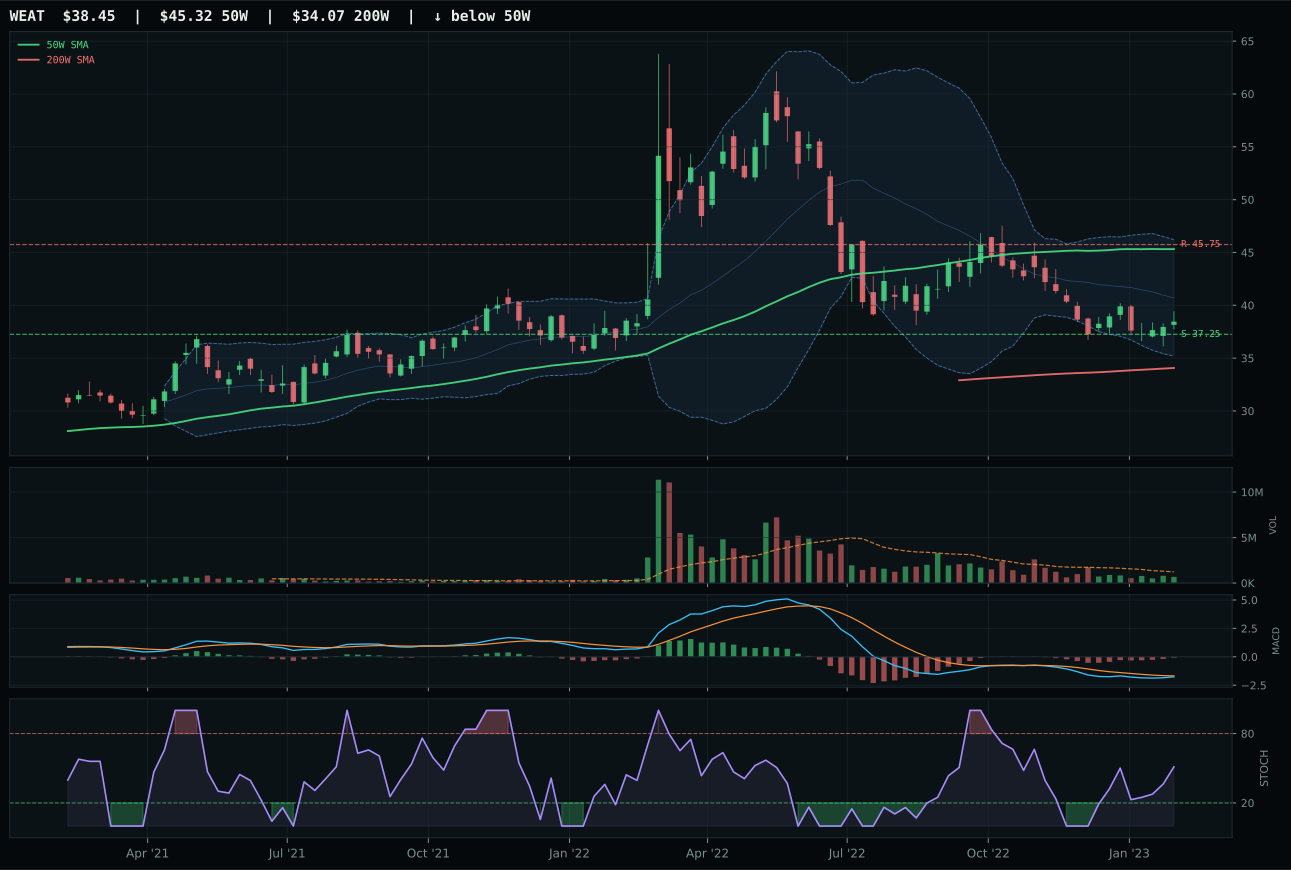
WEAT has a pullback into support profile with -21.4% 13-week relative strength versus SPY.
A failed hold above support would weaken the setup.
Actionable but governed by invalidation levels.
VEGI edged MOO by the narrowest margin (-1.1 points), winning on timing precision despite inferior momentum confirmation—a setup that rewards patience over performance chasing. Price sits at -0.1% from the 50-week moving average in perfect compression-zone alignment, with timing score a clean 100 because stochastic RSI is oversold at 0.12 and MACD is bullish but flattening, offering a coil-into-expansion risk. The 0.4% 13-week return and 0.0% category-relative strength are mathematically poor, but the setup is architecturally sound: support at 39.14 is 10.7% below, resistance at 45.42 is 4.6% above, creating asymmetrical risk (upside limited but downside protected if accumulation revives). MOO's loss came down to two specific failures: risk/reward was 1.3 points worse (59.4 vs 60.7), and MACD confirmation was stronger (bullish and improving), meaning MOO's chart is further extended and less reset-ready. In compressed, mean-reversion setups, the ETF closer to exact moving-average price wins on timing alone.
Agriculture & Livestock earned only 10% allocation because the 31.4 category score ranked tenth (worst) of all categories and was dragged lower by disinflation's -8 impact on real assets and commodity demand. The category macro fit is just 45.0, and active descriptors show conflict: commodity breadth positive (+5) and real asset sponsorship (+8) are offset by disinflation pressure (-8) and liquidity stress (-4). VEGI's technical setup (compression, oversold stochastic, flattening MACD) is the kind that works only if macro sponsorship improves or if patient buyers accumulate during consolidation. This 10% holding is defensive diversification—a long-dated alpha position that only activates if disinflation reverses or if commodity cycles turn. Without macro catalyst, expect this category to underperform; if inflation surprises higher, it becomes a top-4 candidate within weeks. Current allocation reflects low conviction and modest upside, making this the most disposable slot in the portfolio.
Emerging Markets — IEMG
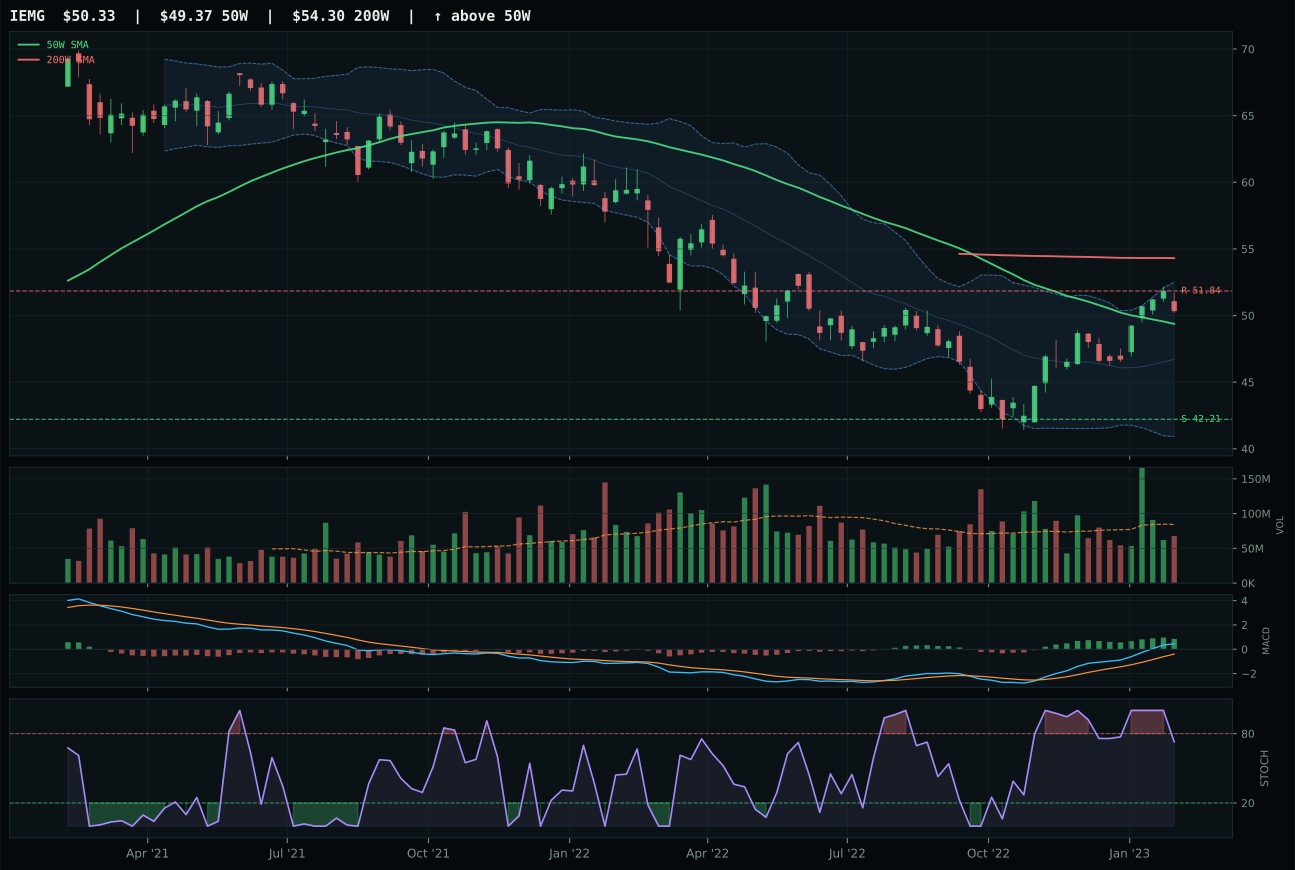
IEMG has a compression near 50W profile with 3.0% 13-week relative strength versus SPY.
A failed hold above support would weaken the setup.
Actionable but governed by invalidation levels.
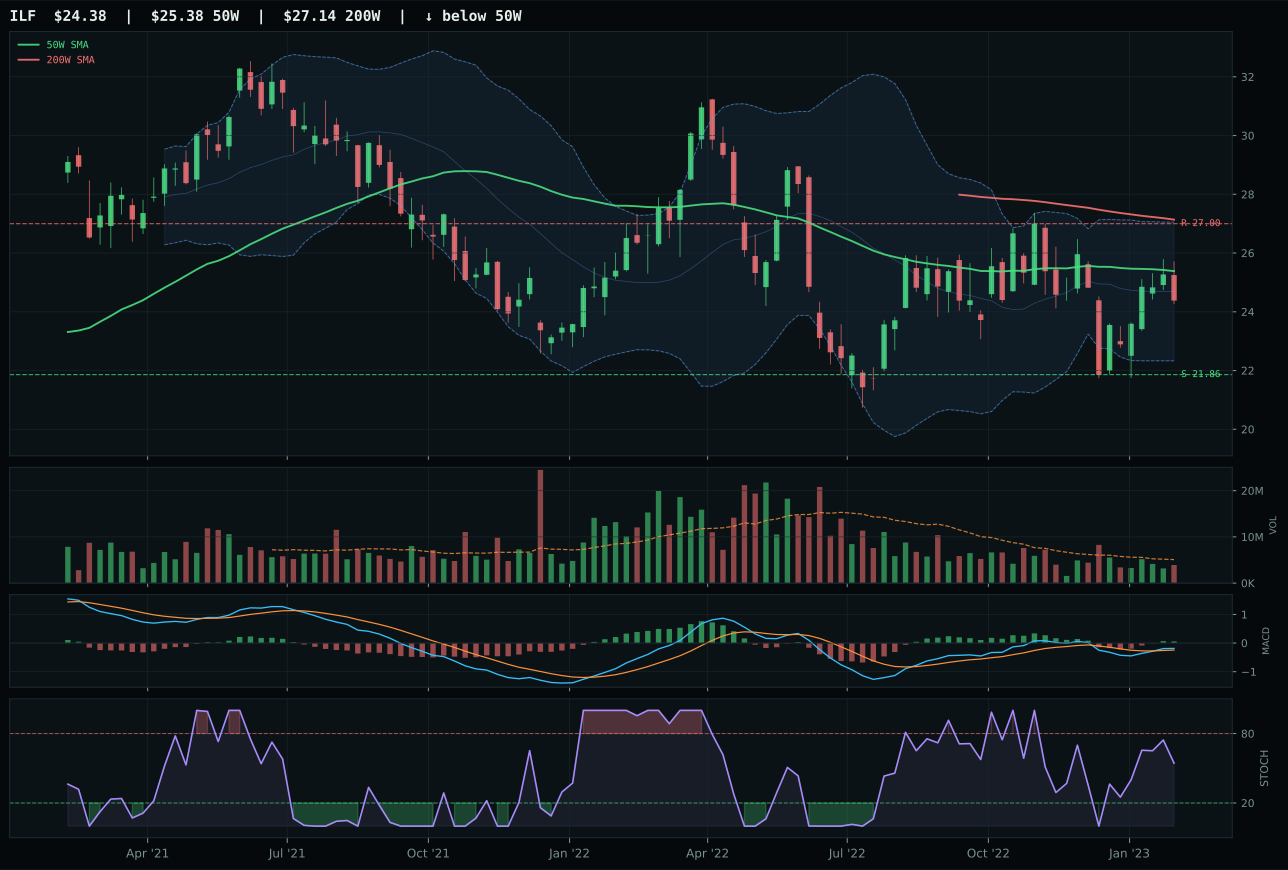
ILF has a neutral structure profile with -19.3% 13-week relative strength versus SPY.
Extension and support failure are the main tactical risks.
Tracked, but not top-2 eligible because: structurally broken.
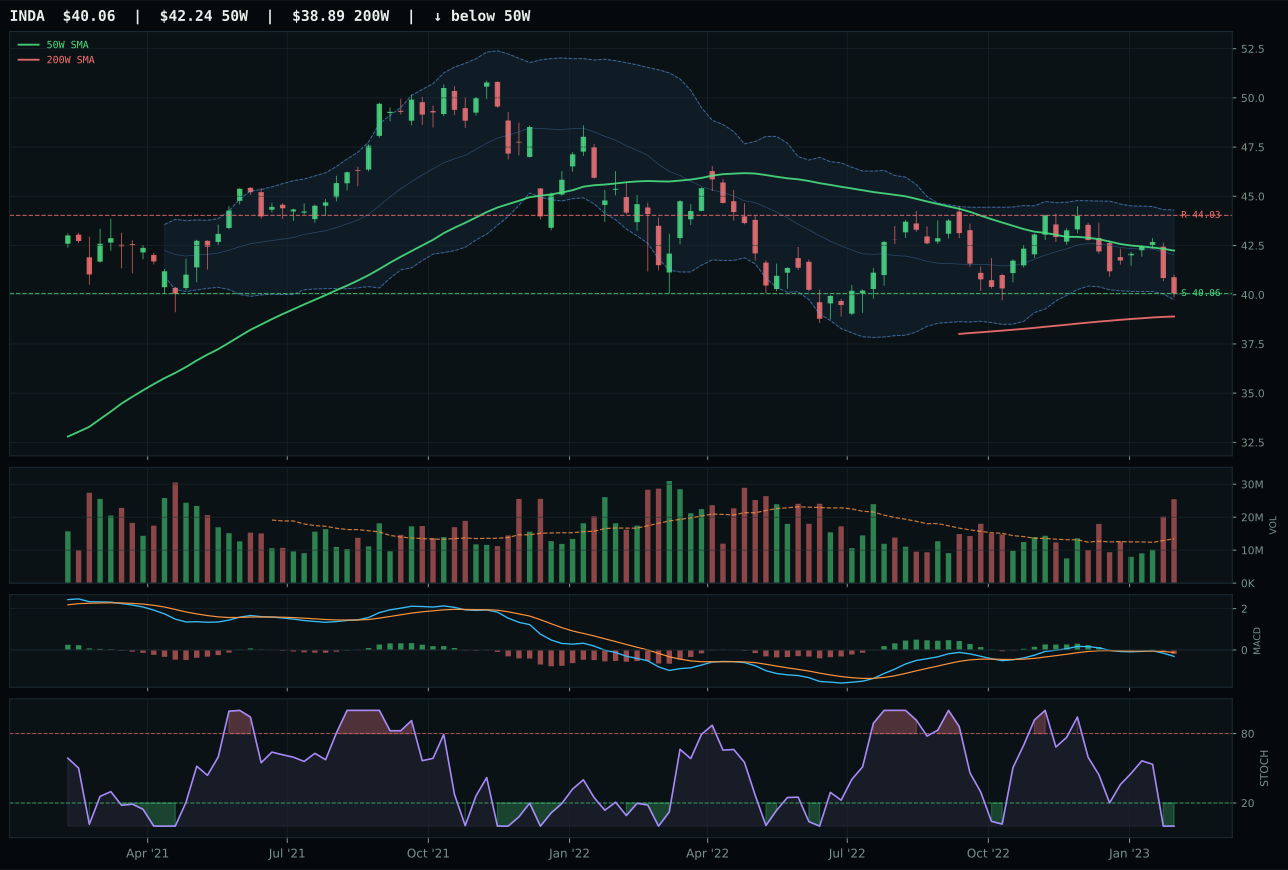
INDA has a pullback into support profile with -16.5% 13-week relative strength versus SPY.
A failed hold above support would weaken the setup.
Actionable but governed by invalidation levels.
IEMG claimed the emerging-markets category decisively with a 67.8-point gap versus ILF, reflecting near-perfect technical execution despite broad market headwinds. Price sits at 1.9% from the 50-week moving average (ideal compression entry), MACD is bullish and improving, stochastic RSI at 0.73 is falling/neutral (no overbought risk), and volume at 0.80x is neutral—yet the 12.5% 13-week return and dominant 19.5% category-relative strength show IEMG is absorbing the basket's outflows while others decline. Structure scores 74.9 with compression at 83.5, meaning the chart is tight and ready to extend if support at 42.21 holds. ILF lost catastrophically because its trend score is only 30 (structured broken, 30-point scoring failure), its 13-week return is -9.7%, and its -19.3% RS versus SPY shows it's being abandoned by all market participants. This is a case where one ETF in a category is fundamentally healthy while peers are broken—IEMG's lead is not close in technical terms, despite both sitting in similar Fibonacci zones.
Emerging Markets received 0% allocation because the 7.9 category score ranked it 9th or 10th, and macro fit at 38.0 (one of the lowest in the portfolio) confirmed why despite IEMG's exceptional 91.8 technical evidence. The descriptor scorecard is unambiguous: risk appetite positive at +8 is insufficient to overcome credit stress at -10, liquidity stress at -10, and the overall macro regime punishing risk assets. IEMG's compression setup and oversold stochastic would typically warrant a core position, yet technical excellence cannot compensate for a macro headwind this severe—under tightening credit and stress in the global financial plumbing, emerging markets are not where capital migrates. The technical setup would improve in a risk-on regime; the macro backdrop is the limiting factor. Re-entry would require credit stress and liquidity stress to reverse, or risk-appetite descriptor weight to spike, neither of which has occurred.
Traditional Energy — XLE
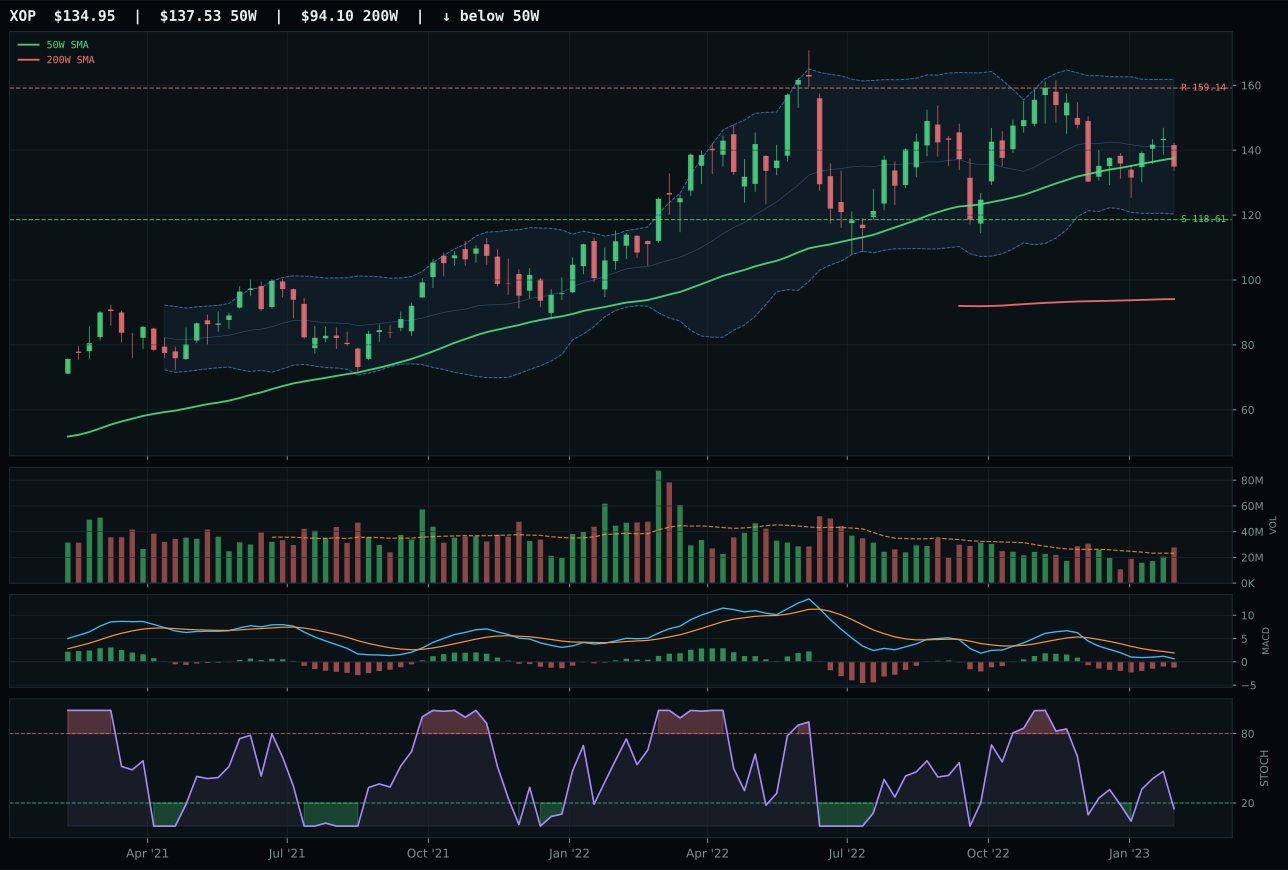
XOP has a compression near 50W profile with -22.8% 13-week relative strength versus SPY.
A failed hold above support would weaken the setup.
Actionable but governed by invalidation levels.
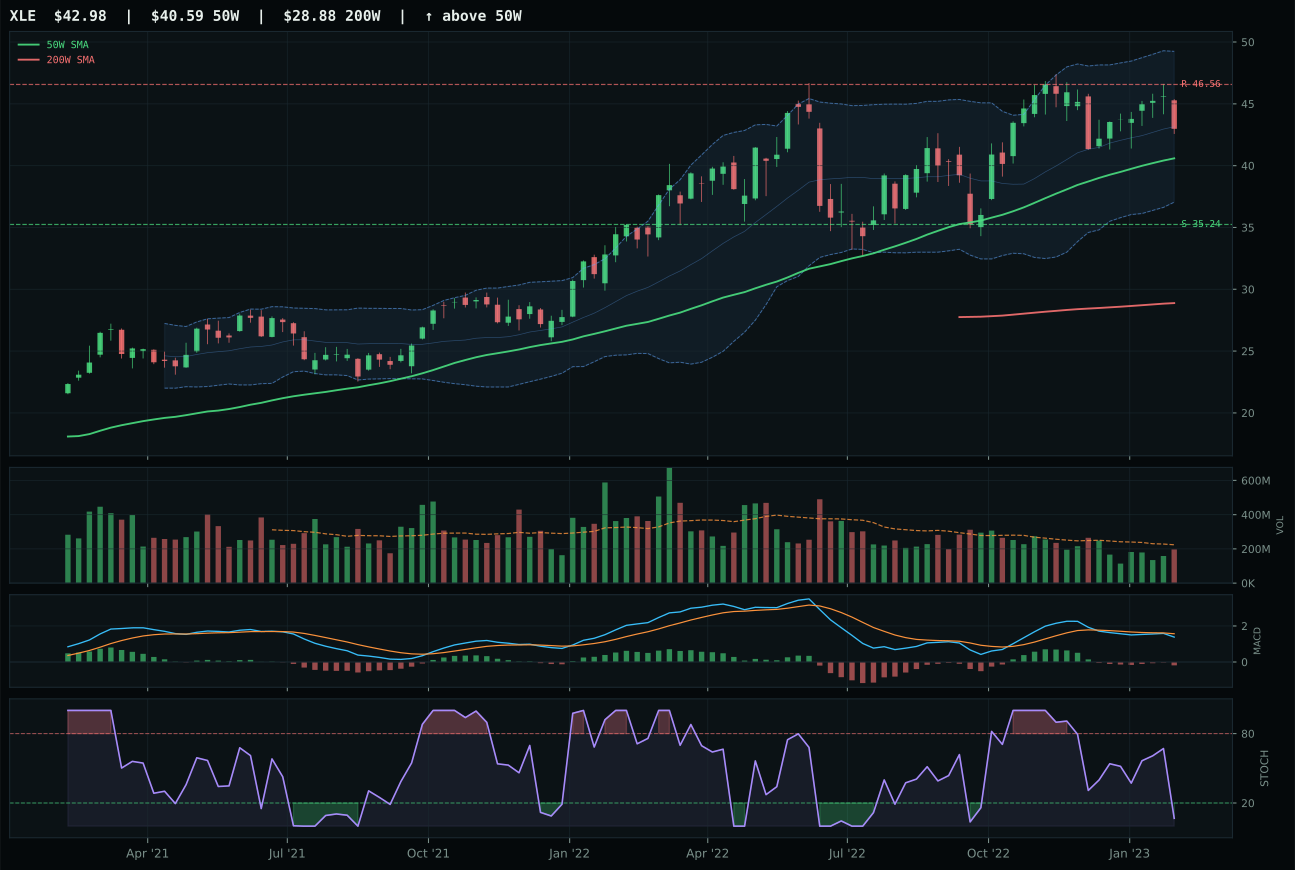
XLE has a neutral structure profile with -15.5% 13-week relative strength versus SPY.
A failed hold above support would weaken the setup.
Actionable but governed by invalidation levels.
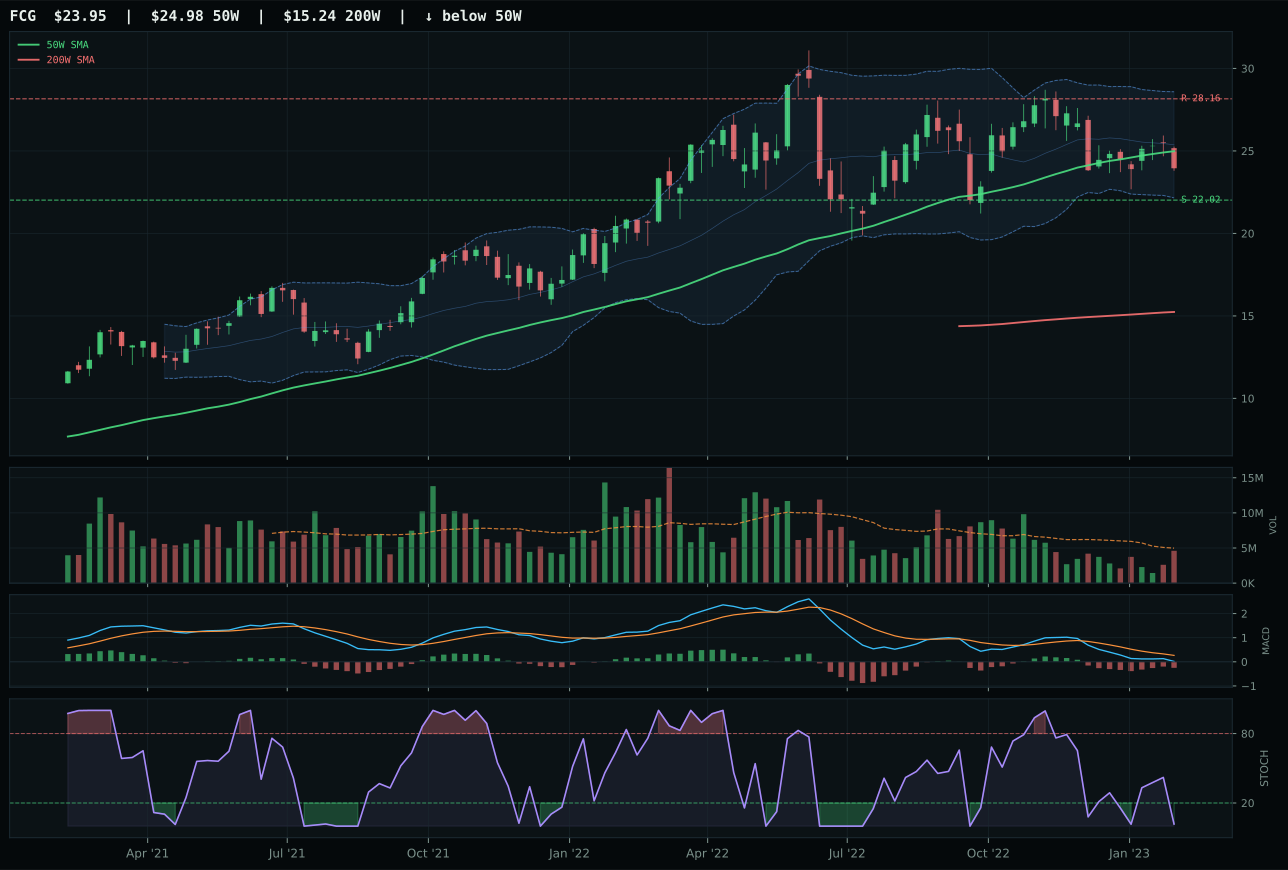
FCG has a neutral structure profile with -23.3% 13-week relative strength versus SPY.
A failed hold above support would weaken the setup.
Actionable but governed by invalidation levels.
XLE won the energy category by default—not because it's attractive, but because it lost less than its peers to the disinflation macro regime crushing energy demand. Price sits 5.9% above the 50-week moving average with neutral structure and a 67.0 trend score marred by -15.5% RS versus SPY, meaning XLE is moving up in absolute terms but down relative to the market. MACD is bearish/weakening and stochastic RSI is oversold at 0.07, warning that the recent 13-week decline of -6.0% has exhausted sellers but created no fresh demand—this is capitulation, not capitulation-to-accumulation. Volume at 0.88x is subaverage, confirming the move lacks institutional sponsorship. XOP lost by trailing on structure clarity (70.1 vs 74.6) and category-relative strength (0.0% vs 7.3%), with a catastrophic 13-week return of -13.2% and -22.8% RS versus SPY showing exploration beta is getting crushed. The category winner is the least-bad choice in an unfavorable regime, not a position of conviction.
Traditional Energy received 0% allocation because the 4.9 category score placed it 9th or 10th in the ranking, and the macro regime actively repels this entire space. Disinflation pressure is -10, credit stress is -7, liquidity stress is -7, and real asset sponsorship at +5 cannot overcome a -22 combined descriptor headwind. XLE's technical evidence of 36.0 is critically weak—the lowest in the entire ten-category universe—and macro fit at 47.0 offers no rescue. The decision is unambiguous: under falling inflation and tightening credit, traditional energy carries no forward option value. A portfolio allocator might revisit this category if real asset sponsorship strengthens, commodity breadth extends further, or disinflation pressure reverses (inflation re-ignites), but those conditions haven't appeared. The exclusion is clean and justified by both technical deterioration and macro regime mismatch.