
2023-01-27
Informational purposes only. The content in this report, including allocations, analysis, and commentary, is provided solely for informational and educational purposes. It does not constitute financial advice, investment advice, trading advice, or any other type of advice. Past performance does not guarantee future results. Always conduct your own research and consult a qualified financial professional before making investment decisions.
Weekly Allocation
| Ticker | Category | Weight | Role |
|---|---|---|---|
| REMX | Industrial Metals | 20% | Top-2 (20%) |
| GLD | Precious Metals | 20% | Top-2 (20%) |
| SMH | AI | 10% | Tier-2 (10%) |
| PAVE | Utilities & Infrastructure | 10% | Tier-2 (10%) |
| XAR | Defense & Aerospace | 10% | Tier-2 (10%) |
| URNM | Nuclear Energy | 10% | Tier-2 (10%) |
| VEGI | Agriculture & Livestock | 10% | Tier-2 (10%) |
| XLE | Traditional Energy | 10% | Tier-2 (10%) |
Trade Instructions — Monday Open
Sell the tranche from 2022-12-30 (completing its 4-week hold). Buy the new tranche. Instructions show net portfolio changes — same-asset positions cancel, weight changes show the delta.
| Action | Ticker | Instruction |
|---|---|---|
| SELL | ITA | Sell entire ITA position (5.00% of portfolio) |
| SELL | XLU | Sell entire XLU position (2.50% of portfolio) |
| SELL | COPX | Sell 17% of COPX position (reduce 15.00% → 12.50%) |
| SELL | WEAT | Sell 50% of WEAT position (reduce 5.00% → 2.50%) |
| SELL | INDA | Sell 50% of INDA position (reduce 5.00% → 2.50%) |
| BUY | XAR | Buy XAR — 16.67% of freed cash (adds 2.50% to portfolio) |
| BUY | VEGI | Buy VEGI — 16.67% of freed cash (adds 2.50% to portfolio) |
| BUY | SMH | Buy SMH — 16.67% of freed cash (adds 2.50% to portfolio) |
| BUY | PAVE | Buy PAVE — 16.67% of freed cash (adds 2.50% to portfolio) |
| BUY | REMX | Buy REMX — 33.33% of freed cash (adds 5.00% to portfolio) |
Current Portfolio After Trade
Combined holdings across all 4 active tranches. Each tranche is 25% of the portfolio.
| Ticker | % of Portfolio | Weight Bar |
|---|---|---|
| GLD | 20.00% | |
| COPX | 12.50% | |
| XLE | 10.00% | |
| URNM | 10.00% | |
| XAR | 10.00% | |
| VEGI | 7.50% | |
| IGF | 5.00% | |
| SMH | 5.00% | |
| PAVE | 5.00% | |
| REMX | 5.00% | |
| WEAT | 2.50% | |
| INDA | 2.50% | |
| XLK | 2.50% | |
| IEMG | 2.50% |
Macro Regime — Late-Cycle Reflation
Macro Evidence Charts
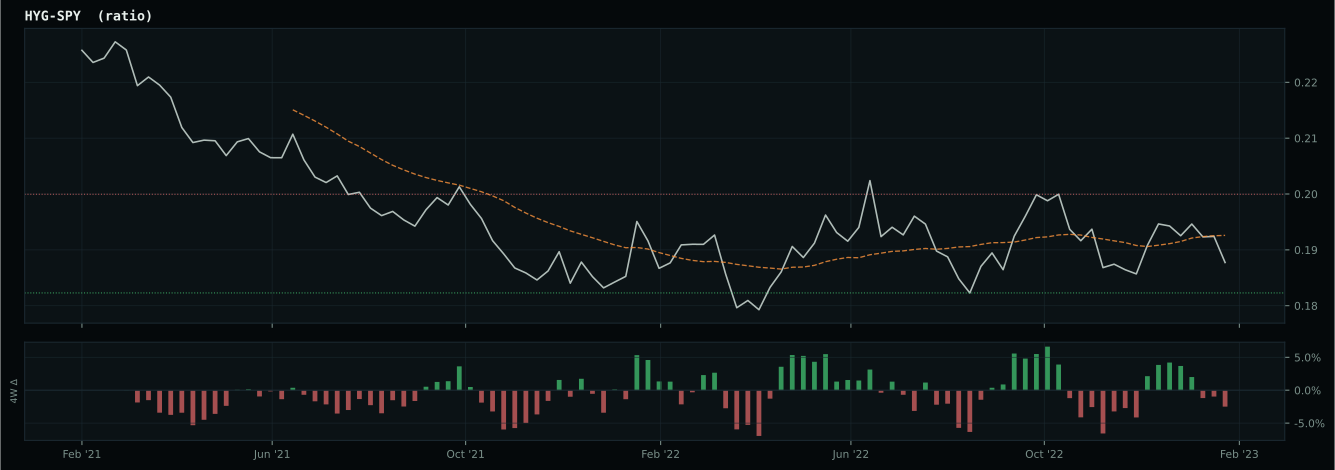
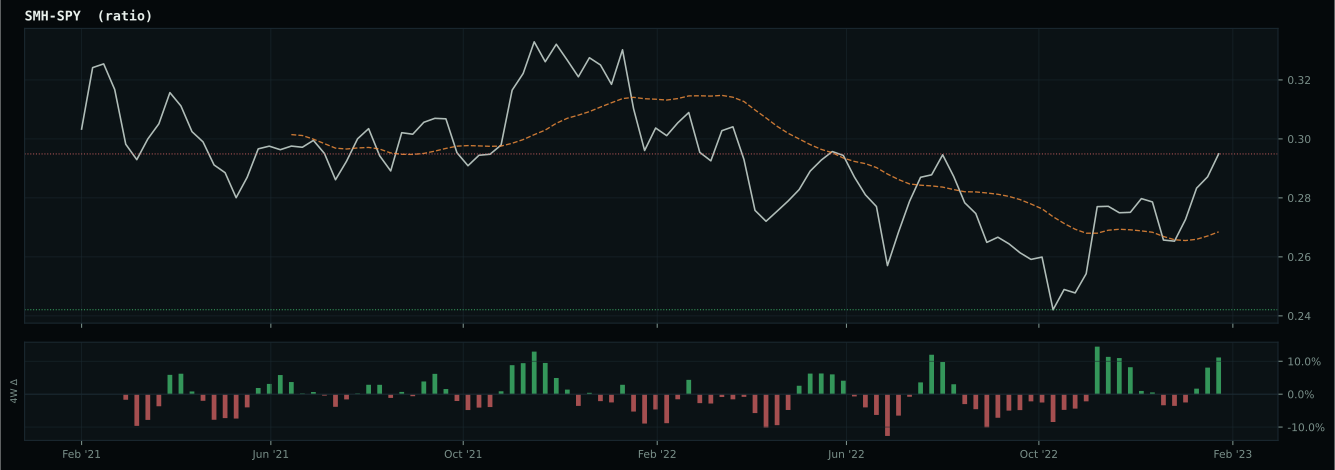
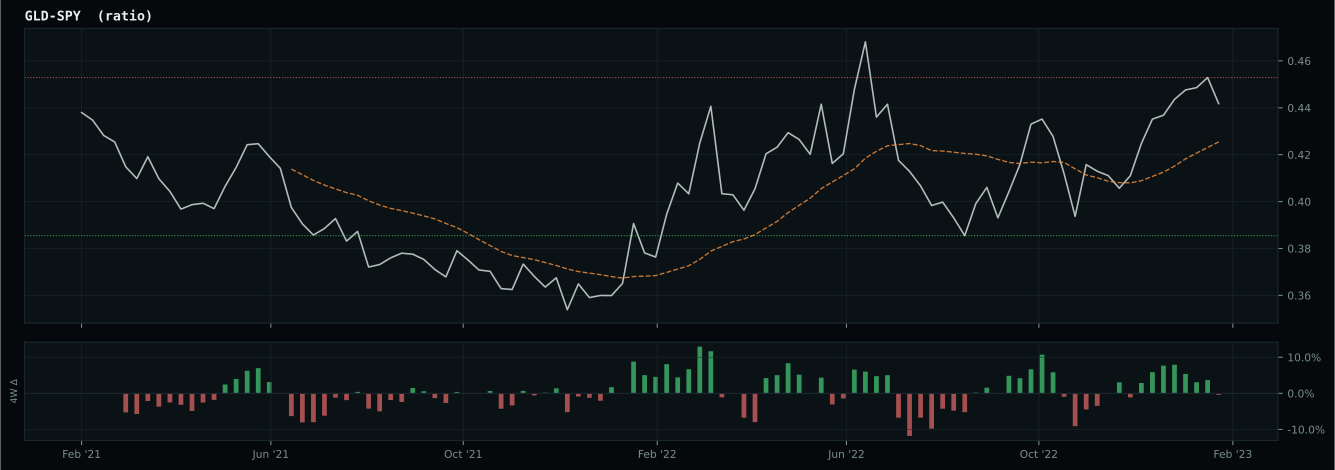
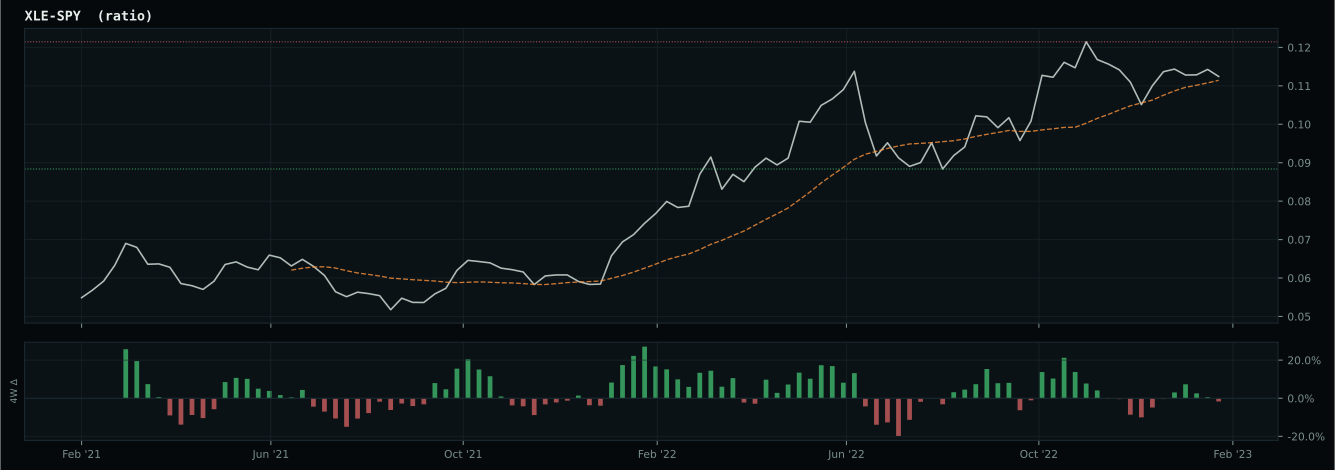
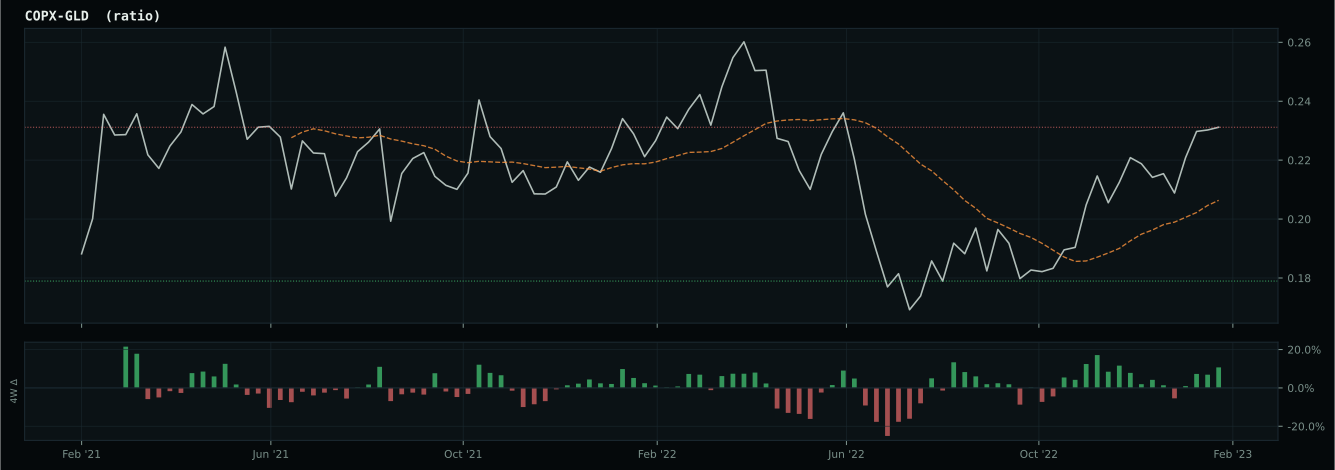
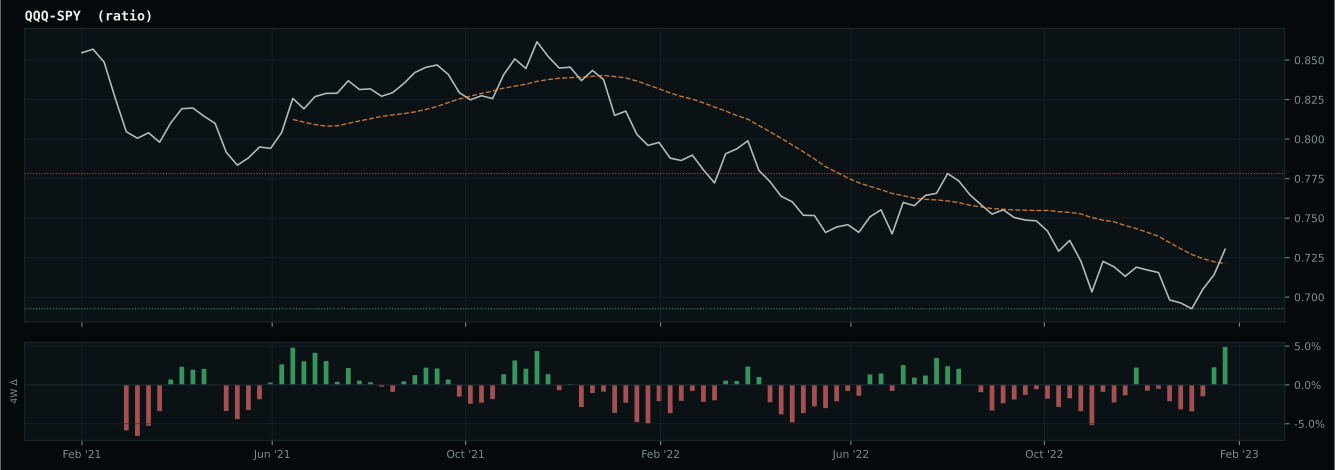
Market-implied signals behind the macro regime scores. Each ratio compares two assets; the direction and slope of the ratio is what the macro engine reads.
Crypto Regime — NoCrypto
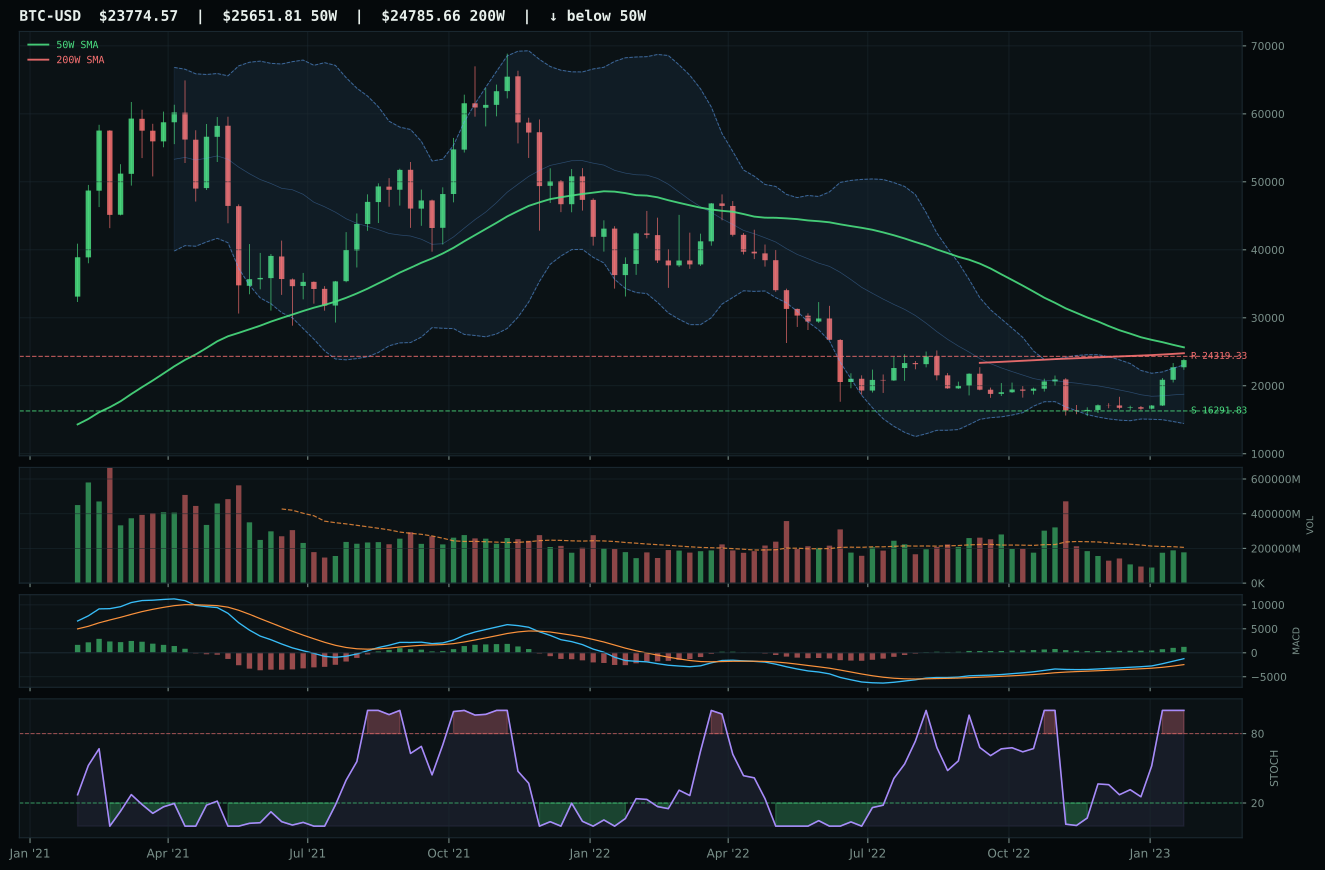
ValueBTC armed; waiting for 50W reclaim, close above 200W, breakout volume above 20W average
TrendBTC not confirmed
one or more available conditions failed
Category Rankings
| Rank | Category | Winner | Score | Alloc | 4W Ret | Peers (4W) |
|---|---|---|---|---|---|---|
| 1 | Industrial Metals | REMX | 81.6 | 20% | -11.23% | COPX -9.1% · PICK -10.0% |
| 2 | Precious Metals | GLD | 69.2 | 20% | -5.81% | GDX -15.8% · SLV -12.4% |
| 3 | AI | SMH | 62.1 | 10% | +2.63% | BOTZ -0.4% · AIQ -1.9% |
| 4 | Utilities & Infrastructure | PAVE | 60.6 | 10% | +2.93% | IGF -2.6% · XLU -2.5% |
| 5 | Defense & Aerospace | XAR | 60.2 | 10% | +2.95% | ITA +2.2% · ROKT +1.9% |
| 6 | Nuclear Energy | URNM | 59.2 | 10% | -9.50% | URA -9.2% · NLR -3.9% |
| 7 | Agriculture & Livestock | VEGI | 51.6 | 10% | -0.59% | MOO -1.6% · WEAT -5.0% |
| 8 | Traditional Energy | XLE | 47.7 | 10% | -6.34% | XOP -4.9% · FCG -6.0% |
| 9 | Technology | XLK | 41.0 | 0% | +1.72% | CIBR +3.7% · IGV +0.6% |
| 10 | Emerging Markets | IEMG | 15.9 | 0% | -6.58% | ILF -5.3% · INDA -4.4% |
Industrial Metals — REMX
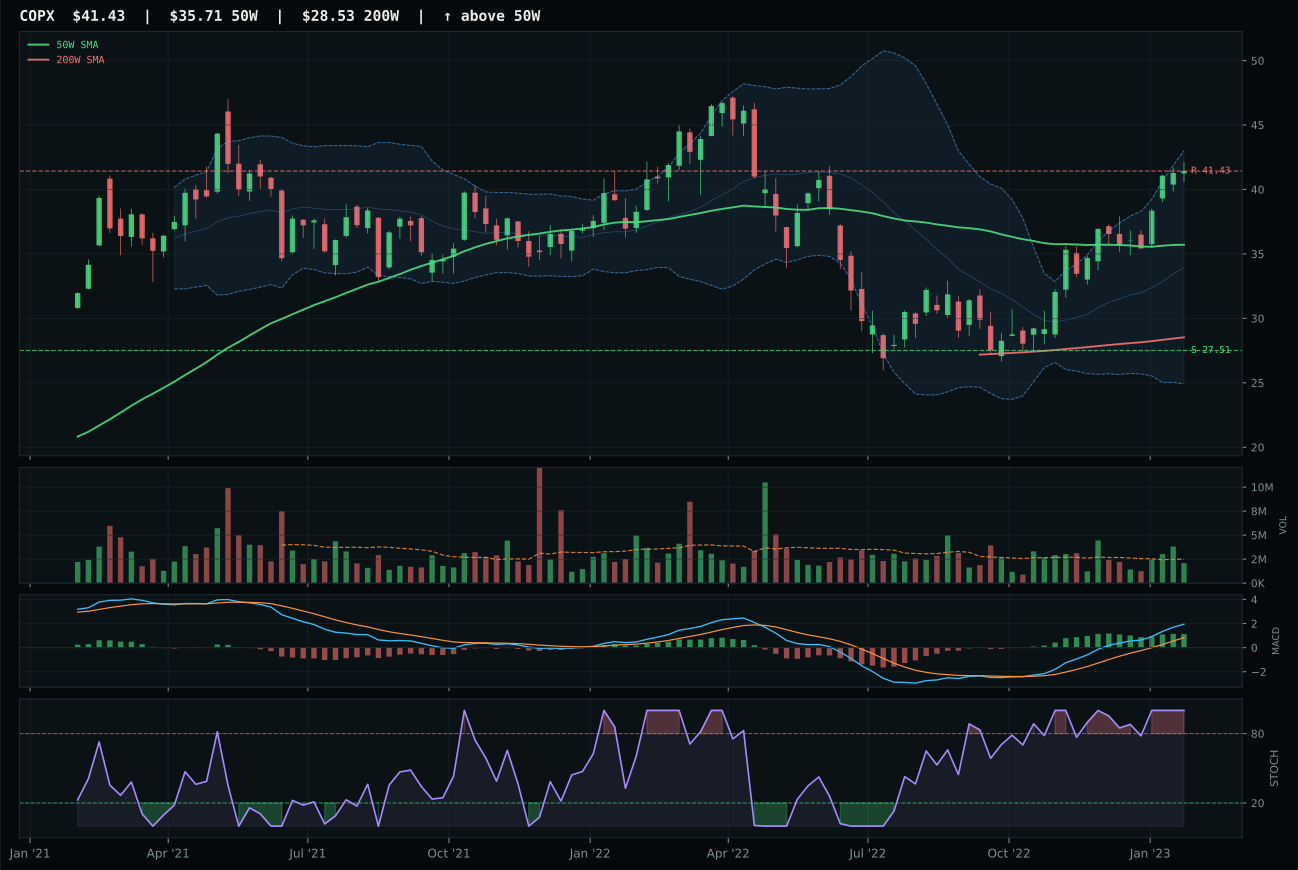
COPX has a vertical extension profile with 37.8% 13-week relative strength versus SPY.
A failed hold above support would weaken the setup.
Actionable but governed by invalidation levels.
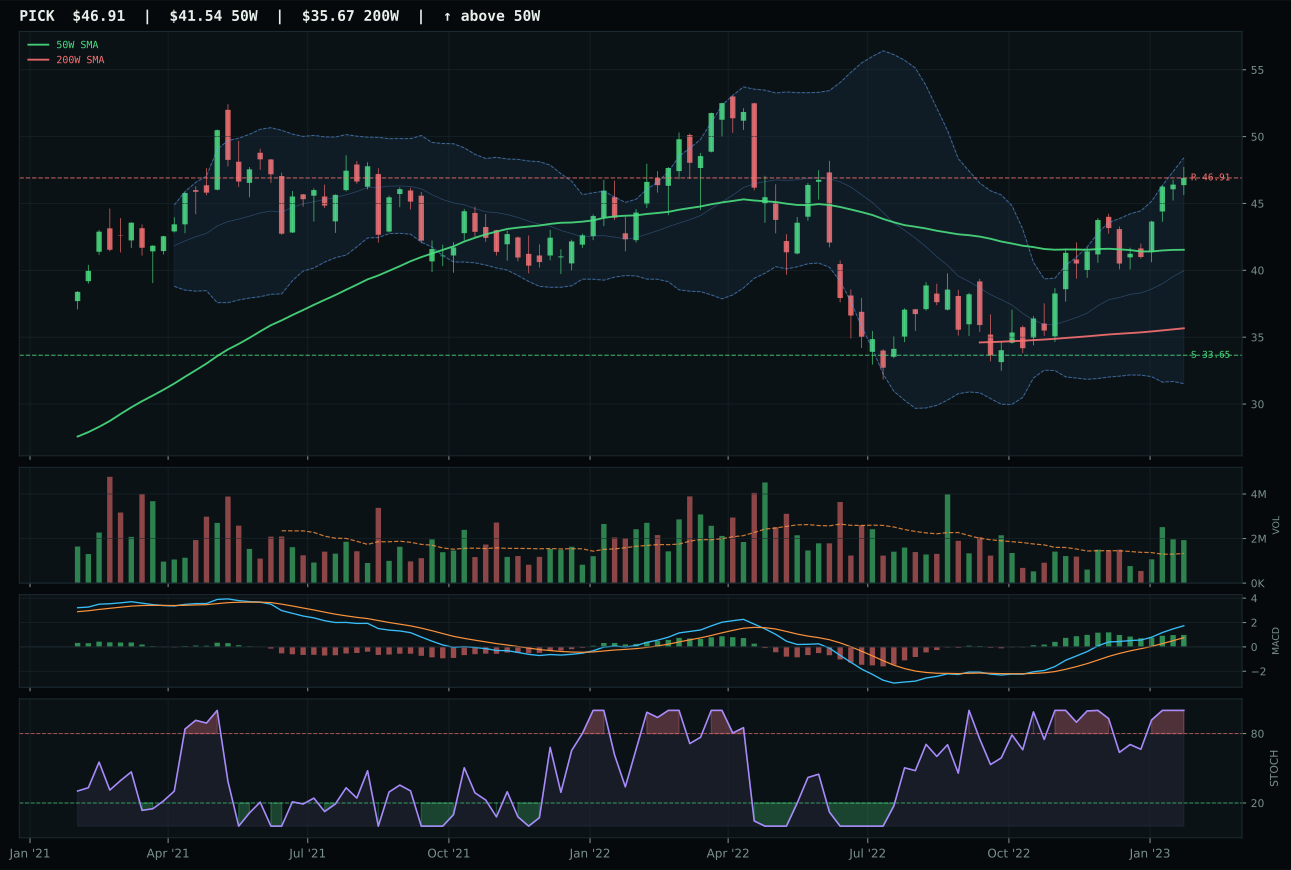
PICK has a neutral structure profile with 27.9% 13-week relative strength versus SPY.
A failed hold above support would weaken the setup.
Actionable but governed by invalidation levels.
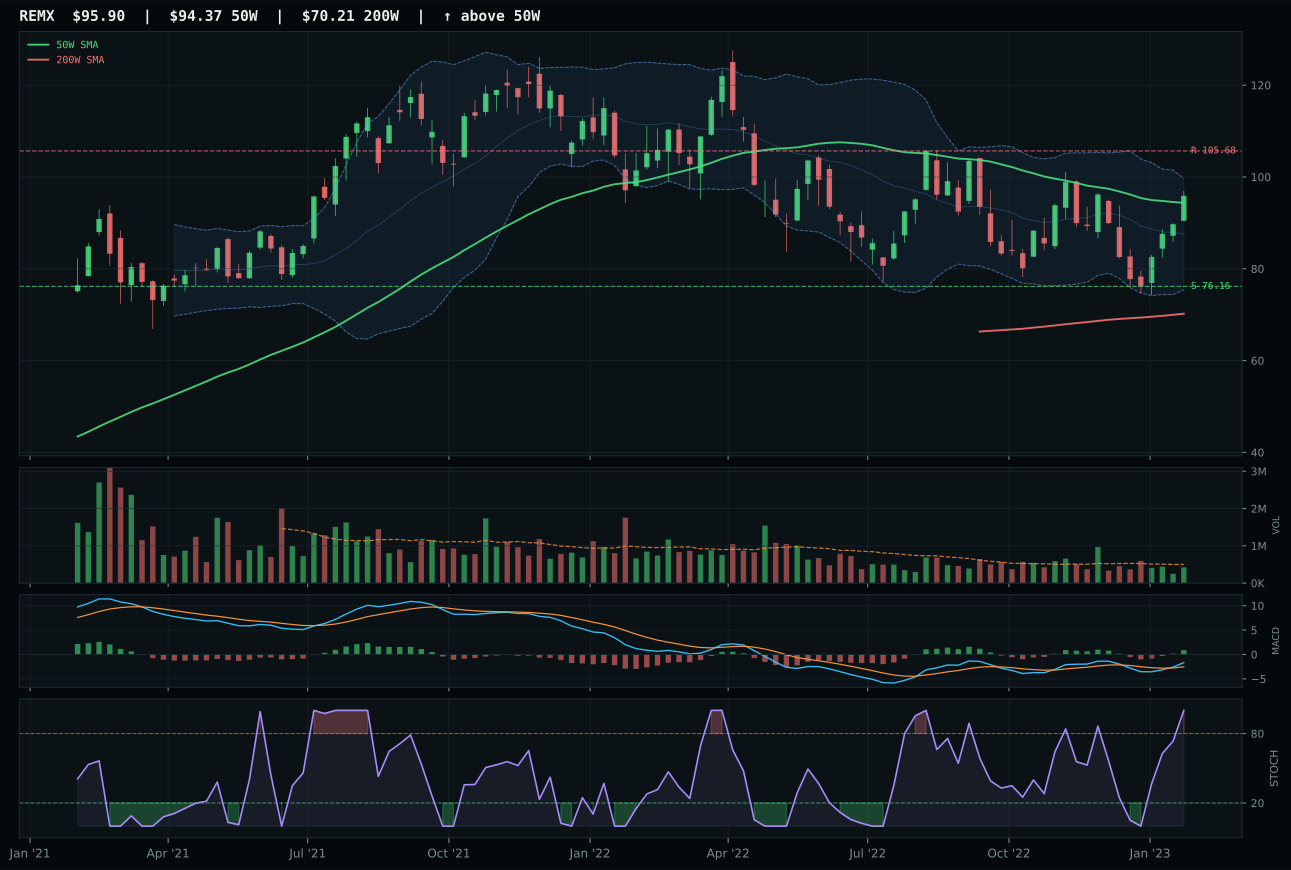
REMX has a compression near 50W profile with 7.9% 13-week relative strength versus SPY.
A failed hold above support would weaken the setup.
Actionable but governed by invalidation levels.
REMX won the category with the highest composite score of 81.6, despite finishing third in the reasoned ETF proof order, because its timing is flawless: a perfect 100.0 score at 1.6% distance from the 50W in true compression near the 0.618 Fibonacci level. The 12.1% thirteen-week return and 7.9% relative strength versus SPY are solid, paired with overbought momentum and improving MACD that signal the coil is real. COPX, by contrast, sits at 16.0% from the 50W in vertical extension with a timing score of only 45.0, meaning new buyers are late to the party and the risk asymmetry has flipped against them. COPX's superior momentum (42.1% return, 37.8% RS/SPY) is precisely the problem—every new buyer pays for the momentum already in the price. REMX's compression setup and perfect timing beat COPX's stretched extension by 12.1 points because geometric quality matters more than momentum magnitude at inflection points.
Industrial Metals earned 20% because it scored 81.6, the highest composite among all ten categories, powered by a macro fit of 75.0 that reflects Late-Cycle Reflation, metals scarcity, commodity breadth positive, and real asset sponsorship all firing in synchrony. The 3/2/1 weighted technical basket is formidable at 86.5 from COPX, with PICK and REMX adding breadth. REMX as the representative offers the cleanest entry point because it is coiling rather than extending, a technical edge that matters in a late-cycle environment where mean reversion is always lurking. The allocation at 20% reflects conviction in both macro and technicals: the rare-earth supply chain is genuinely constrained, capital is rotating into real assets, and REMX's setup suggests the trade has room to run before it exhausts. This is the portfolio's highest-conviction category bet.
Precious Metals — GLD
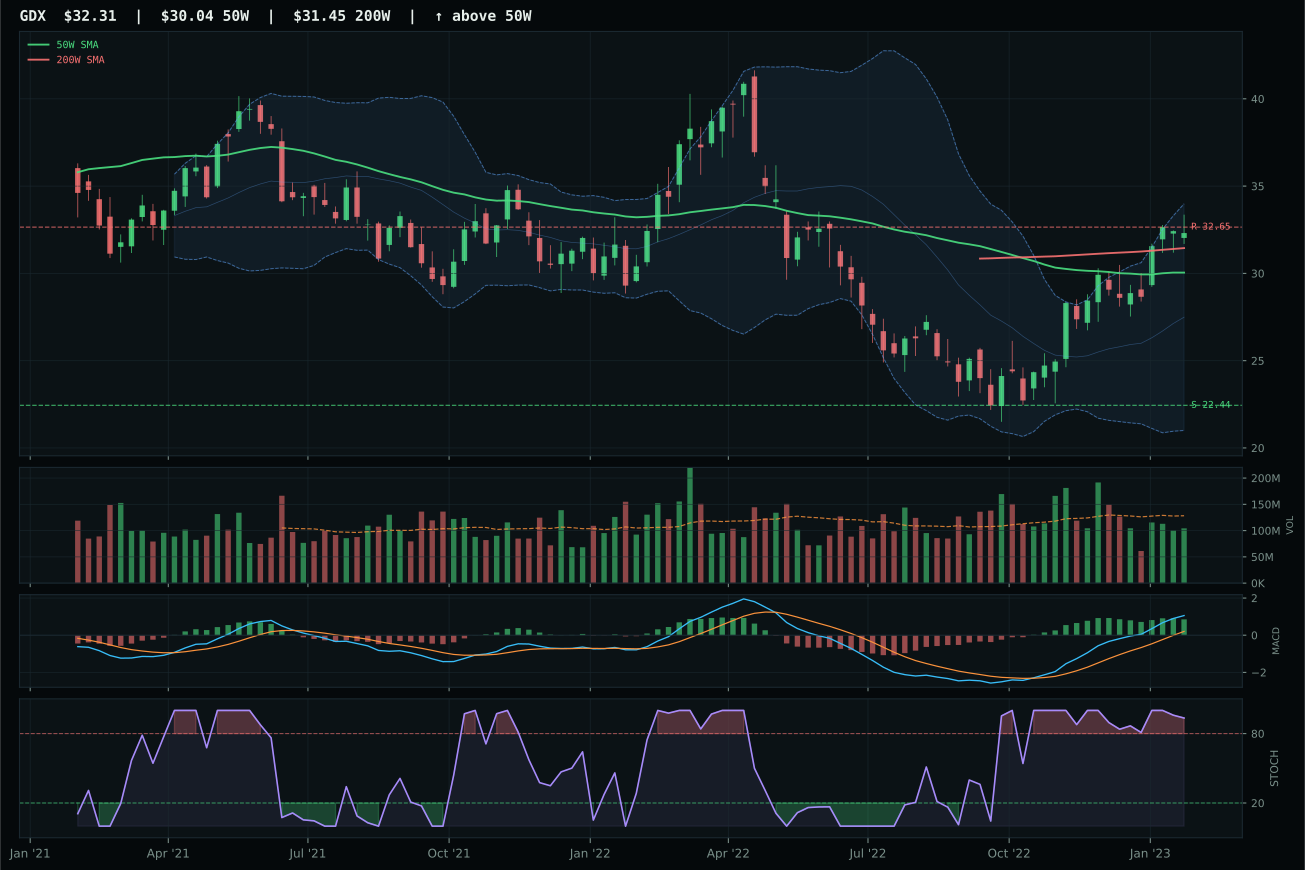
GDX has a neutral structure profile with 26.4% 13-week relative strength versus SPY.
A failed hold above support would weaken the setup.
Actionable but governed by invalidation levels.
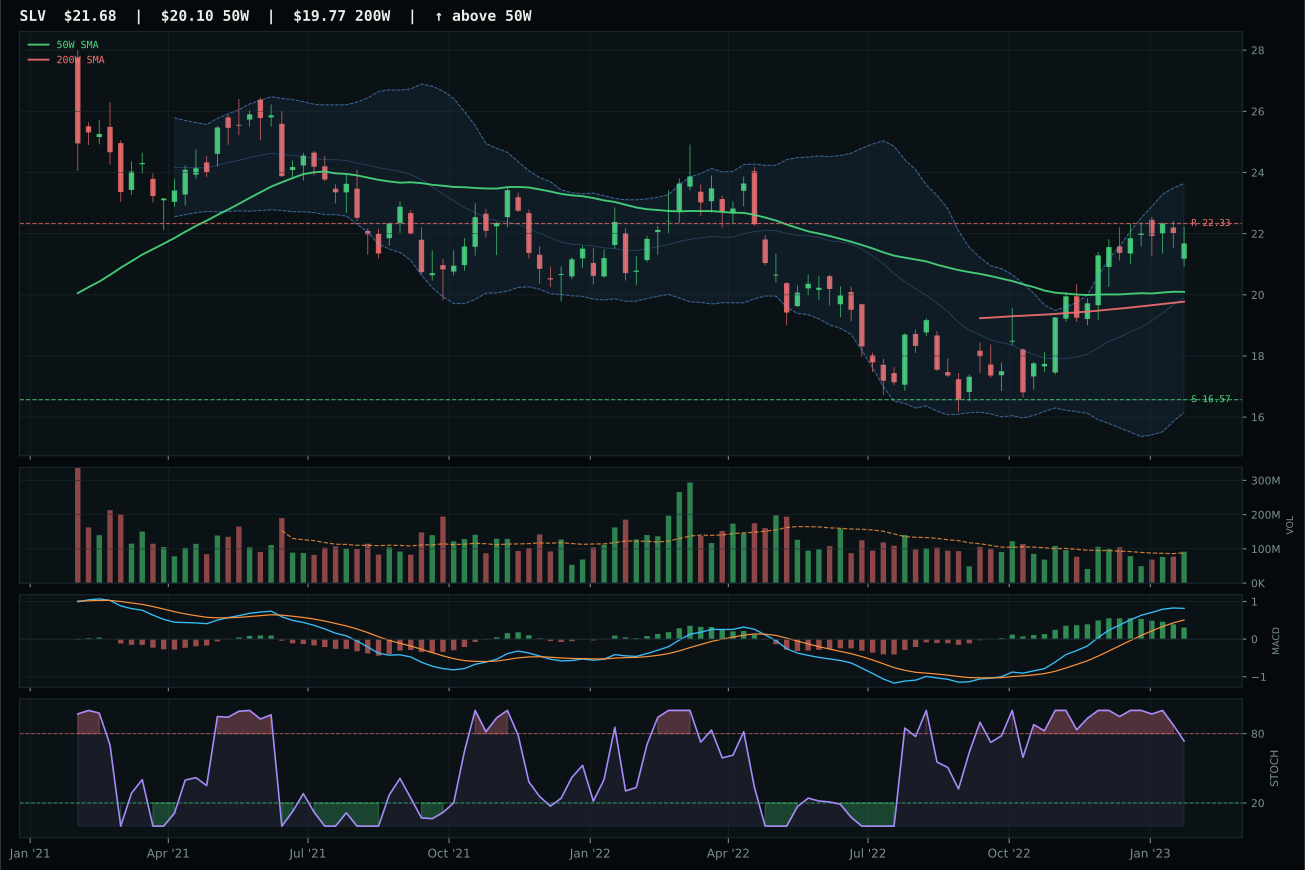
SLV has a neutral structure profile with 17.9% 13-week relative strength versus SPY.
A failed hold above support would weaken the setup.
Actionable but governed by invalidation levels.
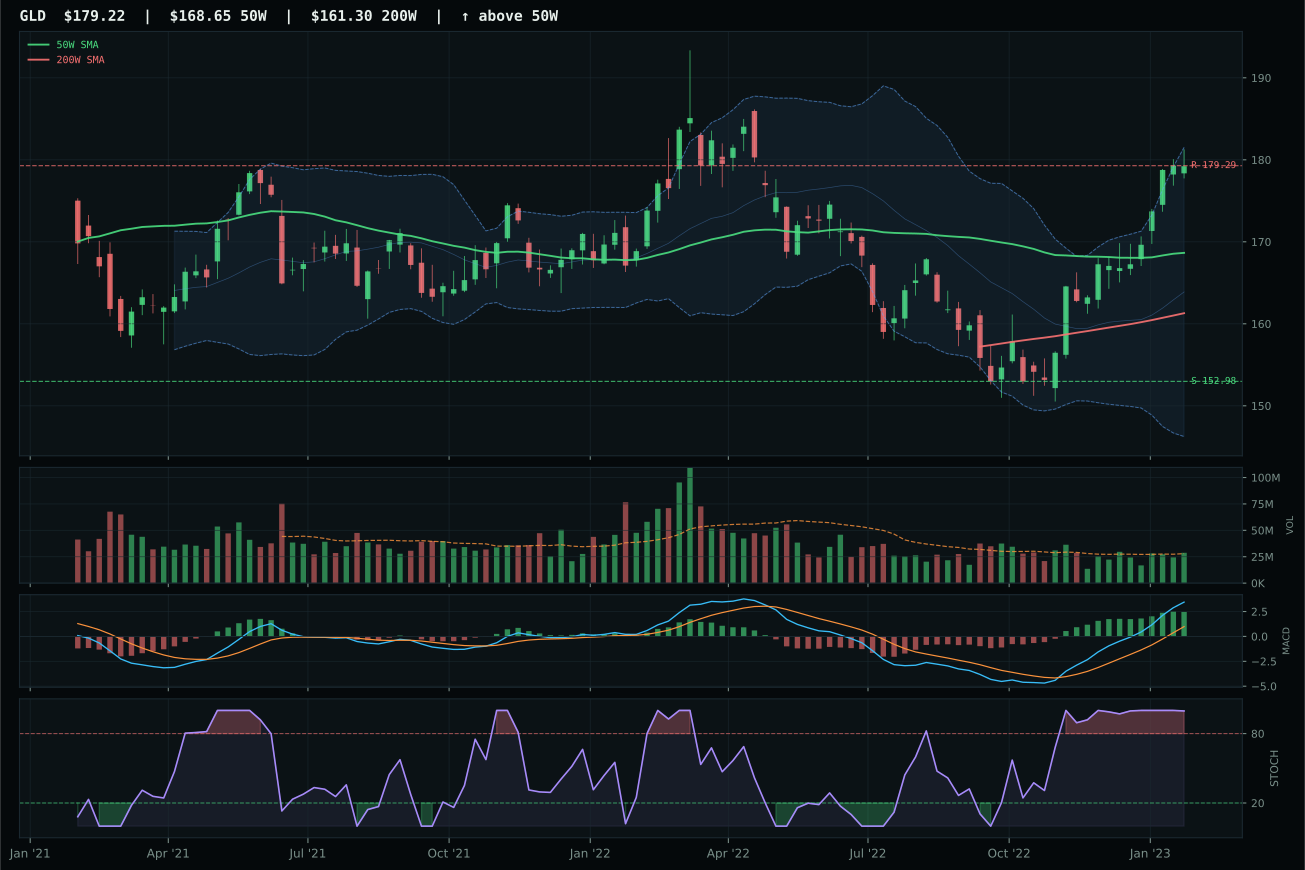
GLD has a neutral structure profile with 12.7% 13-week relative strength versus SPY.
A failed hold above support would weaken the setup.
Actionable but governed by invalidation levels.
GLD claimed the category despite a narrow 1.6-point lead over GDX because it delivered cleaner structure—78.3 versus 68.8—at a moment when chart geometry matters more than raw momentum magnitude. GLD's 17.0% thirteen-week return and 12.7% relative strength versus SPY are substantial, but the real edge is in the setup: GLD sits at 6.3% from the 50W with overbought stochastic RSI rolling over, a sign that the easy gains have been taken and consolidation is near. GDX is more explosive (30.7% thirteen-week, 26.4% RS/SPY) but overextended; at that vertical extension, new buyers are paying full price for leverage they may not need. Volume at 1.03x is neutral for both, but GLD's cleaner Fibonacci geometry (upper retracement/momentum zone) and lower structural noise score it as the safer representative in a category with strong macro sponsorship.
Precious Metals earned its 20% top-2 allocation because the category scored 69.2, making it the second-highest eligible final score, and because the macro fit of 60.0 is visibly powered by active monetary hedge bid (+14 weighting). In Late-Cycle Reflation, central banks are the marginal buyers of precious metals, and that bid is not discretionary—it is structural. The technical evidence from the 3/2/1 weighted basket (GDX, SLV, GLD) comes to 73.7, which is solid if not exceptional, but macro sponsorship tips the scales. Risk appetite positive carries a negative four weighting here, a warning that reflation trades can reverse fast if sentiment shifts, yet the fourteen-point monetary hedge bid is strong enough to anchor the position. GLD as the representative offers a clean entry point to ride monetary flows without the beta amplification of miners; the allocation reflects confidence in the macro case backed by acceptable technical quality.
AI — SMH
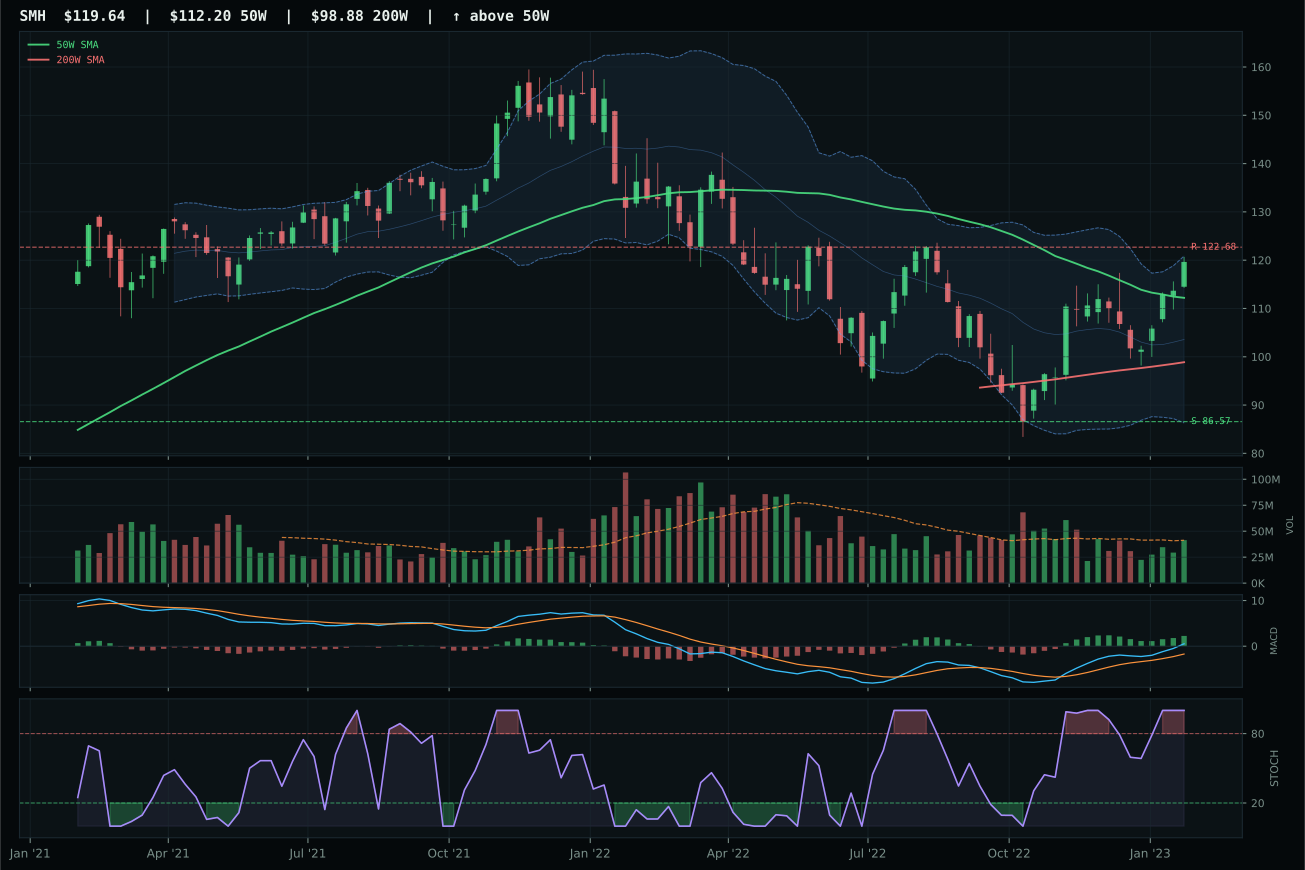
SMH has a neutral structure profile with 19.8% 13-week relative strength versus SPY.
A failed hold above support would weaken the setup.
Actionable but governed by invalidation levels.
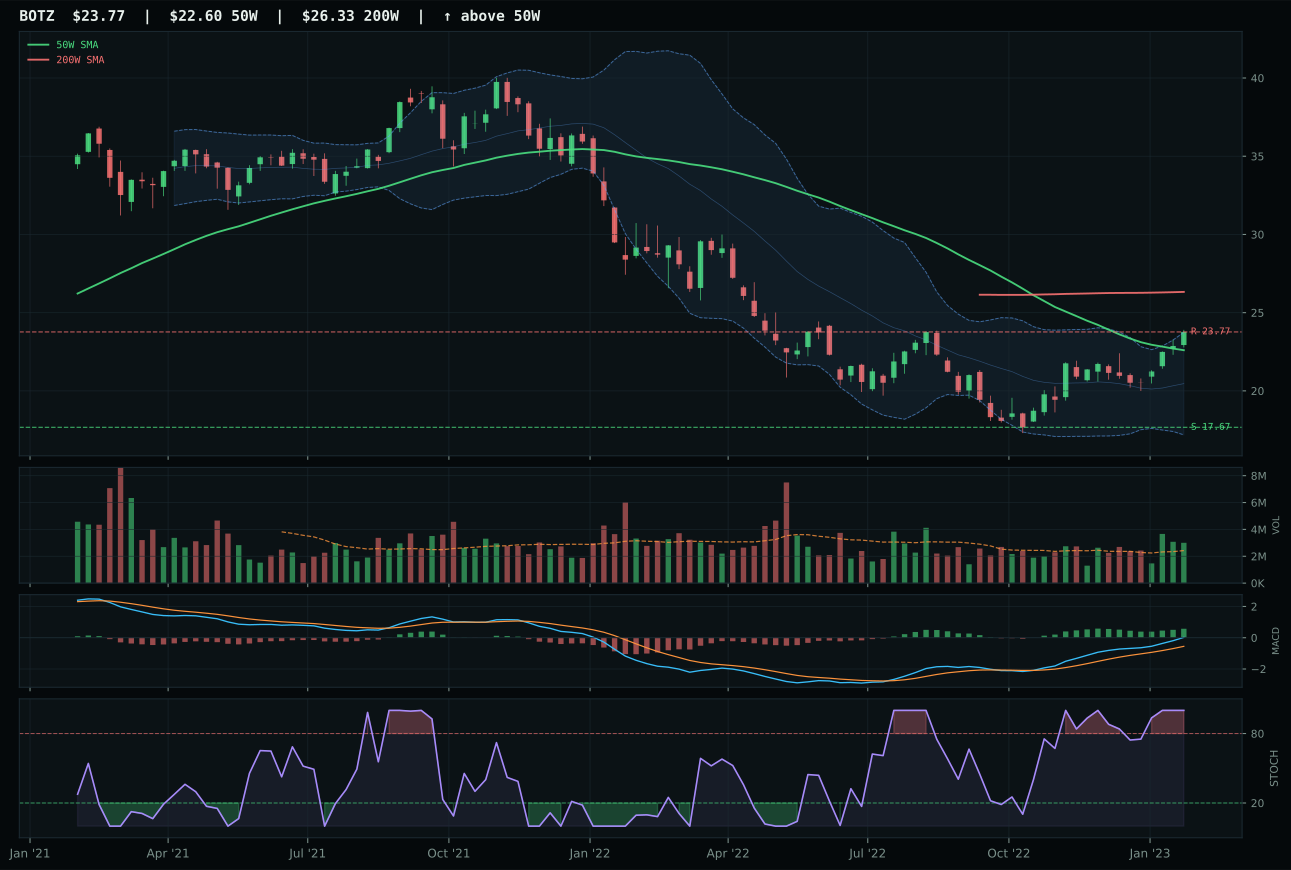
BOTZ has a neutral structure profile with 15.9% 13-week relative strength versus SPY.
A failed hold above support would weaken the setup.
Actionable but governed by invalidation levels.
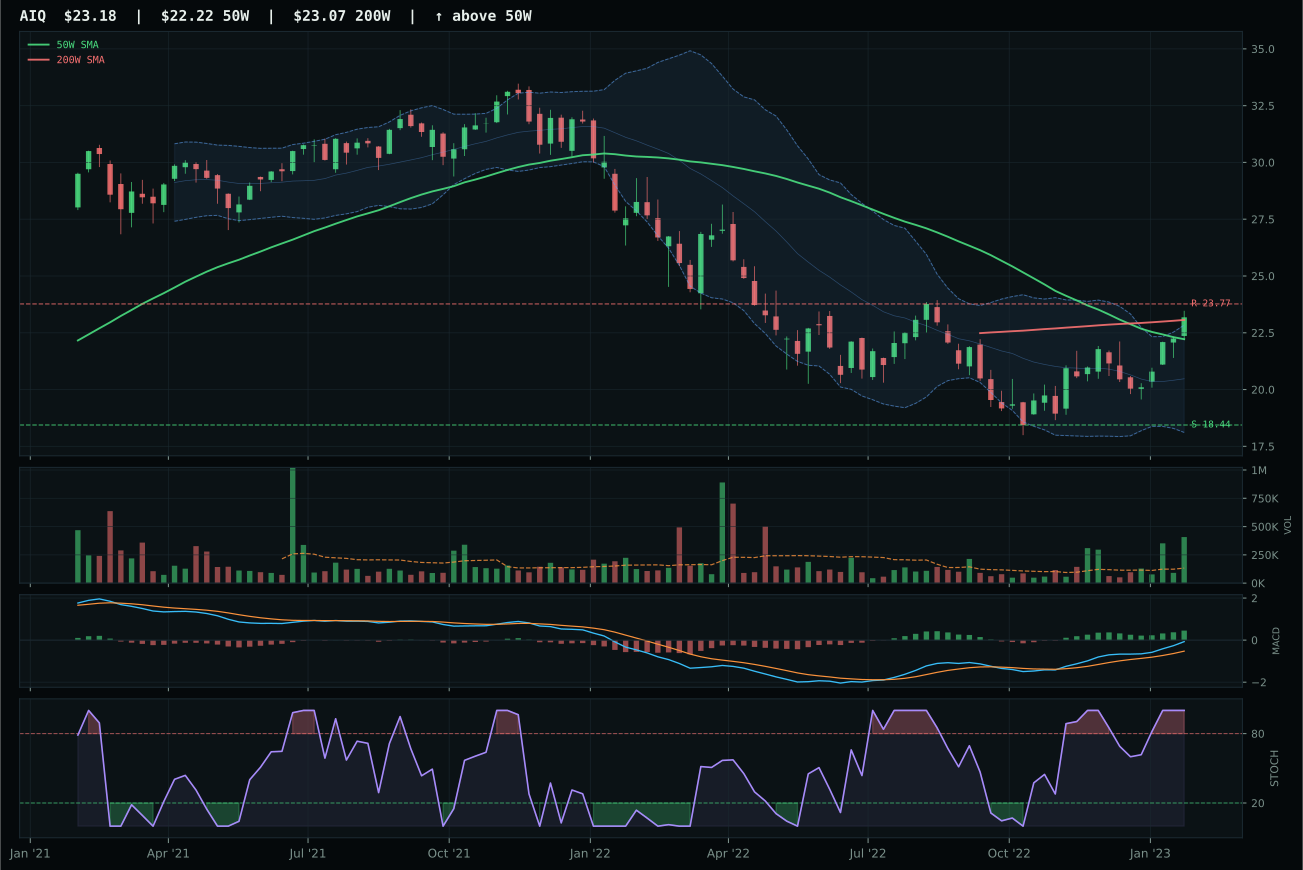
AIQ has a neutral structure profile with 13.1% 13-week relative strength versus SPY.
A failed hold above support would weaken the setup.
Tracked, but not top-2 eligible because: .
SMH wins on pure momentum confirmation: a 100.0 timing score, 24.1% thirteen-week return, and 19.8% relative strength versus SPY place this semiconductor play at the center of AI infrastructure demand. The setup is neutral structure at 6.6% from the 50W, which prevents overextension yet allows a 78.4% volume-price confirmation score to prove that big money is accumulating, not rotating. BOTZ came within 2.6 points but lost on timing (75.0 vs. 82.0) and category-relative strength (0.0% vs. 3.9%), a gap that reveals robotics lacks the near-term supply-chain tailwinds that semiconductor makers enjoy. Stochastic RSI overbought in both, but SMH's improving MACD and persistent breadth suggest the momentum is sponsored, not exhausted.
AI scores 62.1, securing the third-highest category rank but missing the top-2 cut, which means 10% allocation rather than 20%. The macro fit score of 54.0 is respectable—AI growth sponsorship carries a plus-fourteen weighting, and risk appetite positive adds ten—yet liquidity stress and credit stress each claw back points. Late-Cycle Reflation in an environment of tight credit and liquidity constraints means even AI has a ceiling; capital is available, but flows are selective. SMH's technical evidence is rock-solid at 88.0, but the category cannot overcome the macro headwind that pushes composite rank below the two leaders (Industrial Metals and Precious Metals). Reallocation to 20% would require either a meaningful de-risking of credit stress or a widening of the AI sponsorship bid beyond semiconductors.
Utilities & Infrastructure — PAVE
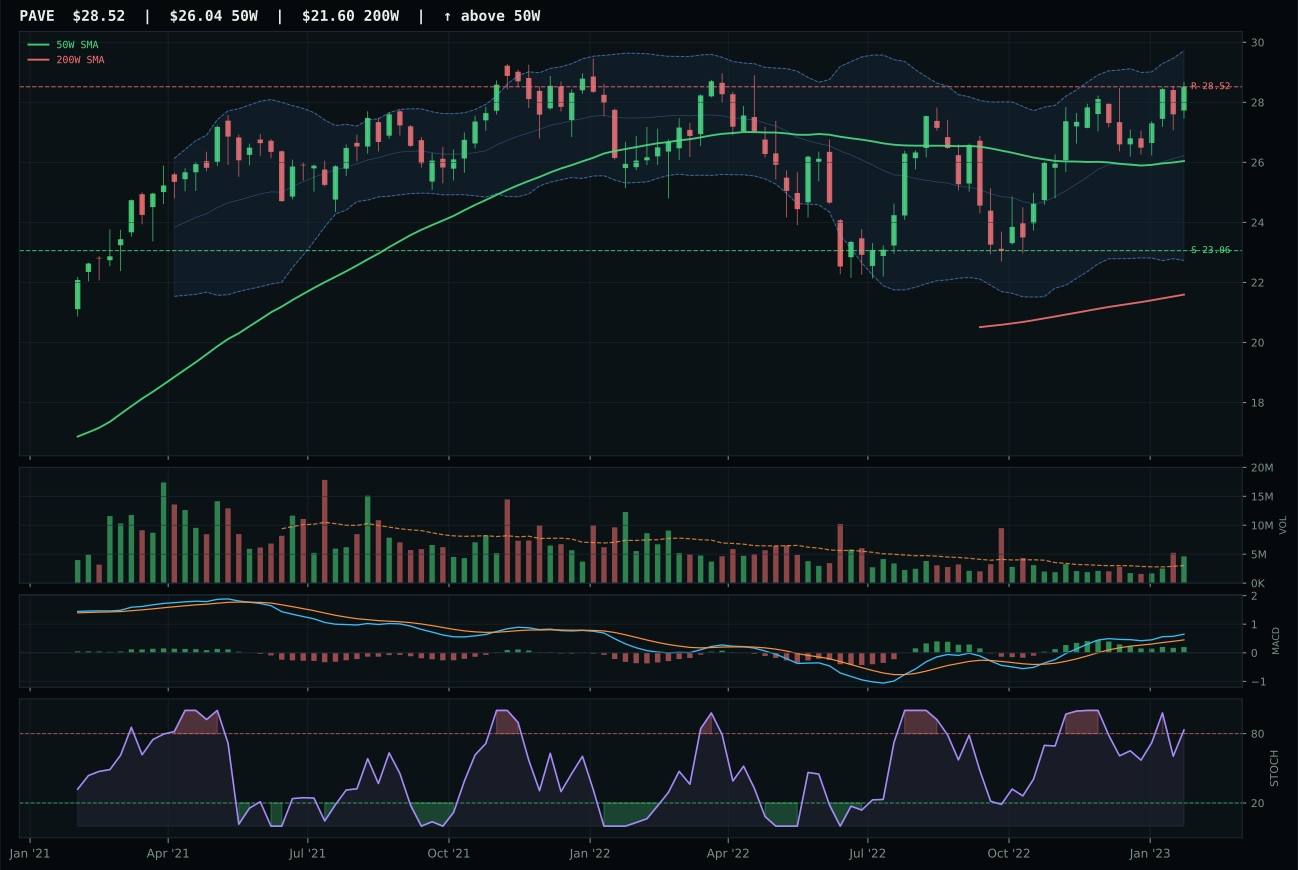
PAVE has a neutral structure profile with 5.5% 13-week relative strength versus SPY.
A failed hold above support would weaken the setup.
Actionable but governed by invalidation levels.
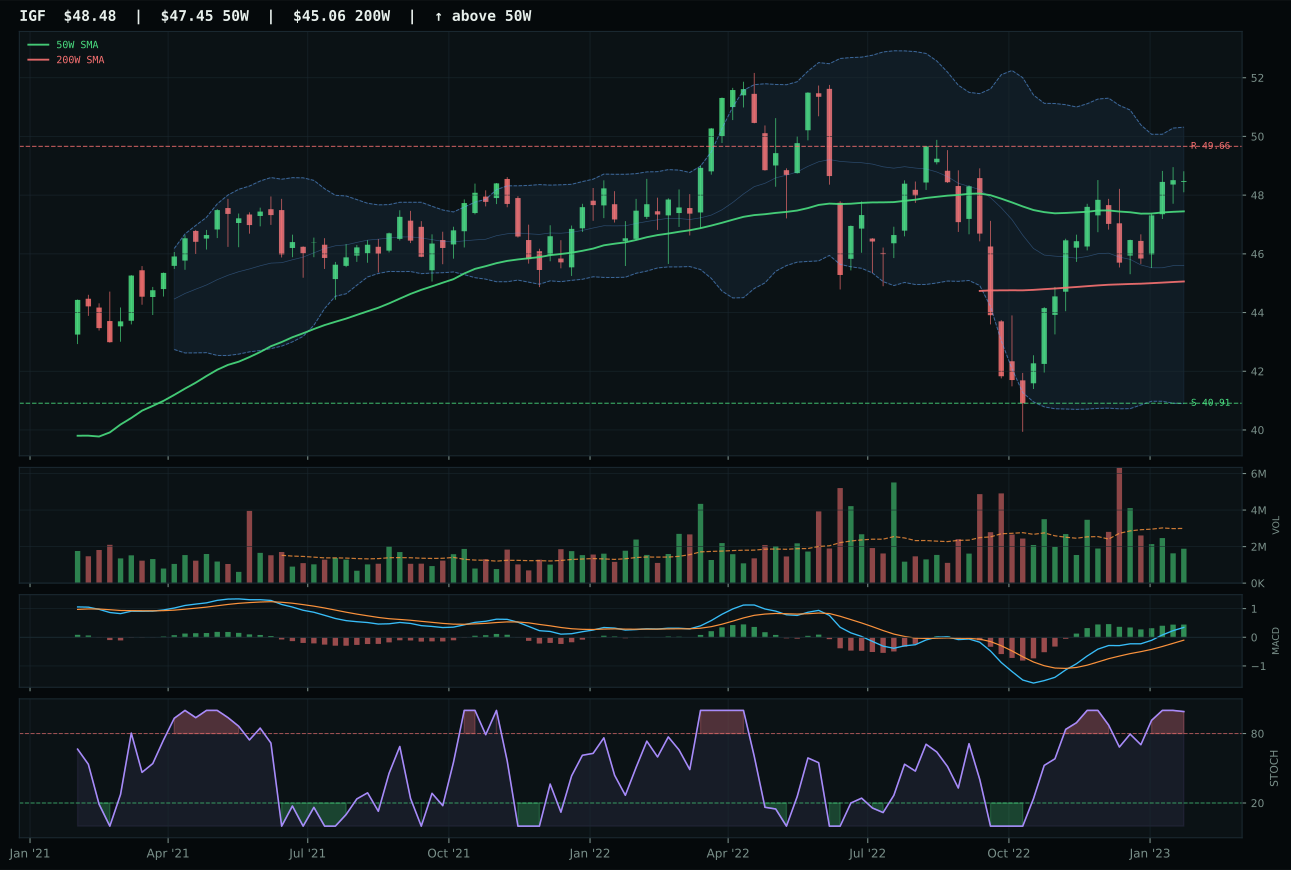
IGF has a compression near 50W profile with 5.5% 13-week relative strength versus SPY.
A failed hold above support would weaken the setup.
Actionable but governed by invalidation levels.
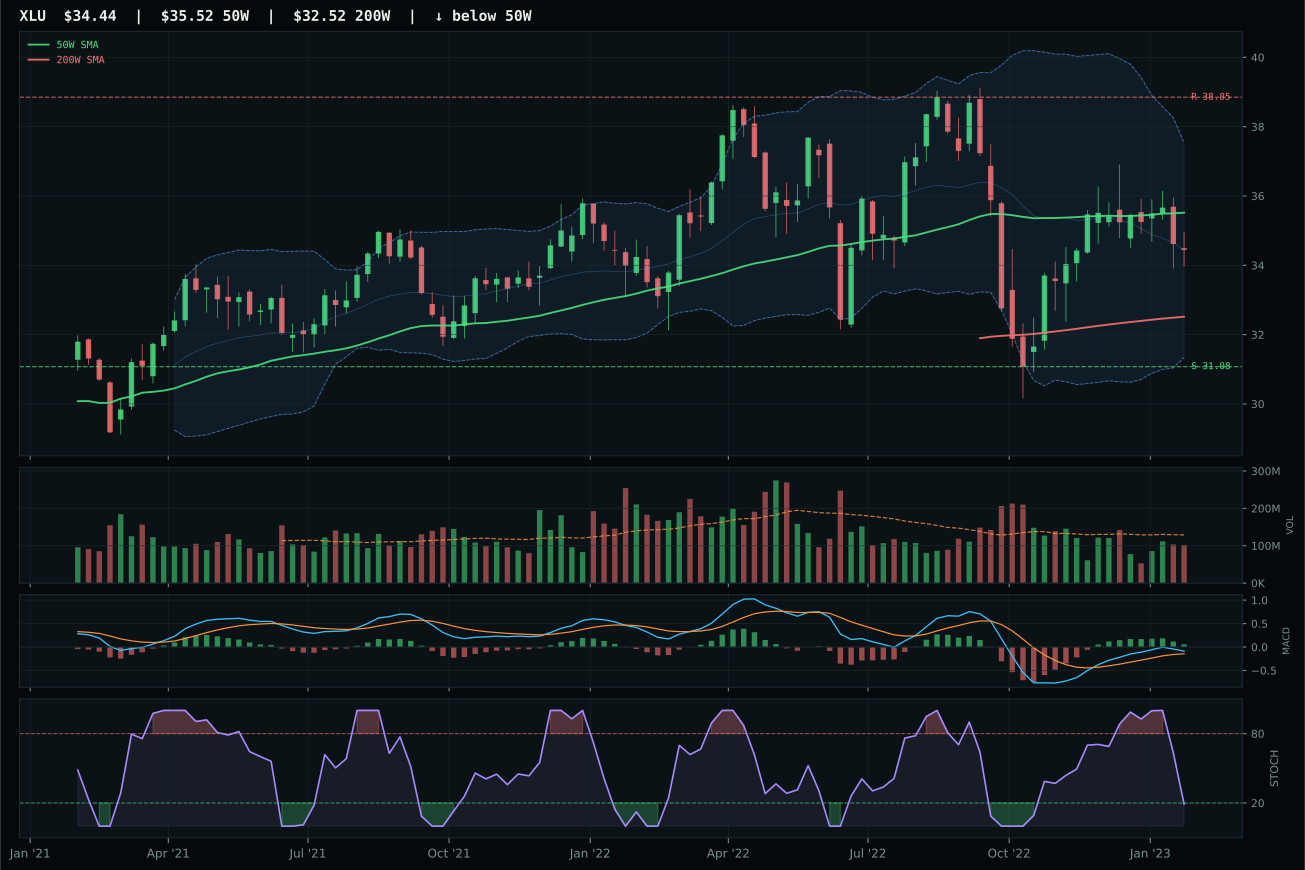
XLU has a neutral structure profile with -2.1% 13-week relative strength versus SPY.
A failed hold above support would weaken the setup.
Actionable but governed by invalidation levels.
PAVE wins with the highest technical composite in the entire portfolio—97.9—because it combines perfect trend (100.0) with the cleanest volume-price confirmation: 93.3 from above-average 1.53x participation paired with improving MACD and overbought momentum that feels muscular rather than exhausted. IGF loses on structure (79.9 vs 73.2) and volume (93.3 vs the runner-up's thin participation), meaning PAVE's move is being accumulated while IGF's is being distributed. At 9.5% from the 50W, PAVE is extended but nowhere near stretched, and the near 52W high / extension Fibonacci zone suggests room remains if buyers hold the line. Risk/reward is tight (48.1 vs 47.3), a warning that upside is limited, but the volume confirmation is so strong that PAVE's move feels sponsored rather than rotational.
Utilities & Infrastructure scores 60.6, tying for fourth with Nuclear Energy but earning 10% because the macro fit is weak at 49.0—no single descriptor strongly favors this category, and Transition/Mixed carries only a plus-four weighting. PAVE's technical excellence (97.9) cannot overcome the macro indifference; in Late-Cycle Reflation, domestic infrastructure plays benefit from capex cycles but face rate headwinds that neutralize the bid. The allocation reflects PAVE's structural quality (trend, volume, momentum all clean) without betting on macro acceleration. To earn 20%, utilities would need either a visible yield-market shock that drives capital into dividend yields, or a meaningful deterioration in risk appetite that sends money toward defensive names. For now, the 10% reflects a clean technical setup (momentum 100, volume-price 93.3) without a macro catalyst to justify larger capital.
Defense & Aerospace — XAR
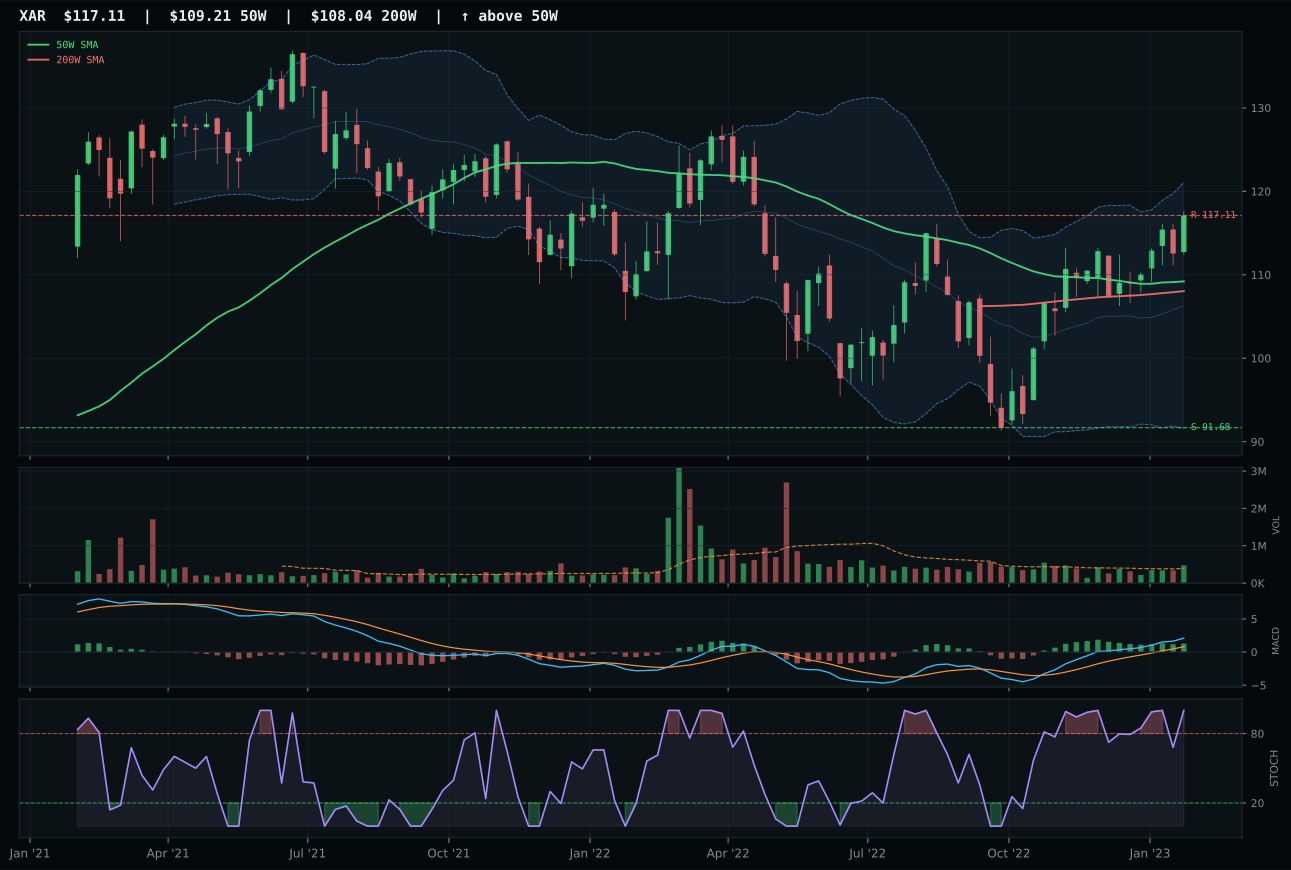
XAR has a neutral structure profile with 5.6% 13-week relative strength versus SPY.
A failed hold above support would weaken the setup.
Actionable but governed by invalidation levels.
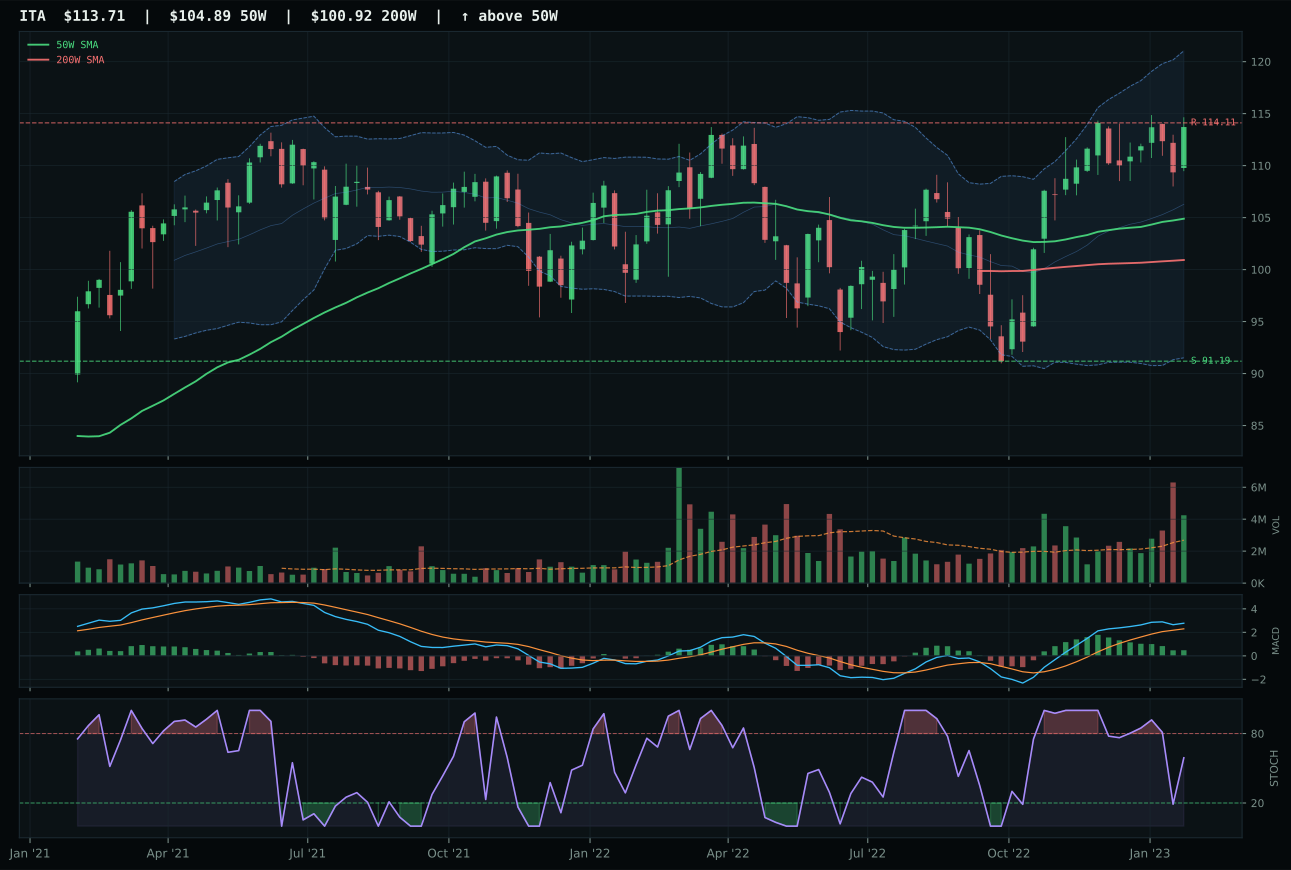
ITA has a neutral structure profile with 1.4% 13-week relative strength versus SPY.
A failed hold above support would weaken the setup.
Actionable but governed by invalidation levels.
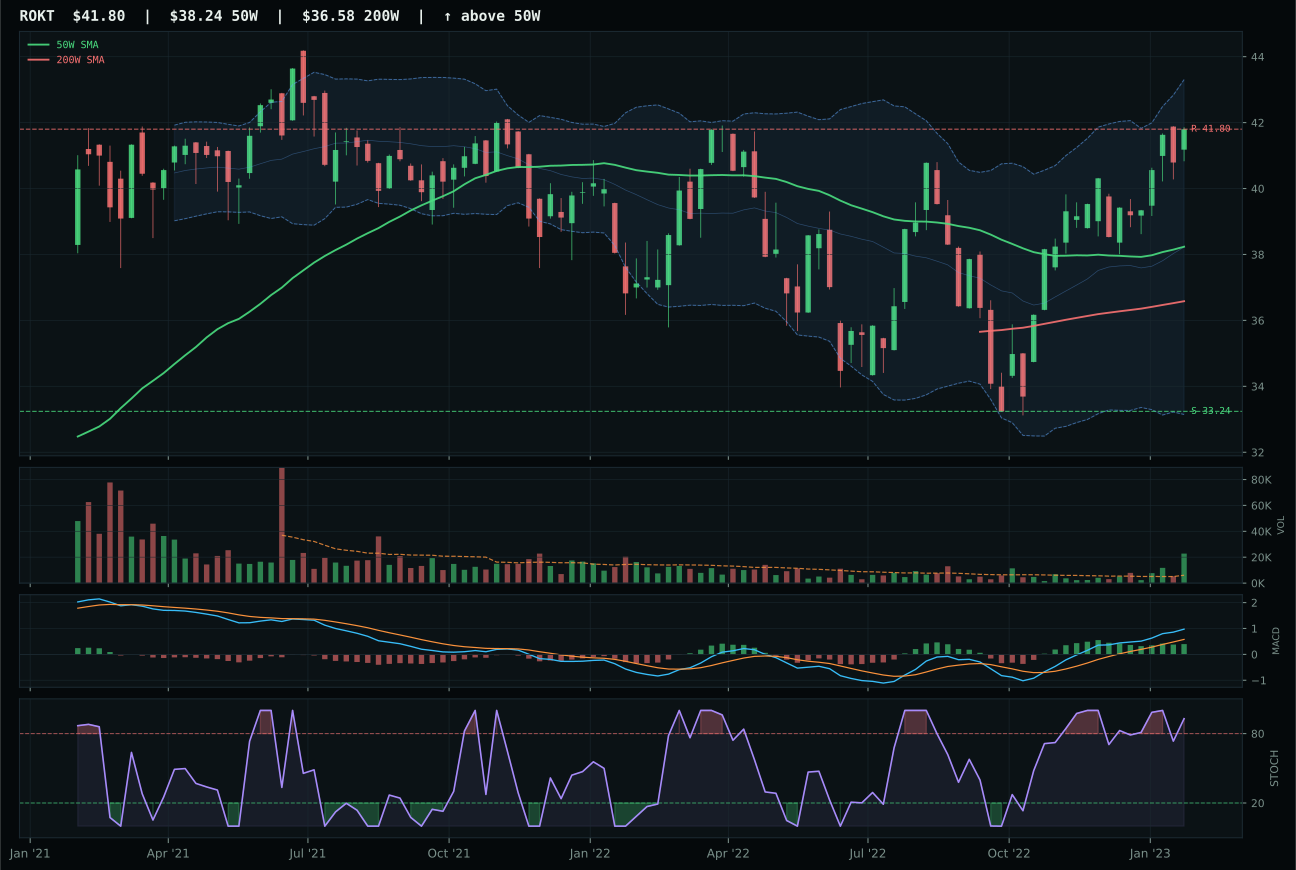
ROKT has a neutral structure profile with 5.3% 13-week relative strength versus SPY.
A failed hold above support would weaken the setup.
Tracked, but not top-2 eligible because: .
XAR wins because it is the only representative in this category that delivers perfect trend confirmation: price above both the 50W and 200W, with a 50W slope of plus 0.1% showing the moving average itself is turning up. The 5.6% relative strength versus SPY is modest but real, paired with above-average 1.22x volume participation that proves accumulation is happening in the hands of institutions. ITA stumbled on momentum—its MACD is bullish but flattening, a warning sign that sellers are entering—while risk/reward shifted from 50.2 to 42.3, putting upside at the resistance line. The 8.5-point gap to the runner-up reflects a clear technical hierarchy: XAR is trending with sponsorship, ITA is rolling over.
Defense & Aerospace earned 10% because its 60.2 composite score places it sixth, pushed down by a macro fit of only 57.0 and a Late-Cycle Reflation regime that offers modest tailwinds but no explosive catalyst. XAR's technical evidence is pristine at 88.8, yet the category macro profile is neutral—no specific descriptor strongly favors defense in a reflation that privileges commodities and real assets more visibly. The setup is tradable (trend 100, momentum 96.4), but late-cycle dynamics suggest defense is a second-half trade, not a current crowding opportunity. To reach 20%, the category would need either a visible credit stress or liquidity stress spike that sends capital fleeing toward perceived safety, or a clear weakening in commodity momentum that causes a rotation out of REMX and GLD into defensive names. For now, it holds 10% as a structural hedge with acceptable technical footing.
Nuclear Energy — URNM
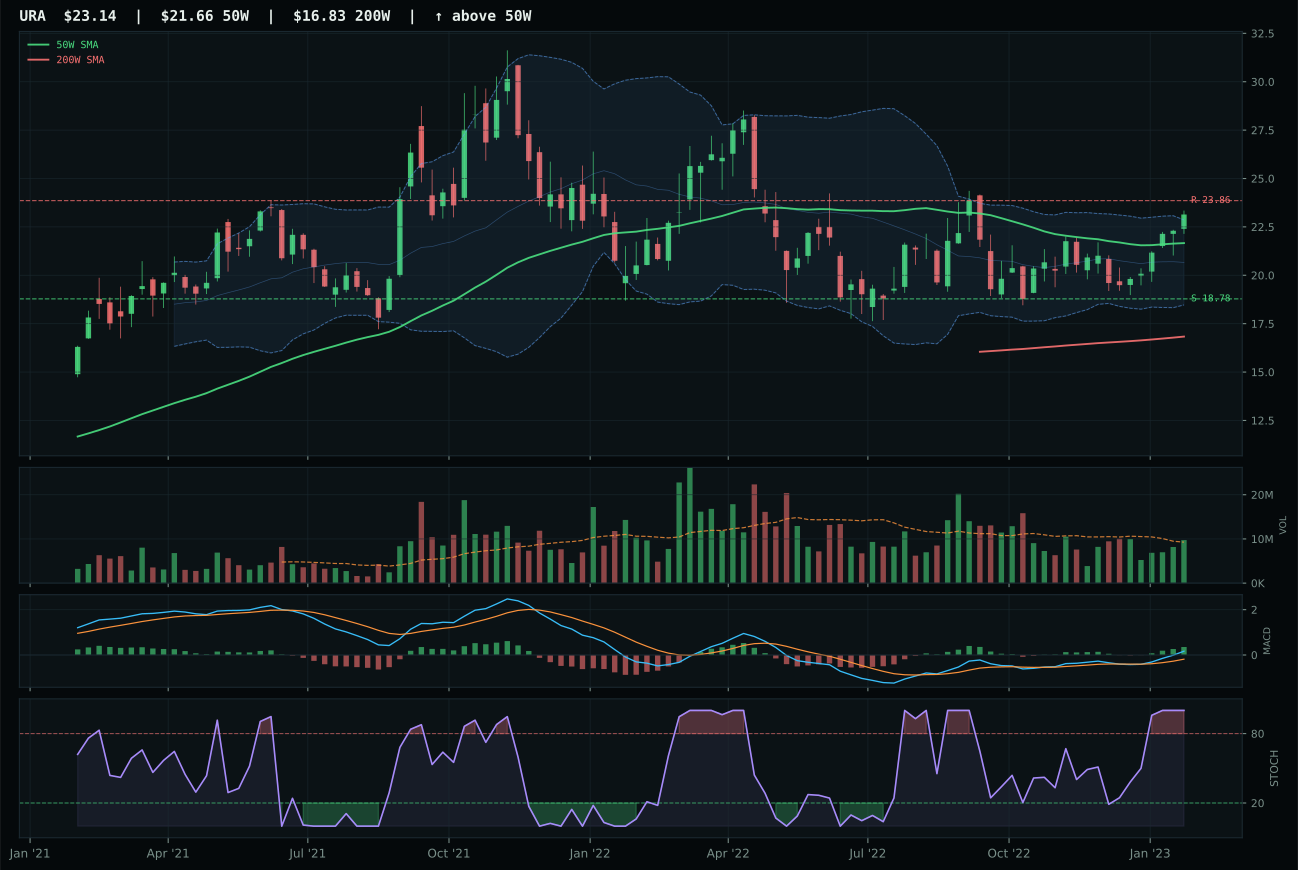
URA has a neutral structure profile with 7.7% 13-week relative strength versus SPY.
A failed hold above support would weaken the setup.
Actionable but governed by invalidation levels.
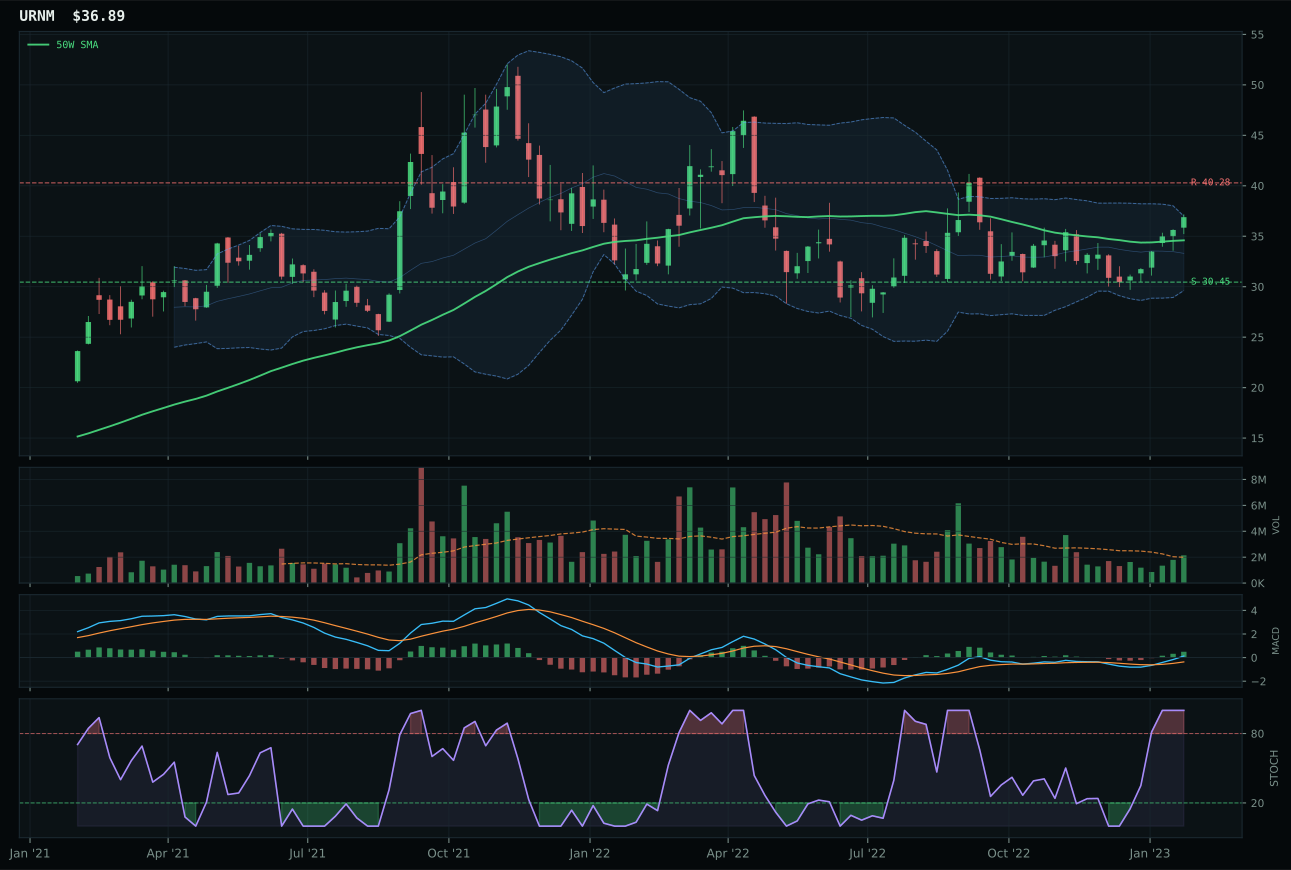
URNM has a neutral structure profile with 2.4% 13-week relative strength versus SPY.
A failed hold above support would weaken the setup.
Actionable but governed by invalidation levels.
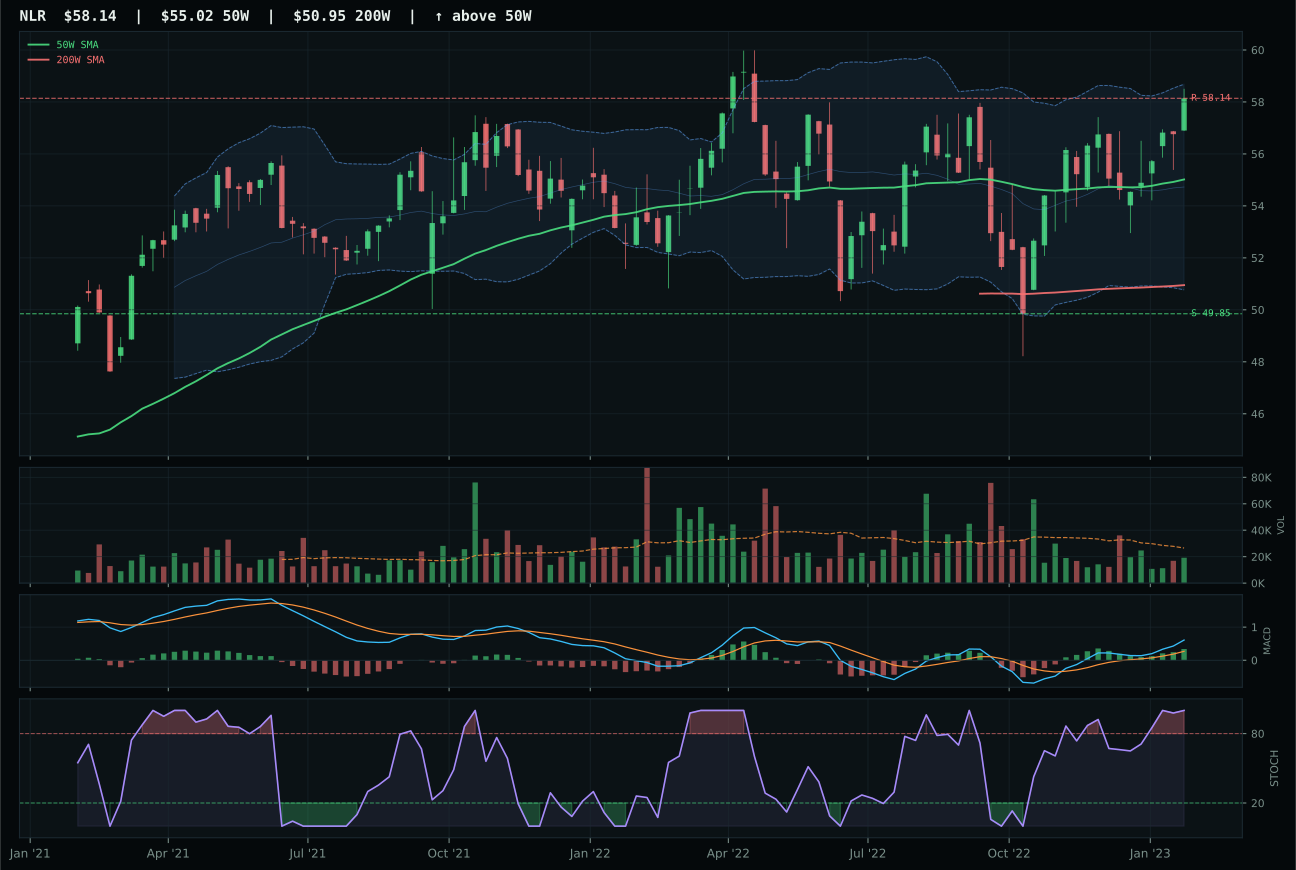
NLR has a neutral structure profile with 2.6% 13-week relative strength versus SPY.
A failed hold above support would weaken the setup.
Tracked, but not top-2 eligible because: .
URNM wins over URA on risk/reward geometry: 60.2 versus 55.3—a small edge that reflects URNM's superior downside support at 21.1% below current price versus URA's undefined setup. Both are below the 200W, which is a structural caution, but URNM sits at 6.6% from the 50W in middle retracement/decision zone, while URA is already in the upper zone. URNM's momentum confirmation is perfect at 100.0, driven by a 16.2% four-week return and 6.7% thirteen-week return, paired with neutral volume at 1.08x—accumulation without euphoria. URA has stronger absolute returns (11.9% thirteen-week) and higher RS/SPY (7.7%), but those are extended gains, not new sponsorship. The gap is narrow (8.8 points) because both names are viable, but URNM's defensive positioning in a compressed setup beats URA's extended posture.
Nuclear Energy scores 59.2, placing it fifth but earning only 10% because the macro fit is 57.0—modest despite Late-Cycle Reflation, real asset sponsorship, and AI growth sponsorship all being active. Technical evidence of 79.9 is respectable, yet it is the second-highest tech score among non-top-2 categories, suggesting that nuclear has clean technicals but weak macro tailwinds relative to metals. The risk/reward profile is balanced (60.2), which is neither exciting nor dangerous, and URNM's positioning below the 200W means this is a recovery trade rather than a breakout. To earn 20%, nuclear would need either a visible energy-supply crisis or a meaningful shift in central-bank policy toward clean energy infrastructure spending; for now, it is a value-and-income holding with decent optionality but no catalyst in sight.
Agriculture & Livestock — VEGI
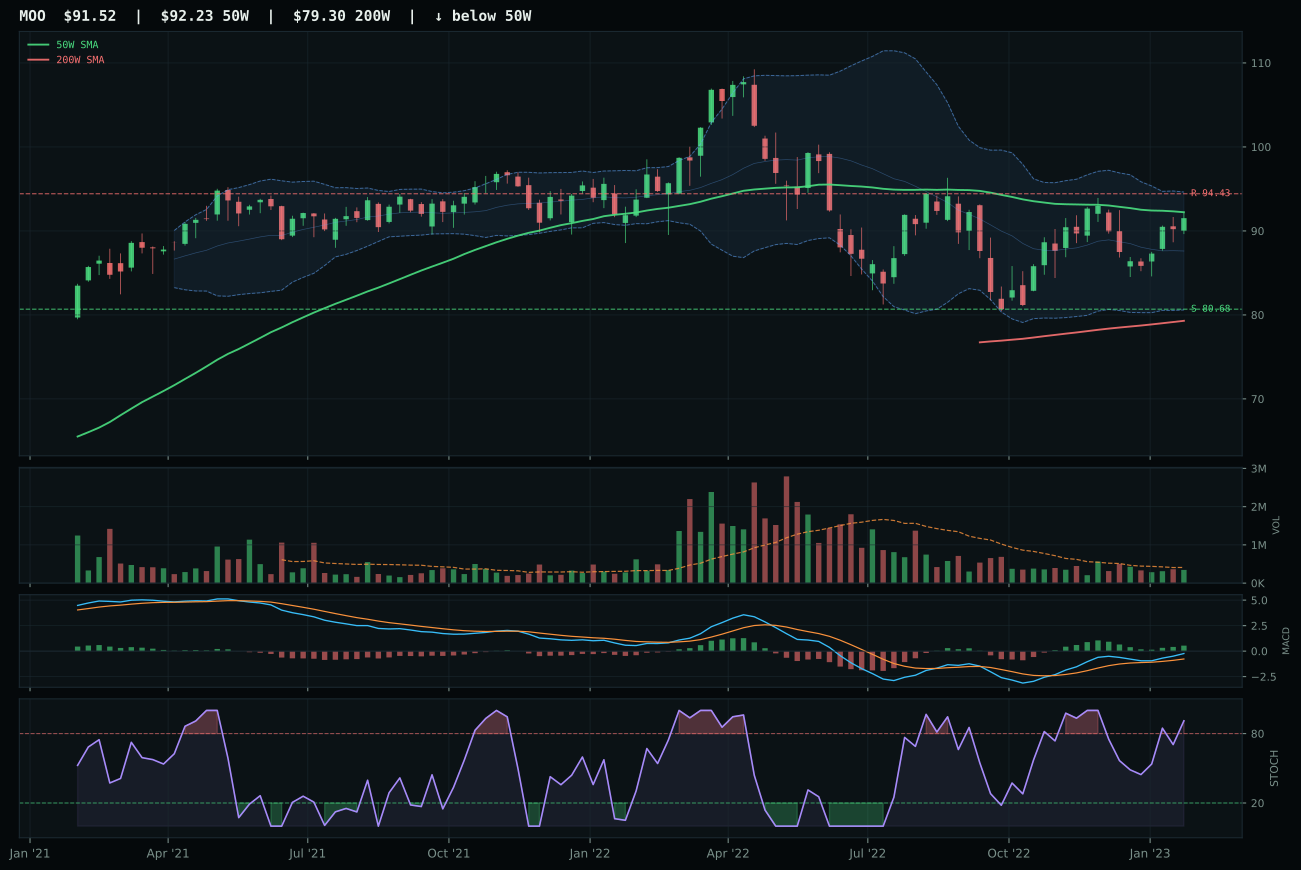
MOO has a compression near 50W profile with -1.0% 13-week relative strength versus SPY.
A failed hold above support would weaken the setup.
Actionable but governed by invalidation levels.
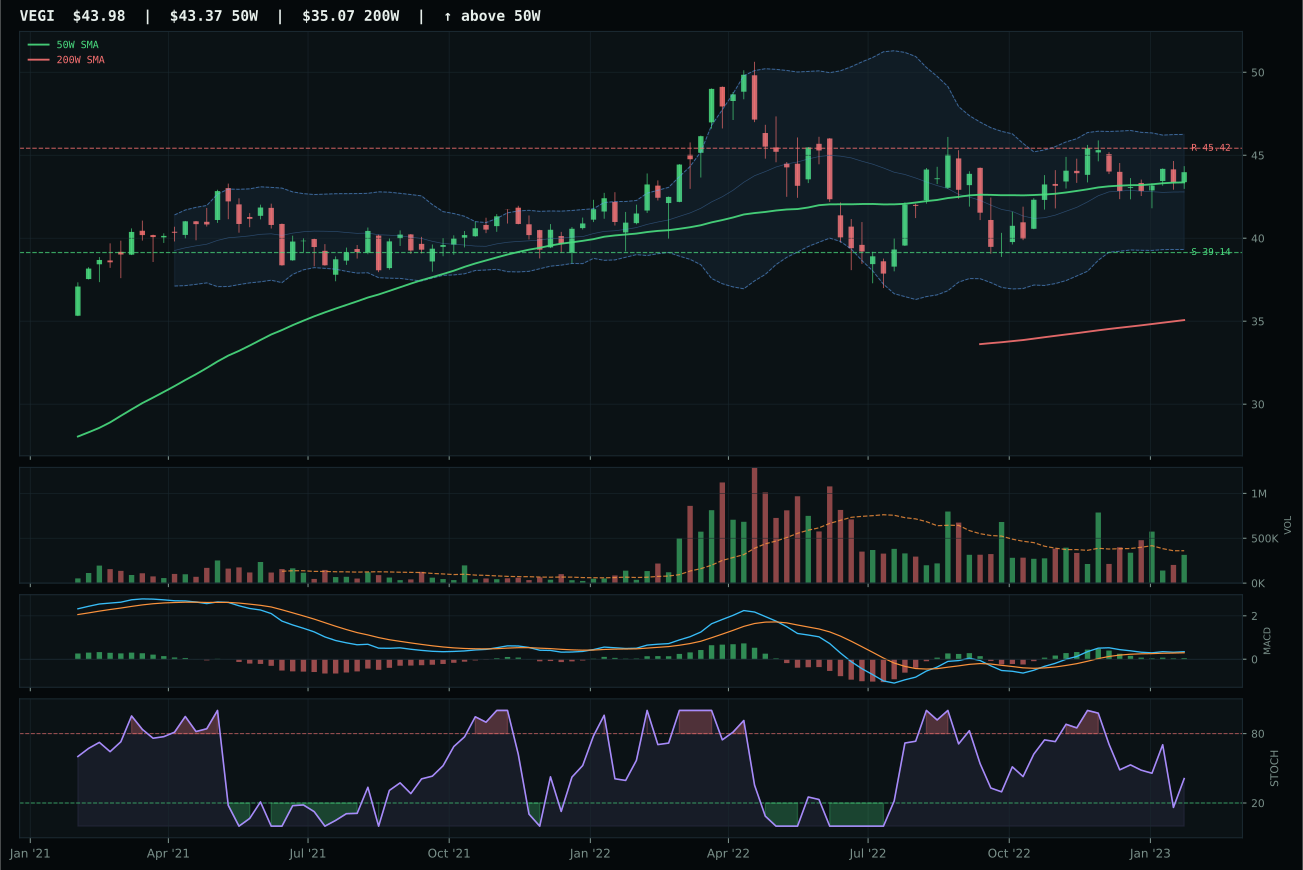
VEGI has a compression near 50W profile with -2.6% 13-week relative strength versus SPY.
A failed hold above support would weaken the setup.
Actionable but governed by invalidation levels.
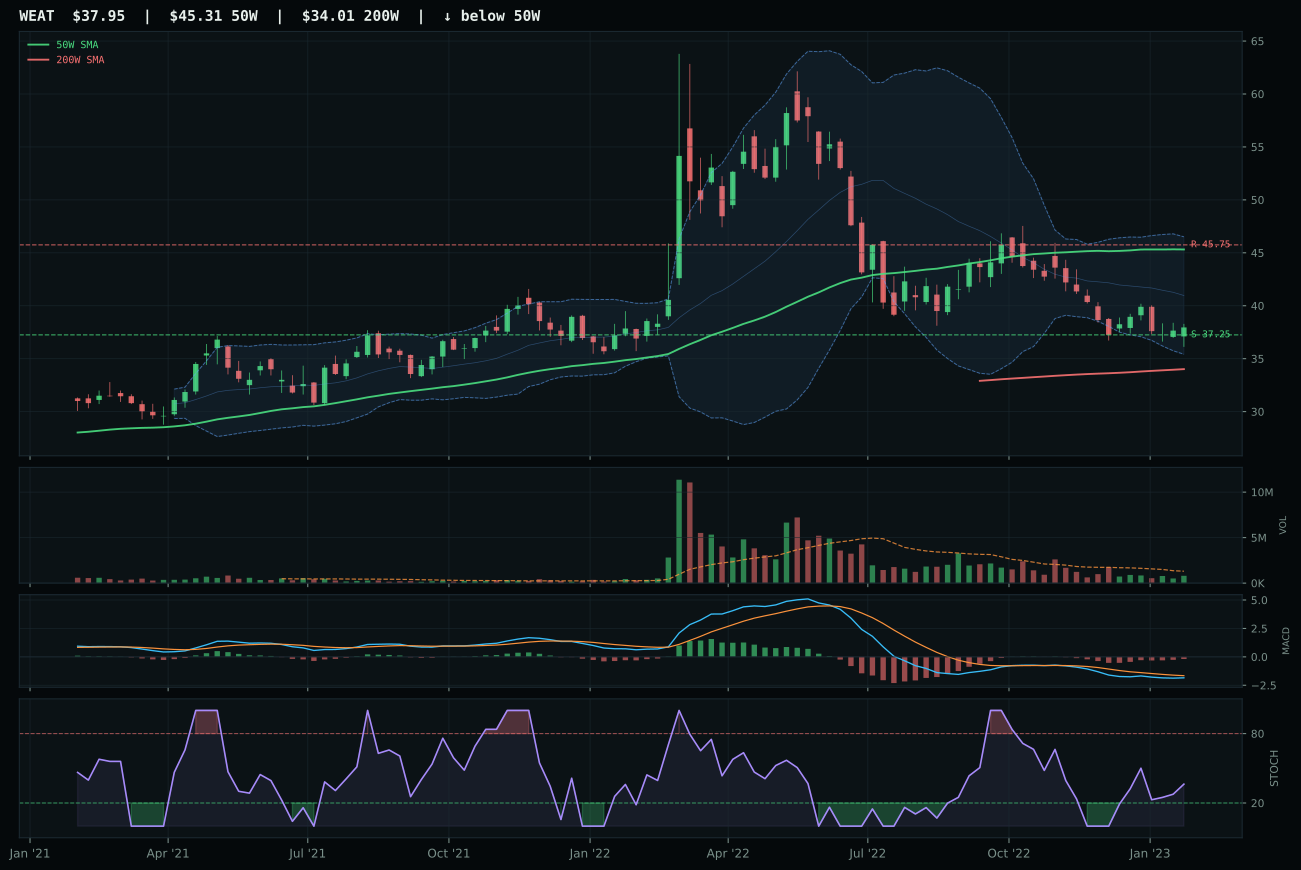
WEAT has a pullback into support profile with -15.5% 13-week relative strength versus SPY.
A failed hold above support would weaken the setup.
Actionable but governed by invalidation levels.
VEGI edges MOO by the narrowest margin—a composite spread of just 5.8 points—because it holds a perfect timing score of 100.0 at 1.4% distance from the 50W, placing it in true compression that can expand in either direction. The setup is neutral structure with MACD bullish but flattening, a mild caution that prevents the win from being clean. MOO boasts a superior technical composite (76 vs. 82) and stronger momentum confirmation (77 vs. 59), yet it lost on structure cleanliness (71.8 vs. 72.0) and MACD quality—bullish and improving versus bullish but flattening. Neither name is screaming conviction; VEGI's win is geometric rather than cyclical, a coil waiting for a spark rather than a confirmed expansion.
Agriculture & Livestock scores 51.6 for a seventh-place finish and 10% allocation, despite a category macro fit of 67.0—the highest among all ten—because technical evidence from the basket is mediocre at 67.7. Late-Cycle Reflation and commodity breadth positive and real asset sponsorship all lean bullish, yet the actual representatives are hesitating: VEGI's thirteen-week return is only 1.7%, and momentum confirmation is a weak 58.9. The allocation reflects a belief that the macro case is sound but the charts are not yet ready to confirm. To earn 20%, this category needs a visible break above near-term resistance paired with volume participation above 1.0x the twenty-week average and a fresh MACD cross; right now it is a waiting pattern rather than a conviction trade.
Traditional Energy — XLE
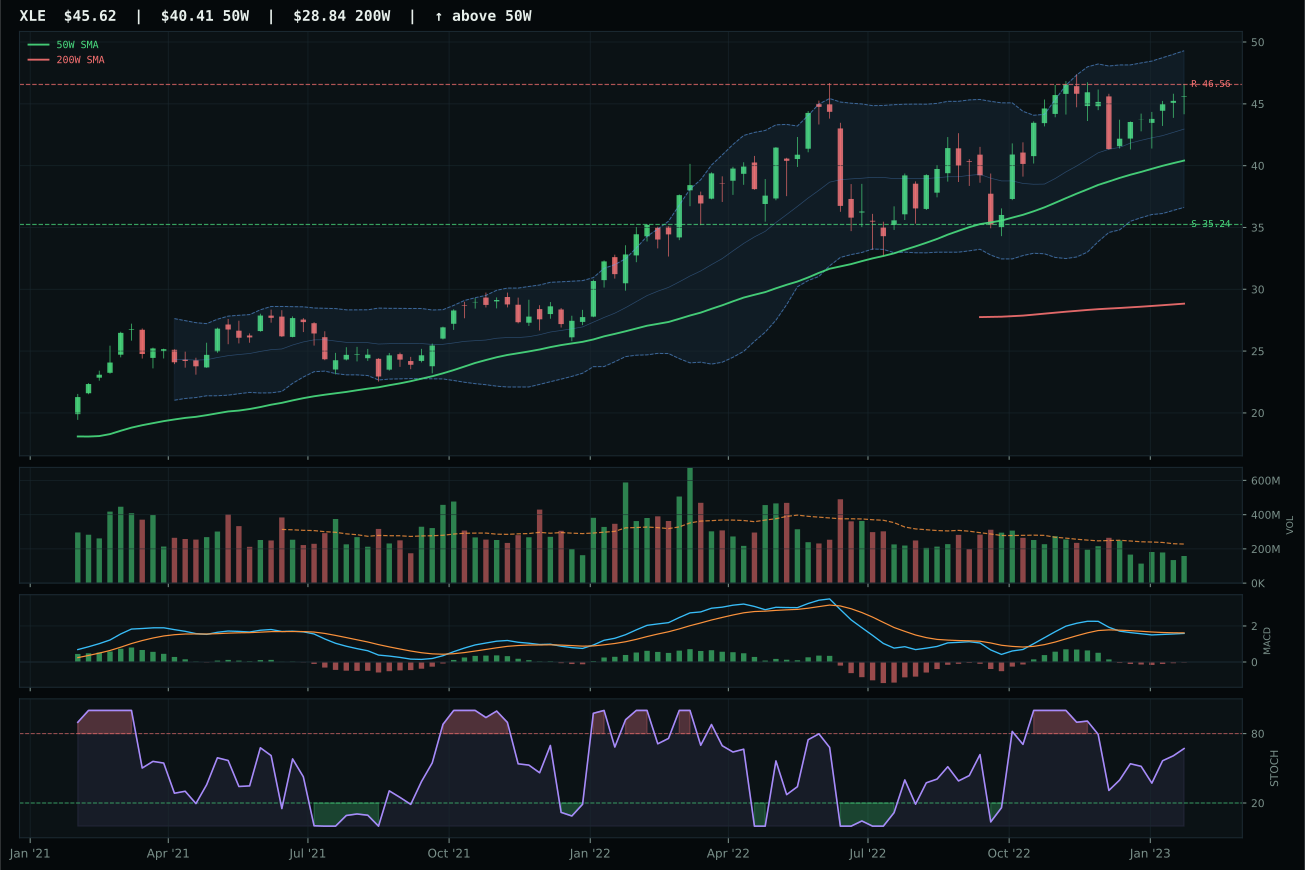
XLE has a neutral structure profile with -2.1% 13-week relative strength versus SPY.
A failed hold above support would weaken the setup.
Actionable but governed by invalidation levels.
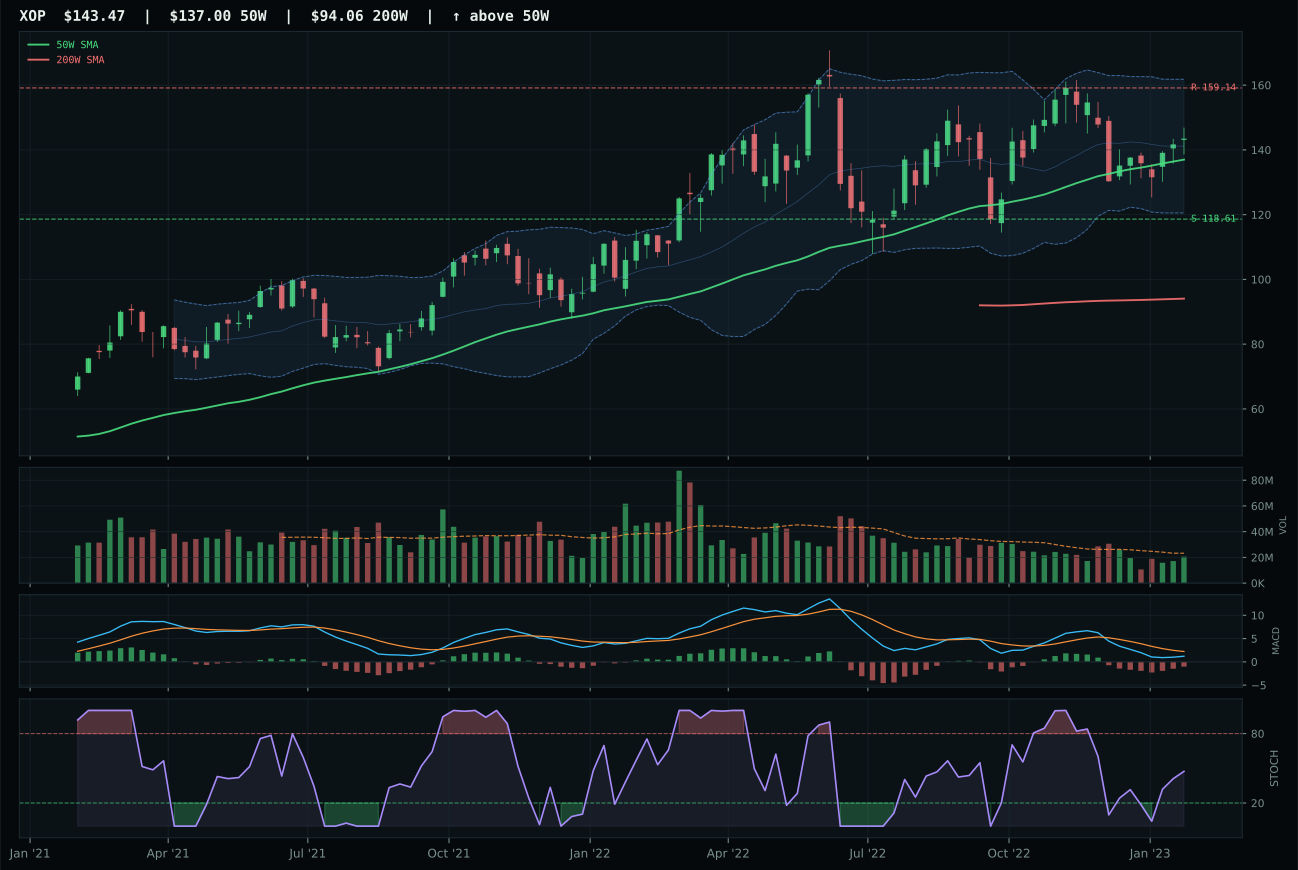
XOP has a neutral structure profile with -8.2% 13-week relative strength versus SPY.
A failed hold above support would weaken the setup.
Actionable but governed by invalidation levels.
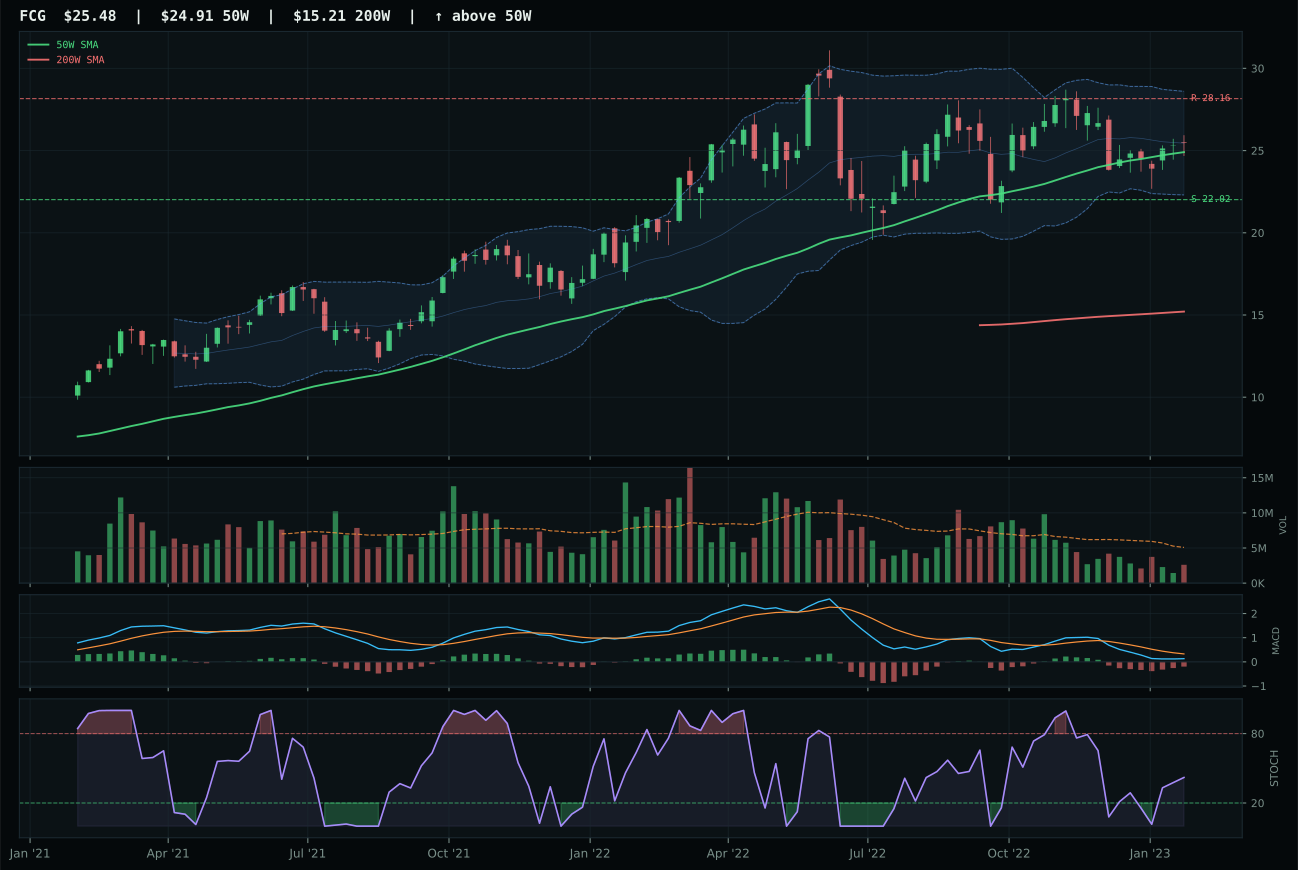
FCG has a compression near 50W profile with -9.2% 13-week relative strength versus SPY.
A failed hold above support would weaken the setup.
Actionable but governed by invalidation levels.
XLE wins narrowly over XOP by 1.0 point because structure cleanliness favored integrated operators: XLE's 75.8 structure score versus XOP's 70.5 reflects better chart geometry and lower noise. Both names struggle with MACD—bearish but improving, not the crisp bullish confirmation that energizes capital—and XLE's category-relative strength of plus 6.1 beats XOP's zero, suggesting that of the two weaker energy representations, XLE has fractionally more sponsorship. The 13W returns are limp (2.2% for XLE, negative 3.9% for XOP), confirming that energy is a passenger trade, not a conviction play. Volume is thin to neutral across both, another sign that buyers are waiting for clearer signals. XLE's 89.9 trend score masks a chart that is drifting higher without conviction, 12.9% from the 50W—safe but stale.
Traditional Energy scores 47.7, placing it eighth among ten categories and earning 10% as a defensive core holding rather than a conviction bet. The macro fit is 55.0, supported by Late-Cycle Reflation and real asset sponsorship, yet credit and liquidity stress each clip five points, and the technical evidence from the basket is only 63.9—the weakest among all categories except Emerging Markets. XLE's technical composite of 74 is respectable, but MACD is bearish and volume is thin, signaling that energy is a residual allocation rather than a crowded flow. To earn 20%, this category would need either a visible geopolitical supply shock or a meaningful deterioration in credit stress that forces capital toward cash-generating dividend plays. For now, it holds at 10% as a real-asset kicker with limp conviction; the lack of liquidity and rising-rate headwinds have stolen energy's luster.
Technology — XLK
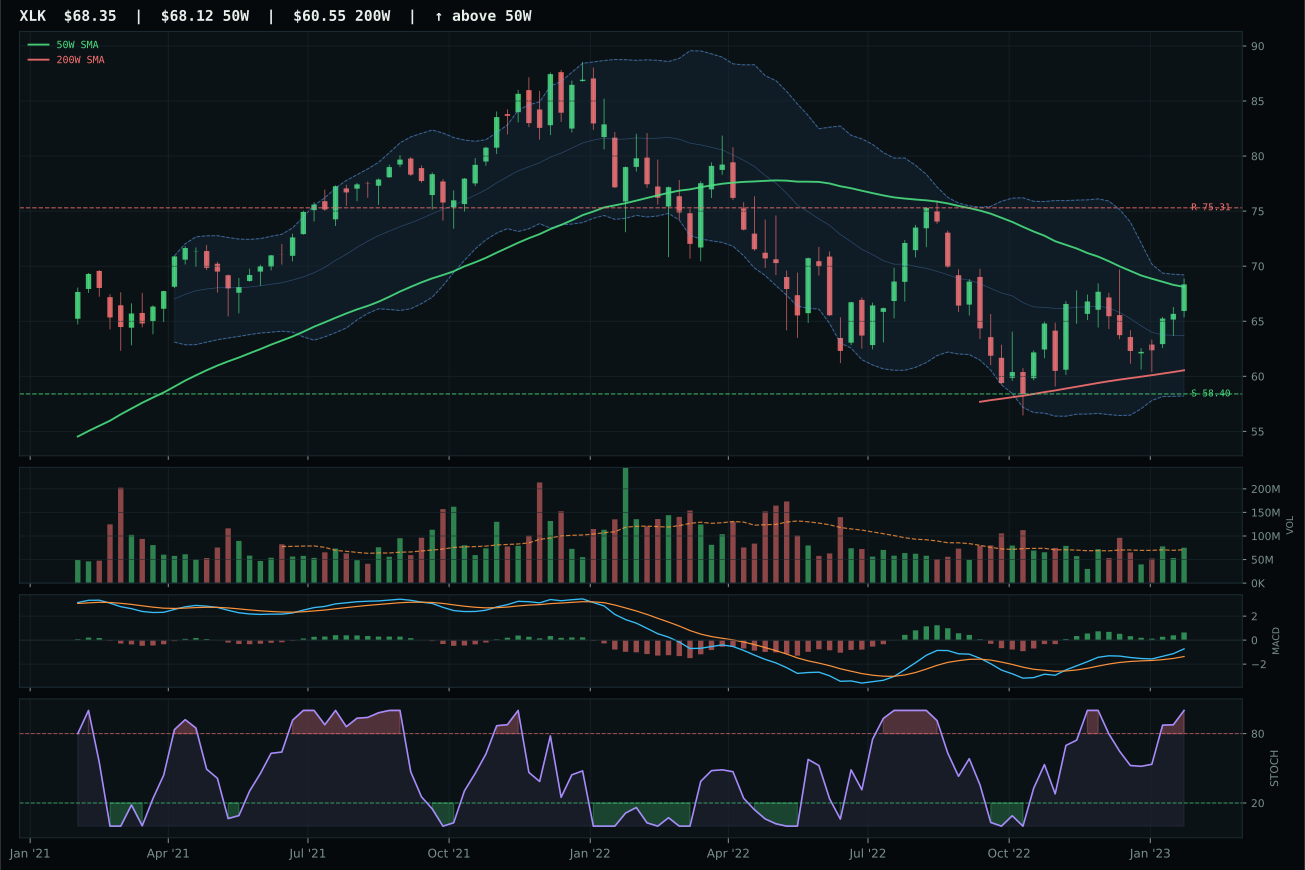
XLK has a compression near 50W profile with 1.2% 13-week relative strength versus SPY.
A failed hold above support would weaken the setup.
Actionable but governed by invalidation levels.
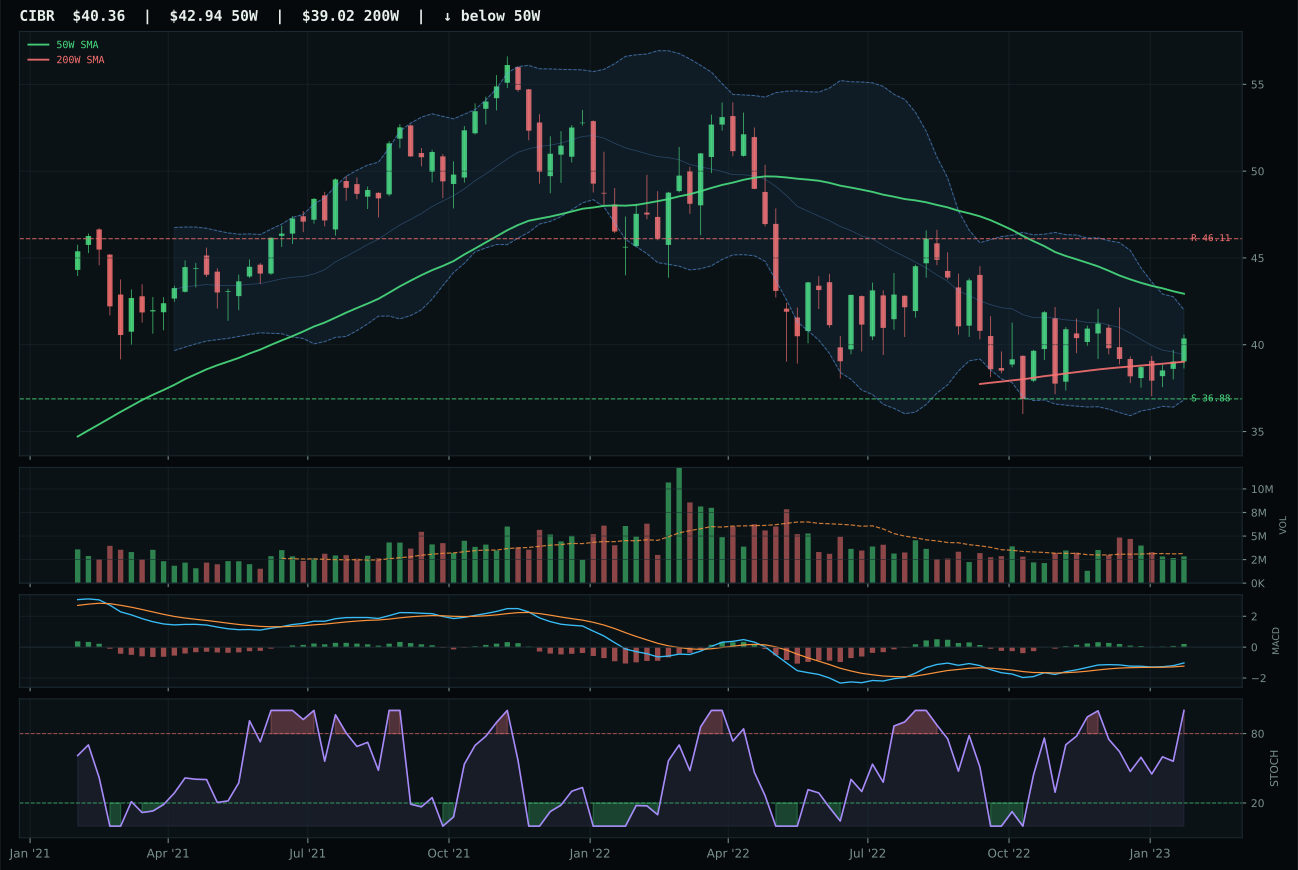
CIBR has a neutral structure profile with -7.9% 13-week relative strength versus SPY.
A failed hold above support would weaken the setup.
Actionable but governed by invalidation levels.
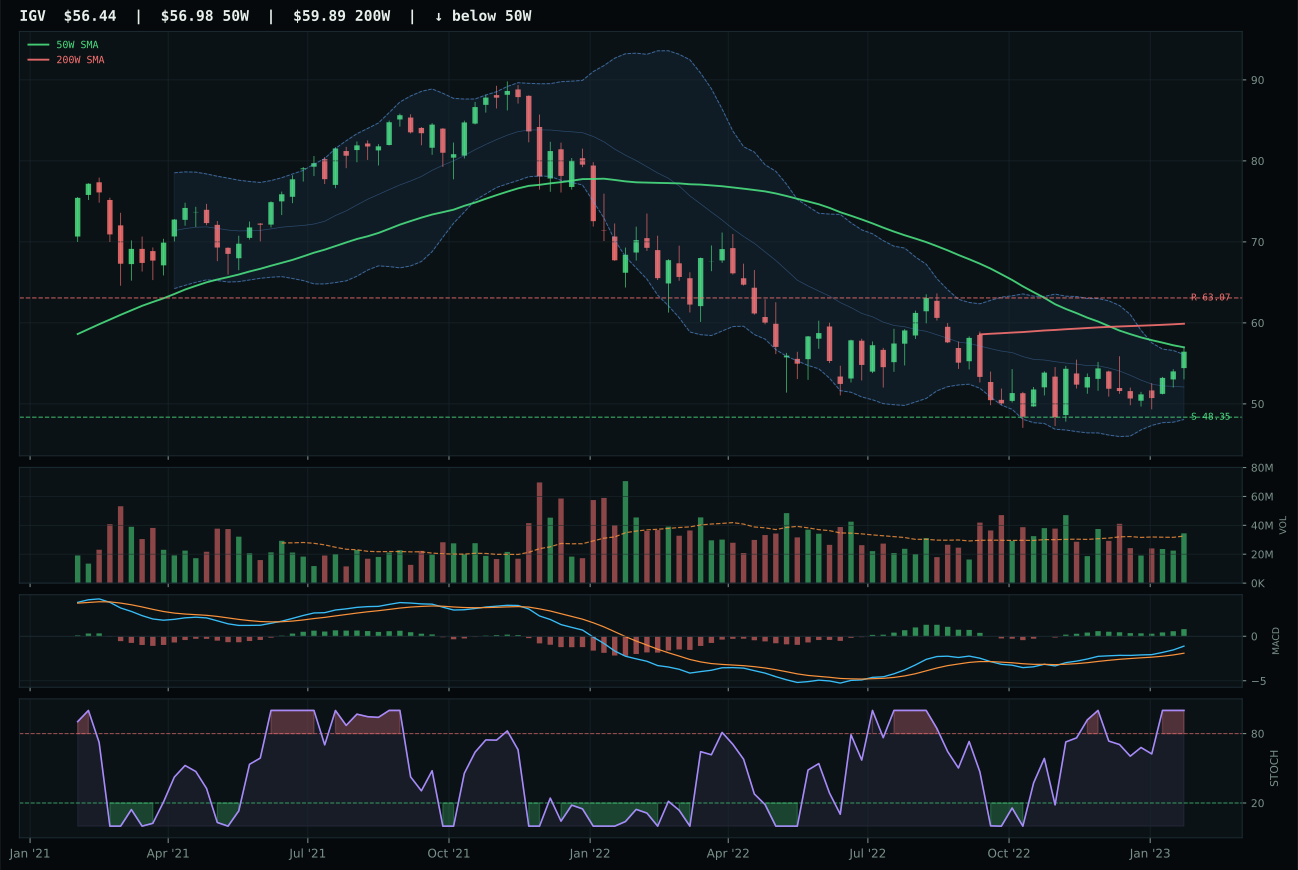
IGV has a compression near 50W profile with 0.5% 13-week relative strength versus SPY.
Extension and support failure are the main tactical risks.
Tracked, but not top-2 eligible because: structurally broken.
XLK claimed the category by defending the 50-week moving average with a razor-thin 0.3% distance, creating a coil-and-release setup that rewards discipline over stretch. Its 1.2% relative strength versus SPY, paired with a 5.5% thirteen-week return and bullish, improving MACD, signals quiet accumulation in the hands of patient capital. CIBR stumbled on timing alone—a 82.0 score versus XLK's perfect 100—but the real damage came from category-relative weakness of negative 8.4%, revealing that cybersecurity has lost the sponsorship race to broad profitable tech. At 0.3% from the 50W with overbought momentum and neutral volume, XLK sits in a decision zone, not an extension; that setup quality is worth the 32-point gap.
Technology earned 0% allocation and ranks outside the portfolio this week, sitting at a final category score of 41.0 that places it 9th or 10th. The macro regime works against it: liquidity stress is active with a -10 weight and credit stress carries -7, suppressing the 48-point macro fit score despite AI growth sponsorship at +6 and risk appetite positive at +9. Even XLK's solid 84/100 technical evidence cannot overcome a regime where capital is rotating hard into real assets and away from duration-sensitive growth. Late-Cycle Reflation favors tangible scarcity—metals, energy, and hard assets—over the multiple compression risk embedded in technology leadership. For Tech to earn allocation, macro conditions would need to shift toward either a sustained risk-on rally that lifts growth multiples or a deflationary pivot that makes duration attractive again; neither is the current regime.
Emerging Markets — IEMG
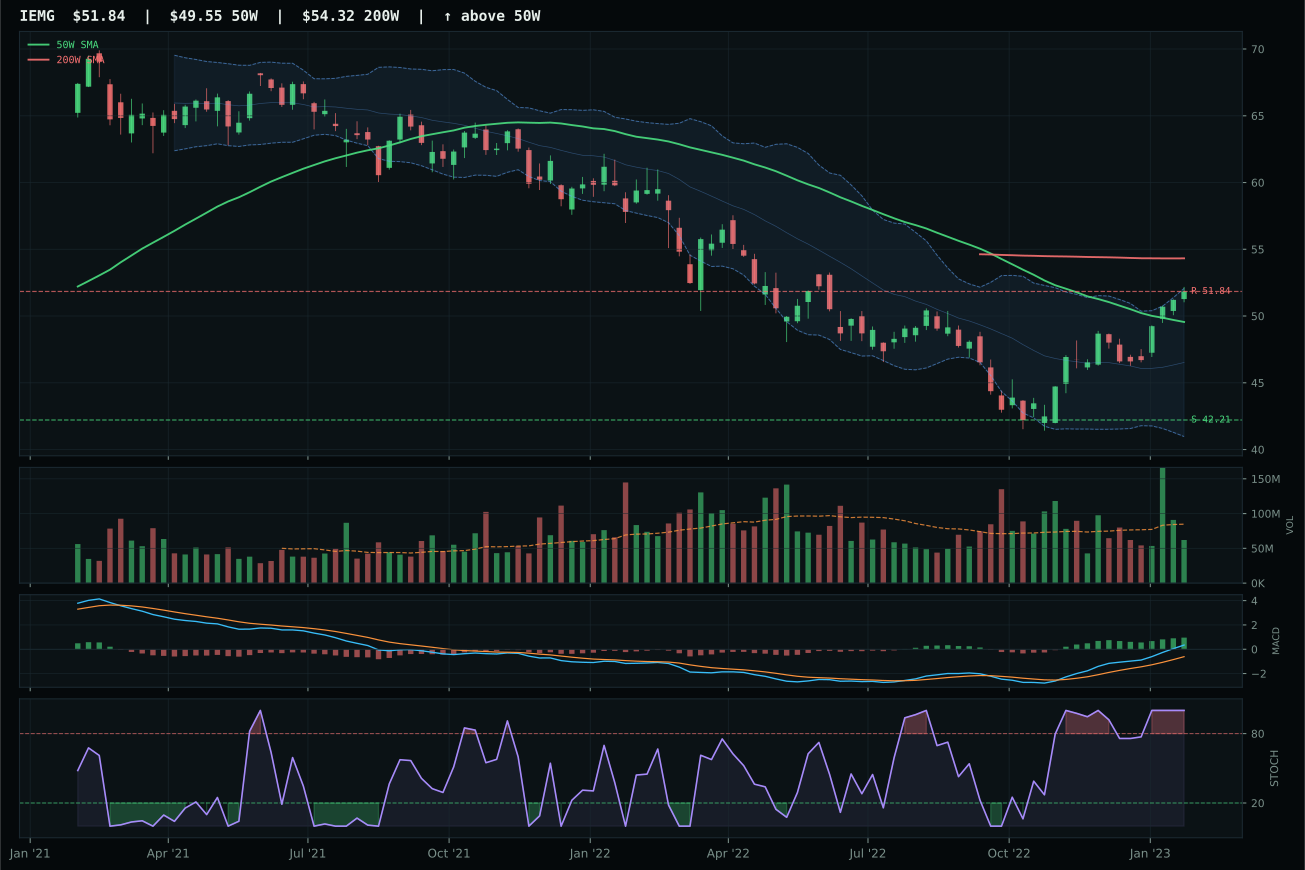
IEMG has a neutral structure profile with 17.8% 13-week relative strength versus SPY.
A failed hold above support would weaken the setup.
Actionable but governed by invalidation levels.
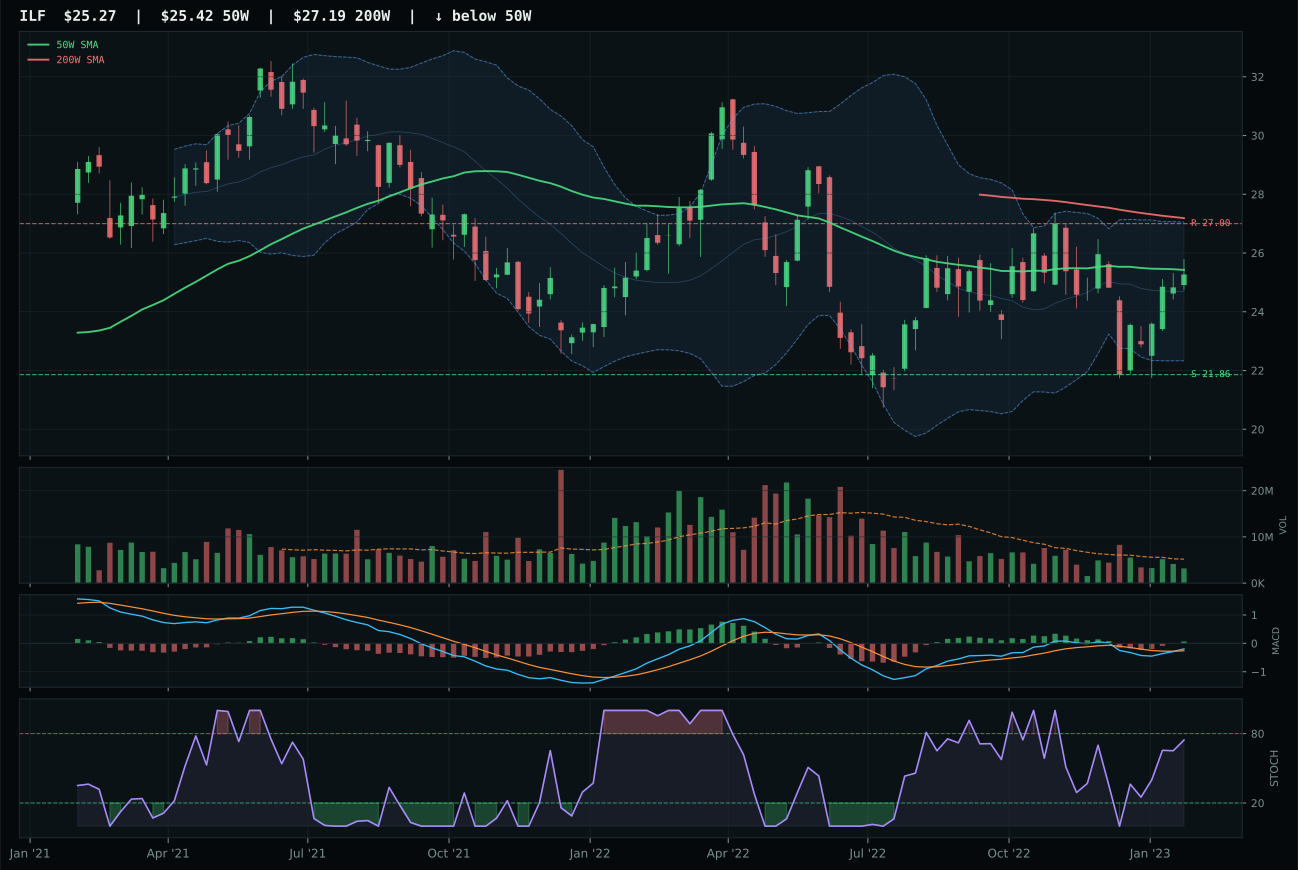
ILF has a compression near 50W profile with -4.5% 13-week relative strength versus SPY.
Extension and support failure are the main tactical risks.
Tracked, but not top-2 eligible because: structurally broken.
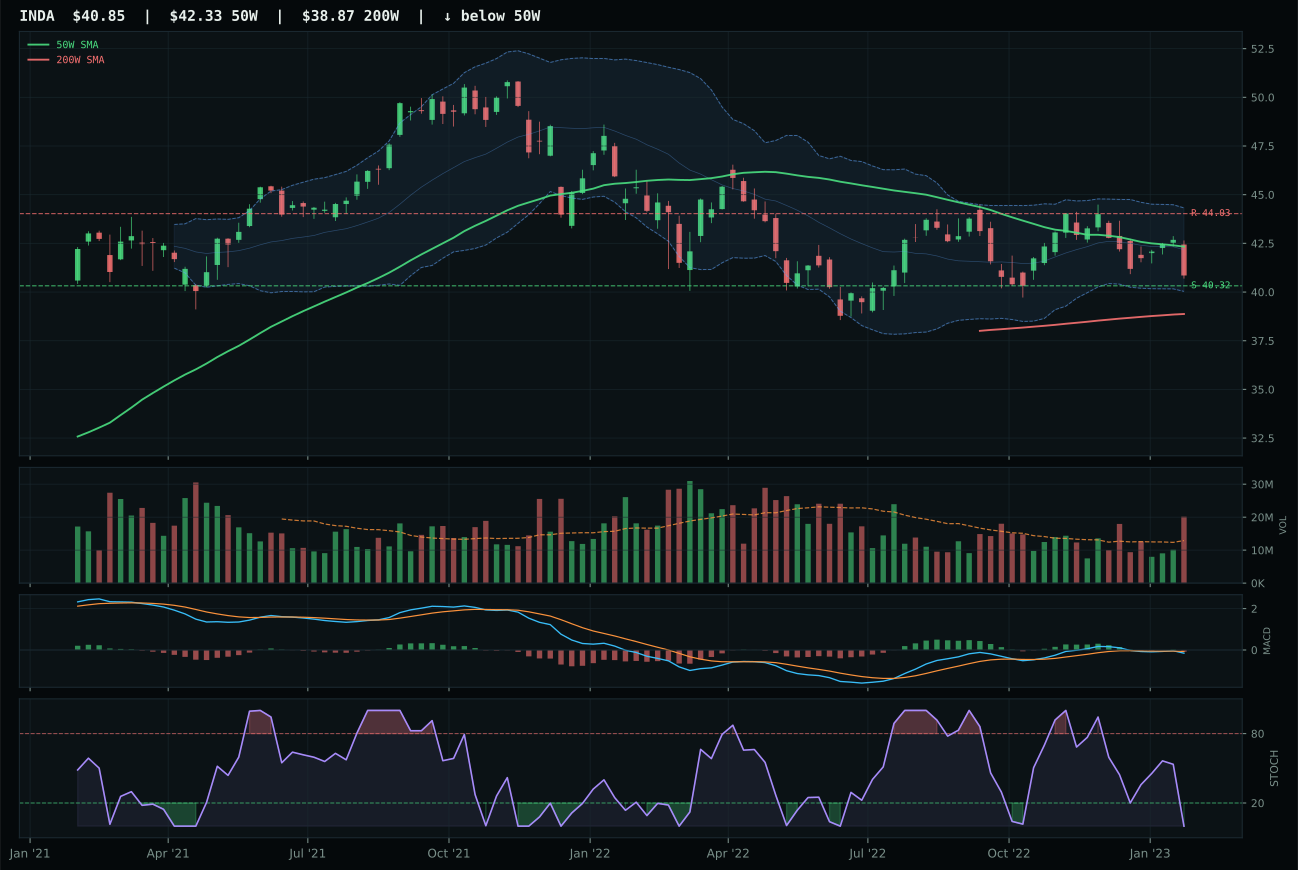
INDA has a pullback into support profile with -7.8% 13-week relative strength versus SPY.
A failed hold above support would weaken the setup.
Actionable but governed by invalidation levels.
IEMG wins by the largest margin in the universe—43.3 points over ILF—because it delivered both technical quality and category relative strength that no peer could match. At 17.8% RS/SPY and 22.0% thirteen-week return, paired with a perfect 100.0 momentum confirmation score and 88.4% persistence, IEMG is the clear crowding trade in emerging markets. ILF's structure cleanliness of 36.9 is broken (versus IEMG's 75.6), a hard filter that signals the Latin America proxy is technically fractured. IEMG sits at 4.6% from the 50W in middle retracement, compressed and ready, while ILF is struggling with compression near the 50W and a slumping MACD. Volume for IEMG is thin at 0.73x, yet momentum is so strong that participation is irrelevant—this is a crowded positioning trade, not an accumulation setup.
Emerging Markets earned 0% allocation and is ranked 9th or 10th with a 15.9 final category score, completely excluded from the portfolio despite IEMG's strong technical setup. The category macro fit of 38/100 reveals the core problem: risk appetite positive carries only +8 weight, while credit stress (-10) and liquidity stress (-10) combine to create a net negative macro environment that undermines the technical case. Late-Cycle Reflation specifically does not favor emerging markets—it favors domestic real assets and developed-market dividends. IEMG's 85.7/100 technical evidence is legitimate, but the macro regime explicitly punishes emerging-market exposure because dollar strength, potential capital flight, and credit stress in developing economies all work against EM positioning. Thin participation (0.73x volume) also signals that the move lacks the institutional conviction of domestic flows driving metals and energy. For Emerging Markets to earn allocation, the macro regime would need to shift toward either a risk-on rally that lifts EM beta broadly or a dollar-weakness regime that supports carry trades and emerging-market currencies. At 15.9 points, this category ranks below eight others, confirming it is outside the current reflation playbook entirely.