
2023-01-20
Informational purposes only. The content in this report, including allocations, analysis, and commentary, is provided solely for informational and educational purposes. It does not constitute financial advice, investment advice, trading advice, or any other type of advice. Past performance does not guarantee future results. Always conduct your own research and consult a qualified financial professional before making investment decisions.
Weekly Allocation
| Ticker | Category | Weight | Role |
|---|---|---|---|
| COPX | Industrial Metals | 20% | Top-2 (20%) |
| GLD | Precious Metals | 20% | Top-2 (20%) |
| SMH | AI | 10% | Tier-2 (10%) |
| URNM | Nuclear Energy | 10% | Tier-2 (10%) |
| XLE | Traditional Energy | 10% | Tier-2 (10%) |
| VEGI | Agriculture & Livestock | 10% | Tier-2 (10%) |
| PAVE | Utilities & Infrastructure | 10% | Tier-2 (10%) |
| IEMG | Emerging Markets | 10% | Tier-2 (10%) |
Trade Instructions — Monday Open
Sell the tranche from 2022-12-23 (completing its 4-week hold). Buy the new tranche. Instructions show net portfolio changes — same-asset positions cancel, weight changes show the delta.
| Action | Ticker | Instruction |
|---|---|---|
| SELL | XLE | Sell 20% of XLE position (reduce 12.50% → 10.00%) |
| SELL | ITA | Sell 50% of ITA position (reduce 10.00% → 5.00%) |
| SELL | XLU | Sell 50% of XLU position (reduce 5.00% → 2.50%) |
| SELL | MOO | Sell entire MOO position (2.50% of portfolio) |
| SELL | SLV | Sell entire SLV position (2.50% of portfolio) |
| SELL | URA | Sell entire URA position (2.50% of portfolio) |
| SELL | XLK | Sell 50% of XLK position (reduce 5.00% → 2.50%) |
| BUY | COPX | Buy COPX — 12.50% of freed cash (adds 2.50% to portfolio) |
| BUY | GLD | Buy GLD — 25.00% of freed cash (adds 5.00% to portfolio) |
| BUY | URNM | Buy URNM — 12.50% of freed cash (adds 2.50% to portfolio) |
| BUY | VEGI | Buy VEGI — 12.50% of freed cash (adds 2.50% to portfolio) |
| BUY | SMH | Buy SMH — 12.50% of freed cash (adds 2.50% to portfolio) |
| BUY | PAVE | Buy PAVE — 12.50% of freed cash (adds 2.50% to portfolio) |
| BUY | IEMG | Buy IEMG — 12.50% of freed cash (adds 2.50% to portfolio) |
Current Portfolio After Trade
Combined holdings across all 4 active tranches. Each tranche is 25% of the portfolio.
| Ticker | % of Portfolio | Weight Bar |
|---|---|---|
| GLD | 20.00% | |
| COPX | 15.00% | |
| XLE | 10.00% | |
| URNM | 10.00% | |
| XAR | 7.50% | |
| ITA | 5.00% | |
| WEAT | 5.00% | |
| INDA | 5.00% | |
| IGF | 5.00% | |
| VEGI | 5.00% | |
| XLU | 2.50% | |
| XLK | 2.50% | |
| SMH | 2.50% | |
| PAVE | 2.50% | |
| IEMG | 2.50% |
Macro Regime — Late-Cycle Reflation
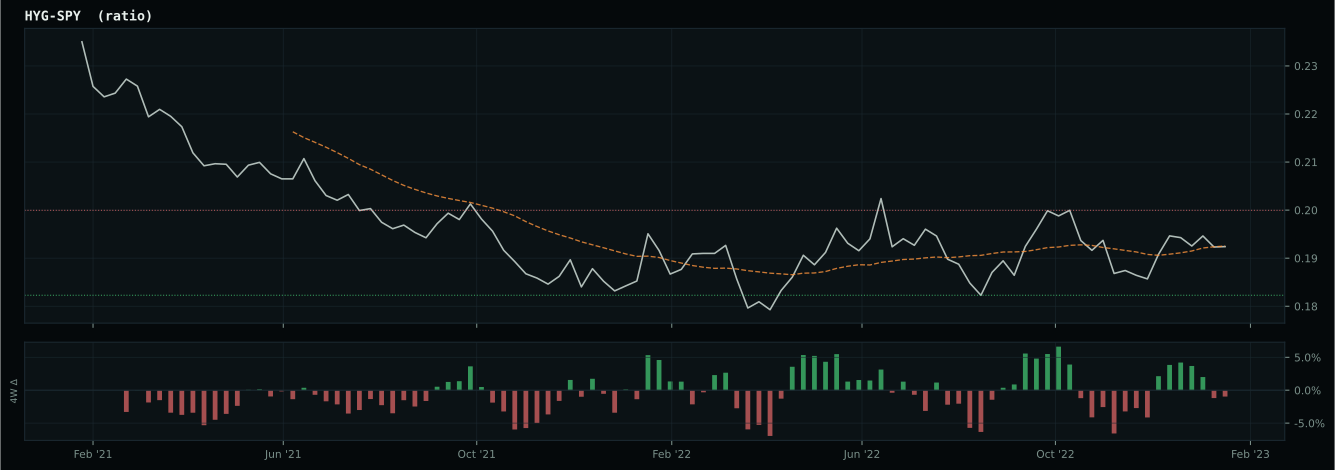
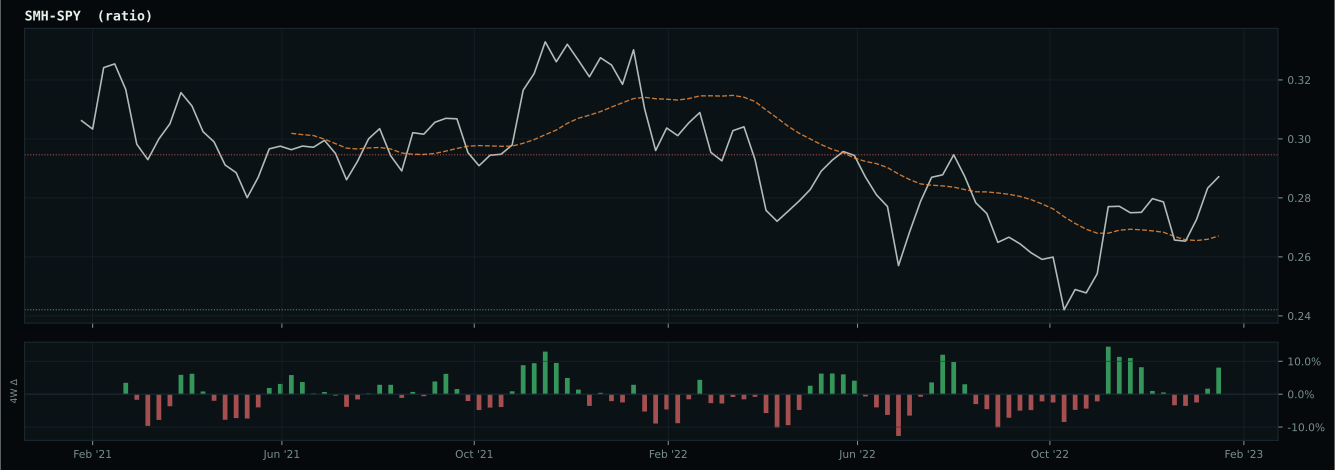
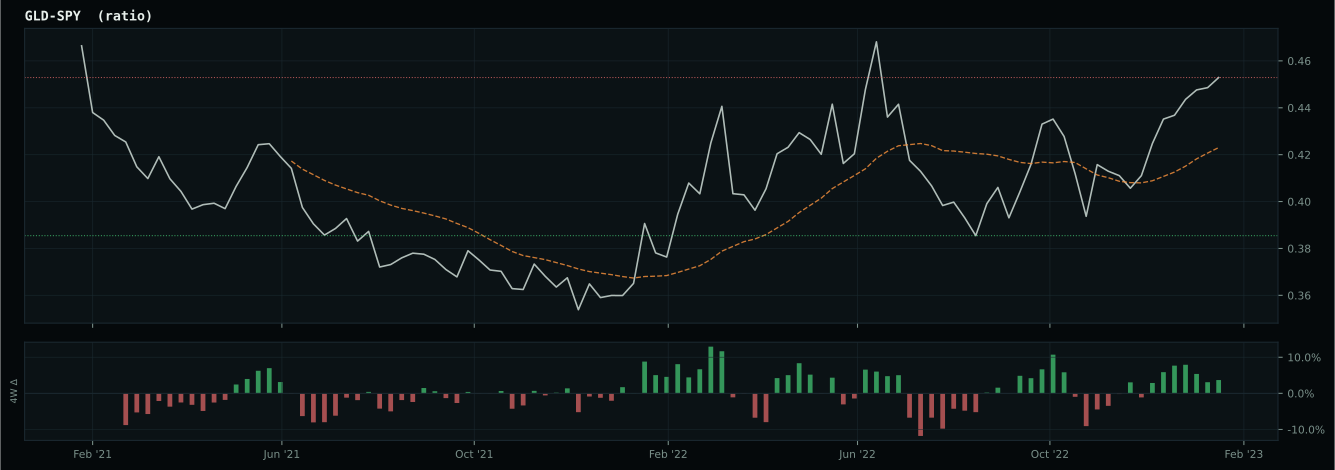
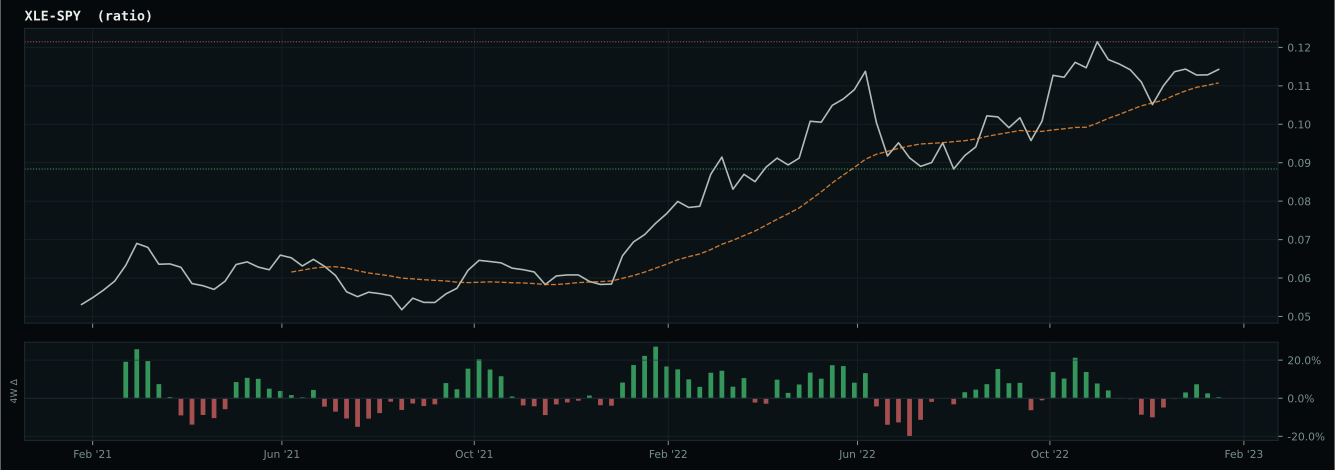
Macro Evidence Charts
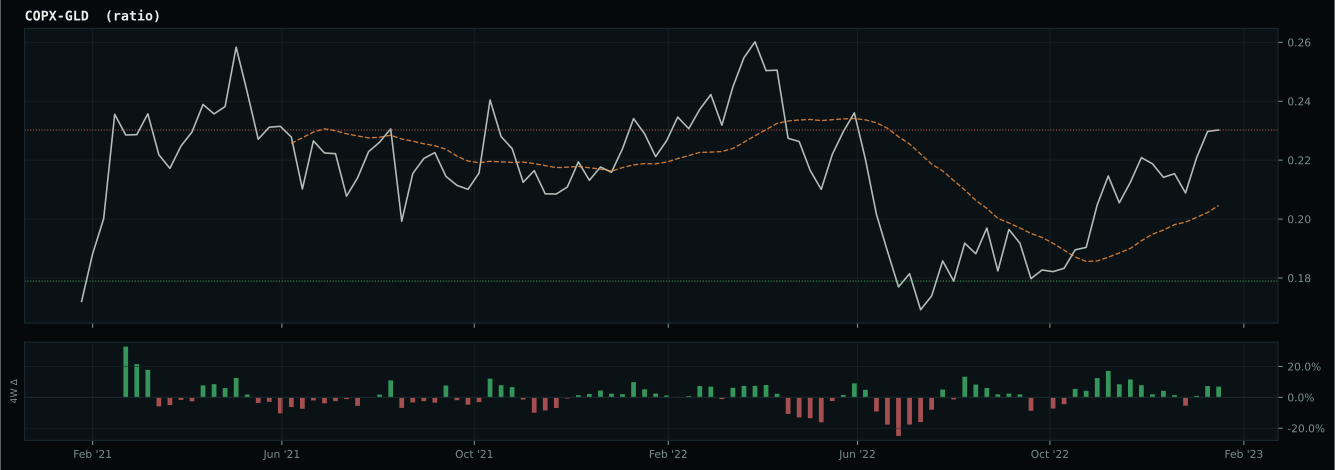
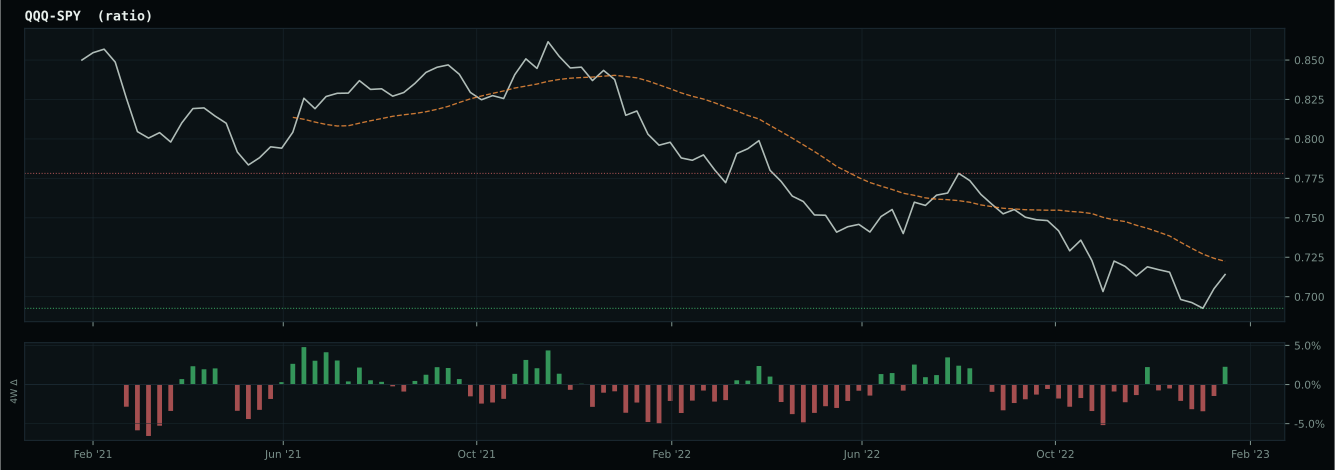
Market-implied signals behind the macro regime scores. Each ratio compares two assets; the direction and slope of the ratio is what the macro engine reads.
Crypto Regime — NoCrypto
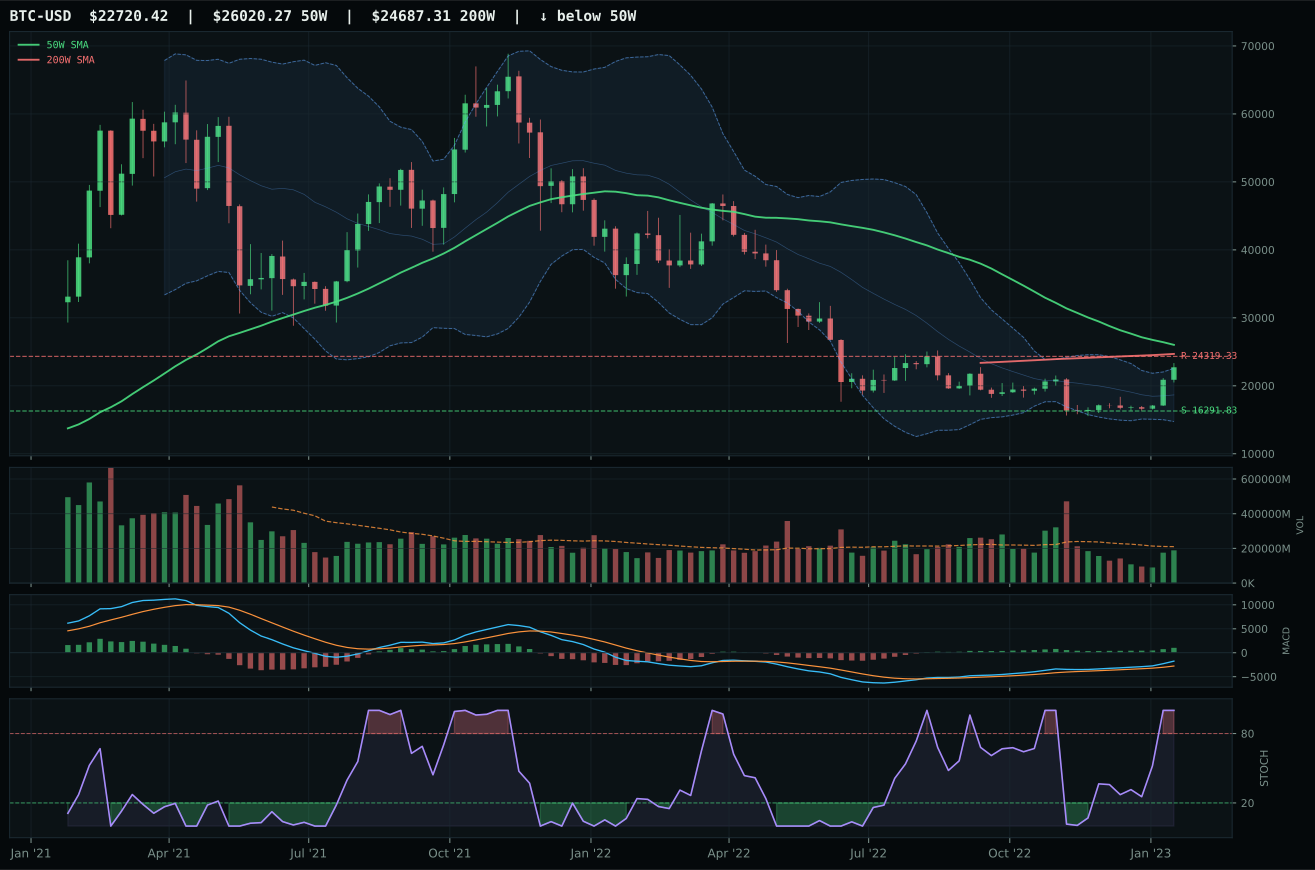
ValueBTC armed; waiting for 50W reclaim, close above 200W, breakout volume above 20W average
TrendBTC not confirmed
one or more available conditions failed
Category Rankings
| Rank | Category | Winner | Score | Alloc | 4W Ret | Peers (4W) |
|---|---|---|---|---|---|---|
| 1 | Industrial Metals | COPX | 83.0 | 20% | -4.39% | PICK -4.6% · REMX -4.5% |
| 2 | Precious Metals | GLD | 74.3 | 20% | -4.01% | GDX -11.7% · SLV -5.0% |
| 3 | AI | SMH | 65.6 | 10% | +4.37% | BOTZ +1.8% · AIQ +2.6% |
| 4 | Nuclear Energy | URNM | 65.4 | 10% | -2.43% | URA -2.0% · NLR -0.2% |
| 5 | Traditional Energy | XLE | 64.0 | 10% | -7.70% | XOP -9.1% · FCG -10.3% |
| 6 | Agriculture & Livestock | VEGI | 60.0 | 10% | -0.39% | MOO -0.9% · WEAT +4.9% |
| 7 | Utilities & Infrastructure | PAVE | 53.8 | 10% | +5.52% | IGF -2.5% · XLU -1.5% |
| 8 | Emerging Markets | IEMG | 42.6 | 10% | -5.01% | INDA -5.6% · ILF -1.6% |
| 9 | Technology | XLK | 42.5 | 0% | +4.61% | CIBR +6.3% · IGV +3.0% |
| 10 | Defense & Aerospace | XAR | 40.7 | 0% | +6.69% | ITA +6.8% · ROKT +4.2% |
Industrial Metals — COPX
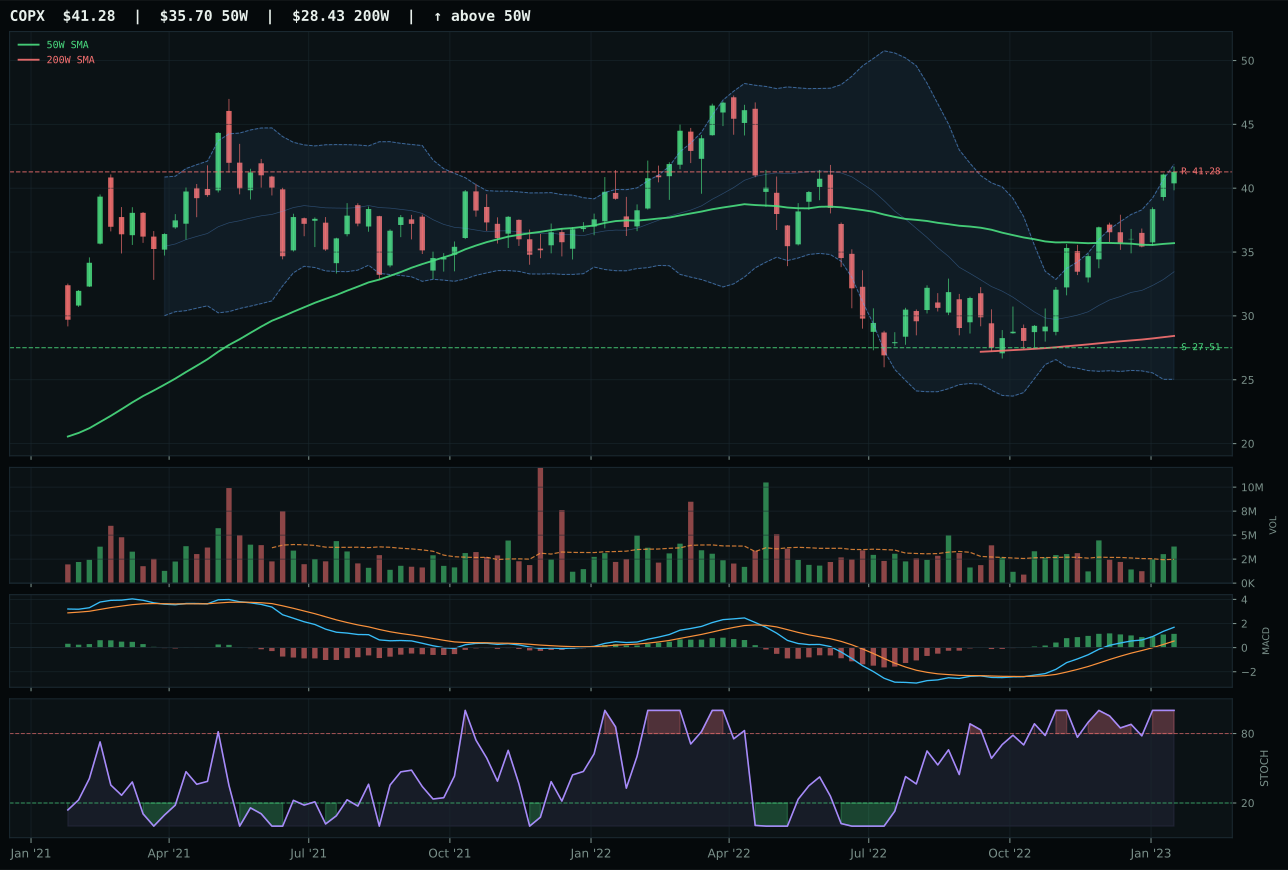
COPX has a vertical extension profile with 35.5% 13-week relative strength versus SPY.
A failed hold above support would weaken the setup.
Actionable but governed by invalidation levels.
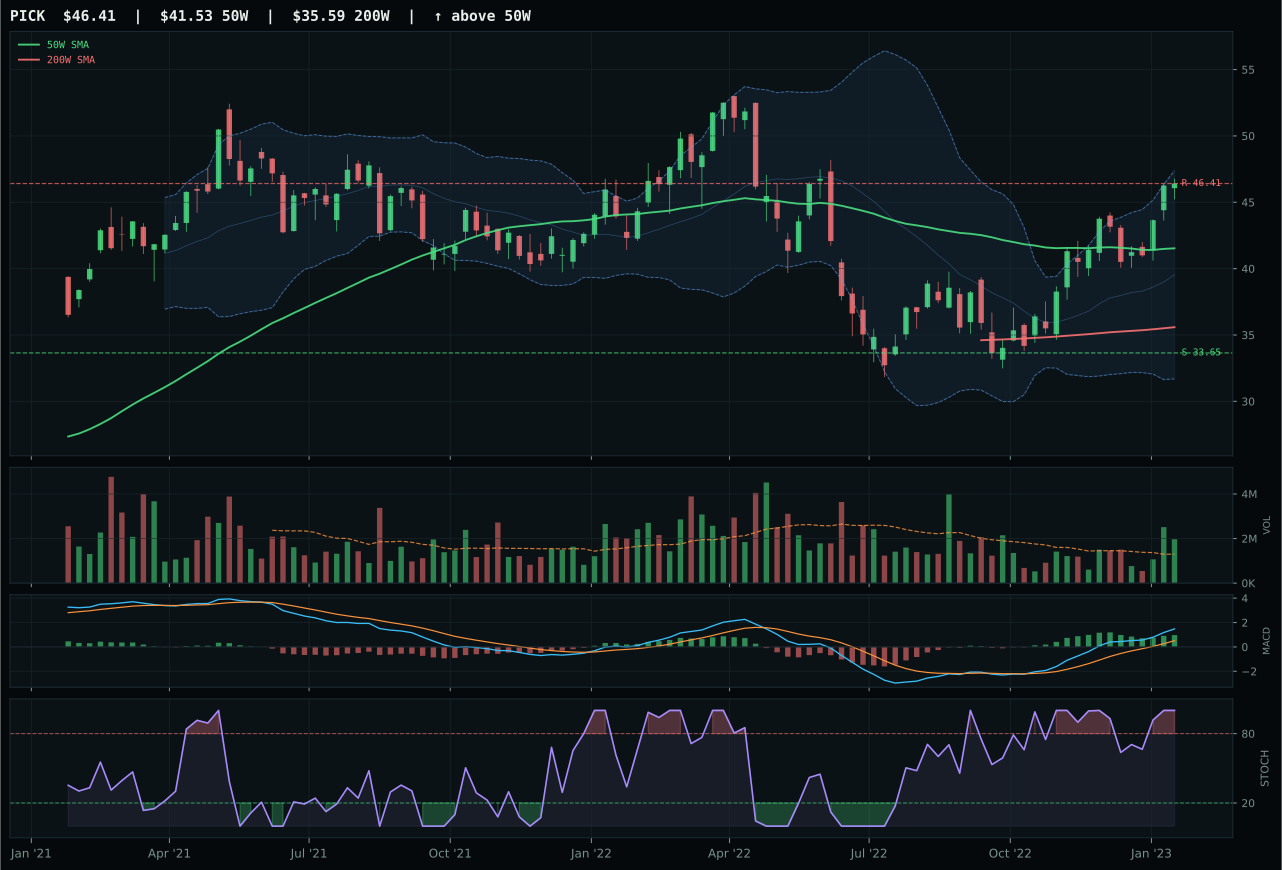
PICK has a neutral structure profile with 21.7% 13-week relative strength versus SPY.
A failed hold above support would weaken the setup.
Actionable but governed by invalidation levels.
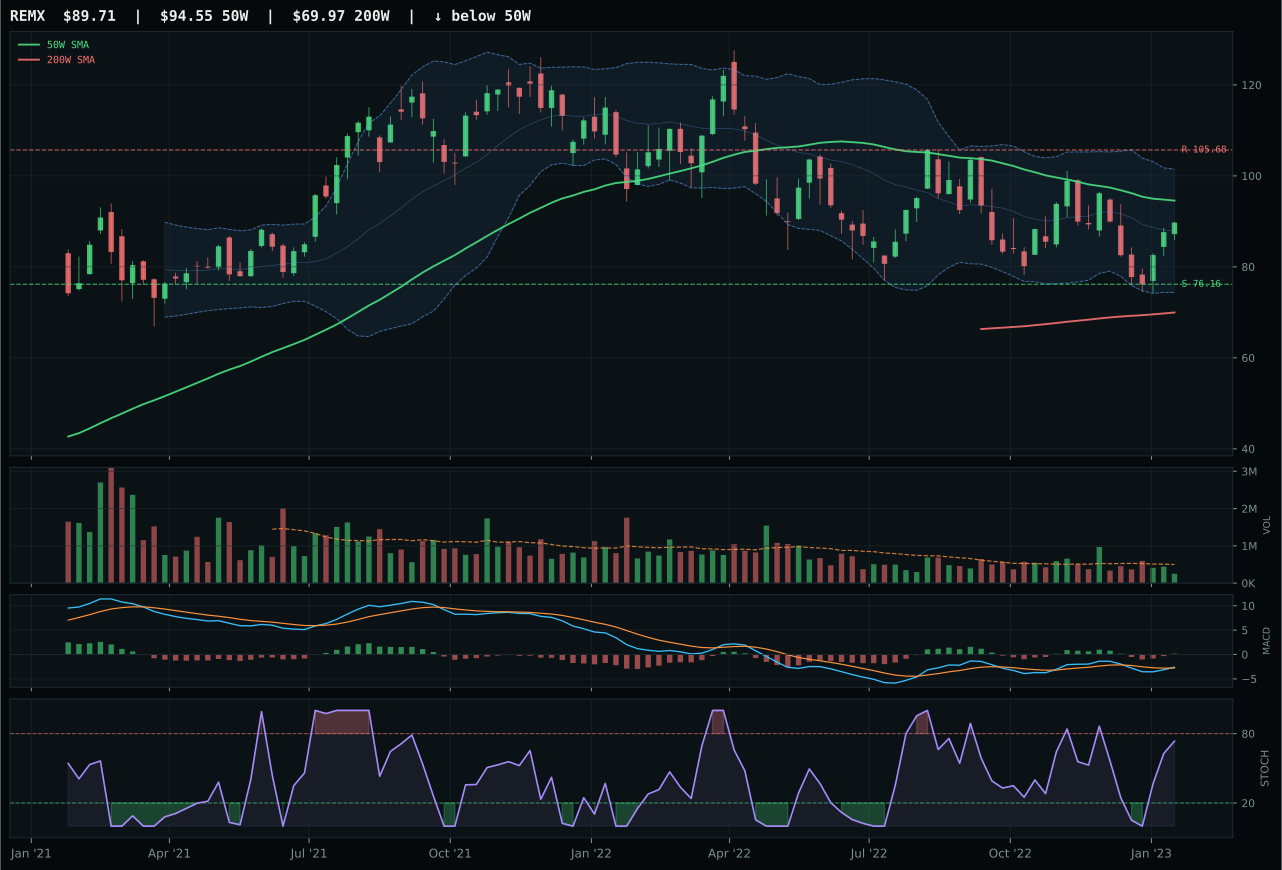
REMX has a neutral structure profile with -4.2% 13-week relative strength versus SPY.
A failed hold above support would weaken the setup.
Actionable but governed by invalidation levels.
COPX dominates Industrial Metals on the back of explosive momentum and perfect volume confirmation that separates it from an otherwise competitive field. The ETF explodes 15.6% above its 50-week moving average with a perfect 100-point trend score—price above both major averages, slope strengthening at 0.2%, relative strength of 35.5% versus SPY, which is a 13.8% outperformance within the basket—while volume surges to 1.54x the twenty-week average, providing institutional accumulation proof. Thirteen-week return of 41.3% is exceptional, stochastic RSI sits at perfect overbought 1.00, and MACD is bullish and improving, confirming that the extension is being actively accumulated rather than distributed. PICK's technical evidence is technically higher at 100.0, but it fails on relative strength—the category-median comparison shows COPX leads by 13.8% because copper demand is more acute than general mining breadth, and volume persistence at 97.1 proves sponsored accumulation.
Industrial Metals earns 20% because it is the single strongest category on both technical and macro grounds, with COPX representing the purest scarcity play available. The category macro fit is 82.0, with metals scarcity at +14, commodity breadth positive at +10, and late-cycle reflation at +10, creating a tailwind matched only by Precious Metals. Unlike Precious Metals, which is defensive, Industrial Metals is offensive: supply shortage is active, inflation pressure is acute, and real-asset sponsorship is embedded in the reflation narrative. COPX's 83.0 category score is the highest final rank across all ten holdings, and its volume persistence at 100.0 proves that accumulation is genuine and not dependent on retail crowding. The setup is extended at 15.6% above the 50-week line, creating entry risk, but the conviction is so high that this category demands equal weight with Precious Metals as a portfolio anchor.
Precious Metals — GLD
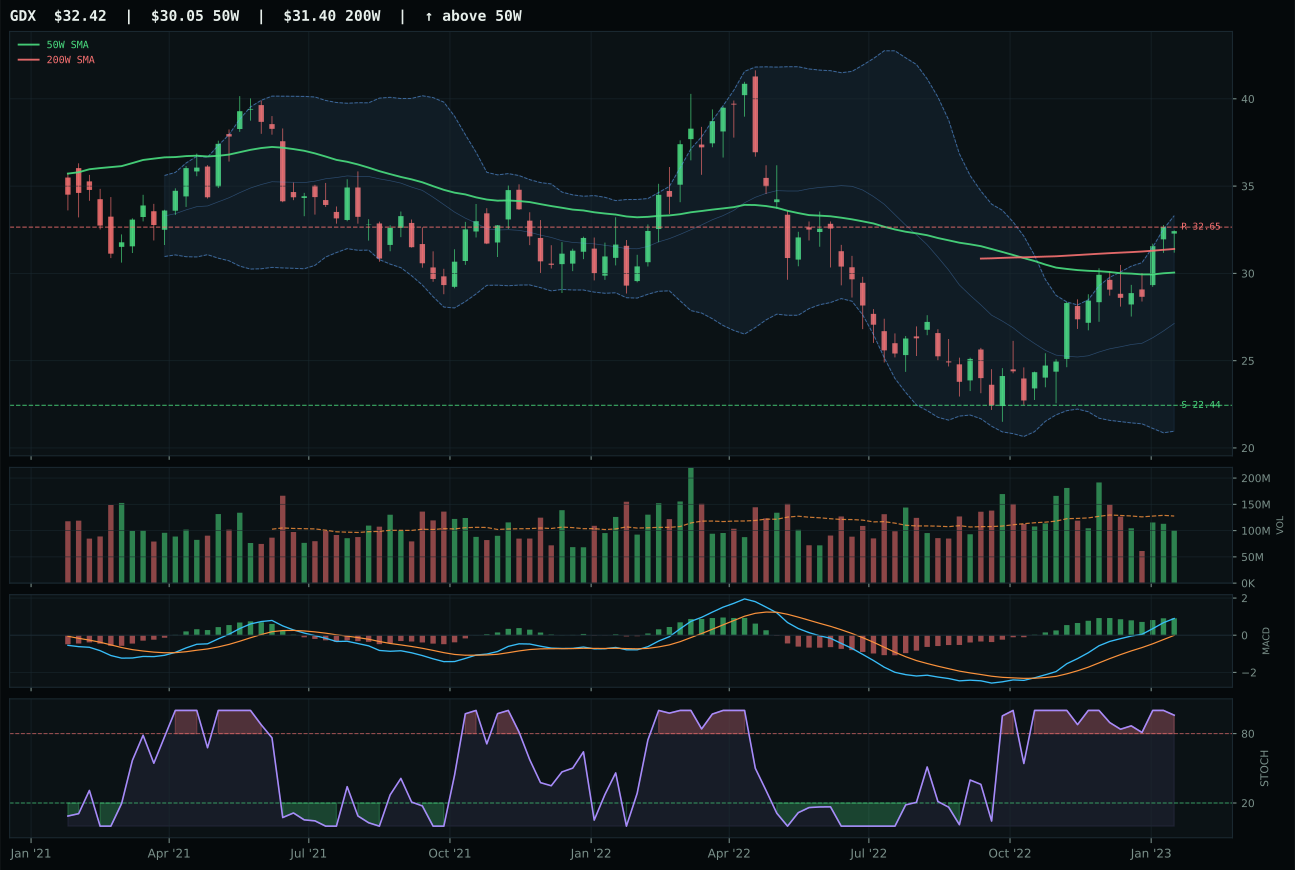
GDX has a neutral structure profile with 27.4% 13-week relative strength versus SPY.
A failed hold above support would weaken the setup.
Actionable but governed by invalidation levels.
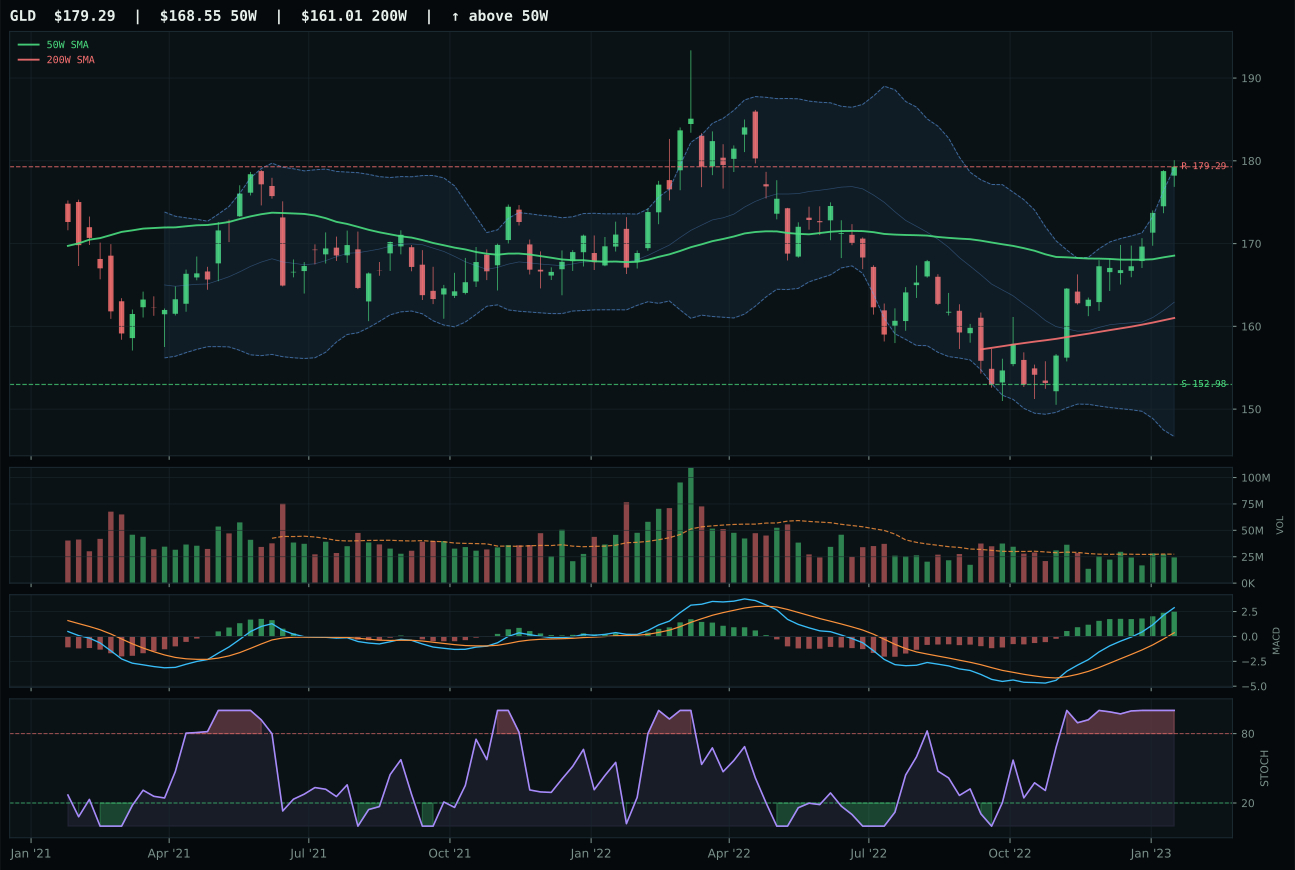
GLD has a neutral structure profile with 10.5% 13-week relative strength versus SPY.
A failed hold above support would weaken the setup.
Actionable but governed by invalidation levels.
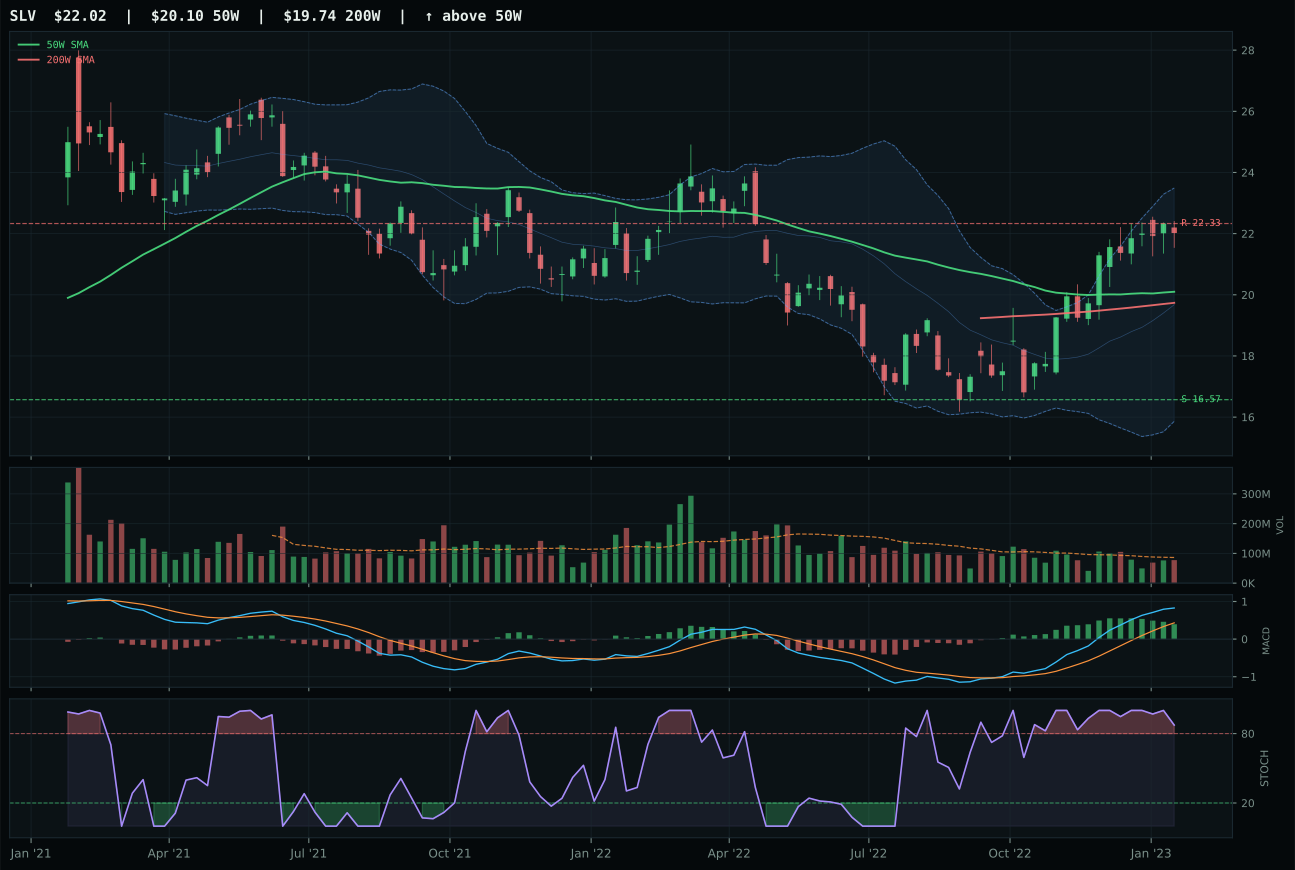
SLV has a neutral structure profile with 18.2% 13-week relative strength versus SPY.
A failed hold above support would weaken the setup.
Actionable but governed by invalidation levels.
GLD captures the 20% top-2 slot by delivering the clearest monetary hedge signal with the broadest appeal and lowest volatility. The ETF trades 6.4% above its 50-week moving average with a perfect 100-point trend score—price above both major averages, slope neutral at 0.1%, relative strength of 10.5% versus SPY—while MACD is bullish and improving and stochastic RSI sits at overbought 1.00, confirming accumulation without exhaustion. Thirteen-week return of 16.3% rivals GDX's 33.2%, but GLD's structure is materially cleaner at 80.8 versus 71.4, and its risk-reward advantage is negligible, making the lower-volatility choice the prudent allocator's path. GDX's 27.4% relative strength is flashy but carries hidden leverage risk; GLD's 10.5% offers conviction without leverage.
Precious Metals earns 20% because it is one of only two categories where the technical setup, macro sponsorship, and portfolio construction all align perfectly. The monetary hedge bid is the single most powerful active descriptor at +14, defensive rotation adds +7, and late-cycle reflation supports exposure at +8, yielding a 67.0 macro fit—the third-highest among all categories. GLD's 82.5 technical evidence score reflects clean structure, perfect trend, and overbought momentum confirmation that the market is buying physical bullion as insurance against both inflation and financial stress. The category represents the apex of risk-off positioning within a risk-on macro regime, making it an essential ballast. Relative to other top-2 slot options, Precious Metals offers better diversification than Industrial Metals while maintaining equal conviction; it is the portfolio's monetary-system hedge.
AI — SMH
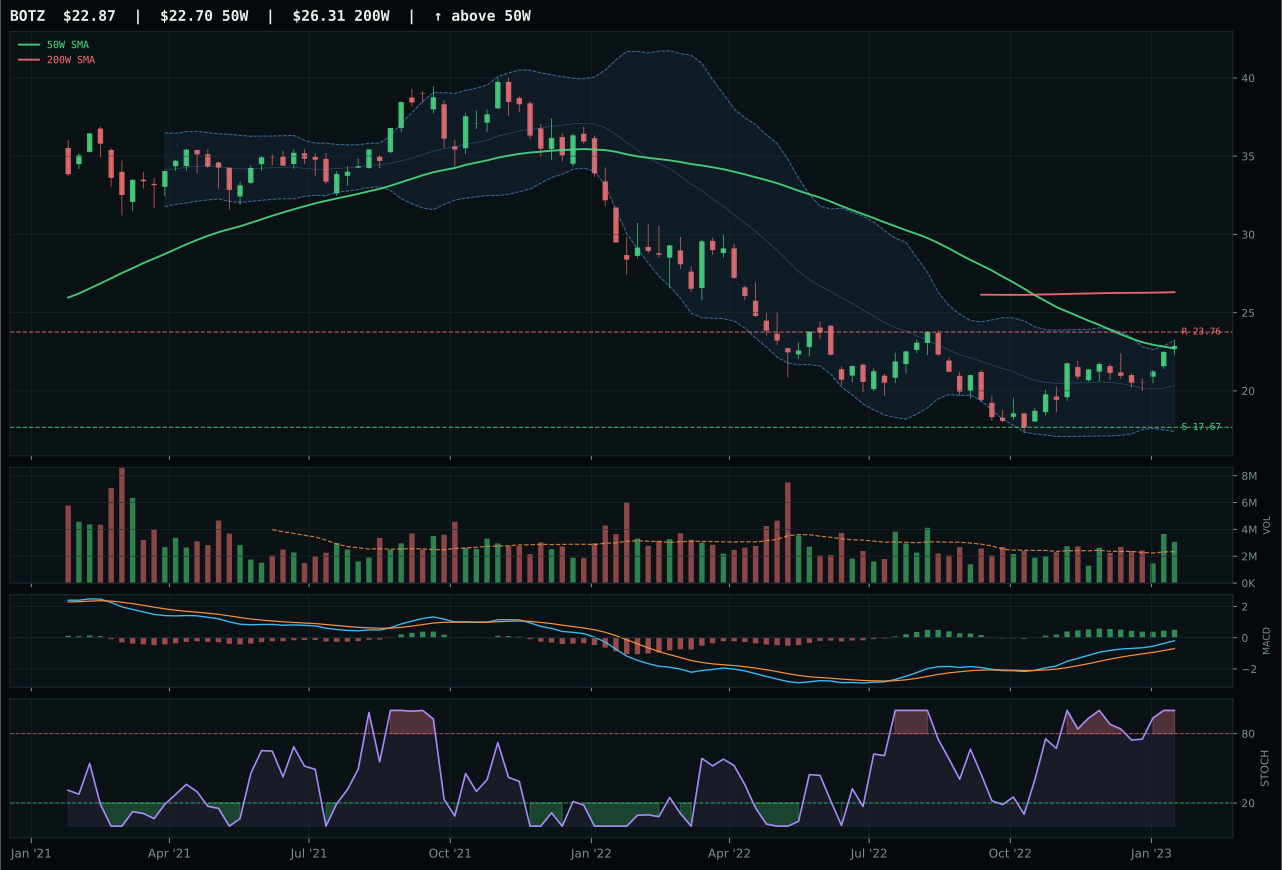
BOTZ has a compression near 50W profile with 16.3% 13-week relative strength versus SPY.
A failed hold above support would weaken the setup.
Actionable but governed by invalidation levels.
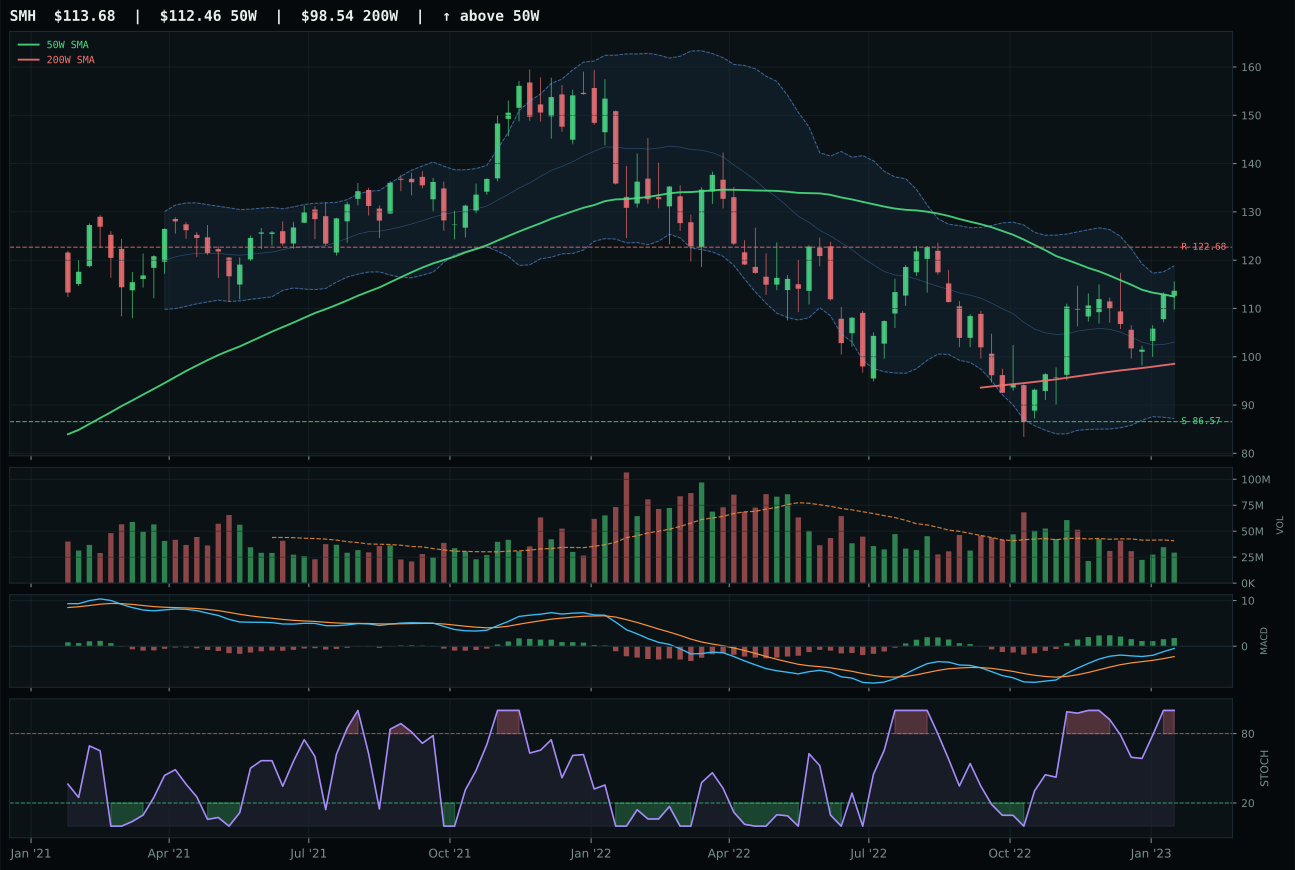
SMH has a compression near 50W profile with 16.2% 13-week relative strength versus SPY.
A failed hold above support would weaken the setup.
Actionable but governed by invalidation levels.
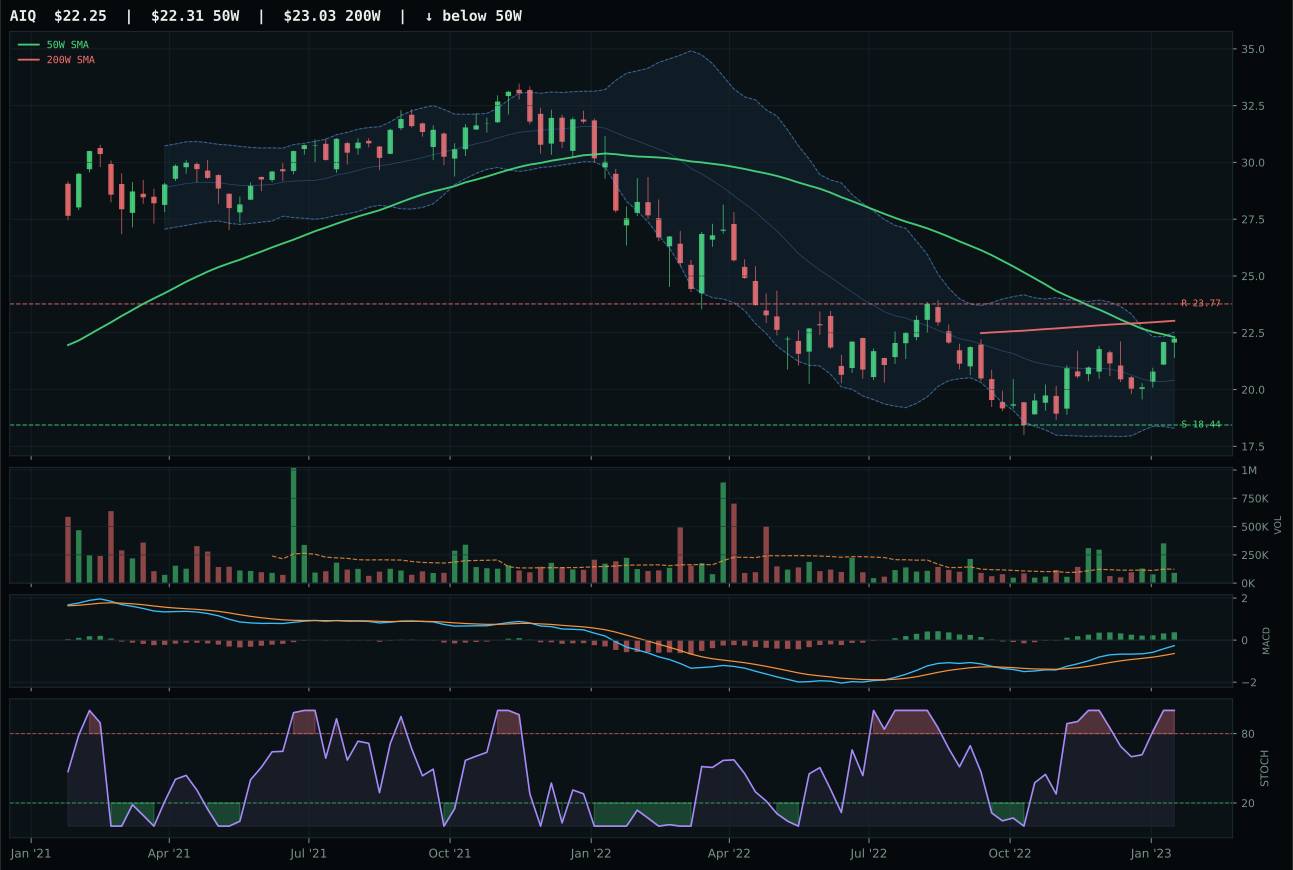
AIQ has a compression near 50W profile with 8.2% 13-week relative strength versus SPY.
Extension and support failure are the main tactical risks.
Tracked, but not top-2 eligible because: structurally broken.
SMH edges BOTZ by a single point in risk-reward ratio because it offers better asymmetry despite identical momentum scores and nearly matched relative strength. Both ETFs compress near their 50-week pivot with MACD bullish and improving, stochastic RSI maxed at 1.00, and thirteen-week returns around 22%; the difference lies in volume sponsorship and entry risk. SMH's thinner participation at 0.72x the twenty-week average hints at accumulation by smart money rather than crowded breakout buying, whereas BOTZ's above-average volume warns that the move may have already shifted from institutional accumulation to retail distribution. SMH's neutral structure and tight 1.1% proximity to the 50-week line create a lower-friction entry than BOTZ, which sits in explicit vertical extension territory.
AI ranks third overall with a 65.6 score, earning 10% despite strong technicals because the late-cycle backdrop limits its allocation weight. AI growth sponsorship is among the most powerful active macro descriptors at +14, and risk appetite is positive at +10, but liquidity stress penalizes the category at -12 and erodes conviction. The category macro fit of 62.0 trails both commodities categories significantly. SMH and BOTZ are both overbought and compressed, offering excellent tactical timing but poor entry dynamics for a 20% commitment. Liquidity conditions would need to stabilize and the reflation narrative to soften before AI can graduate to a top-two slot; until then, it serves as a tactical satellite position that captures upside without exposing the portfolio to extended-valuation compression collapse.
Nuclear Energy — URNM
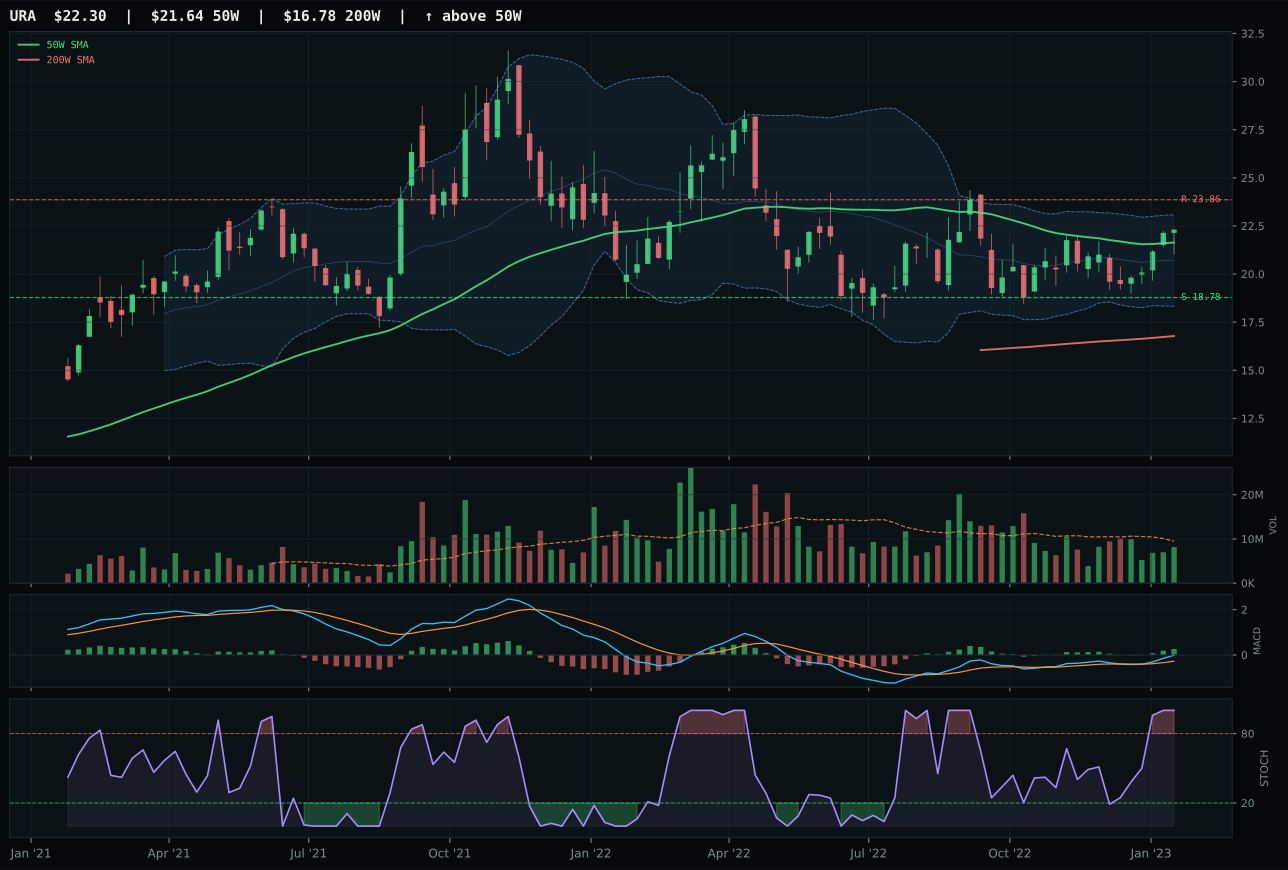
URA has a neutral structure profile with 3.8% 13-week relative strength versus SPY.
A failed hold above support would weaken the setup.
Actionable but governed by invalidation levels.
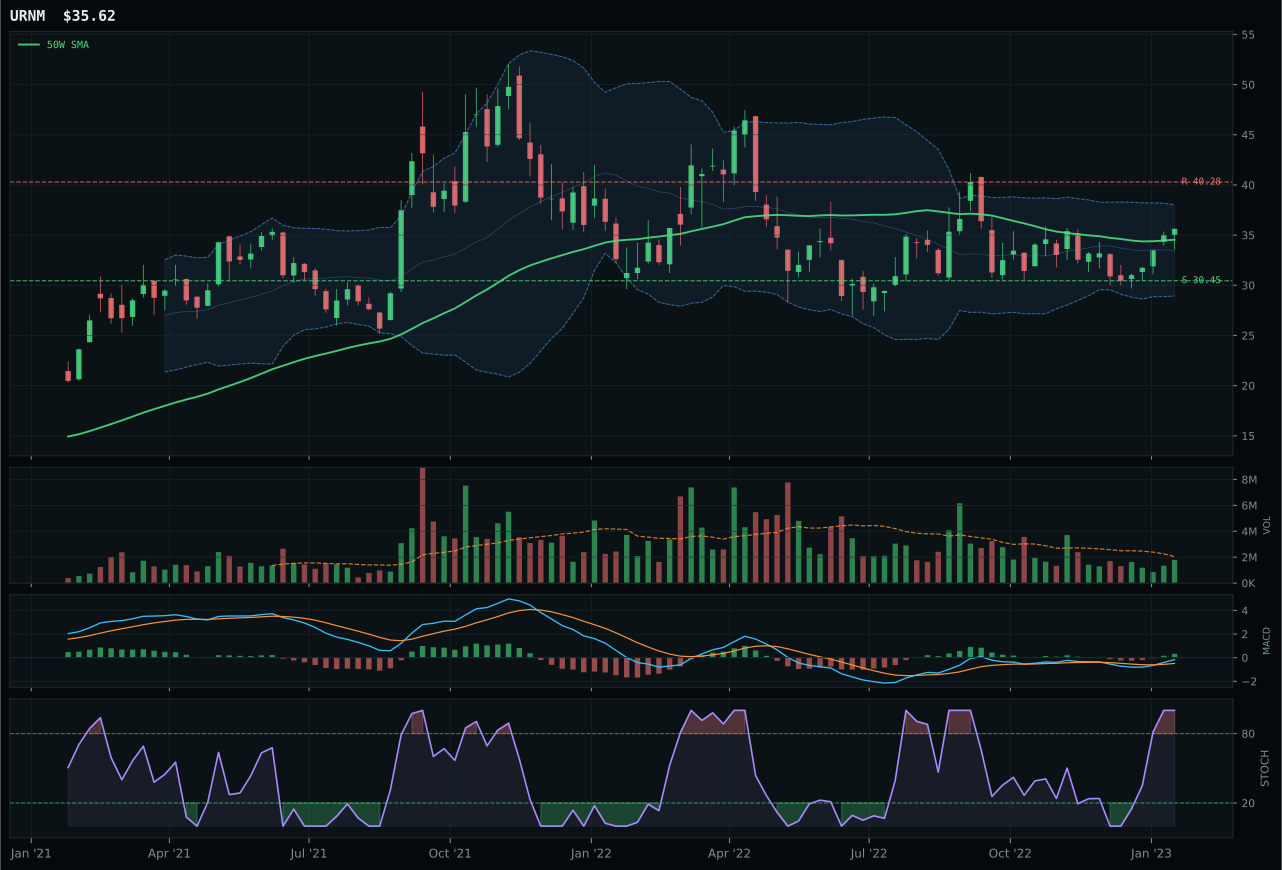
URNM has a neutral structure profile with -1.2% 13-week relative strength versus SPY.
A failed hold above support would weaken the setup.
Actionable but governed by invalidation levels.
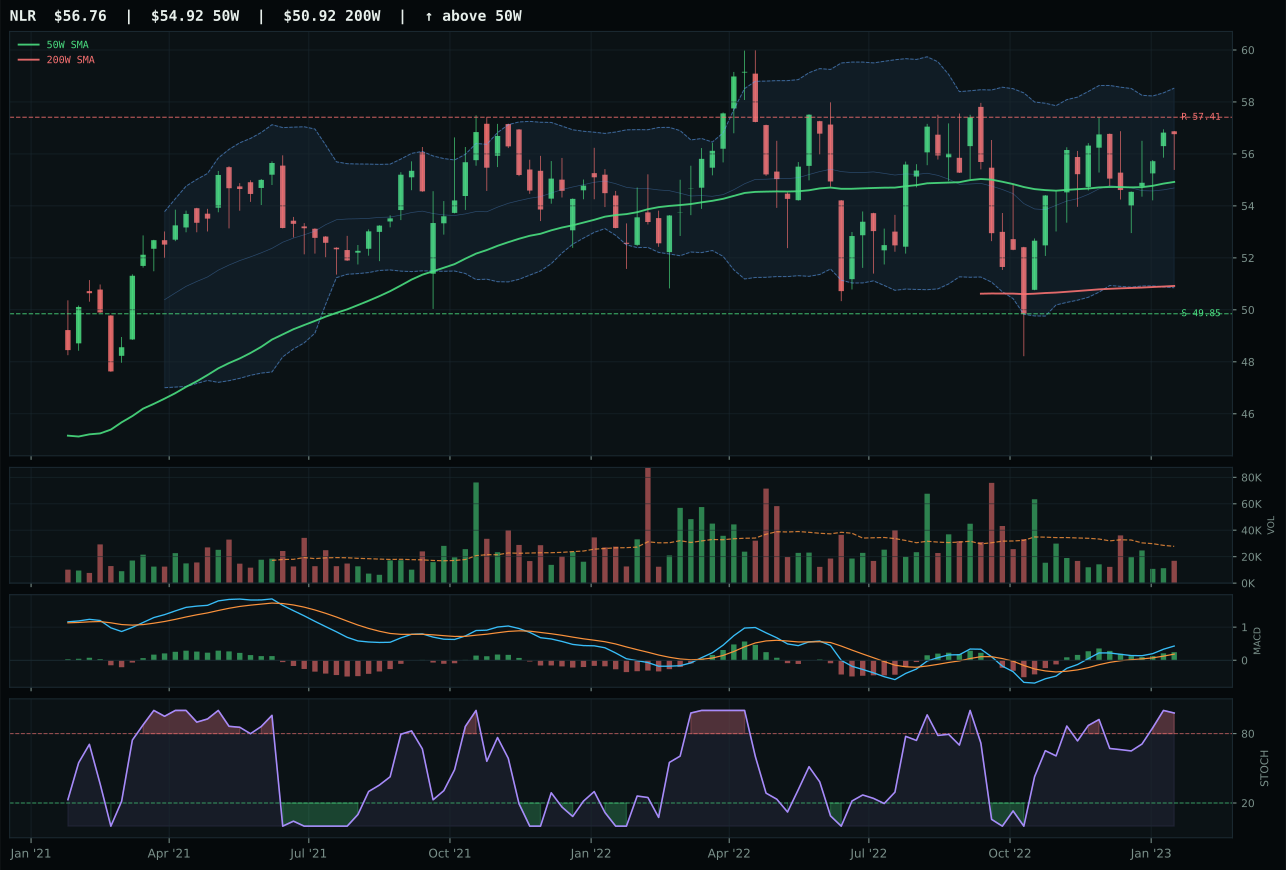
NLR has a neutral structure profile with 2.0% 13-week relative strength versus SPY.
A failed hold above support would weaken the setup.
Tracked, but not top-2 eligible because: .
URNM edges URA on superior risk-reward asymmetry despite trailing on absolute technical evidence and momentum scores. Both ETFs compress near their 50-week pivots with MACD bullish and improving and stochastic RSI overbought at 1.00, but URNM's 65.3 risk-reward ratio outperforms URA's 59.3 because upside to resistance is similarly capped at 11-12% while downside to support is deeper at 17.0%, giving URNM more edge on the long side. URA's neutral structure and flawless trend score of 100 cannot overcome its lower category-relative strength of -3.2%, suggesting that the broader uranium complex is outperforming the pure-play miners. URNM's category-relative weakness is real, but the broader risk-reward edge proves decisive in a tight matchup; this is a case where asymmetry beats raw momentum.
Nuclear Energy justifies 10% because energy scarcity is a legitimate macro driver at +9, real-asset sponsorship adds +7, and late-cycle reflation provides +7, but macro fit remains only 74.0—trailing both commodity categories and matching AI. URNM's chart sits defensively below the 200-week moving average despite a bullish MACD, and the thirteen-week return of 4.6% is modest, suggesting that uranium enthusiasm is priced in but not yet accelerating. URA's superior technical evidence of 87.0 hints that a macro inflection could favor the pure-play miners more than the equity-focused URNM, but current volume sponsorship and relative strength favor URNM's more patient positioning. The allocation holds nuclear as an energy-scarcity play separate from oil and as a tail hedge on power-demand growth; to reach 20%, URNM would need to break above its 40.28 resistance with volume confirmation.
Traditional Energy — XLE
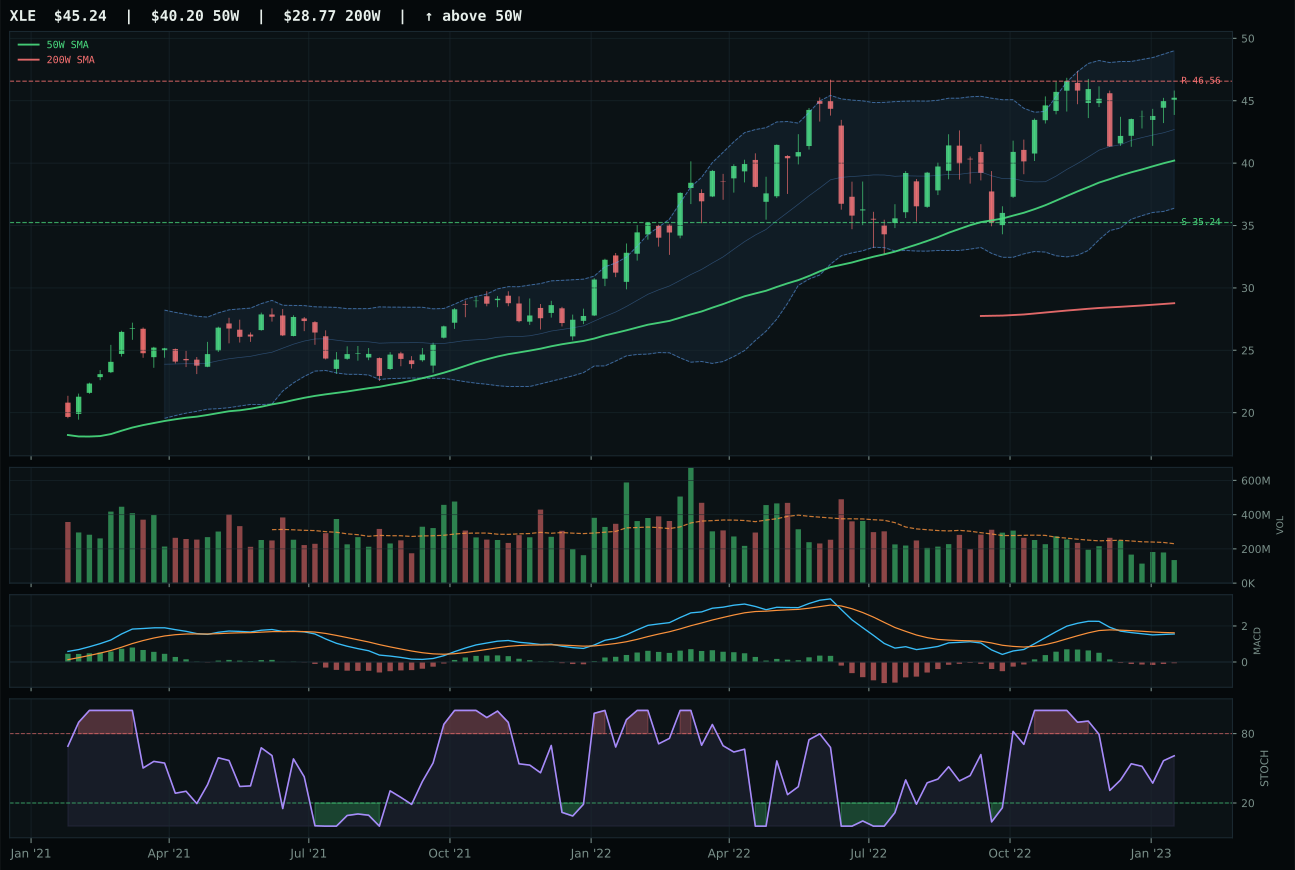
XLE has a neutral structure profile with -1.7% 13-week relative strength versus SPY.
A failed hold above support would weaken the setup.
Actionable but governed by invalidation levels.
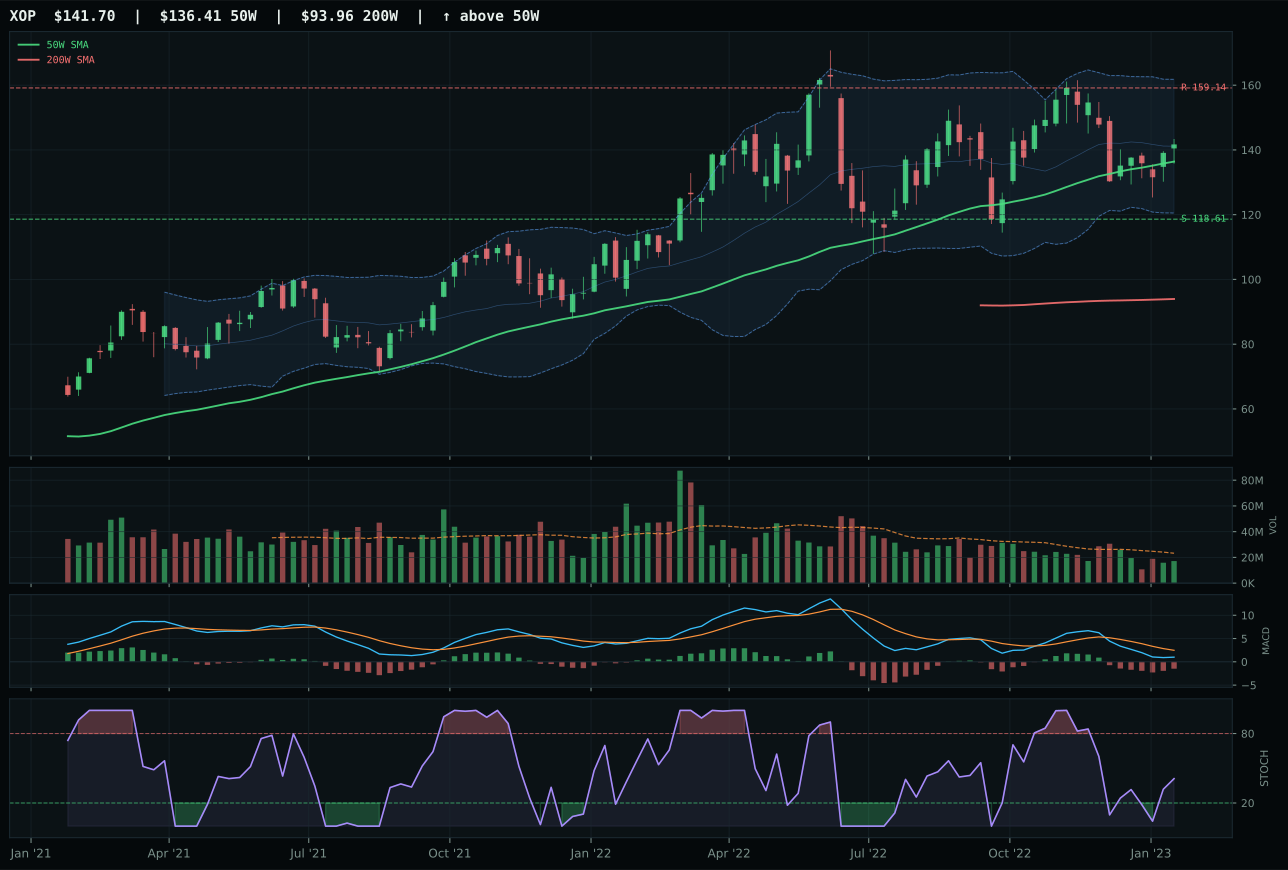
XOP has a neutral structure profile with -9.8% 13-week relative strength versus SPY.
A failed hold above support would weaken the setup.
Actionable but governed by invalidation levels.
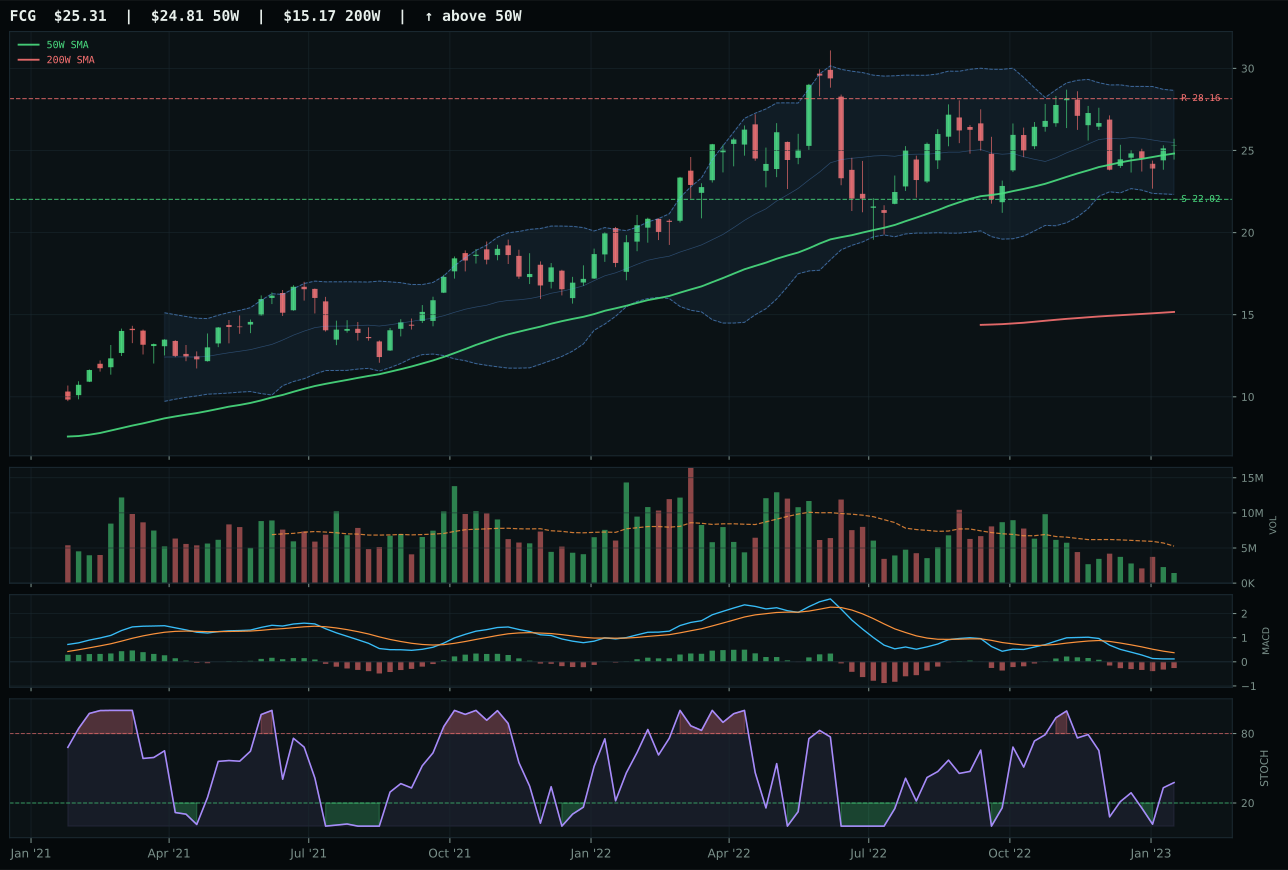
FCG has a compression near 50W profile with -10.0% 13-week relative strength versus SPY.
A failed hold above support would weaken the setup.
Actionable but governed by invalidation levels.
XLE wins Traditional Energy with a 64.0 score on the back of superior structure cleanliness and category-relative strength despite a weaker momentum picture than some peers. The ETF sits 12.5% above its 50-week moving average with a trend score of 90.5—price above both major averages, slope steady at 0.5%, relative strength of -1.7% versus SPY offset by +8.1% relative to the category median—while structure remains clean at 75.6. MACD has shifted to bearish but is improving, and stochastic RSI rising mid-zone at 0.61 signals early-stage recovery rather than overbought exhaustion. XOP and FCG both underperform because they lack category-relative strength; their negative SPY-relative returns suggest that energy strength is narrowing to the integrated cash-flow story rather than broadening into exploration and natural-gas plays.
Traditional Energy earns 10% despite a 97.0 macro fit—the highest across all categories—because the technical setup is too extended and momentum too weak to justify heavier allocation. Energy scarcity is +16, inflation pressure is +10, supply shortage is +9, and real-asset sponsorship is +7, creating an exceptional macro tailwind; however, XLE's chart shows distribution volume at 0.59x the twenty-week average, indicating that strength is driven by macro enthusiasm rather than institutional accumulation. The entry at 12.5% above the 50-week line and MACD deterioration to bearish status create timing friction that offsets the macro conviction. Late-Cycle Reflation should elevate this category to 20%, but XLE's technical evidence of 74.3 trails both Precious Metals and Industrial Metals significantly, making it a lower-confidence execution of an otherwise outstanding macro thesis. A push to new highs with volume confirmation would warrant doubling the allocation.
Agriculture & Livestock — VEGI
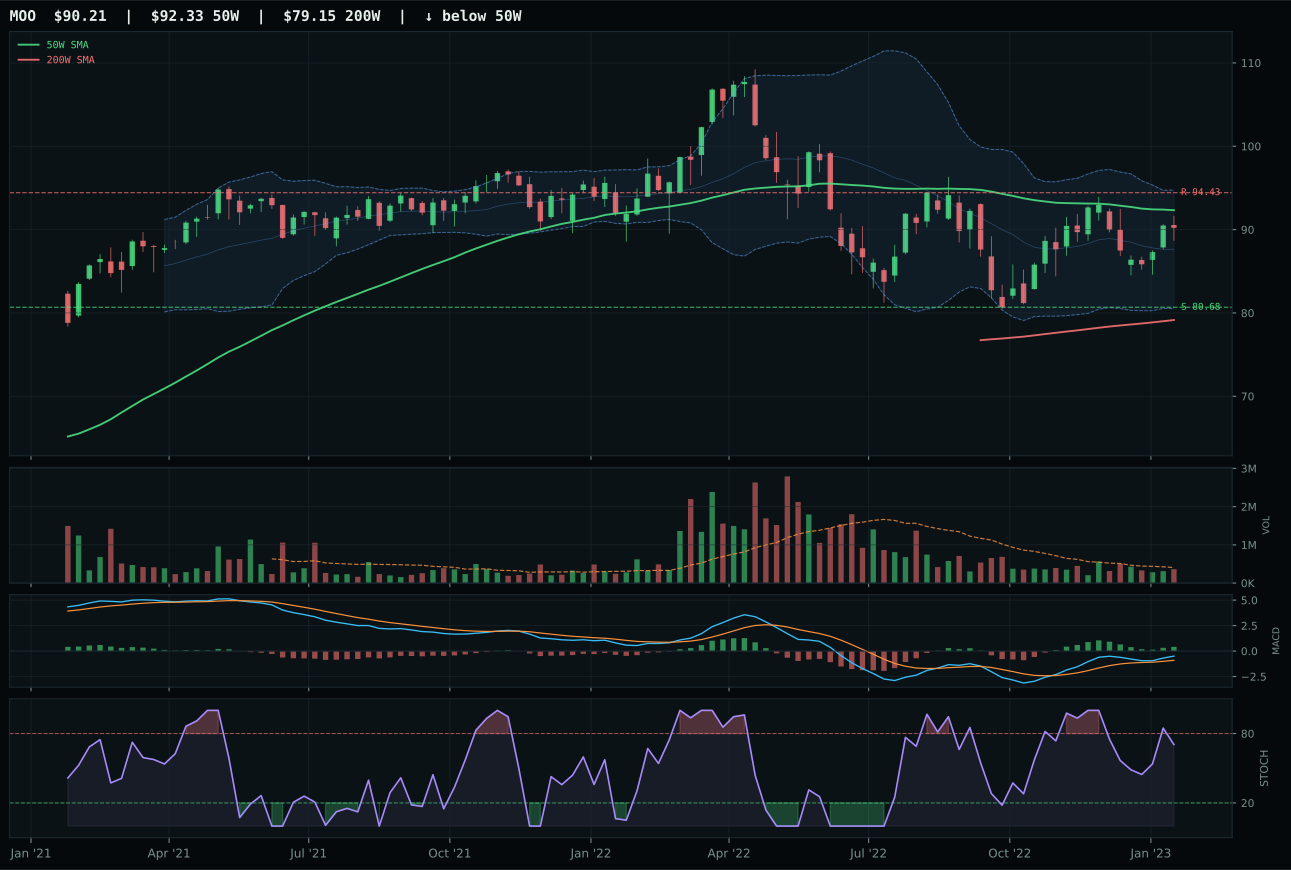
MOO has a compression near 50W profile with -0.6% 13-week relative strength versus SPY.
A failed hold above support would weaken the setup.
Actionable but governed by invalidation levels.
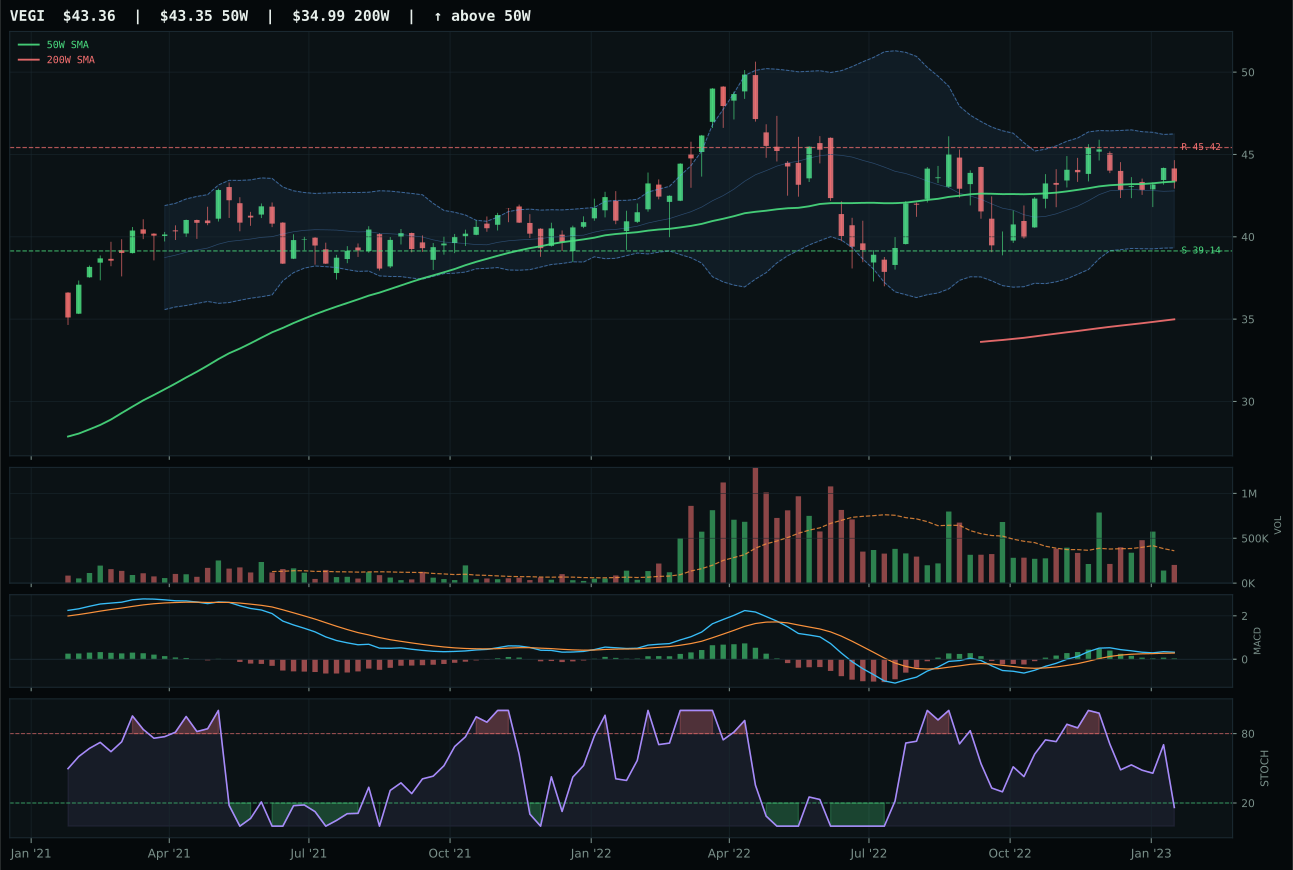
VEGI has a compression near 50W profile with -3.3% 13-week relative strength versus SPY.
A failed hold above support would weaken the setup.
Actionable but governed by invalidation levels.
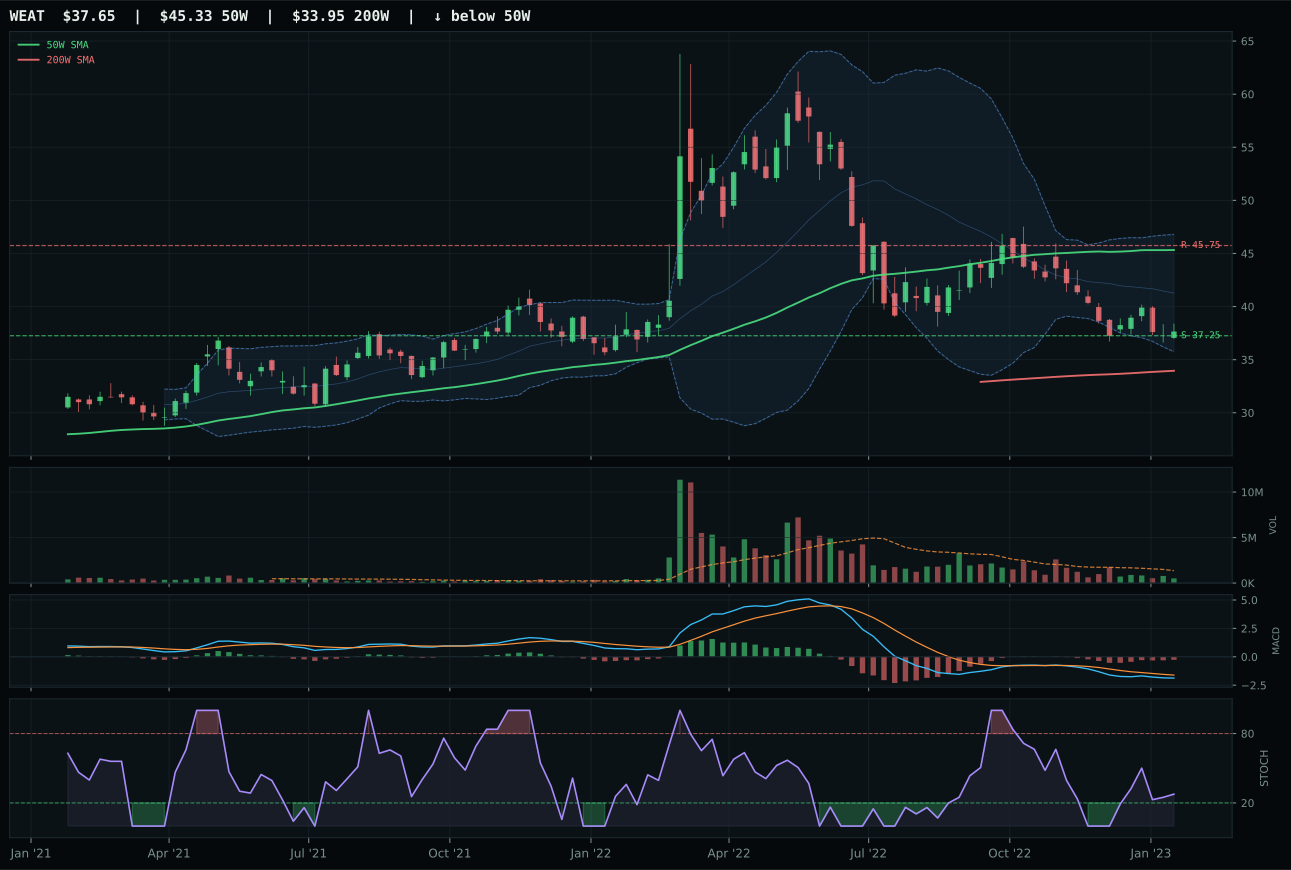
WEAT has a pullback into support profile with -19.0% 13-week relative strength versus SPY.
A failed hold above support would weaken the setup.
Actionable but governed by invalidation levels.
VEGI edges MOO by 2.4 points on the strength of its superior trend score and impeccable timing despite weaker momentum confirmation. Both ETFs sit exactly at or just above their 50-week lines—VEGI precisely at 0.0% distance, MOO at compression—and both compress with MACD bullish but flattening; the separation comes from cleanliness and stochastic RSI action. VEGI's trend of 91 bests MOO's 64 because its price structure shows less degradation in the daily teardown, while stochastic RSI at oversold (0.16) signals mean reversion potential that MOO's rising mid-zone cannot match. MOO's risk-reward is marginally tighter at 59.8 versus 60.6, but VEGI's 100-point perfect timing score—reflecting the exact 50-week pivot and Fib 0.500 zone alignment—clinches the category leadership.
Agriculture & Livestock justifies 10% allocation despite a robust 60.0 category score because the macro environment is so favorable it overwhelms the technical setup quality. The category macro fit is 90.0—the second-highest across all ten categories—with supply shortage at +13, inflation pressure at +10, and real-asset sponsorship at +8, creating a tail wind that would elevate even a weaker technical representative. VEGI's momentum confirmation scored only 49.8 due to minimal thirteen-week return of 2.5%, and volume participation remains thin, suggesting the move is patient rather than urgent. A 10% allocation would require either acceleration in price momentum or a decisive breach above 45.42 resistance; currently, the category serves as a macro insurance overlay and inflation hedge rather than a primary growth engine.
Utilities & Infrastructure — PAVE
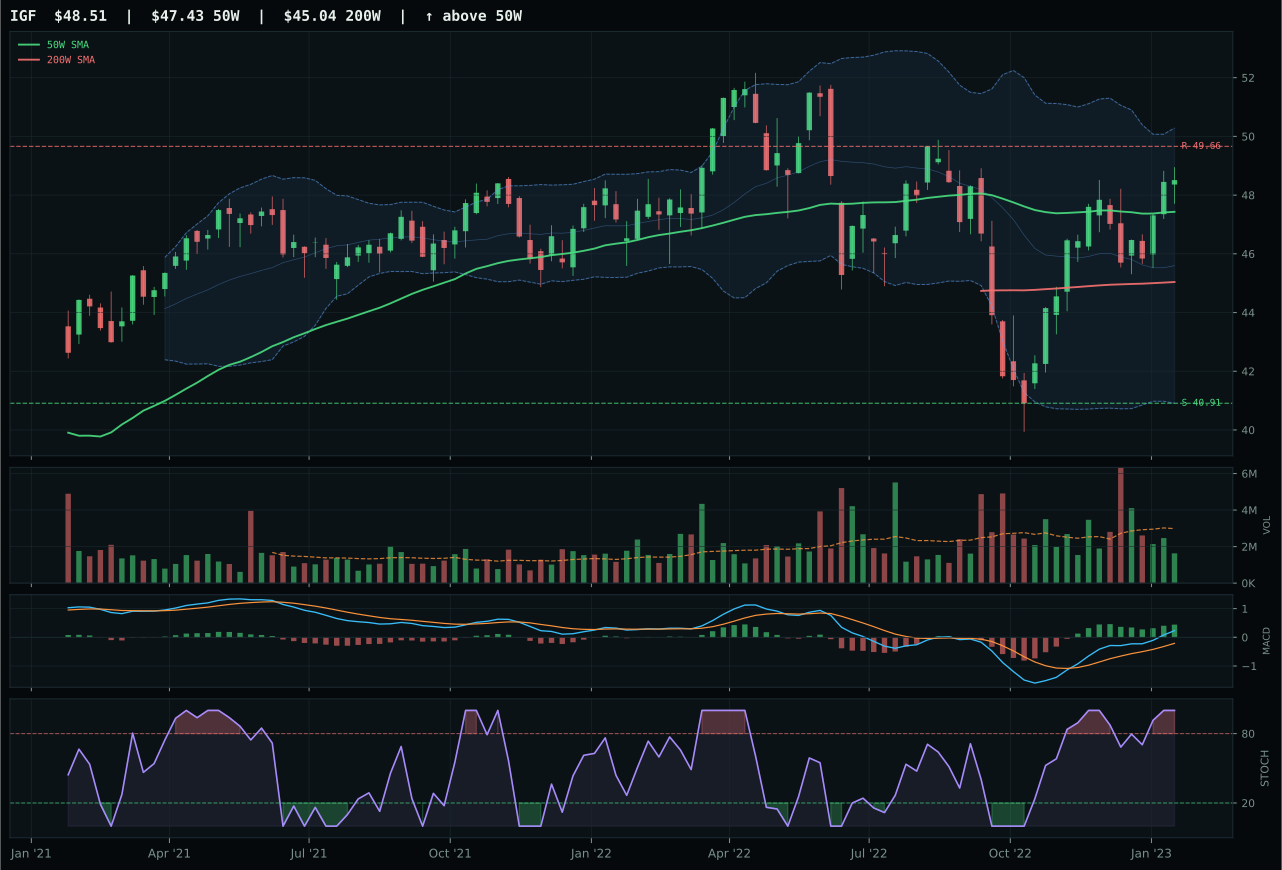
IGF has a compression near 50W profile with 9.0% 13-week relative strength versus SPY.
A failed hold above support would weaken the setup.
Actionable but governed by invalidation levels.
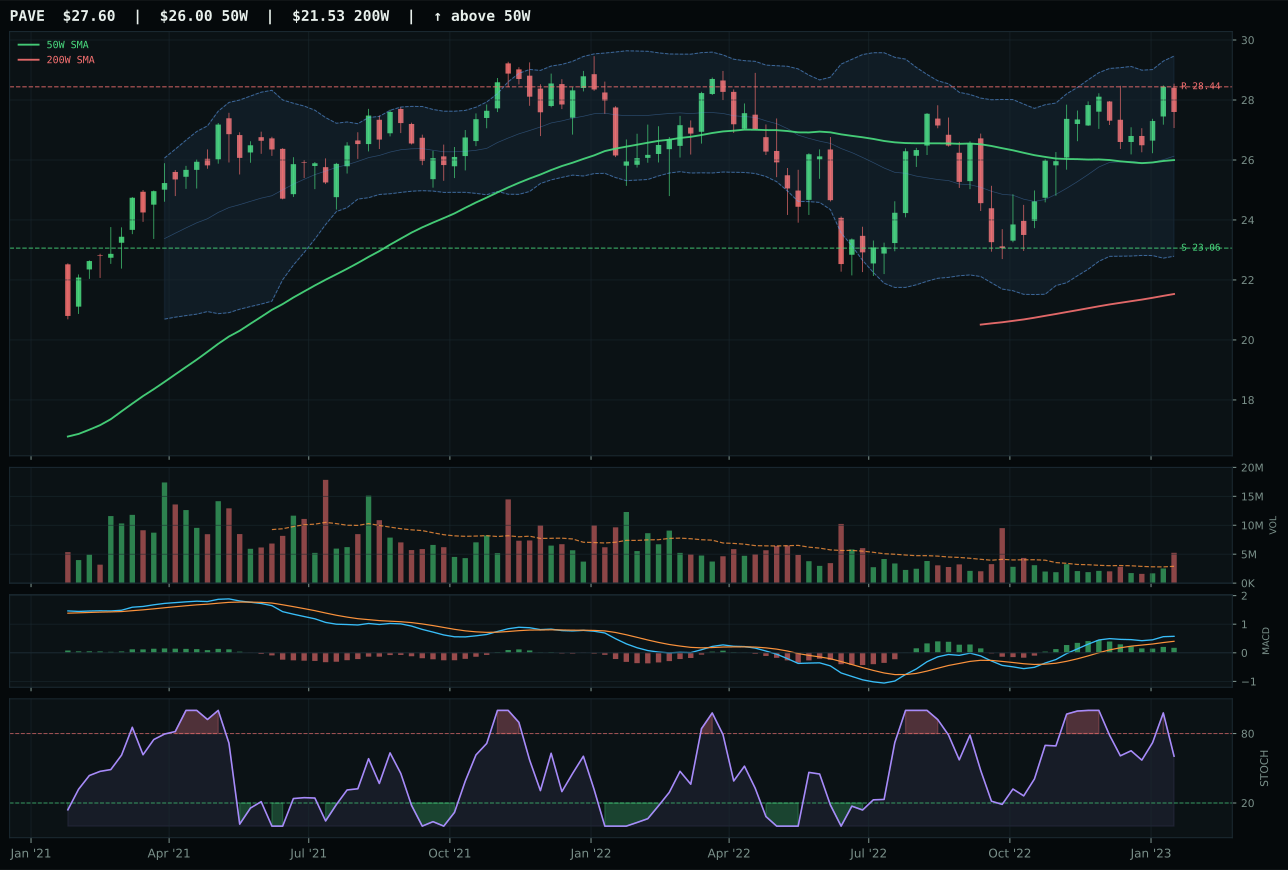
PAVE has a neutral structure profile with 6.3% 13-week relative strength versus SPY.
A failed hold above support would weaken the setup.
Actionable but governed by invalidation levels.
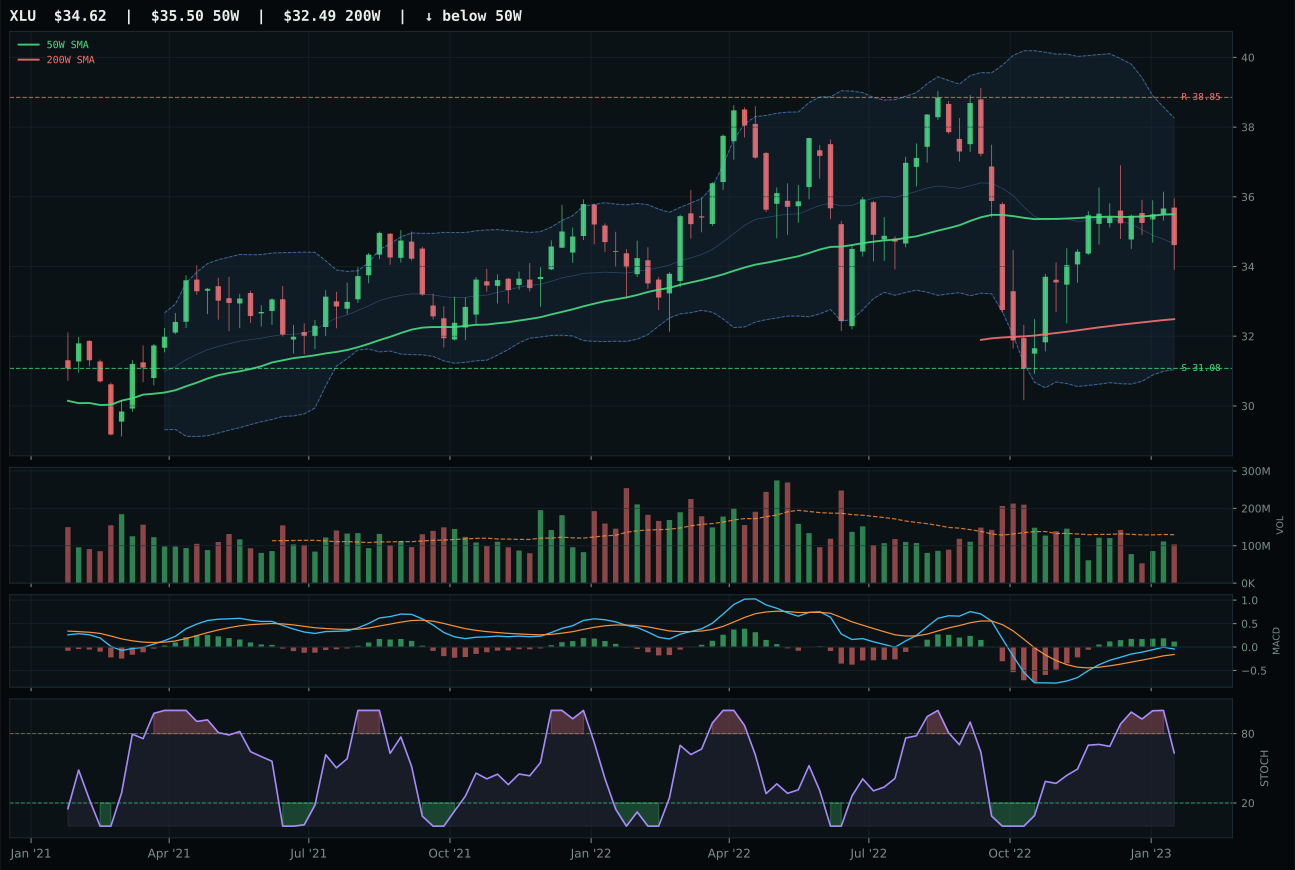
XLU has a compression near 50W profile with 3.6% 13-week relative strength versus SPY.
A failed hold above support would weaken the setup.
Actionable but governed by invalidation levels.
PAVE claims Utilities & Infrastructure despite trailing IGF's superior technical evidence because its distribution volume and flattening MACD create the preferred entry for an extended category. IGF scores a commanding 84.4 on technical evidence with overbought stochastic RSI and bullish improving MACD, but PAVE's perfect 100-point trend score and distribution volume at 1.80x the twenty-week average signal that smart money is using strength to sell infrastructure exposure into retail demand rather than accumulate. Both ETFs sit extended above their 50-week lines—PAVE at 6.2%, IGF at implicit compression—but PAVE's neutral structure and rising mid-zone stochastic RSI (0.60) offer cleaner supply absorption than IGF's overbought rollover setup. When entries are stretched and volume suspect, the allocator favors the lower-confidence name with the better structural timing.
Utilities & Infrastructure earns 10% as a defensive ballast because defensive rotation is an active descriptor at +12, but the category's 55.0 macro fit reveals why it cannot graduate to 20%. Late-Cycle Reflation favors cyclical hard assets, not rate-sensitive utilities, and liquidity stress carries a -3 headwind while inflation pressure actually becomes a -6 drag on utility valuations. PAVE's distribution volume and flattening MACD suggest institutional supply, which contradicts the bullish technical picture; this is a name that looks strong on the daily but feels like a short signal on the weekly. IGF's superior technical evidence cannot overcome the same macro misalignment. The allocation serves primarily as portfolio ballast and dividend capture during equity volatility spikes rather than as a growth or inflation-protection engine. It would require either a sharp pivot toward recession concerns or confirmation of stagflation severity to warrant doubling the position.
Emerging Markets — IEMG
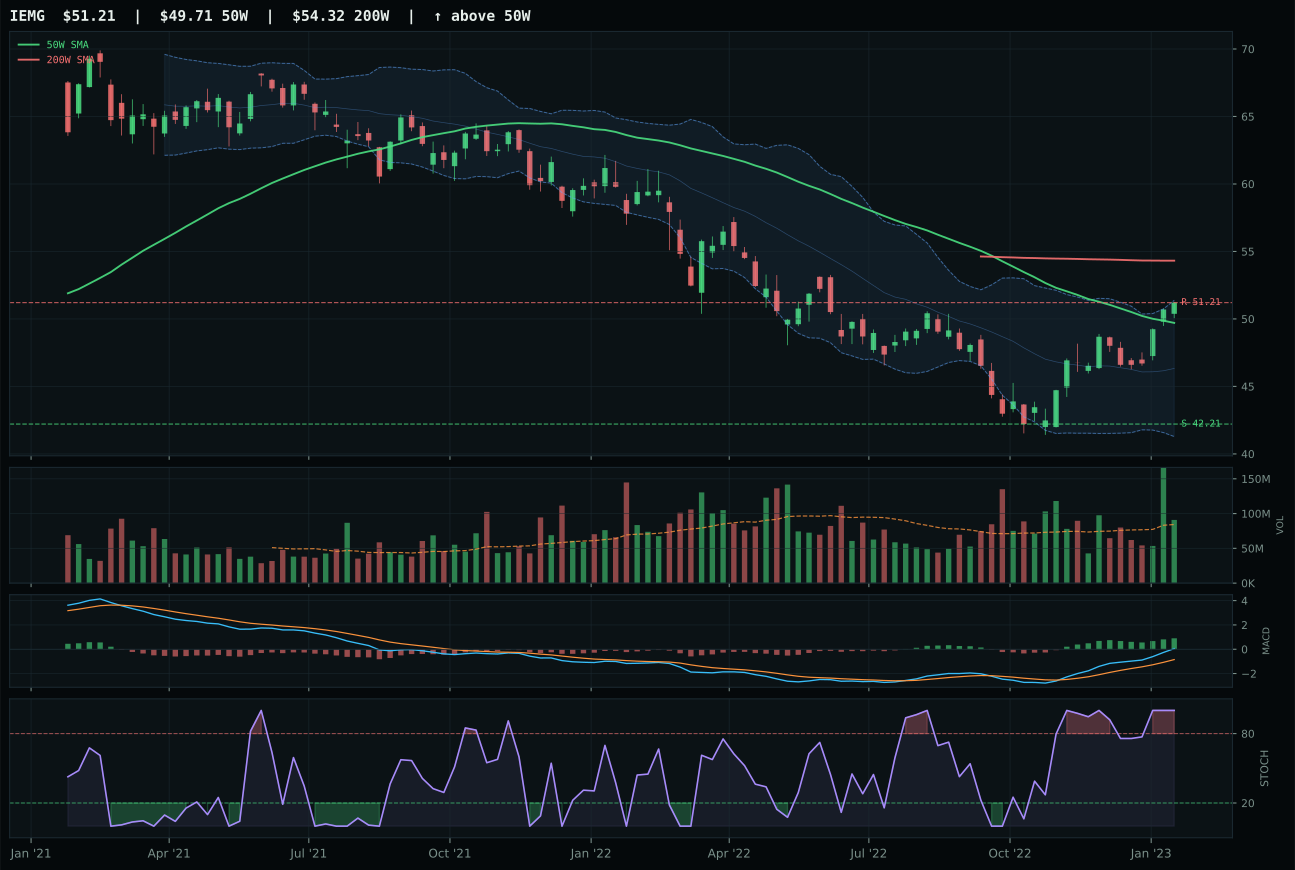
IEMG has a neutral structure profile with 12.1% 13-week relative strength versus SPY.
A failed hold above support would weaken the setup.
Actionable but governed by invalidation levels.
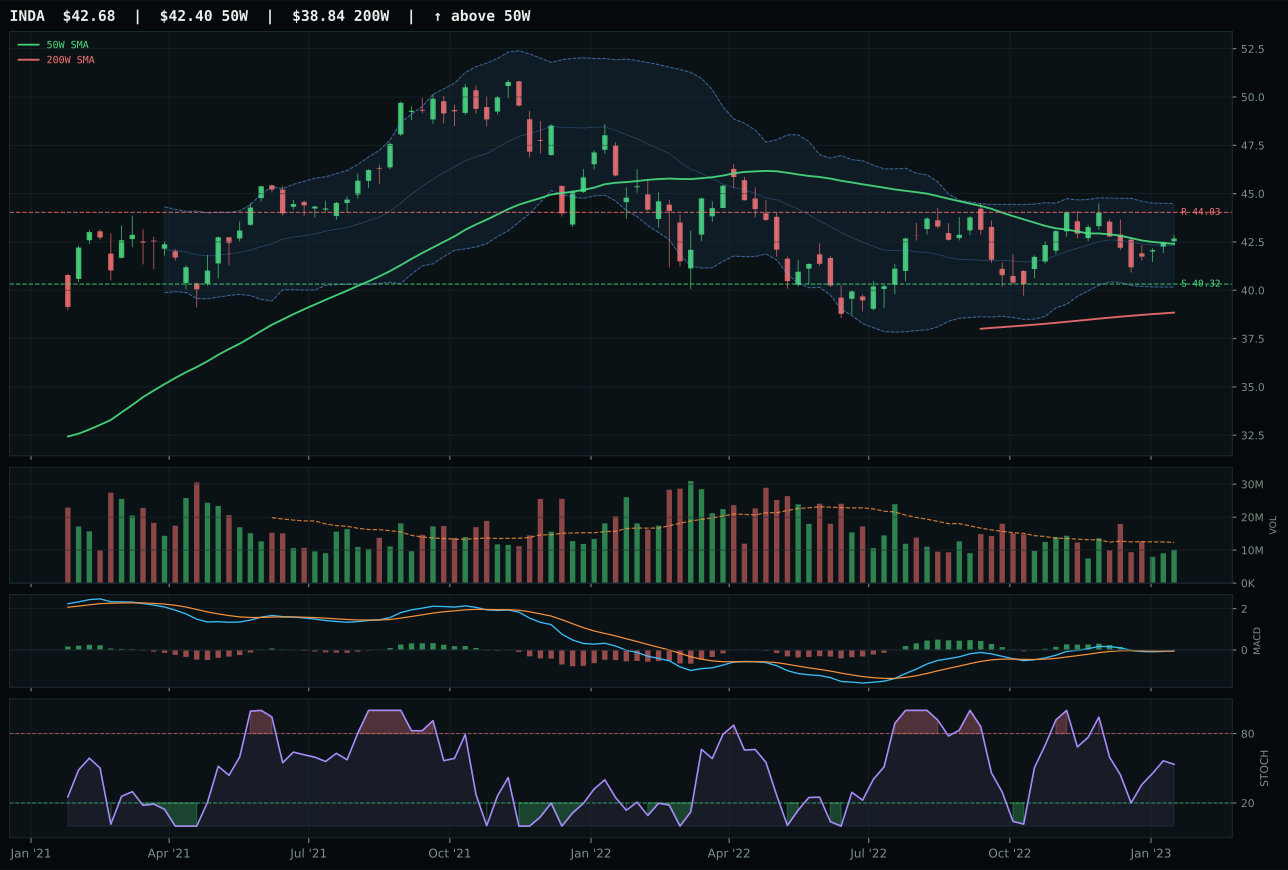
INDA has a compression near 50W profile with -3.5% 13-week relative strength versus SPY.
A failed hold above support would weaken the setup.
Actionable but governed by invalidation levels.
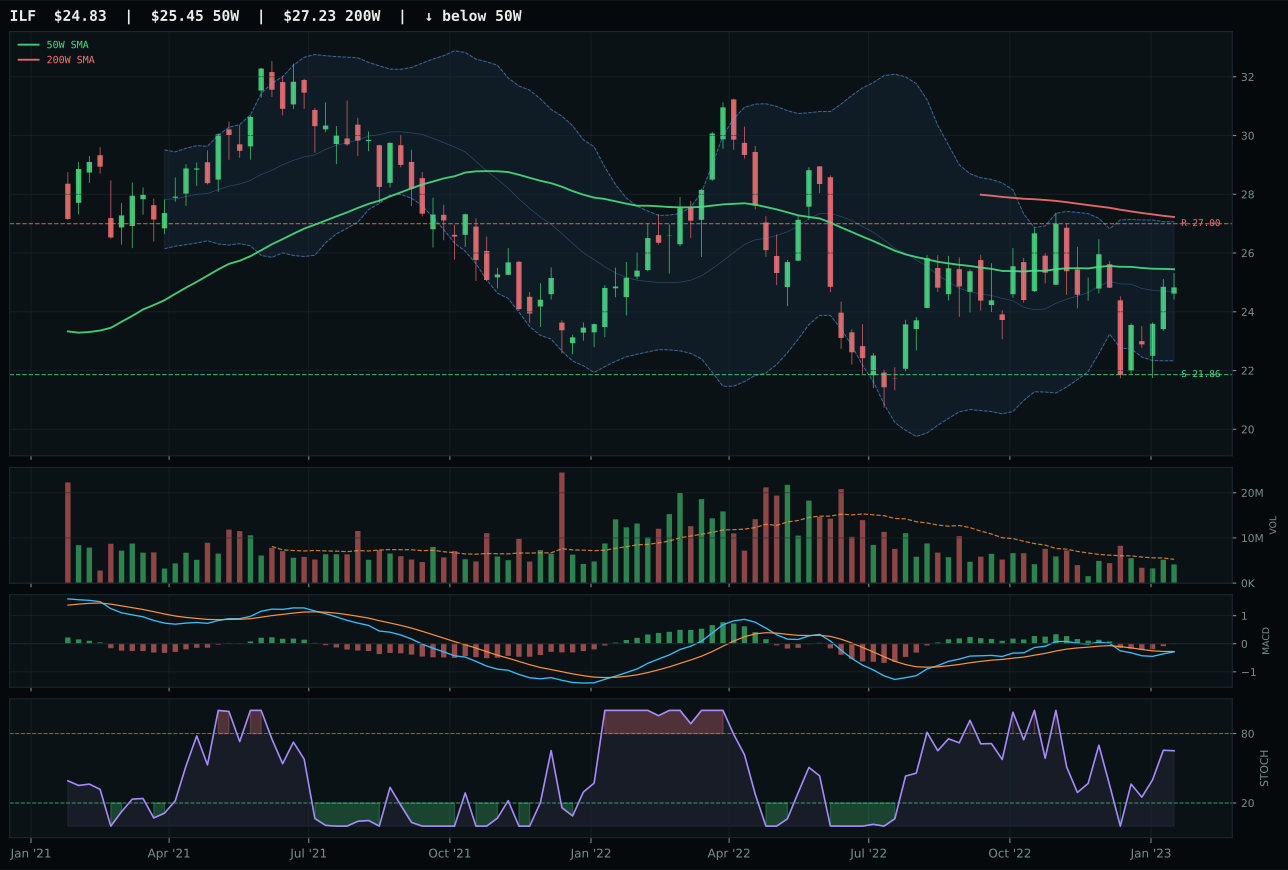
ILF has a compression near 50W profile with -12.7% 13-week relative strength versus SPY.
Extension and support failure are the main tactical risks.
Tracked, but not top-2 eligible because: structurally broken.
IEMG triumphs over INDA on the back of exceptional relative strength despite a narrower technical evidence score. Both ETFs sit near their 50-week pivots—IEMG at exactly 3.0% above, INDA at compression—with MACD bullish and improving, but IEMG's category-relative strength of 15.6% dominates INDA's 0.0%, signaling that broad emerging-market beta is outpacing India-specific quality. IEMG's thirteen-week return of 17.8% with perfect momentum confirmation at 100.0 reflects genuine accumulation, while INDA's 2.3% thirteen-week return and rising mid-zone stochastic RSI suggest the India narrative has stalled relative to broader EM exposure. INDA's cleaner structure at compression near the 50-week line would normally compete, but IEMG's absolute momentum and category leadership make it the unambiguous choice.
Emerging Markets earns 10% because technical strength and relative momentum are not enough to overcome a 48.0 macro fit that lags all other categories except Technology. Risk appetite is positive at +6, but liquidity stress is a -10 headwind that dominating conviction. IEMG's perfect momentum score and 12.1% relative strength versus SPY prove that emerging markets are gaining traction, but the current macro regime penalizes growth and favors hard assets, making this a token tactical position rather than a structural holding. The thirteen-week return of 17.8% is exceptional, but the setup sits precisely at mean reversion risk with zero resistance buffer, and volume at 1.08x the twenty-week average suggests retail rather than institutional accumulation. To reach 20%, Emerging Markets would require either a shift away from late-cycle reflation toward early-cycle growth, or confirmation that Fed easing is imminent; currently, it serves as a sentiment hedge and valuation diversifier within a commodity-dominated portfolio.
Technology — XLK
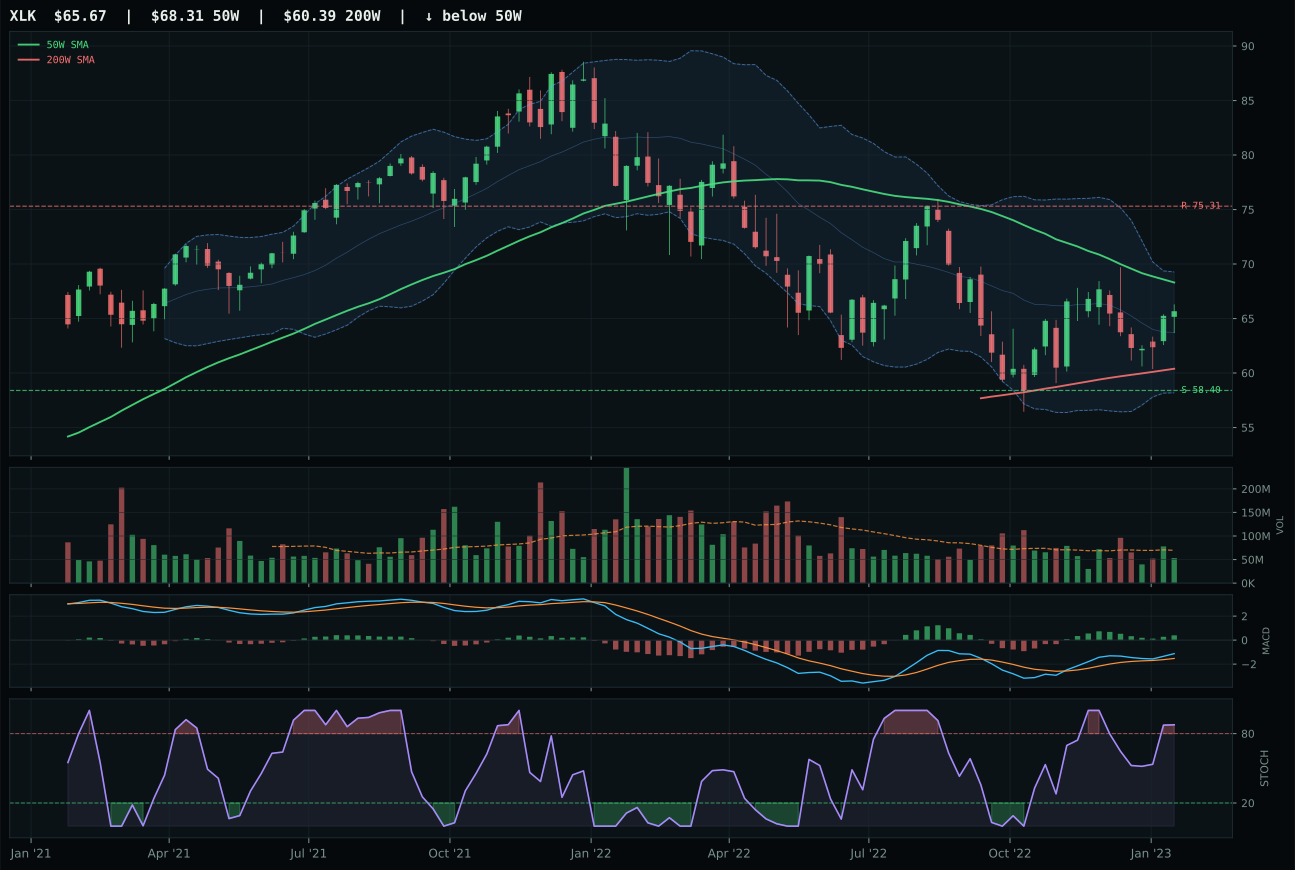
XLK has a neutral structure profile with -0.1% 13-week relative strength versus SPY.
A failed hold above support would weaken the setup.
Actionable but governed by invalidation levels.
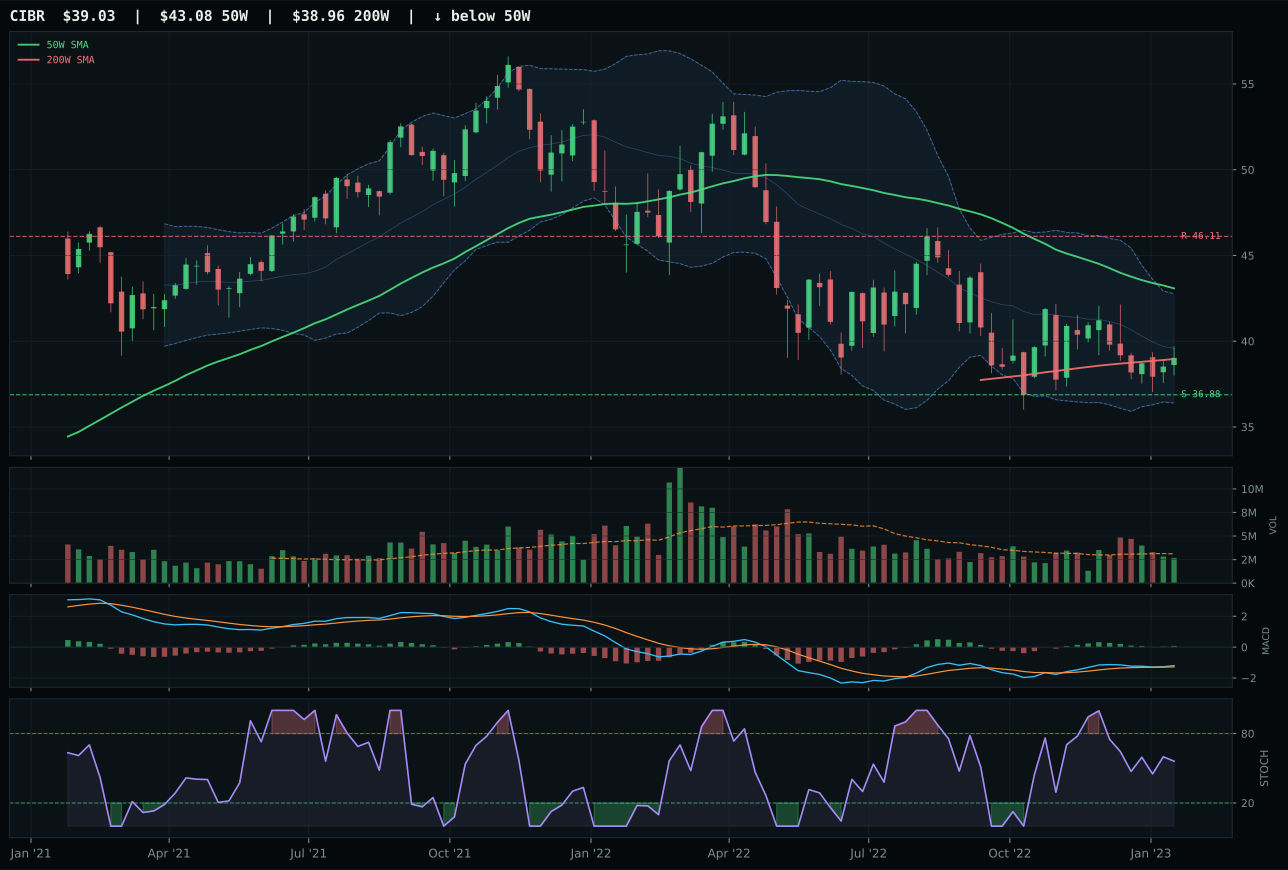
CIBR has a neutral structure profile with -7.3% 13-week relative strength versus SPY.
A failed hold above support would weaken the setup.
Actionable but governed by invalidation levels.
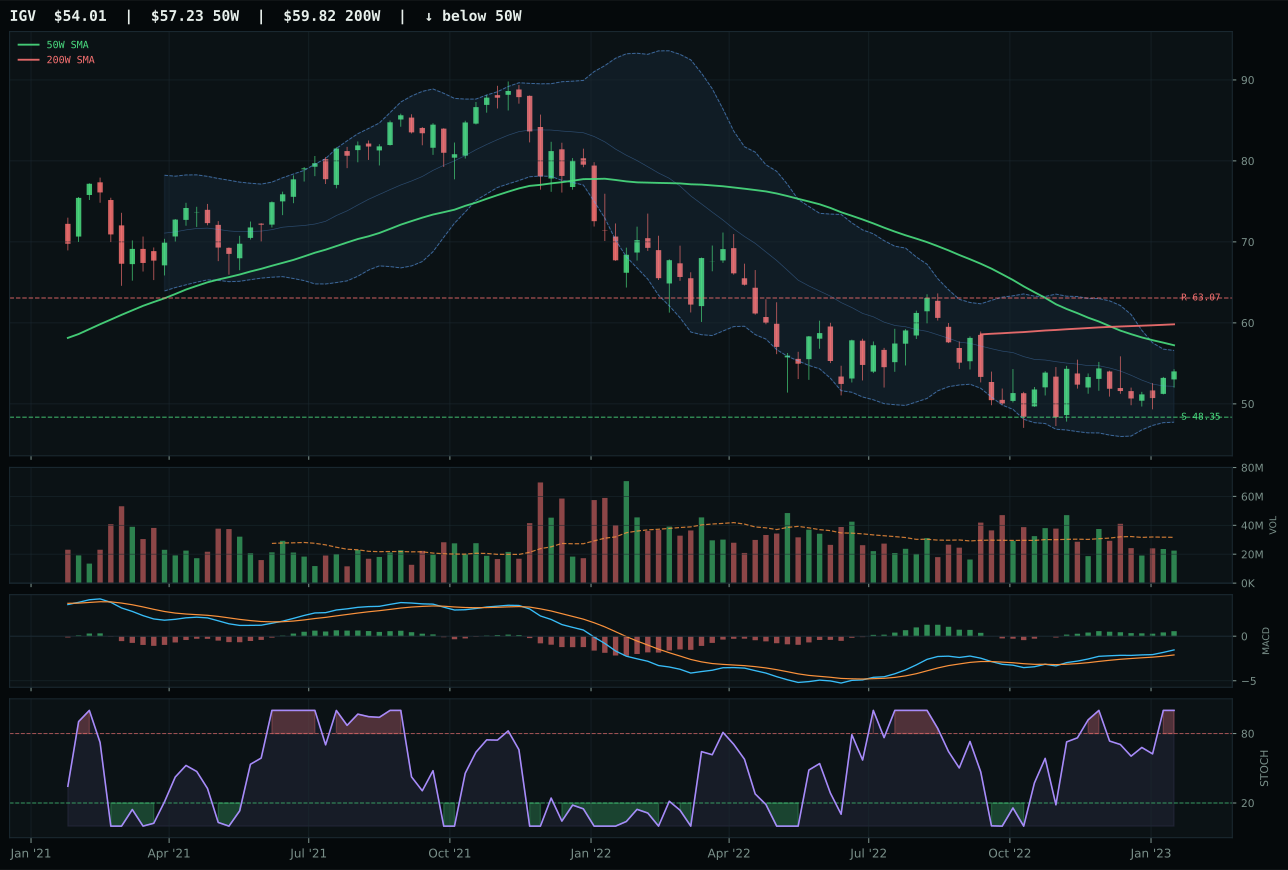
IGV has a neutral structure profile with -1.5% 13-week relative strength versus SPY.
Extension and support failure are the main tactical risks.
Tracked, but not top-2 eligible because: structurally broken.
XLK seized the category because it commands a clean setup at the intersection of mean reversion and momentum confirmation. The ETF sits 3.9% below its 50-week moving average—deep enough into the value zone to attract bargain hunters but not so extended that new buyers are overpaying—while MACD is bullish and improving and stochastic RSI has reached overbought territory at 0.88, signaling conviction without exhaustion. Category-relative strength of 1.3% and a 5.6% thirteen-week return prove that accumulation is real, not just a bounce. CIBR failed because its MACD is flattening rather than improving, its relative strength lags at -5.9% versus the basket, and timing scored 27 points lower due to weaker stochastic RSI action and distribution pressure in the price structure.
Technology earned 0% allocation this week and ranks 9th among the ten categories, dragged down by a category-level macro fit of just 51.0 out of 100 in a Late-Cycle Reflation regime. The tension is clear: AI growth sponsorship is actively supporting the space (+6), and risk appetite remains positive (+9), but liquidity stress is active and pressing (-10), while inflation pressure works against multiple expansion (-4). This creates a headwind that keeps even the cleanest technical setup from reaching top-2 tier. For Technology to earn a portfolio slot, the category would need either a macro pivot toward growth prioritization over inflation defense, or the sector's internal technicals to accelerate—specifically, the winning ETF's RS versus SPY would need to turn positive and MACD confirmation would need to strengthen across the entire three-ETF basket. Until one of those conditions materializes, the capital is better deployed into categories with stronger macro tailwinds.
Defense & Aerospace — XAR
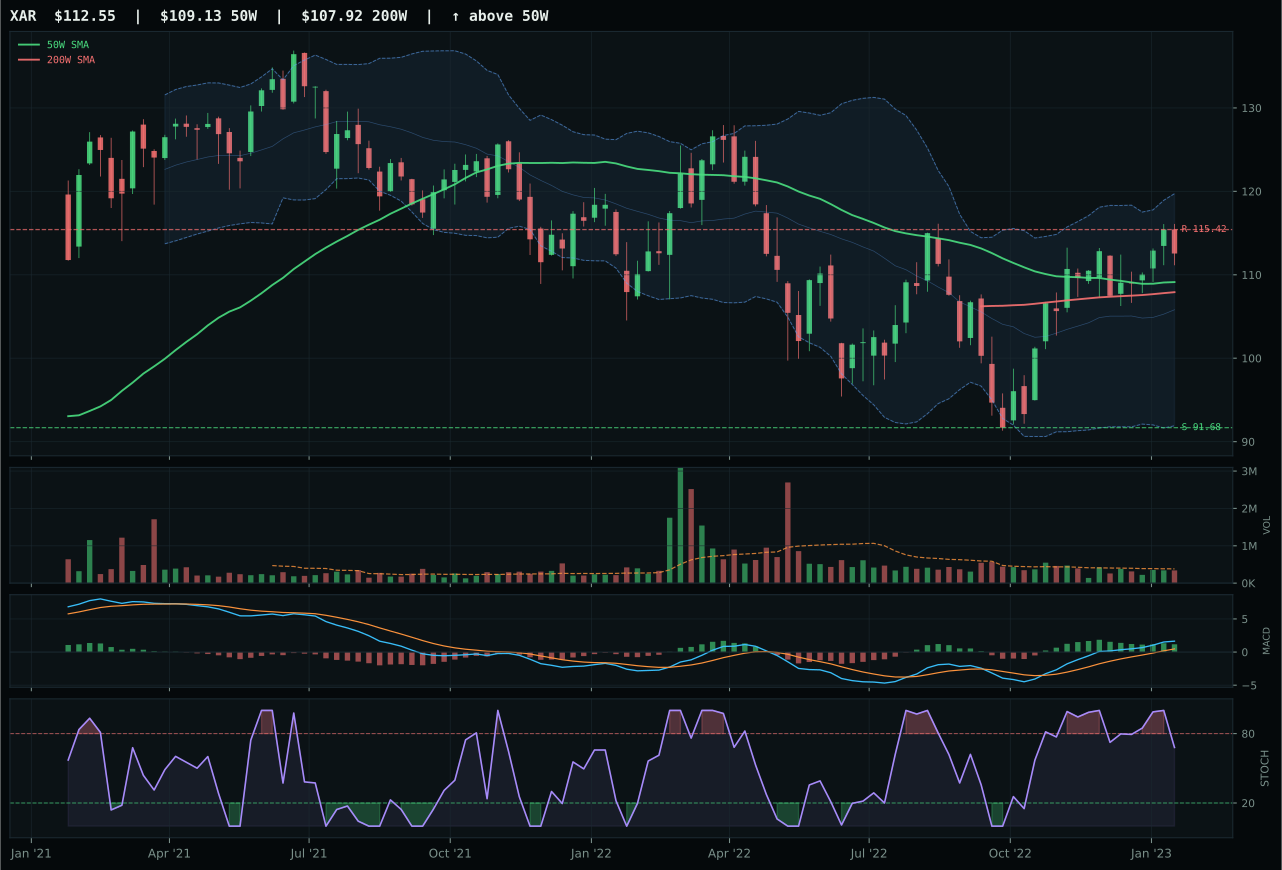
XAR has a neutral structure profile with 5.5% 13-week relative strength versus SPY.
A failed hold above support would weaken the setup.
Actionable but governed by invalidation levels.
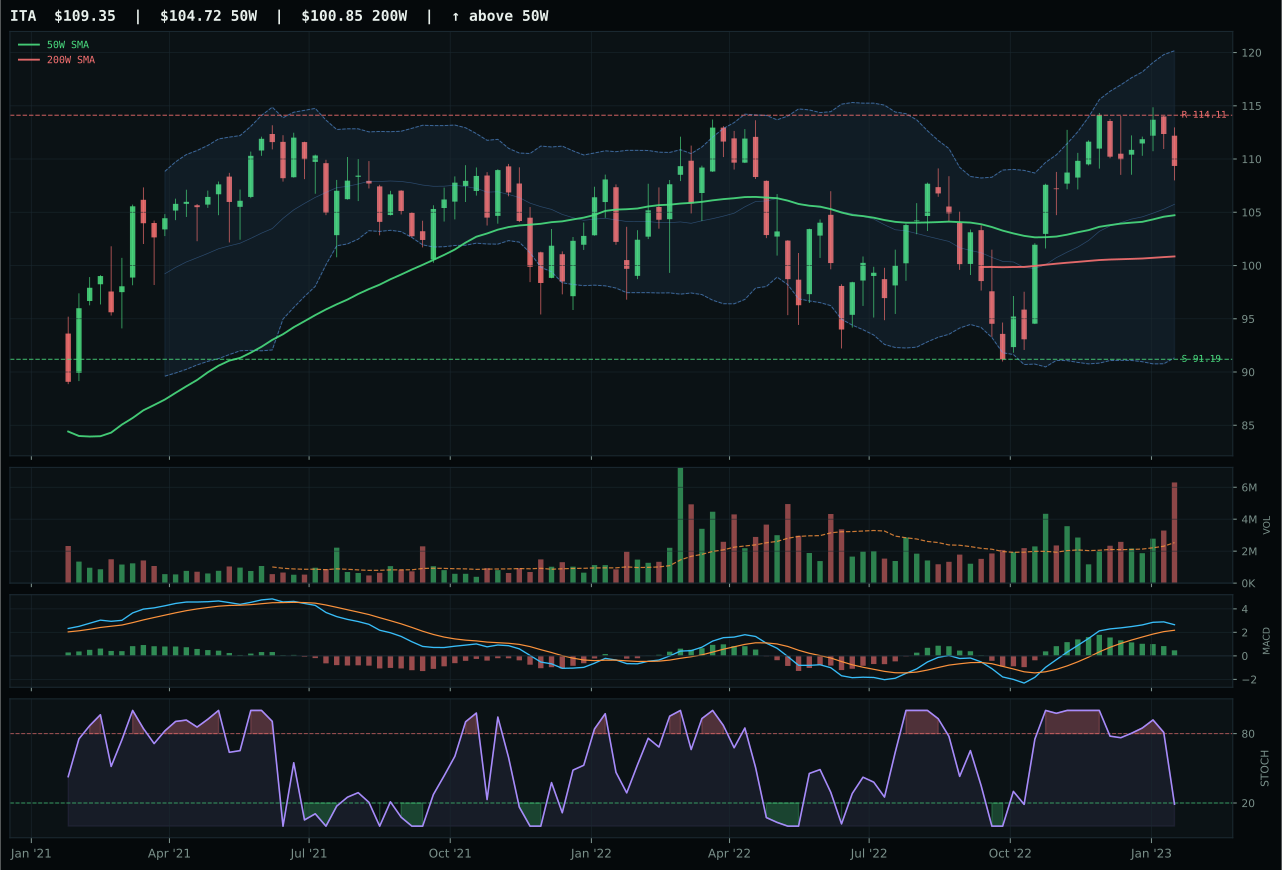
ITA has a neutral structure profile with 1.5% 13-week relative strength versus SPY.
A failed hold above support would weaken the setup.
Actionable but governed by invalidation levels.
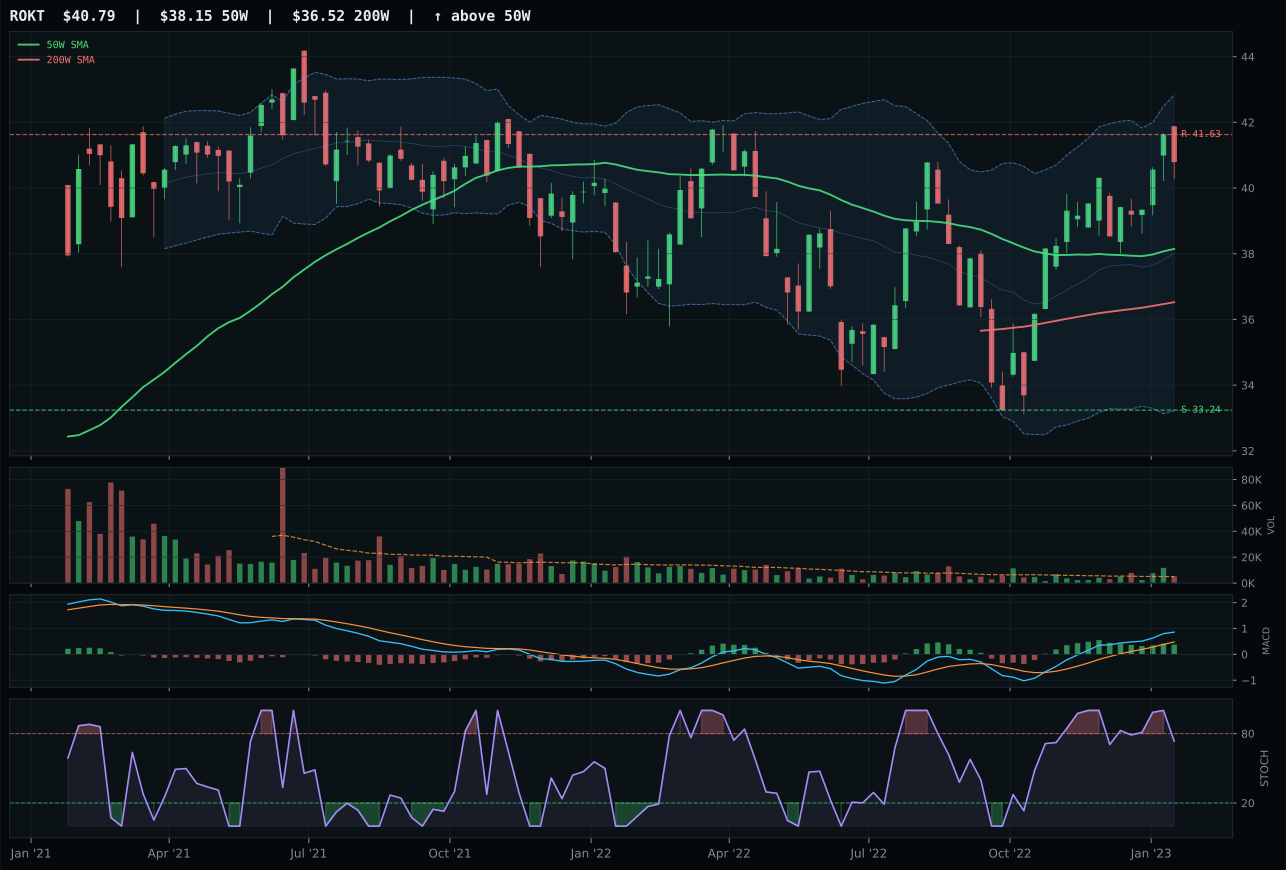
ROKT has a neutral structure profile with 7.0% 13-week relative strength versus SPY.
A failed hold above support would weaken the setup.
Tracked, but not top-2 eligible because: .
XAR claims the category on balanced technical merit and superior structure despite Defense & Aerospace being one of the weakest macro environments for growth allocation. The ETF sits 3.1% above its 50-week moving average with a trend score of 94.2—price above both major averages, slope neutral, relative strength of 5.5%—while MACD is bullish but flattening and stochastic RSI has cooled to 0.68, eliminating overbought whip. Thirteen-week return of 11.2% with zero category-relative weakness proves leadership without crowding. ITA stumbles on multiple counts: timing falls to 85 versus 92, risk-reward collapses to 40.8 from 55, structure becomes less clean, and volume shows distribution pressure rather than accumulation, signaling that the move is being sold into rather than accumulated.
Defense & Aerospace earned 0% allocation this week and ranks 8th despite a respectable 40.7 category score. The issue is not setup quality—XAR's trend score of 94.2 is pristine—but rather the category's weak macro fit of just 50.0 out of 100 in a reflation regime. Defensive rotation is active (+8) and offers some support, but Late-Cycle Reflation typically cycles away from pure defense into real-asset and cyclical exposure, which explains why this category gets crowded out. Liquidity stress (-4) and the broader lack of specific category tailwinds leave XAR technically sound but strategically misaligned with the current regime. For Defense & Aerospace to earn portfolio allocation, either macro would need to pivot toward recessionary risk-off (requiring a full regime shift), or the category's relative strength would need to accelerate sharply enough to overcome the headwind—currently it isn't. The 10% spots are going to categories with stronger structural backing.