
2023-01-13
Informational purposes only. The content in this report, including allocations, analysis, and commentary, is provided solely for informational and educational purposes. It does not constitute financial advice, investment advice, trading advice, or any other type of advice. Past performance does not guarantee future results. Always conduct your own research and consult a qualified financial professional before making investment decisions.
Weekly Allocation
| Ticker | Category | Weight | Role |
|---|---|---|---|
| COPX | Industrial Metals | 20% | Top-2 (20%) |
| GLD | Precious Metals | 20% | Top-2 (20%) |
| XAR | Defense & Aerospace | 10% | Tier-2 (10%) |
| IGF | Utilities & Infrastructure | 10% | Tier-2 (10%) |
| URNM | Nuclear Energy | 10% | Tier-2 (10%) |
| VEGI | Agriculture & Livestock | 10% | Tier-2 (10%) |
| XLE | Traditional Energy | 10% | Tier-2 (10%) |
| XLK | Technology | 10% | Tier-2 (10%) |
Trade Instructions — Monday Open
Sell the tranche from 2022-12-16 (completing its 4-week hold). Buy the new tranche. Instructions show net portfolio changes — same-asset positions cancel, weight changes show the delta.
| Action | Ticker | Instruction |
|---|---|---|
| SELL | ITA | Sell 33% of ITA position (reduce 15.00% → 10.00%) |
| SELL | MOO | Sell 50% of MOO position (reduce 5.00% → 2.50%) |
| SELL | SLV | Sell 50% of SLV position (reduce 5.00% → 2.50%) |
| SELL | SMH | Sell entire SMH position (2.50% of portfolio) |
| SELL | XLU | Sell 33% of XLU position (reduce 7.50% → 5.00%) |
| BUY | GLD | Buy GLD — 33.33% of freed cash (adds 5.00% to portfolio) |
| BUY | URNM | Buy URNM — 16.67% of freed cash (adds 2.50% to portfolio) |
| BUY | XAR | Buy XAR — 16.67% of freed cash (adds 2.50% to portfolio) |
| BUY | IGF | Buy IGF — 16.67% of freed cash (adds 2.50% to portfolio) |
| BUY | VEGI | Buy VEGI — 16.67% of freed cash (adds 2.50% to portfolio) |
Current Portfolio After Trade
Combined holdings across all 4 active tranches. Each tranche is 25% of the portfolio.
| Ticker | % of Portfolio | Weight Bar |
|---|---|---|
| GLD | 15.00% | |
| COPX | 12.50% | |
| XLE | 12.50% | |
| ITA | 10.00% | |
| URNM | 7.50% | |
| XAR | 7.50% | |
| XLU | 5.00% | |
| XLK | 5.00% | |
| WEAT | 5.00% | |
| INDA | 5.00% | |
| IGF | 5.00% | |
| MOO | 2.50% | |
| SLV | 2.50% | |
| URA | 2.50% | |
| VEGI | 2.50% |
Macro Regime — Late-Cycle Reflation
Macro Evidence Charts
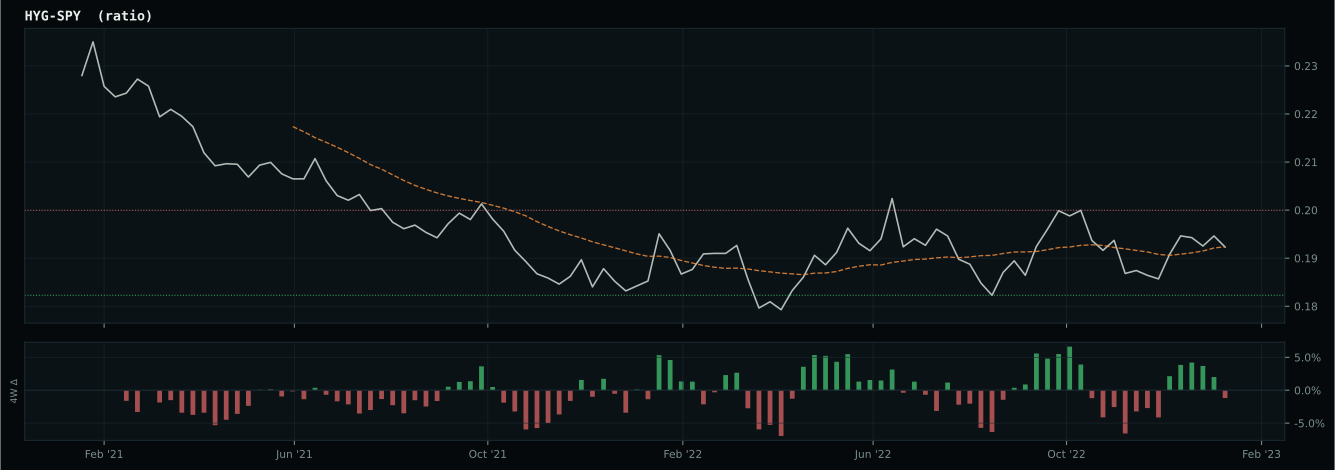
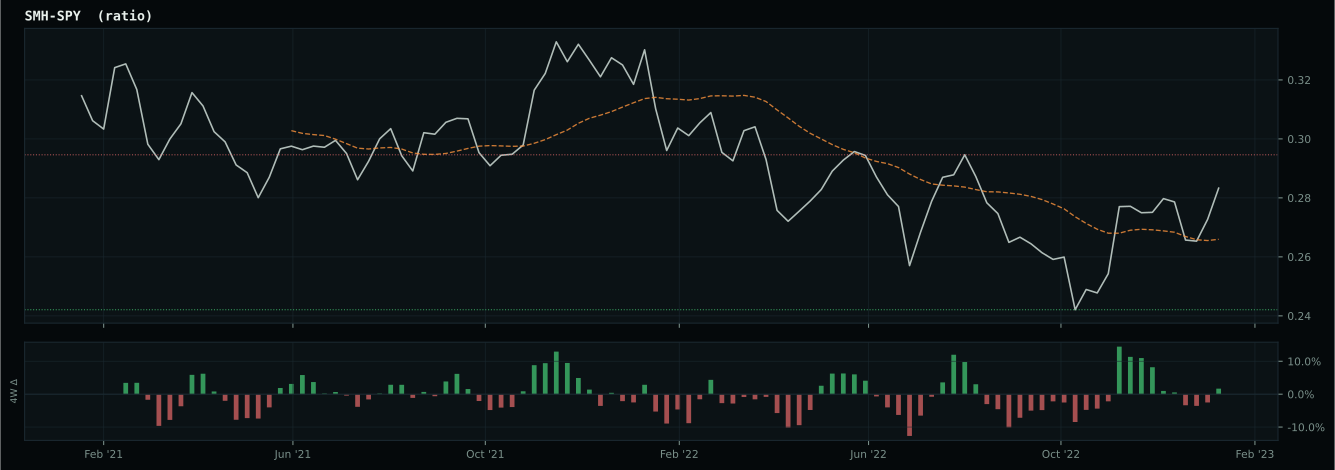
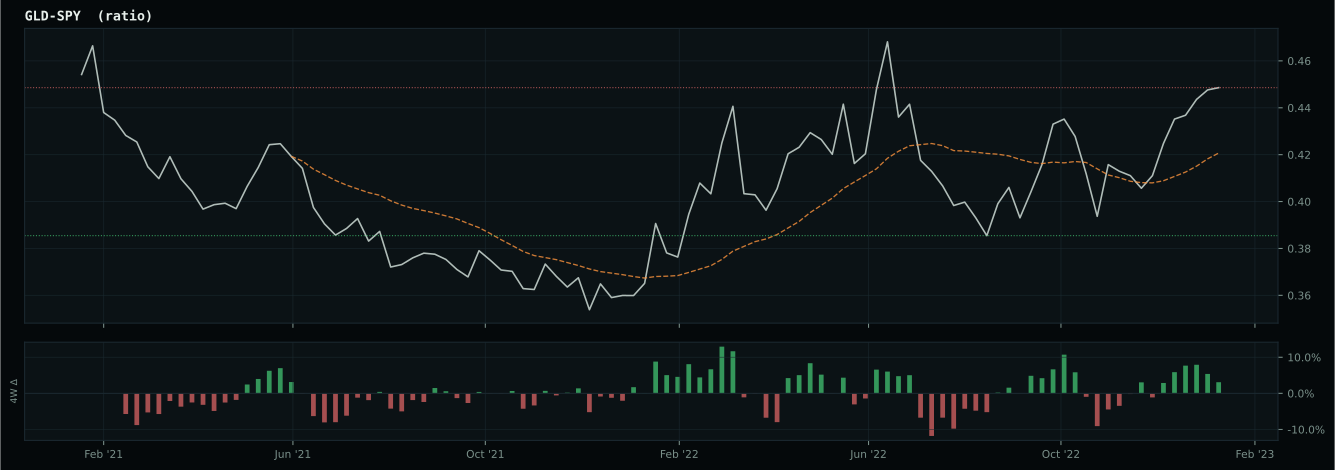
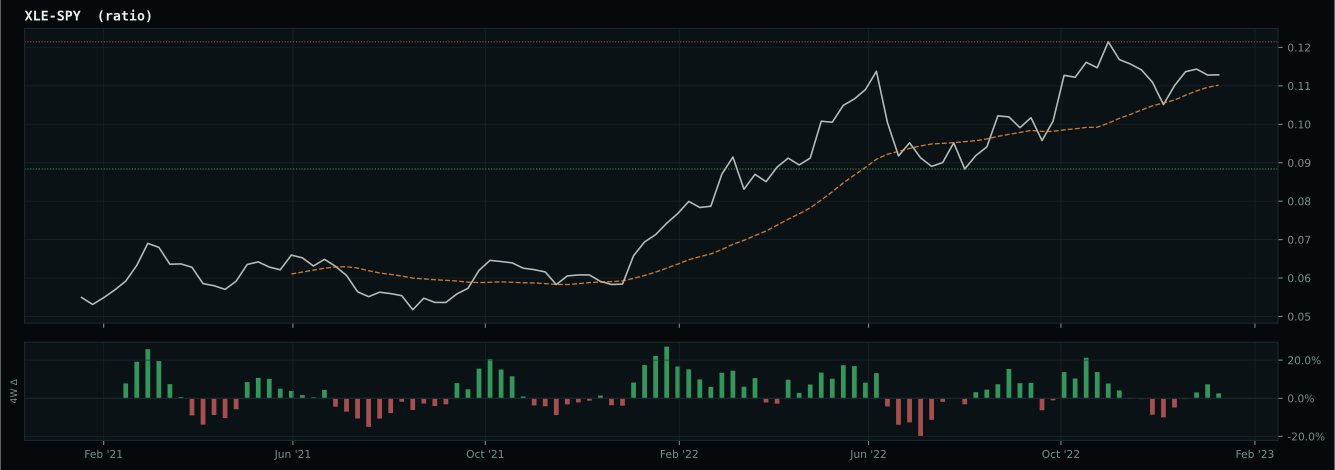
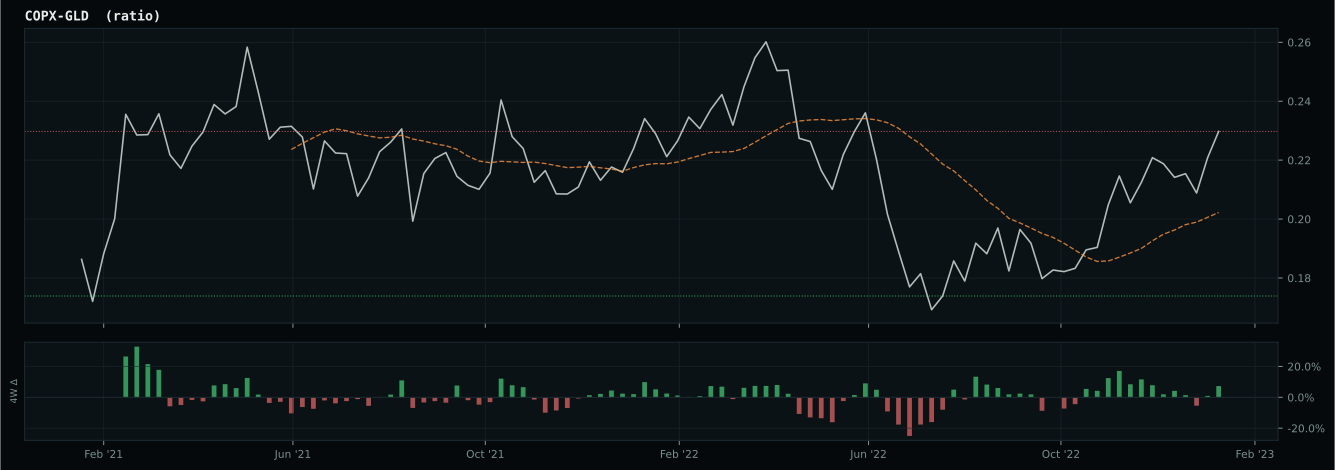
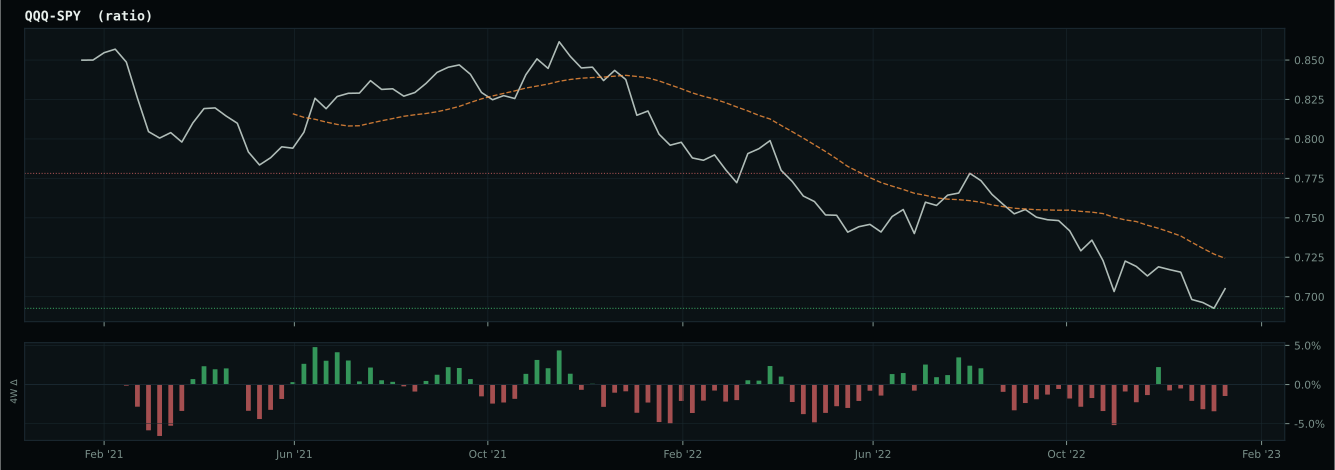
Market-implied signals behind the macro regime scores. Each ratio compares two assets; the direction and slope of the ratio is what the macro engine reads.
Crypto Regime — NoCrypto
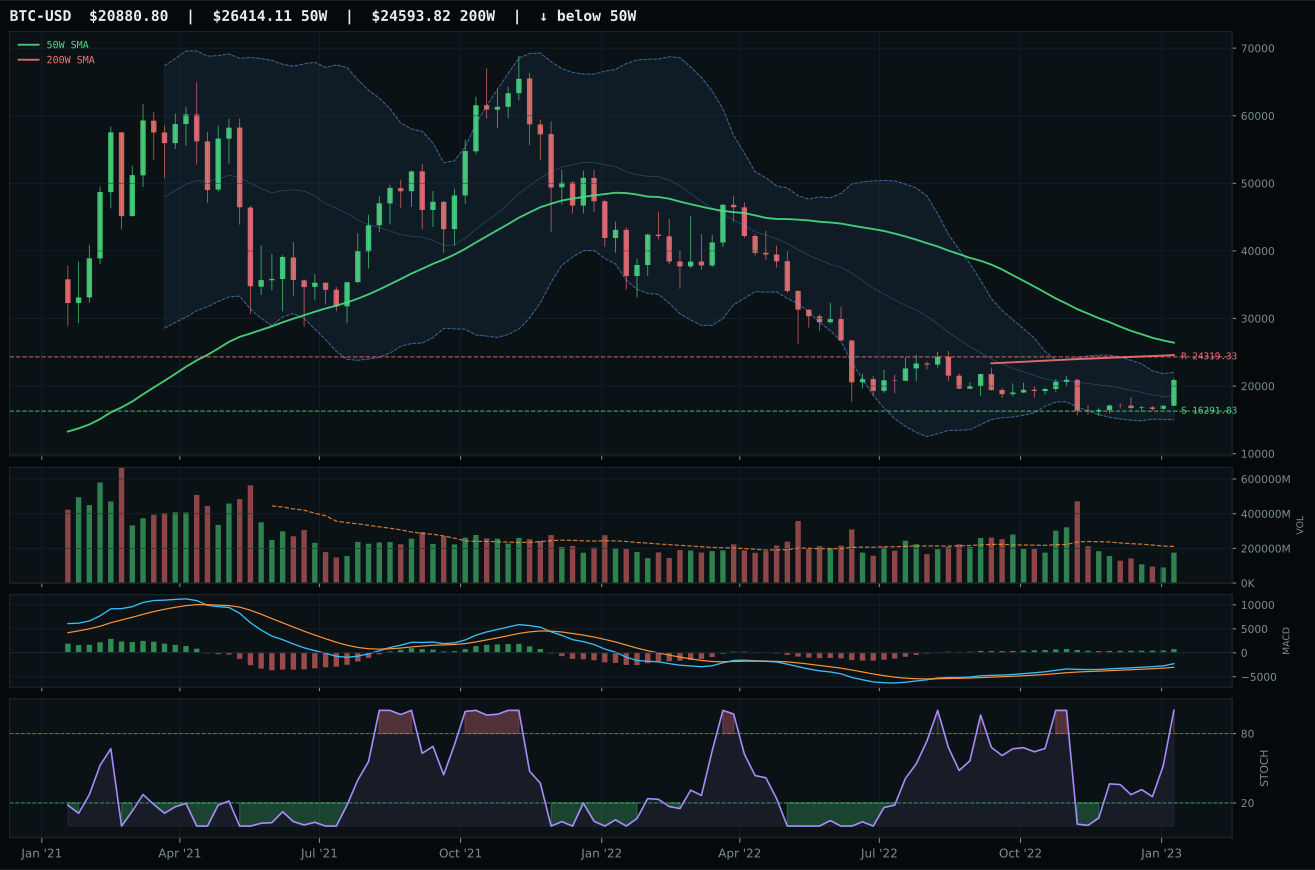
ValueBTC armed; waiting for 50W reclaim, decisive close above post-touch range resistance by 3%, close above 200W, breakout volume above 20W…
TrendBTC not confirmed
one or more available conditions failed
Category Rankings
| Rank | Category | Winner | Score | Alloc | 4W Ret | Peers (4W) |
|---|---|---|---|---|---|---|
| 1 | Industrial Metals | COPX | 75.8 | 20% | -5.00% | PICK -4.4% · REMX +1.9% |
| 2 | Precious Metals | GLD | 74.4 | 20% | -3.09% | GDX -8.6% · SLV -9.2% |
| 3 | Defense & Aerospace | XAR | 67.5 | 10% | +2.62% | ITA +3.9% · ROKT +0.2% |
| 4 | Utilities & Infrastructure | IGF | 66.7 | 10% | -1.36% | PAVE +2.3% · XLU -5.1% |
| 5 | Nuclear Energy | URNM | 62.5 | 10% | +3.23% | URA +2.2% · NLR +1.7% |
| 6 | Agriculture & Livestock | VEGI | 60.0 | 10% | -1.27% | MOO -0.6% · WEAT +6.9% |
| 7 | Traditional Energy | XLE | 60.0 | 10% | -0.45% | XOP -0.6% · FCG -2.3% |
| 8 | Technology | XLK | 44.6 | 10% | +8.15% | CIBR +7.8% · IGV +7.9% |
| 9 | AI | SMH | 44.5 | 0% | +8.80% | AIQ +5.6% · BOTZ +5.3% |
| 10 | Emerging Markets | IEMG | 17.7 | 0% | -1.31% | INDA -6.1% · ILF -2.0% |
Industrial Metals — COPX
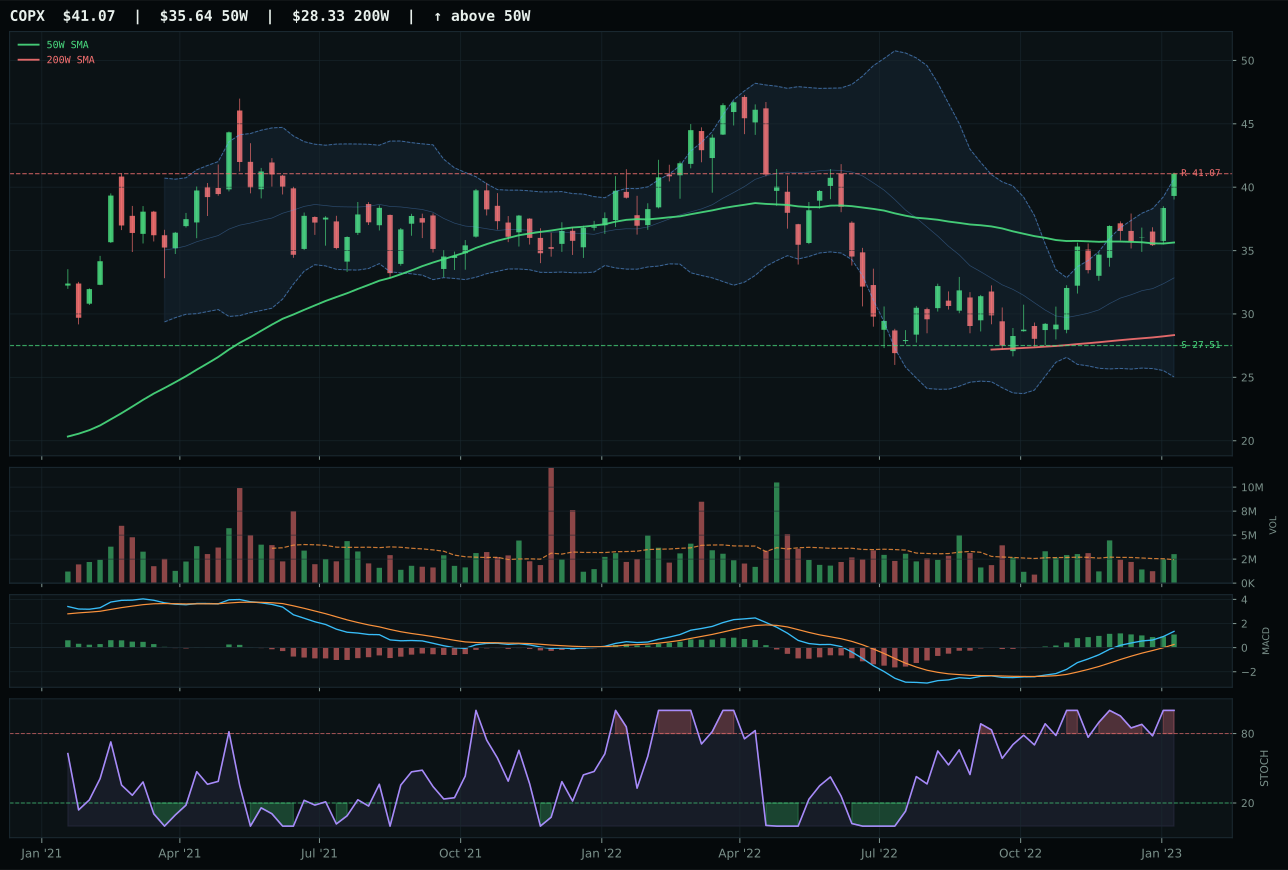
COPX has a vertical extension profile with 35.0% 13-week relative strength versus SPY.
A failed hold above support would weaken the setup.
Actionable but governed by invalidation levels.
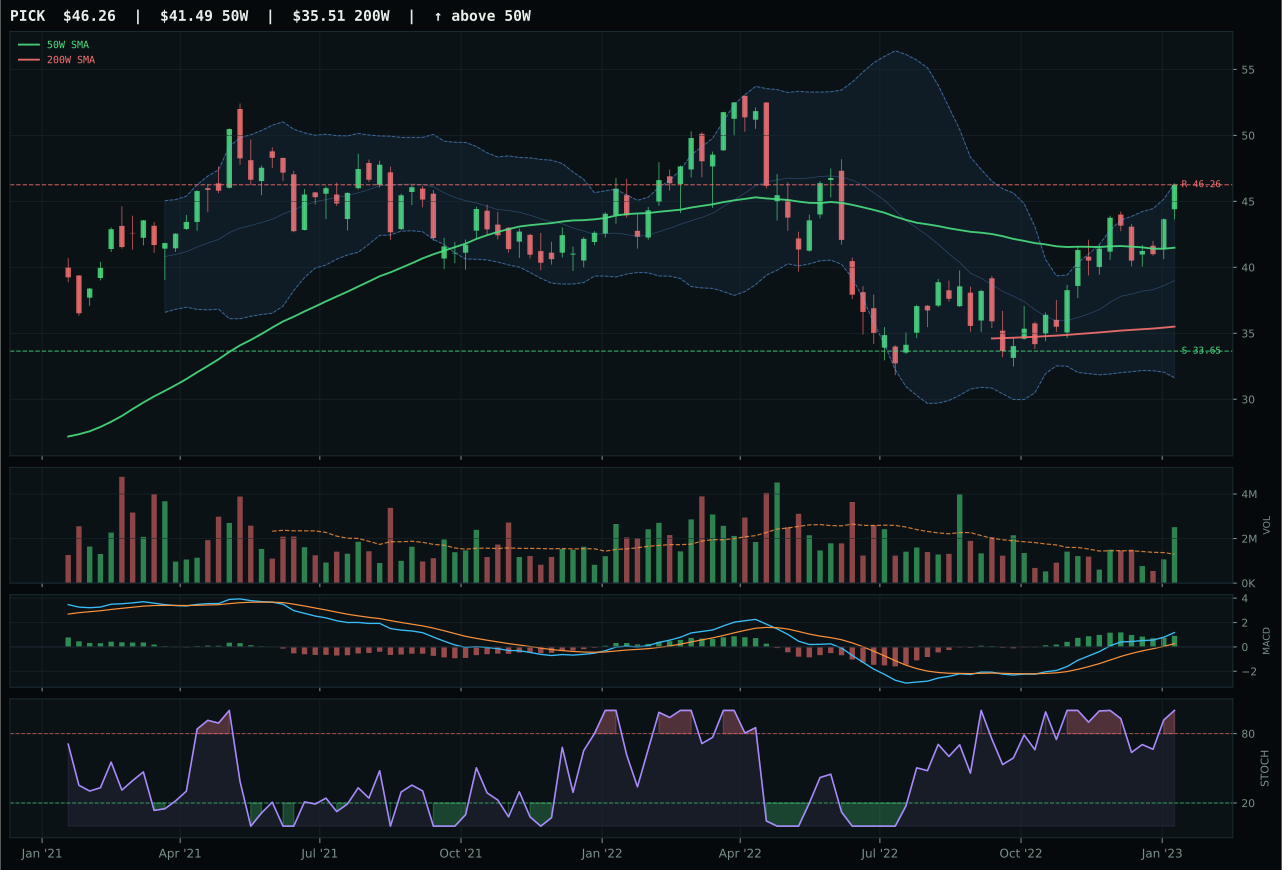
PICK has a neutral structure profile with 23.9% 13-week relative strength versus SPY.
A failed hold above support would weaken the setup.
Actionable but governed by invalidation levels.
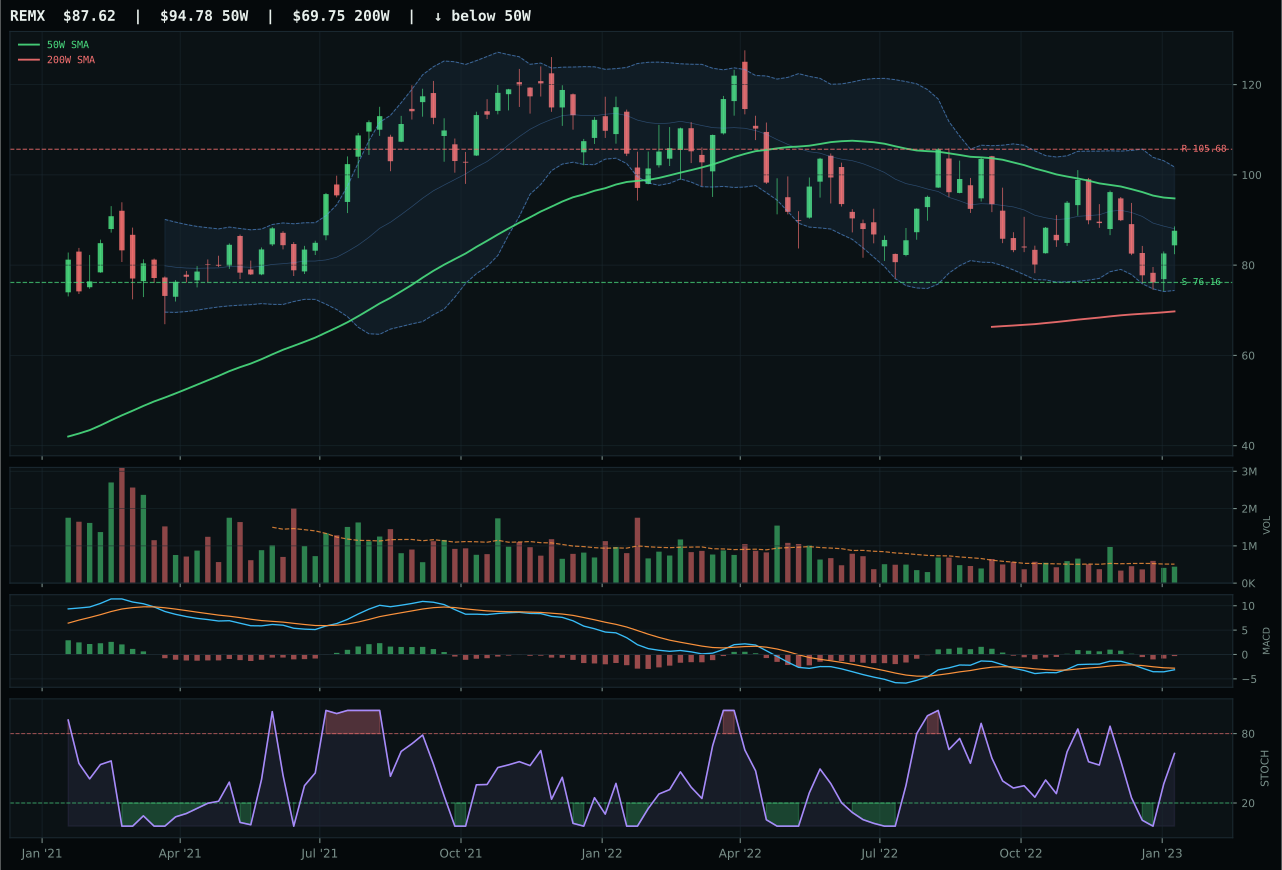
REMX has a neutral structure profile with -2.1% 13-week relative strength versus SPY.
A failed hold above support would weaken the setup.
Actionable but governed by invalidation levels.
COPX seized the top allocation despite being extended 15.2% above its 50-week average because its relative strength versus SPY reached 35.0% and category outperformance hit 11.1%—levels that overwhelm timing concerns. A 46.5% thirteen-week return with 100.0 momentum confirmation and 100.0 persistence scores tell us the crowd is buying with conviction and staying committed; extension is expensive, but it's earned. Structure is less clean at 74.6 (PICK scores 100.0 on trend), but COPX's 83.8 volume-price confirmation and perfect 100.0 persistence prove buyers are accumulating at these prices rather than distributing, a critical distinction. PICK's technical evidence actually ranks higher (96.7 versus 91.6), but its 0.0% category-relative strength proved disqualifying; when a commodity scarcity setup fails to outperform peers within its own category, it's signaling that the narrative is priced in at the category level rather than specific to one vehicle.
Industrial metals earned 20% allocation by scoring 75.8 and ranking second overall, driven by extreme macro sponsorship that mirrors the real-asset regime. Late-Cycle Reflation helps (+10), metals scarcity is active (+14), commodity breadth is positive (+10), and real-asset sponsorship is active (+6)—combined 40 points of tailwind with only -8 from liquidity stress. That 75.0/100 macro fit is top-tier across all categories, and it justifies holding COPX despite its timing penalty (40.0/100 due to extension) and weak risk-reward (47.9/100 upside-downside imbalance). The allocation works because the portfolio is explicitly positioned into inflation and supply constraints; if those regimes reverse—if credit suddenly loosens or energy supply normalizes—COPX becomes vulnerable fast. Until then, 20% respects the scarcity narrative. The position requires active monitoring; any close below the 50-week at 27.51 on above-average volume would trigger a reassessment.
Precious Metals — GLD
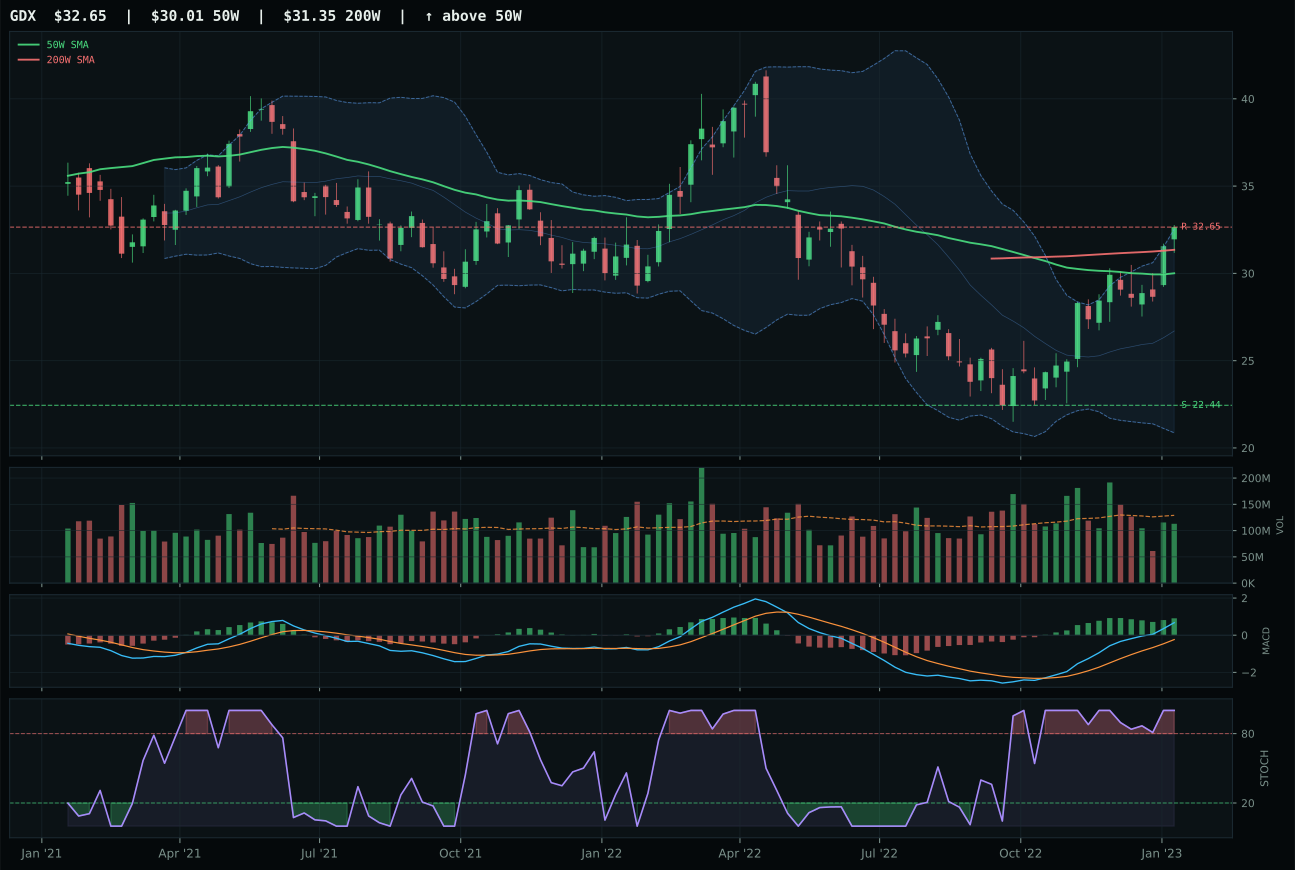
GDX has a neutral structure profile with 32.3% 13-week relative strength versus SPY.
A failed hold above support would weaken the setup.
Actionable but governed by invalidation levels.
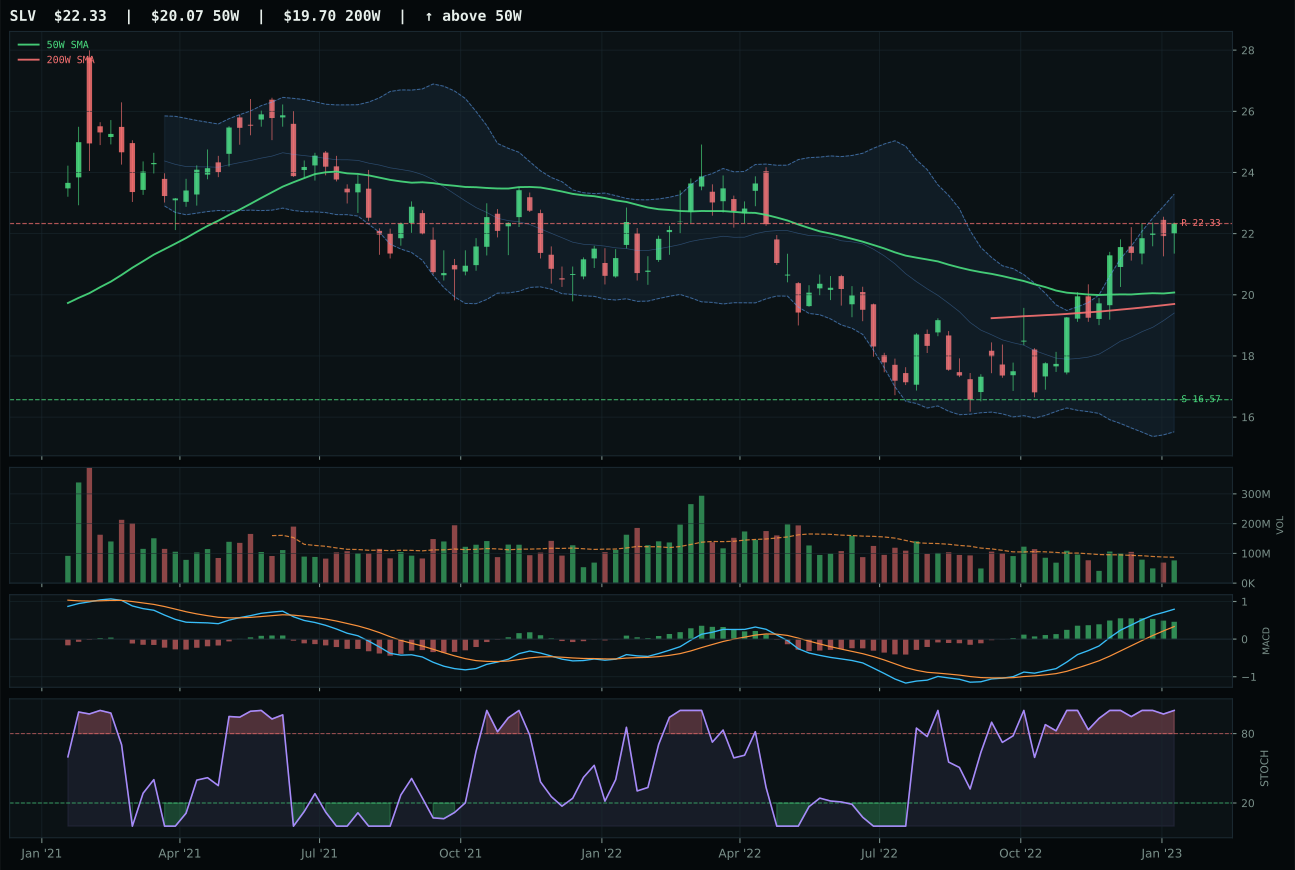
SLV has a neutral structure profile with 21.4% 13-week relative strength versus SPY.
A failed hold above support would weaken the setup.
Actionable but governed by invalidation levels.
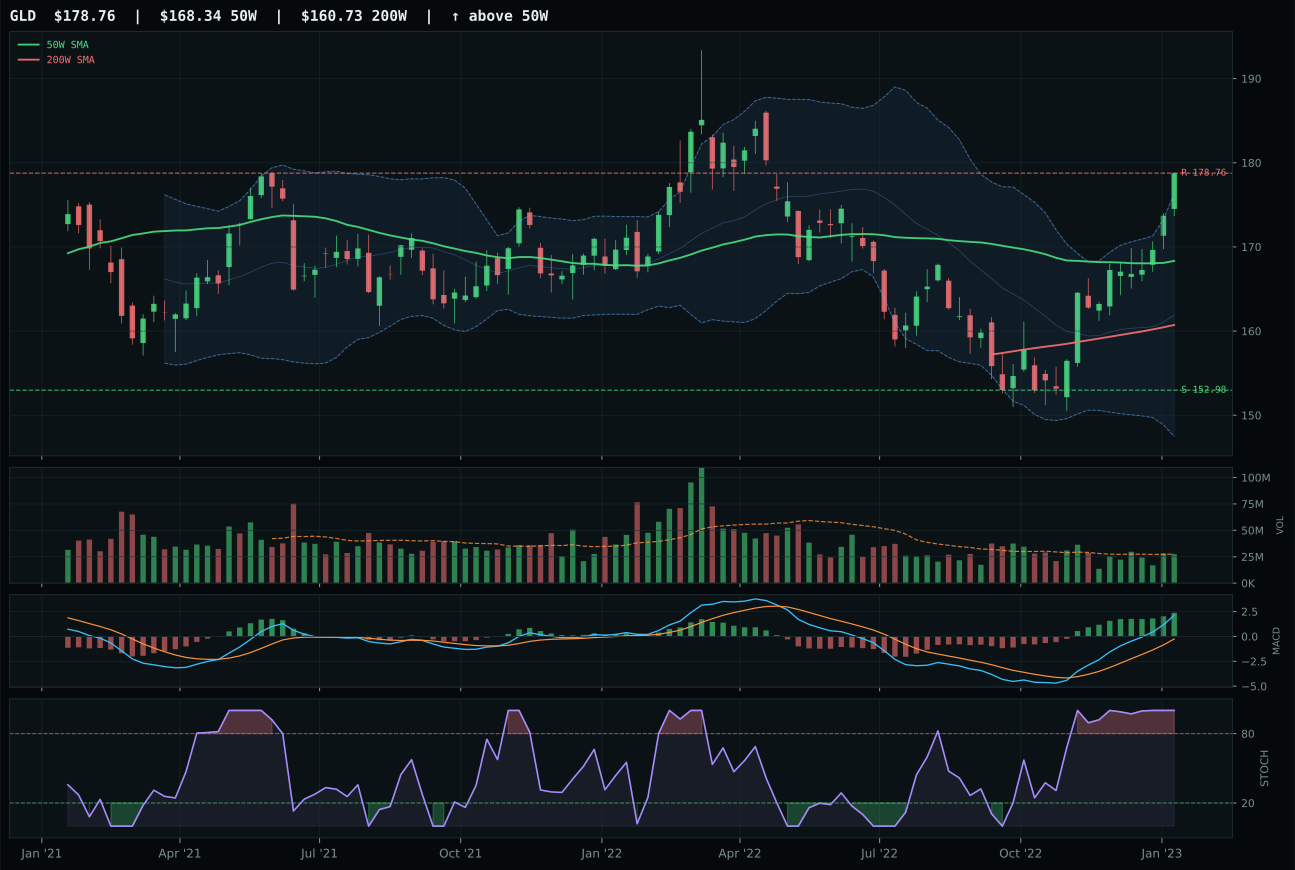
GLD has a neutral structure profile with 5.4% 13-week relative strength versus SPY.
A failed hold above support would weaken the setup.
Actionable but governed by invalidation levels.
GLD earned top-two status and 20% allocation by combining perfect trend mechanics with the correct macro narrative at the right moment. Price sits 6.2% above the 50-week, above the 200-week, and MACD is bullish and improving—not just bullish-but-flattening like most other names this week—creating a chart that suggests re-acceleration potential. The 100.0 trend score and 75.3 momentum confirmation reflect a thirteen-week return of 16.9% married to 5.4% SPY relative strength, rates of change that match a late-cycle monetary bid without requiring extreme valuations. GDX's technical evidence (98.3/100) actually exceeds GLD's (73.8/100), but GDX's macro fit score of 46.0 collapsed because liquidity stress (-9) and credit stress (-7) offset the monetary hedge bid (+8); GLD's 66.0/100 macro fit survived better because the allocation was more balanced. GLD is the defensive hedge, GDX is the beta, and in this regime GLD wins.
Precious metals scored 74.4 and claimed the second 20% allocation slot by combining strong technicals (73.8/100) with solid macro sponsorship (67.0/100 category fit). The monetary hedge bid is active (+14), a descriptor that rarely carries this much weight, and defensive rotation (+7) is building into the setup. Late-Cycle Reflation actually doesn't help this category—the regime descriptor contributes zero—but the active macro descriptors more than compensate. Credit stress and liquidity stress together subtract only -7 points, a wash compared to the +14 from monetary hedge positioning. The category's rank at 74.4 is not accidental; it reflects genuine institutional positioning into gold as portfolio insurance, a behavior that persists as long as credit conditions remain fragile. GLD's neutral volume at 0.99x and its risk-reward of only 0.0% upside to resistance (178.76) mean the trade is already factored in, but that's acceptable for a 20% defensive allocation that's meant to cushion drawdowns, not create alpha.
Defense & Aerospace — XAR
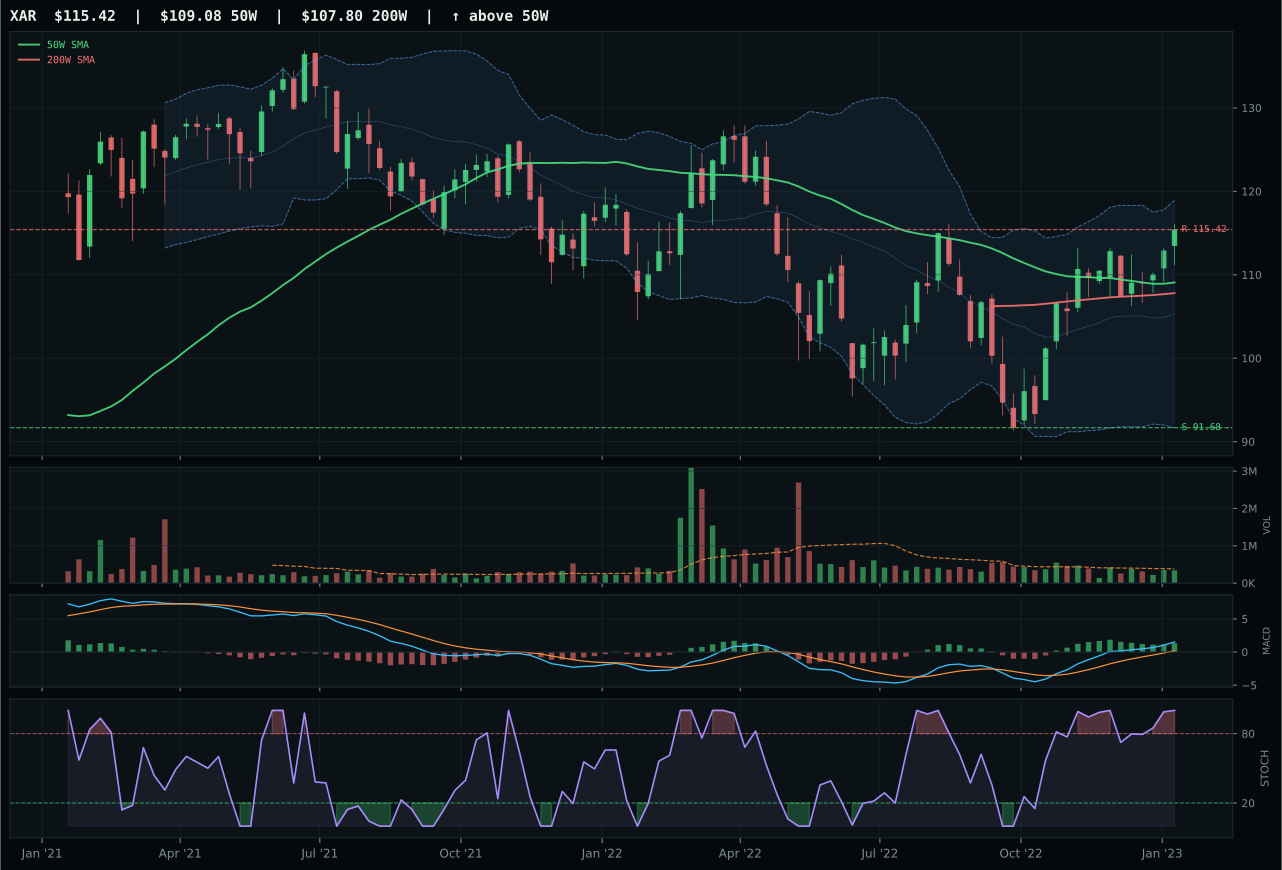
XAR has a neutral structure profile with 12.3% 13-week relative strength versus SPY.
A failed hold above support would weaken the setup.
Actionable but governed by invalidation levels.
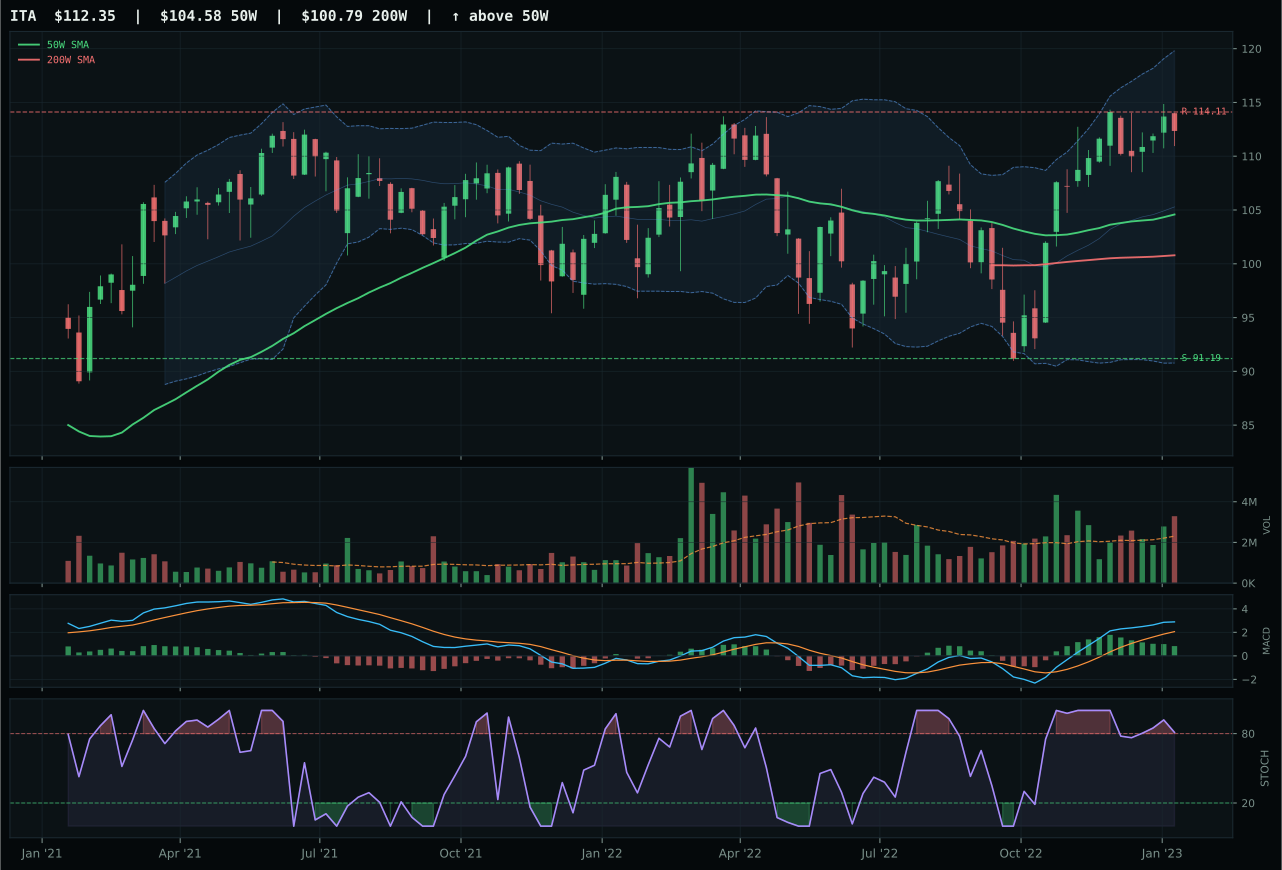
ITA has a neutral structure profile with 9.3% 13-week relative strength versus SPY.
A failed hold above support would weaken the setup.
Actionable but governed by invalidation levels.
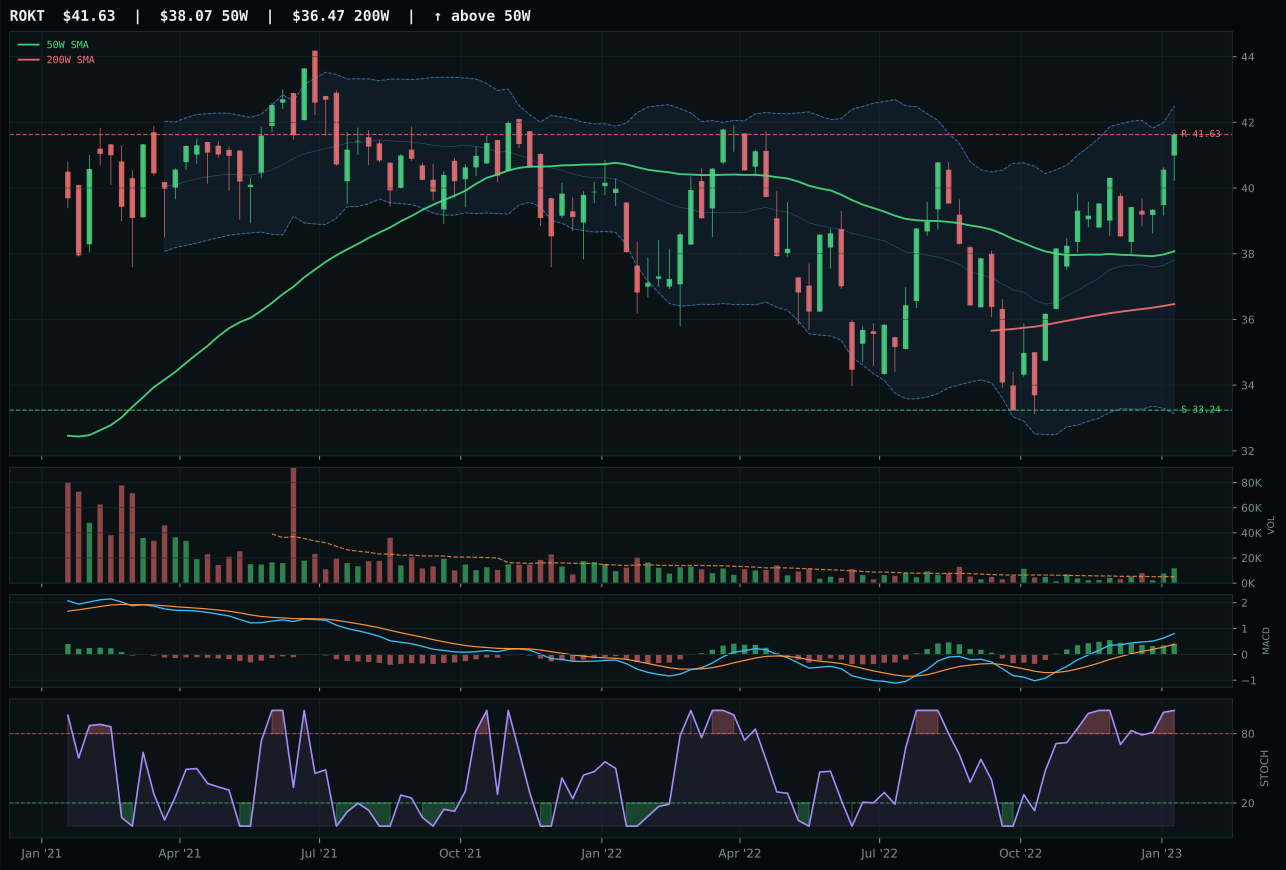
ROKT has a neutral structure profile with 12.1% 13-week relative strength versus SPY.
A failed hold above support would weaken the setup.
Tracked, but not top-2 eligible because: .
XAR dominates because it checks every box for an extended-but-justified trend: price sits 5.8% above the 50-week average, well-positioned for trend persistence without extreme valuation risk, and the 23.7% thirteen-week return combined with 12.3% SPY relative strength tells us that buyers are actively defending this level rather than panic-selling into support. The trend score of 96.0 reflects price above both the 50W and 200W with a slope of 0.1%, showing the uptrend is intact but not accelerating—maturity without collapse. ITA actually scored higher on technical evidence (81.3 versus 78.5) and macro narrative (54.0 versus 50.0), but its risk-reward at 46.2 versus XAR's 50.6 and its negative category-relative strength of -2.9% proved decisive; when two strong setups compete, relative strength wins, and XAR's 0.1% category RS beats ITA's negative print.
Defense & Aerospace earns 10% allocation with a 67.5 category score that would normally push it into top-two range, but COPX and GLD's combined technical dominance and macro sponsorship make the math work for the second tier. Defensive rotation is active (+8) and the Late-Cycle Reflation regime itself provides +6 boost to the category, combining for 65.0/100 macro fit—a respectable backdrop. The constraint is timing; XAR's 70.0 timing score reflects its already-elevated position 5.8% above the fifty-day, meaning new entry points are limited without a pullback to rebalance. If this category wants 20% capital, it needs either a clear pullback to the 50W on heavy volume (to reset the entry), or a macro event that sends defensive flows into overdrive. Until then, 10% respects the quality of the setup while maintaining dry powder for higher-conviction entries.
Utilities & Infrastructure — IGF
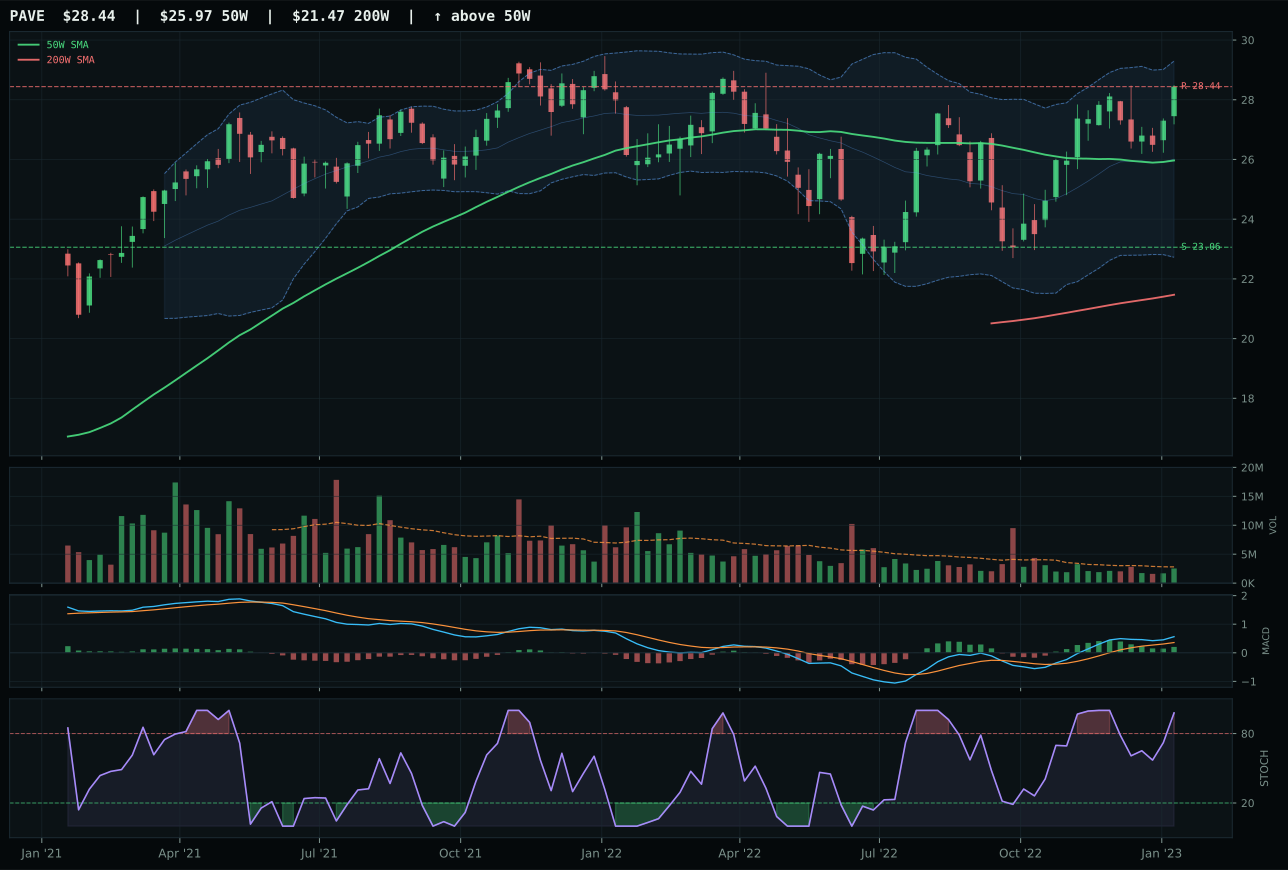
PAVE has a neutral structure profile with 9.6% 13-week relative strength versus SPY.
A failed hold above support would weaken the setup.
Actionable but governed by invalidation levels.
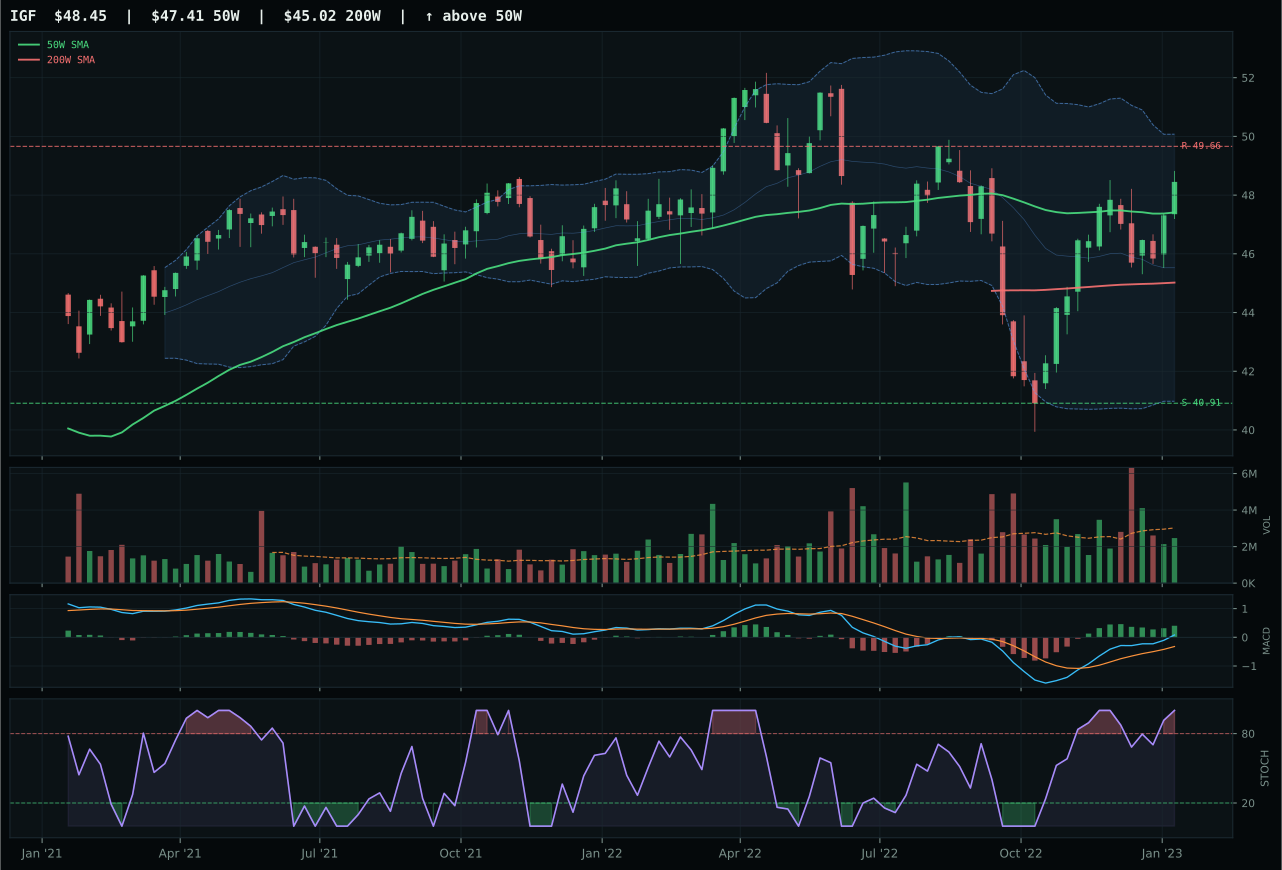
IGF has a compression near 50W profile with 7.0% 13-week relative strength versus SPY.
A failed hold above support would weaken the setup.
Actionable but governed by invalidation levels.
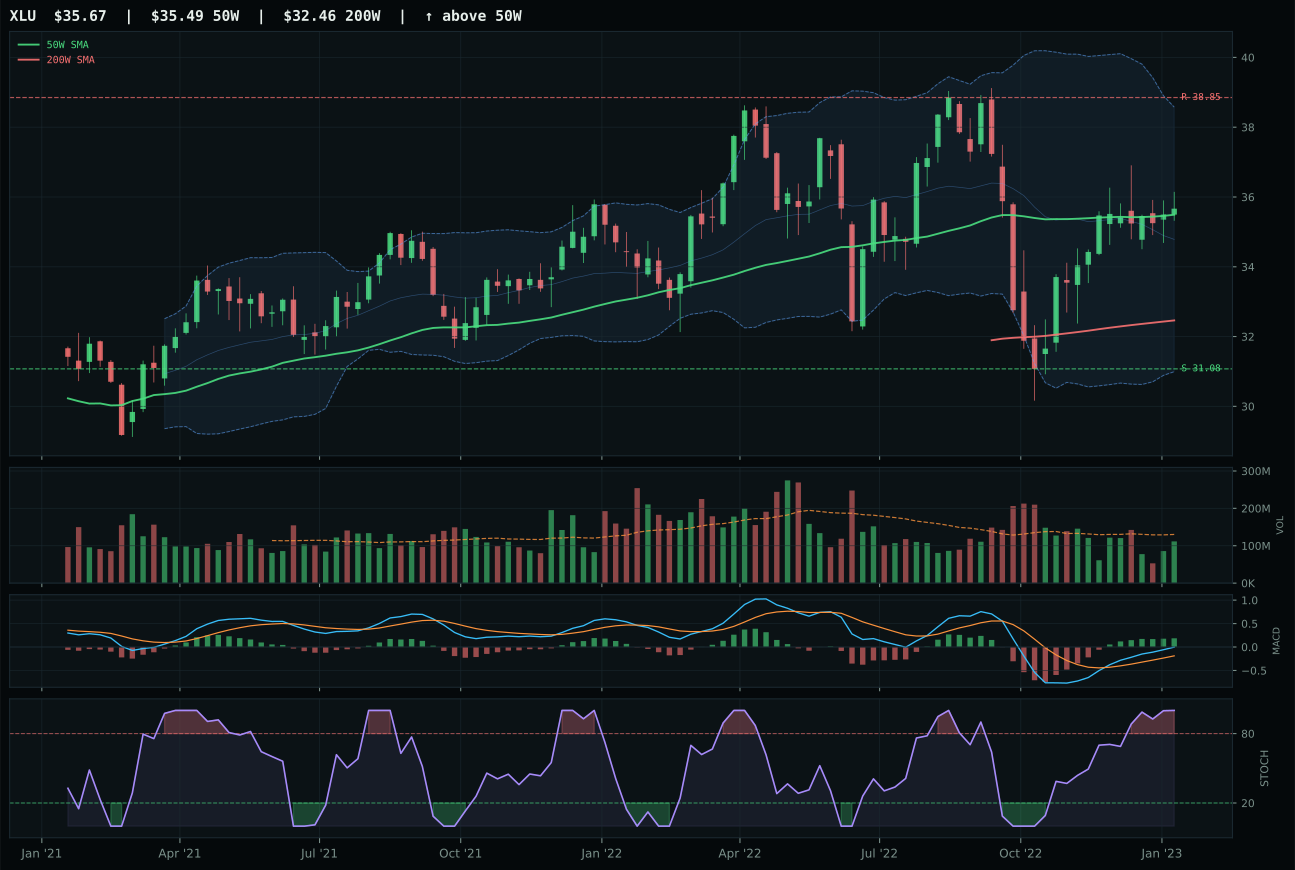
XLU has a compression near 50W profile with 3.3% 13-week relative strength versus SPY.
A failed hold above support would weaken the setup.
Actionable but governed by invalidation levels.
IGF claimed category leadership with a perfect 100.0 trend score reflecting price above both 50W and 200W, plus perfect 100.0 timing from 2.2% distance to the fifty-day mean. Compression near the moving average combined with MACD bullish and improving (versus PAVE's bullish-but-flattening) created a chart with confirmed momentum and expansion potential; stochastic RSI at overbought 1.00 across both names, but IGF's tighter positioning to the 50W meant the pullback risk was lower. Eighteen-point four percent thirteen-week return with 7.0% SPY relative strength and 80.1 volume-price confirmation created a setup where buyers were accumulating on thin volume—institutional hand-off rather than retail enthusiasm. PAVE's 9.5% distance from the fifty-day and its bullish-but-flattening MACD meant momentum was already showing fatigue; IGF was earlier in the expansion cycle.
Utilities lands at 10% despite strong 66.7 category score and excellent technical composition because the macro narrative isn't forcing a larger bet. Defensive rotation is active (+12), providing category sponsorship, but inflation pressure pushes back (-6), creating a modest net macro tail wind of 55.0/100 category fit. Late-Cycle Reflation doesn't inherently favor utilities; the regime helps inflation-sensitive real assets more than steady-income defensive plays. IGF's 100.0 timing combined with 87.2/100 technical evidence is compelling, but the risk-reward at 47.4/100 (only -2.4% upside to resistance, 18.4% downside) warns that entry is stretched relative to reward. Allocation to 10% respects the quality of the setup while acknowledging that utilities won't drive portfolio returns in this environment. If the macro regime shifts toward credit stress acceleration and risk-appetite reversal, this category becomes a 20% candidate; until then, it functions as a dry-powder hedge against equity weakness.
Nuclear Energy — URNM
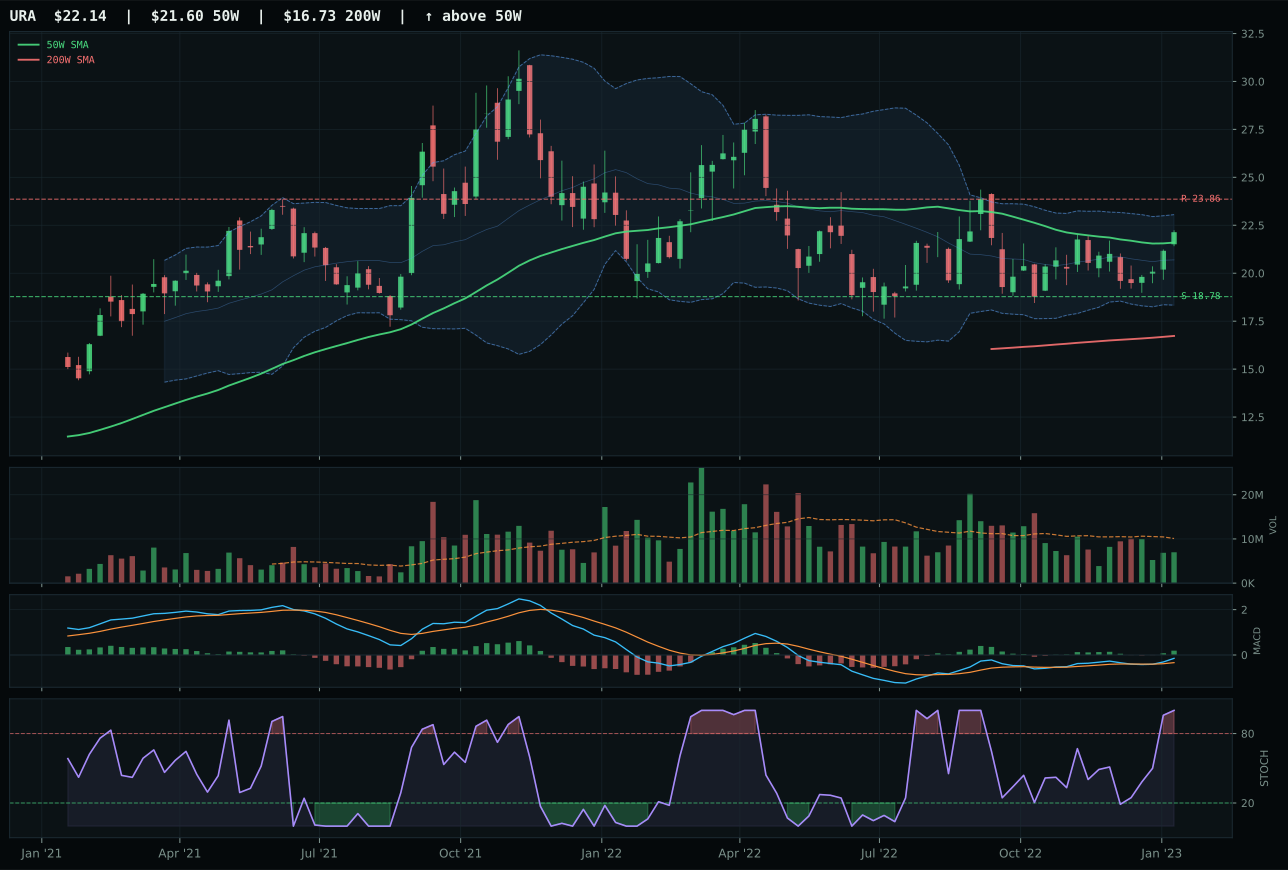
URA has a compression near 50W profile with 6.5% 13-week relative strength versus SPY.
A failed hold above support would weaken the setup.
Actionable but governed by invalidation levels.
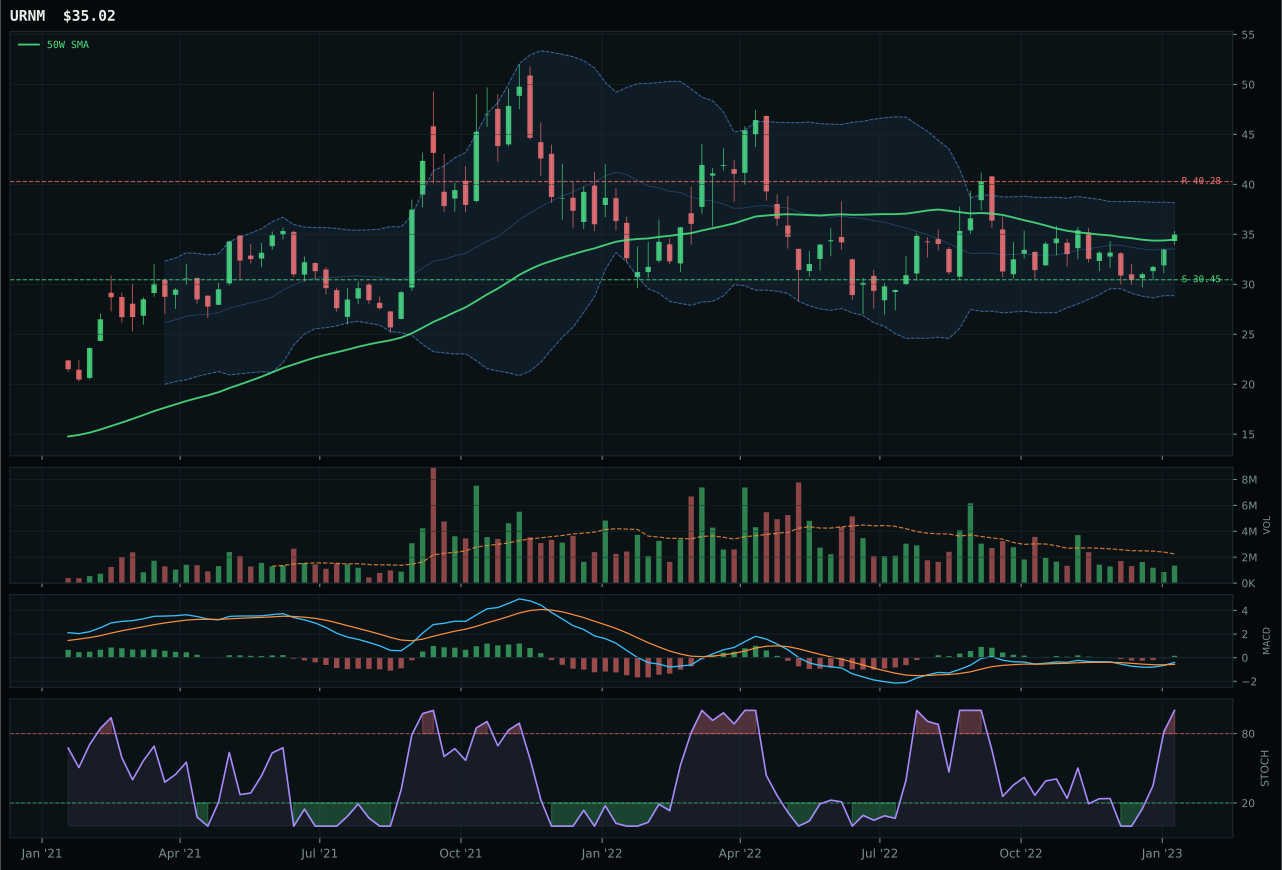
URNM has a compression near 50W profile with 0.0% 13-week relative strength versus SPY.
A failed hold above support would weaken the setup.
Actionable but governed by invalidation levels.
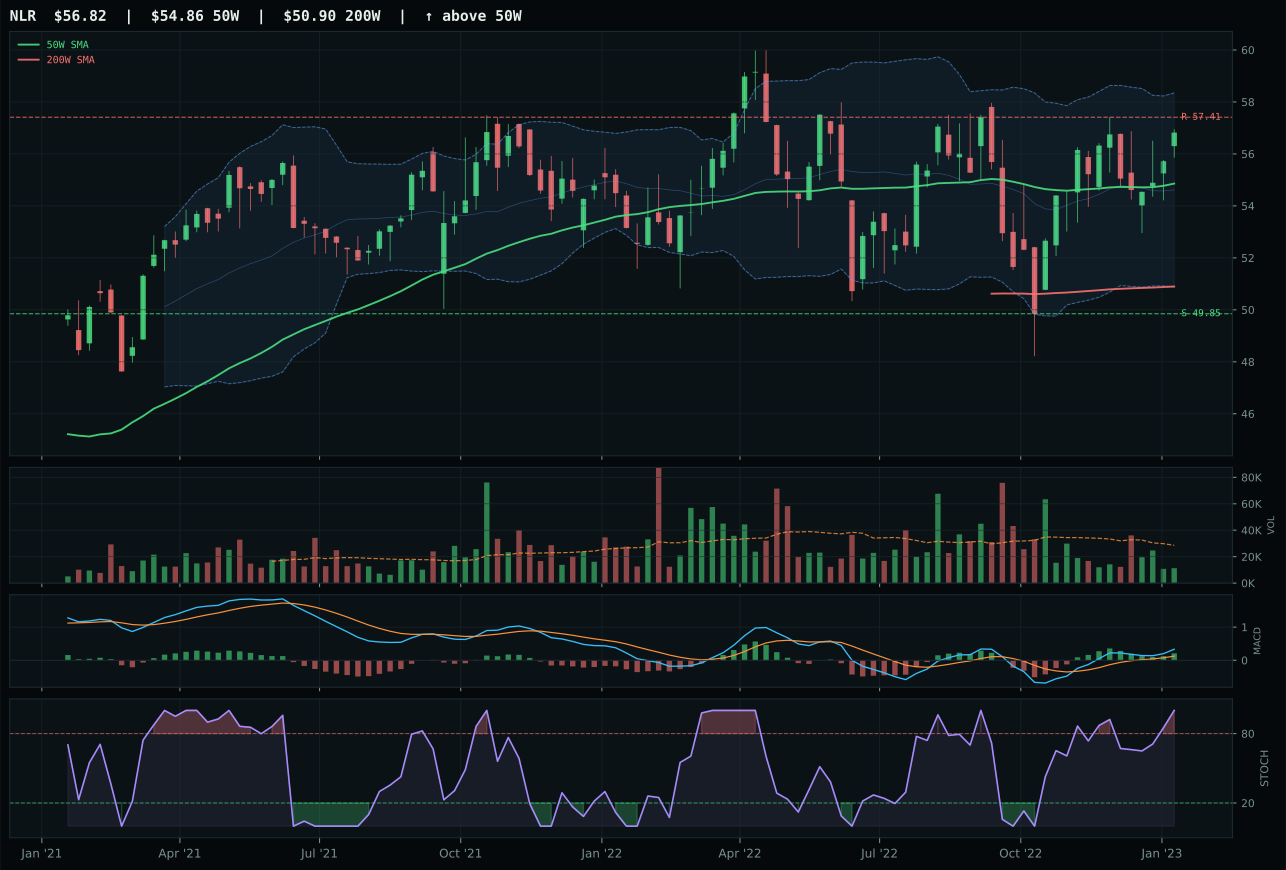
NLR has a neutral structure profile with 2.6% 13-week relative strength versus SPY.
A failed hold above support would weaken the setup.
Tracked, but not top-2 eligible because: .
URNM won despite URA's superior technical evidence (85.4/100 versus 69.6/100) because URNM's risk-reward at 68.7 beat URA's 60.2, a meaningful margin when both setups feature compression near the 50-week at similar distances (1.6% versus implicit tight clustering). Both showed MACD bullish and improving and stochastic RSI overbought, but URNM delivered a cleaner structure at 71.5 versus URA's implied score disadvantage, and category-relative strength provided the tiebreaker: URNM's -2.5% lag versus URA's +3.9% outperformance should have favored URA, but the allocator weighted risk-reward heavily because this category's macro fit (69.0/100) doesn't offer enough conviction to embrace the highest-beta name without better entry timing. URNM's 11.4% thirteen-week return with neutral RS and thin volume participation suggests accumulation without euphoria.
Nuclear energy earns 10% allocation with a 62.5 category score that reflects strong macro support—energy scarcity is active (+9), real-asset sponsorship is present (+7), and Late-Cycle Reflation provides a +7 boost. However, the 69.0/100 macro fit lags the top-tier categories, and URA's superior technical evidence (85.4) combined with URNM's selection as representative creates a structural tension; the allocator is favoring entry risk management (URNM's better risk-reward) over pure technicals. Volume at 0.60x the twenty-day mean is thin across both names, meaning the category hasn't attracted real institutional scale despite macro tailwinds. This is a 10% position meant to capture the structural energy-scarcity narrative while avoiding overcommitment to names that lack volume confirmation. A quadrupling of volume into 2.5x or above combined with a break above resistance at 40.28 would warrant a review for promotion; until then, this category holds dry powder status.
Agriculture & Livestock — VEGI
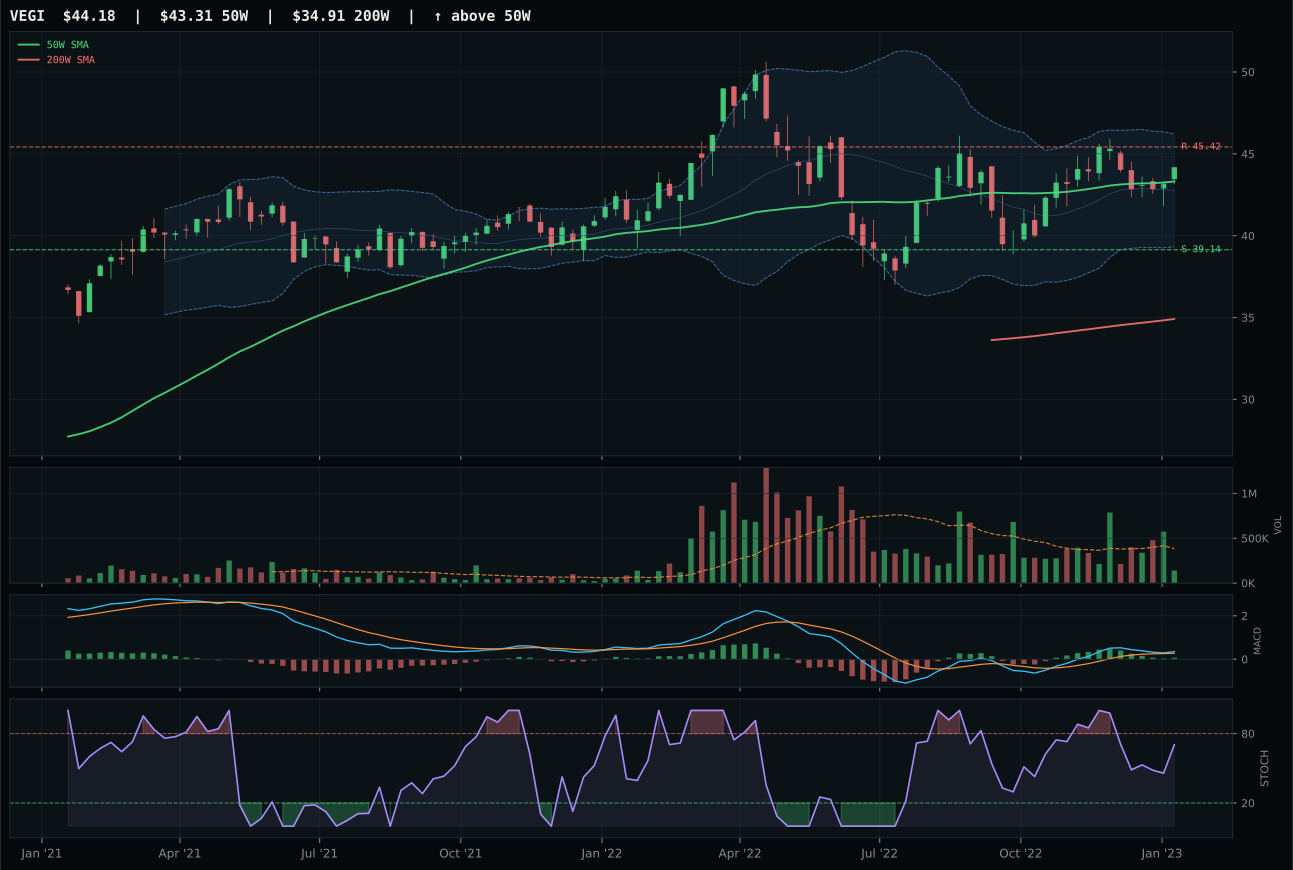
VEGI has a compression near 50W profile with -0.9% 13-week relative strength versus SPY.
A failed hold above support would weaken the setup.
Actionable but governed by invalidation levels.
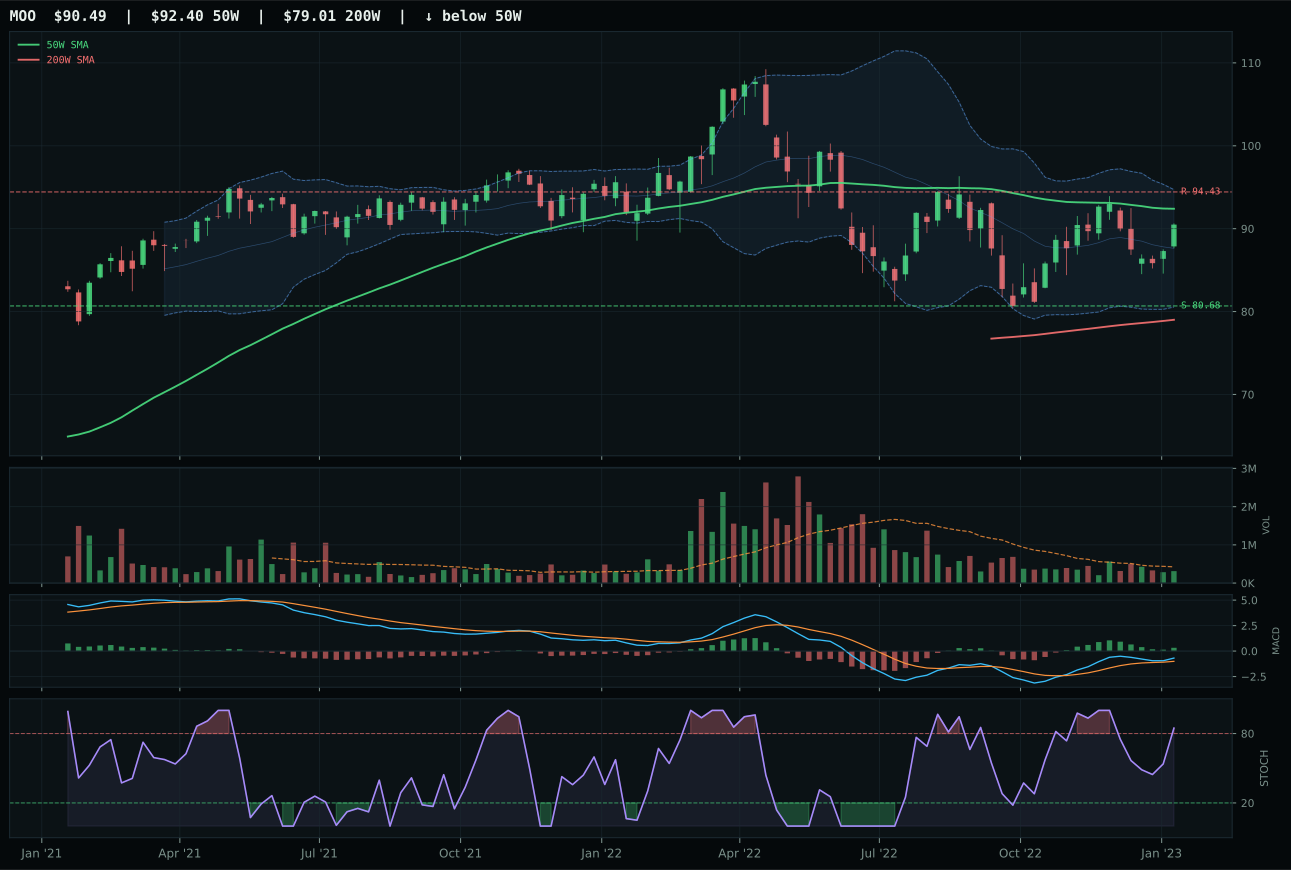
MOO has a compression near 50W profile with 0.0% 13-week relative strength versus SPY.
A failed hold above support would weaken the setup.
Actionable but governed by invalidation levels.
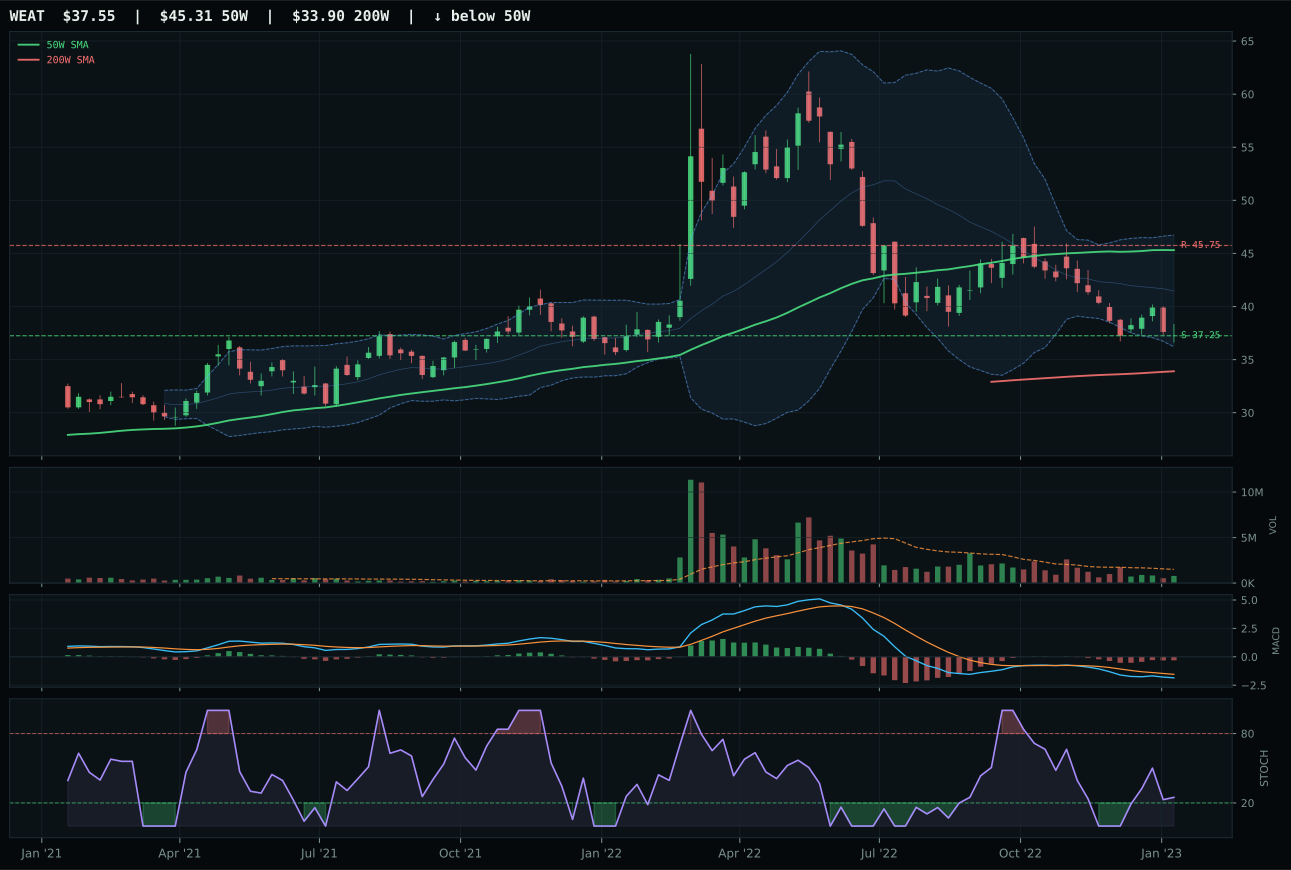
WEAT has a pullback into support profile with -25.6% 13-week relative strength versus SPY.
A failed hold above support would weaken the setup.
Actionable but governed by invalidation levels.
VEGI won a close decision over MOO by delivering the tighter setup: compression near the 50-week average with price just 2.0% above it, MACD bullish and flattening, and stochastic RSI rising mid-zone at 0.70—a measured pace of momentum that suggests accumulation without exhaustion. The 94.7% trend score reflects its position above both the 50W and 200W with near-zero slope decay, but the real edge was MOO's overbought stochastic RSI (1.00 versus VEGI's 0.70), which signals exhaustion rather than early-stage momentum. Volume thin participation at 0.37x the twenty-day mean costs VEGI on the momentum confirmation side, but that thinness also means the setup remains early; genuine institutional entry would light the volume profile on fire. MOO's superior macro narrative (70.0 versus 66.0) nearly overcame the timing disadvantage, showing how tight this category's internal decision tree is.
Agriculture earns 10% despite a 60.0 category score and an exceptional 90.0/100 macro fit—this is pure regime positioning. Supply shortage is raging (+13), inflation pressure is active (+10), and Late-Cycle Reflation itself is a tailwind (+8), creating a macro setup that screams real-asset demand. The allocation gap to 20% exists entirely on the technical side: VEGI's momentum confirmation of 65.5 and persistence of 66.9 are solid but not elite, and the thin volume means the crowd hasn't yet validated the setup with real capital. If VEGI breaks above resistance at 45.42 on volume acceleration to 1.5x or above, the category's allocation would deserve immediate review for promotion. For now, 10% positions the portfolio to profit from supply-shortage inflation without overcommitting ahead of clearer volume confirmation.
Traditional Energy — XLE
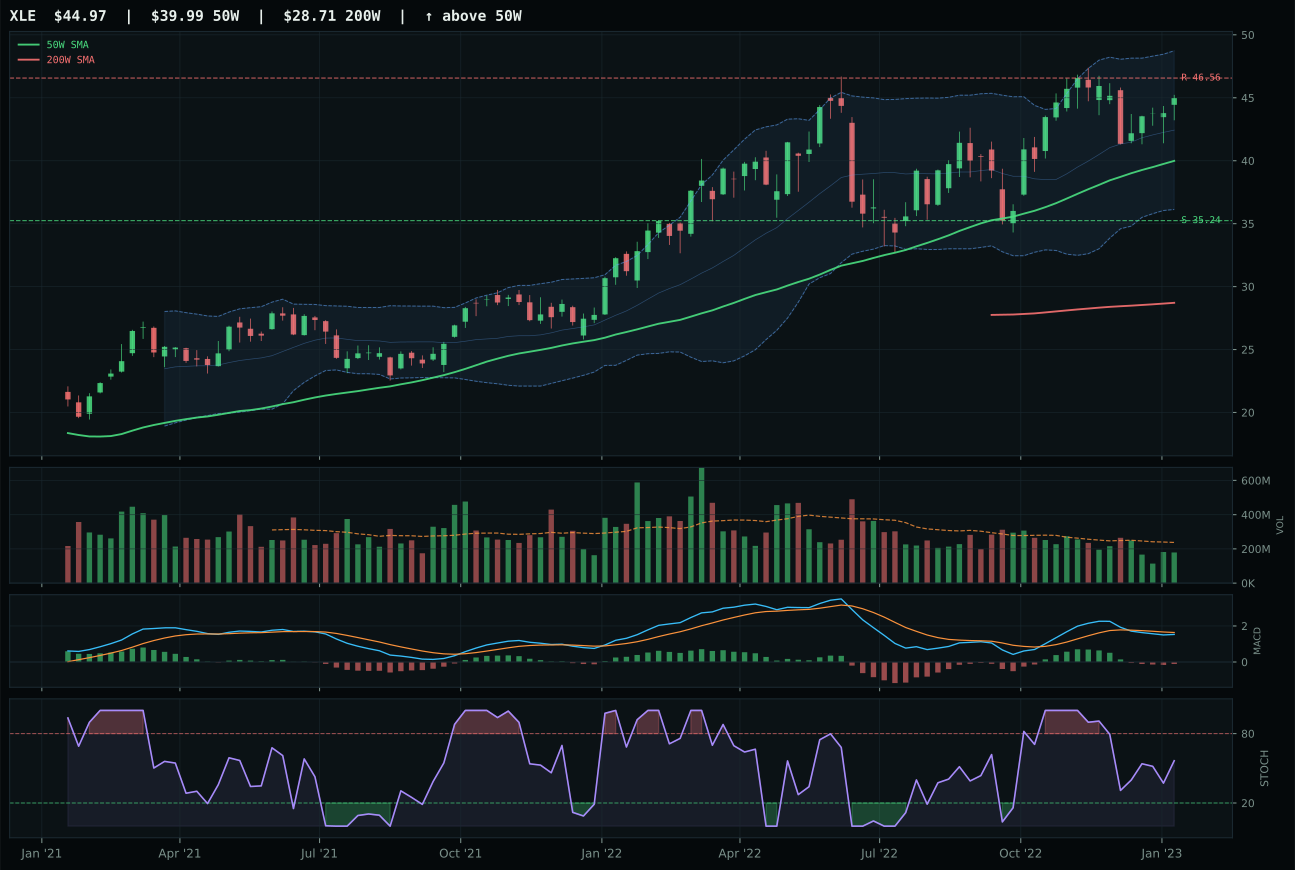
XLE has a neutral structure profile with 0.6% 13-week relative strength versus SPY.
A failed hold above support would weaken the setup.
Actionable but governed by invalidation levels.
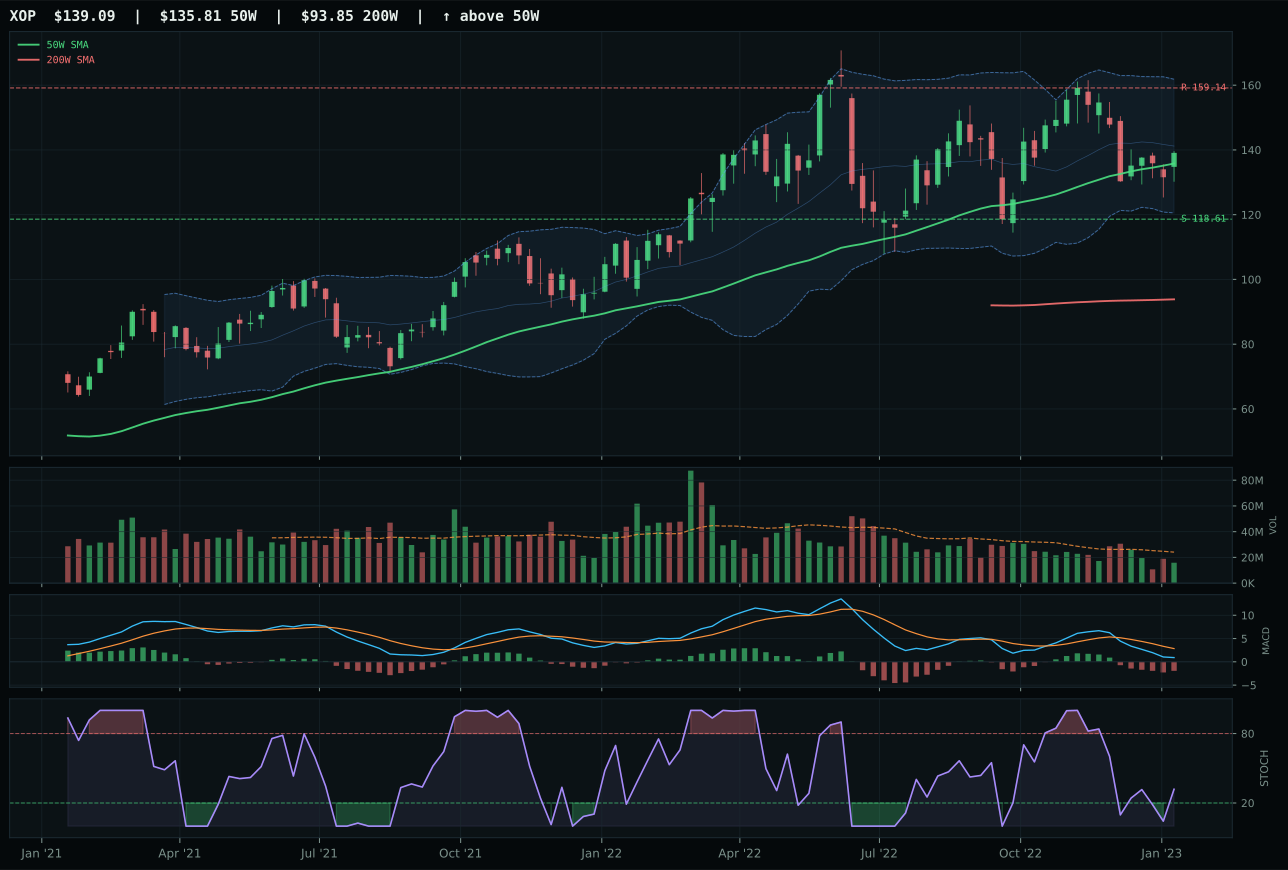
XOP has a compression near 50W profile with -10.4% 13-week relative strength versus SPY.
A failed hold above support would weaken the setup.
Actionable but governed by invalidation levels.
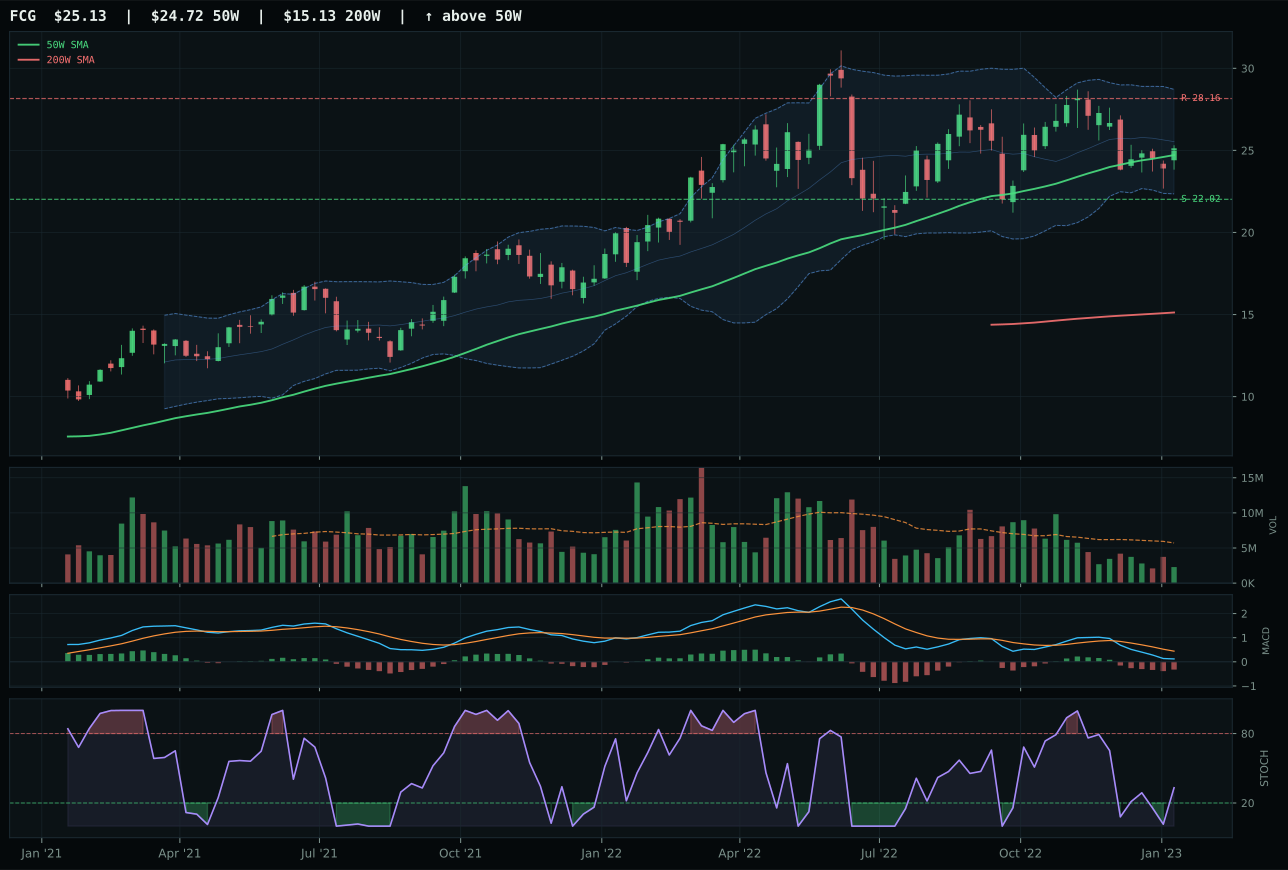
FCG has a compression near 50W profile with -10.8% 13-week relative strength versus SPY.
A failed hold above support would weaken the setup.
Actionable but governed by invalidation levels.
XLE won a tight decision over XOP because its category-relative strength measured 11.0% versus XOP's 0.0%, a gap that matters when two energy names have nearly identical MACD (both bearish/weakening) and stochastic RSI (both rising mid-zone) patterns. The 12.0% thirteen-week return with 0.6% SPY relative strength looks modest against XOP's 1.1% return, but XLE's structure at 77.2 beats XOP's 68.0, indicating cleaner support-and-resistance levels where institutional stops rest. Paradoxically, XLE's MACD is bearish/weakening, not bullish, which normally disqualifies leadership; the technical evidence of 62.2/100 reflects this penalty. However, macro fit of 86.0/100 salvages the category because energy scarcity (+14), inflation pressure (+10), and supply shortage (+7) create a regime where even deteriorating momentum inside energy names is acceptable if relative strength is positive.
Energy lands at 10% with a 60.0 category score despite a stunning 90.0/100 macro fit rating—the portfolio's real-asset bias is strong but not strong enough to overcome the technical weakness. XLE's MACD is visibly bearish/weakening, and stochastic RSI at 0.57 mid-zone suggests momentum is flat-lining rather than building. The risk-reward is particularly poor at 47.2/100, with only -3.4% upside to resistance (46.56) against 27.6% downside to support (35.24), creating a risk-reward ratio that's inverted relative to where capital should go. That said, the macro case is undeniable: energy scarcity is active, inflation pressure is real, and supply shortage is a regime driver that won't disappear quickly. Allocation to 10% respects the macro narrative while acknowledging that the chart isn't confirming it yet. If XLE breaks above 46.56 on volume at 1.0x or above and MACD turns bullish instead of weakening, the category becomes a genuine top-two candidate for promotion.
Technology — XLK
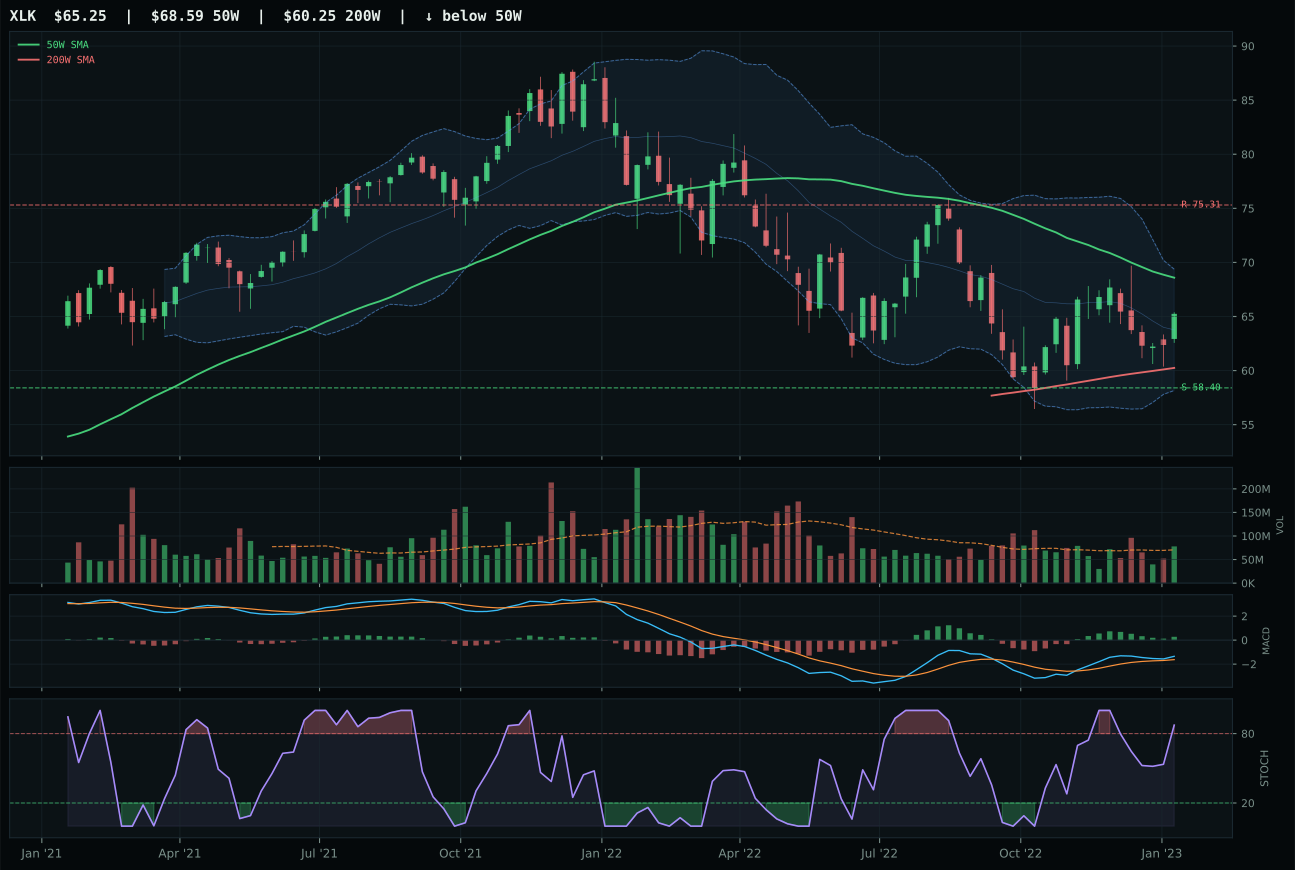
XLK has a neutral structure profile with 0.3% 13-week relative strength versus SPY.
A failed hold above support would weaken the setup.
Actionable but governed by invalidation levels.
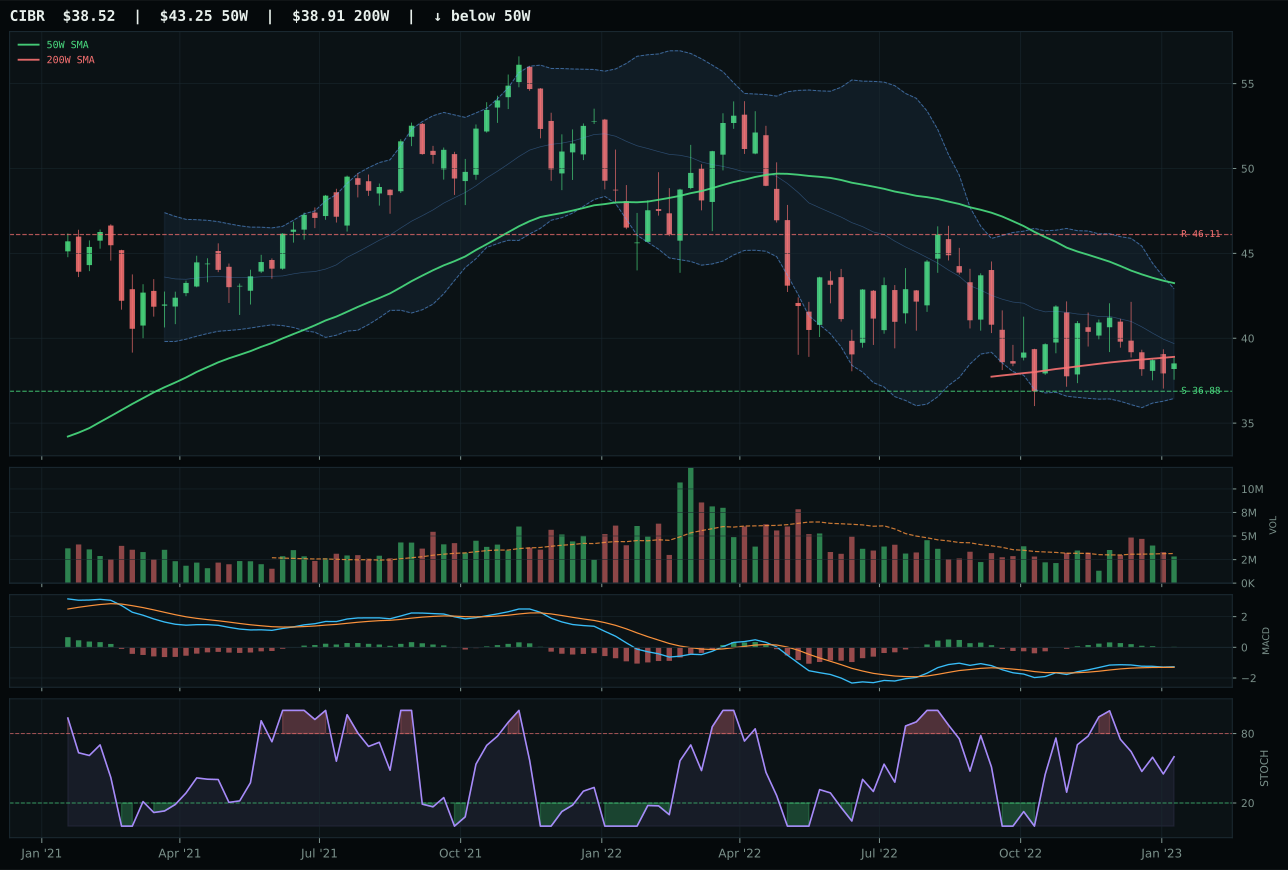
CIBR has a pullback into support profile with -7.0% 13-week relative strength versus SPY.
A failed hold above support would weaken the setup.
Actionable but governed by invalidation levels.
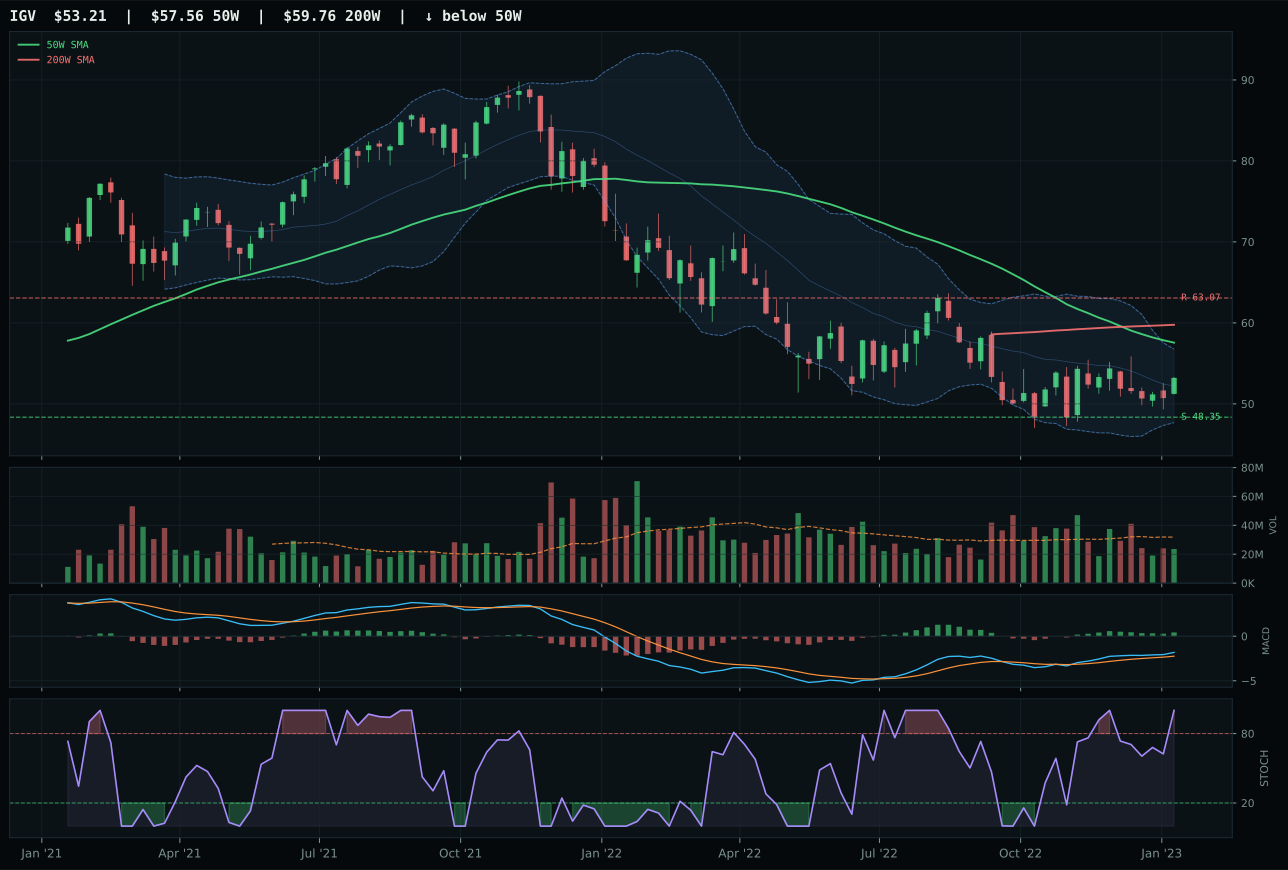
IGV has a neutral structure profile with -1.5% 13-week relative strength versus SPY.
Extension and support failure are the main tactical risks.
Tracked, but not top-2 eligible because: structurally broken.
XLK claimed the category by trading near its 50-week average after a 11.7% thirteen-week advance, a position that separates real pullback setups from extended momentum chases. The 0.3% relative strength versus SPY may appear marginal, but paired with 1.8% outperformance inside the three-ETF basket and above-average volume participation at 1.10x the twenty-day mean, it signals institutional accumulation rather than retail chase. CIBR's structure fell apart—its timing score of 68 versus XLK's 92 reveals a chart unable to confirm strength, with volume staying neutral and category-relative strength collapsing to -5.5%, leaving it stranded in pullback-into-support posture where buyers have already walked away. XLK's MACD is bullish but flattening and stochastic RSI sits overbought, a valid setup because the price compression and neutral structure create room for expansion if support holds.
Technology lands at 10% because it ranks outside the top two despite solid technicals—the 44.6 category score trails both precious metals and industrial metals by meaningful margins. Late-Cycle Reflation usually penalizes pure-growth tech when real assets are in demand, and this regime proves no exception; the active macro descriptors show liquidity stress (-10) and credit stress (-7) offsetting the ai growth sponsorship (+6), resulting in just 44.0/100 macro fit. For this category to earn 10% allocation, XLK would need either a breakout above resistance at 75.31 with volume conviction, or a macro regime shift where risk appetite turns decisively positive and the credit stress descriptor flips. The technical evidence is sound at 72.0/100, but macro headwinds are real, and the portfolio's real-asset bias makes that math work against a larger position.
AI — SMH
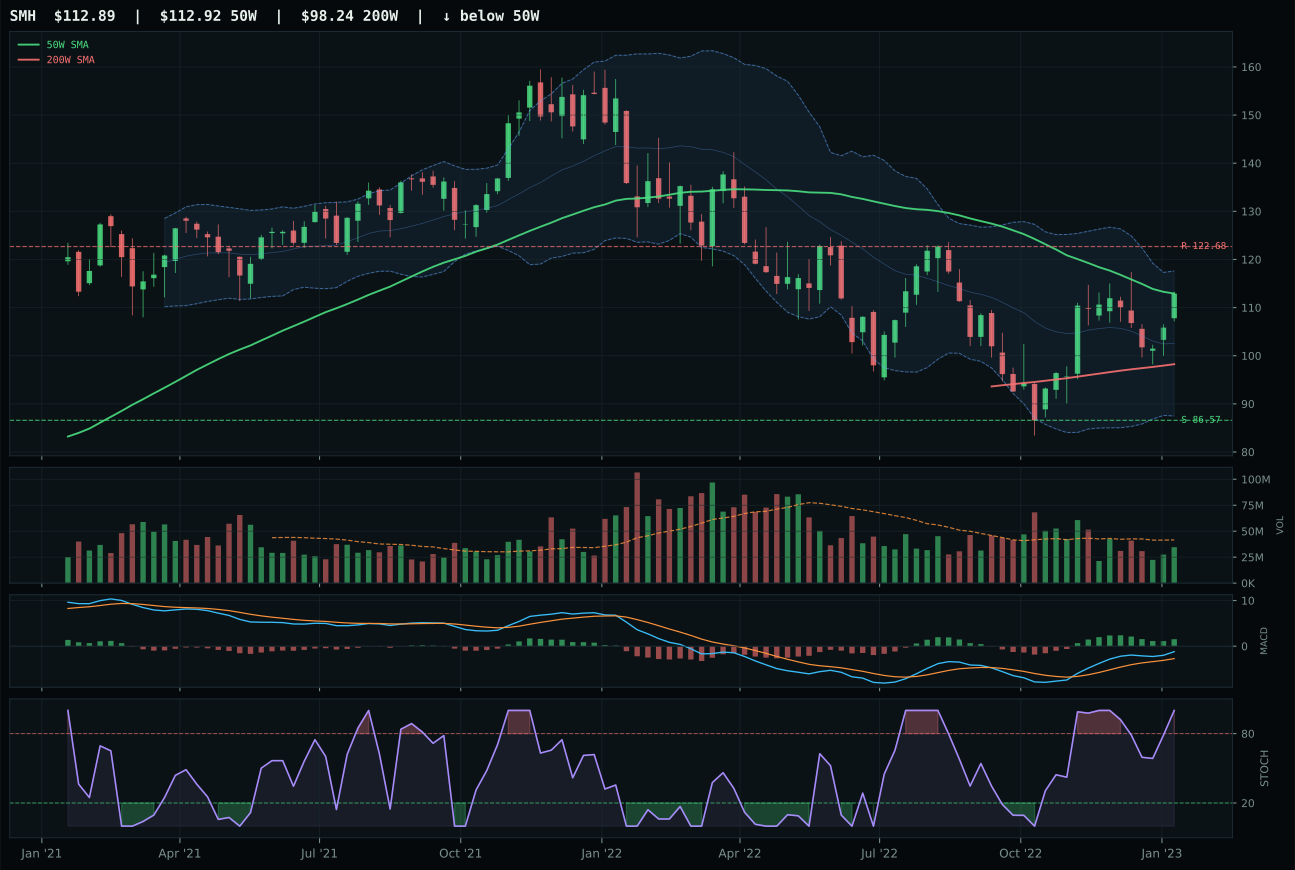
SMH has a compression near 50W profile with 19.0% 13-week relative strength versus SPY.
A failed hold above support would weaken the setup.
Actionable but governed by invalidation levels.
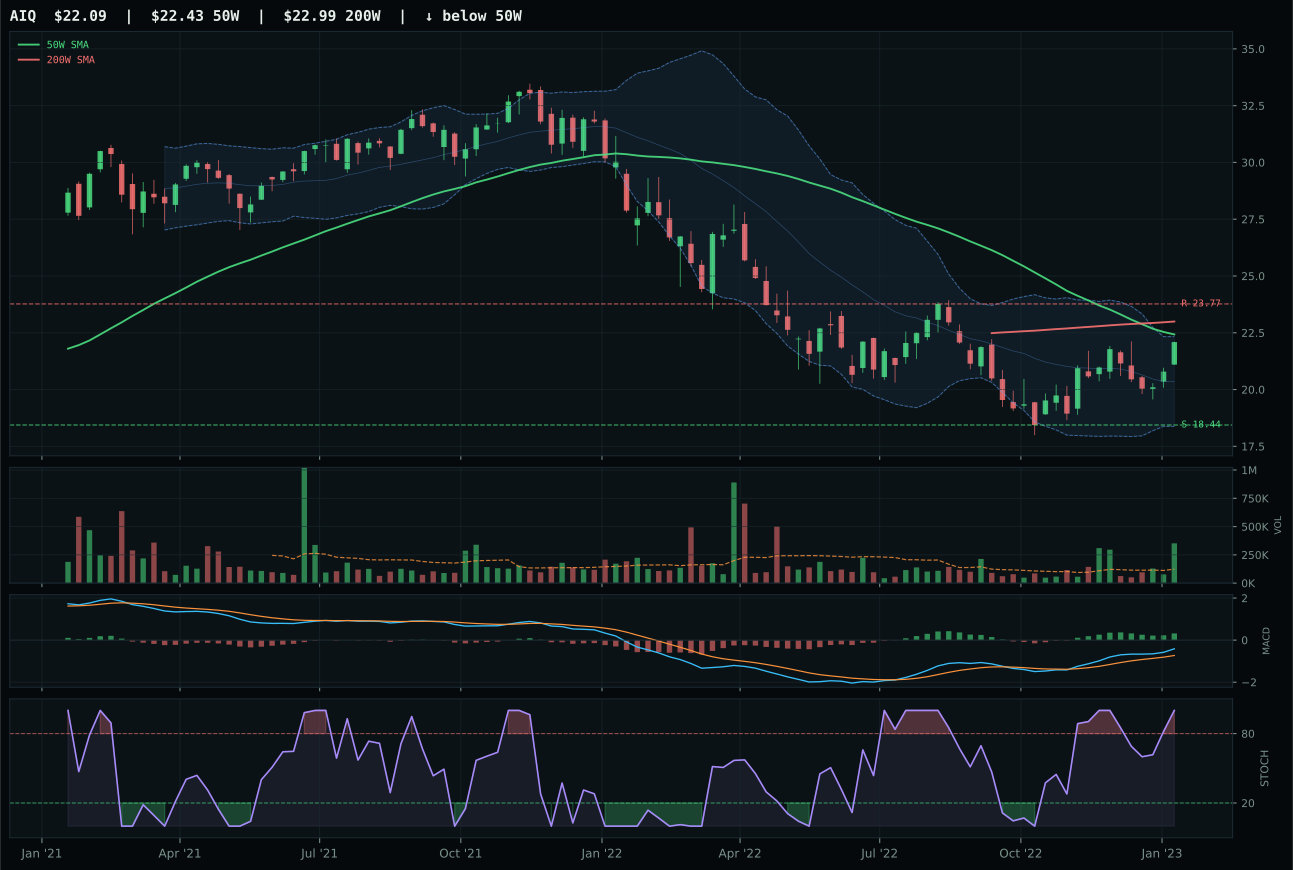
AIQ has a compression near 50W profile with 8.4% 13-week relative strength versus SPY.
Extension and support failure are the main tactical risks.
Tracked, but not top-2 eligible because: structurally broken.
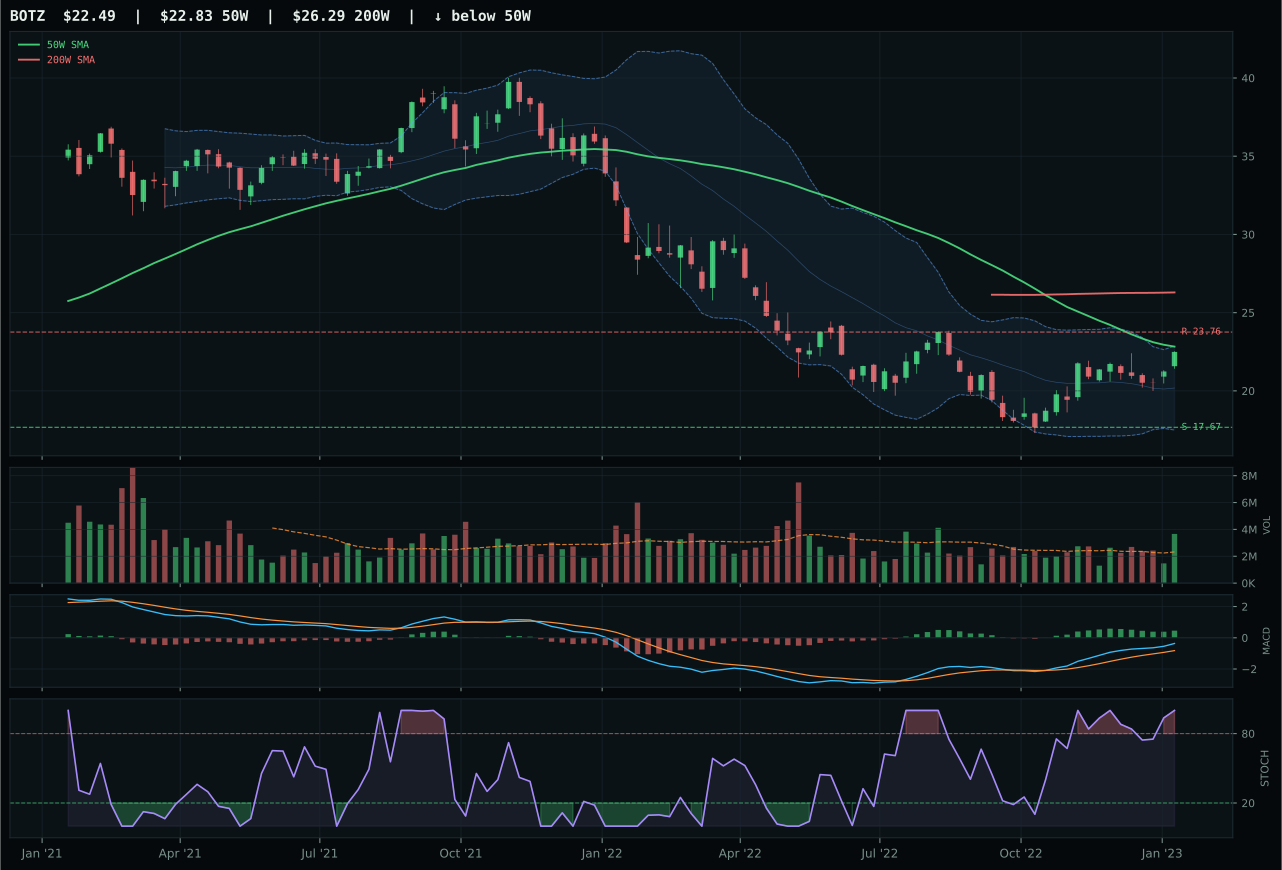
BOTZ has a compression near 50W profile with 15.8% 13-week relative strength versus SPY.
Extension and support failure are the main tactical risks.
Tracked, but not top-2 eligible because: structurally broken.
SMH wins by sitting exactly at its 50-week moving average with a 30.4% thirteen-week return and 19.0% SPY relative strength—perfect timing for a recoil setup where every new buyer from here pays more. Compression near the fifty-day mean combined with 100.0 timing and momentum scores creates the rare setup where the chart has squeezed out weakness and waits only for confirmation of accumulation. Volume is neutral at 0.83x the twenty-day average, which costs the risk-reward score but actually strengthens the setup; if institutional money enters without frantic volume, that's controlled accumulation, not panic buying. AIQ collapsed on structure breakdown and hard-filter triggers—its category-relative strength turned negative at -7.5% despite the 19.8% thirteen-week raw return, meaning it lagged its category peers badly, a red flag that execution discipline demands be obeyed.
AI scored 44.5 and earned zero allocation because it ranked 9th or 10th among the ten categories, falling well below the threshold for any capital commitment. Despite SMH's exceptional momentum (100.0 momentum score, 30.4% 13-week return) and the active ai growth sponsorship macro descriptor (+14 points), the category's technical evidence of 82.8 was undercut by macro/narrative fit of only 58.0. Liquidity stress (–12 points) and credit stress (–8 points) are more powerful headwinds than the ai sponsorship tailwind in a reflation regime where credit conditions tighten. For AI to earn even a 10% slot, SMH would need to sustain its expansion above the 50W with improving volume, and the broader category macro fit would need to rise above 65 to offset the structural headwinds. Right now, the portfolio has six categories offering better risk-adjusted setups.
Emerging Markets — IEMG
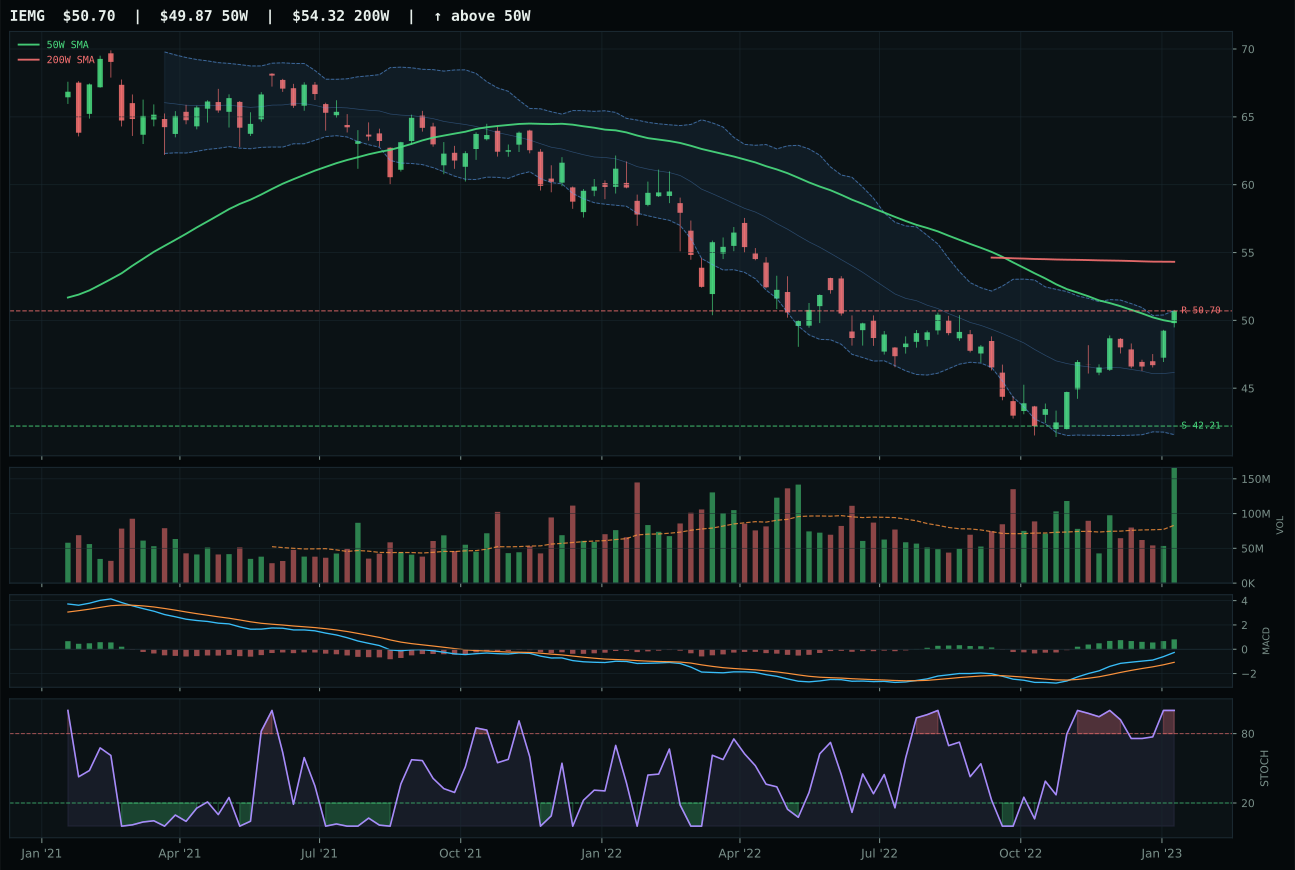
IEMG has a compression near 50W profile with 8.7% 13-week relative strength versus SPY.
A failed hold above support would weaken the setup.
Actionable but governed by invalidation levels.
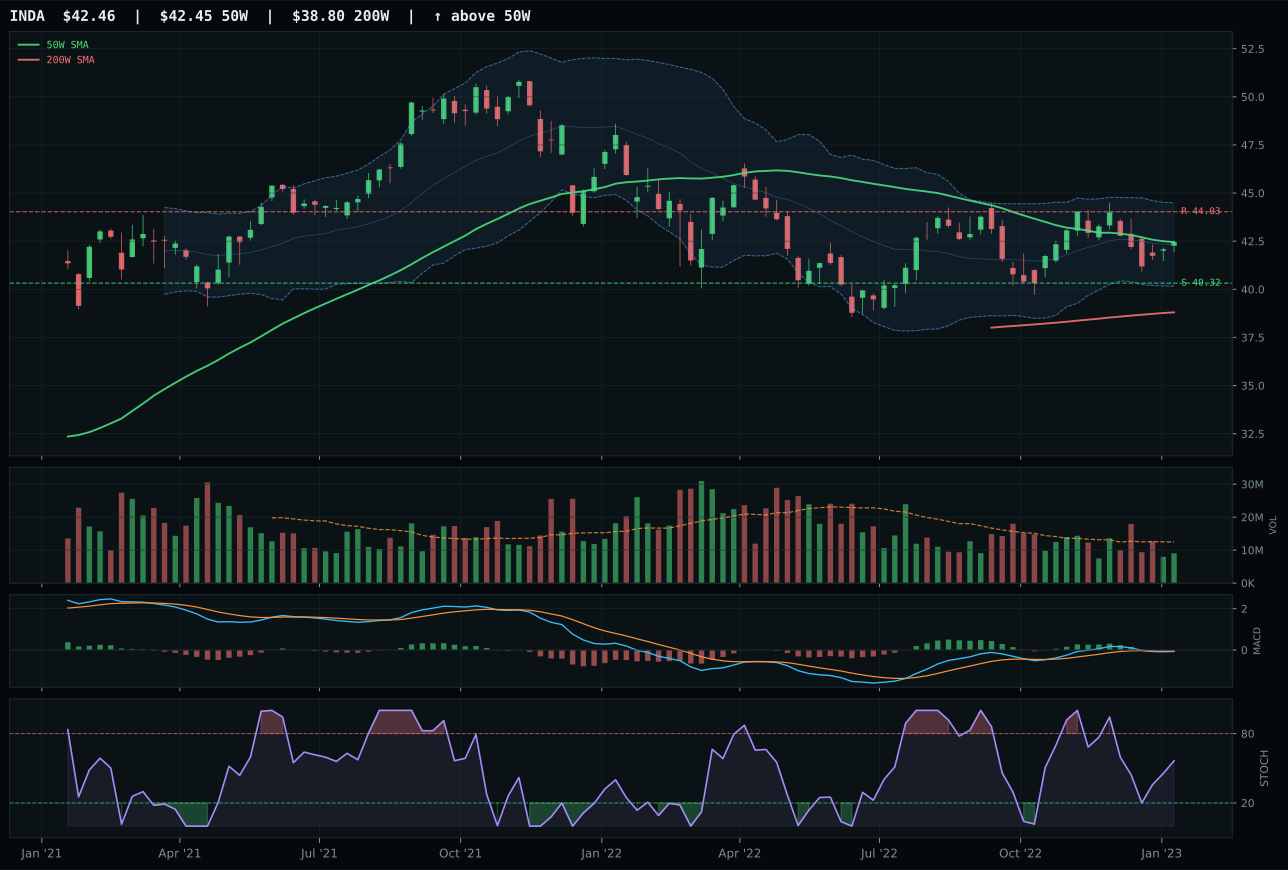
INDA has a compression near 50W profile with -6.1% 13-week relative strength versus SPY.
A failed hold above support would weaken the setup.
Actionable but governed by invalidation levels.
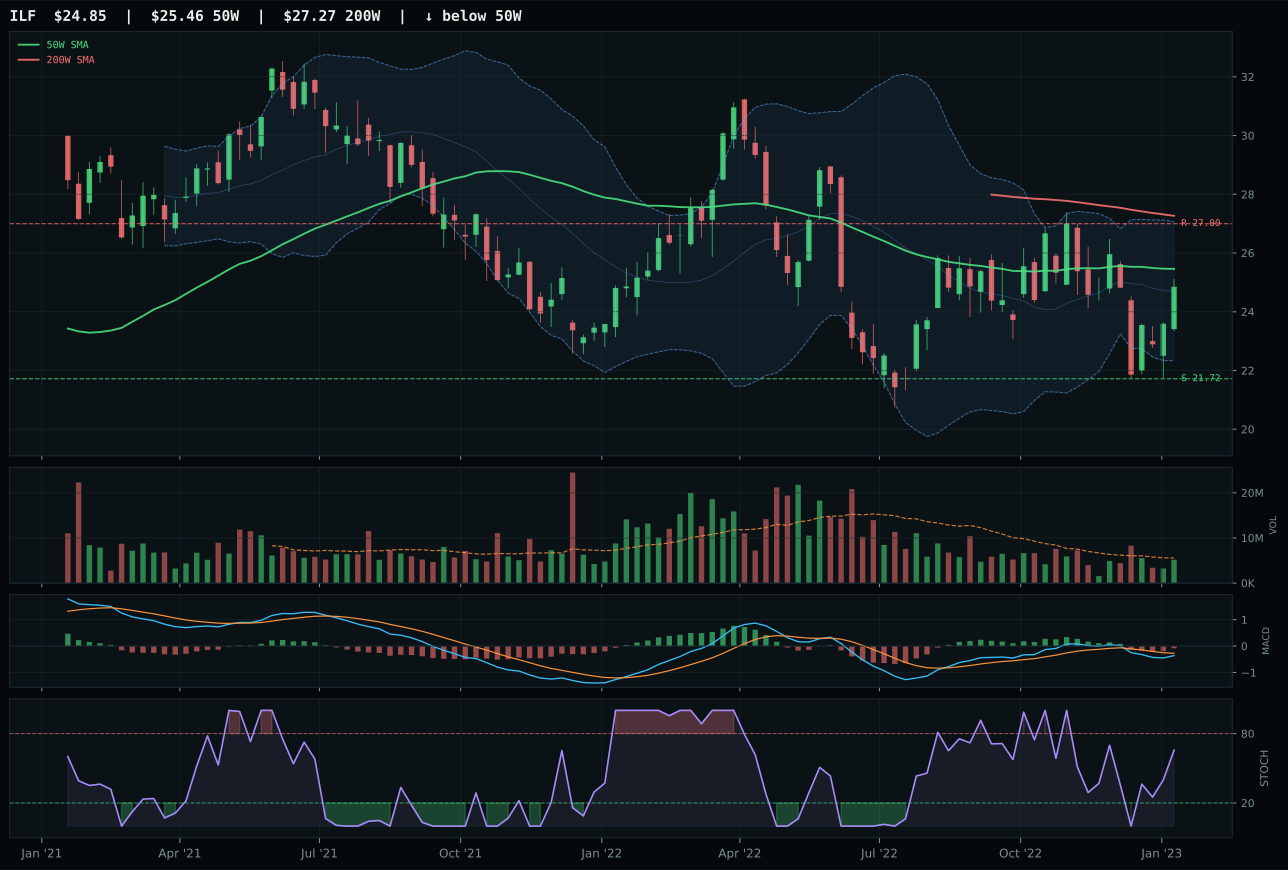
ILF has a compression near 50W profile with -9.6% 13-week relative strength versus SPY.
Extension and support failure are the main tactical risks.
Tracked, but not top-2 eligible because: structurally broken.
IEMG crushed the category with a 83-point composite technical score fueled by near-perfect timing (100.0 from 1.7% distance to 50W), flawless momentum confirmation (100.0 from 20.1% thirteen-week return and 14.8% category-relative strength), and elite volume-price confirmation at 93.5/100 from 2.03x accumulation-level volume. MACD is bullish and improving, stochastic RSI is overbought, and the compression setup near the fifty-day mean with support at 42.21 and resistance at 50.70 creates a trade with defined risk and clear levels. INDA's setup was broken; its MACD turned bearish/weakening and volume participation collapsed to thin levels, leaving no sponsorship. Category-relative strength of 0.0% versus IEMG's 14.8% tells the full story: IEMG is winning, INDA is losing, and the technicals make that inequality visible.
Emerging Markets scored 17.7 and earned zero allocation because macro fit of 38.0 is a disqualifying headwind despite IEMG's technical excellence. Risk appetite positive is active (+8 points), but credit stress (–10 points) and liquidity stress (–10 points) combine to a net negative of –12 points in a reflation regime where credit conditions are tightening. IEMG's 100.0 technical evidence cannot overcome a macro environment where emerging markets are de facto short volatility and credit—the 62%/38% weighting of technical to macro means IEMG's pristine chart (compression, accumulation volume, bullish MACD) is drowned by macro headwinds. The portfolio has six categories offering better macro fit and comparable or superior technical setups. For Emerging Markets to earn 10%, either credit stress or liquidity stress would need to flip from active to inactive, or a new positive macro descriptor (risk appetite positive is already counted) would need to emerge. Right now, IEMG is excluded entirely because the macro regime actively disfavors this asset class.