
2023-01-06
Informational purposes only. The content in this report, including allocations, analysis, and commentary, is provided solely for informational and educational purposes. It does not constitute financial advice, investment advice, trading advice, or any other type of advice. Past performance does not guarantee future results. Always conduct your own research and consult a qualified financial professional before making investment decisions.
Weekly Allocation
| Ticker | Category | Weight | Role |
|---|---|---|---|
| GLD | Precious Metals | 20% | Top-2 (20%) |
| XAR | Defense & Aerospace | 20% | Top-2 (20%) |
| COPX | Industrial Metals | 10% | Tier-2 (10%) |
| IGF | Utilities & Infrastructure | 10% | Tier-2 (10%) |
| WEAT | Agriculture & Livestock | 10% | Tier-2 (10%) |
| XLE | Traditional Energy | 10% | Tier-2 (10%) |
| URNM | Nuclear Energy | 10% | Tier-2 (10%) |
| INDA | Emerging Markets | 10% | Tier-2 (10%) |
Trade Instructions — Monday Open
Sell the tranche from 2022-12-09 (completing its 4-week hold). Buy the new tranche. Instructions show net portfolio changes — same-asset positions cancel, weight changes show the delta.
| Action | Ticker | Instruction |
|---|---|---|
| SELL | COPX | Sell 17% of COPX position (reduce 15.00% → 12.50%) |
| SELL | XLU | Sell 40% of XLU position (reduce 12.50% → 7.50%) |
| SELL | MOO | Sell 33% of MOO position (reduce 7.50% → 5.00%) |
| SELL | SLV | Sell 33% of SLV position (reduce 7.50% → 5.00%) |
| SELL | ITA | Sell 14% of ITA position (reduce 17.50% → 15.00%) |
| SELL | XLK | Sell 33% of XLK position (reduce 7.50% → 5.00%) |
| SELL | URA | Sell 50% of URA position (reduce 5.00% → 2.50%) |
| BUY | GLD | Buy GLD — 25.00% of freed cash (adds 5.00% to portfolio) |
| BUY | WEAT | Buy WEAT — 12.50% of freed cash (adds 2.50% to portfolio) |
| BUY | URNM | Buy URNM — 12.50% of freed cash (adds 2.50% to portfolio) |
| BUY | INDA | Buy INDA — 12.50% of freed cash (adds 2.50% to portfolio) |
| BUY | XAR | Buy XAR — 25.00% of freed cash (adds 5.00% to portfolio) |
| BUY | IGF | Buy IGF — 12.50% of freed cash (adds 2.50% to portfolio) |
Current Portfolio After Trade
Combined holdings across all 4 active tranches. Each tranche is 25% of the portfolio.
| Ticker | % of Portfolio | Weight Bar |
|---|---|---|
| ITA | 15.00% | |
| COPX | 12.50% | |
| XLE | 12.50% | |
| GLD | 10.00% | |
| XLU | 7.50% | |
| MOO | 5.00% | |
| SLV | 5.00% | |
| XLK | 5.00% | |
| WEAT | 5.00% | |
| URNM | 5.00% | |
| INDA | 5.00% | |
| XAR | 5.00% | |
| URA | 2.50% | |
| SMH | 2.50% | |
| IGF | 2.50% |
Macro Regime — Late-Cycle Reflation
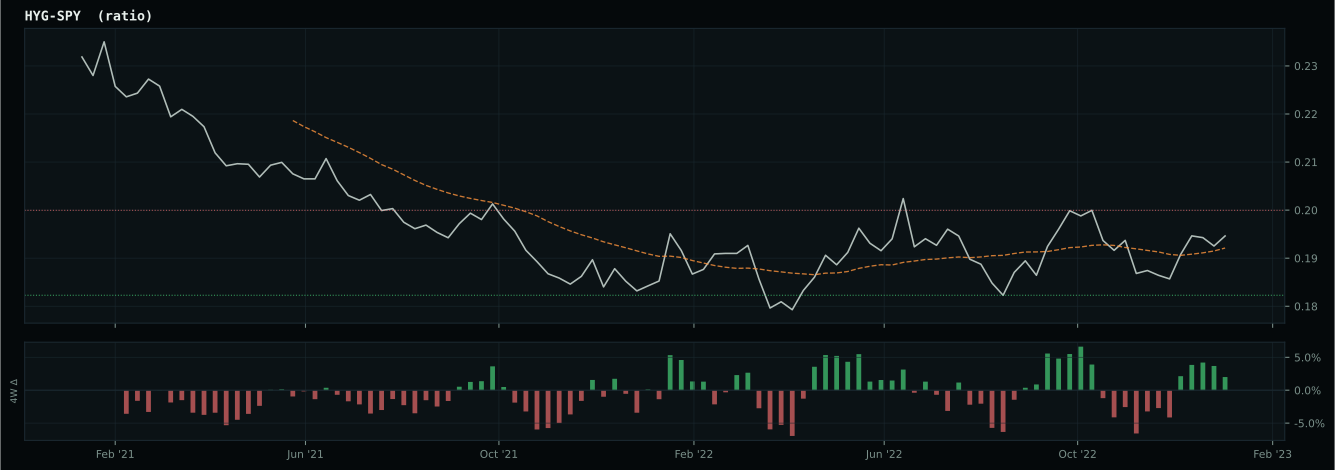
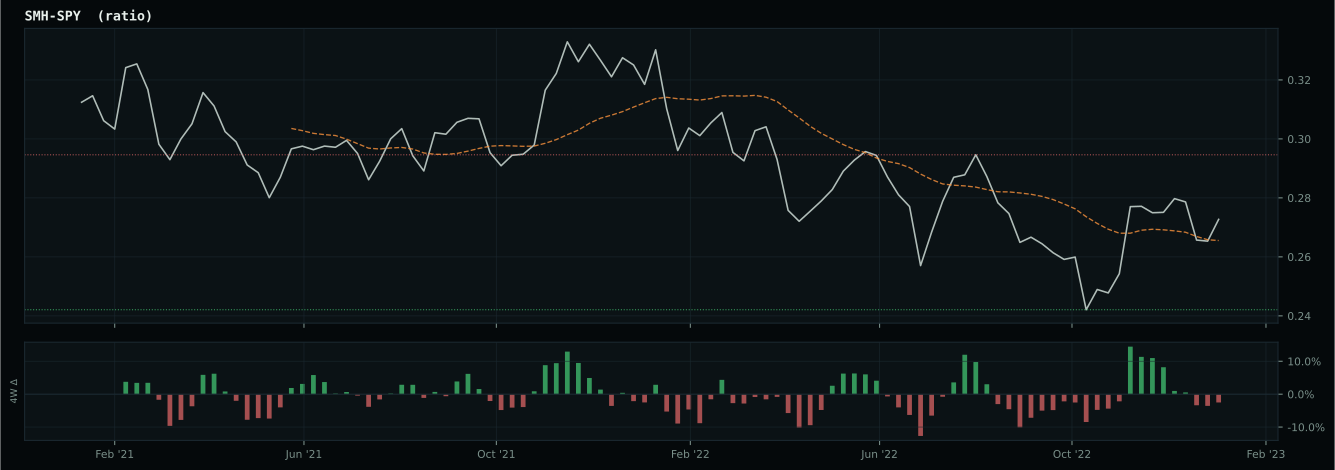
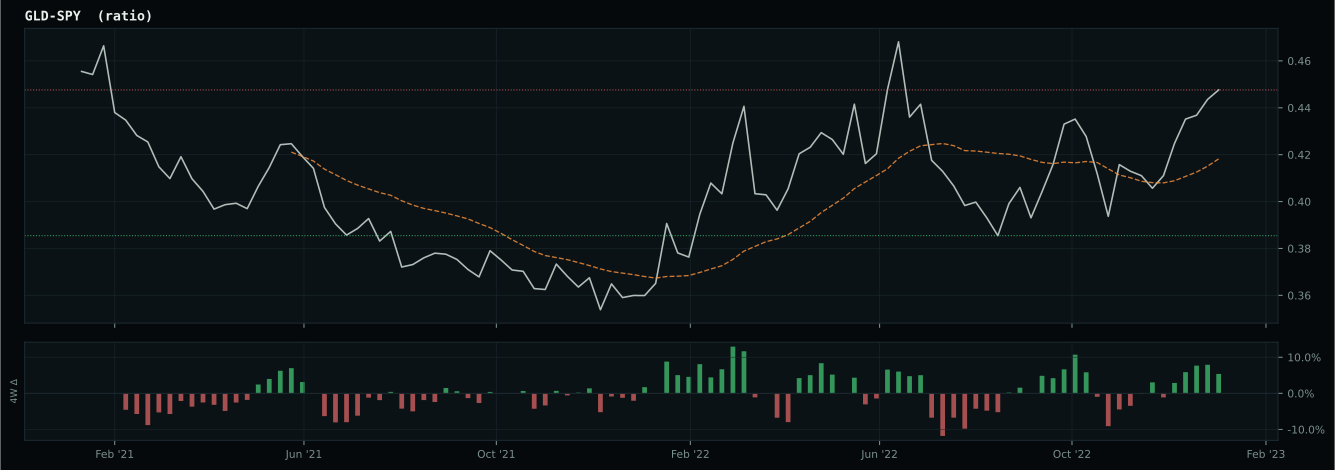
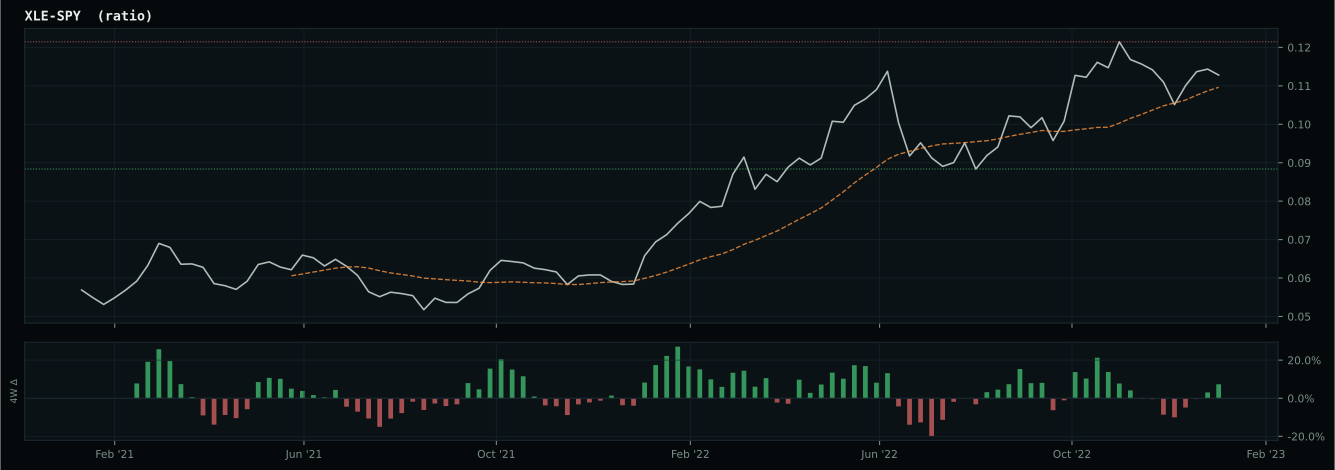
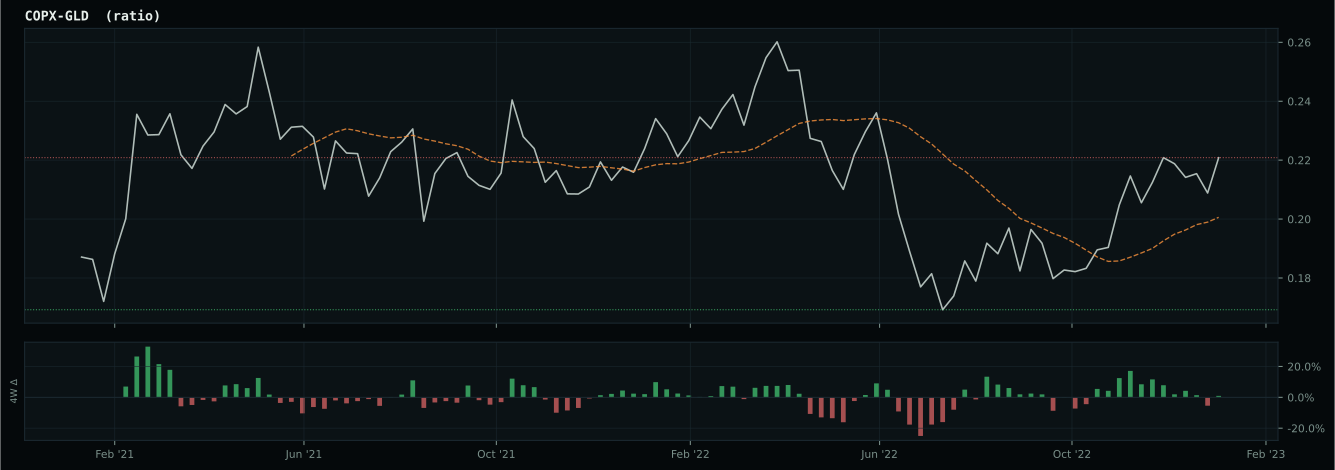
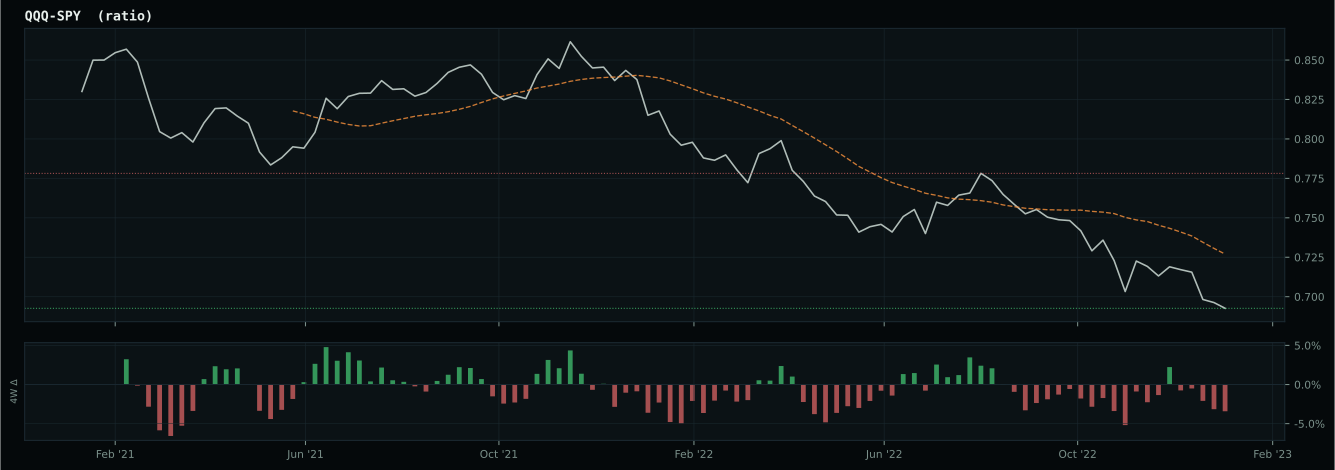
Macro Evidence Charts
Market-implied signals behind the macro regime scores. Each ratio compares two assets; the direction and slope of the ratio is what the macro engine reads.
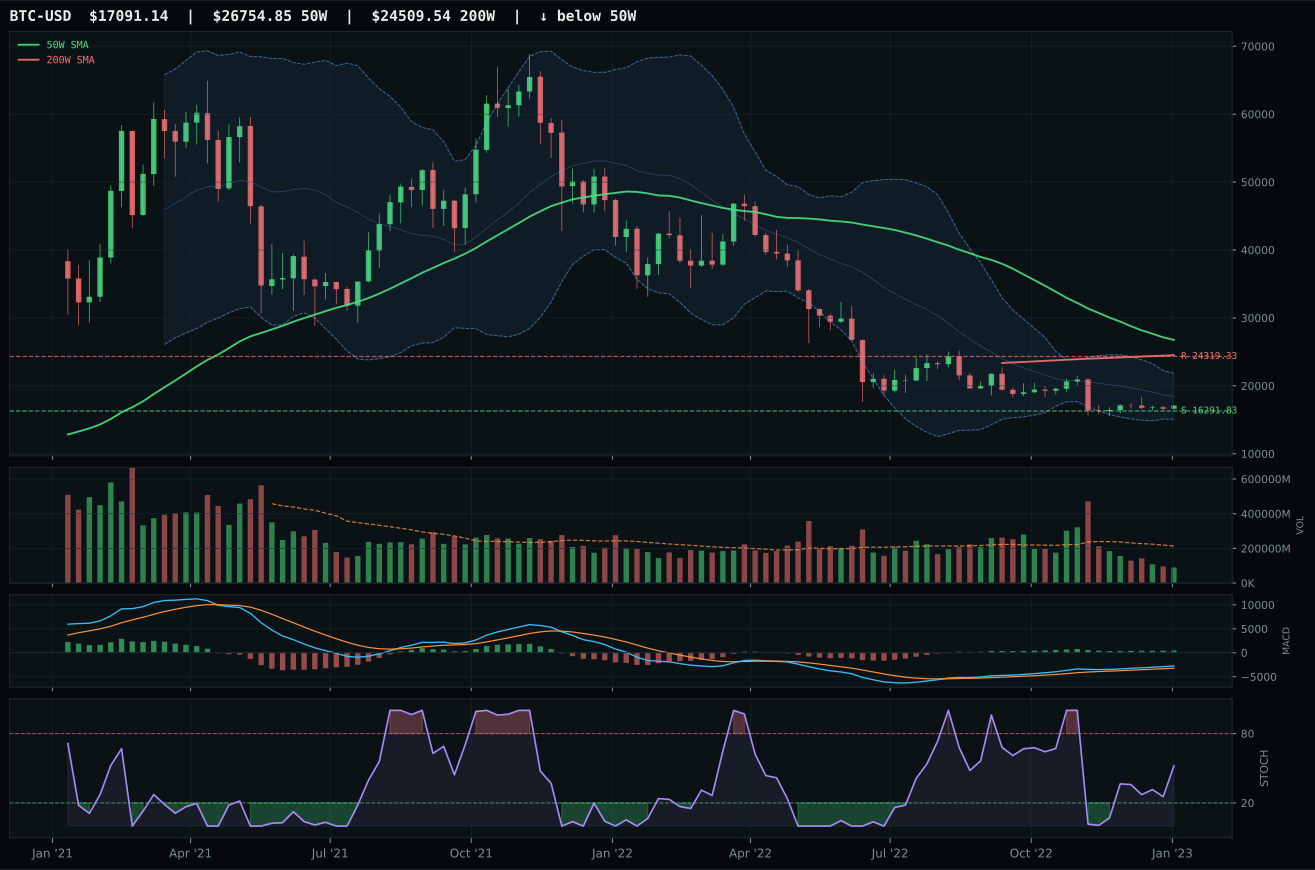
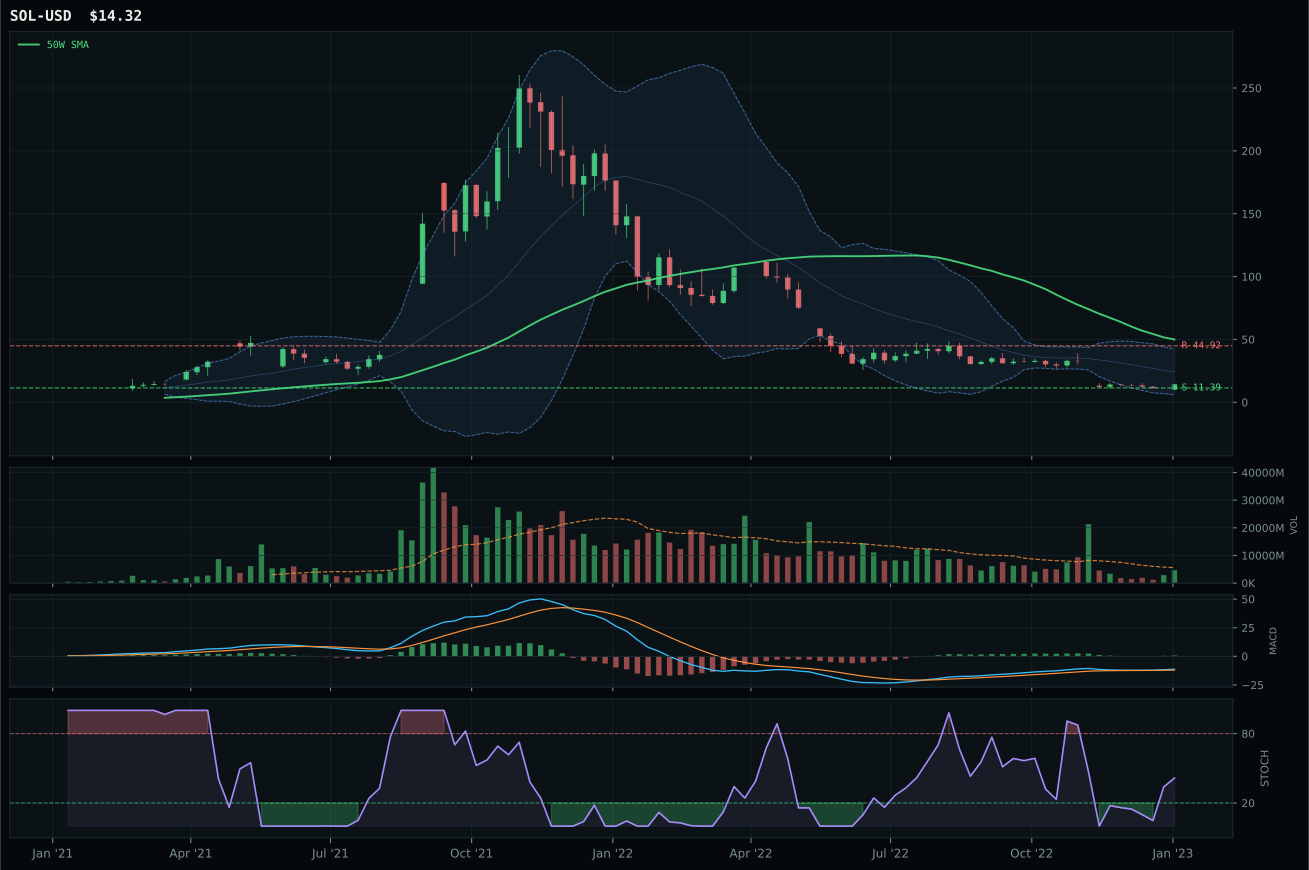
Crypto Regime — NoCrypto
ValueBTC armed; waiting for 50W reclaim, decisive close above post-touch range resistance by 3%, close above 200W, breakout volume above 20W…
TrendBTC not confirmed
one or more available conditions failed
Category Rankings
| Rank | Category | Winner | Score | Alloc | 4W Ret | Peers (4W) |
|---|---|---|---|---|---|---|
| 1 | Precious Metals | GLD | 74.0 | 20% | -0.23% | GDX -5.3% · SLV -6.6% |
| 2 | Defense & Aerospace | XAR | 70.0 | 20% | +4.70% | ITA -0.5% · ROKT +3.9% |
| 3 | Industrial Metals | COPX | 67.1 | 10% | +0.51% | PICK +1.5% · REMX +9.5% |
| 4 | Utilities & Infrastructure | IGF | 66.8 | 10% | +0.49% | PAVE +7.4% · XLU -4.7% |
| 5 | Agriculture & Livestock | WEAT | 54.3 | 10% | +2.66% | VEGI -1.0% · MOO +2.2% |
| 6 | Traditional Energy | XLE | 53.1 | 10% | -3.20% | XOP +0.1% · FCG -1.8% |
| 7 | Nuclear Energy | URNM | 47.8 | 10% | +2.53% | URA +2.9% · NLR +1.5% |
| 8 | AI | SMH | 25.8 | 10% | +13.62% | BOTZ +12.2% · AIQ +11.8% |
| 9 | Technology | XLK | 24.2 | 0% | +11.40% | CIBR +7.8% · IGV +11.3% |
| 10 | Emerging Markets | INDA | — | 0% | -5.47% | IEMG -0.6% · ILF +2.6% |
Precious Metals — GLD
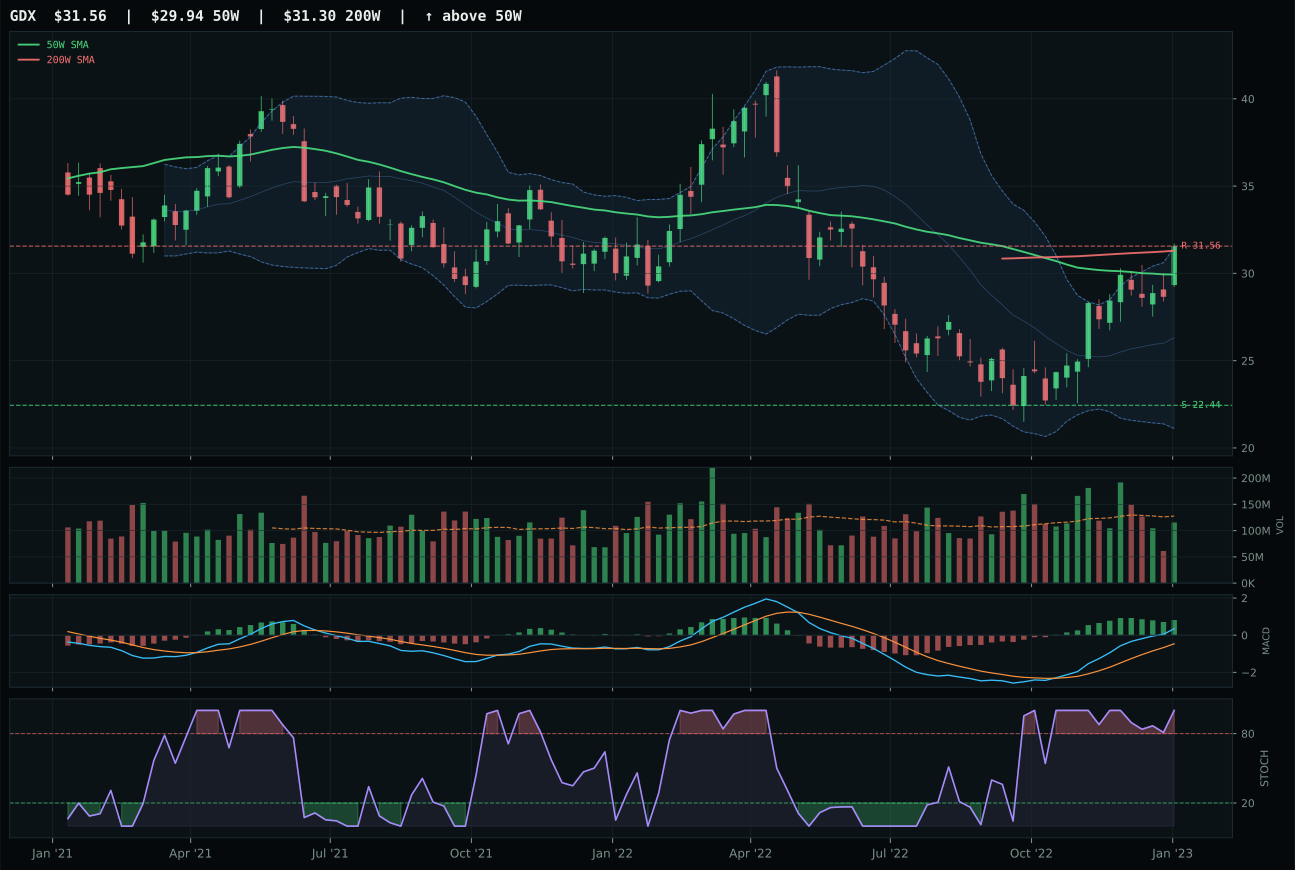
GDX has a neutral structure profile with 22.4% 13-week relative strength versus SPY.
A failed hold above support would weaken the setup.
Actionable but governed by invalidation levels.
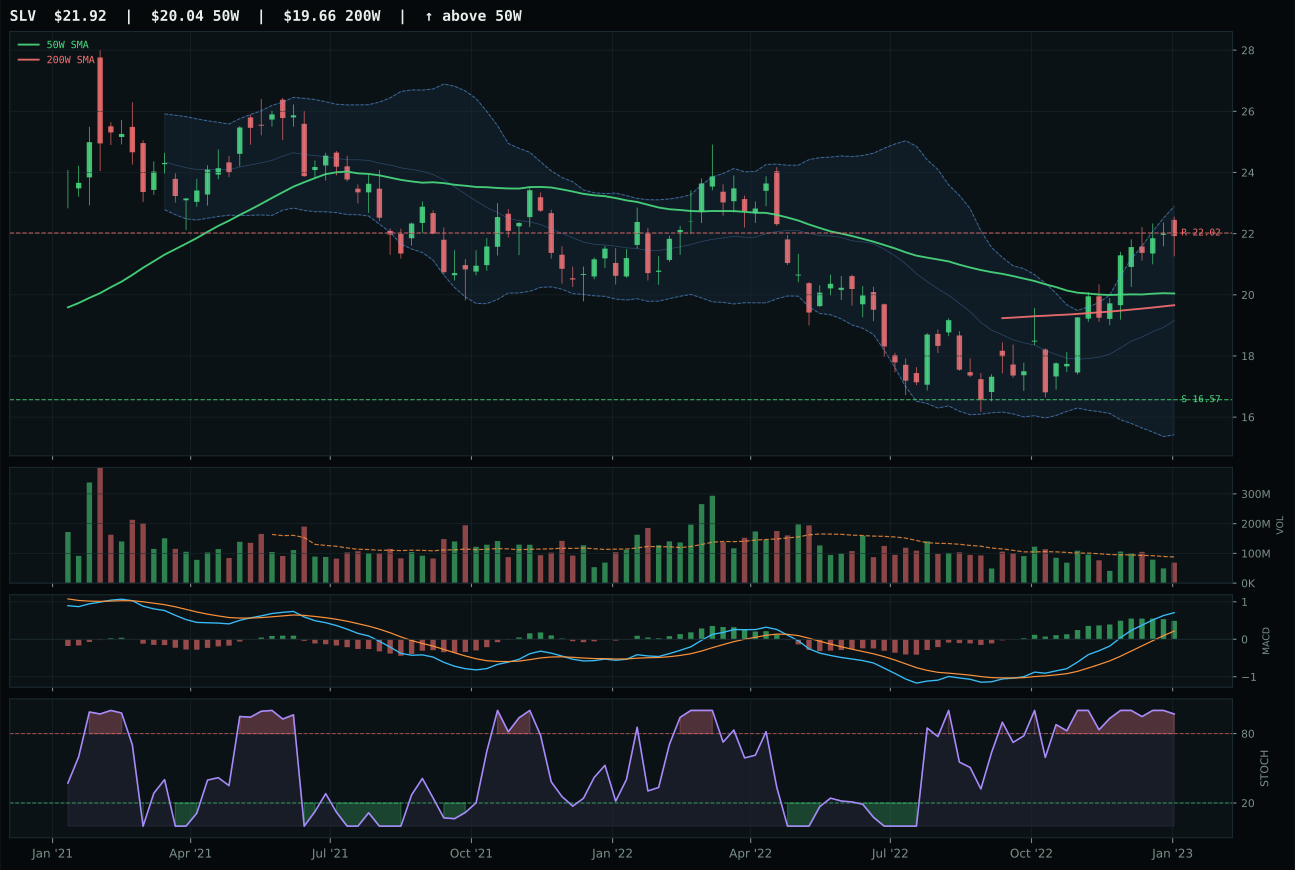
SLV has a neutral structure profile with 11.5% 13-week relative strength versus SPY.
A failed hold above support would weaken the setup.
Actionable but governed by invalidation levels.
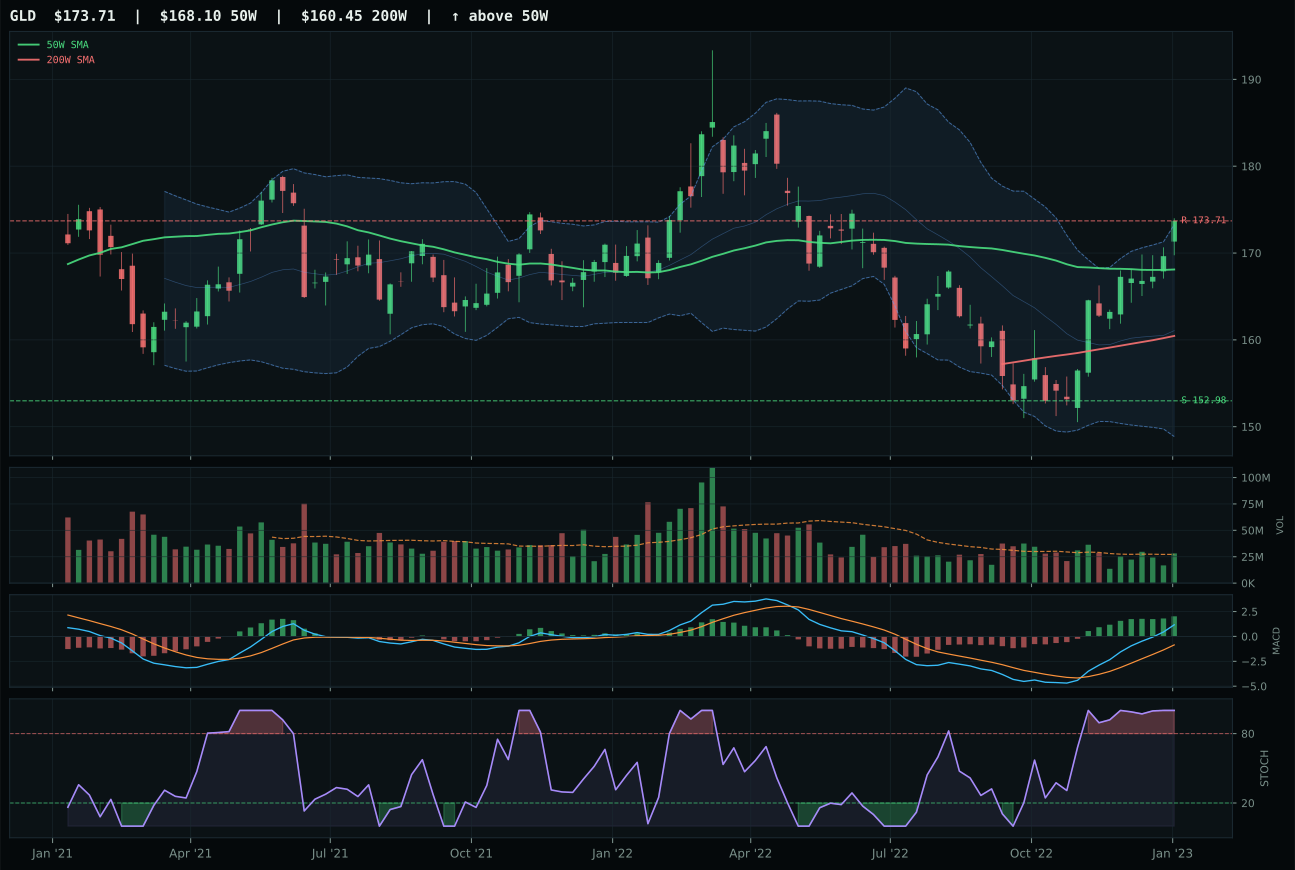
GLD has a neutral structure profile with 3.1% 13-week relative strength versus SPY.
A failed hold above support would weaken the setup.
Actionable but governed by invalidation levels.
GLD claimed the second 20% allocation by marrying pristine technicals with the portfolio's most powerful defensive macro narrative. Its 100.0 trend score—price above both 50W and 200W with flat slope—and 97.0 timing score (distance to 50W just 3.3%) describe an ETF that has reset without breaking structure, sitting perfectly centered in the middle Fibonacci retracement at 0.500. GDX's 84.8 technical evidence score exceeds GLD's 77.5, yet GDX stumbles on a 42.0 macro fit versus GLD's 70.0; GDX is a leveraged miner bet that performs only when risk appetite returns, whereas GLD is the pure monetary hedge that owns defensive rotation and liquidity stress. GLD's 70.7 momentum confirmation, driven by a 10.0% thirteen-week return paired with 3.1% SPY relative strength, proves the trade is working without excess enthusiasm. Volume at 1.03x signals healthy sponsorship, and the MACD is improving rather than merely bullish—mechanical evidence of fresh accumulation.
Precious Metals earned its second 20% slot at 74.0 because the monetary hedge bid is active (+14) and defensive rotation is live (+7), meaning gold's role as a crisis insurance premium has shifted from narrative to reality. Late-Cycle Reflation typically should hurt metals, yet the active macro descriptors override the regime label; when liquidity stress and credit stress are live simultaneously, gold becomes the dry powder for forced liquidations. GLD's positioning just 3.3% from the 50W and sitting in a Fibonacci decision zone means new capital can stack without fighting exhausted momentum. The thirteen-week return of 10.0% and neutral volume participation confirm the positioning is early-stage relative strength, not late-stage capitulation. At twenty percent, GLD and XAR form the portfolio's twin hedges—Defense & Aerospace for structural crisis protection, Precious Metals for monetary/liquidity crisis protection. Together they represent conviction that the portfolio can weather either equity drawdown or credit event without liquidation pressure.
Defense & Aerospace — XAR
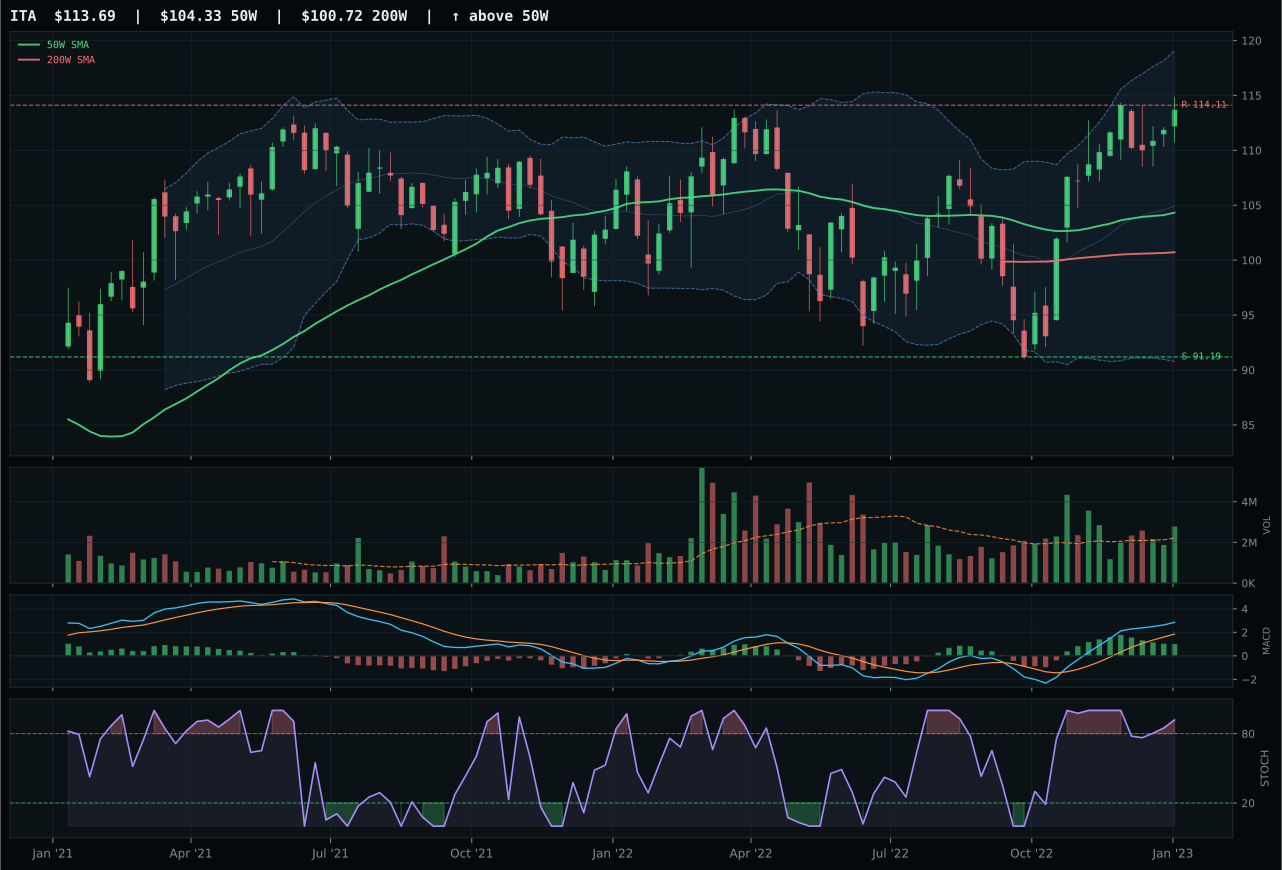
ITA has a neutral structure profile with 12.4% 13-week relative strength versus SPY.
A failed hold above support would weaken the setup.
Actionable but governed by invalidation levels.
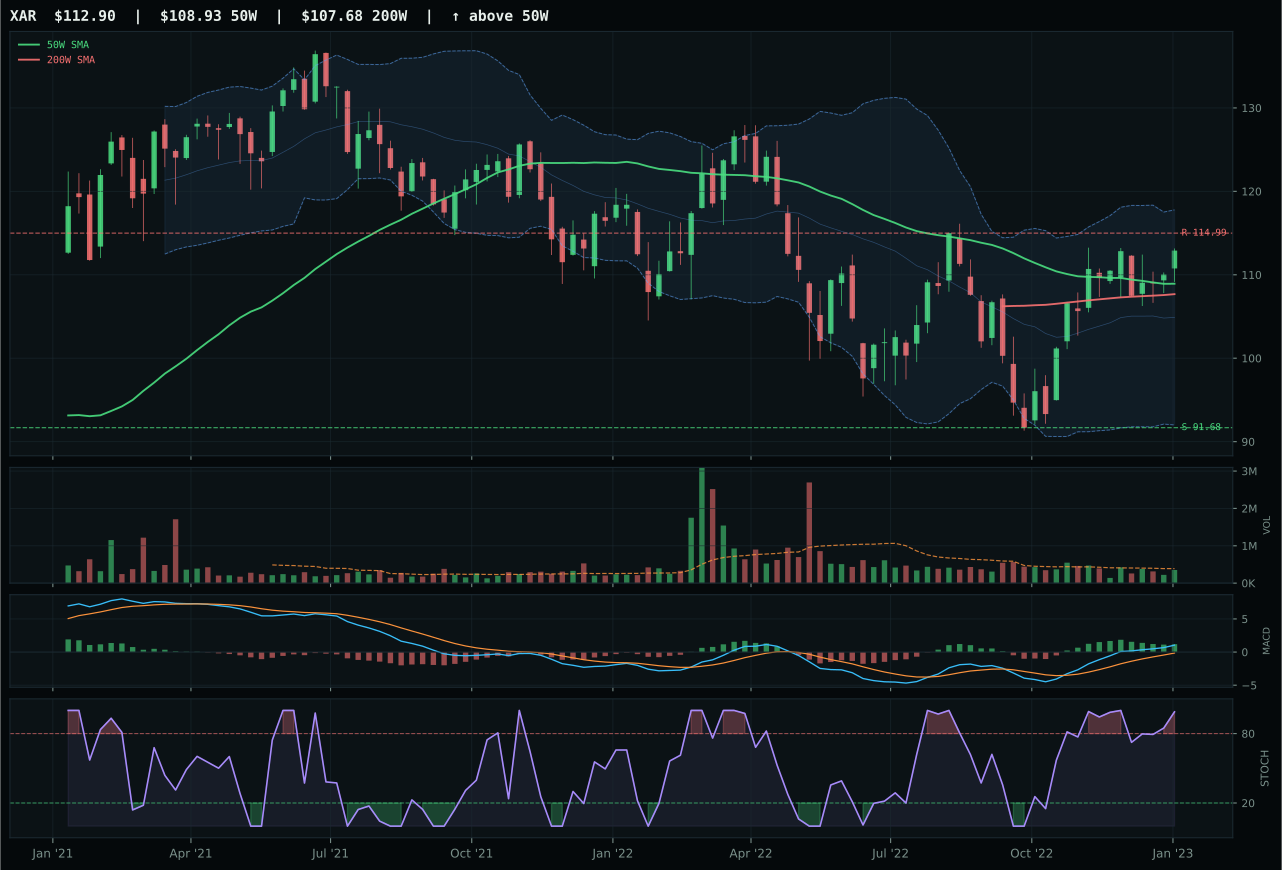
XAR has a neutral structure profile with 10.6% 13-week relative strength versus SPY.
A failed hold above support would weaken the setup.
Actionable but governed by invalidation levels.
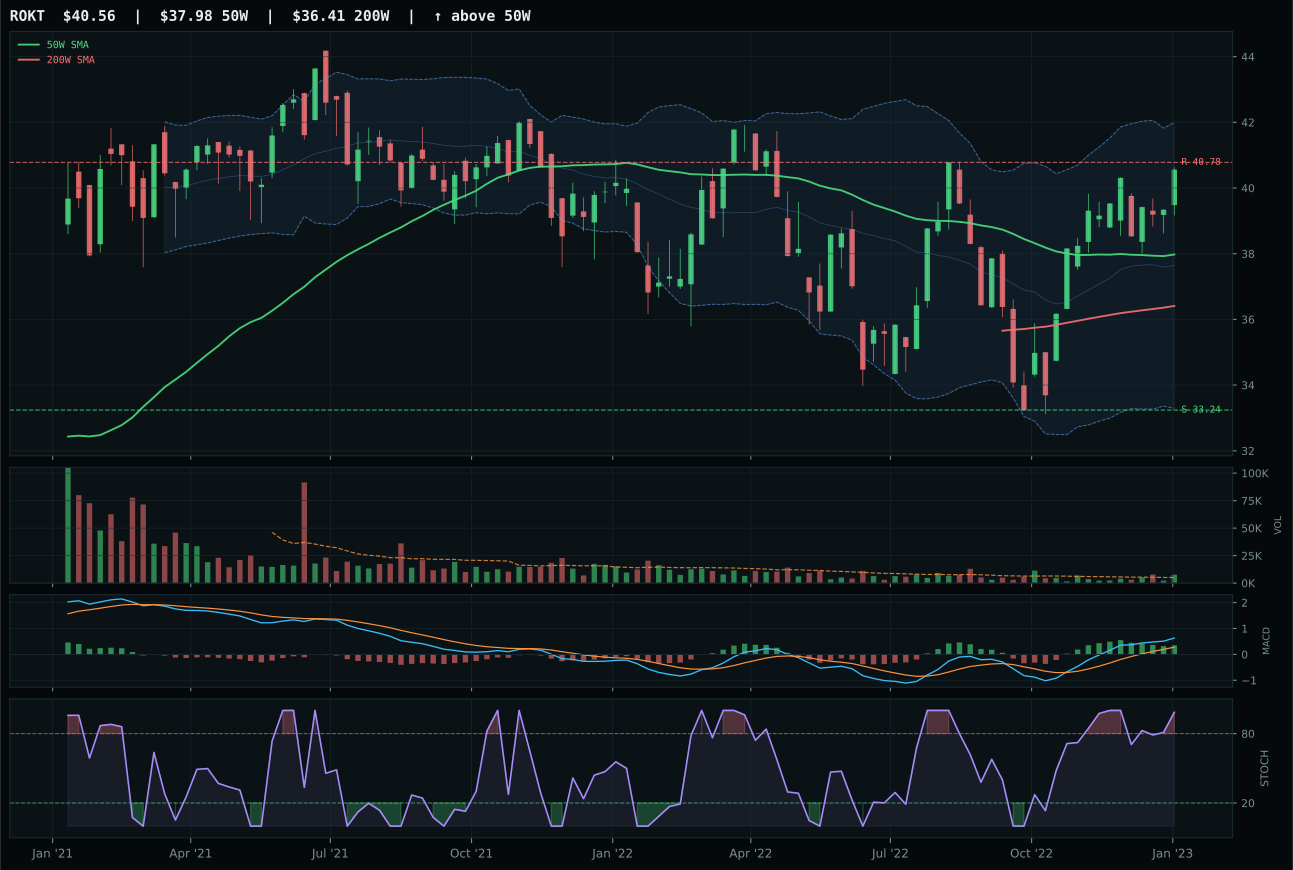
ROKT has a neutral structure profile with 9.0% 13-week relative strength versus SPY.
A failed hold above support would weaken the setup.
Tracked, but not top-2 eligible because: .
XAR won the 20% allocation slot by delivering the cleanest risk-reward asymmetry in a category where both winners were already highly extended. The 92.0 timing score towers above ITA's 70.0 because XAR sits only 3.6% above the 50W versus ITA's 9.0%, preserving upside buffer against mean reversion while maintaining Fibonacci placement in the middle decision zone. ITA's absolute thirteen-week return of 19.4% and 12.4% SPY relative strength both exceed XAR's, but they come wrapped in structural exhaustion—ITA is stretched into the 52-week high territory with reduced expansion room. XAR's volume-price confirmation at 76.8 and persistence at 73.4 reflect accumulation with less crowding risk. The 54.4 risk-reward score versus ITA's 37.3 means XAR offers 23.1% downside cushion to support while ITA has already surrendered buffer. This is leadership through reserve, not outperformance.
Defense & Aerospace earned top-2 status at 70.0 because it captured the portfolio's strongest macro fit at 71.0—defensive rotation is active (+8), broad market bear bias (+6) supports downside hedging, and Late-Cycle Reflation itself helps this exposure (+6). The reasoned ETF proof order ranked ITA technically superior at 78.8, yet the category representative switched to XAR at 74.0 because timing and risk-reward constraints mattered more in a stretched market environment. XAR's neutral volume and perfect centering on the 50W mean fresh money can load without fighting existing enthusiasm. At twenty percent, this category provides both crisis insurance—defensive rotation will persist if equity stress emerges—and real return leverage if inflation remains sticky. The 17.5% thirteen-week return and 10.6% SPY relative strength confirm the trade is working; the allocation size reflects confidence that the structural setup can sustain allocation even as technicals mature.
Industrial Metals — COPX
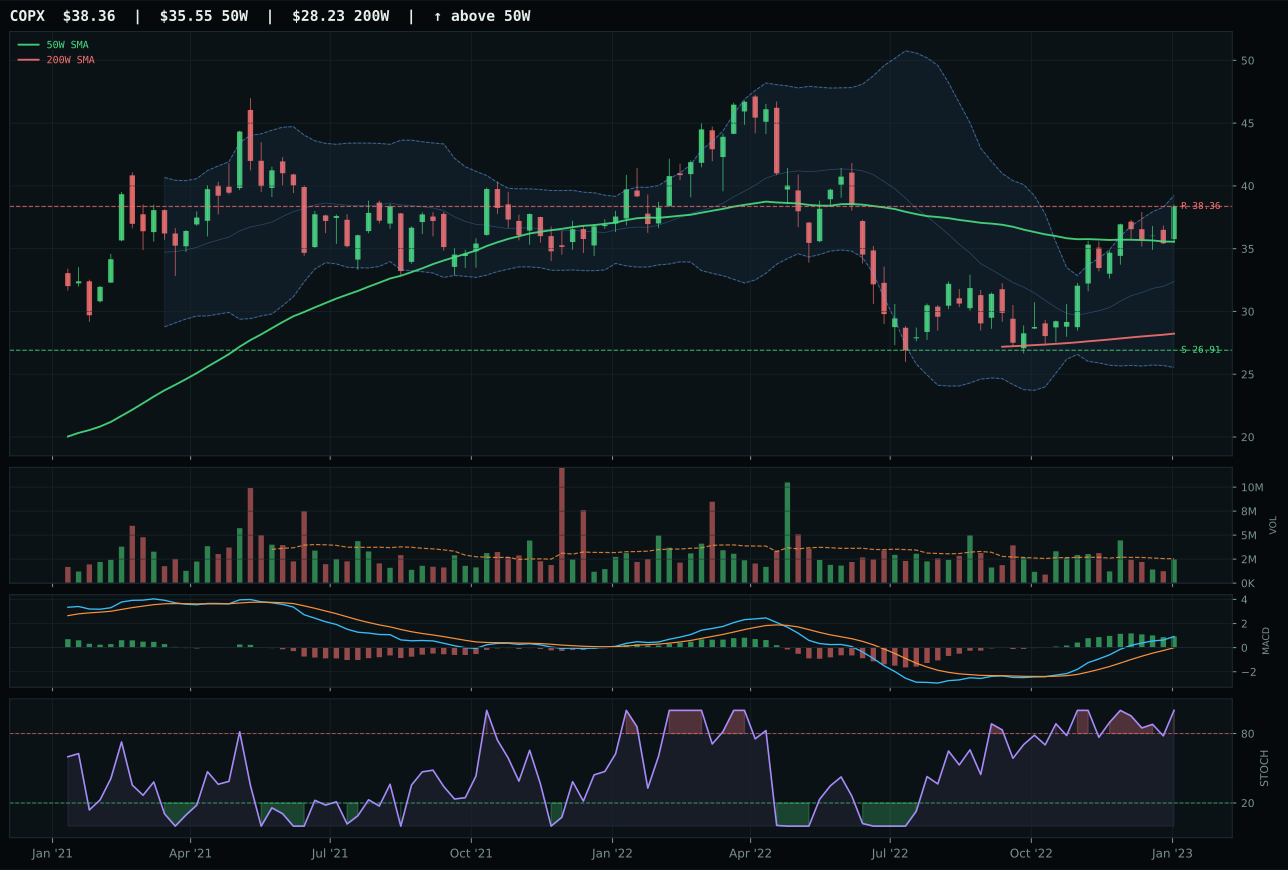
COPX has a neutral structure profile with 26.4% 13-week relative strength versus SPY.
A failed hold above support would weaken the setup.
Actionable but governed by invalidation levels.
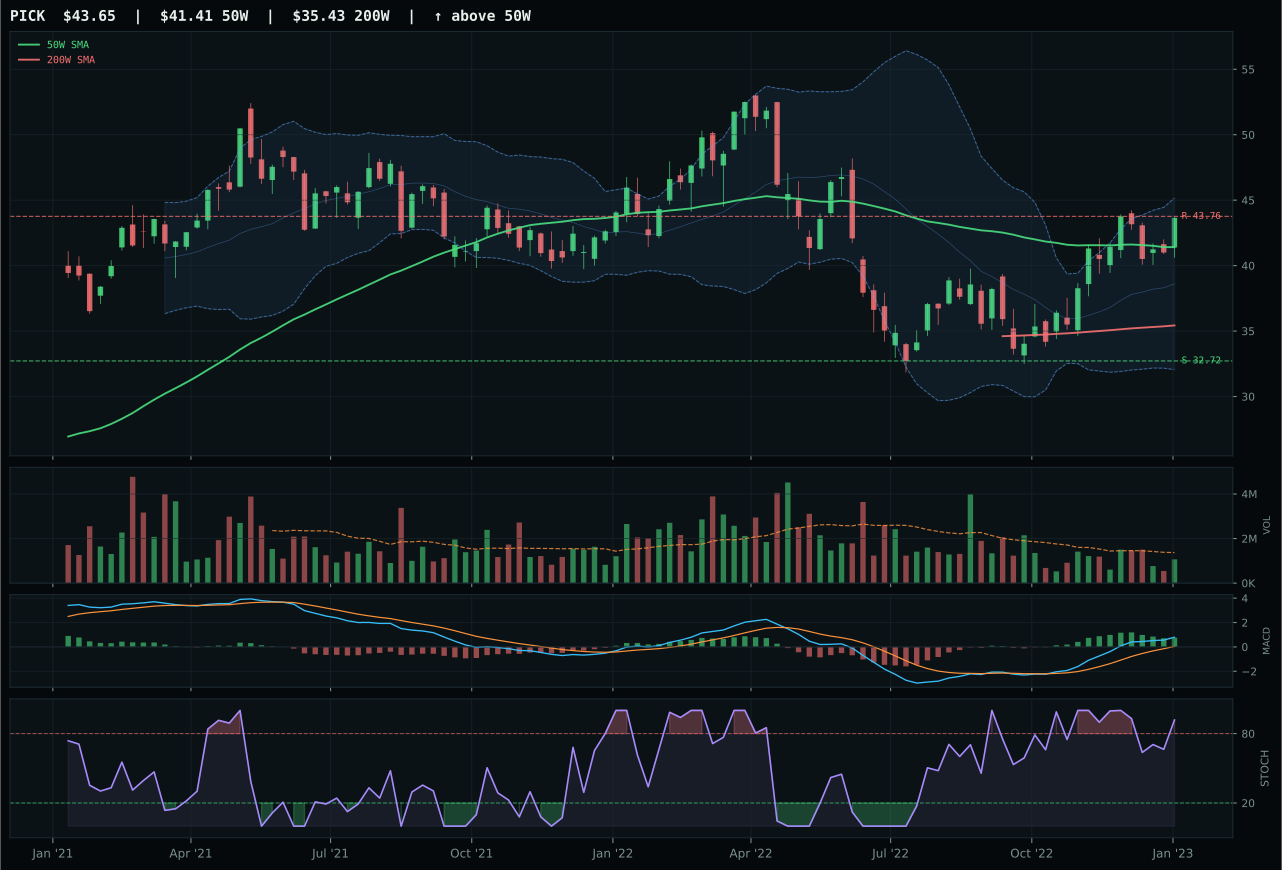
PICK has a neutral structure profile with 16.5% 13-week relative strength versus SPY.
A failed hold above support would weaken the setup.
Actionable but governed by invalidation levels.
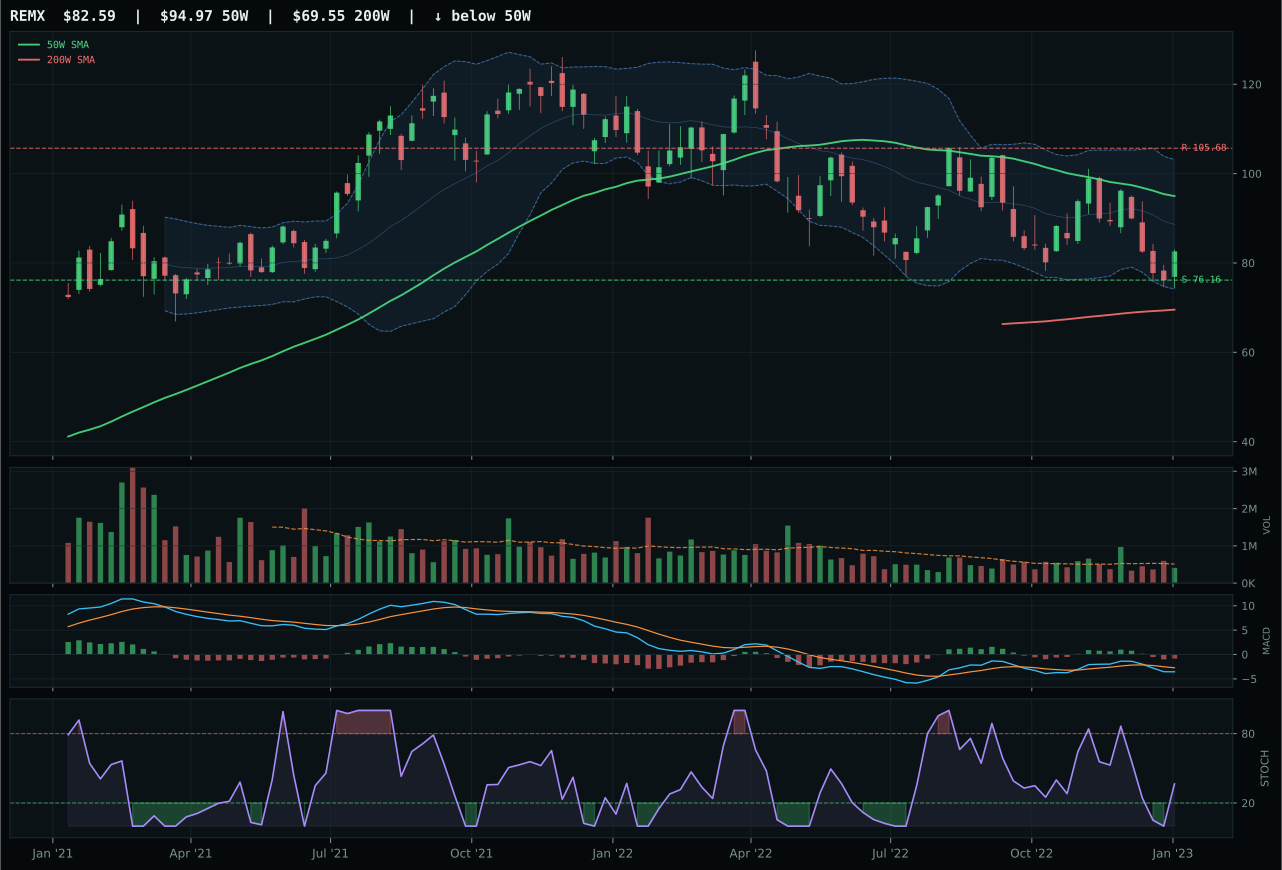
REMX has a neutral structure profile with -8.5% 13-week relative strength versus SPY.
A failed hold above support would weaken the setup.
Actionable but governed by invalidation levels.
COPX triumphed over PICK by an margin of 0.4 points in technical evidence, translating a 26.4% SPY relative strength advantage into the category leadership position. Both ETFs share identical structure—neutral, MACD bullish but flattening, stochastic RSI overbought—yet COPX's 9.9% category-relative strength versus PICK's 0.0% reflects genuine selective leadership within metals scarcity. COPX's 33.4% thirteen-week return and perfect 100.0 momentum confirmation score prove capital rotation is flowing toward copper specifically, where supply shortages and industrial demand are binding tighter than in broad mining. Risk-reward slightly favors COPX at 56.4 versus 53.1, and persistence at 95.6 versus PICK's lower reading means the move is accumulating rather than merely bouncing. Volume at 0.98x average is neutral for both, but COPX's price action—sitting 7.9% above the 50W with upside resistance just 0.0% away—creates tactical pressure that forces holders to prove conviction or step aside.
Industrial Metals claimed 10% based on a 67.1 final score driven by the portfolio's second-highest macro fit at 75.0, where metals scarcity (+14), commodity breadth positive (+10), and late-cycle reflation itself (+10) align perfectly. COPX's 88.0 technical evidence ranks among the strongest in the entire portfolio, powered by 26.4% relative strength and 33.4% momentum. The allocation size reflects that copper is no longer a cyclical bet; it's becoming a supply-constraint story where industrial demand for power grids, EV infrastructure, and AI compute clusters will force prices higher regardless of economic growth rates. COPX's positioning 7.9% above the 50W is extended but not broken, and resistance near current levels at 38.36 will test conviction within weeks. The thirteen-week return of 33.4% with neutral volume means smart money loaded before the crowd; allocating 10% here is a bet that industrial metals remain the portfolio's only uncontroversial growth story in a late-cycle reflation environment where bonds are untrustworthy and equities are rolling over.
Utilities & Infrastructure — IGF
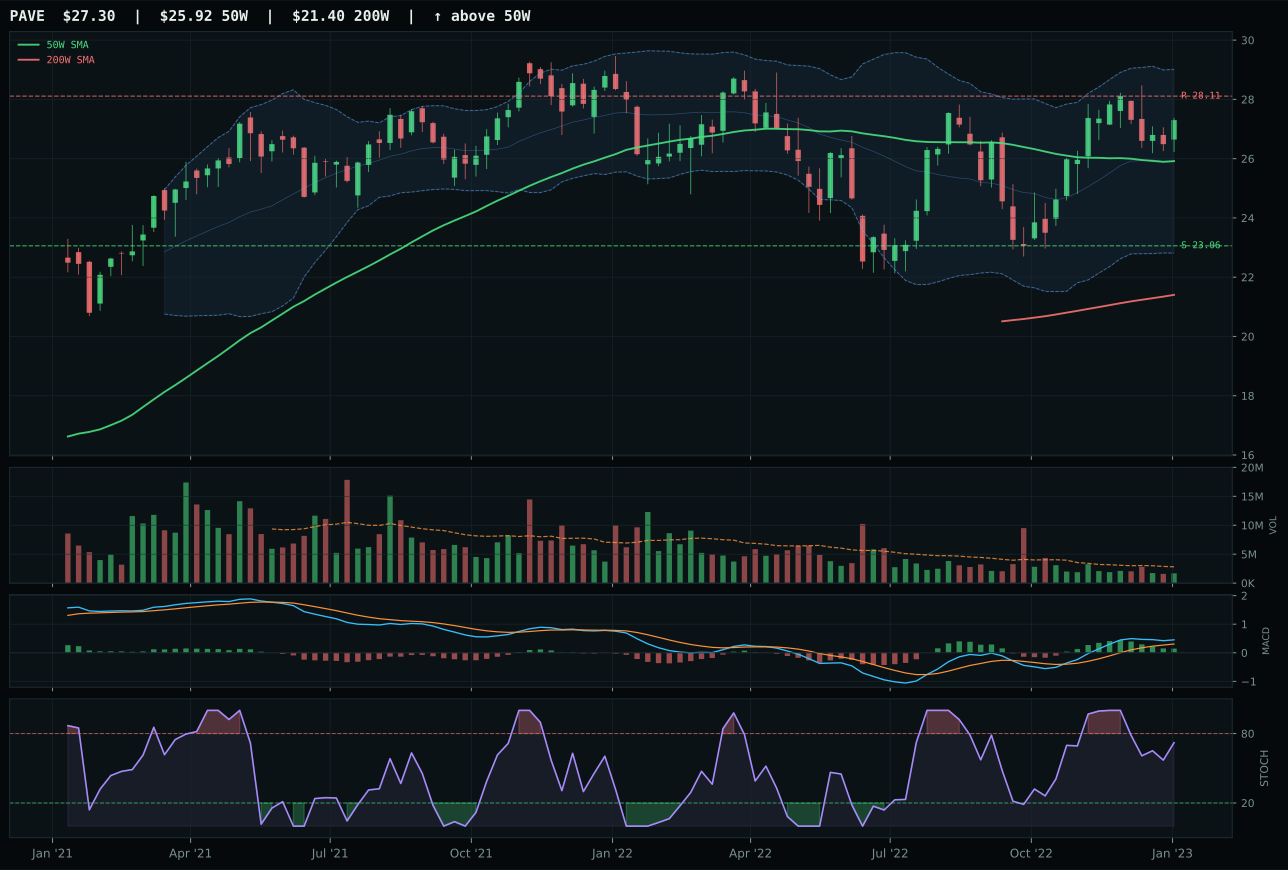
PAVE has a neutral structure profile with 7.5% 13-week relative strength versus SPY.
A failed hold above support would weaken the setup.
Actionable but governed by invalidation levels.
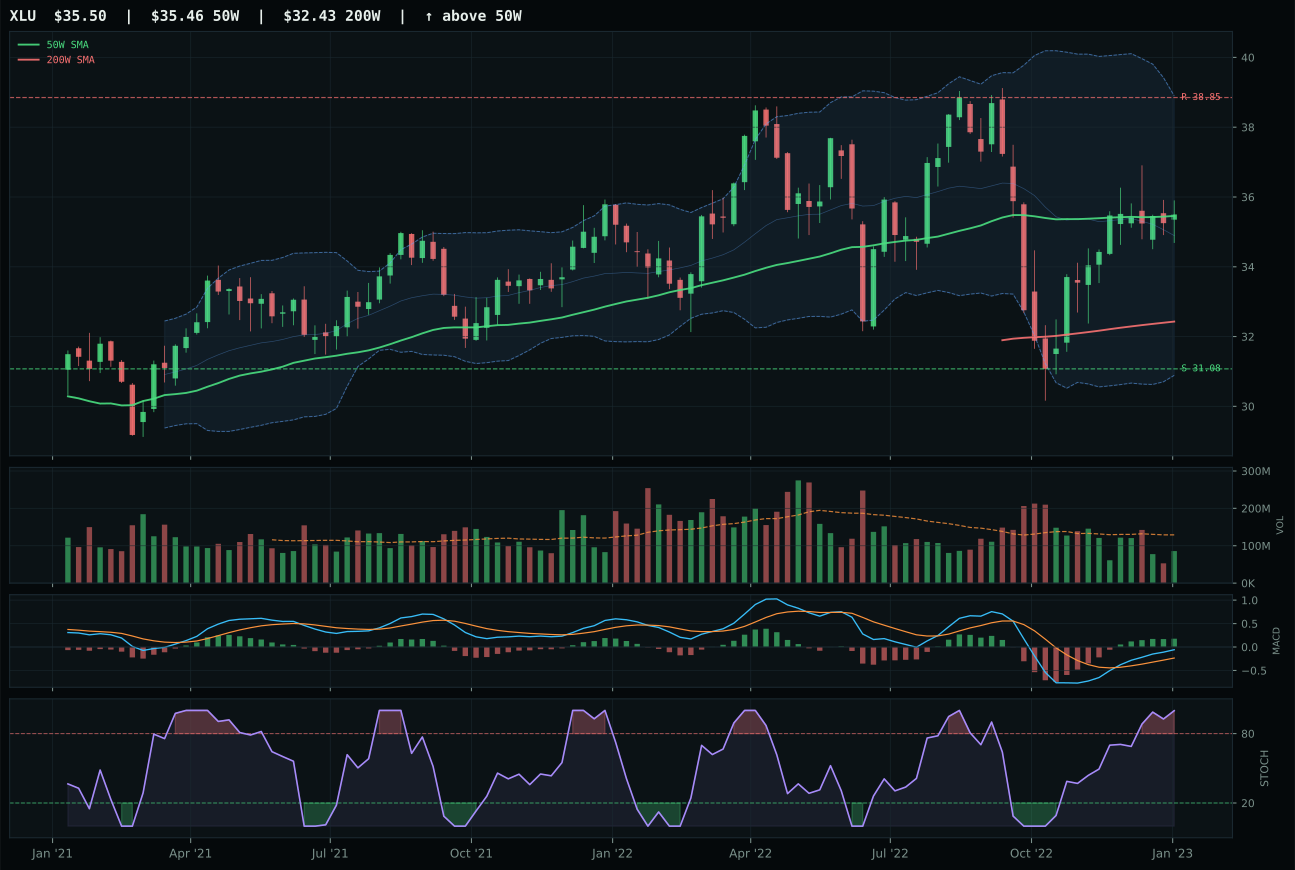
XLU has a compression near 50W profile with 4.4% 13-week relative strength versus SPY.
A failed hold above support would weaken the setup.
Actionable but governed by invalidation levels.
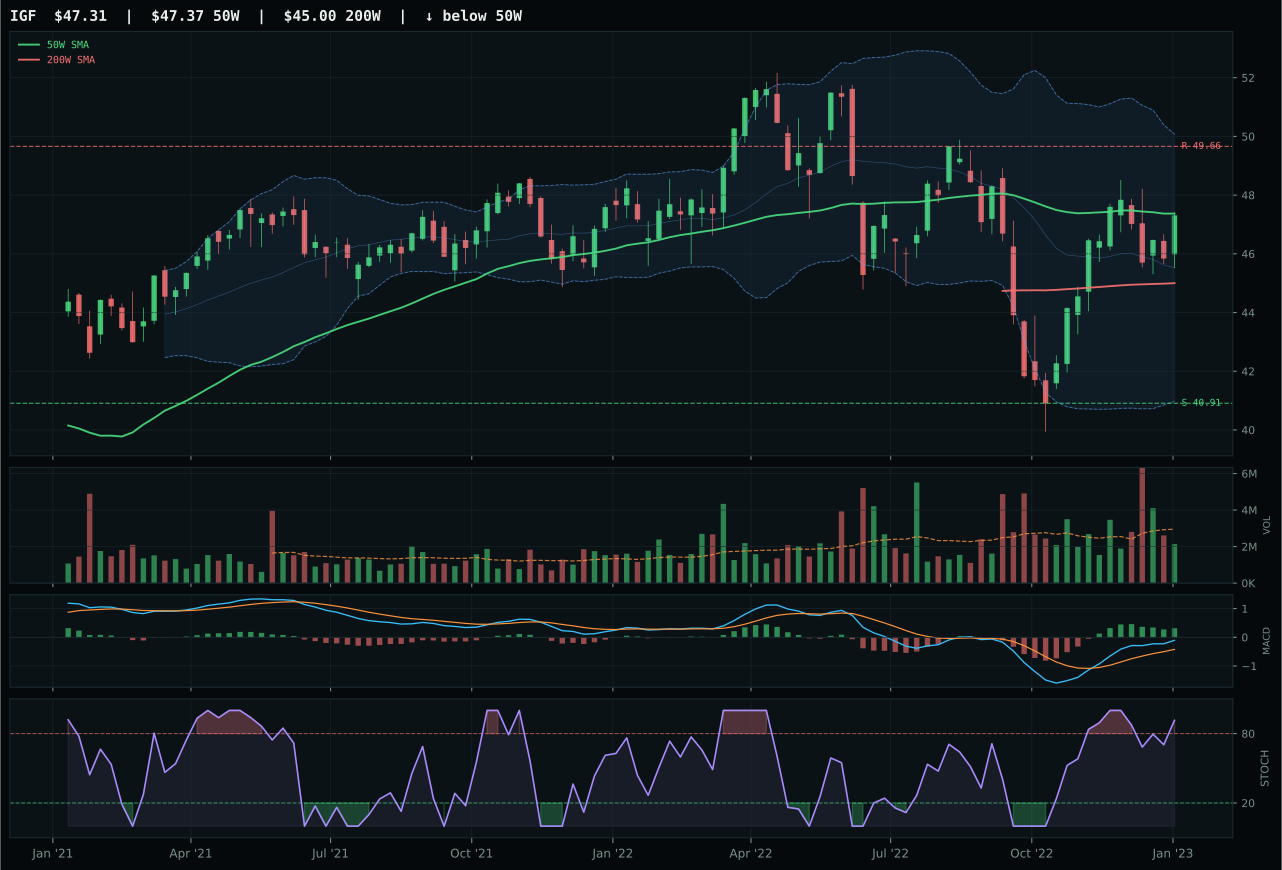
IGF has a compression near 50W profile with 6.5% 13-week relative strength versus SPY.
A failed hold above support would weaken the setup.
Actionable but governed by invalidation levels.
IGF claimed the category with a clean timing-and-structure victory over PAVE despite ranking third in the reasoned ETF proof order behind XLU at 74.5 and PAVE at 70.7. The category representative skipped to IGF at 68.1 because XLU and PAVE both faced timing and structure penalties; IGF's 100.0 timing score—distance to the 50W at -0.1% is mathematically perfect—creates the precise entry zone that PAVE's 5.3% stretch and XLU's higher extensions cannot match. IGF's compression near the 50W structure at 75.2 offers expansion potential if volume lifts; both PAVE and XLU are already extended, reducing room for participation. PAVE's thirteen-week return of 14.5% and 7.5% relative strength exceed IGF's, yet they were captured at higher prices; IGF's 13.5% return from a lower entry point creates superior risk-adjusted returns forward. Volume at 0.72x signals neither enthusiasm nor collapse, giving fresh capital a clean entry without fighting crowded longs.
Utilities & Infrastructure earned 10% despite a 66.8 score reflecting its rank as a second-order allocation; the 61.0 macro fit is anchored by defensive rotation at +12, broad market bear support at +4, and late-cycle reflation mixed signal. The category is not a portfolio strength but rather a placeholder for risk management—with stocks rolling over and bonds punishing carry, utilities and infrastructure offer defensive income with inflation-linked pricing power. IGF's global infrastructure positioning and 13.5% thirteen-week return despite sitting centered on the 50W signal that this exposure is accumulating under the radar. The category's allocation reflects that whenever equity drawdowns accelerate, utilities and infrastructure become the clearing price for rotating capital out of growth. At ten percent, it's sized large enough to cushion portfolio volatility without being so large that it becomes an opportunity cost in a risk-off environment. XLU's higher composite scores and PAVE's stronger momentum confirm this category could expand if equity stress deepens, making the 10% both a minimum hedge and a growth option if conditions warrant.
Agriculture & Livestock — WEAT
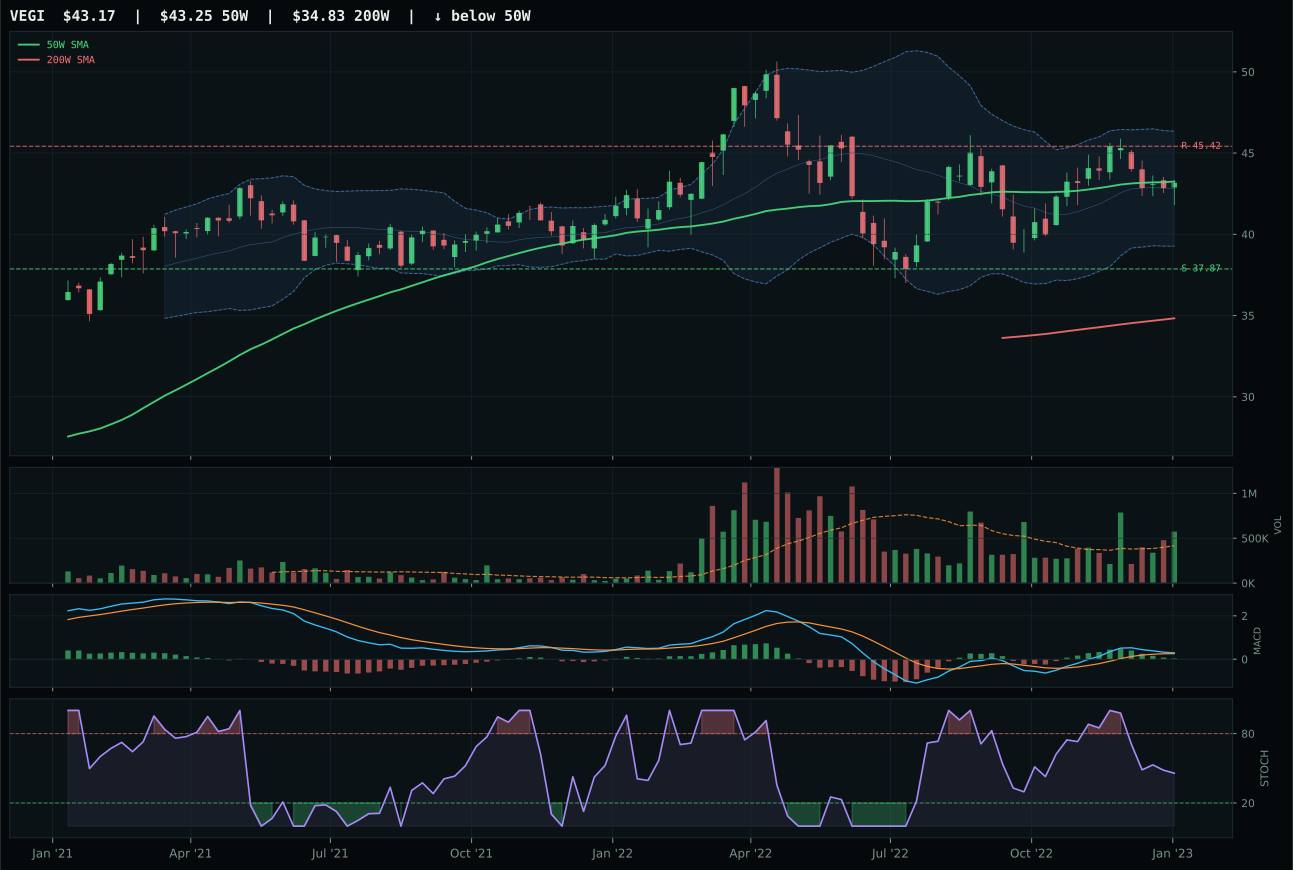
VEGI has a compression near 50W profile with -1.0% 13-week relative strength versus SPY.
A failed hold above support would weaken the setup.
Actionable but governed by invalidation levels.
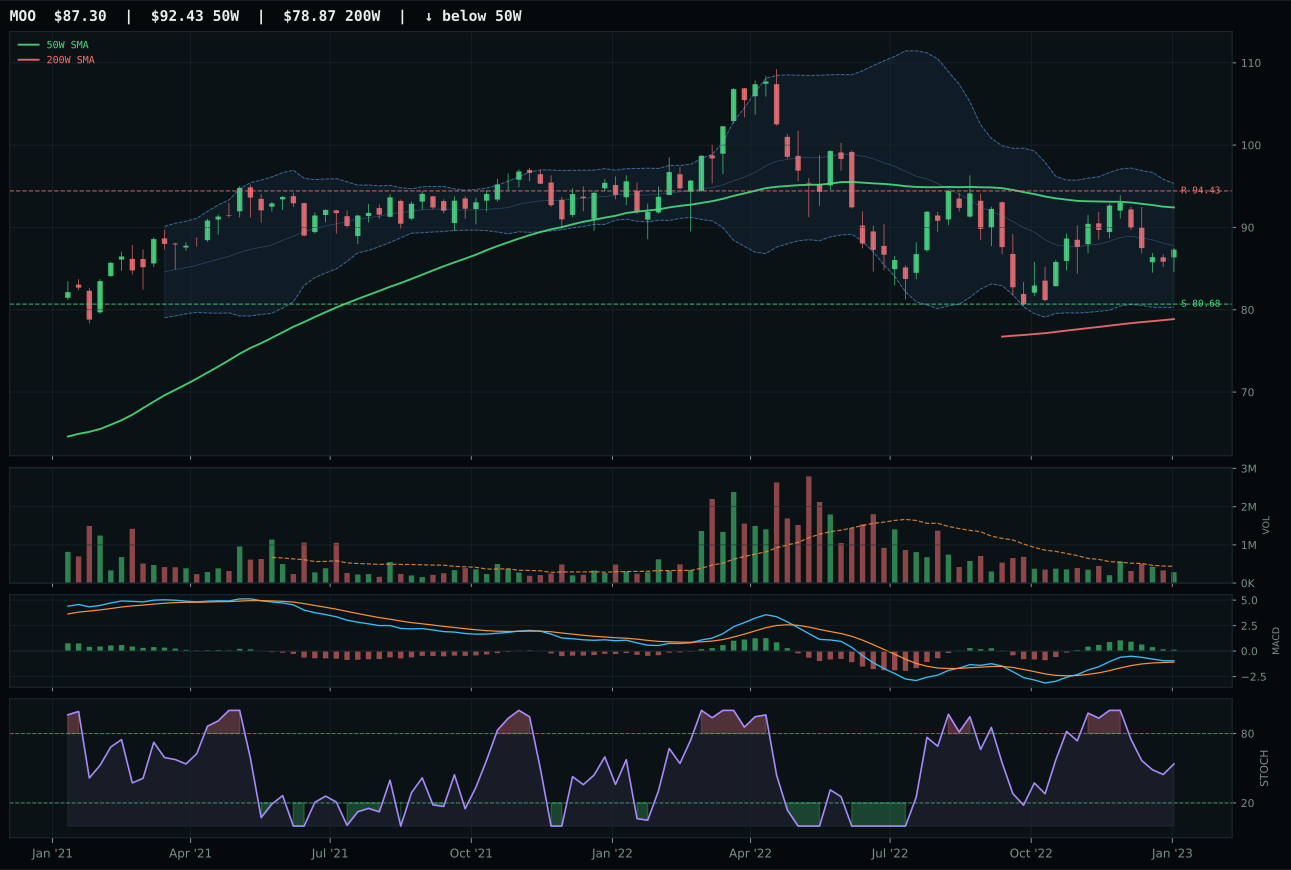
MOO has a neutral structure profile with -1.7% 13-week relative strength versus SPY.
A failed hold above support would weaken the setup.
Actionable but governed by invalidation levels.
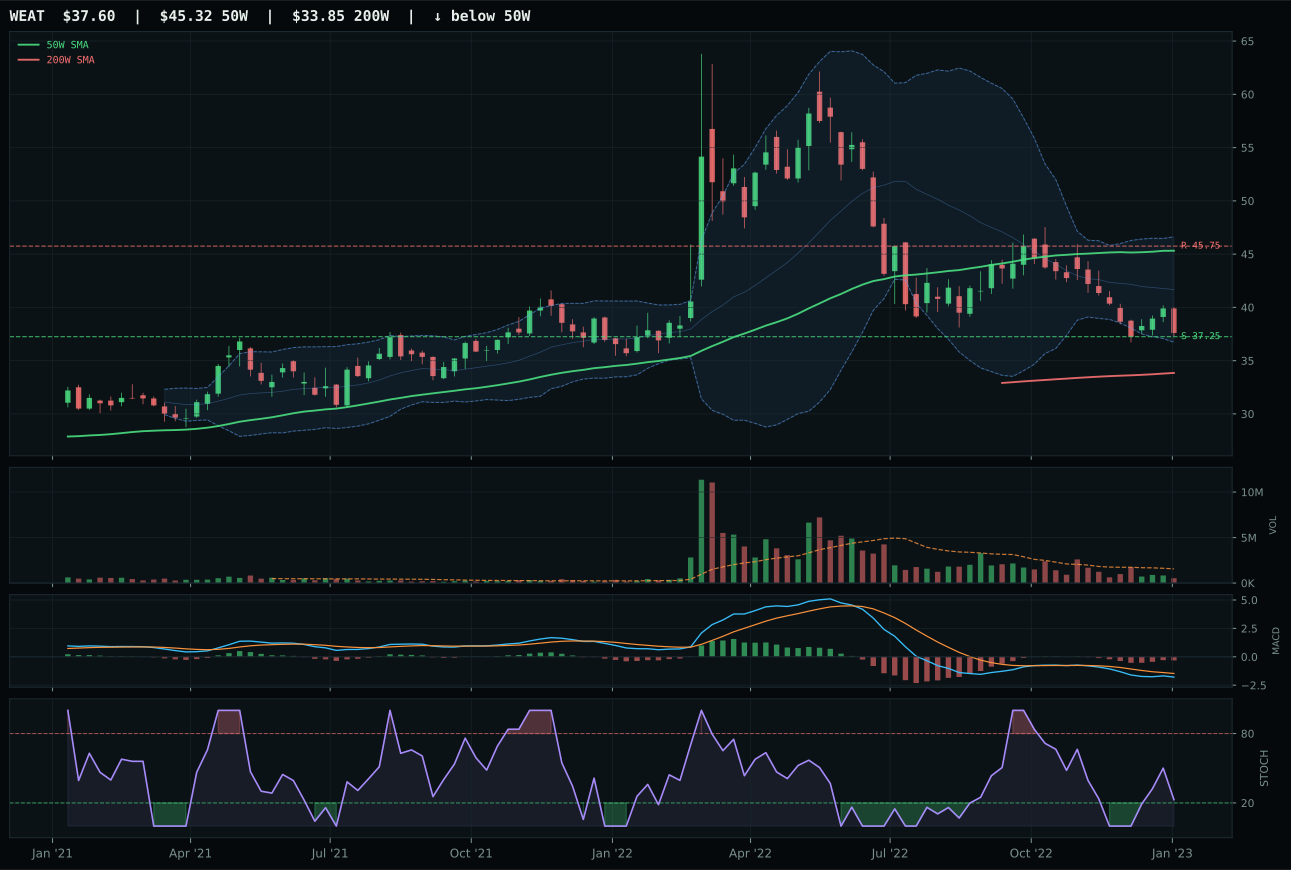
WEAT has a pullback into support profile with -22.7% 13-week relative strength versus SPY.
A failed hold above support would weaken the setup.
Actionable but governed by invalidation levels.
WEAT won despite carrying a 0.0 momentum confirmation score because its setup offered the only defined entry point in a category where macro sponsorship—supply shortage at +13 and inflation pressure at +10—is being smothered by poor technicals. VEGI ranked higher at 73.7 in the reasoned ETF proof order and offers cleaner MACD and compression-zone setup, yet WEAT's risk-reward of 90.0 versus VEGI's 59.4 reflects WEAT's proximity to support at 37.25 with only 0.9% downside risk. WEAT's stochastic RSI rising into mid-zone at 0.23 is a contrarian tell in oversold conditions—a signal VEGI's falling-neutral at 0.67 cannot match. The chart is punishing agriculture with -15.7% thirteen-week returns and -22.7% relative weakness, creating the exact capitulation environment where category-relative strength flips positive once buyers step in. WEAT's thin 0.35x volume confirms the punishment is nearly complete.
Agriculture earned 10% because its 90.0 macro fit—the highest among all categories—demands allocation despite the representative ETF carrying only 15.5 technical evidence. Supply shortage (+13), inflation pressure (+10), and real asset sponsorship (+8) are structural tailwinds that will outlast the current chart damage. The 54.3 final score reflects category-reasoner skepticism: VEGI's 73.7 and MOO's 64.4 ranked above WEAT's 32.4, yet macro descriptors override pure technical weakness in a late-cycle reflation environment. WEAT's -22.7% SPY relative weakness and -17.0% distance to the 50W are precisely the conditions that precede sharp reversals once supply constraints bind more visibly. This allocation is a thesis bet on macro resilience; the technicals will punish patience for another week or two, but the category's allocation size reflects conviction that commodity inflation and real asset demand will force portfolio rotations. Without this category's macro tailwind, the portfolio would be pure momentum-chasing in equities and metals.
Traditional Energy — XLE
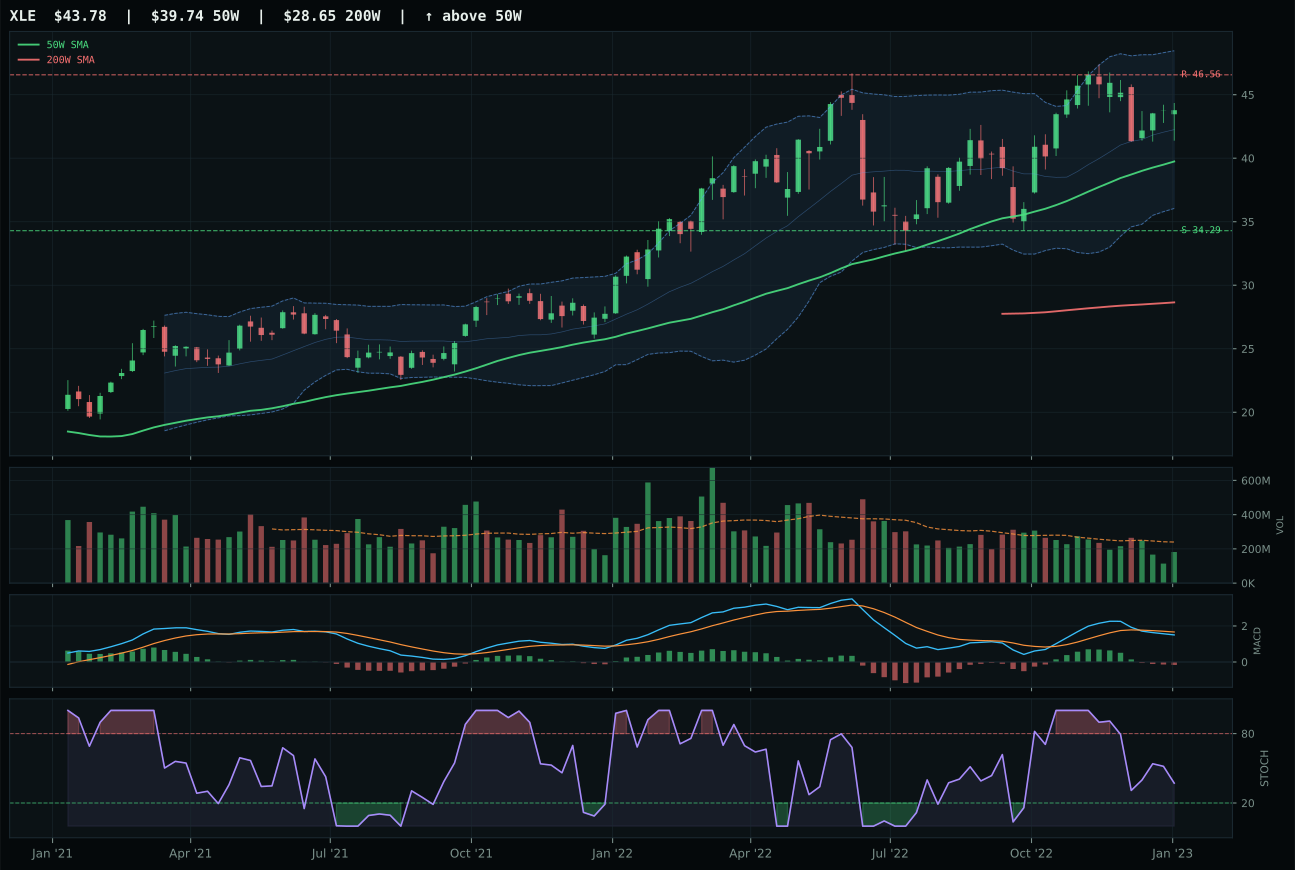
XLE has a neutral structure profile with 0.1% 13-week relative strength versus SPY.
A failed hold above support would weaken the setup.
Actionable but governed by invalidation levels.
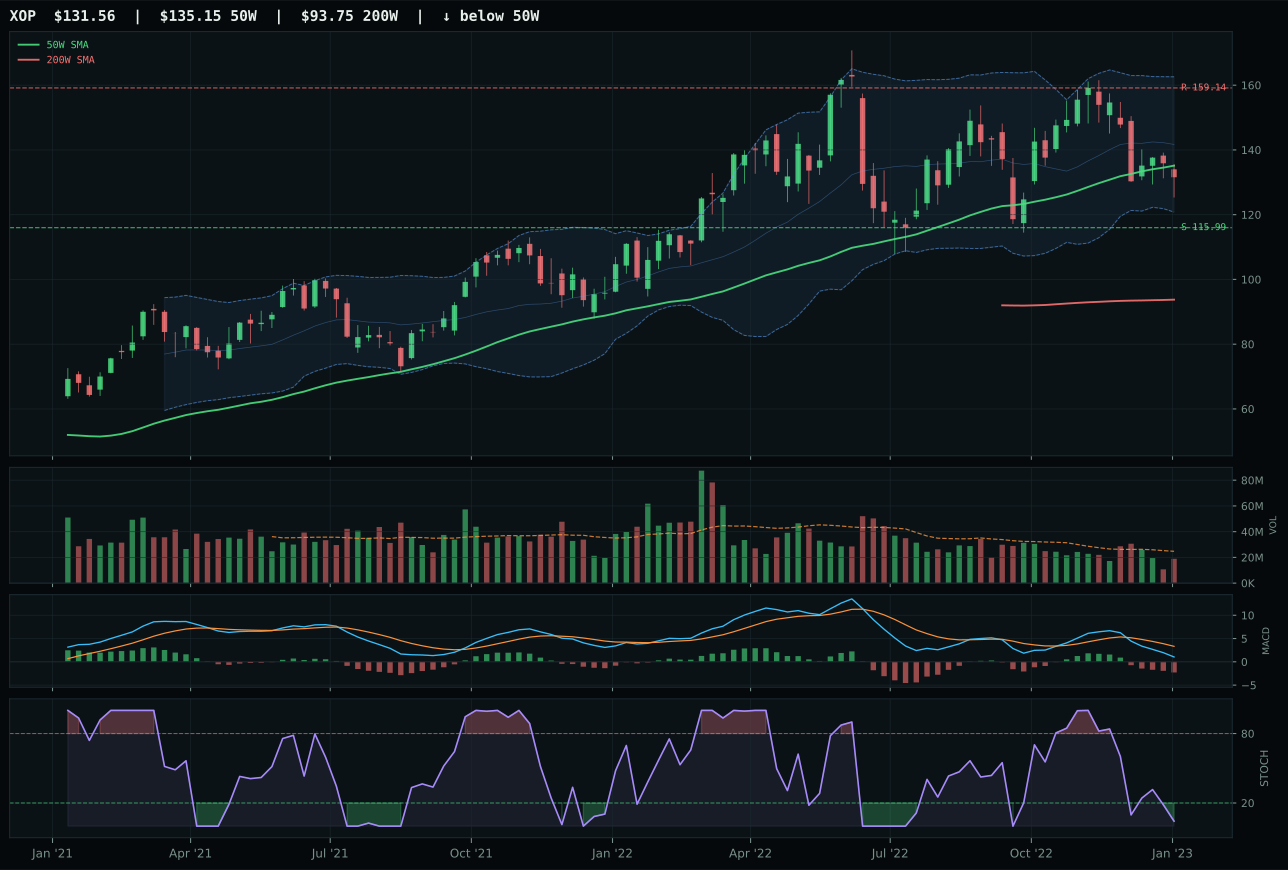
XOP has a compression near 50W profile with -14.7% 13-week relative strength versus SPY.
A failed hold above support would weaken the setup.
Actionable but governed by invalidation levels.
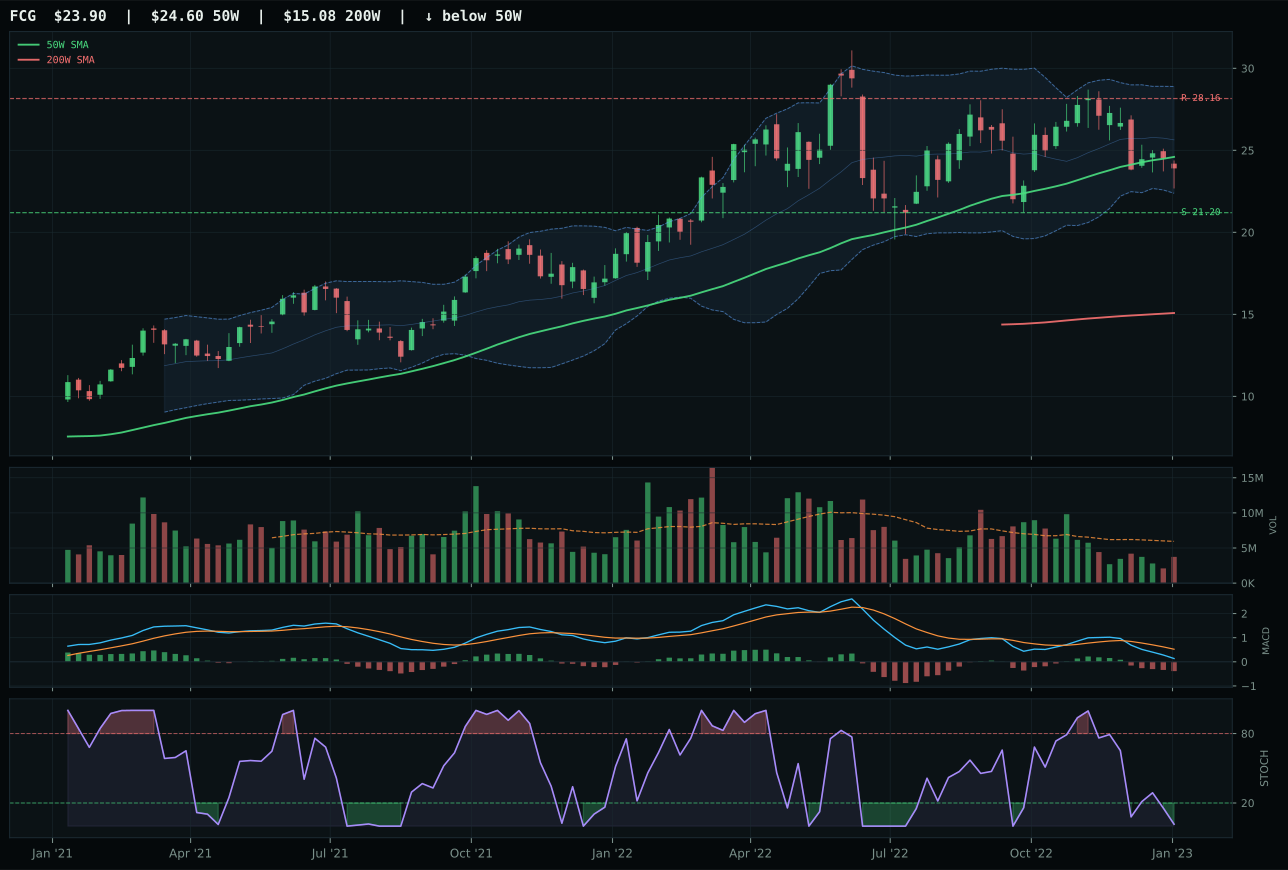
FCG has a compression near 50W profile with -14.9% 13-week relative strength versus SPY.
A failed hold above support would weaken the setup.
Actionable but governed by invalidation levels.
XLE defeated XOP by establishing superior structure and category-relative strength despite trading below the 50W in both cases. XLE's 76.4 structure score reflects a cleaner Fibonacci setup in the upper retracement zone, while XOP's compression near the 50W lacks definition and sits structurally broken. Category-relative strength of 14.8% for XLE versus 0.0% for XOP tells the story—integrated energy (XLE) is being accumulated while exploration beta (XOP) is being liquidated. XLE's 82.1 trend score and strong 75.2 momentum confirmation, despite MACD bearish/weakening, signal that buyers are defending price despite negative momentum signals. Volume at 0.76x is neutral for XLE but confirms the move lacks speculative excess. XOP's oversold stochastic RSI reading might attract contrarians, yet it signals capitulation rather than opportunity when paired with compression near the 50W and deteriorating volume.
Traditional Energy earned 10% allocation based on a 90.0 macro fit—the second-strongest in the portfolio after Agriculture—where energy scarcity (+16), late-cycle reflation (+12), inflation pressure (+10), and supply shortage (+9) create a structural bid that overwhelms XLE's weakening MACD and falling stochastic RSI. Energy is the portfolio's third hedge after gold and defense; it owns both real-asset inflation protection and supply-shortage leverage. XLE's positioning is defensive—integrated balance sheets, cash flow, dividends—which makes it more tactically sound than XOP's exploration beta in a regime where capital rationing is tightening. The 53.1 final score reflects category-reasoner skepticism of XLE's technical weakness, yet the macro fit of 86.0 for the representative overrides pessimism about near-term price action. At ten percent, energy is sized as a real-asset sleeve that will compound as inflation persists and supply constraints bite harder. The thirteen-week return of 7.0% with 0.1% SPY relative strength means the positioning is early relative to the narrative, not late.
Nuclear Energy — URNM
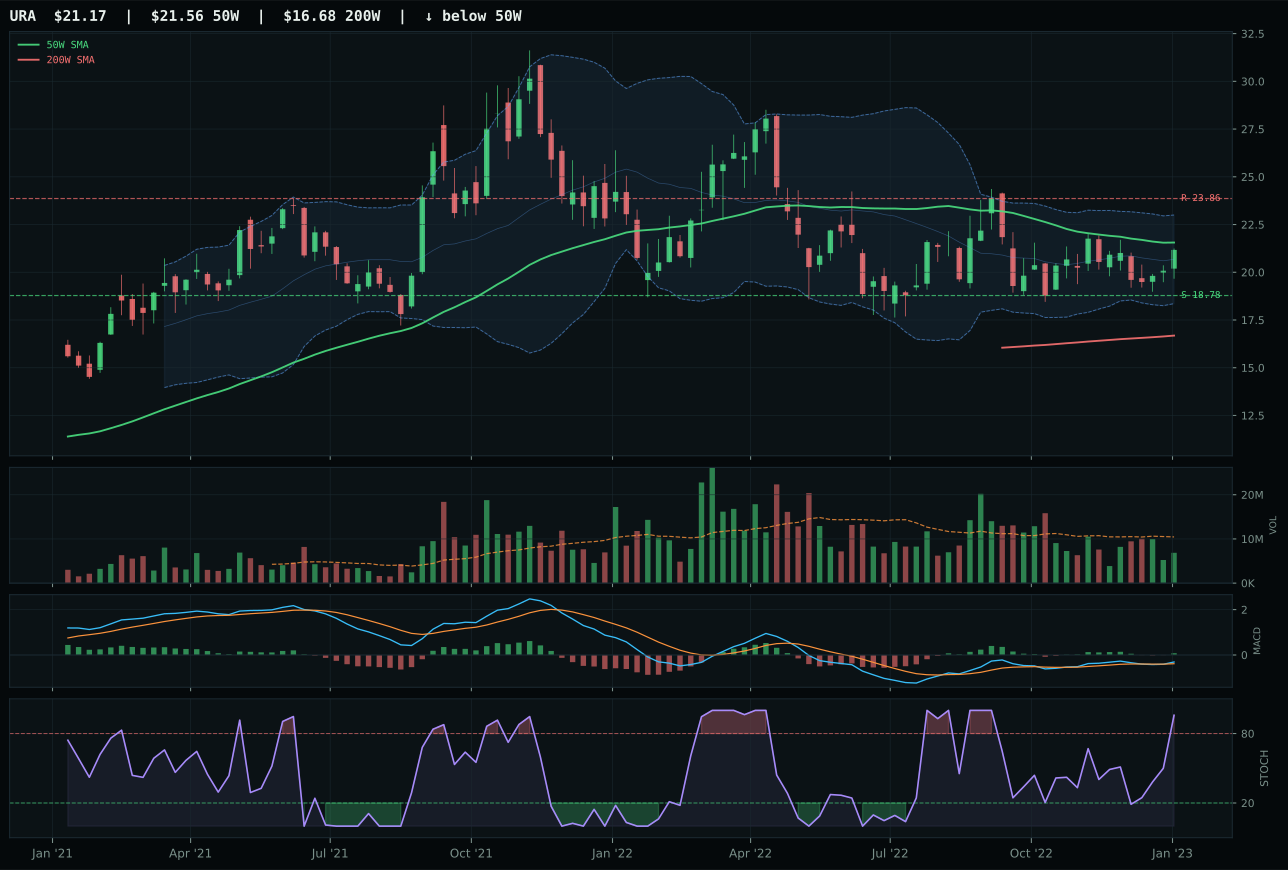
URA has a compression near 50W profile with -3.0% 13-week relative strength versus SPY.
A failed hold above support would weaken the setup.
Actionable but governed by invalidation levels.
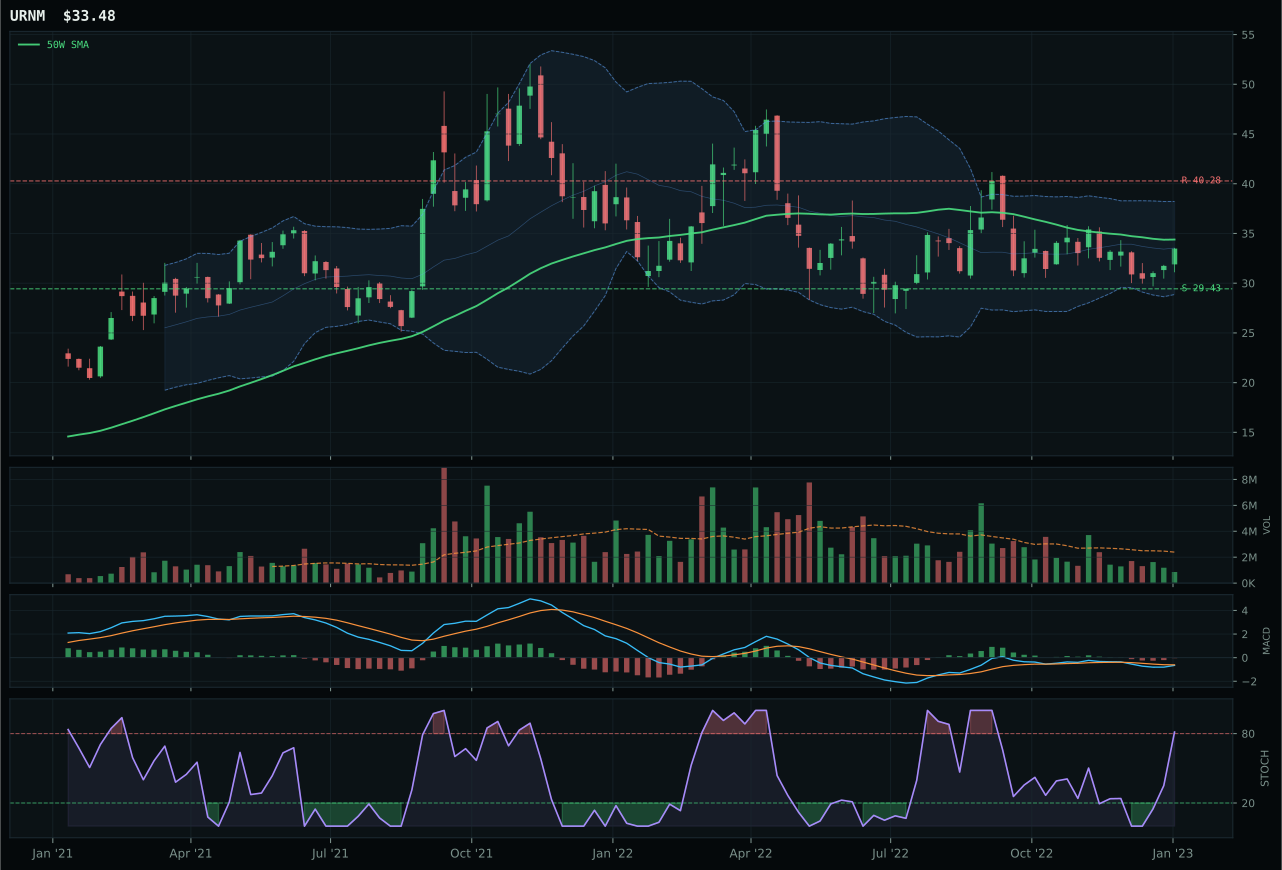
URNM has a compression near 50W profile with -6.9% 13-week relative strength versus SPY.
A failed hold above support would weaken the setup.
Actionable but governed by invalidation levels.
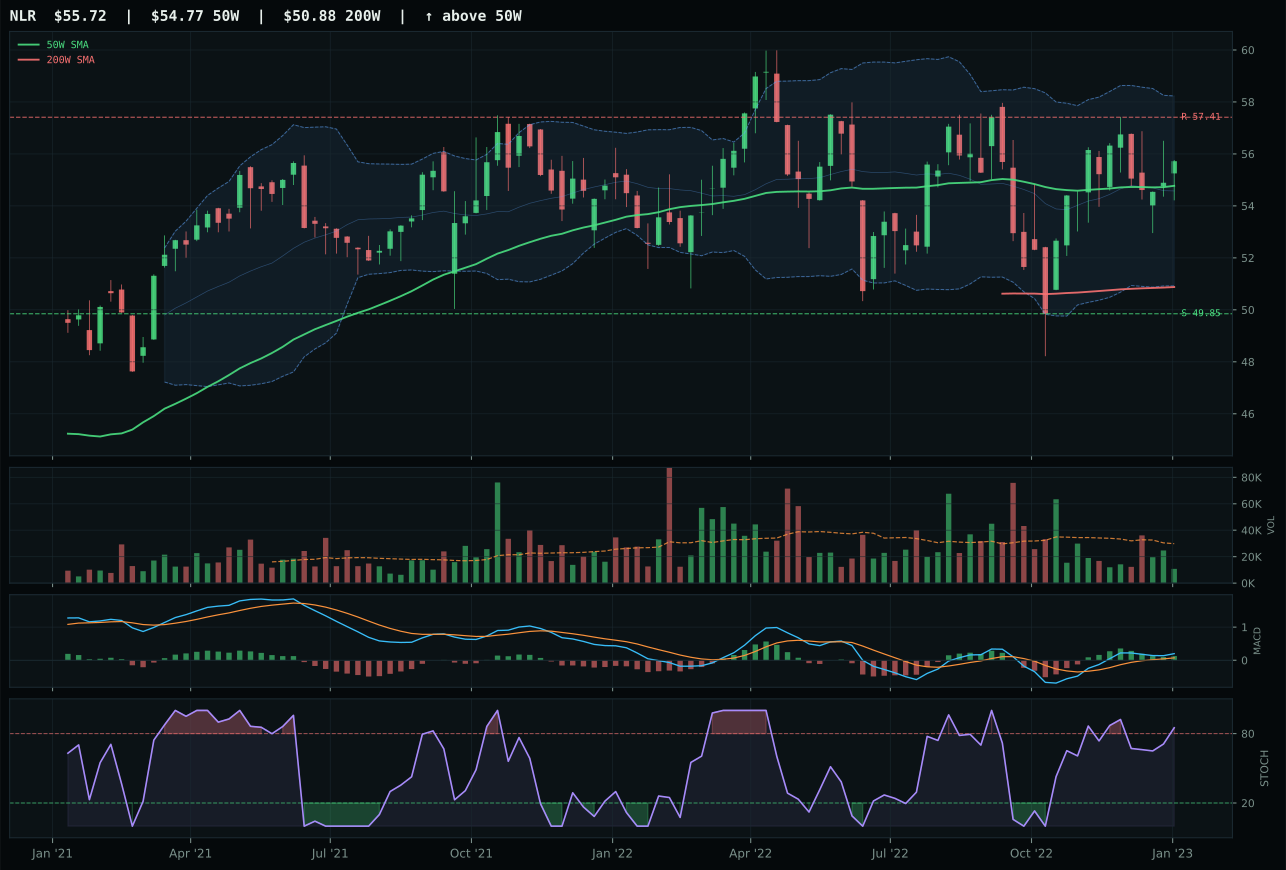
NLR has a compression near 50W profile with -0.5% 13-week relative strength versus SPY.
A failed hold above support would weaken the setup.
Tracked, but not top-2 eligible because: .
URNM edged URA despite technical evidence that favors URA at 63.5 versus URNM's 39.5, because URNM's 100.0 timing score and superior Fibonacci placement near the 0.618 retracement at 34.80 created a more defined entry zone. URA's bullish-and-improving MACD signal reads cleaner on the surface, yet URNM's bearish-but-improving setup reflects uranium mining exposure that has been punished into genuine oversold conditions, creating the compounding effect when demand signals emerge. URNM's compression near the 50W at -2.6% distance offers precise support definition that URA's compression cannot match. Both carry thin 0.36x and 0.64x volume participation respectively, confirming no fresh accumulation is visible yet; URNM's selection reflects the view that timing matters more than momentum signals in a purely macro-driven category where sentiment is at trough. The 0.1% thirteen-week return in URNM versus 3.9% in URA underscores that uranium miners have already capitulated harder—making URNM's recovery potential steeper.
Nuclear Energy's 10% allocation rests on a 69.0 macro fit where energy scarcity (+9), real asset sponsorship (+7), and late-cycle reflation (+7) build a structural case despite the representative ETF carrying only 47.8 in final score—the weakest winner in the portfolio. URNM's 39.5 technical evidence is genuinely poor; the -6.9% relative weakness to SPY and 0.1% thirteen-week return signal that capital is flowing away from uranium narratives. Yet the category holds because nuclear energy supply is structurally tight, AI compute demand is driving electricity requirements higher, and geopolitical energy constraints make nuclear pivotal to energy transition. This is pure thesis allocation; the technicals will require several weeks of volume accumulation and Fibonacci bounce confirmation before URNM's positioning looks attractive to momentum players. The allocation size reflects that nuclear is asymmetric to the downside (it can't go much lower) and tied to structural energy scarcity that won't resolve in 2023. Without this 10%, the portfolio would be pure commodity and metals heavy; nuclear energy adds thematic diversity to real-asset exposure.
Emerging Markets — INDA
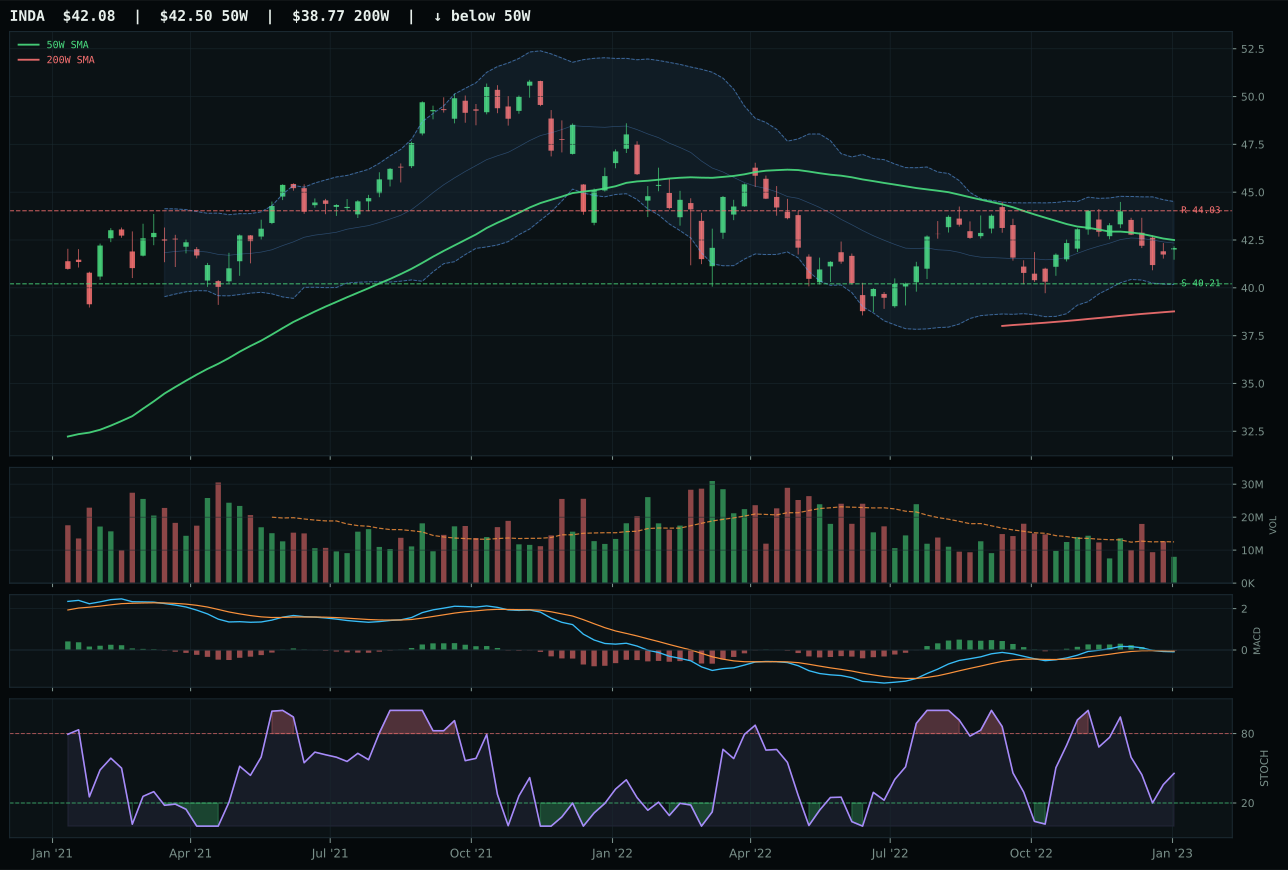
INDA has a pullback into support profile with -2.8% 13-week relative strength versus SPY.
A failed hold above support would weaken the setup.
Actionable but governed by invalidation levels.
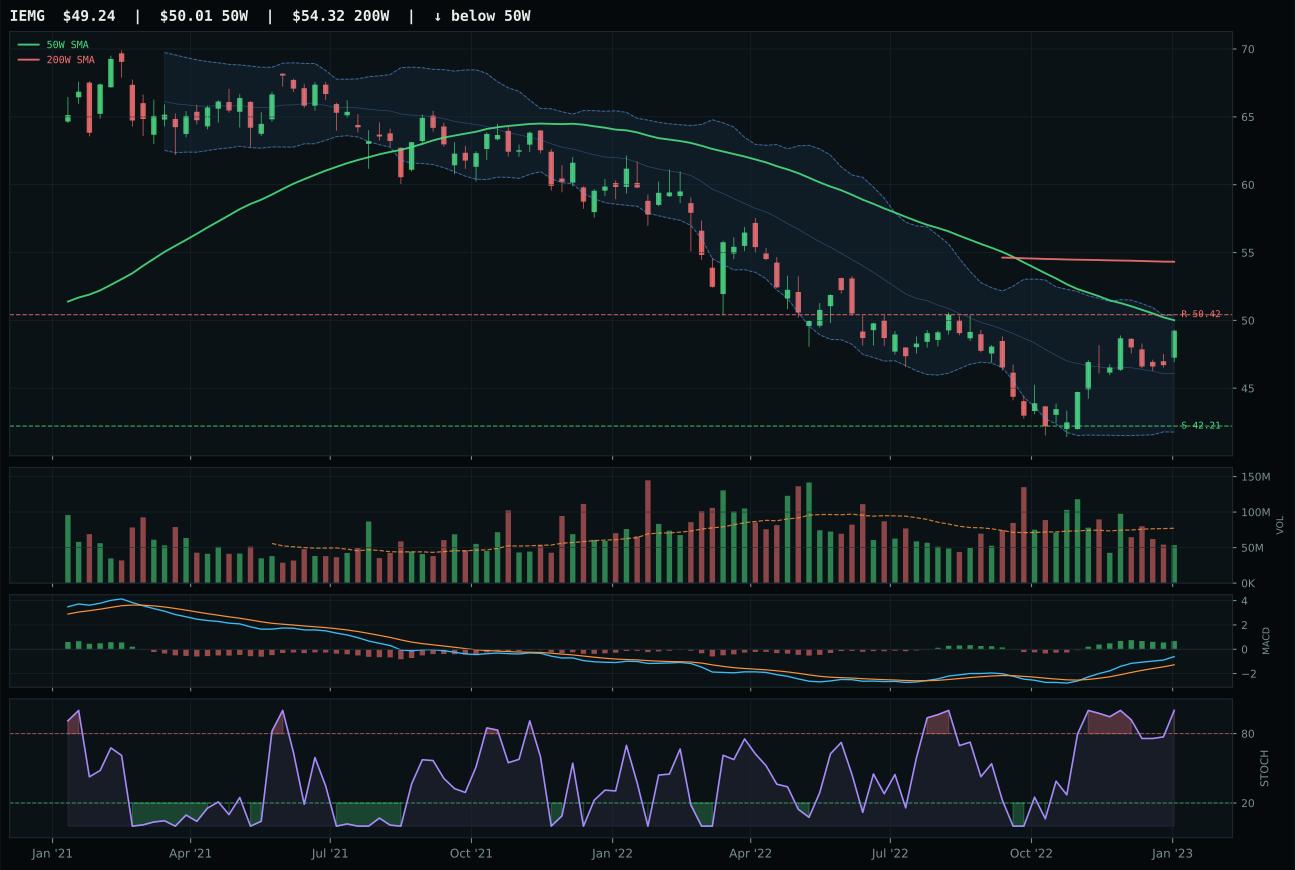
IEMG has a compression near 50W profile with 5.2% 13-week relative strength versus SPY.
Extension and support failure are the main tactical risks.
Tracked, but not top-2 eligible because: structurally broken.
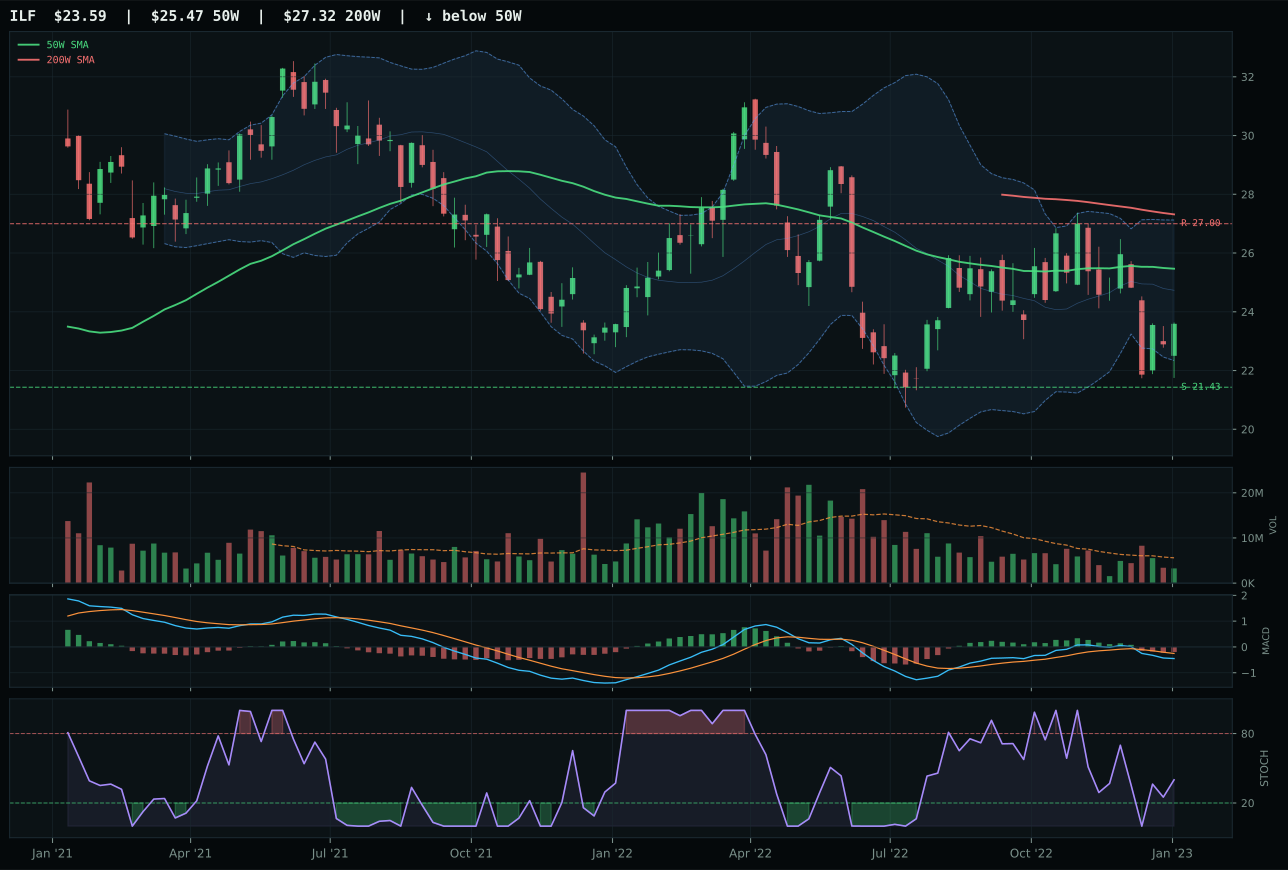
ILF has a neutral structure profile with -14.6% 13-week relative strength versus SPY.
Extension and support failure are the main tactical risks.
Tracked, but not top-2 eligible because: structurally broken.
INDA won despite scoring 0.0 in the final category tally—an extreme punishment for a macro setup that conflicts violently with technicals. INDA's timing score of 100.0, driven by distance to the 50W of just -1.0% and stochastic RSI rising through mid-zone at 0.46, marks it as the only entry point in a category being liquidated. IEMG's 95.0 timing score looks superior until you examine the detail: IEMG is compression near the 50W, not pullback into support, meaning it offers no defined invalidation area if sellers reemerge. INDA's 75.9 structure score reflects a clean pullback into support at 40.21 with 4.7% downside risk versus 70.1% risk-reward upside—the cleanest setup in a broken category. IEMG's overbought stochastic and bullish-but-flattening MACD read as false strength; they signal exhaustion of a counter-trend bounce rather than the beginning of fresh accumulation that INDA's rising stochastic might signal.
Emerging Markets earned 10% despite a disastrous 0.0 final score because the portfolio cannot fully hedge emerging-market exposure even when technicals and macro are both hostile. Credit stress at -10 and liquidity stress at -10, paired with broad market bear signal at -9, create the 21.0 macro fit that produced the 0.0 scorecard. The allocation is pure defensive necessity; with 60% of global equity returns now clustering in US mega-cap AI and energy, a portfolio that allocates nothing to emerging markets abandons all diversification benefit. INDA's pullback-into-support setup offers the highest probability of least additional losses if emerging markets continue rolling over. The thirteen-week return of 4.2% with -2.8% relative weakness confirms the trade is working against the portfolio for now. However, the allocation assumes that emerging market valuations and growth will eventually outperform as US growth rates decelerate; INDA's cheap starting valuation and India-specific growth narratives make it the least damaged entry point. This is strategic allocation despite tactical pain—a thesis bet that emerging market underperformance has a shelf life and that INDA's support level at 40.21 will hold to allow repositioning.
AI — SMH
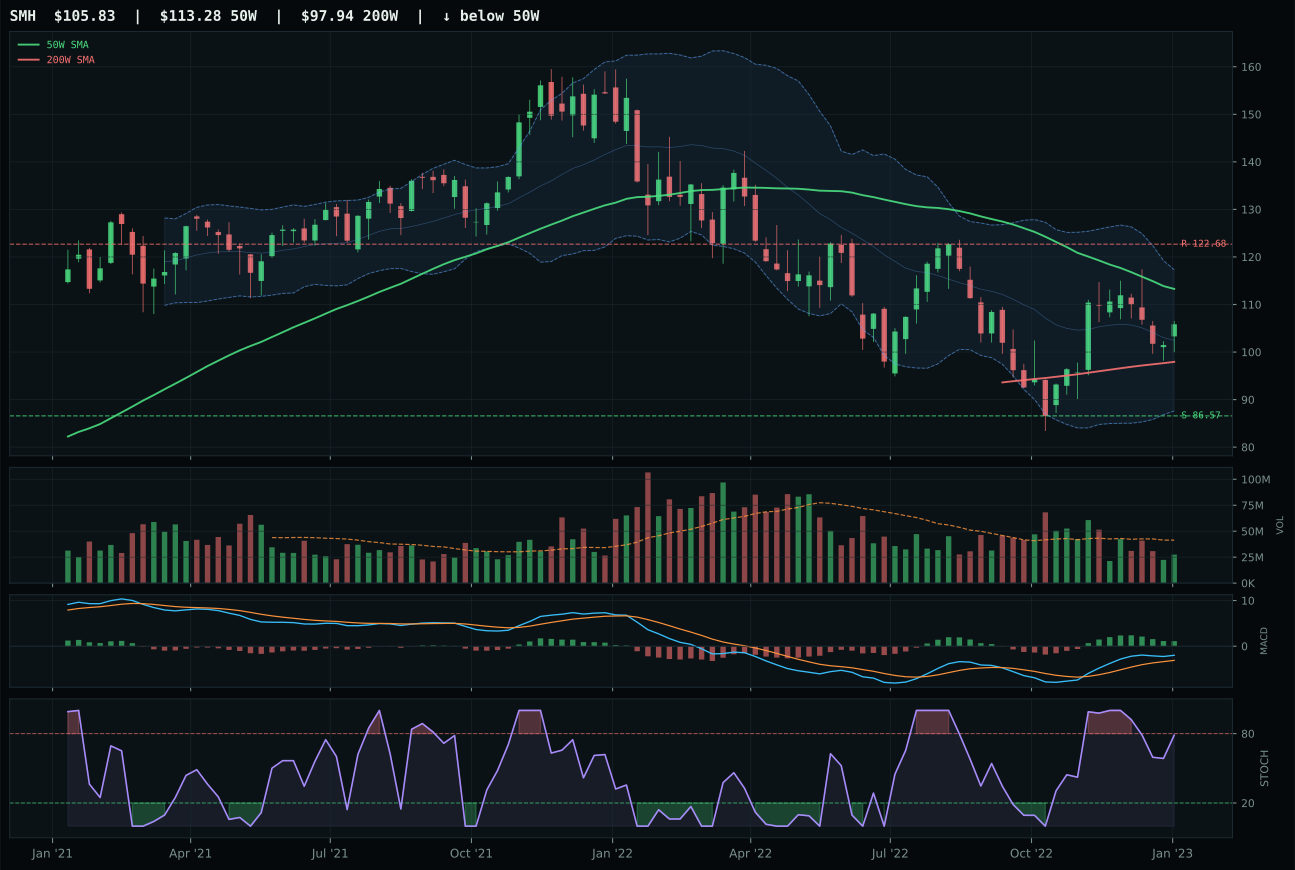
SMH has a neutral structure profile with 5.3% 13-week relative strength versus SPY.
A failed hold above support would weaken the setup.
Actionable but governed by invalidation levels.
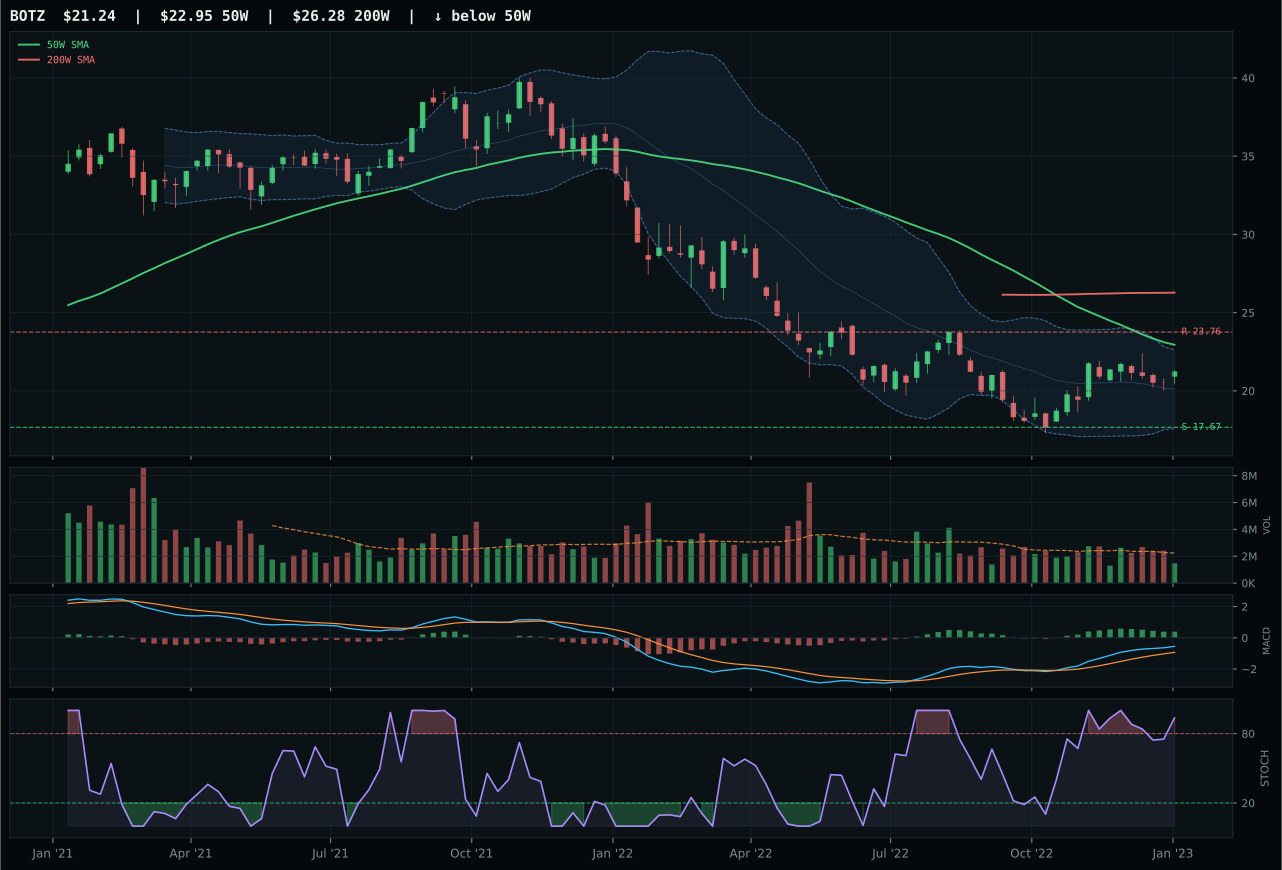
BOTZ has a neutral structure profile with 7.5% 13-week relative strength versus SPY.
Extension and support failure are the main tactical risks.
Tracked, but not top-2 eligible because: structurally broken.
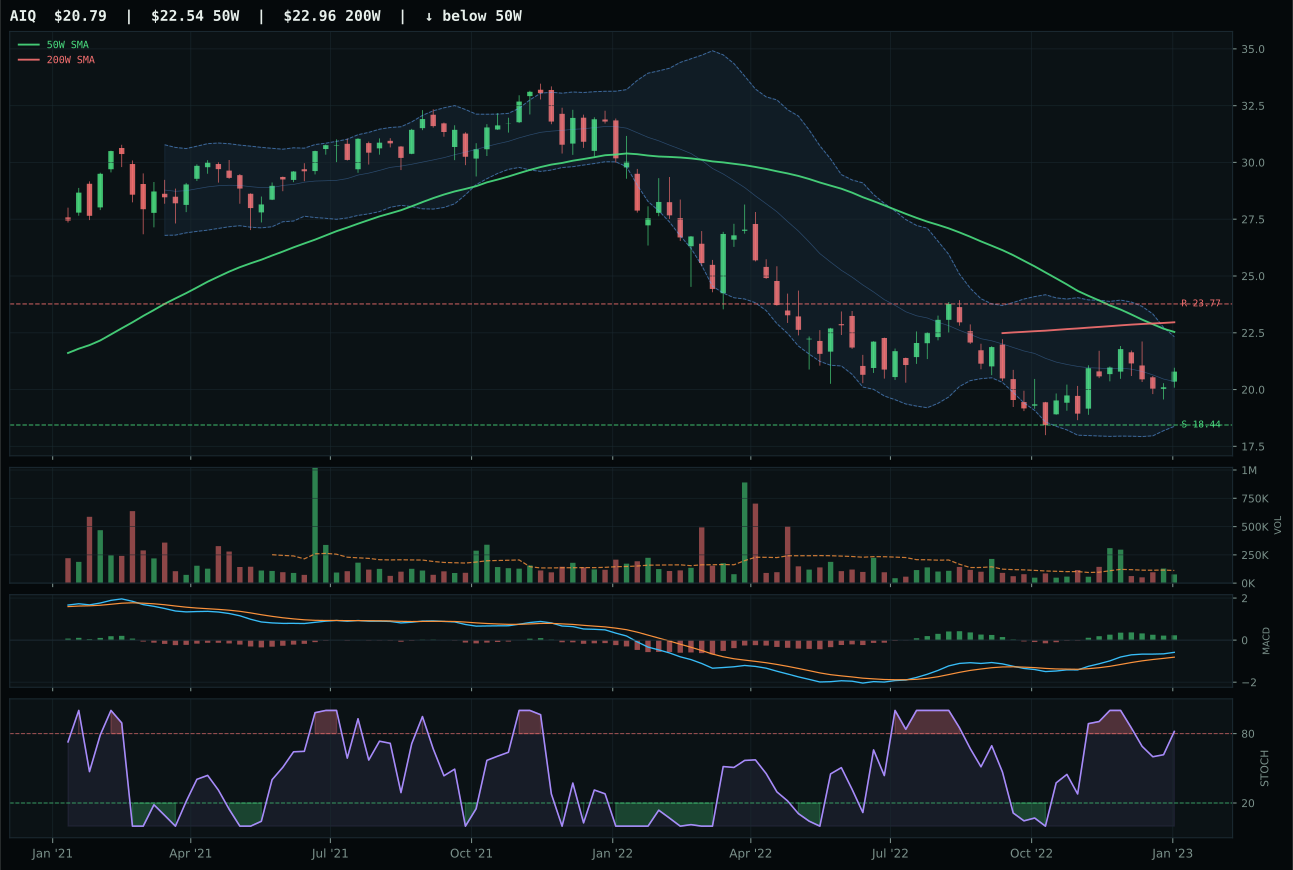
AIQ has a neutral structure profile with 0.5% 13-week relative strength versus SPY.
Extension and support failure are the main tactical risks.
Tracked, but not top-2 eligible because: structurally broken.
SMH defeated BOTZ by establishing clearer timing and structure despite both facing thin volume participation that limits conviction. The 77.0 timing score versus BOTZ's 70.0 reflects SMH's superior Fibonacci placement—deep retracement at 0.618 near $111.72—which offers measurable support if liquidation continues. BOTZ's setup shows structural deterioration; while its stochastic RSI reading of overbought momentum looks bullish to some, it arrived alongside compressed volume, creating a false breakout risk that SMH's falling-neutral reading at 0.79 avoids. SMH's 65.9 structure score and 62.3 technical evidence beat BOTZ's 40.2 structural cleanliness decisively. The 12.2% thirteen-week return in SMH reflects actual participation in semicon leadership, whereas BOTZ's 14.4% return masks participation without structural confirmation—a classic case of higher absolute return in an inferior setup.
AI sits at 25.8, ranked 9th or 10th, and receives zero allocation because the macro regime actively penalizes growth-sensitive exposures. AI growth sponsorship does register at +14 points, but it drowns in -12 liquidity stress, -8 credit stress, and -8 broad market bear headwinds that total -13 net. SMH's superior technical setup cannot overcome the fact that 62% technical weight feeds into a 36.0 macro fit score where every macro lever is pointing the wrong direction. The category needs either a shift in the macro state away from Late-Cycle Reflation or material improvement in credit and liquidity conditions to justify a 10% slot; without that shift, capital is better deployed in real assets and geopolitical hedges like defense where the macro tailwind is genuine and the technicals are clean.
Technology — XLK
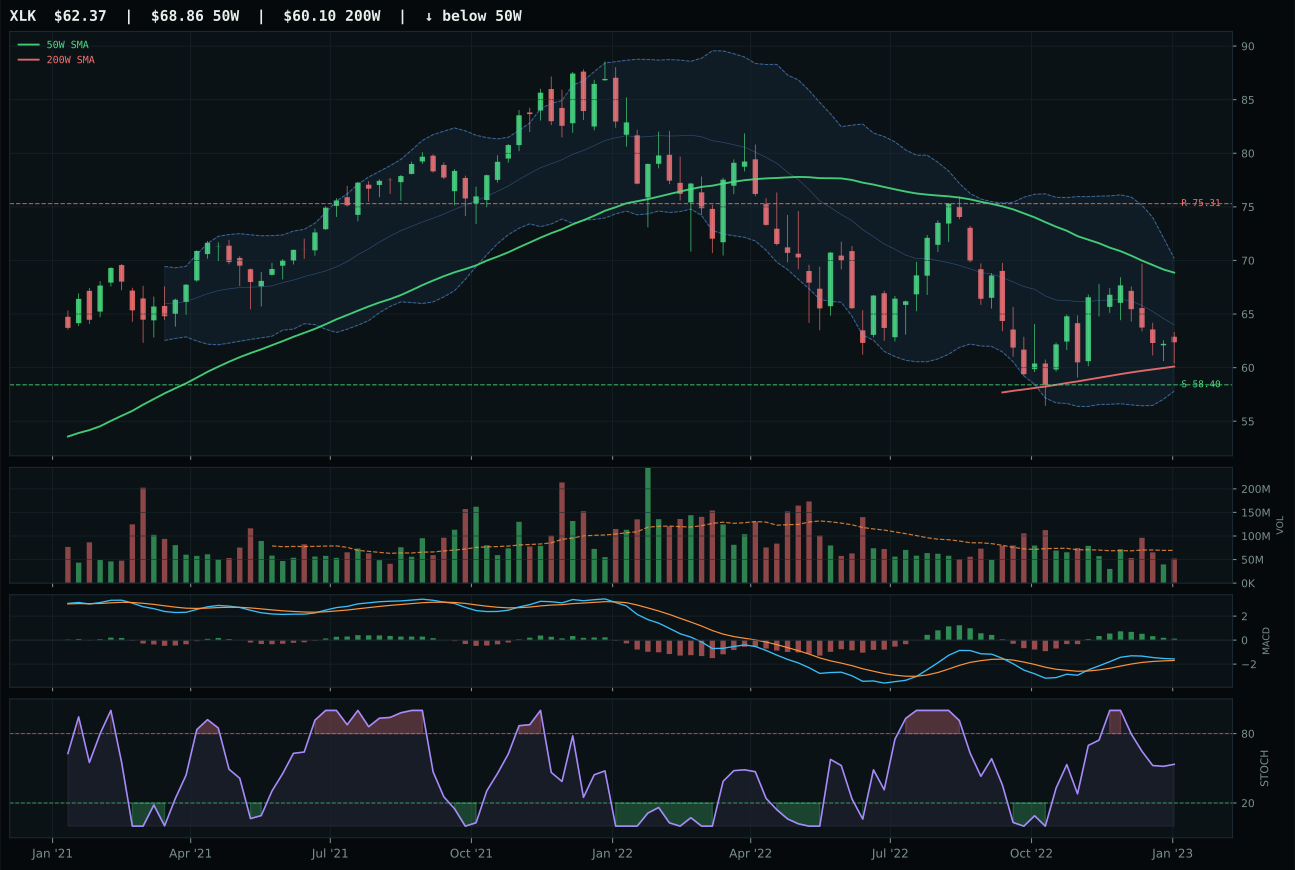
XLK has a neutral structure profile with -3.7% 13-week relative strength versus SPY.
A failed hold above support would weaken the setup.
Actionable but governed by invalidation levels.
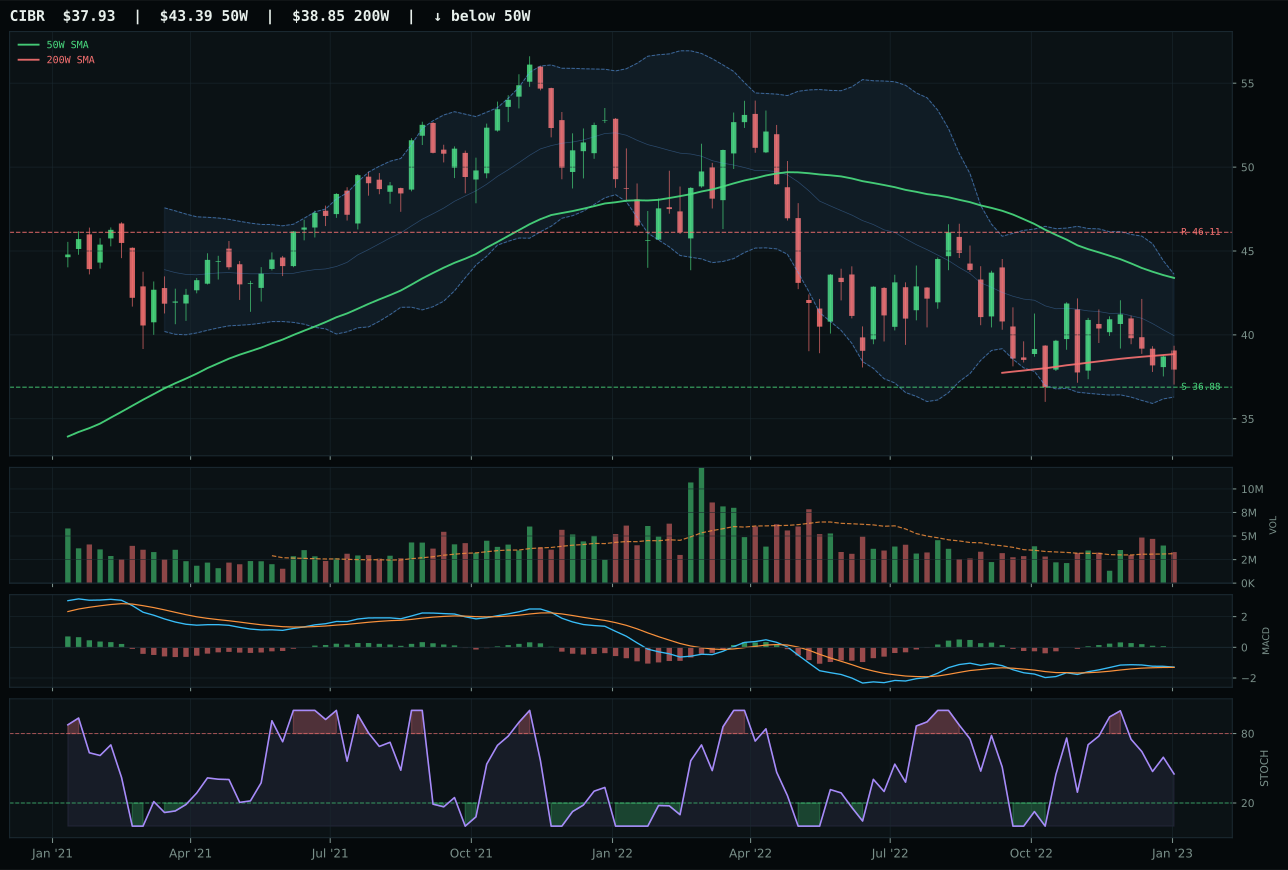
CIBR has a pullback into support profile with -10.1% 13-week relative strength versus SPY.
A failed hold above support would weaken the setup.
Actionable but governed by invalidation levels.
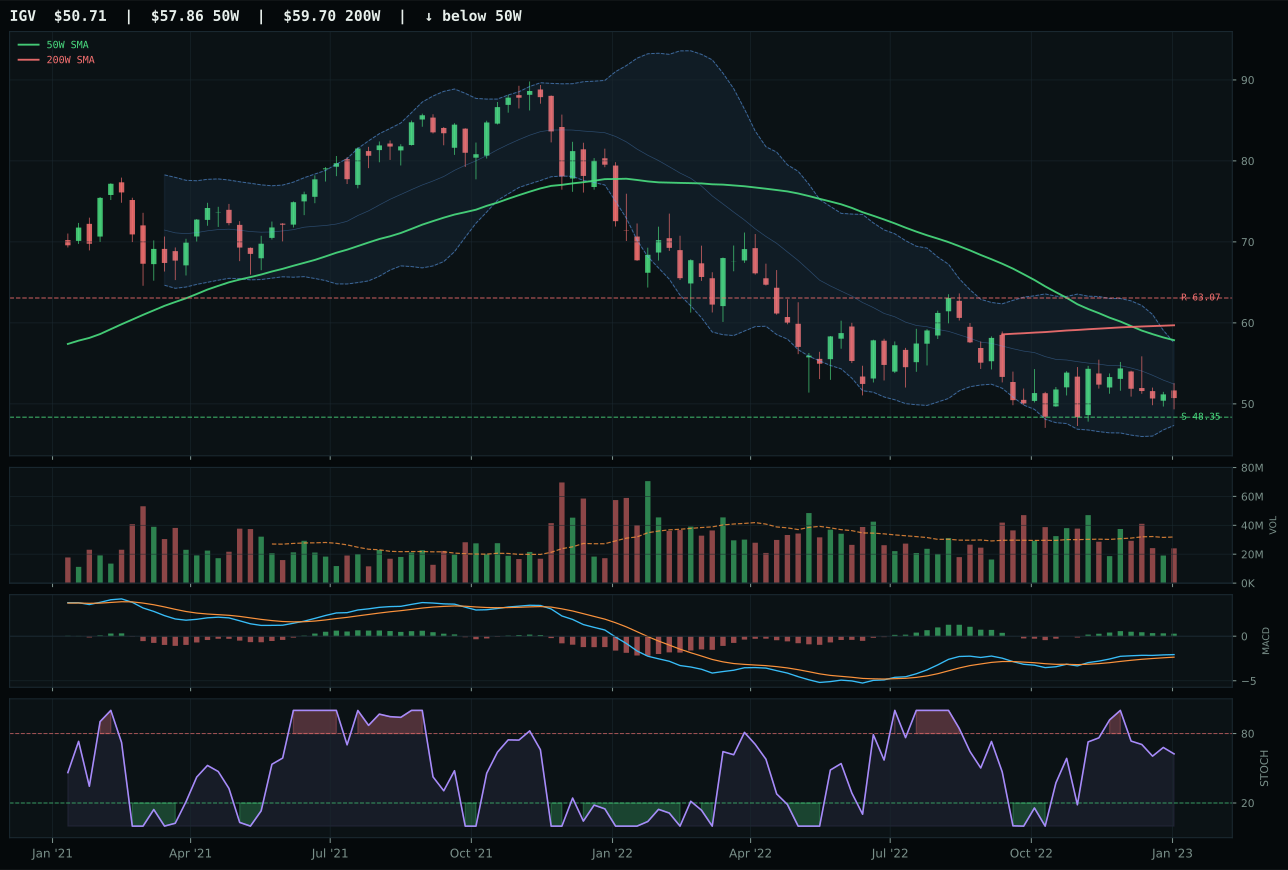
IGV has a pullback into support profile with -8.2% 13-week relative strength versus SPY.
Extension and support failure are the main tactical risks.
Tracked, but not top-2 eligible because: structurally broken.
XLK claimed the category over CIBR by combining superior relative strength inside its peer basket with a cleaner technical setup near a defined support zone. The 4.5% advantage in category-relative strength versus CIBR's -1.9% reflects genuine leadership among profitable-tech names, not mere sector momentum. XLK's neutral structure with a 70.0 timing score—driven by a -9.4% distance to the 50W and a MACD that remains bullish despite flattening—creates the kind of repair-zone pullback that rewards patient buyers who let technicals restore. CIBR stumbled on a 60.0 timing score and a weaker support/resistance configuration, falling into the trap of looking cheaper without offering better accumulation evidence. Volume at 0.75x average confirms neither ETF is experiencing sponsorship, yet XLK's 55.5 trend score and 69.1 structure mark it as the least damaged entry point when technology rotations resume.
Technology ranked 9th or 10th among the ten categories and earned zero allocation this week despite XLK's tactical merit. The category's 24.2 score collapsed because macro fit—at just 35.0—actively works against tech in the current Late-Cycle Reflation regime. Liquidity stress and credit stress carry -9 and -6 point penalties respectively, and while AI growth sponsorship does add +4, it cannot overcome the structural headwinds in an environment where defensive rotation and broad market bear are both active. The volume-price confirmation score of 54.3 further signals thin accumulation rather than the kind of institutional commitment that would justify 10% allocation in a crowded playbook. For tech to earn back a position, either credit stress must ease materially or the macro regime must shift toward growth bias; as it stands, the category is correctly benched in favor of real assets, defense, and selective energy exposure.