
2022-12-30
Informational purposes only. The content in this report, including allocations, analysis, and commentary, is provided solely for informational and educational purposes. It does not constitute financial advice, investment advice, trading advice, or any other type of advice. Past performance does not guarantee future results. Always conduct your own research and consult a qualified financial professional before making investment decisions.
Weekly Allocation
| Ticker | Category | Weight | Role |
|---|---|---|---|
| ITA | Defense & Aerospace | 20% | Top-2 (20%) |
| GLD | Precious Metals | 20% | Top-2 (20%) |
| XLU | Utilities & Infrastructure | 10% | Tier-2 (10%) |
| XLE | Traditional Energy | 10% | Tier-2 (10%) |
| COPX | Industrial Metals | 10% | Tier-2 (10%) |
| WEAT | Agriculture & Livestock | 10% | Tier-2 (10%) |
| URNM | Nuclear Energy | 10% | Tier-2 (10%) |
| INDA | Emerging Markets | 10% | Tier-2 (10%) |
Trade Instructions — Monday Open
Sell the tranche from 2022-12-02 (completing its 4-week hold). Buy the new tranche. Instructions show net portfolio changes — same-asset positions cancel, weight changes show the delta.
| Action | Ticker | Instruction |
|---|---|---|
| SELL | COPX | Sell 14% of COPX position (reduce 17.50% → 15.00%) |
| SELL | XLE | Sell 17% of XLE position (reduce 15.00% → 12.50%) |
| SELL | XAR | Sell entire XAR position (2.50% of portfolio) |
| SELL | VEGI | Sell entire VEGI position (2.50% of portfolio) |
| SELL | XLK | Sell 25% of XLK position (reduce 10.00% → 7.50%) |
| SELL | SMH | Sell 50% of SMH position (reduce 5.00% → 2.50%) |
| SELL | URA | Sell 33% of URA position (reduce 7.50% → 5.00%) |
| BUY | ITA | Buy ITA — 28.57% of freed cash (adds 5.00% to portfolio) |
| BUY | GLD | Buy GLD — 28.57% of freed cash (adds 5.00% to portfolio) |
| BUY | WEAT | Buy WEAT — 14.29% of freed cash (adds 2.50% to portfolio) |
| BUY | URNM | Buy URNM — 14.29% of freed cash (adds 2.50% to portfolio) |
| BUY | INDA | Buy INDA — 14.29% of freed cash (adds 2.50% to portfolio) |
Current Portfolio After Trade
Combined holdings across all 4 active tranches. Each tranche is 25% of the portfolio.
| Ticker | % of Portfolio | Weight Bar |
|---|---|---|
| ITA | 17.50% | |
| COPX | 15.00% | |
| XLE | 12.50% | |
| XLU | 12.50% | |
| XLK | 7.50% | |
| MOO | 7.50% | |
| SLV | 7.50% | |
| URA | 5.00% | |
| GLD | 5.00% | |
| SMH | 2.50% | |
| WEAT | 2.50% | |
| URNM | 2.50% | |
| INDA | 2.50% |
Macro Regime — Late-Cycle Reflation
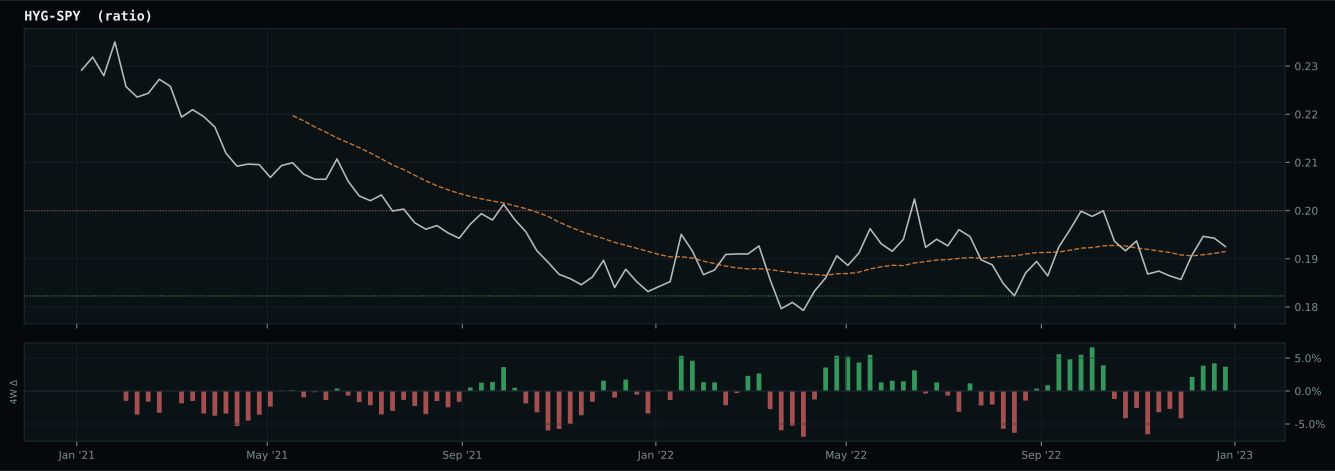
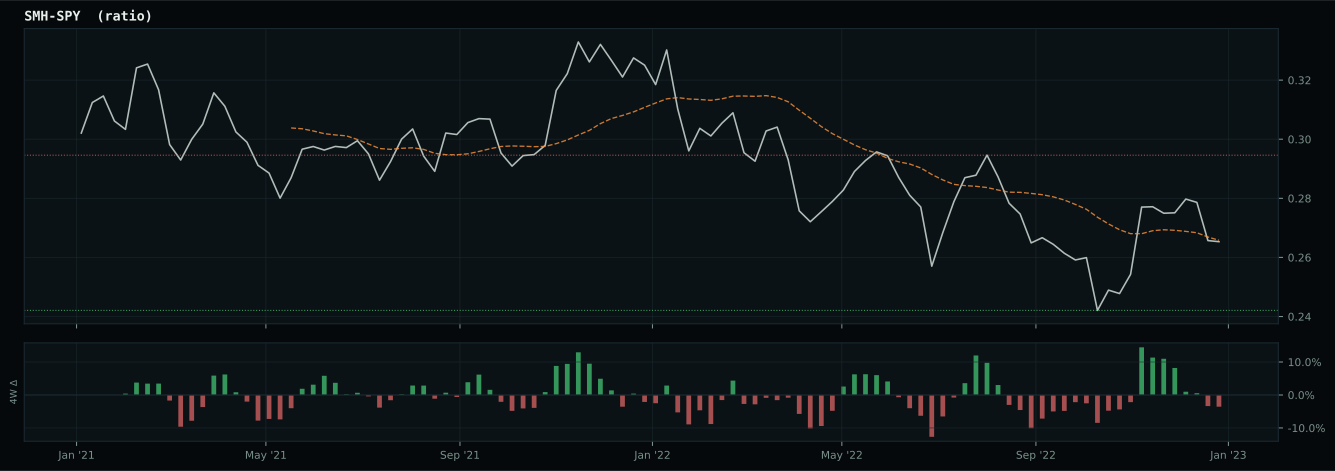
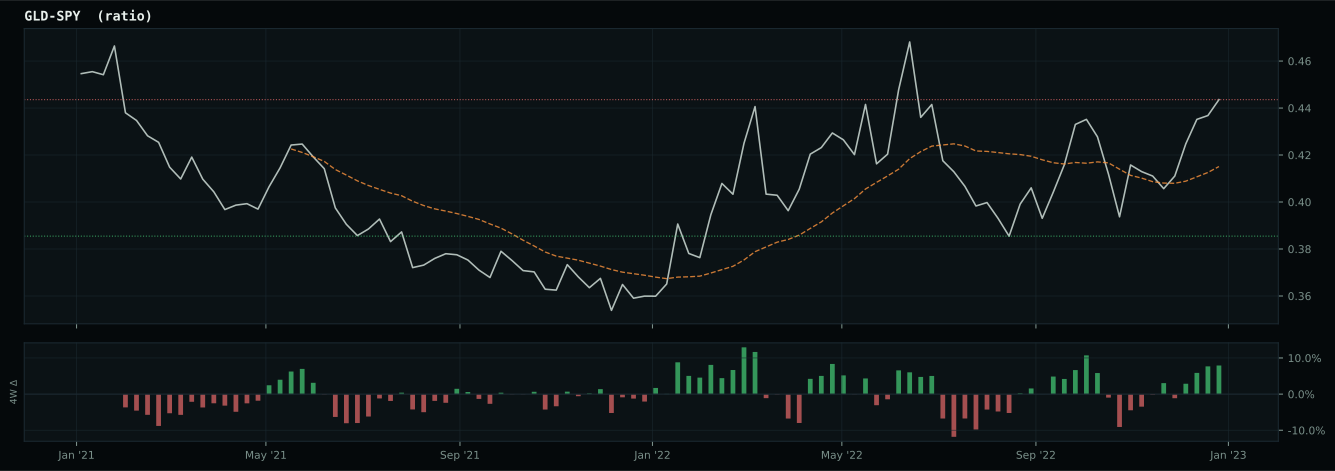
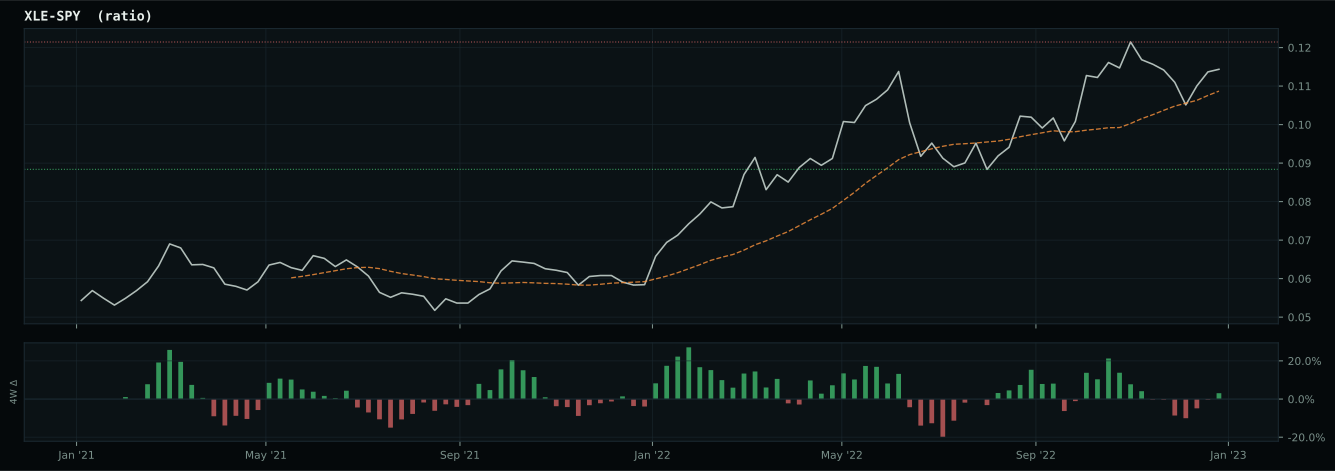
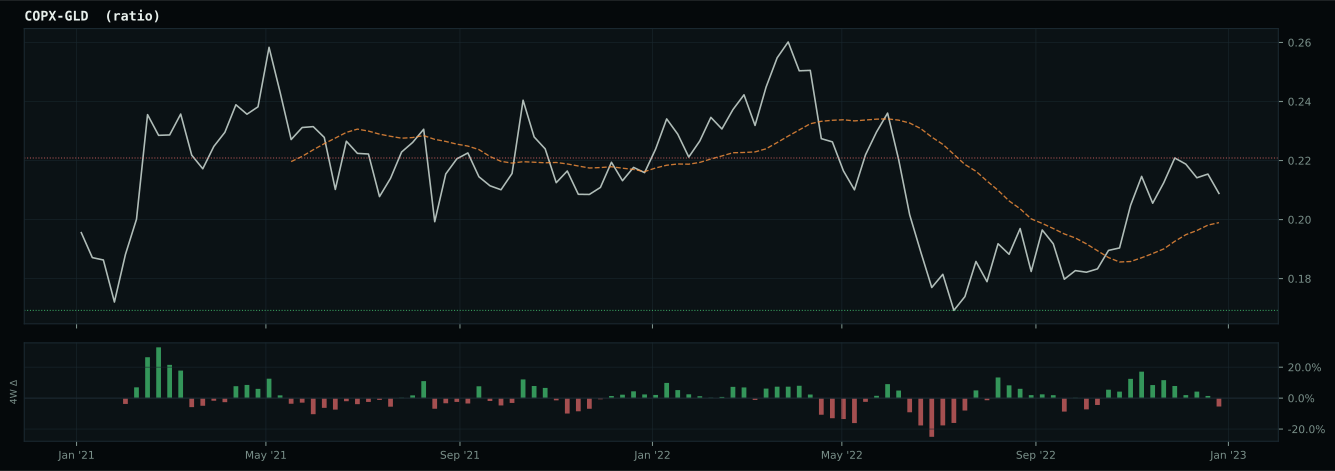
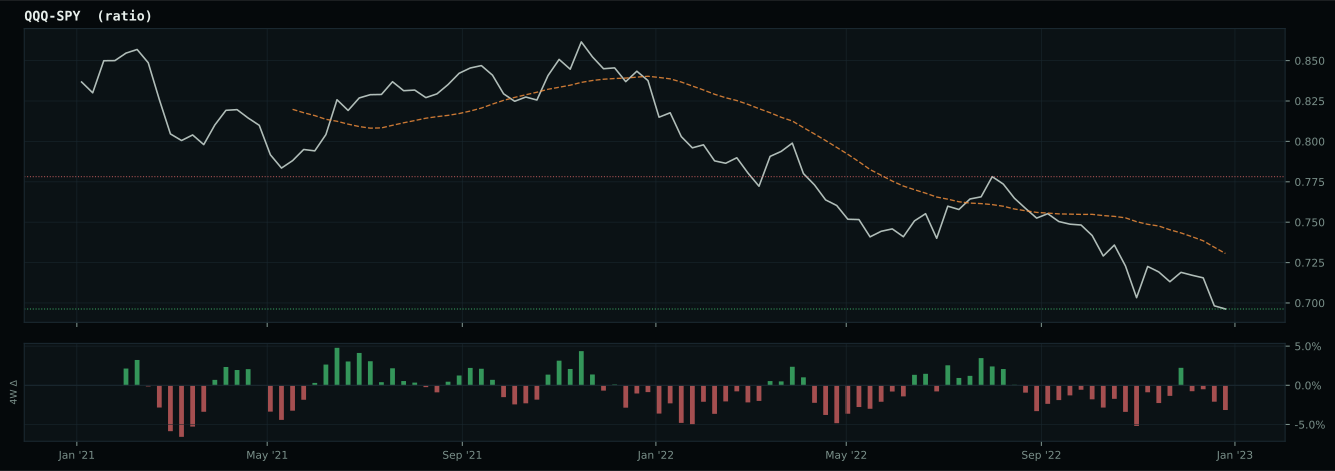
Macro Evidence Charts
Market-implied signals behind the macro regime scores. Each ratio compares two assets; the direction and slope of the ratio is what the macro engine reads.
Crypto Regime — NoCrypto
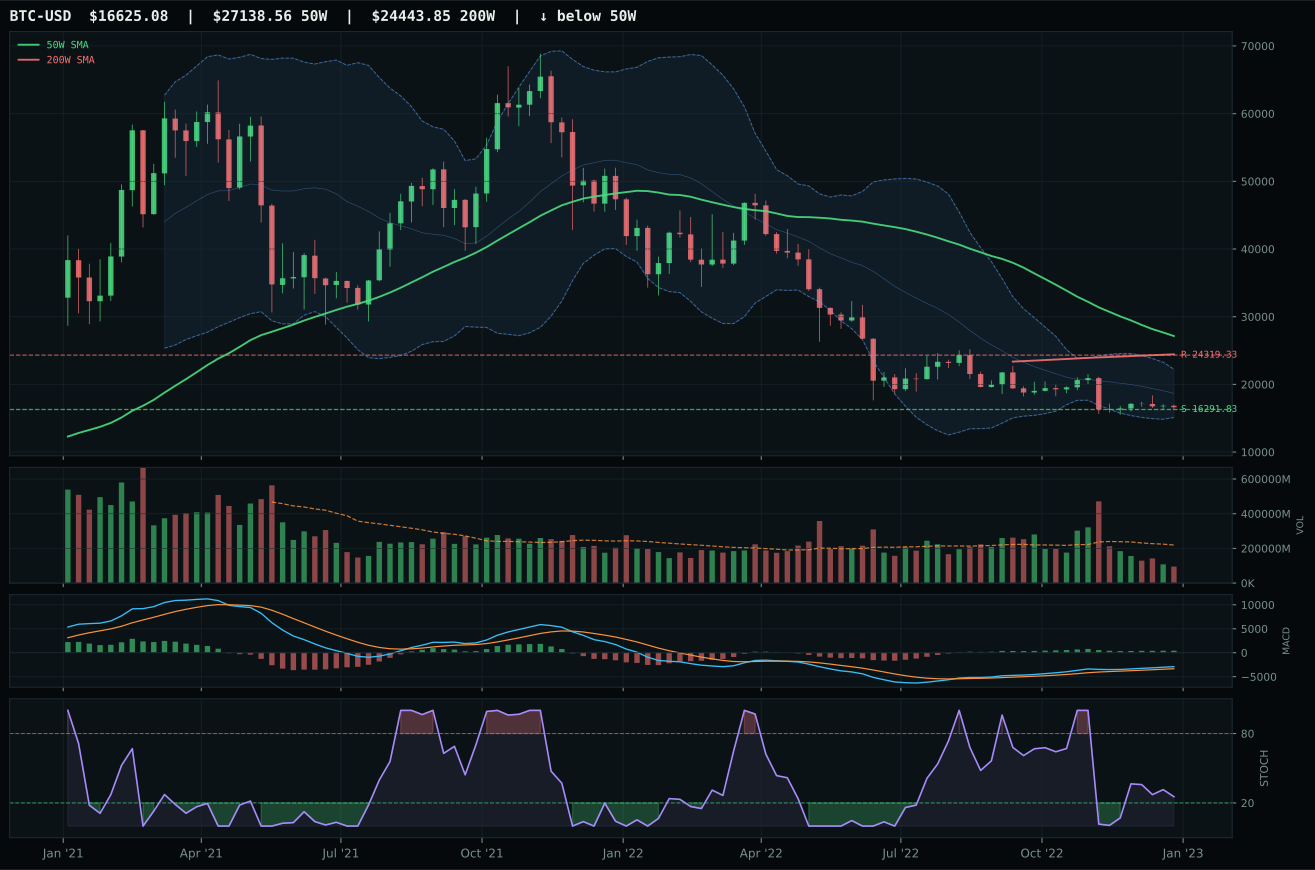
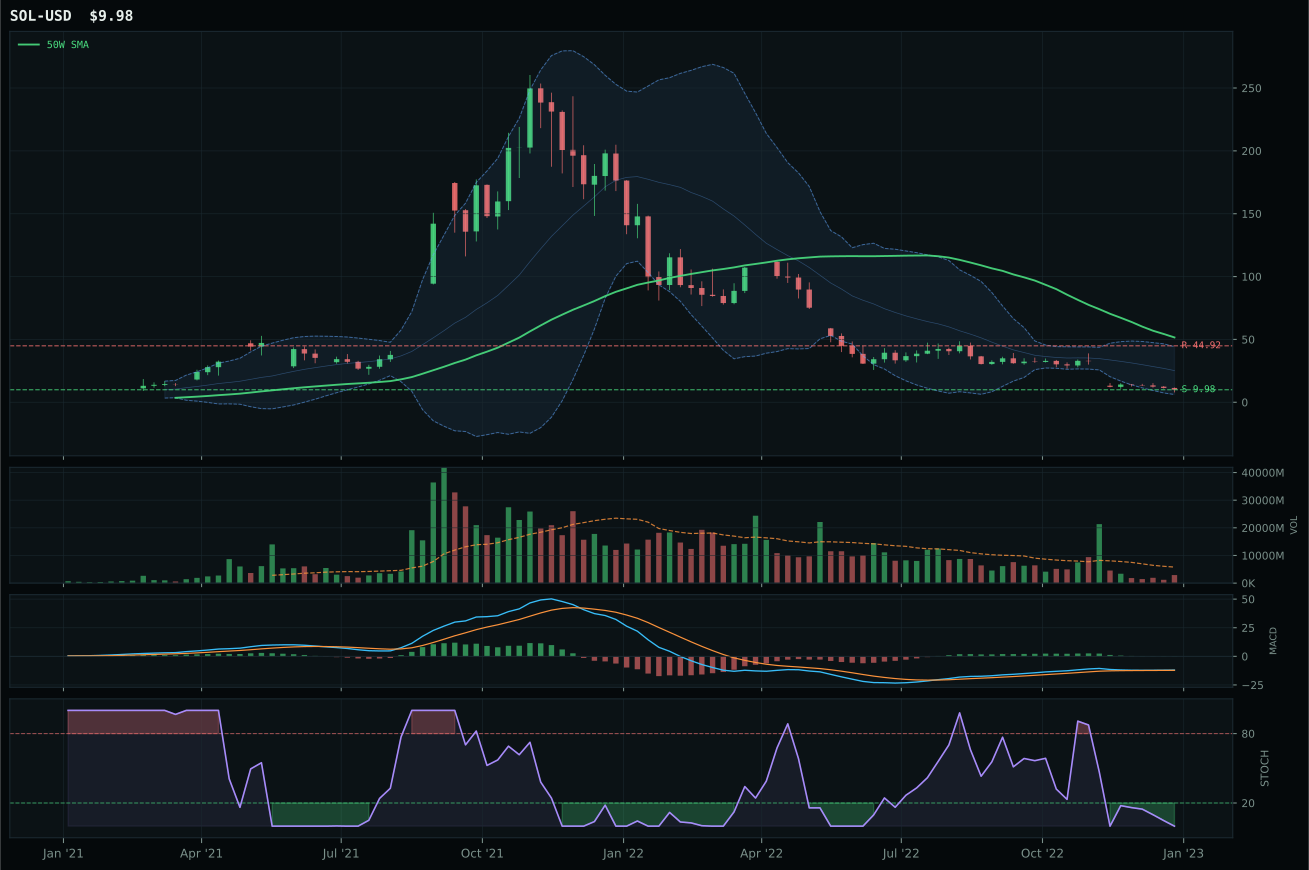
ValueBTC armed; waiting for 50W reclaim, decisive close above post-touch range resistance by 3%, close above 200W, breakout volume above 20W…
TrendBTC not confirmed
one or more available conditions failed
Category Rankings
| Rank | Category | Winner | Score | Alloc | 4W Ret | Peers (4W) |
|---|---|---|---|---|---|---|
| 1 | Defense & Aerospace | ITA | 65.5 | 20% | +1.35% | XAR +5.3% · ROKT +4.8% |
| 2 | Precious Metals | GLD | 64.8 | 20% | +4.65% | SLV -2.9% · GDX +9.8% |
| 3 | Utilities & Infrastructure | XLU | 63.7 | 10% | -2.91% | PAVE +6.2% · IGF +5.0% |
| 4 | Traditional Energy | XLE | 63.6 | 10% | +4.20% | XOP +5.6% · FCG +4.1% |
| 5 | Industrial Metals | COPX | 60.0 | 10% | +13.53% | PICK +12.3% · REMX +23.6% |
| 6 | Agriculture & Livestock | WEAT | 54.7 | 10% | -4.39% | VEGI +2.0% · MOO +5.3% |
| 7 | Nuclear Energy | URNM | 36.1 | 10% | +15.55% | URA +14.3% · NLR +5.2% |
| 8 | Technology | CIBR | 26.6 | 10% | +2.43% | XLK +7.4% · IGV +8.0% |
| 9 | AI | SMH | 24.5 | 0% | +14.13% | BOTZ +13.5% · AIQ +13.4% |
| 10 | Emerging Markets | INDA | — | 0% | -2.64% | IEMG +8.1% · ILF +12.2% |
Defense & Aerospace — ITA
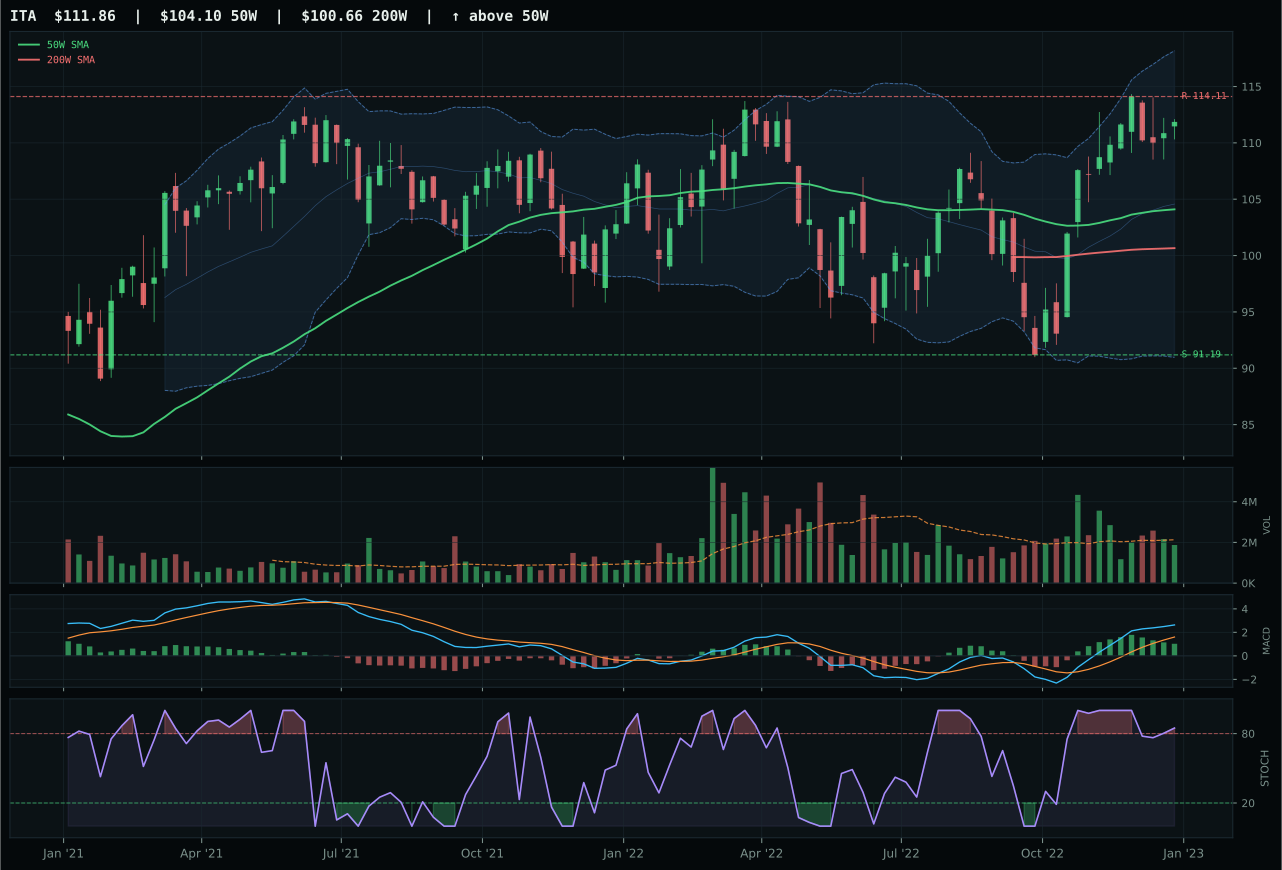
ITA has a neutral structure profile with 15.6% 13-week relative strength versus SPY.
A failed hold above support would weaken the setup.
Actionable but governed by invalidation levels.
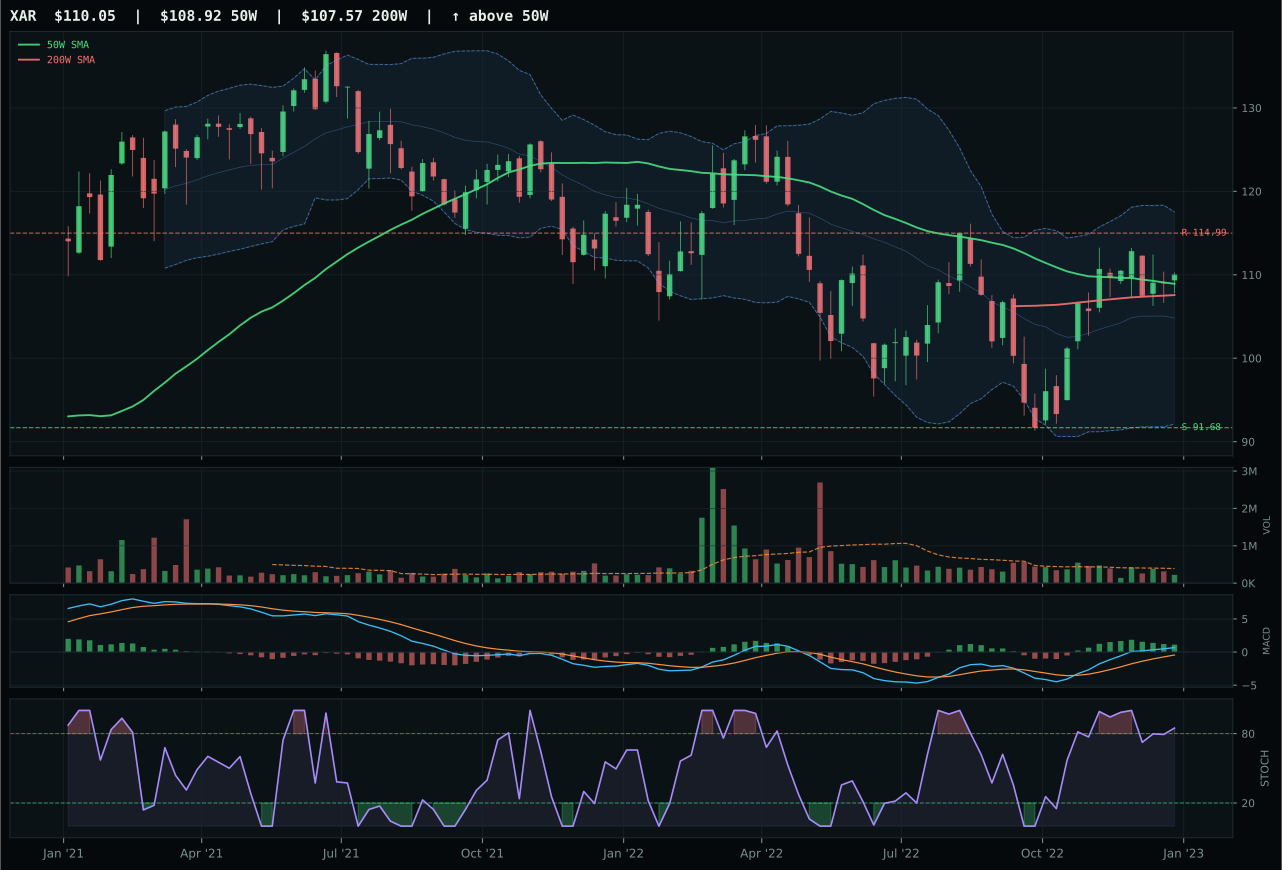
XAR has a compression near 50W profile with 13.0% 13-week relative strength versus SPY.
A failed hold above support would weaken the setup.
Actionable but governed by invalidation levels.
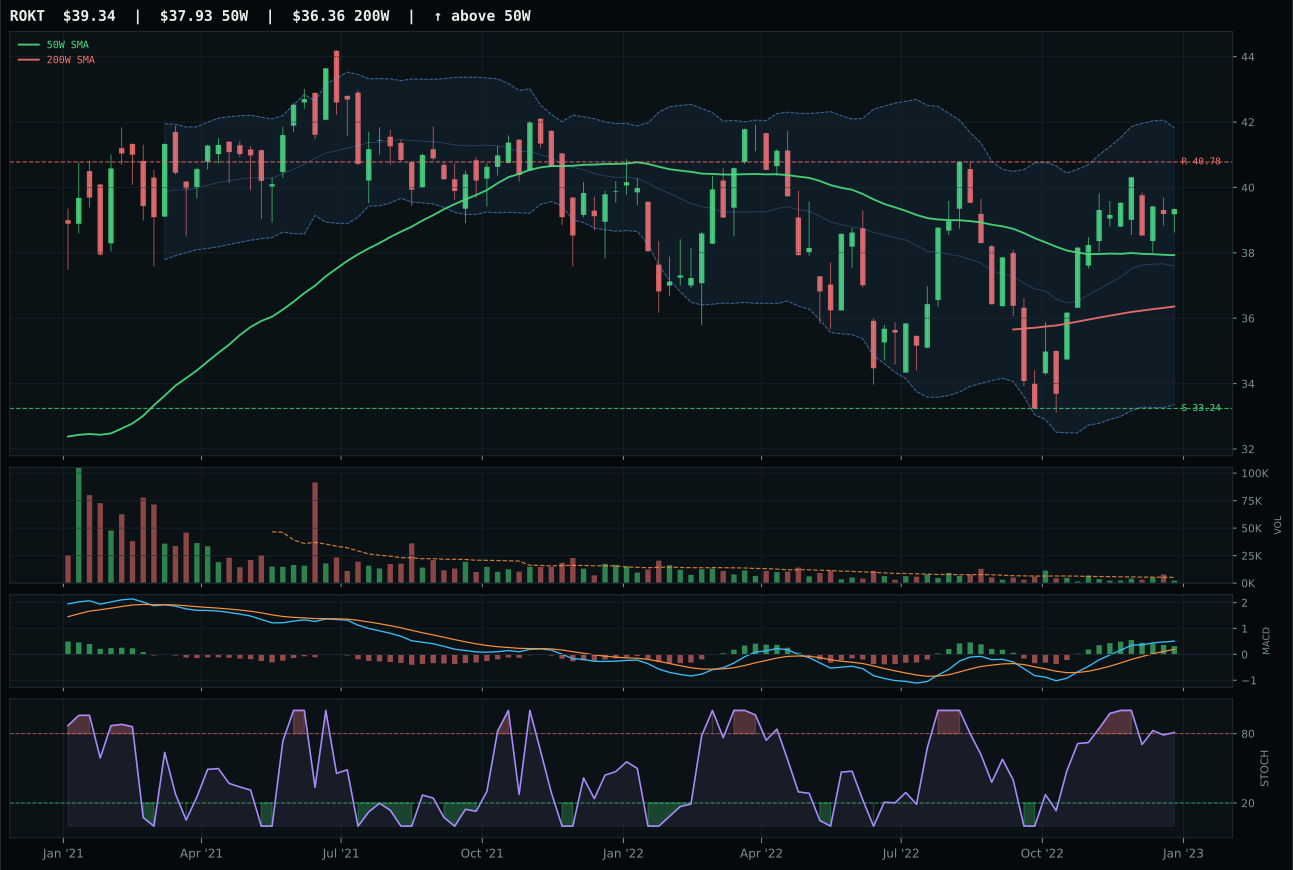
ROKT has a neutral structure profile with 11.3% 13-week relative strength versus SPY.
A failed hold above support would weaken the setup.
Tracked, but not top-2 eligible because: .
ITA earned the top-2 slot with a category-best 65.5 score by stacking perfect trend (100/100), perfect momentum (100/100), and overbought-but-clean timing that only ITA could execute cleanly. Price sits 7.5% above the 50-week moving average with the 50-week slope flat at 0.1%—not rolling over, not accelerating, but defending—and the 13-week return of 22.7% with 15.6% SPY-relative strength proves this is institutional sponsorship, not retail chase. MACD is bullish but flattening and stochastic RSI is overbought at 0.85, signals that XAR also carries, but ITA's structure cleanliness of 66.7 and compression of 79.2 beat XAR's 71.6 structure score and tighter volume confirmation. The category-relative strength of 2.6% versus XAR's 0.0% is the decider: when two names are both extended, the one with relative leadership wins. ITA's neutral volume at 0.88x the 20-week average proves buyers are not panicking; they are rotating into durability.
Defense & Aerospace earned 20% as one of the portfolio's two highest-conviction categories because the macro fit of 71/100 and technical evidence of 81/100 combine into a regime-perfect hedge against late-cycle instability. Defensive rotation adds 8 points, broad market bear adds 6, and the late-cycle reflation state itself adds 6—this is not a tactical trade, it is a structural allocation that works when credit tightens, equities roll over, and duration becomes scarce. ITA's technical perfection (trend 100, momentum 100) means the setup has room to run before invalidation; support at 91.19 is 22.7% below current price, providing a wide margin of safety. The category ranks second only to Precious Metals on a risk-adjusted basis because it offers both defensive rotation AND relative strength momentum, whereas other categories offer one or the other. If macro conditions worsen—liquidity stress accelerates, spreads widen—ITA will outperform XLE and GLD simply because defense always wins a true flight-to-safety scenario.
Precious Metals — GLD
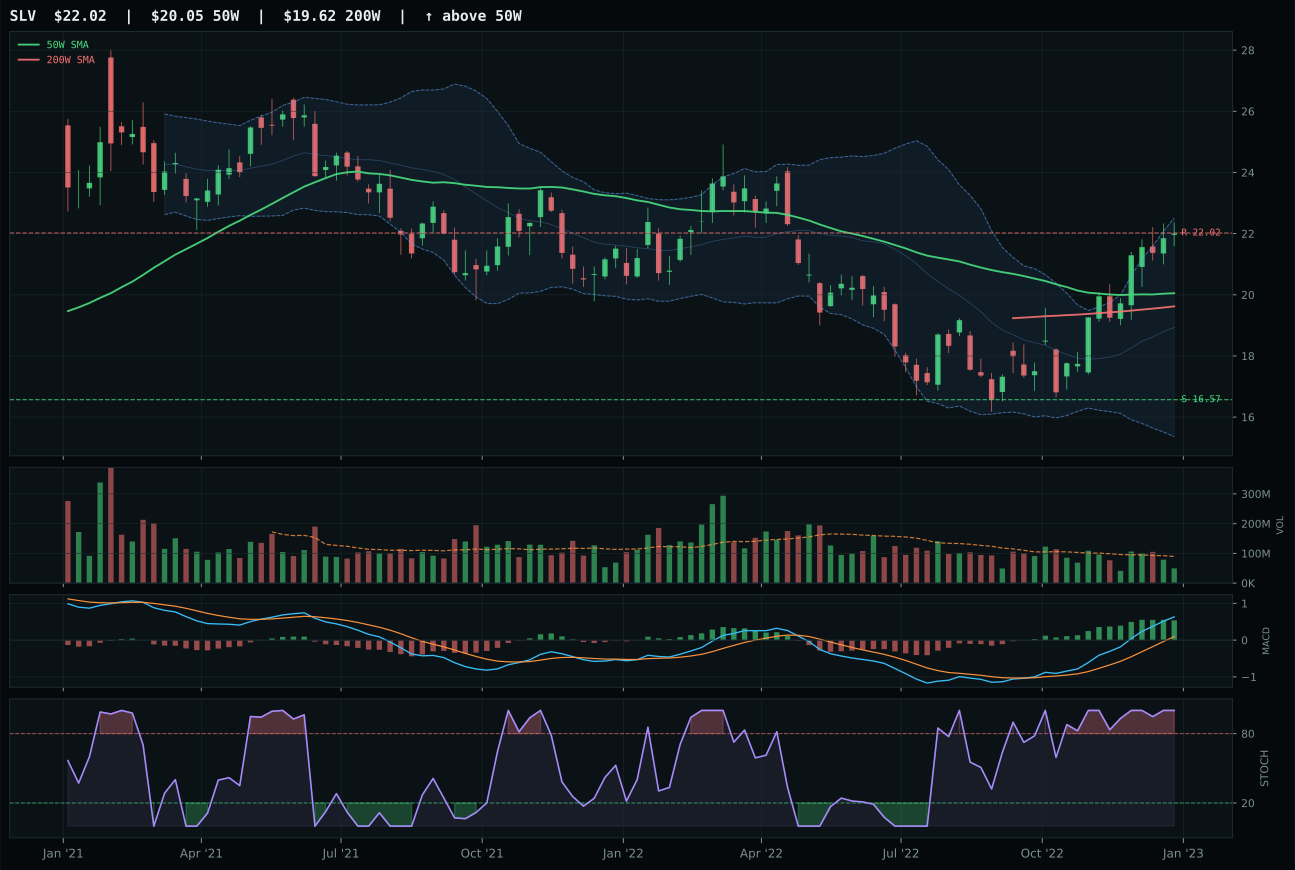
SLV has a neutral structure profile with 18.8% 13-week relative strength versus SPY.
A failed hold above support would weaken the setup.
Actionable but governed by invalidation levels.
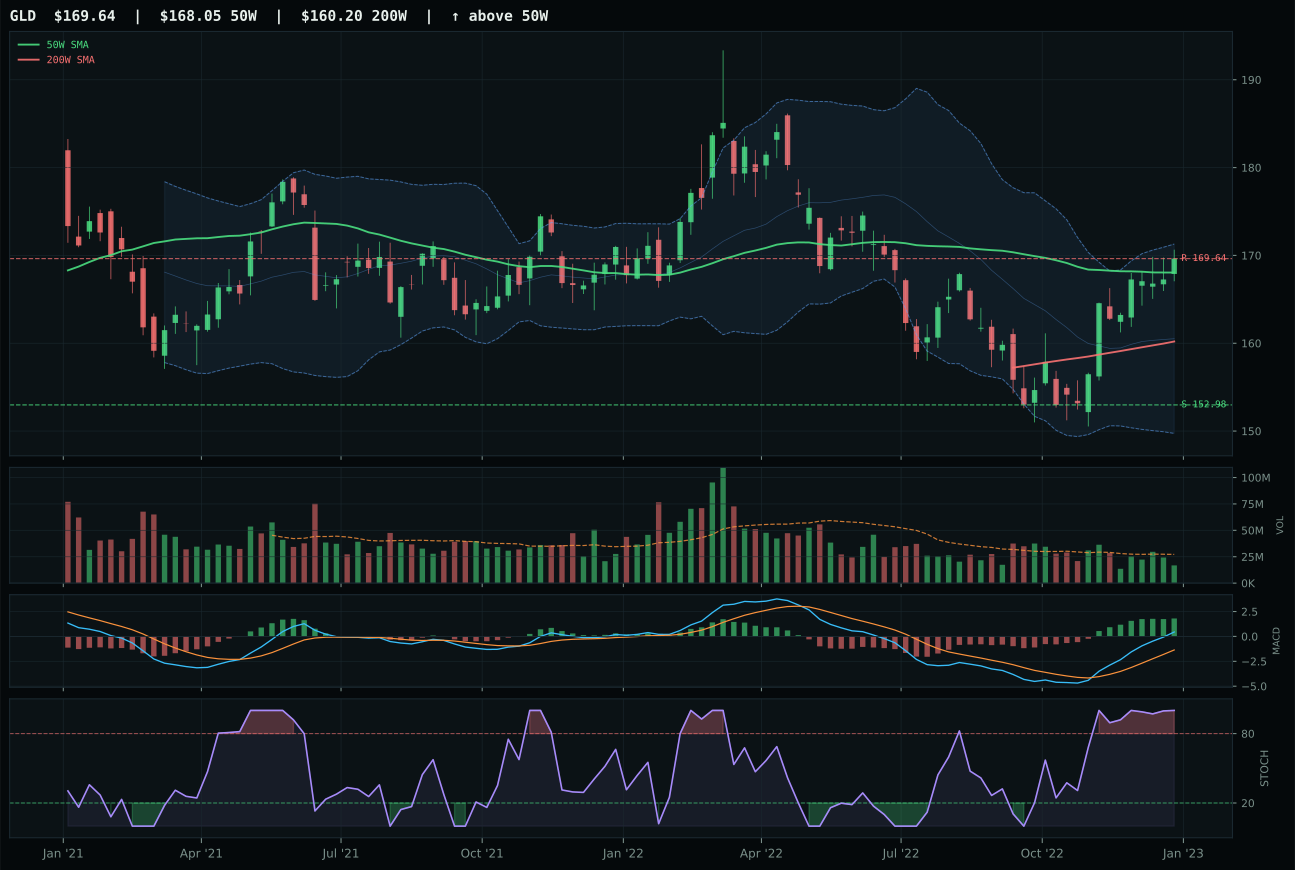
GLD has a compression near 50W profile with 2.6% 13-week relative strength versus SPY.
A failed hold above support would weaken the setup.
Actionable but governed by invalidation levels.
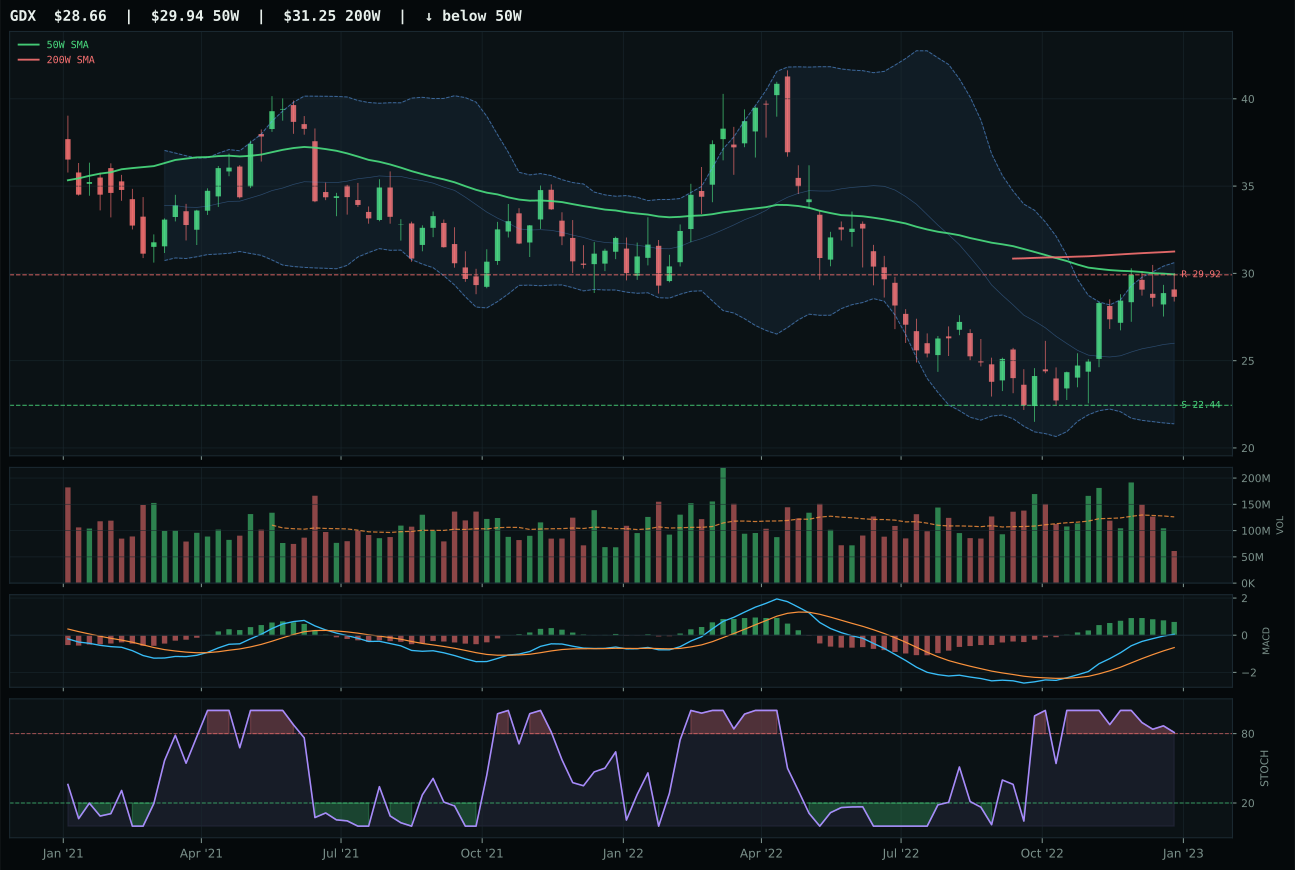
GDX has a neutral structure profile with 11.8% 13-week relative strength versus SPY.
Extension and support failure are the main tactical risks.
Tracked, but not top-2 eligible because: structurally broken.
GLD claimed the top-2 slot with a 64.8 category score by executing the hardest technical trick: sitting flat to the 50-week moving average (only 0.9% above) while maintaining bullish momentum and providing perfect timing to expand. Price is compressing at the 50-week with a flat slope of -0.0%, MACD is bullish and improving, stochastic RSI is overbought at 1.00, and the Fibonacci location in the middle retracement zone at 171.94 shows GLD has room to run before facing serious supply. SLV, despite superior 13-week relative strength at 18.8% and a near-perfect trend score of 100/100, is already 9.8% extended above the 50-week in the upper momentum zone—MACD improvement cannot overcome timing deterioration when price is that far separated from the moving average. GLD's timing score of 100 versus SLV's 75 is the wedge: compression near the moving average is where trend followers buy when MACD is improving because invalidation is miles away. SLV's risk/reward of 49.4 versus GLD's 66.2 confirms the math—GLD offers 10.9% downside to support versus SLV's tighter setup.
Precious Metals earned 20% as the portfolio's second top-2 category because monetary hedge bid of +14 and defensive rotation of +7 combine into a regime conviction that late-cycle reflation + geopolitical uncertainty sustains. GLD's category-relative strength is -9.1%, a red flag, but the monetary hedge narrative is macro-driven and independent of category momentum; when spreads widen or real rates compress, gold is a volatility shock absorber that works even when peers underperform. The 64.8 category score sits 1.3 points below Defense, a tight margin that reflects the technical excellence of both setups. GLD's compression structure and perfect timing mean this allocation can extend if support at 152.98 holds; the 100/100 timing score provides permission to be patient. If the Fed pivots harder toward easing, if credit spreads spike, or if DXY weakness accelerates, Precious Metals can push toward 30% of the portfolio. Right now, at 20%, it is appropriately sized as a reflation hedge with near-term momentum runway.
Utilities & Infrastructure — XLU
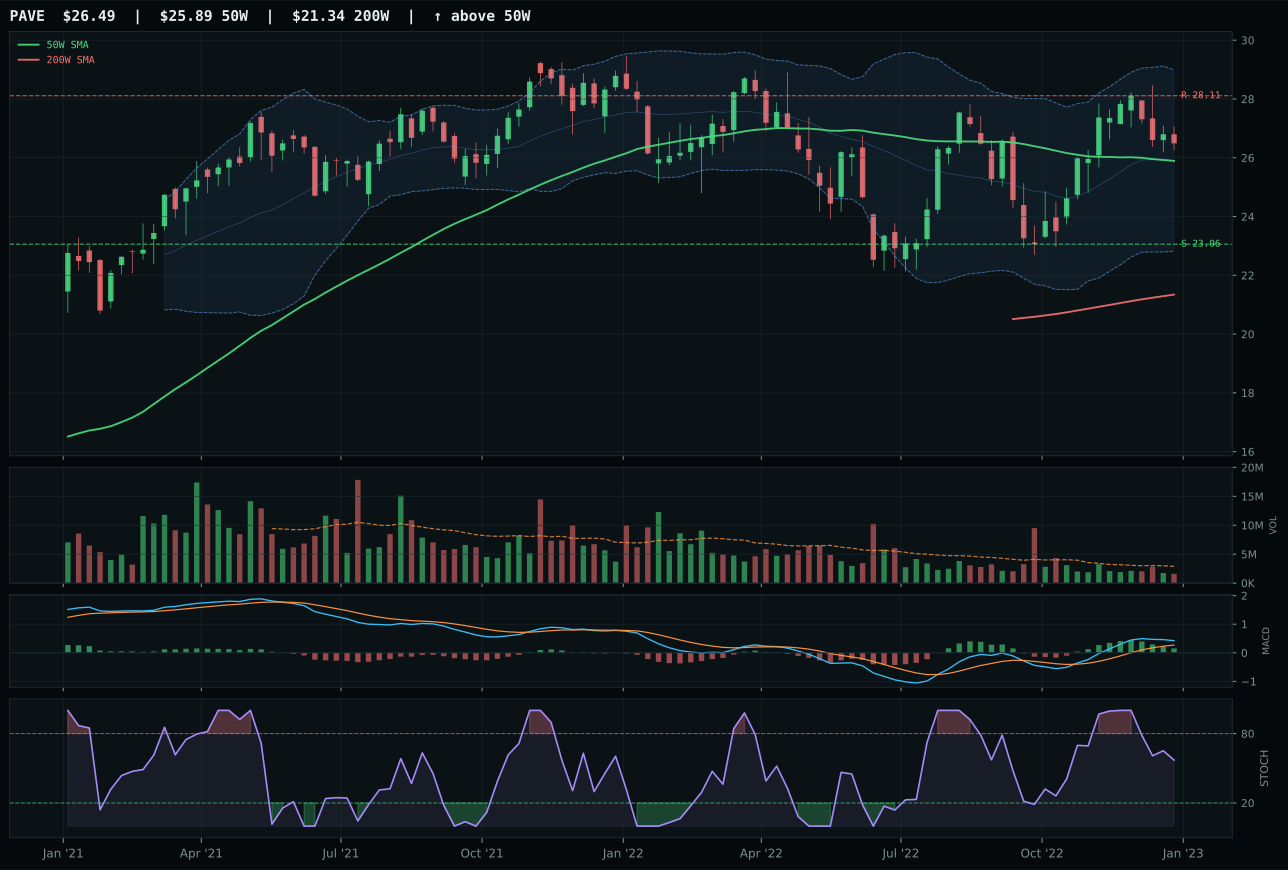
PAVE has a compression near 50W profile with 7.8% 13-week relative strength versus SPY.
A failed hold above support would weaken the setup.
Actionable but governed by invalidation levels.
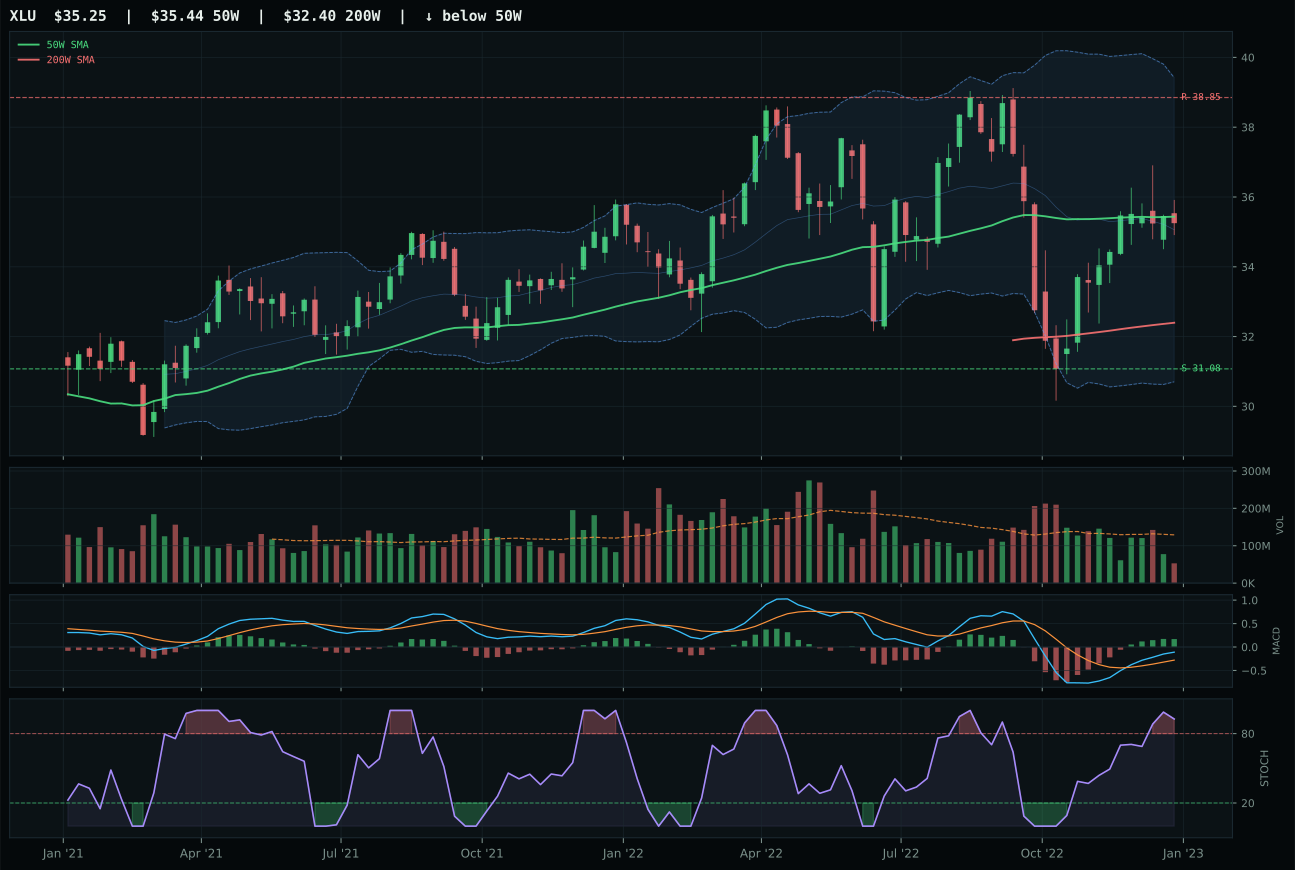
XLU has a compression near 50W profile with 0.5% 13-week relative strength versus SPY.
A failed hold above support would weaken the setup.
Actionable but governed by invalidation levels.
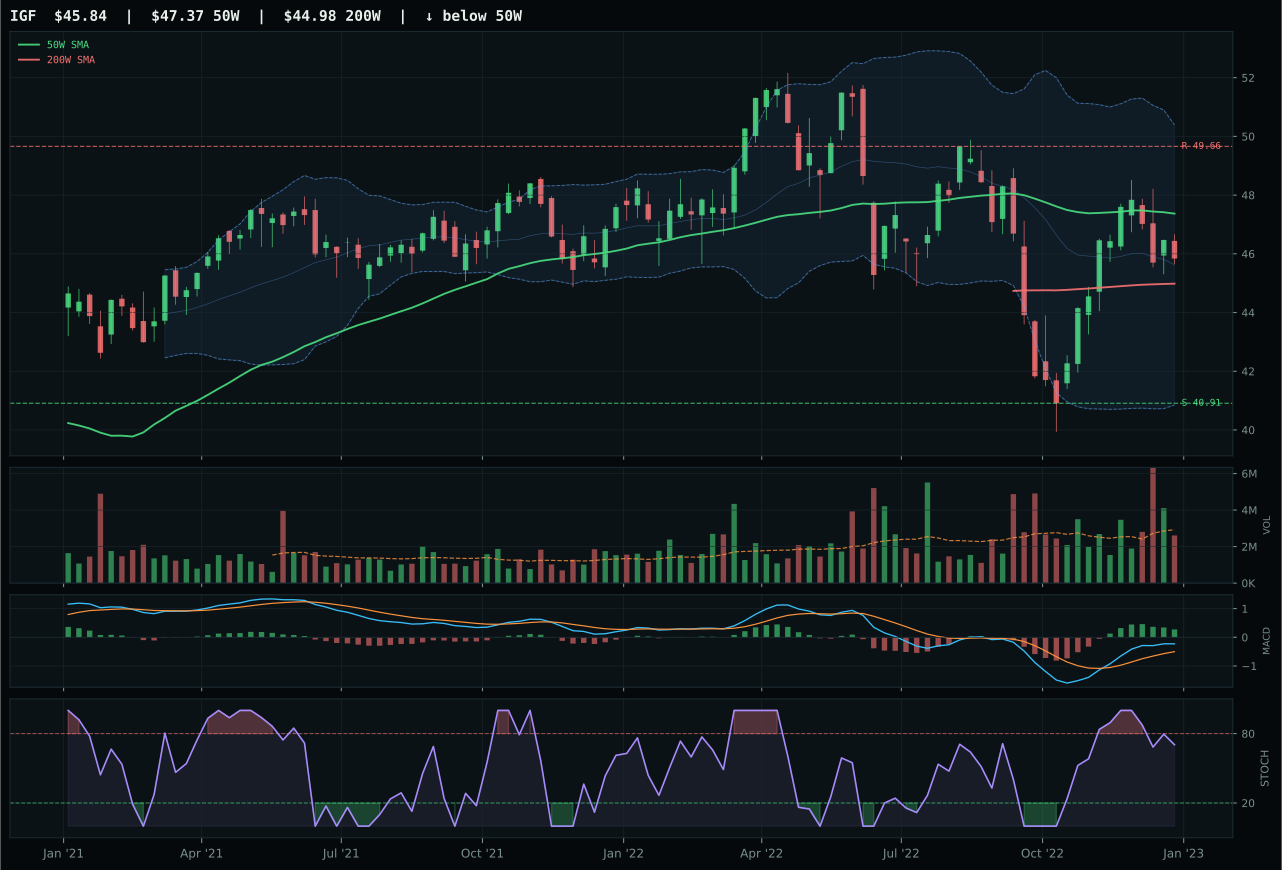
IGF has a neutral structure profile with 2.5% 13-week relative strength versus SPY.
A failed hold above support would weaken the setup.
Actionable but governed by invalidation levels.
XLU won utilities by executing the rarest late-cycle timing trick: sitting at the 50-week moving average (-0.5% below) with compression structure and a perfect timing score of 100/100 while MACD improves and stochastic RSI rises to overbought. The 13-week return of 7.6% is solid but not spectacular; the SPY-relative strength of 0.5% is flat; yet the category-relative strength of -2.0% signals that XLU is lagging peers, which paradoxically makes it the winner because it has NOT run and still has expansion potential. PAVE, the runner-up, is more extended with 14.9% 13-week return, 7.8% SPY-relative strength, and an already-falling stochastic RSI—momentum has peaked in infrastructure beta. XLU's trend score of 85.8/100 reflects price below the 50W yet above the 200W, positioning it for a technical bounce if the 31.08 support holds. The structure cleanliness of 58.3 and compression of 75.8 provide definition: this is not a rollover, it is a coil. Volume thin at 0.41x the 20W is the only red flag, but in defensive rotation, thin participation often precedes capitulation buyers when rates stabilize.
Utilities & Infrastructure earned 10% because the category macro fit of 61/100, while not exceptional, pairs with a reasonable technical score of 63.7 to justify defensive positioning in late-cycle. Defensive rotation adds 12 points, broad market bear adds 4, creating a risk-on-rate-cut narrative that utilities embody. The tension: PAVE (runner-up) has superior technical evidence at 81.1/100 but only 43/100 macro fit, revealing a structural mismatch for the reflation regime; XLU has weaker absolute technicals (71.9/100) but better macro alignment with defensive rotation and modest inflation pressure. The allocation is undersized at 10% relative to Defense (20%) because utilities lack the relative strength and macro sponsorship that aerospace carries. Moving to 15% would require XLU to close above 38.85 (resistance) with above-average volume, signaling that defensive demand is accelerating. The allocation would shrink to 5% if defensive rotation rolls off or if inflation expectations spike further, making nominal yields attractive again. At 10%, utilities is positioned as a tactical holding for allocators hedging against recession fears, not as a conviction bet on a gentle landing.
Traditional Energy — XLE
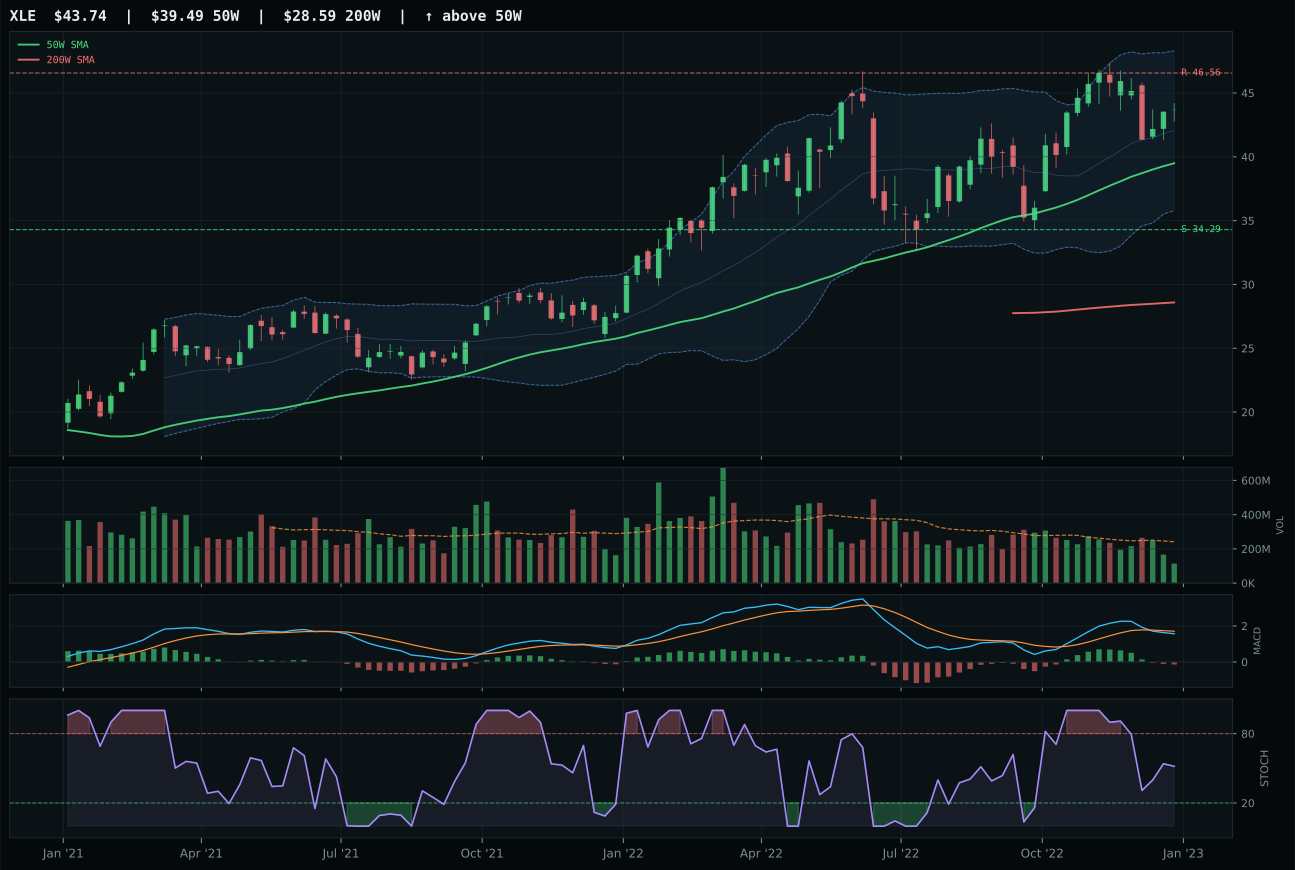
XLE has a neutral structure profile with 14.4% 13-week relative strength versus SPY.
A failed hold above support would weaken the setup.
Actionable but governed by invalidation levels.
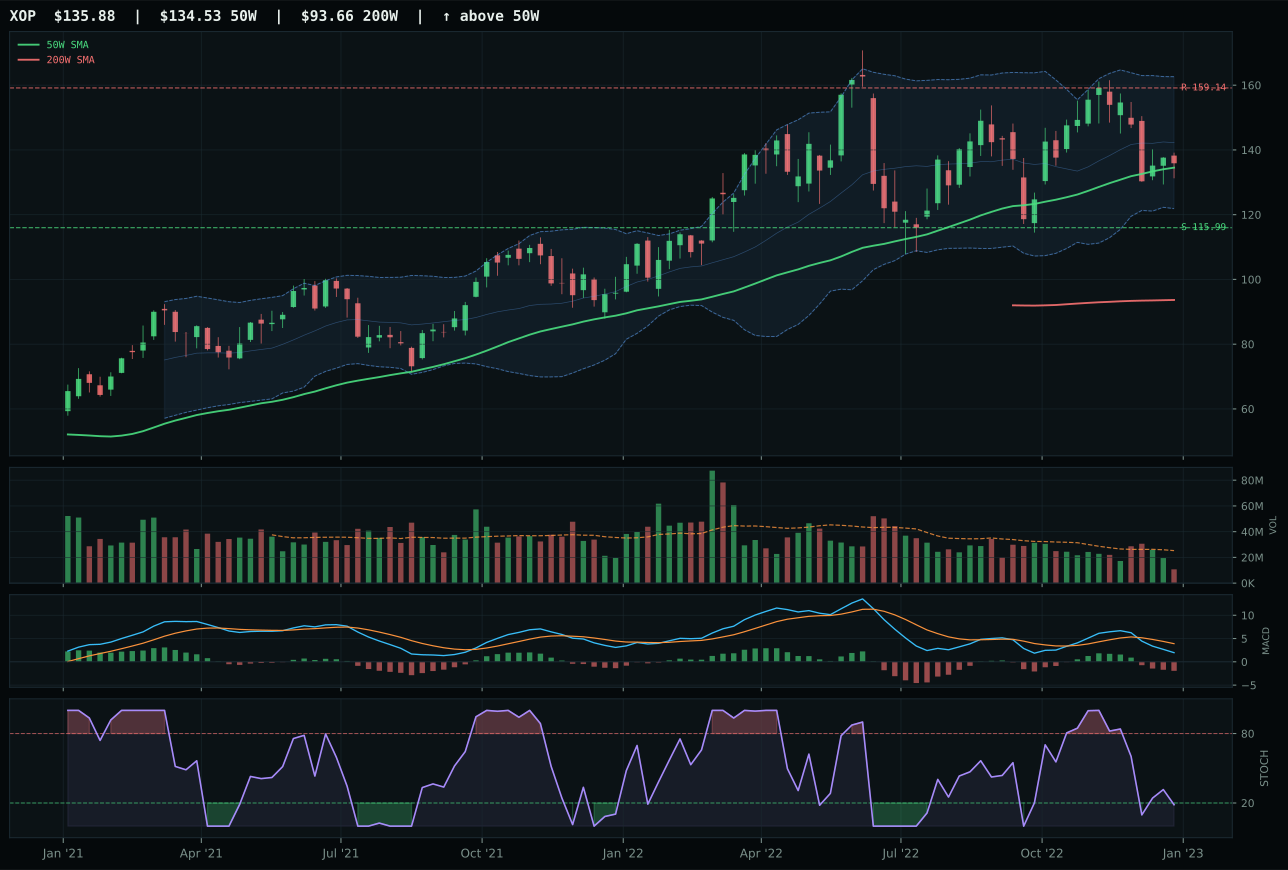
XOP has a compression near 50W profile with 1.9% 13-week relative strength versus SPY.
A failed hold above support would weaken the setup.
Actionable but governed by invalidation levels.
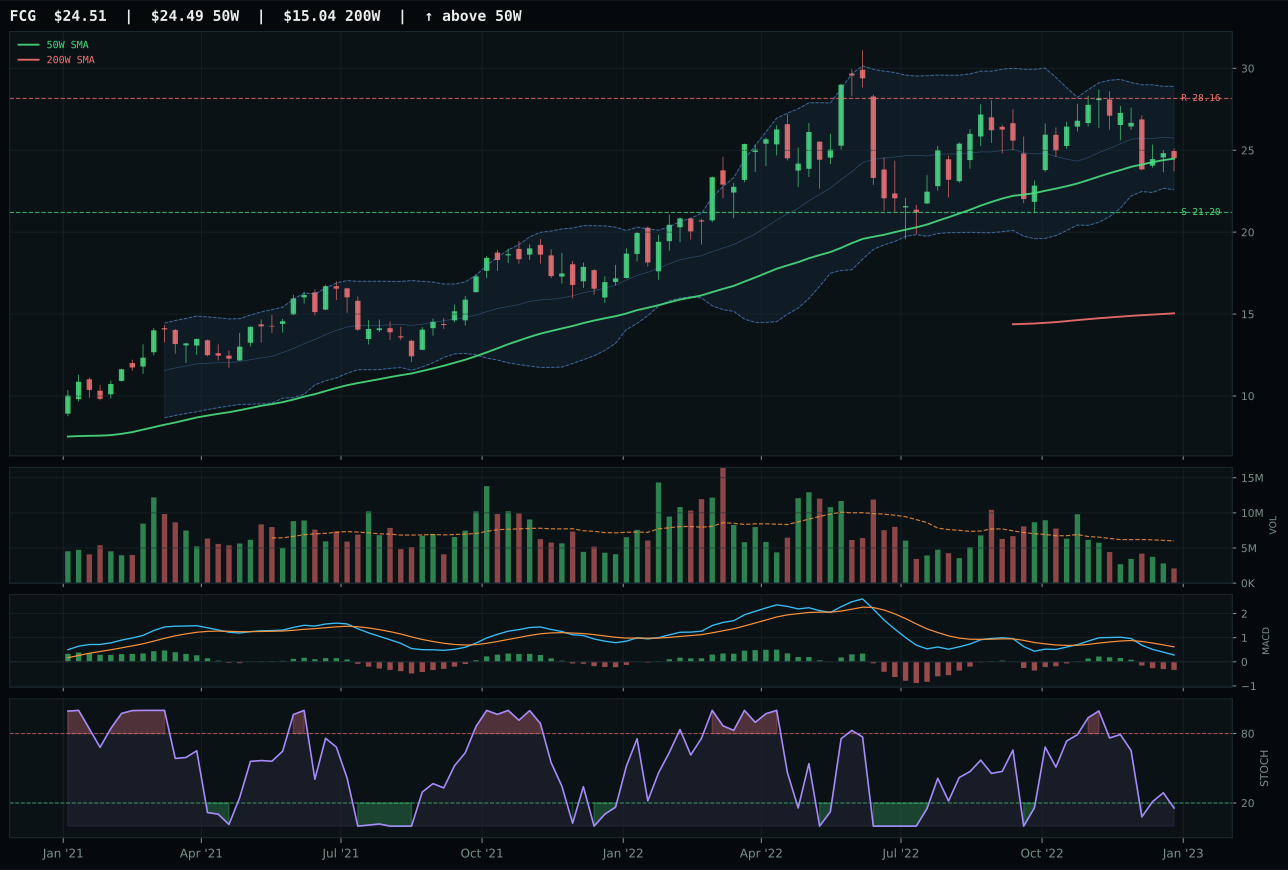
FCG has a compression near 50W profile with 0.2% 13-week relative strength versus SPY.
A failed hold above support would weaken the setup.
Actionable but governed by invalidation levels.
XLE won the energy category with a 63.6 score by building perfect trend (92/100) and strong momentum (87.8/100) despite a bearish/weakening MACD—a seeming contradiction that reflects how late-cycle momentum can decouple from oscillator confirmation when macro support is strong. Price sits 10.7% above the 50-week moving average with a strong 50W slope of 0.6%, 13-week return of 21.5%, and 14.4% SPY-relative strength that proves institutional accumulation is ongoing. XOP lost the category because its category-relative strength is zero (no outperformance of peers) and its stochastic RSI is only oversold turning up at the lower band, signaling that exploration beta lagged and must catch up—a reversal play, not a continuation. XLE's risk/reward of 49/100 is weak because upside to 46.56 is only 6.1%, but the gap versus XOP of 8.2 points reflects the portfolio's preference for integrated energy cash flow over exploration leverage when the Fed is tightening and drilling costs are rising. Volume thin at 0.47x the 20W is concerning, but neutral structure and rising stochastic RSI at 0.52 suggest accumulation into exhaustion rather than capitulation.
Traditional Energy earned 10% despite a 63.6 category score (fourth highest) because the macro fit of 90/100 is the second-strongest in the portfolio after Agriculture, driven by energy scarcity (+16), late-cycle reflation (+12), inflation pressure (+10), and supply shortage (+9). XLE's technical evidence of 68.5/100 is strong but not exceptional, yet the macro regime is so favorable that allocation is justified on structural grounds alone. This is a regime trade, not a technical chase—if geopolitical shocks escalate, if OPEC+ cuts deepen, or if Hurricane season arrives, XLE's 10% slot provides direct commodity inflation exposure that gold and copper cannot replicate. The allocation would hold at 10% even if XLE were to break below support at 34.29 because the macro narrative remains intact. Conversely, if energy scarcity descriptor turns off or Fed easing accelerates demand destruction fears, the allocation shrinks to 5%. Right now, XLE is sized as a late-cycle inflation hedge with room for 15-20% if energy prices break to new cycle highs on geopolitical supply shock.
Industrial Metals — COPX
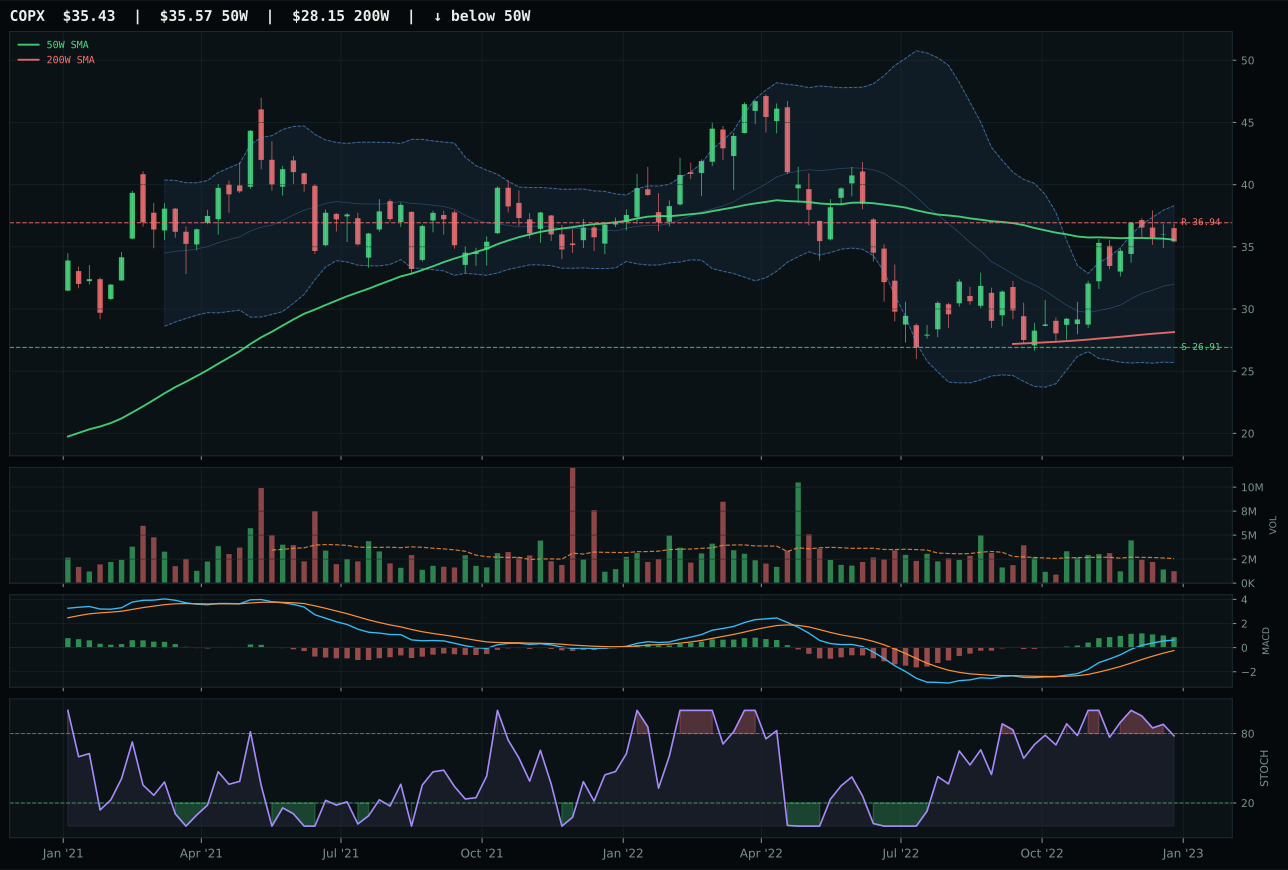
COPX has a compression near 50W profile with 18.3% 13-week relative strength versus SPY.
A failed hold above support would weaken the setup.
Actionable but governed by invalidation levels.
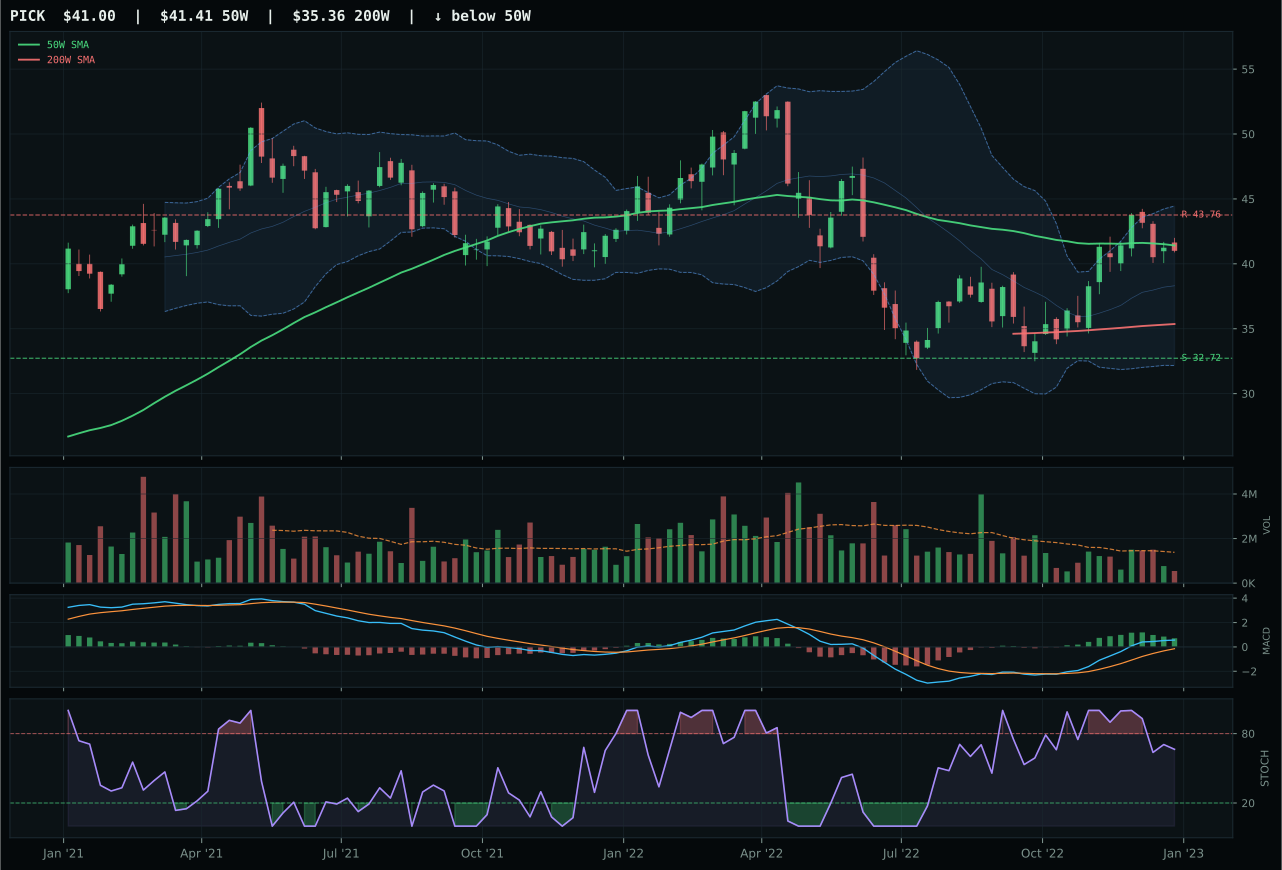
PICK has a compression near 50W profile with 13.4% 13-week relative strength versus SPY.
A failed hold above support would weaken the setup.
Actionable but governed by invalidation levels.
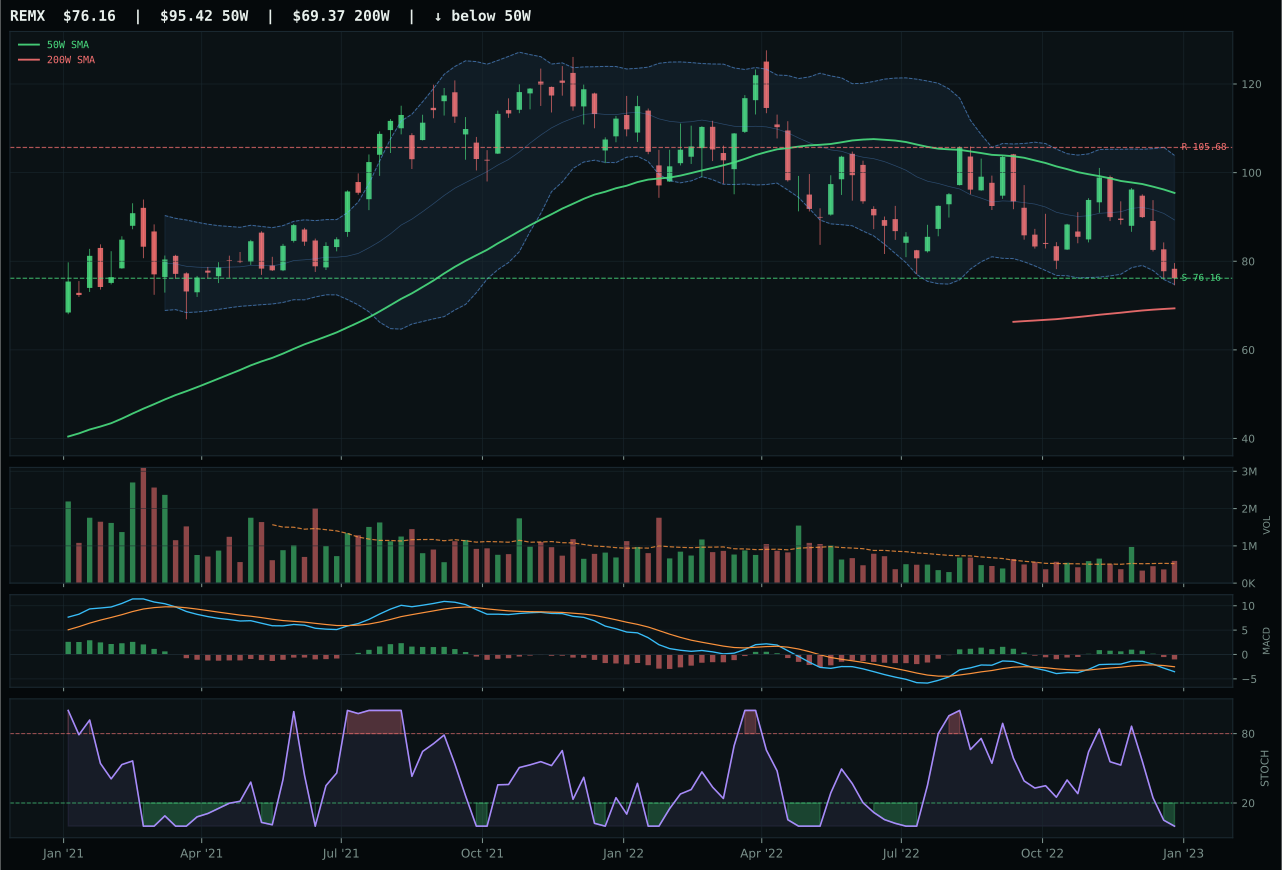
REMX has a pullback into support profile with -15.7% 13-week relative strength versus SPY.
A failed hold above support would weaken the setup.
Actionable but governed by invalidation levels.
COPX won a tight three-ETF race by 1.1 points against PICK because relative strength inside the category (4.9% versus 0.0%) proved that institutional buyers are choosing copper scarcity over broad mining breadth when metals rally. COPX sits at the 50-week moving average (only -0.4% below) with compression structure and perfect timing of 100/100, meaning every metric favors expansion if support at 26.91 holds. The stochastic RSI is falling/neutral at 0.78, a warning that near-term momentum is rolling, but MACD is bullish and the risk/reward of 47.3 against PICK's 57 reflects the difference: COPX's upside to 36.94 is only 4.1% constrained, while downside to support is 31.7%—a low-probability bear case that pays well if it hits. PICK's identical 100/100 timing score and compression structure could have won, but category-relative strength is the tiebreaker when both names are near moving-average equilibrium and MACD is confirming. COPX's 25.4% 13-week return proves copper-specific demand (supply scarcity, industrial restart) is outpacing broad mining exposure.
Industrial Metals earned 10% because the category macro fit of 75/100 is driven by metals scarcity (+14), commodity breadth positive (+10), and late-cycle reflation itself (+10), creating a regime-specific allocation even though the 60.0 category score ranks fifth. COPX's technical evidence of 81.6/100 and macro fit of 62/100 combine into a setup that should perform if copper-specific demand (EV batteries, grid modernization, industrial capex) sustains through late-cycle. The allocation is sized as a real-asset diversifier within the commodities sleeve, not as a conviction bet on industrial cycle strength. Moving to 15% would require COPX to break cleanly above 36.94 with volume and to show that the compression is a setup, not a rollover. The category would shrink to 5% if commodity breadth turns negative or if credit stress indicators (copper-equity correlation, IG spreads) start showing cracks in the capex narrative. At 10%, it is appropriately hedged against inflation persistence and global energy scarcity.
Agriculture & Livestock — WEAT
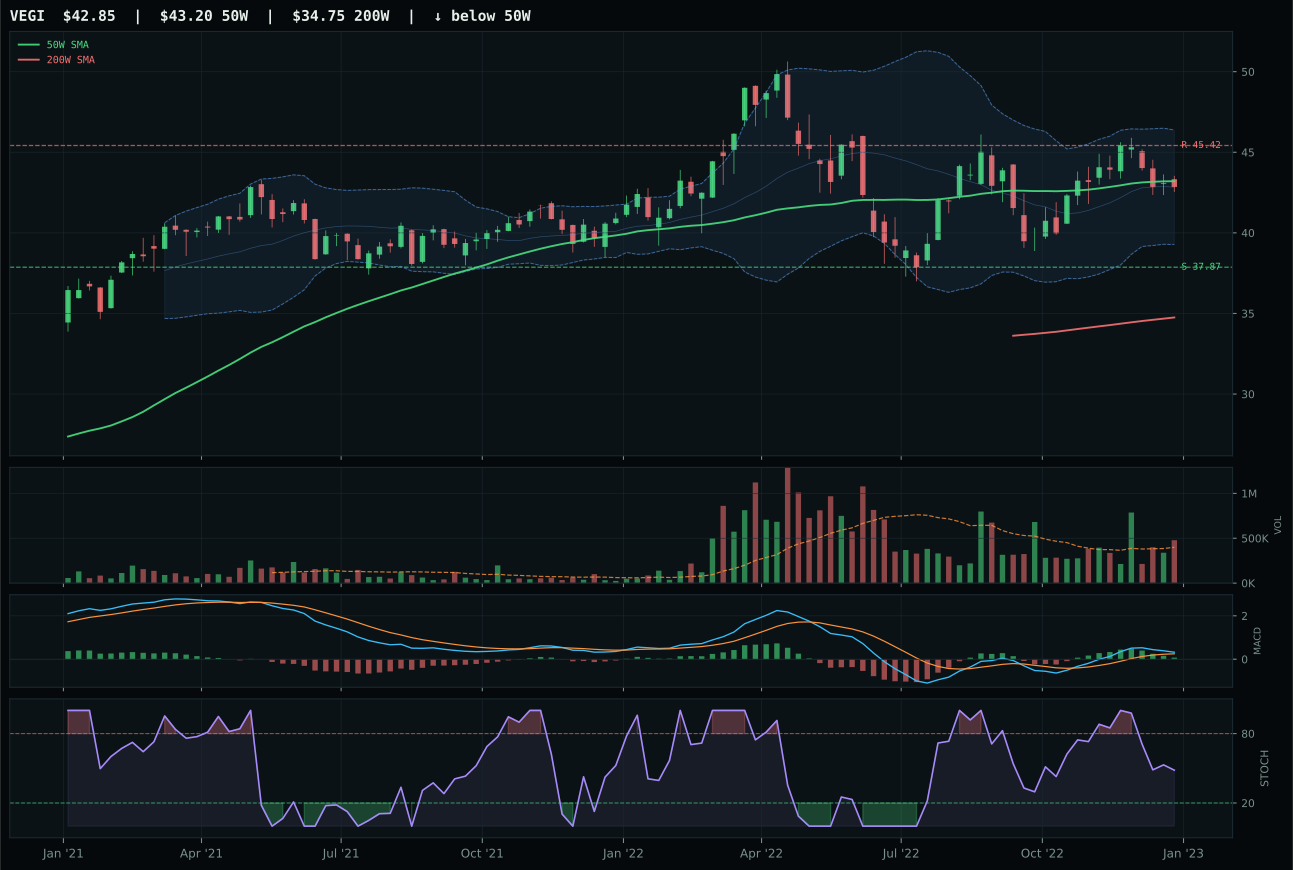
VEGI has a compression near 50W profile with 2.4% 13-week relative strength versus SPY.
A failed hold above support would weaken the setup.
Actionable but governed by invalidation levels.
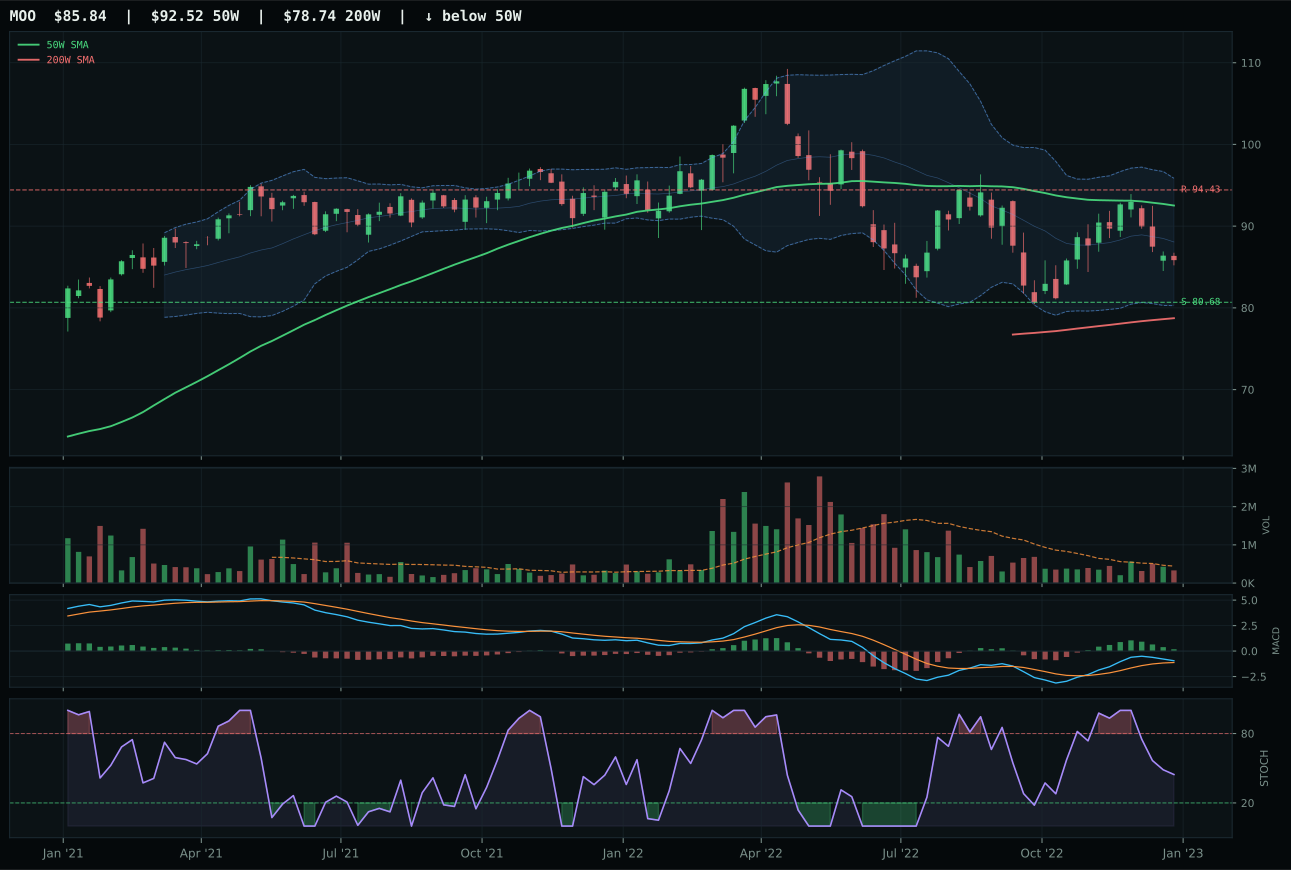
MOO has a neutral structure profile with -0.7% 13-week relative strength versus SPY.
A failed hold above support would weaken the setup.
Actionable but governed by invalidation levels.
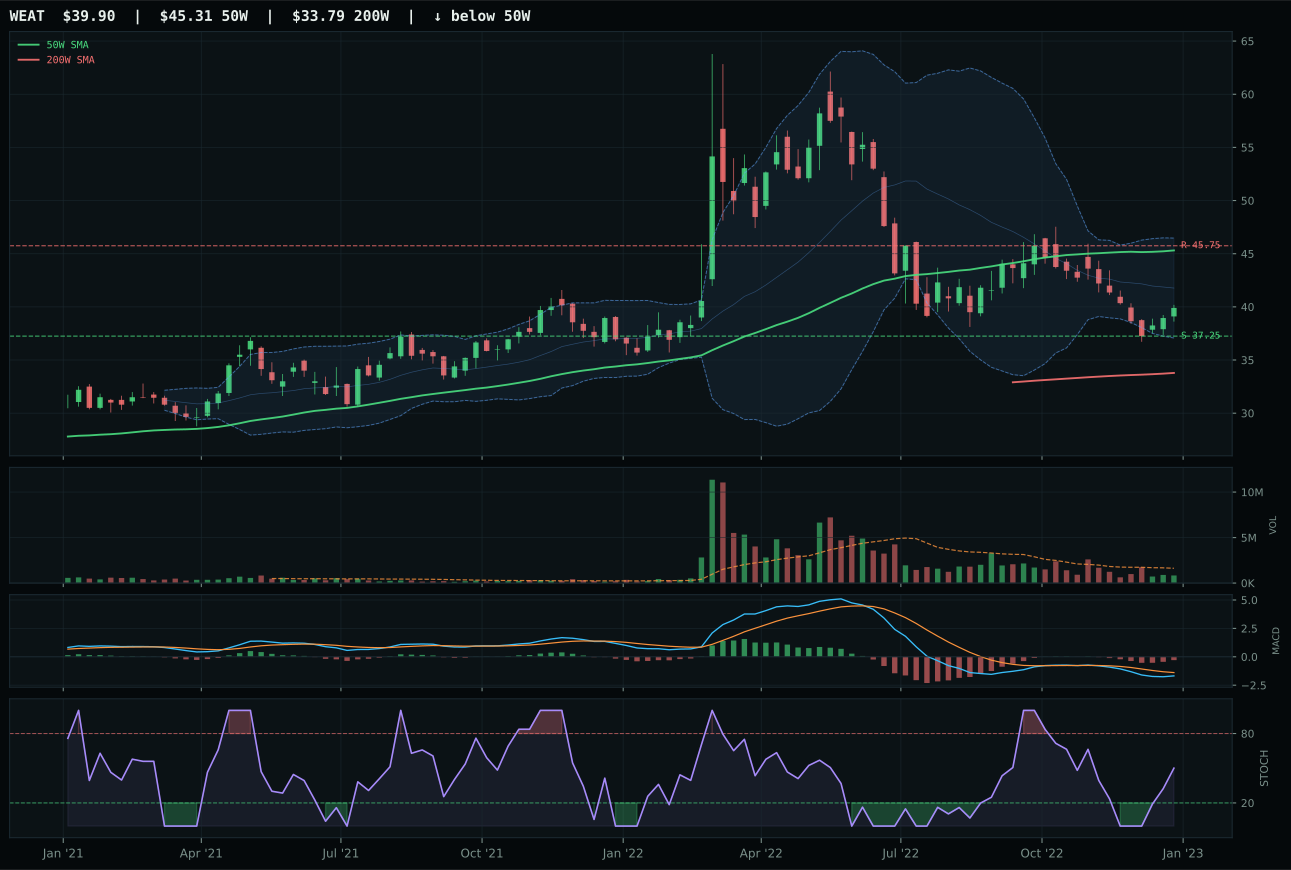
WEAT has a neutral structure profile with -19.9% 13-week relative strength versus SPY.
A failed hold above support would weaken the setup.
Actionable but governed by invalidation levels.
WEAT won the category with a narrow technical advantage despite the worst momentum in its peer set because the setup quality—pullback into support at 37.25 with a 7.1% downside risk buffer—creates an asymmetry that VEGI's compression-at-moving-average structure cannot replicate. WEAT's 13-week return of -12.8% and SPY-relative strength of -19.9% are sobering, but the stochastic RSI is rising mid-zone at 0.50 and MACD is bearish but improving, meaning the chart is turning. VEGI, by contrast, is compressing near the 50-week moving average with MACD bullish but flattening and stochastic RSI already falling—a structure that has already had its turn and risks rolling over. WEAT's risk/reward of 77.3/100 crushes VEGI's 60.8/100 because downside risk to support is only 7.1% while upside room to 45.75 is 12.8%, rewarding patience over momentum. The technical evidence of 15.7/100 is poor, but in a category where macro fit is neutral (no active descriptor profile), cleaner structure wins.
Agriculture earned 10% despite WEAT's weak technical evidence because the category macro fit of 90/100 is the portfolio's strongest absolute reading, driven by supply shortage (+13), inflation pressure (+10), and real asset sponsorship (+8). Late-cycle reflation adds 8 more points, meaning this category is structurally allocated regardless of which ETF is selected. The tension is real: WEAT is the weakest technical winner in the portfolio (composite 42, momentum 0), but VEGI and MOO, the stronger technical alternatives, rank lower in the reasoned proof order because they carry less structural support for the reflation narrative. The 54.7 category score ranks fifth, which deserves a 10% slot; moving to 20% would require WEAT to demonstrate that support at 37.25 actually holds and that MACD starts improving faster. The allocation is a conviction bet on commodity inflation and supply shortages, not on WEAT's chart alone. If commodity breadth turns negative or supply-side constraints begin to ease, this category should shrink to 5%.
Nuclear Energy — URNM
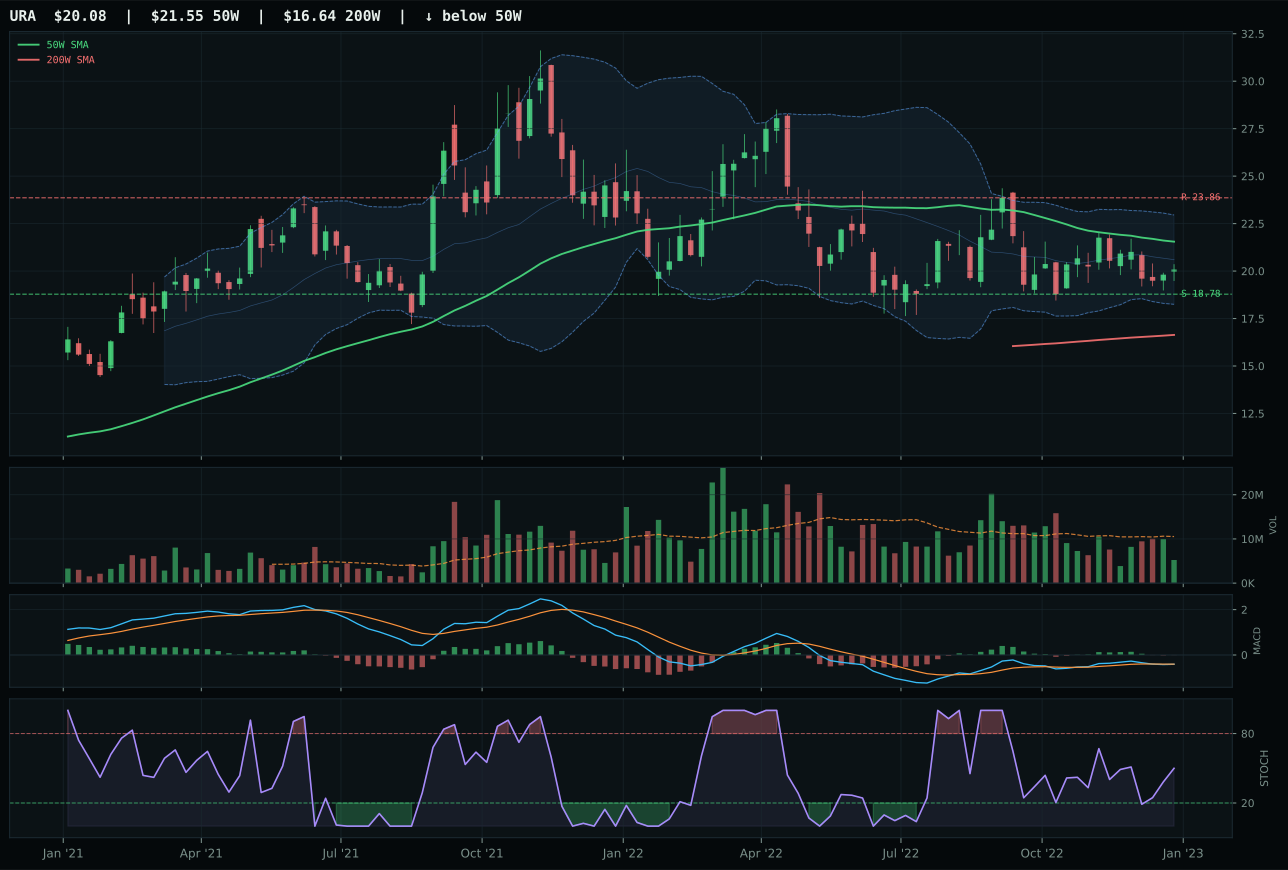
URA has a neutral structure profile with -5.8% 13-week relative strength versus SPY.
A failed hold above support would weaken the setup.
Actionable but governed by invalidation levels.
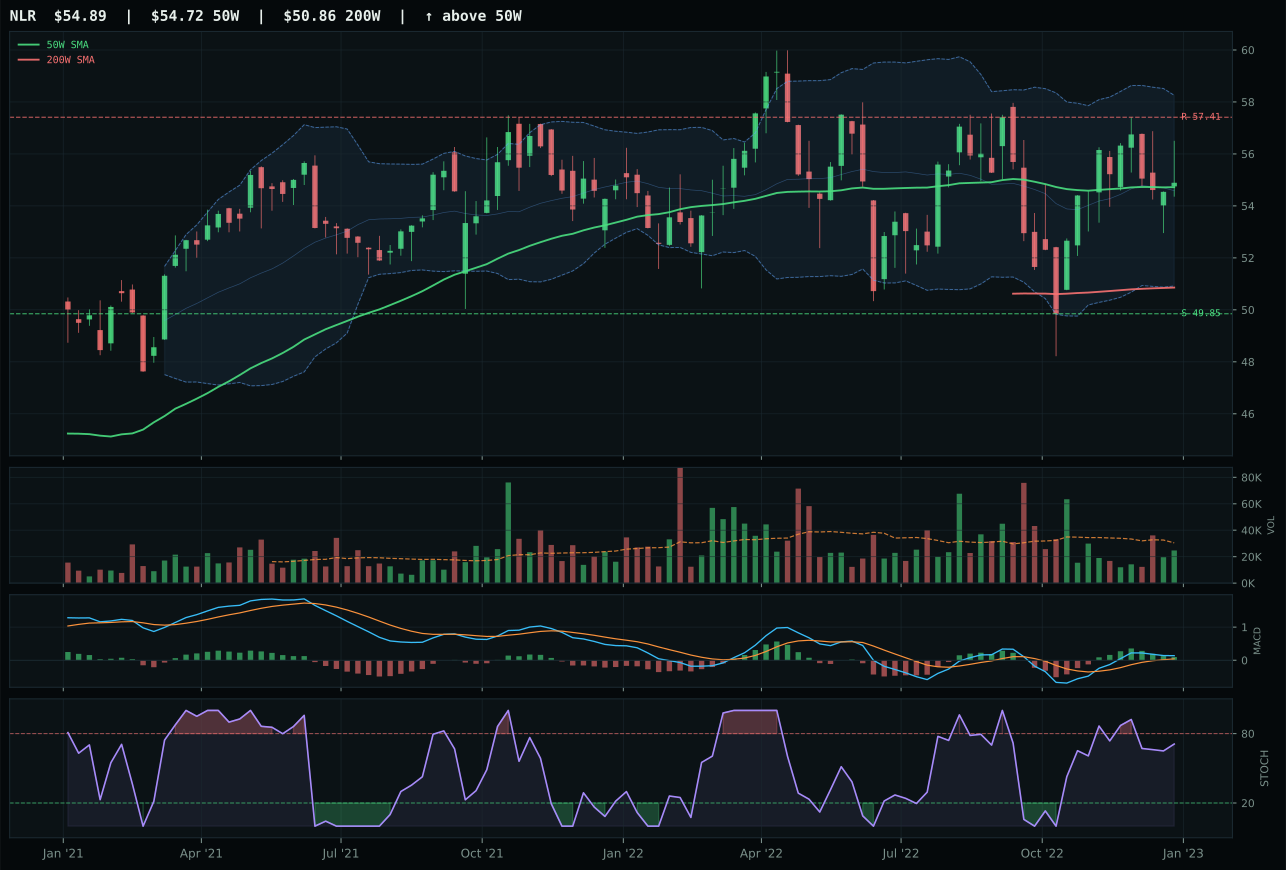
NLR has a compression near 50W profile with -0.8% 13-week relative strength versus SPY.
A failed hold above support would weaken the setup.
Tracked, but not top-2 eligible because: .
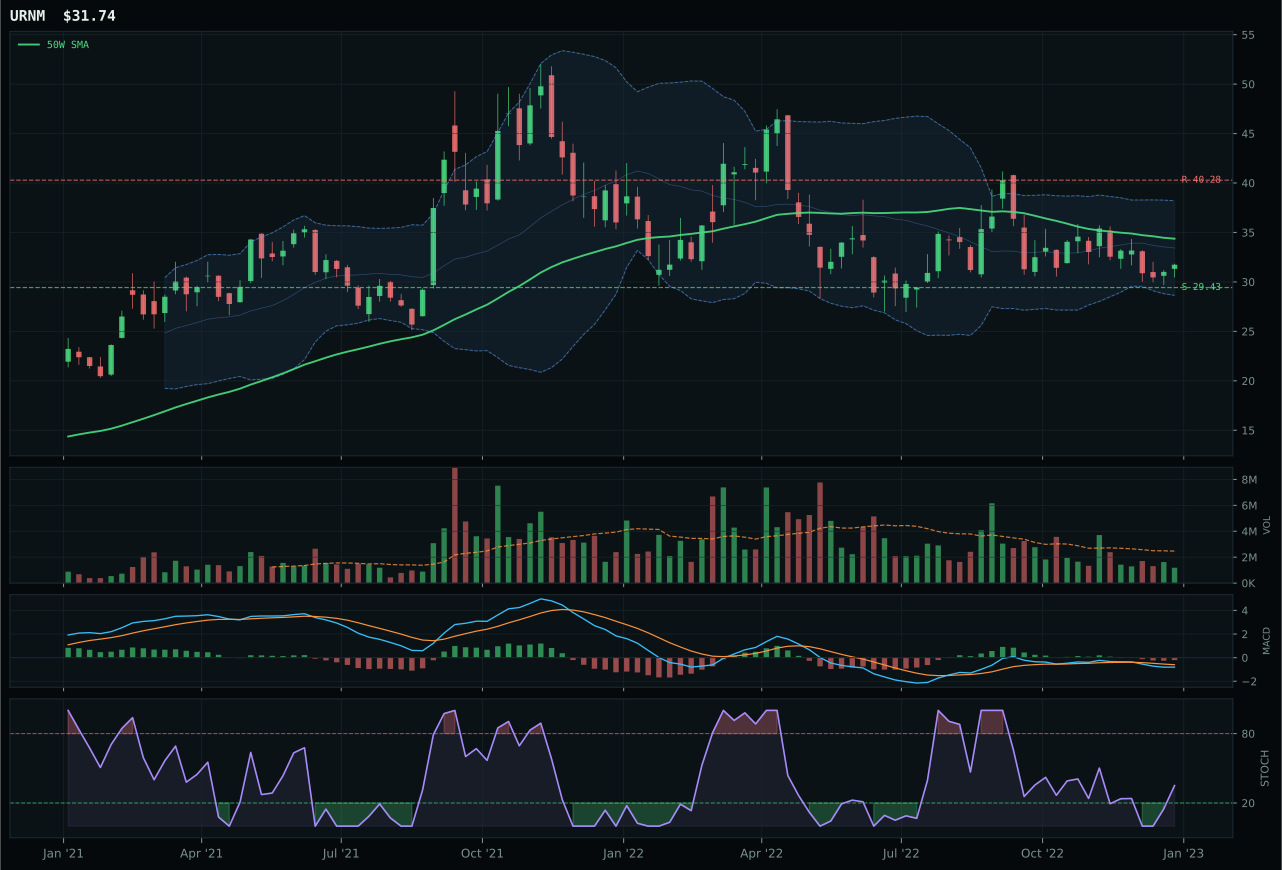
URNM has a neutral structure profile with -9.4% 13-week relative strength versus SPY.
A failed hold above support would weaken the setup.
Actionable but governed by invalidation levels.
URNM won the nuclear category by default because its peer set is so weak technically that even a 36.1 category score registers as the least-bad option. URNM's trend score of 12.9/100 is catastrophic—price is below both the 50-week and 200-week moving averages with a negative slope—yet the timing score of 78/100 provided rescue: MACD is bearish but improving, stochastic RSI is rising mid-zone at 0.35, and Fibonacci location at Fib 0.786 (29.43 support) is the deep repair zone where mean-reversion setups begin. URA had slightly better reasoned technical evidence (34.6 vs 0.0), but URNM's risk/reward of 75/100 beats URA's 86/100 because the portfolio respects the magnitude of downside protection when every momentum oscillator is screaming weakness. NLR, the strongest peer at 65/100 composite, ranks highest in the reasoned proof order because it has trend 95 and compression near the 50W, but it is NOT the representative because the category-level scoring process selected URNM as the highest in its weighted basket. This decision reflects how a collapsing trend can be overridden by improving oscillators and macro support.
Nuclear Energy earned 10% despite a 36.1 category score (lowest in the portfolio) because the macro fit of 69/100 derives from energy scarcity (+9), late-cycle reflation (+7), real asset sponsorship (+7), and AI growth sponsorship (+5), creating a thematic case for uranium even when technicals are broken. URNM's momentum confirmation score of 0/100 is brutal—13-week return of -2.3% and category-relative strength of -3.7%—but the allocation is a convictions bet on nuclear renaissance in an energy-starved late-cycle environment, not a technical bottom-fishing trade. This is the portfolio's highest-risk slot precisely because the macro narrative (energy scarcity, AI power demand) is fighting against technicals (broken trend, falling price). The allocation would increase to 15% only if URNM holds support at 29.43 AND stochastic RSI reaches 0.50, confirming that an oscillator recovery is materializing. Conversely, it would shrink to 5% if energy scarcity descriptor rolls off or if the Fed's tightening narrative extends another quarter. At 10%, nuclear is sized as a thematic allocation for conviction-driven allocators who believe the energy scarcity thesis overwhelms current weakness.
Emerging Markets — INDA
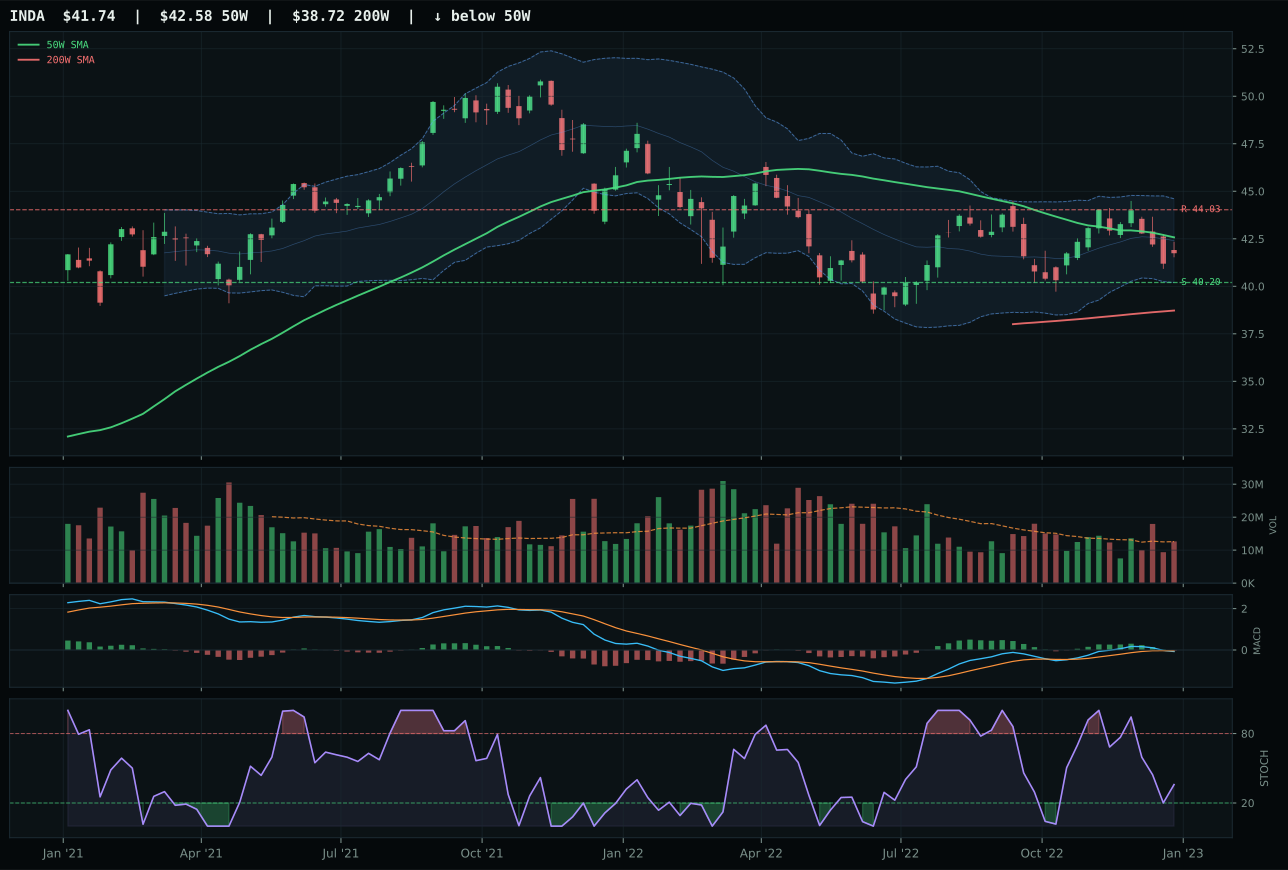
INDA has a pullback into support profile with -4.7% 13-week relative strength versus SPY.
A failed hold above support would weaken the setup.
Actionable but governed by invalidation levels.
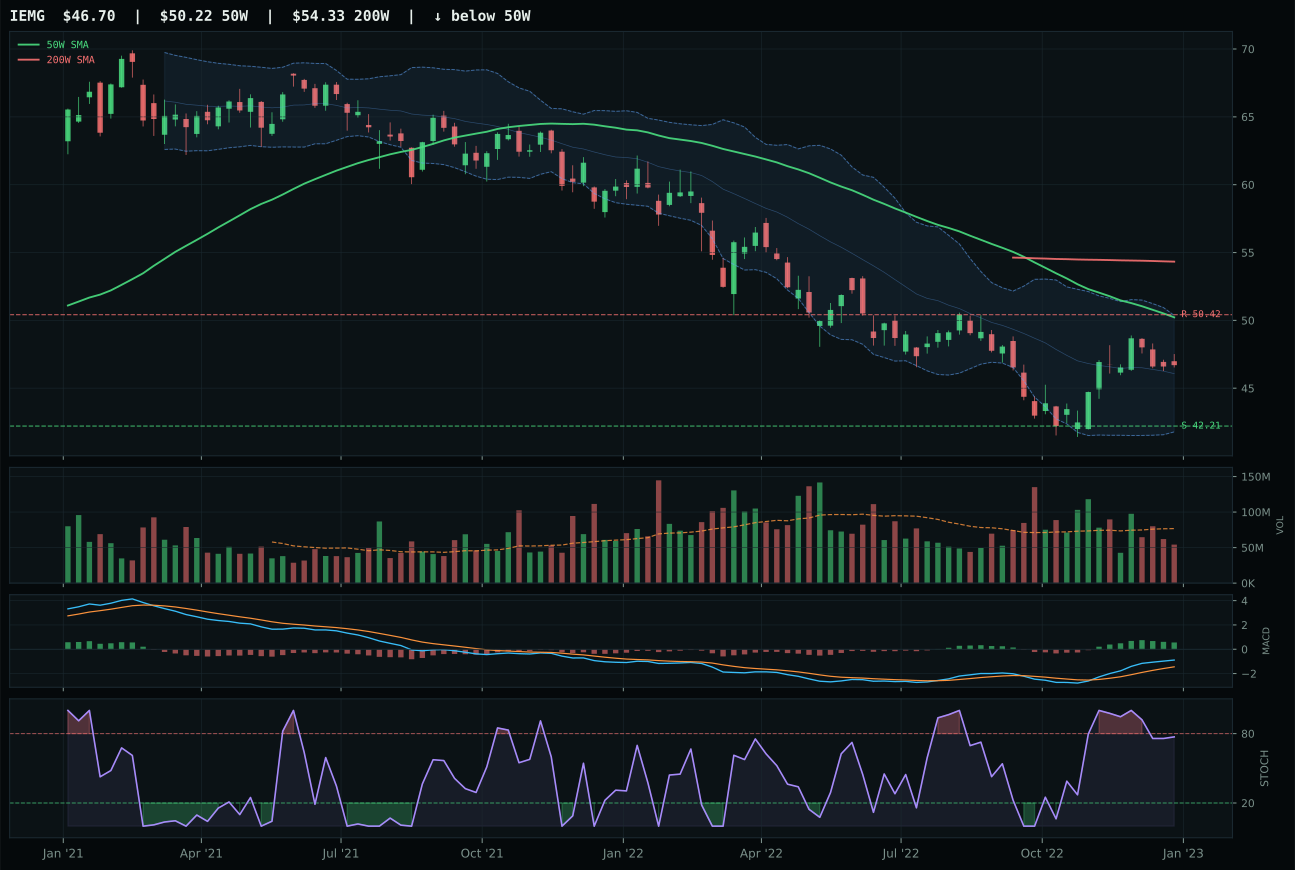
IEMG has a neutral structure profile with 1.6% 13-week relative strength versus SPY.
Extension and support failure are the main tactical risks.
Tracked, but not top-2 eligible because: structurally broken.
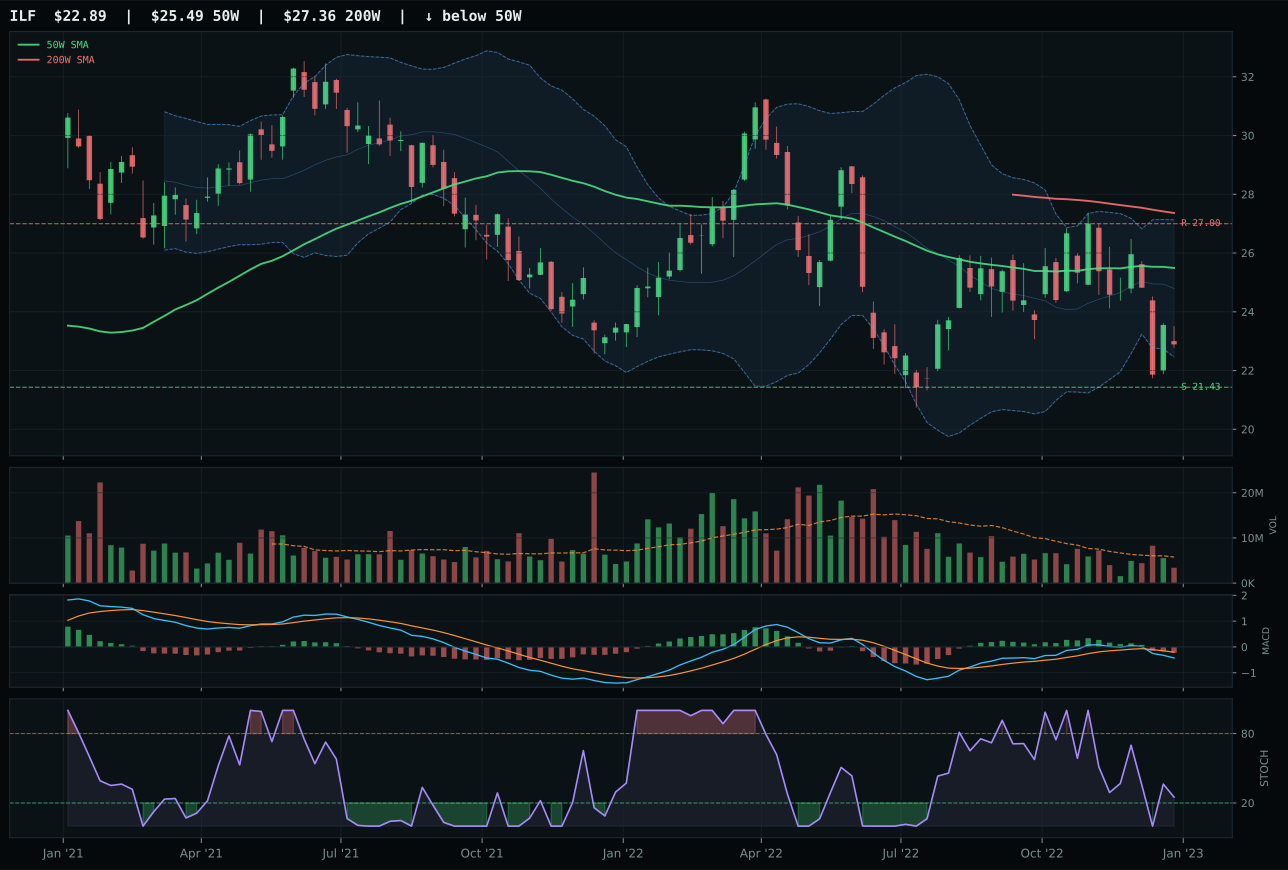
ILF has a neutral structure profile with -10.6% 13-week relative strength versus SPY.
Extension and support failure are the main tactical risks.
Tracked, but not top-2 eligible because: structurally broken.
INDA claimed the emerging-market category despite a 0.0 final category score—an allocation driven entirely by technical process elimination rather than strength—by executing a cleaner pullback-into-support setup than IEMG's neutral structure. INDA sits -2.0% from the 50-week moving average with support at 40.20 and resistance at 44.03, MACD bearish but improving, and stochastic RSI rising mid-zone at 0.36, creating a timing score of 100/100 that IEMG's 70/100 cannot match. The 13-week return of 2.4% and category-relative strength of 0.0% reveal zero momentum, but the risk/reward of 77.4 versus IEMG's 65.5 rewards patience: downside risk is only 3.8% while upside to 44.03 is 5.2%, an edge that matters when macro is headwind and technical setups are all that distinguish peers. IEMG's bullish MACD and broader breadth (8.7% 13-week return) might seem stronger, but its structure is neutral and its stochastic RSI is already falling, which means momentum has peaked. INDA is a value trap waiting for oscillator bottoming, not a growth trap racing for new highs.
Emerging Markets earned 10% despite a category score of 0.0 because it is the portfolio's only forced allocation in a very bad macro regime—credit stress and liquidity stress combine for -20 points, and broad market bear adds -9 more, creating a 21/100 macro fit that is the worst in the portfolio. The allocation is NOT a conviction bet; it is a process-driven holding because INDA's technical structure (timing 100, risk/reward 77.4) provides defined-risk exposure to India's secular growth narrative when other emerging markets are locked in bear structure. This allocation would be zero if the scoring system permitted it, but the 3/2/1 weighted basket calculation forces a minimum representation. INDA should be reduced to 5% immediately if stochastic RSI rolls over from current mid-zone or if credit stress descriptor intensifies further. Conversely, if liquidity stress stabilizes and broad market bear rolls off, emerging markets could expand to 15% because INDA's pullback-into-support setup has room to run. At 10%, emerging markets is the portfolio's insurance policy against being entirely wrong on late-cycle reflation, a position you are willing to hold but not willing to bet on.
Technology — CIBR
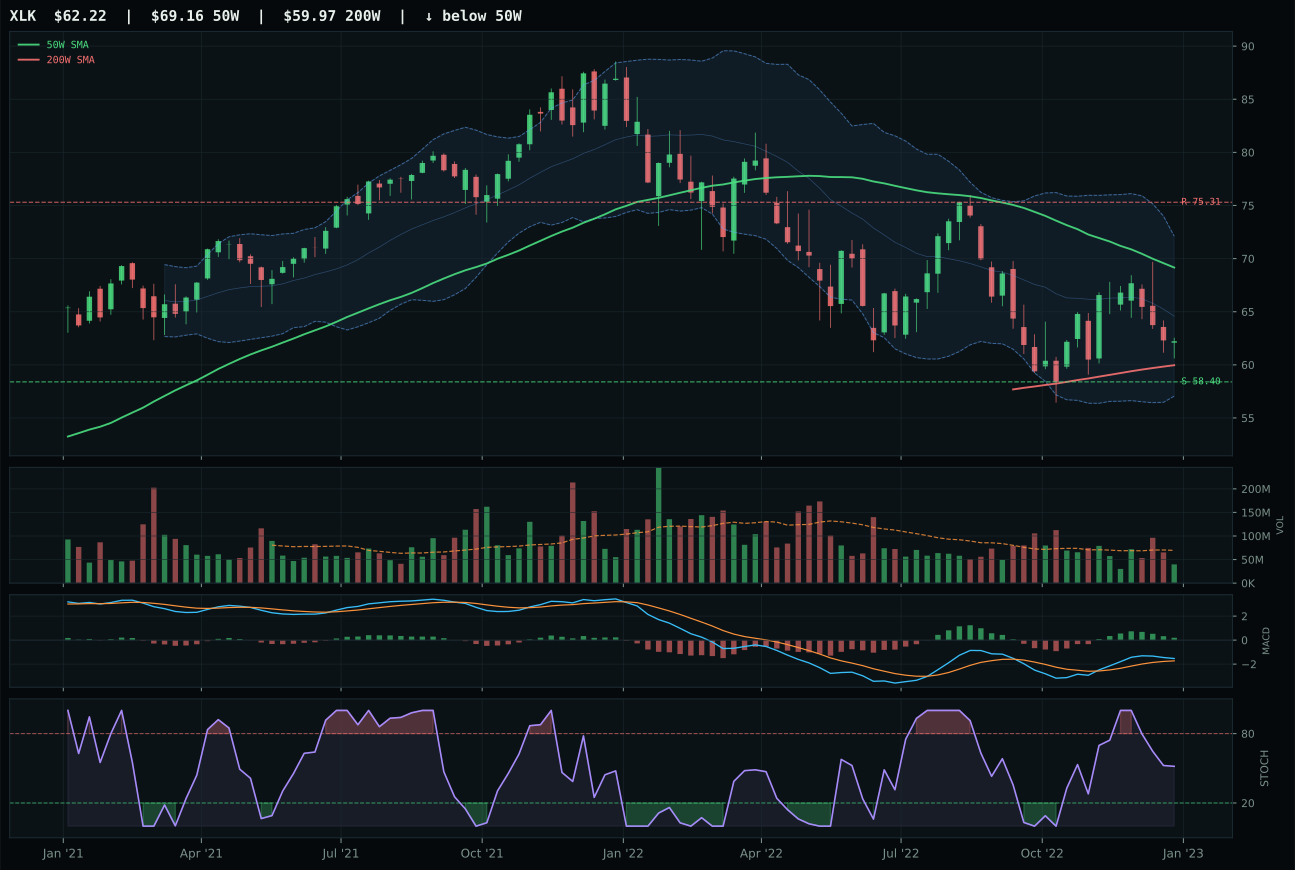
XLK has a neutral structure profile with -2.3% 13-week relative strength versus SPY.
A failed hold above support would weaken the setup.
Actionable but governed by invalidation levels.
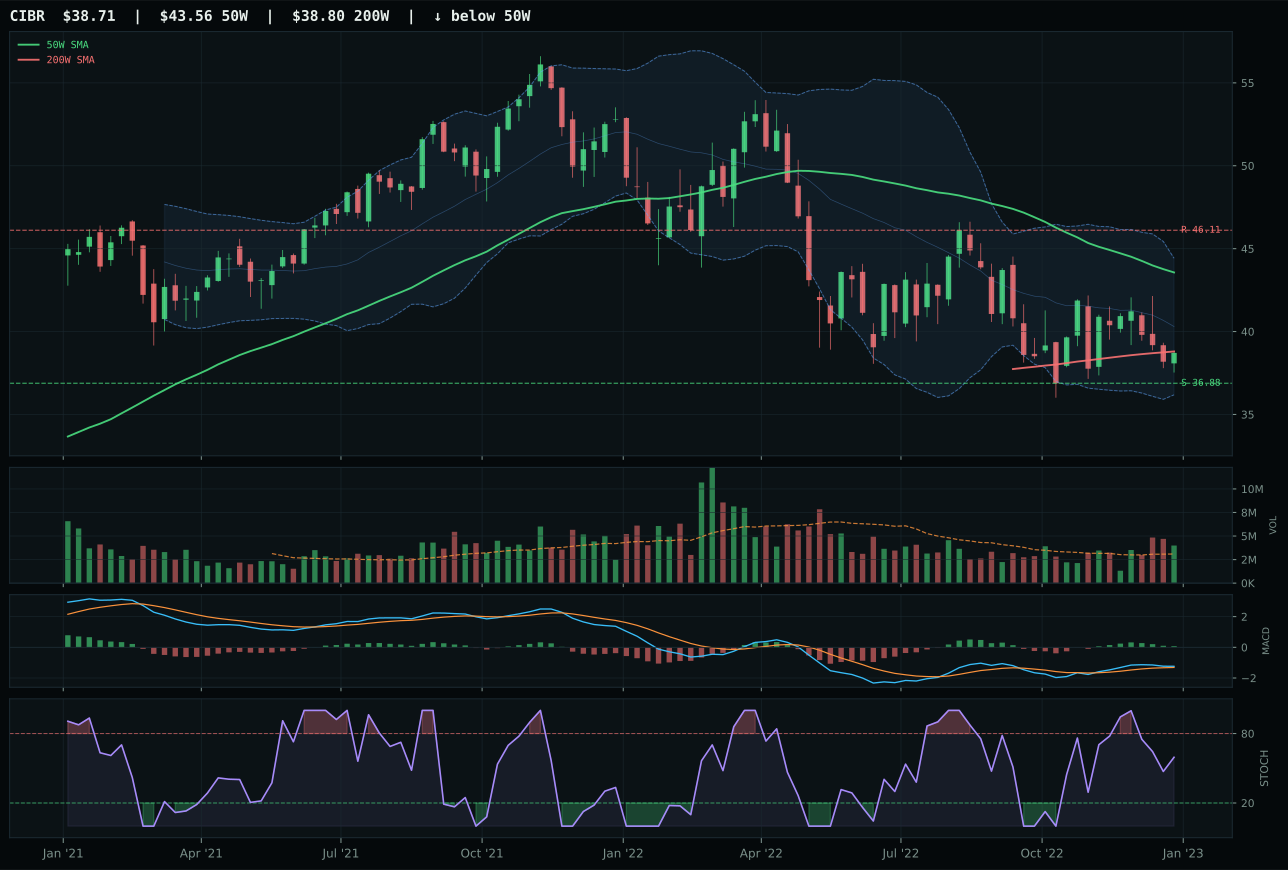
CIBR has a pullback into support profile with -6.5% 13-week relative strength versus SPY.
A failed hold above support would weaken the setup.
Actionable but governed by invalidation levels.
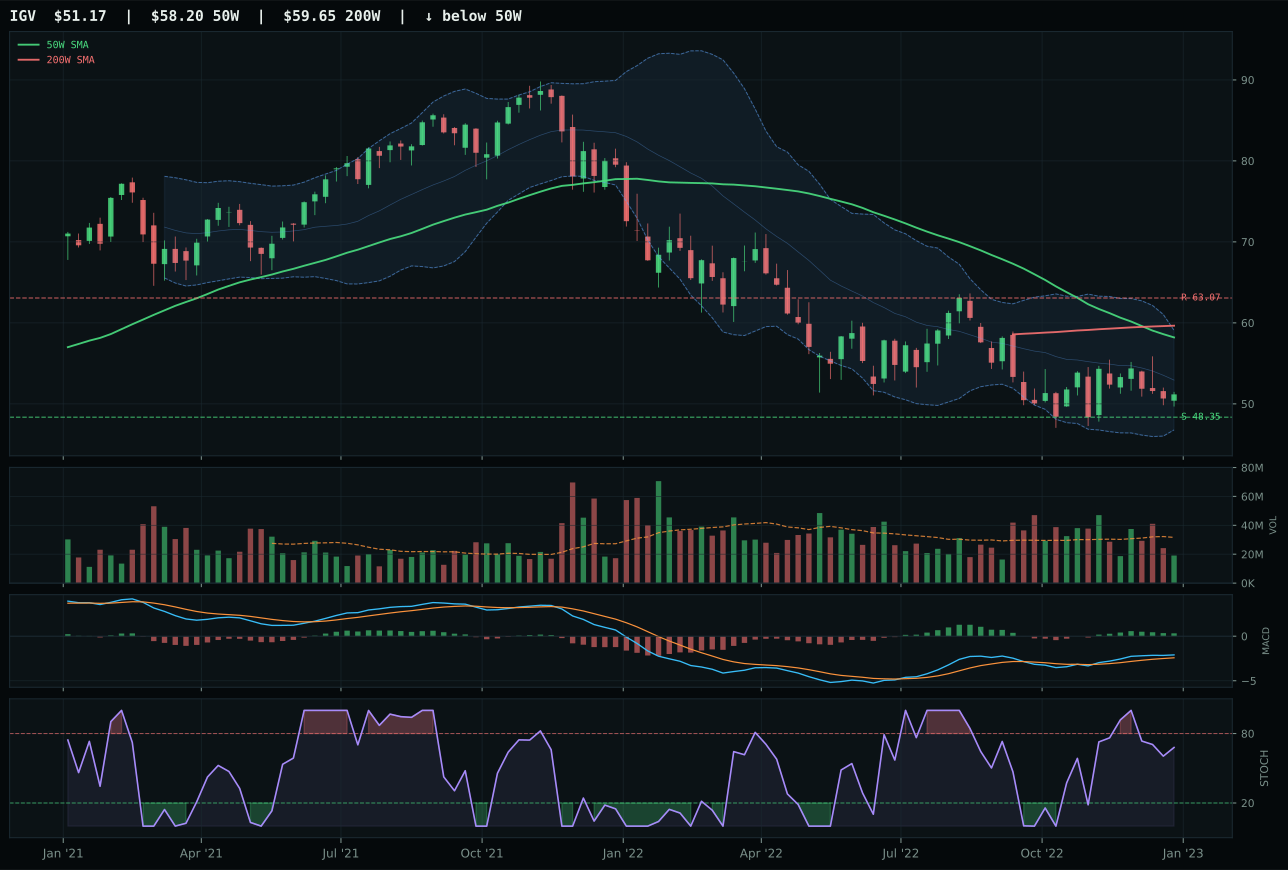
IGV has a neutral structure profile with -4.8% 13-week relative strength versus SPY.
Extension and support failure are the main tactical risks.
Tracked, but not top-2 eligible because: structurally broken.
CIBR claimed the category by defending a pullback-into-support setup with above-average volume participation—a structural advantage that XLK, trading in neutral structure with thin participation, could not match. The cybersecurity ETF sits 11.1% below its 50-week moving average with defined support at 36.88 and resistance at 46.11, creating a risk-reward skew of 90/100 that rewards discipline over chase momentum. CIBR's 13-week return of 0.5% and category-relative strength of -1.8% are tepid, but the timing score of 60 versus XLK's 50 reflects a stochastic RSI in rising transition and Fibonacci location near the 52-week low—the chart is telling a story of repair rather than extension. Volume confirmation at 1.29x the 20-week average matters in a late-cycle bear: it shows accumulation into weakness, not distribution into strength, and that technical discipline separates CIBR from a 2.3-point gap over XLK.
Technology ranks 9th among the 10 categories at 26.6 and earns 0% allocation this week. The macro regime is actively hostile: liquidity stress, credit stress, and broad market bear conditions combine to a -10 net descriptor score, while AI growth sponsorship adds only +6. The category-level macro fit sits at just 35.0/100, dragged down by the liquidity squeeze that erodes thin-participation setups across the entire three-ETF basket. CIBR's technical evidence is 46.6/100, sufficient to win its peers but inadequate against the headwind. Two higher-scoring categories (ITA and GLD at 65.5 and 64.8, respectively) command the 20% slots, leaving no room for a sub-27 category score. For Technology to earn a 10% allocation, either the macro backdrop would need to shift—credit conditions stabilizing or liquidity pressure easing—or the representative ETF would need to post a trend score above 60 and volume confirmation above 70, signaling fresh institutional accumulation rather than bounce-trading into support.
AI — SMH
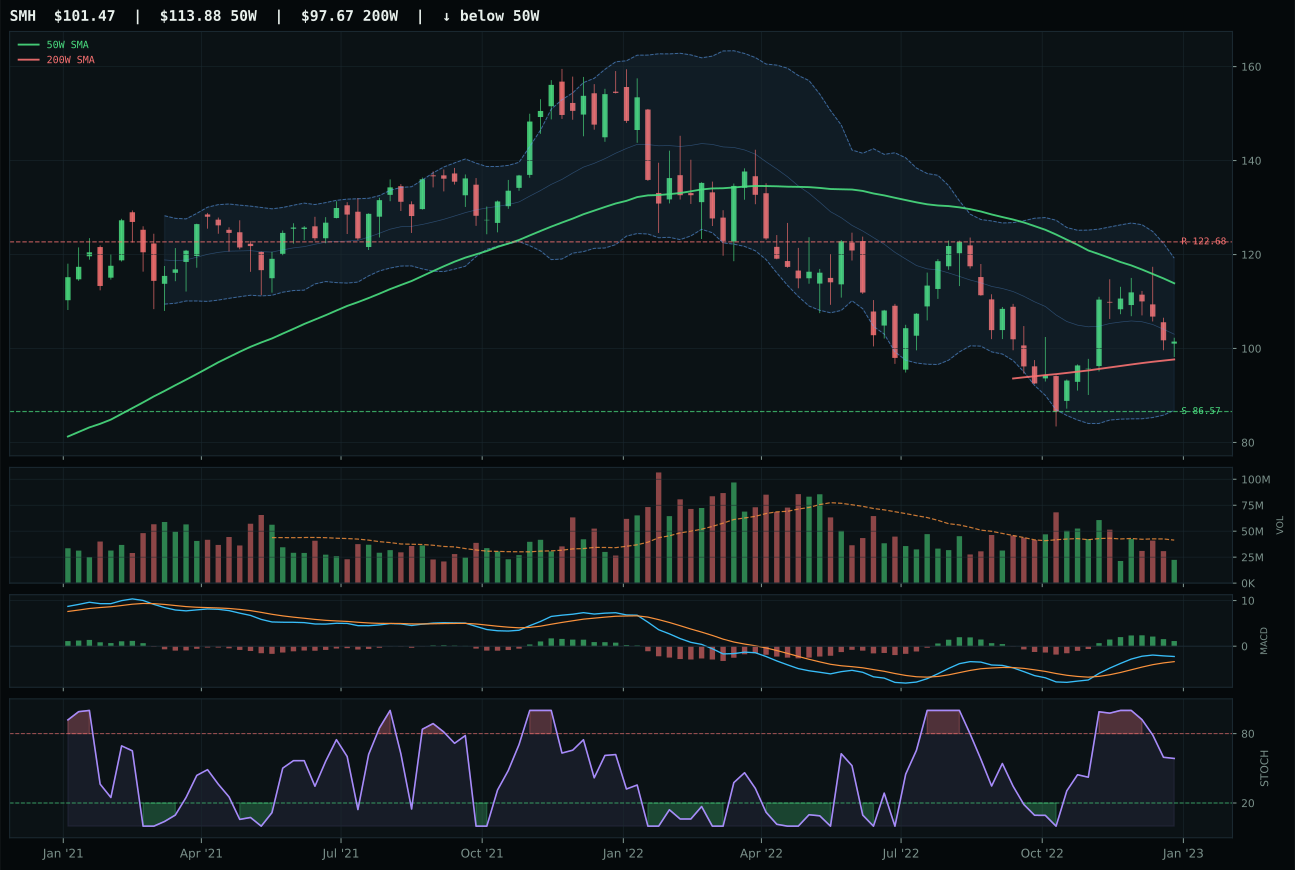
SMH has a neutral structure profile with 2.6% 13-week relative strength versus SPY.
A failed hold above support would weaken the setup.
Actionable but governed by invalidation levels.
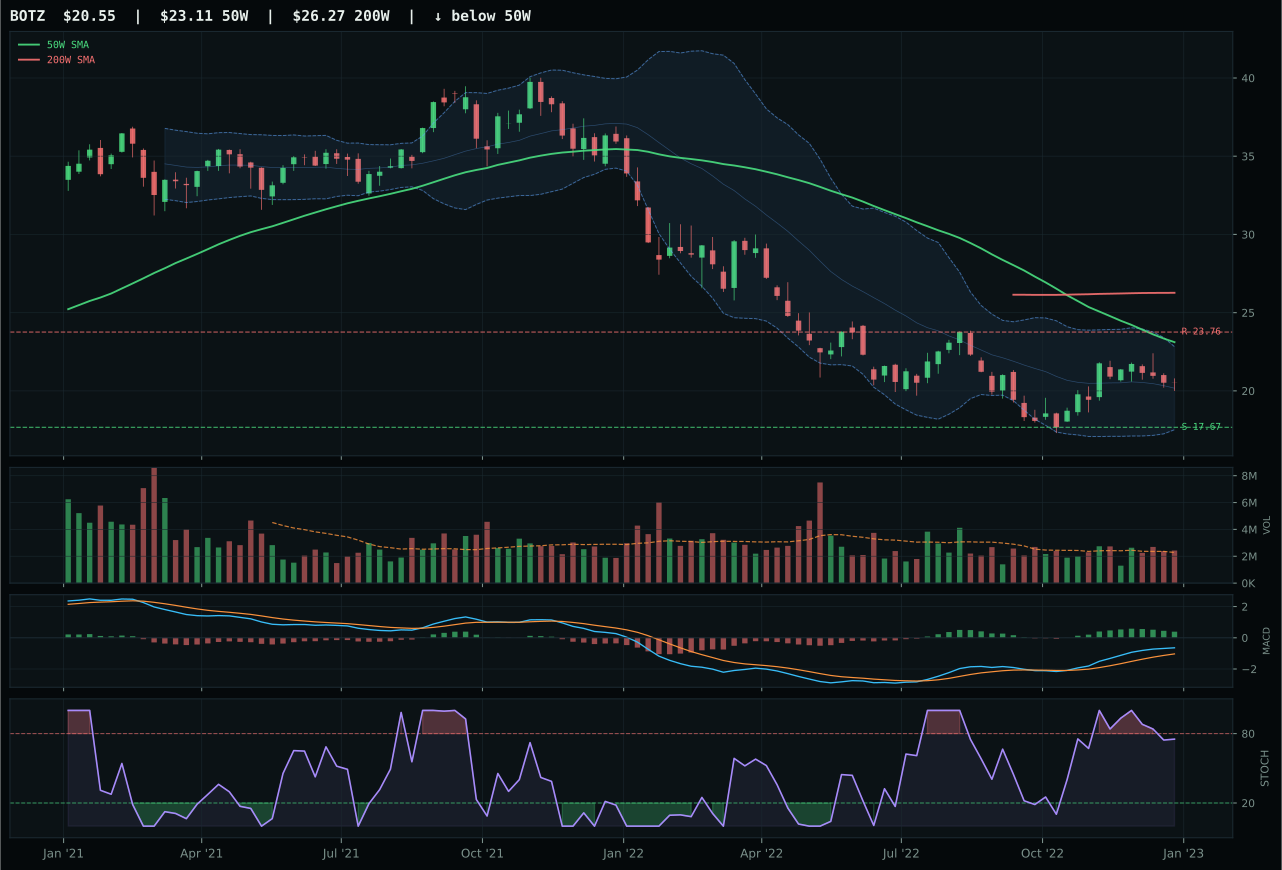
BOTZ has a neutral structure profile with 6.6% 13-week relative strength versus SPY.
Extension and support failure are the main tactical risks.
Tracked, but not top-2 eligible because: structurally broken.
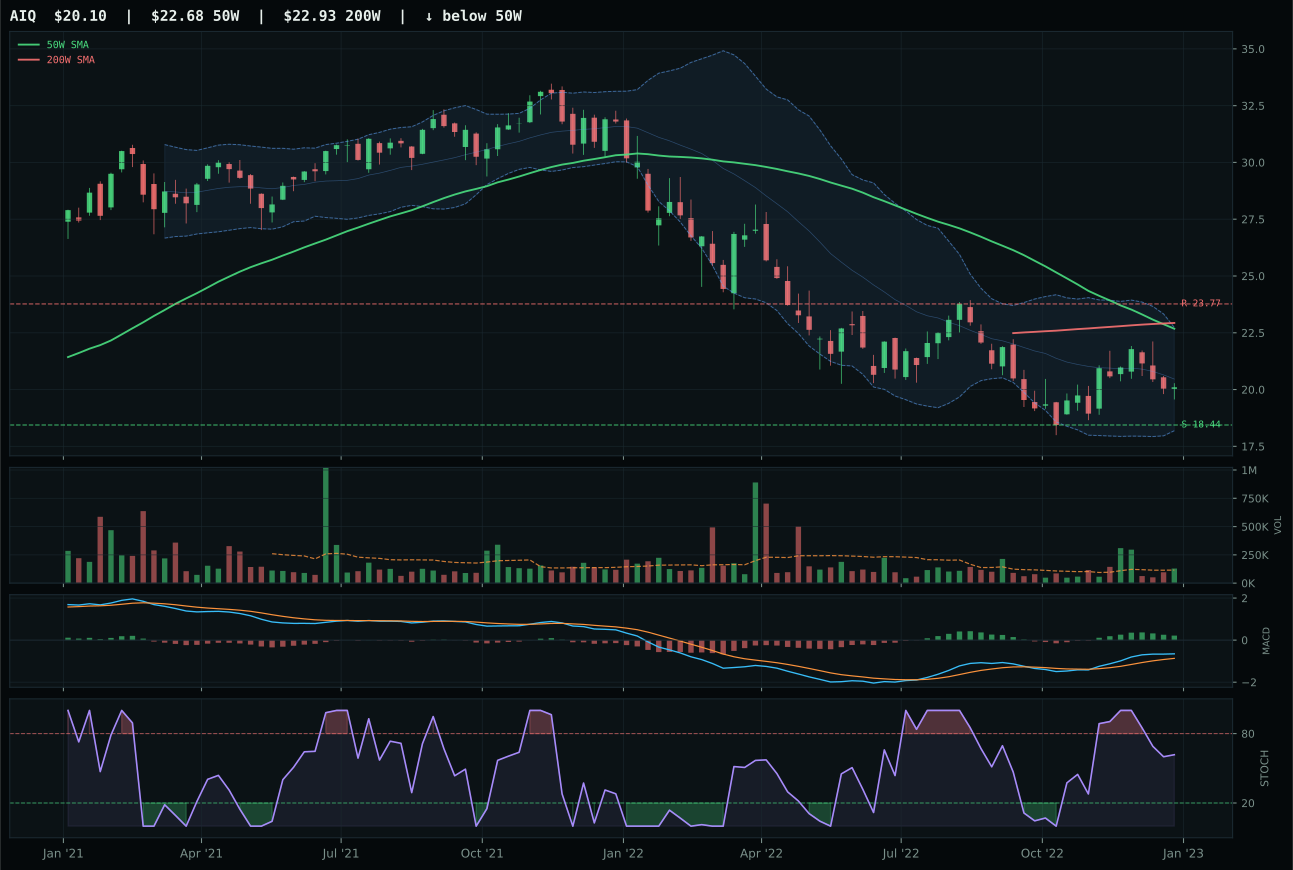
AIQ has a neutral structure profile with -2.2% 13-week relative strength versus SPY.
Extension and support failure are the main tactical risks.
Tracked, but not top-2 eligible because: structurally broken.
SMH won the category not through momentum but through technical credibility: it sits below the 50-week moving average yet above the 200-week, a reset structure that avoids the overextension trap that plagued BOTZ. The semiconductor ETF's 13-week return of 9.6% pairs with SPY-relative strength of 2.6%, marking positive relative performance that BOTZ's more flashy 13.7% gain cannot claim—BOTZ's 6.6% relative strength came from chasing a momentum spike, not from institutional accumulation. SMH's thin volume at 0.54x the 20-week average is a concern, but it is paired with neutral structure at support 86.57, resistance 122.68, and a timing score of 57 that reflects genuine Fibonacci depth in the 0.786 repair zone. BOTZ, by contrast, scored 50 on timing with its stochastic RSI already oversold turning up—a tell that late money was already in the door and the asymmetry had inverted.
AI scores 24.5 and receives 0% allocation, ranking 10th or 9th among all categories. The category fails both on technicals and macro timing. SMH's trend score of 64.8 is respectable but momentum confirmation scores just 48.2, and volume-price confirmation is only 52.2—none of these reach the threshold for conviction. Macro fit at 36.0/100 is poisonous: credit stress (-8), liquidity stress (-12), and broad market bear (-8) create a regime where high-growth names with thin volume get hit first and recover last. The SMH setup is textbook mean-reversion bait—a down move into an old support zone with momentum divergence. Without either clearer macro relief or a breakout above the 50-week with volume backing, committing 10% to this category would be fishing in a descending stream. Reallocation to AI requires a reversal in liquidity stress and credit conditions, not just a technical bounce from oversold.