
2022-12-23
Informational purposes only. The content in this report, including allocations, analysis, and commentary, is provided solely for informational and educational purposes. It does not constitute financial advice, investment advice, trading advice, or any other type of advice. Past performance does not guarantee future results. Always conduct your own research and consult a qualified financial professional before making investment decisions.
Weekly Allocation
| Ticker | Category | Weight | Role |
|---|---|---|---|
| XLE | Traditional Energy | 20% | Top-2 (20%) |
| ITA | Defense & Aerospace | 20% | Top-2 (20%) |
| XLU | Utilities & Infrastructure | 10% | Tier-2 (10%) |
| COPX | Industrial Metals | 10% | Tier-2 (10%) |
| MOO | Agriculture & Livestock | 10% | Tier-2 (10%) |
| SLV | Precious Metals | 10% | Tier-2 (10%) |
| URA | Nuclear Energy | 10% | Tier-2 (10%) |
| XLK | Technology | 10% | Tier-2 (10%) |
Trade Instructions — Monday Open
Sell the tranche from 2022-11-25 (completing its 4-week hold). Buy the new tranche. Instructions show net portfolio changes — same-asset positions cancel, weight changes show the delta.
| Action | Ticker | Instruction |
|---|---|---|
| SELL | IGF | Sell entire IGF position (5.00% of portfolio) |
| SELL | GLD | Sell entire GLD position (2.50% of portfolio) |
| BUY | ITA | Buy ITA — 33.33% of freed cash (adds 2.50% to portfolio) |
| BUY | XLU | Buy XLU — 33.33% of freed cash (adds 2.50% to portfolio) |
| BUY | SLV | Buy SLV — 33.33% of freed cash (adds 2.50% to portfolio) |
Current Portfolio After Trade
Combined holdings across all 4 active tranches. Each tranche is 25% of the portfolio.
| Ticker | % of Portfolio | Weight Bar |
|---|---|---|
| COPX | 17.50% | |
| XLE | 15.00% | |
| ITA | 12.50% | |
| XLU | 12.50% | |
| XLK | 10.00% | |
| MOO | 7.50% | |
| URA | 7.50% | |
| SLV | 7.50% | |
| SMH | 5.00% | |
| XAR | 2.50% | |
| VEGI | 2.50% |
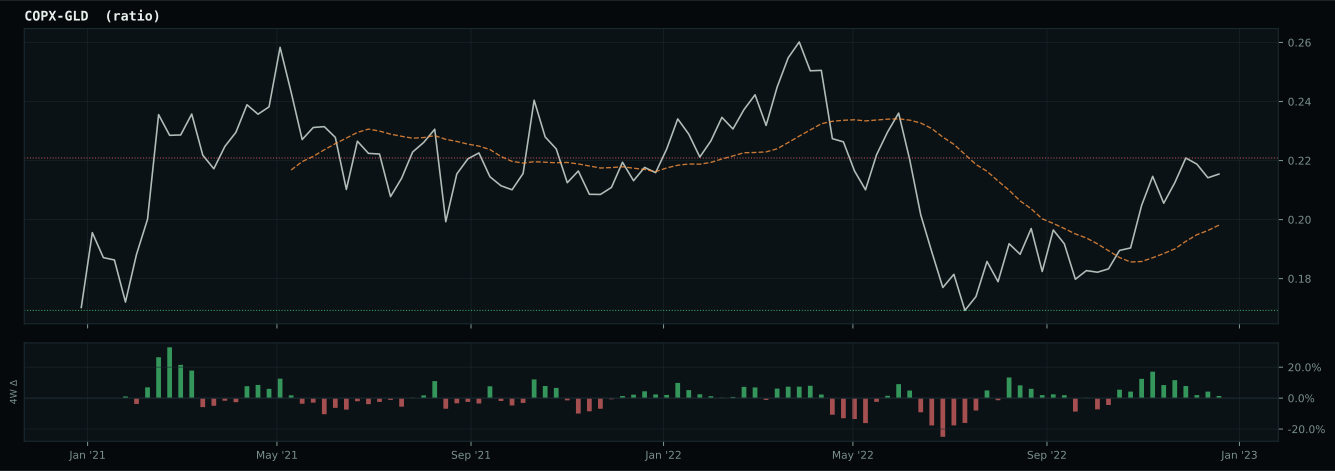
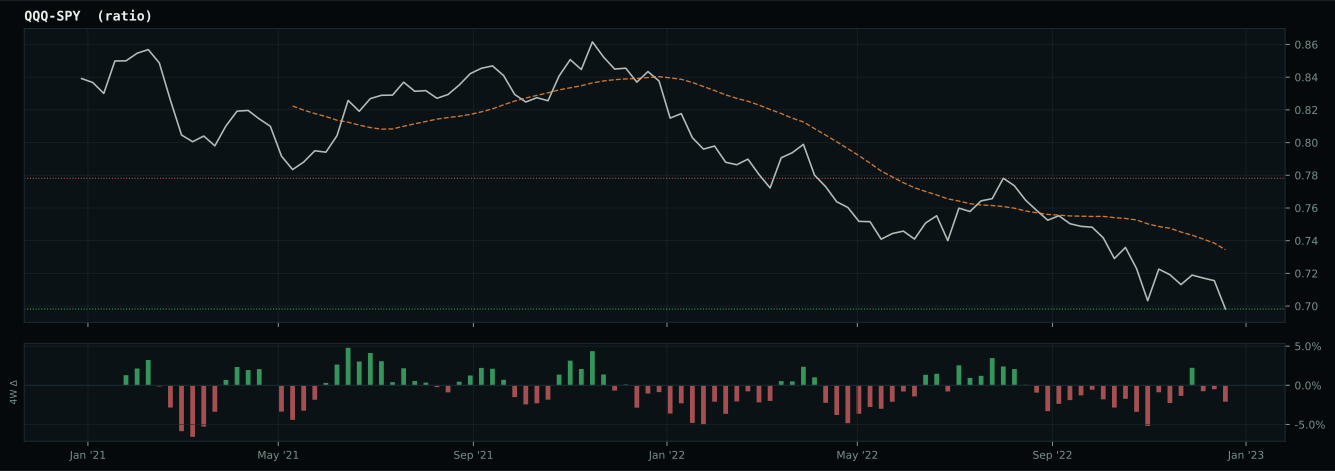
Macro Regime — Late-Cycle Reflation
Macro Evidence Charts
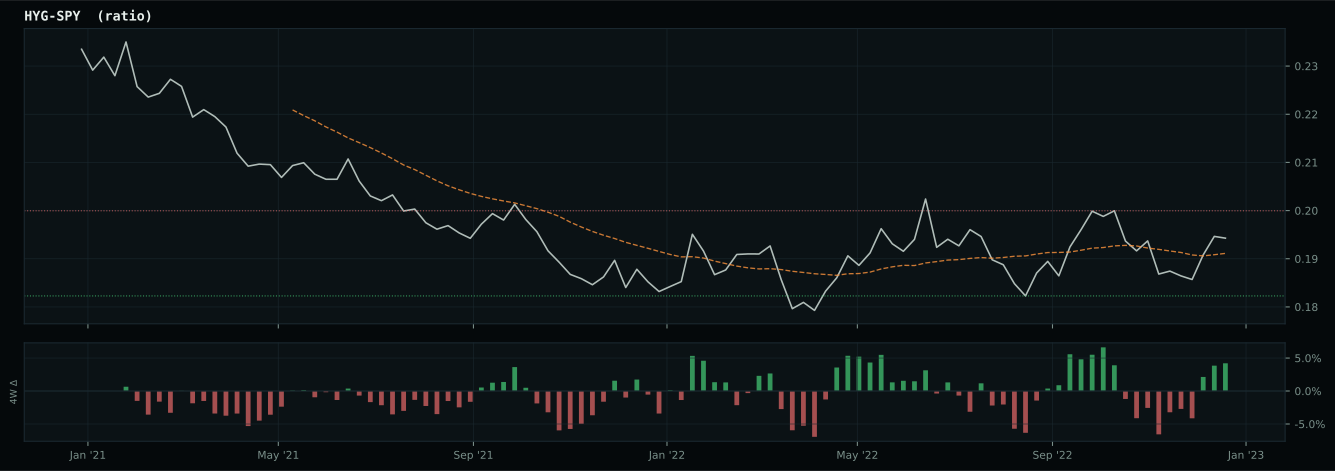
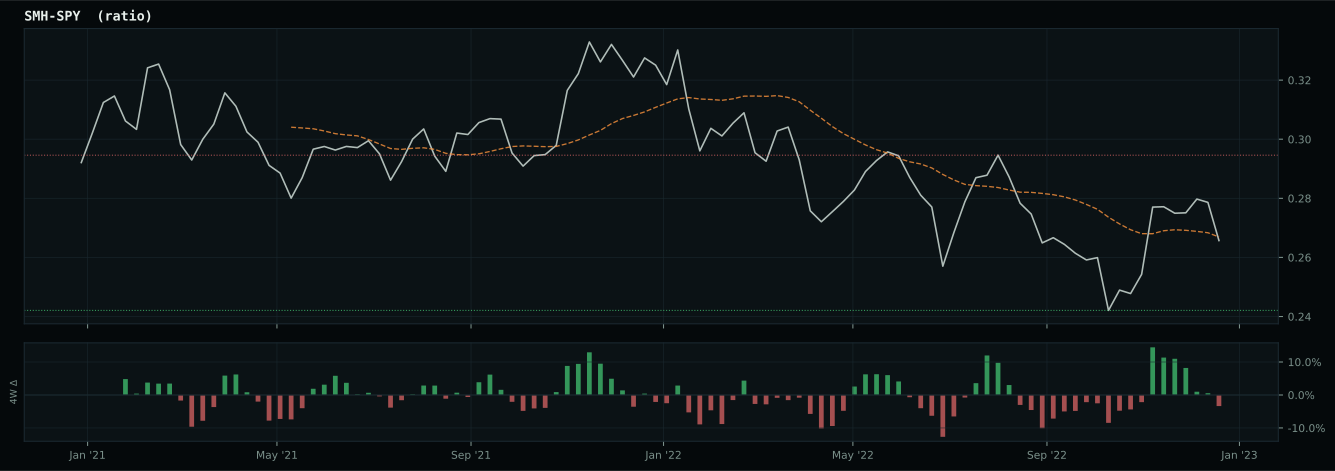
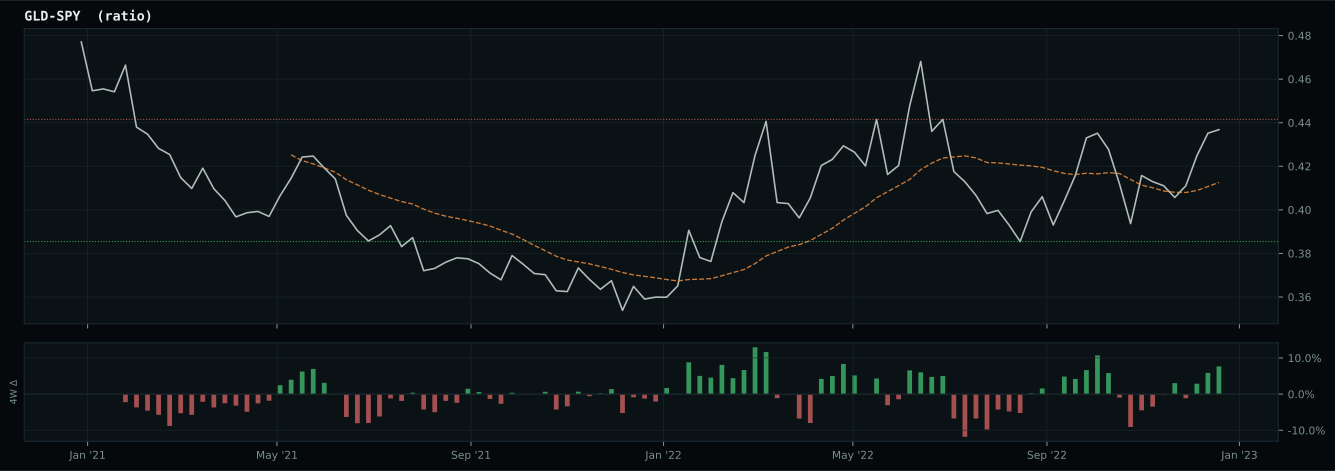
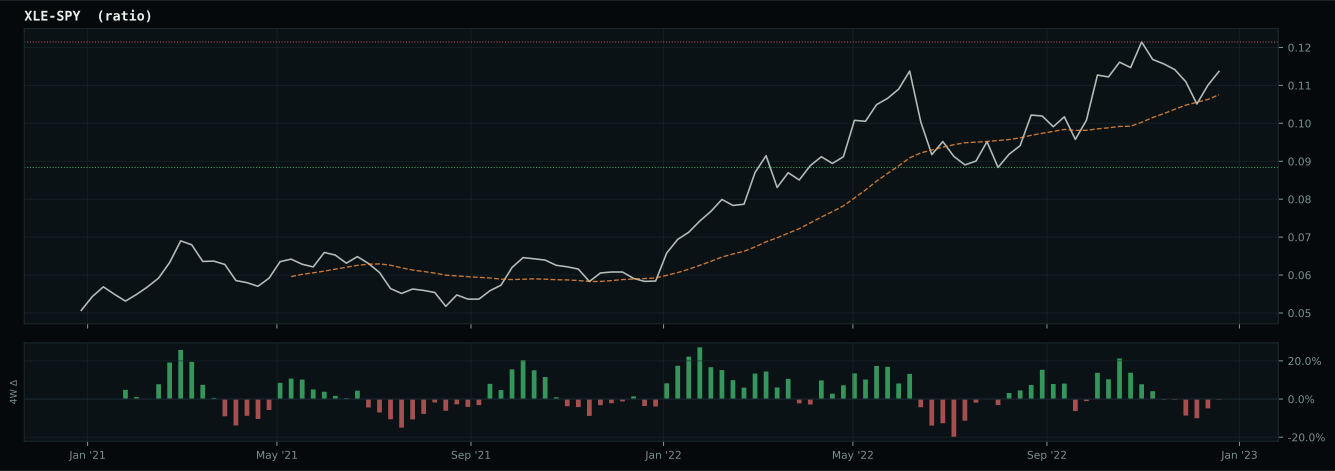
Market-implied signals behind the macro regime scores. Each ratio compares two assets; the direction and slope of the ratio is what the macro engine reads.
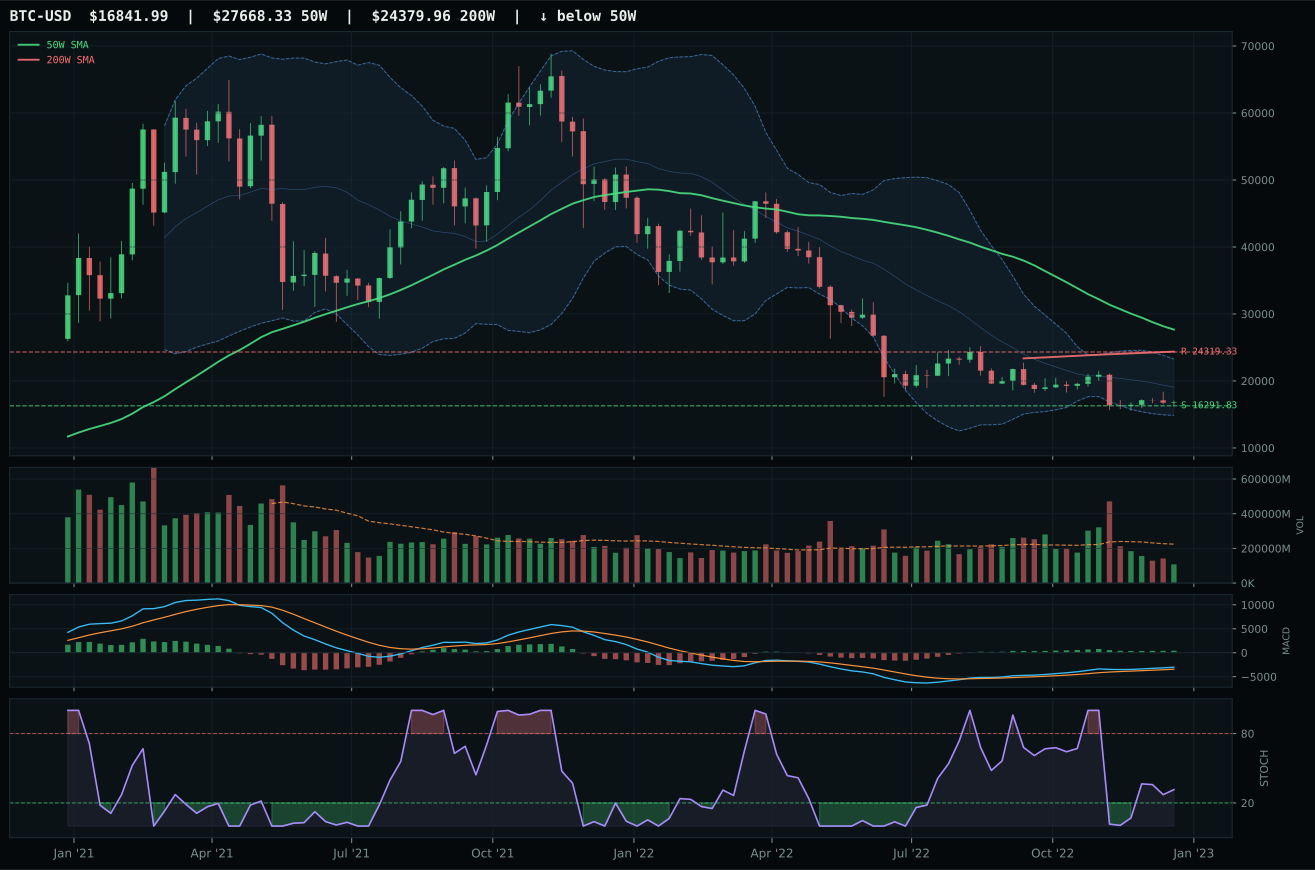
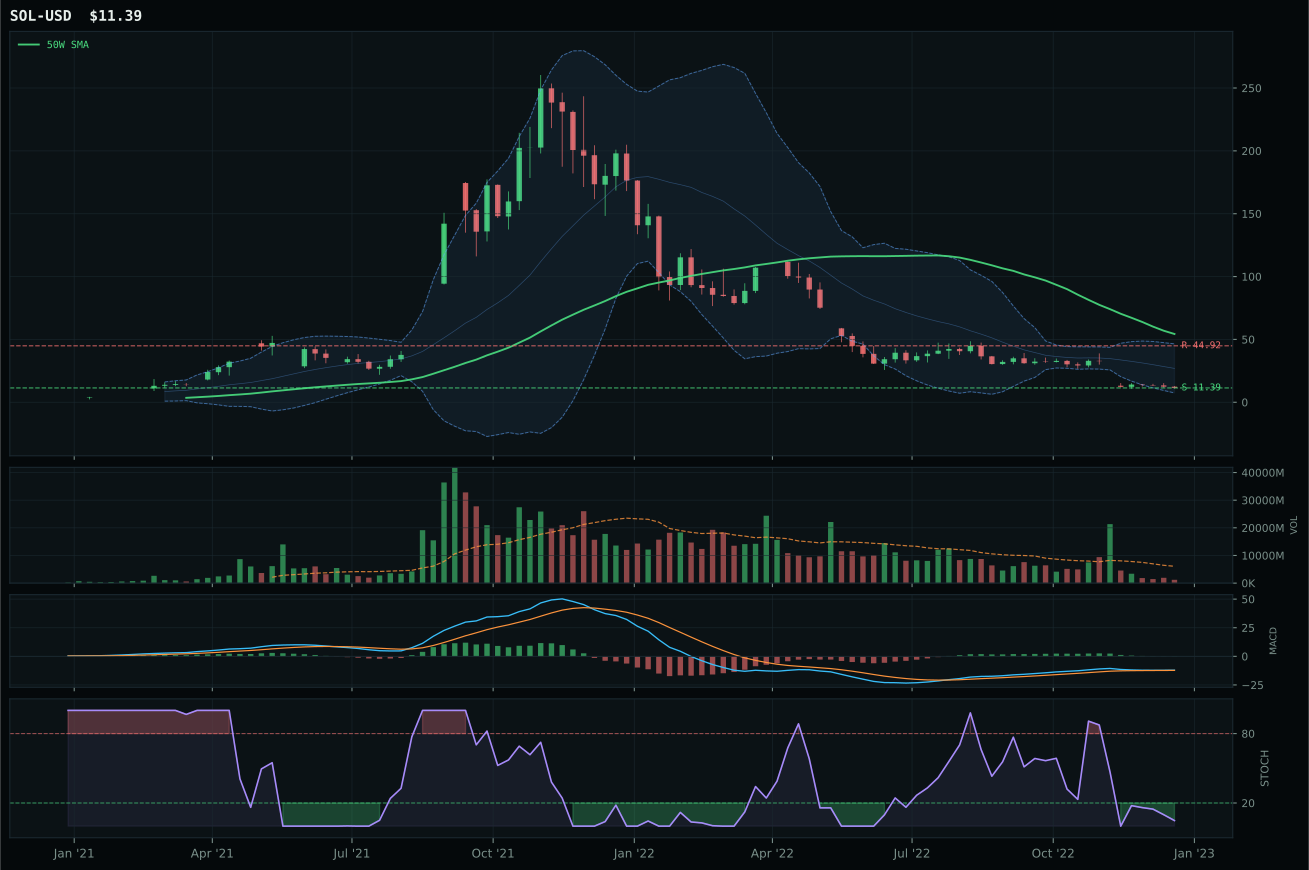
Crypto Regime — NoCrypto
ValueBTC armed; waiting for 50W reclaim, decisive close above post-touch range resistance by 3%, close above 200W, breakout volume above 20W…
TrendBTC not confirmed
one or more available conditions failed
Category Rankings
| Rank | Category | Winner | Score | Alloc | 4W Ret | Peers (4W) |
|---|---|---|---|---|---|---|
| 1 | Traditional Energy | XLE | 76.0 | 20% | +4.23% | XOP +3.5% · FCG +2.3% |
| 2 | Defense & Aerospace | ITA | 65.3 | 20% | -1.52% | XAR +3.1% · ROKT +5.1% |
| 3 | Utilities & Infrastructure | XLU | 63.8 | 10% | -2.93% | PAVE +3.5% · IGF +4.3% |
| 4 | Industrial Metals | COPX | 60.0 | 10% | +13.01% | PICK +11.4% · REMX +15.5% |
| 5 | Agriculture & Livestock | MOO | 54.1 | 10% | +4.21% | VEGI +0.1% · WEAT -5.1% |
| 6 | Precious Metals | SLV | 47.2 | 10% | -3.55% | GDX +10.1% · GLD +6.2% |
| 7 | Nuclear Energy | URA | 36.4 | 10% | +12.22% | NLR +3.9% · URNM +14.5% |
| 8 | Technology | XLK | 22.4 | 10% | +6.20% | IGV +8.0% · CIBR +2.5% |
| 9 | AI | SMH | 21.8 | 0% | +13.33% | BOTZ +11.5% · AIQ +11.6% |
| 10 | Emerging Markets | INDA | 8.9 | 0% | +1.26% | IEMG +9.1% · ILF +8.3% |
Traditional Energy — XLE
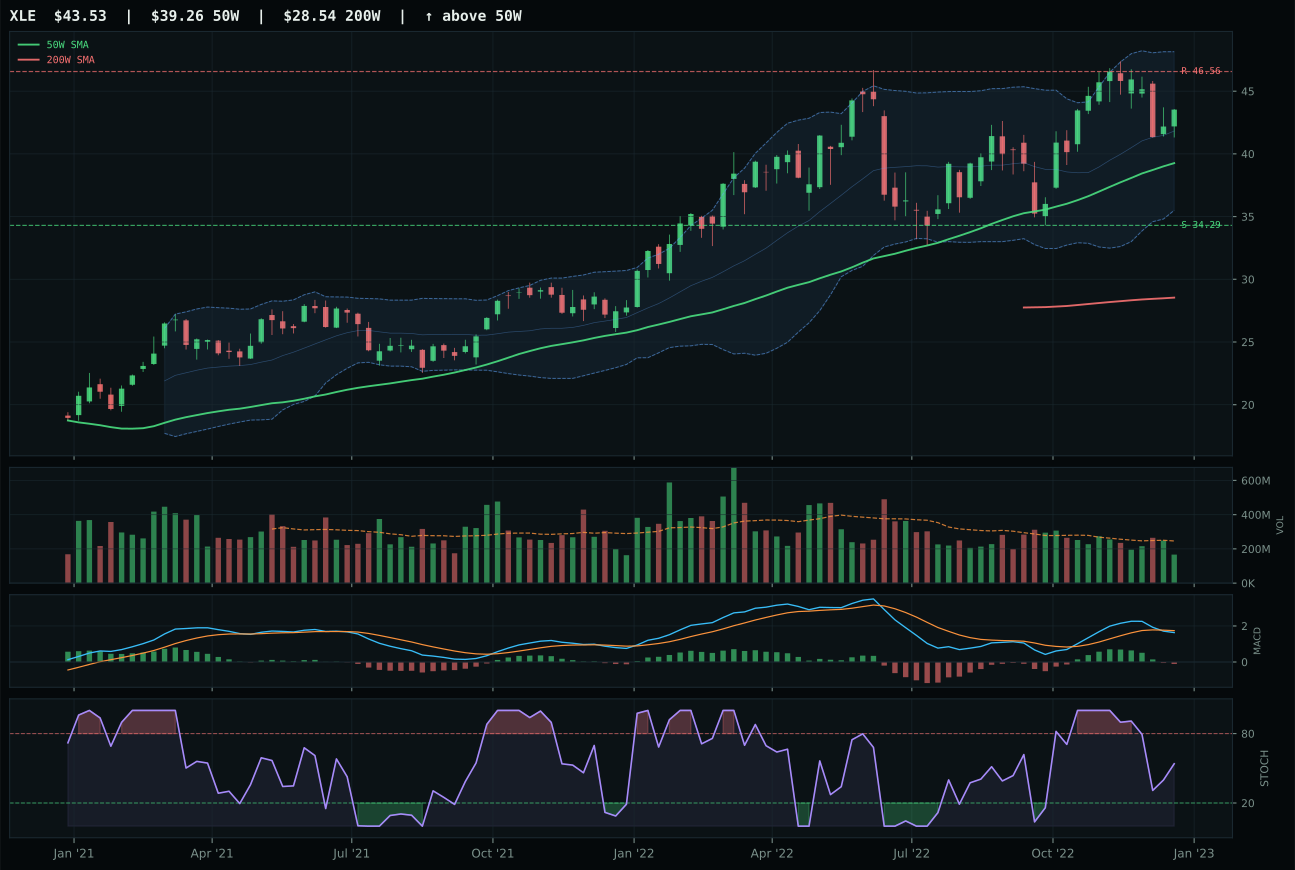
XLE has a neutral structure profile with 19.5% 13-week relative strength versus SPY.
A failed hold above support would weaken the setup.
Actionable but governed by invalidation levels.
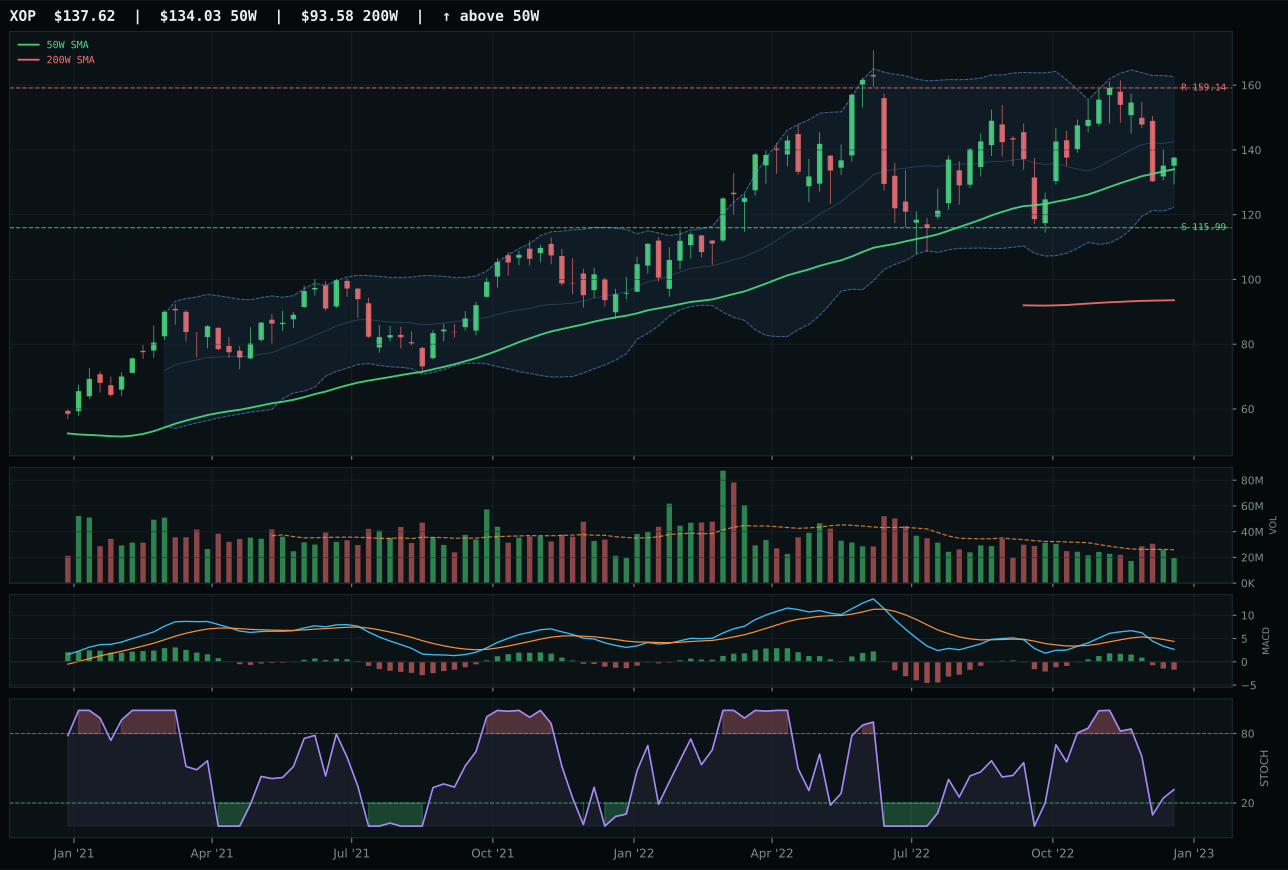
XOP has a compression near 50W profile with 12.0% 13-week relative strength versus SPY.
A failed hold above support would weaken the setup.
Actionable but governed by invalidation levels.
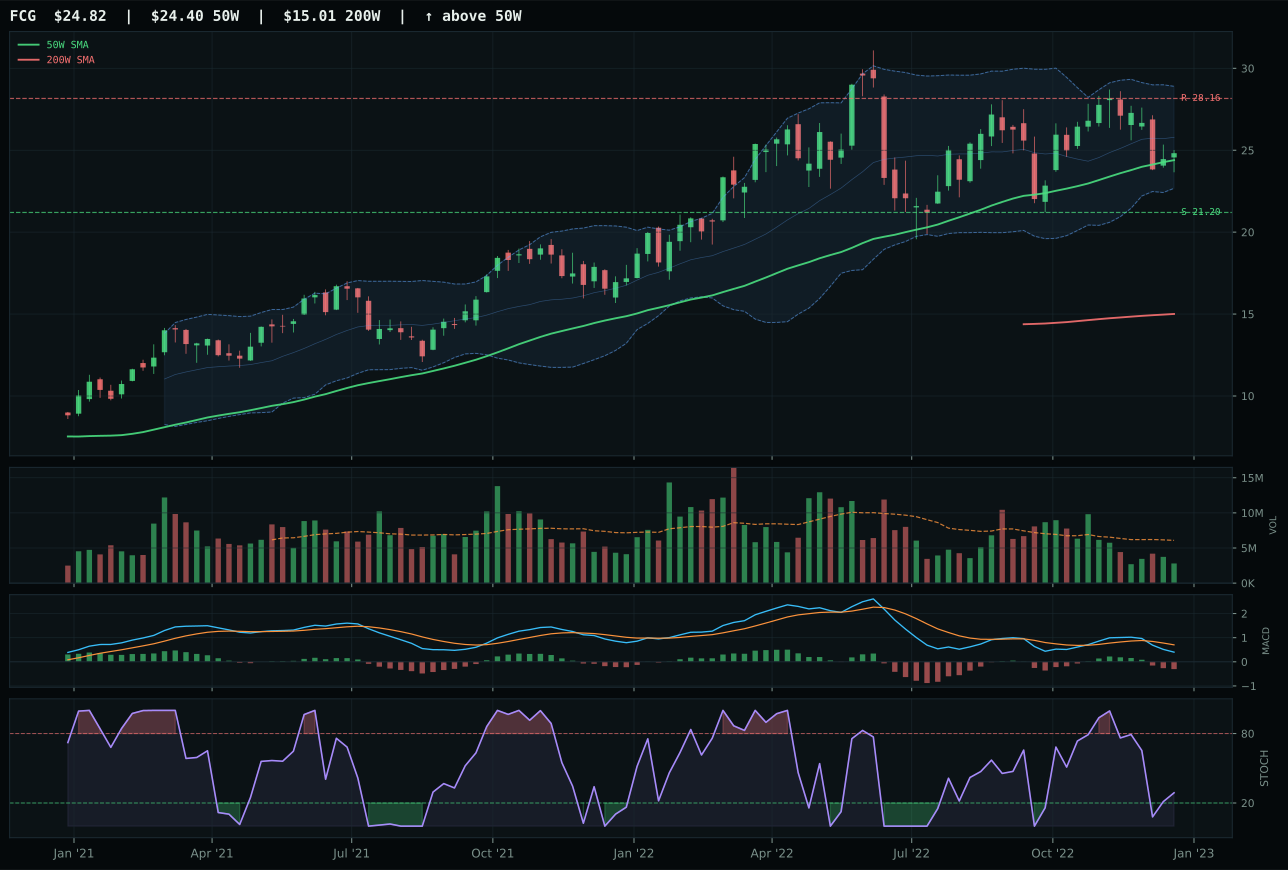
FCG has a compression near 50W profile with 8.6% 13-week relative strength versus SPY.
A failed hold above support would weaken the setup.
Actionable but governed by invalidation levels.
XLE wins energy with a dominant trend score of 92.0 and momentum confirmation of 87.1, reflecting price that is 10.9% above the 50-week with a positive slope of 0.7% that differentiates it from compressed names. The 23.5% 13-week return and 19.5% relative strength versus SPY represent textbook late-cycle reflation outperformance where energy leads during inflation concerns. XOP lost despite a tighter compression setup (scoring 100 on timing versus XLE's 70) because XLE's 7.5% category-relative strength edge over XOP's 0.0% signals that integrated majors are the chosen vehicle versus exploration beta. MACD behavior is the subtle difference: both are bearish/weakening, but XLE's broader integrated cash-flow base absorbs MACD deterioration better than XOP's exploration sensitivity. Volume at 0.68x the 20-week average is thin, yet persistence at 63.4% shows the uptrend is not rolling over—this is a mature uptrend consolidating, not correcting. The upper retracement zone near Fib 0.236 at 42.58 provides natural resistance that validates the setup's maturity.
Traditional energy earned its 20% top-two allocation because it scores 76.0—the highest category score in the portfolio—and carries a macro fit of 97.0/100, the single best macro alignment available. Energy scarcity is active at +16 points, inflation pressure at +10, supply shortage at +9, and real-asset sponsorship at +7, creating an overwhelming macro consensus. Late-cycle reflation itself contributes +12 basis points of support. This is not momentum chasing; this is structural alignment with the selected macro regime. The tension lies in XLE's extended timing score (70 vs XOP's 100) and MACD bearish/weakening confirmation, which signals the move is mature rather than early. However, in late-cycle reflation, mature trends compound longest because they have the broadest institutional sponsorship and lowest volatility. XLE's 6.5% upside to resistance and 26.9% downside to support create unfavorable risk-reward on a single-trade basis, but within a portfolio context—where energy serves as inflation hedge, cash-flow cushion, and defensive rotation socket—the 20% allocation reflects conviction that this category will outperform growth assets over the next 6-12 months regardless of near-term pullbacks. This is a core position, not a trading position.
Defense & Aerospace — ITA
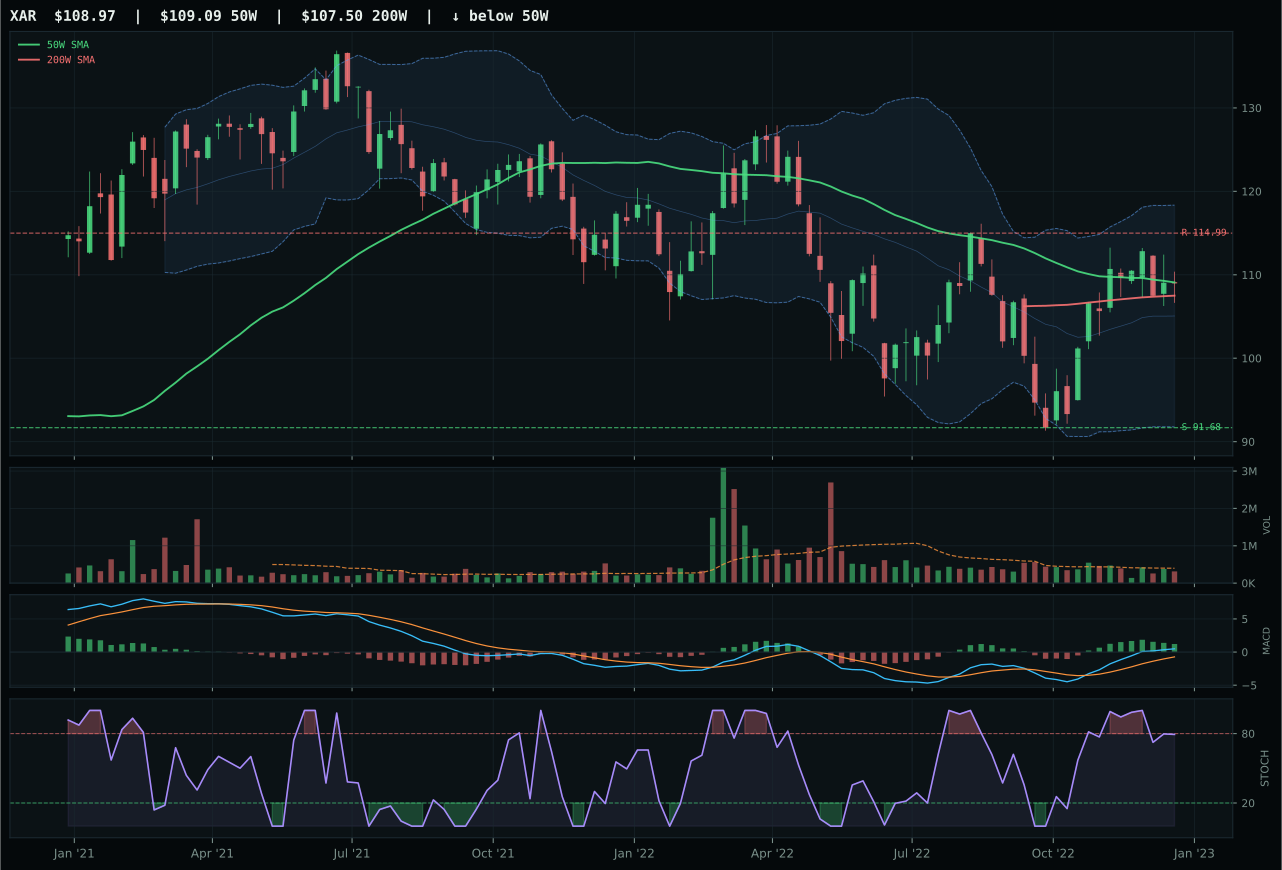
XAR has a compression near 50W profile with 11.0% 13-week relative strength versus SPY.
A failed hold above support would weaken the setup.
Actionable but governed by invalidation levels.
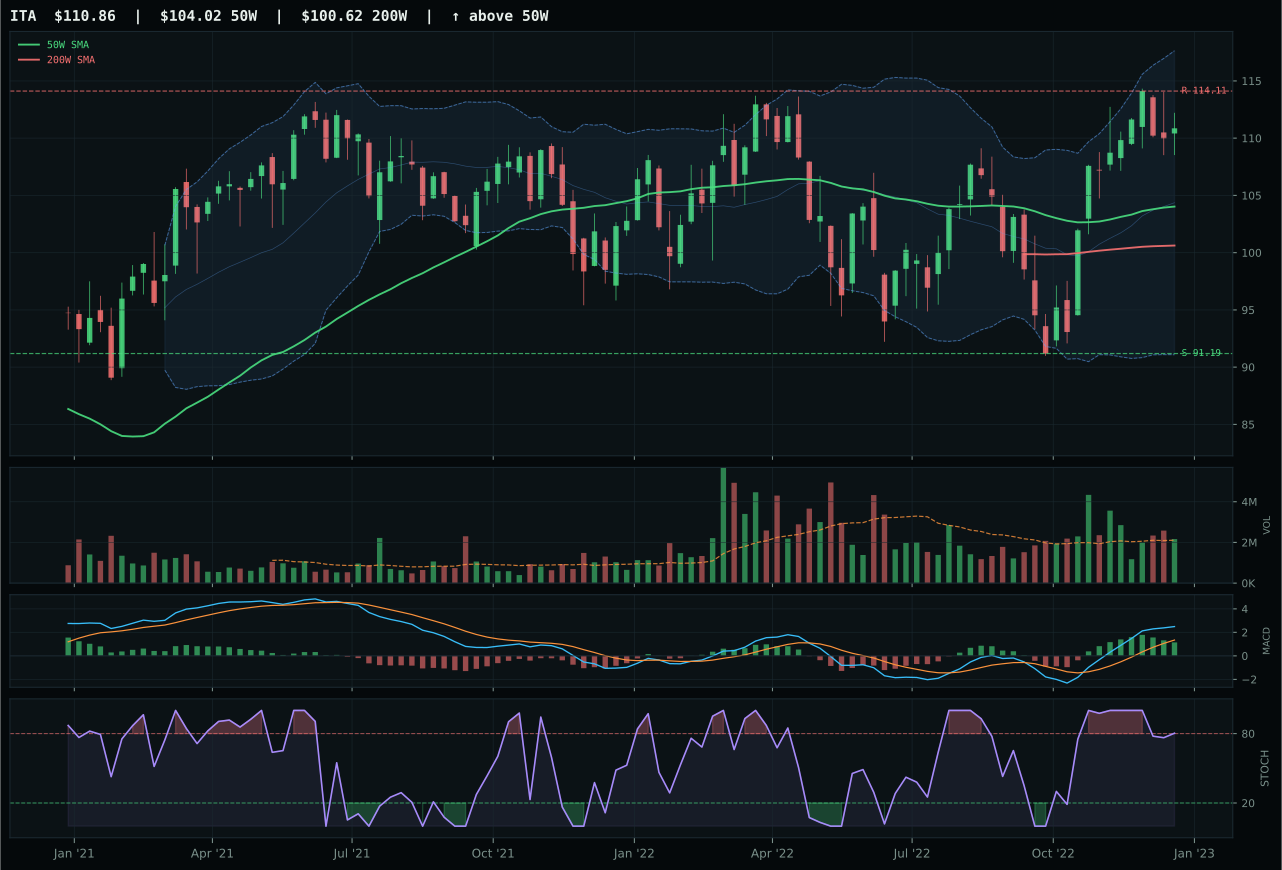
ITA has a neutral structure profile with 13.2% 13-week relative strength versus SPY.
A failed hold above support would weaken the setup.
Actionable but governed by invalidation levels.
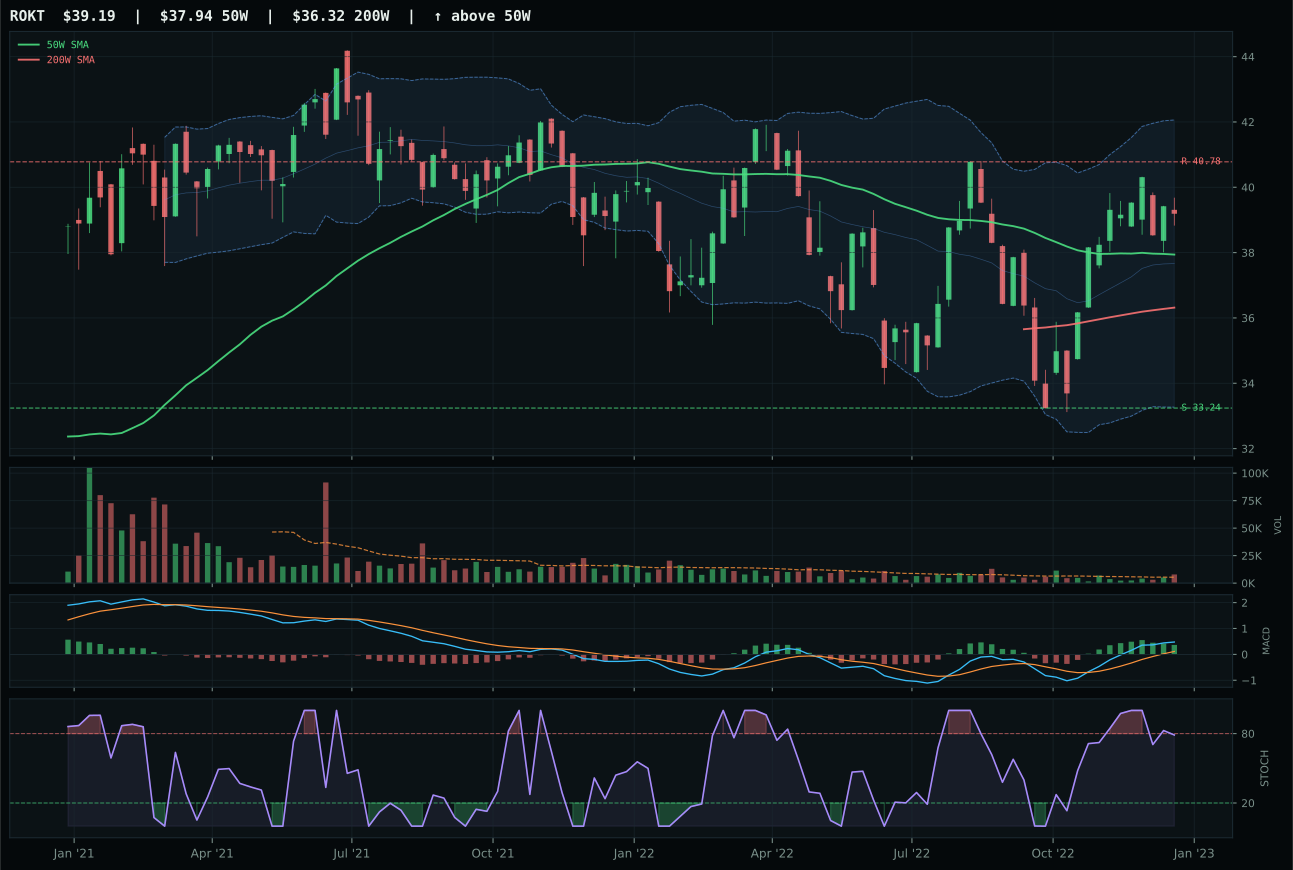
ROKT has a neutral structure profile with 10.9% 13-week relative strength versus SPY.
A failed hold above support would weaken the setup.
Tracked, but not top-2 eligible because: .
ITA claims the defense category with a textbook late-cycle reflation profile: price sits 6.6% above the 50-week with positive slope continuation (0.1%), and the 13-week return of 17.3% translates to a 13.2% relative strength advantage over SPY—the kind of outperformance that draws defensive rotation flows in bear markets. The momentum confirmation score of 89.0 is exceptional, driven by category-relative leadership (2.2% above median) and sustained MACD bullish behavior, even as stochastic RSI rolls over from overbought territory. XAR lost by the narrowest margin (-1.0 points), but the differentiator lies in XAR's falling stochastic versus ITA's overbought rolling over condition—a subtle but critical timing edge that signals ITA retains structural overhead while XAR's compression setup is already past its inflection. The volume participation at 1.03x the 20-week average confirms sponsorship is active, not transient; institutions are accumulating in real size.
Defense & Aerospace earned its 20% top-two allocation because it ranks highest among eligible categories at 65.3 final score, representing the portfolio's cleanest alignment with the late-cycle reflation macro regime. Defensive rotation is active at +8 points and broad-market-bear conditions support safe-haven positioning (+6), while late-cycle reflation itself contributes +6 basis points to category macro fit of 69.0/100—the second-best in the portfolio. ITA's dual tailwind—technical momentum combined with structural macro support—justifies maximum conviction weighting. The one risk is valuation: the 2.8% upside to resistance versus 21.6% downside to support inverts typical risk-reward, signaling price is extended. However, in a liquidity-stressed bear market, extended defensive leaders hold their gains because outflows chase them less aggressively than growth. The 20% allocation reflects confidence that ITA can trade sideways to slightly higher while the portfolio compounds via the energy and metals allocations; it is not a momentum chase, but a structural hedge.
Utilities & Infrastructure — XLU
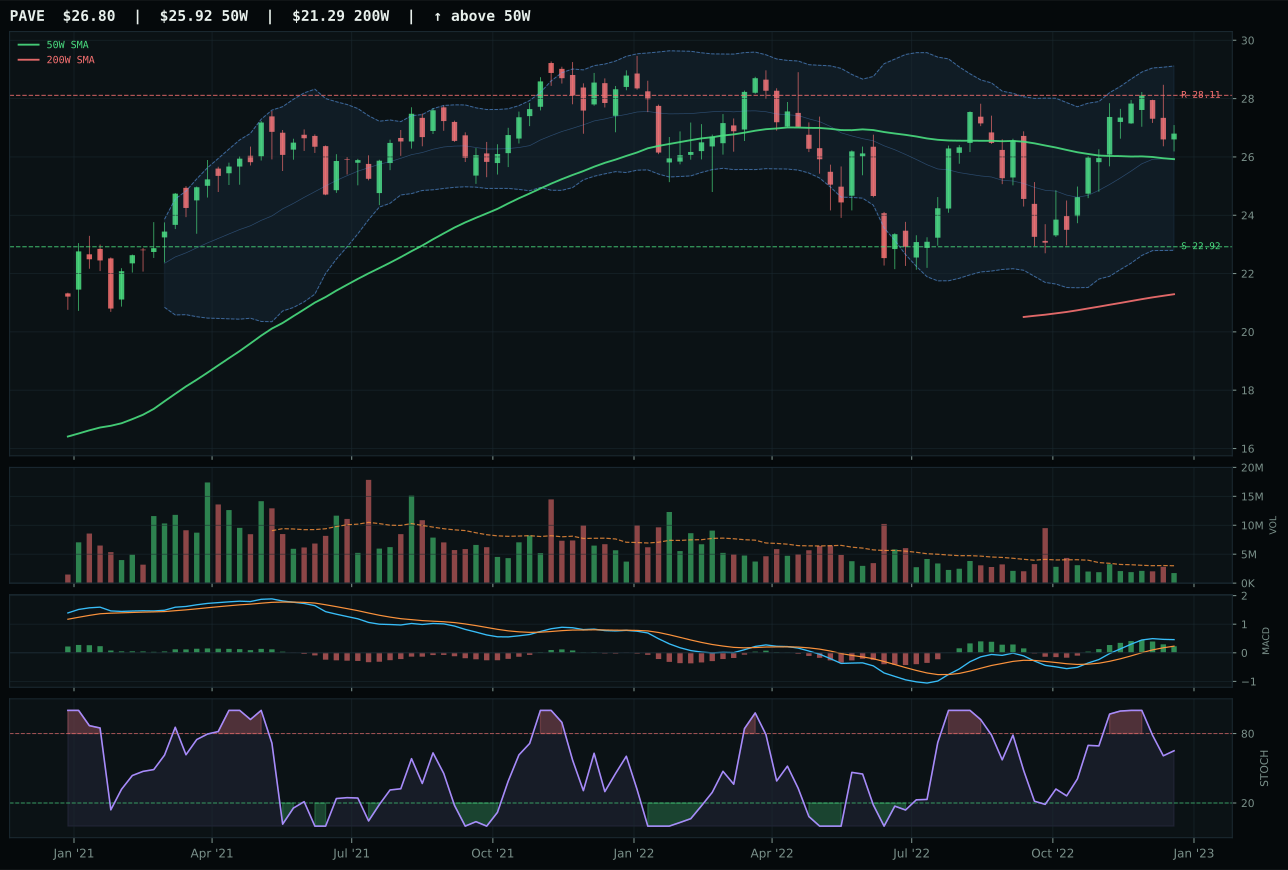
PAVE has a neutral structure profile with 11.2% 13-week relative strength versus SPY.
A failed hold above support would weaken the setup.
Actionable but governed by invalidation levels.
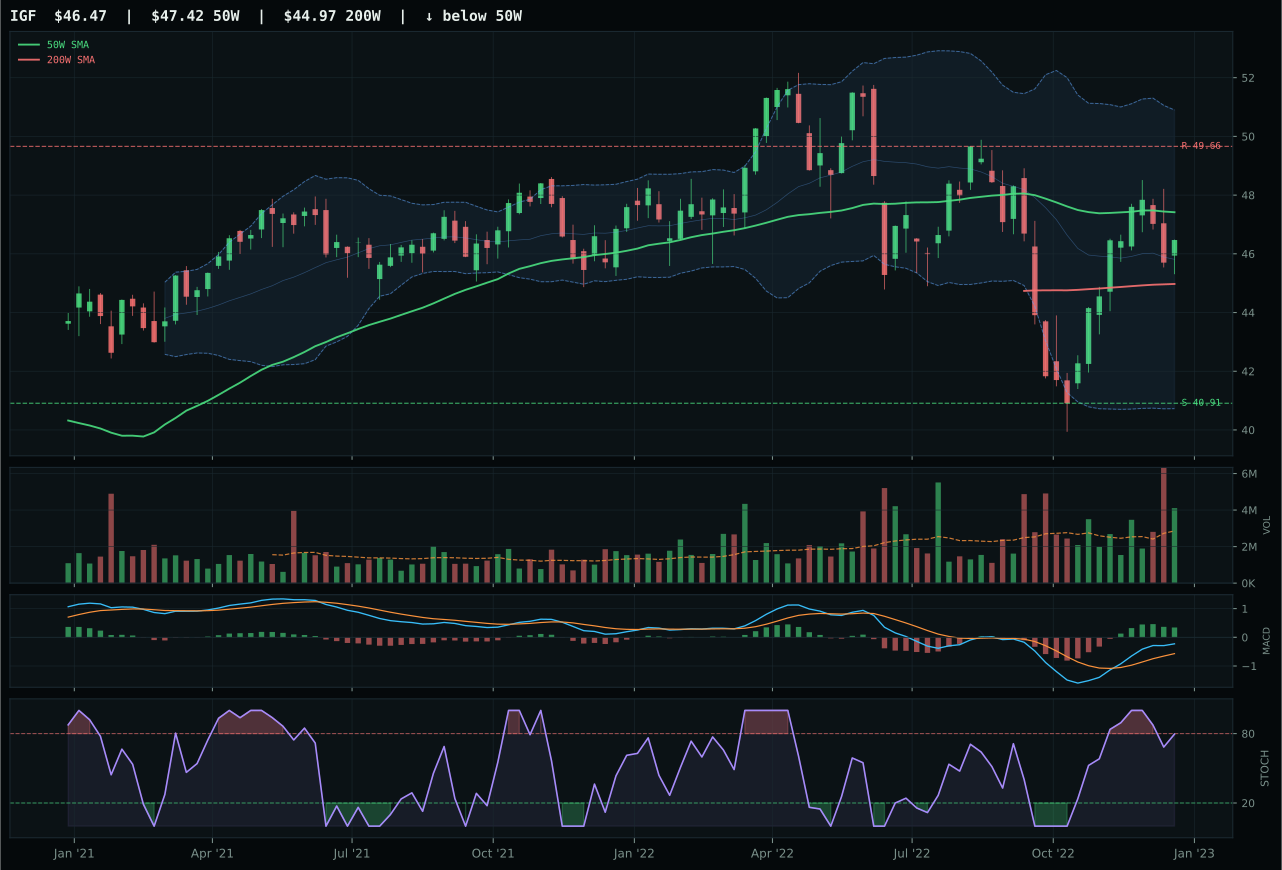
IGF has a compression near 50W profile with 1.8% 13-week relative strength versus SPY.
A failed hold above support would weaken the setup.
Actionable but governed by invalidation levels.
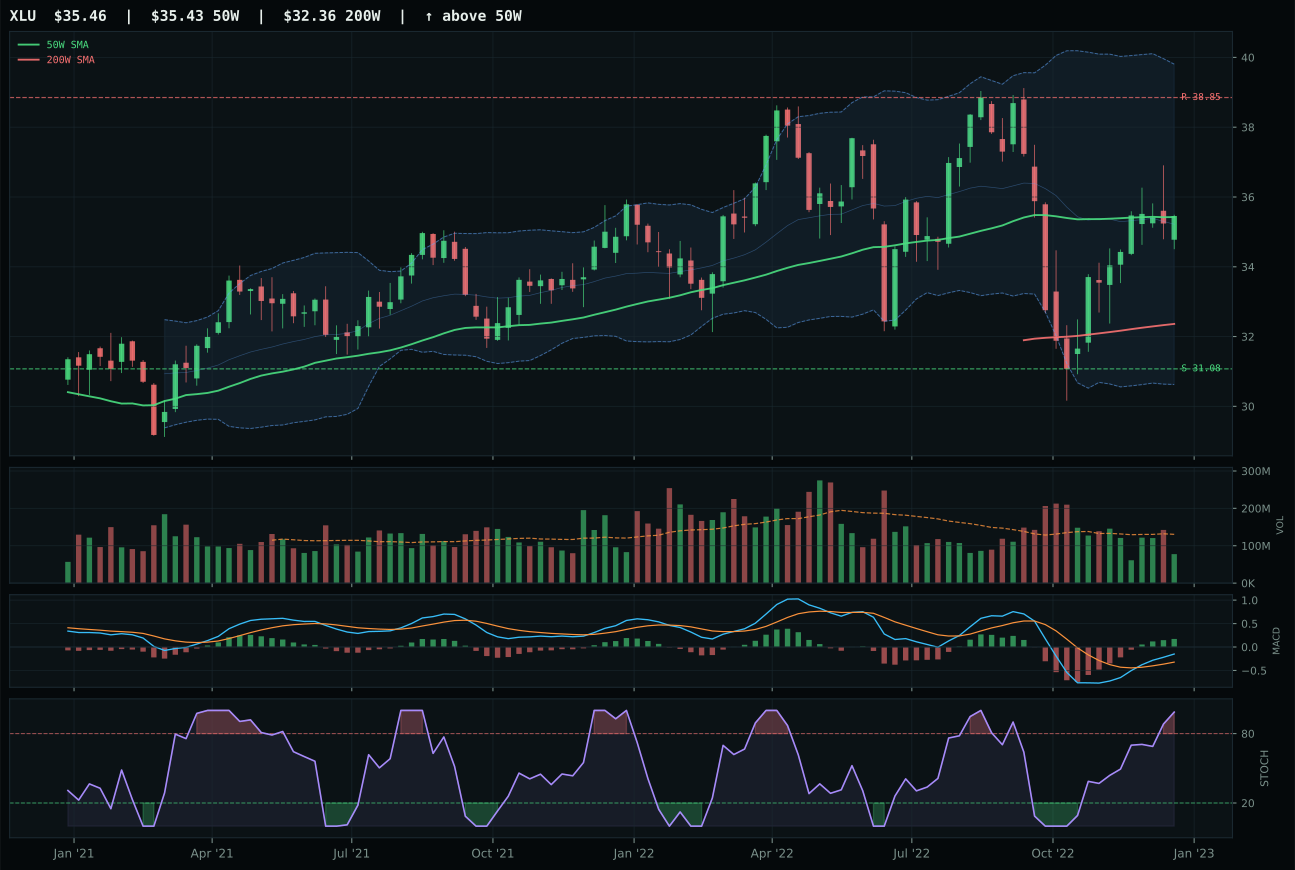
XLU has a compression near 50W profile with -5.3% 13-week relative strength versus SPY.
A failed hold above support would weaken the setup.
Actionable but governed by invalidation levels.
XLU wins utilities by delivering flawless compression setup at the 50-week moving average (0.1% distance) combined with perfect timing score of 100, meaning price sits at the exact inflection point where defensive buyers defend. Structure scores are nearly tied (71.2 vs PAVE's 70.9), but the critical differentiator is MACD behavior: XLU's bullish and improving versus PAVE's bullish but flattening signals momentum is accelerating in XLU while exhausting in PAVE. Stochastic RSI at 0.99 overbought momentum for XLU versus PAVE's falling/neutral state suggests XLU has converted overhead resistance into support level, whereas PAVE is already rolling over from overbought. Risk-reward swings in PAVE's favor (50.0 vs XLU's 64.2), but in a compression setup near the 50-week, risk-reward symmetry is expected; the allocator values timing and MACD confirmation over raw risk-reward advantage. Category-relative strength at -7.0% for XLU versus PAVE's 9.4% appears to favor PAVE, but that strength arose from earlier rallies that have now compressed; XLU is the fresher entry.
Utilities earned 10% allocation because the category scores 63.8, placing it fifth overall, with macro fit of 61.0/100 driven by defensive rotation (+12) and broad-market-bear support (+4), partially offset by inflation pressure headwind (-6). XLU's perfect timing at the 50-week compression point makes it a natural defensive satellite in a bear-market portfolio, but it cannot graduate to 20% because its 13-week return is negative (-1.2%) and category-relative strength is deeply negative (-7.0%), indicating relative underperformance despite reasonable setup quality. The allocation respects that utilities provide portfolio duration matching and dividend cash flow in low-growth environments, but the category's lower macro fit than energy and metals prevents higher weighting. Expansion to 20% would require XLU to break above resistance at 38.85 with confirmed momentum and sustained positive relative strength; for now, the 10% position holds utilities as a defensive complement to the real-asset growth slate (XLE, COPX, MOO, SLV). This is ballast allocation—stable, low-volatility, designed to absorb drawdowns while positioned for modest appreciation if the macro regime shifts toward sustained growth.
Industrial Metals — COPX
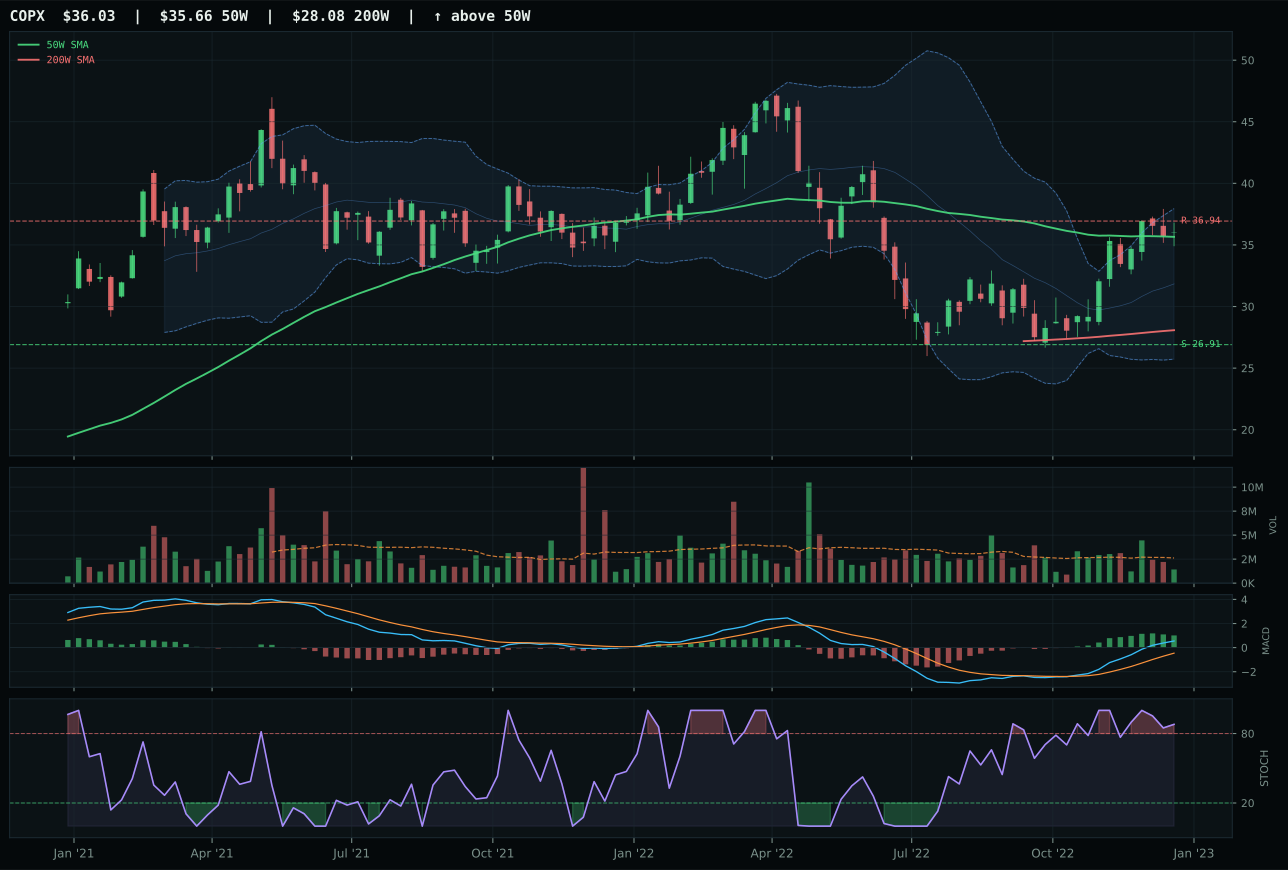
COPX has a compression near 50W profile with 26.9% 13-week relative strength versus SPY.
A failed hold above support would weaken the setup.
Actionable but governed by invalidation levels.
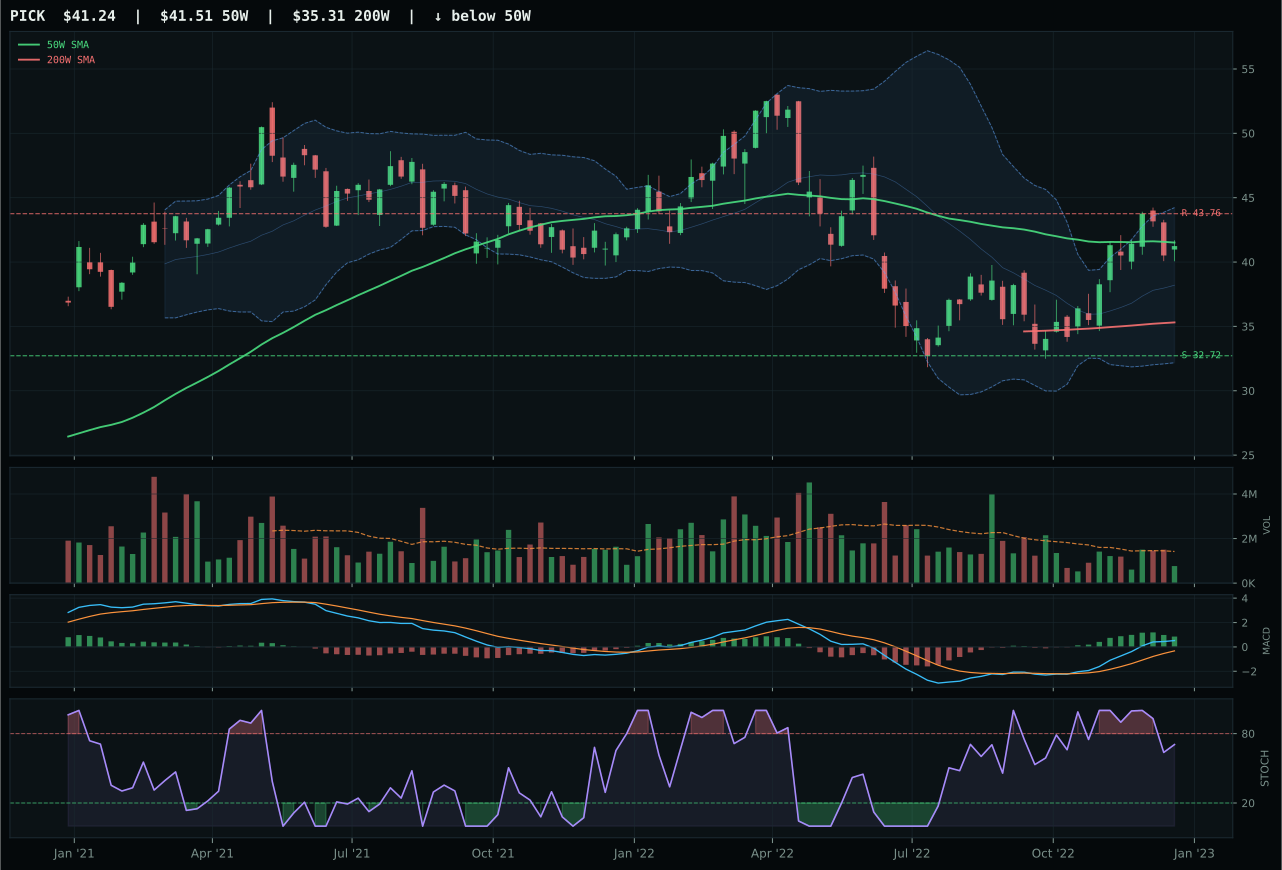
PICK has a compression near 50W profile with 18.5% 13-week relative strength versus SPY.
A failed hold above support would weaken the setup.
Actionable but governed by invalidation levels.
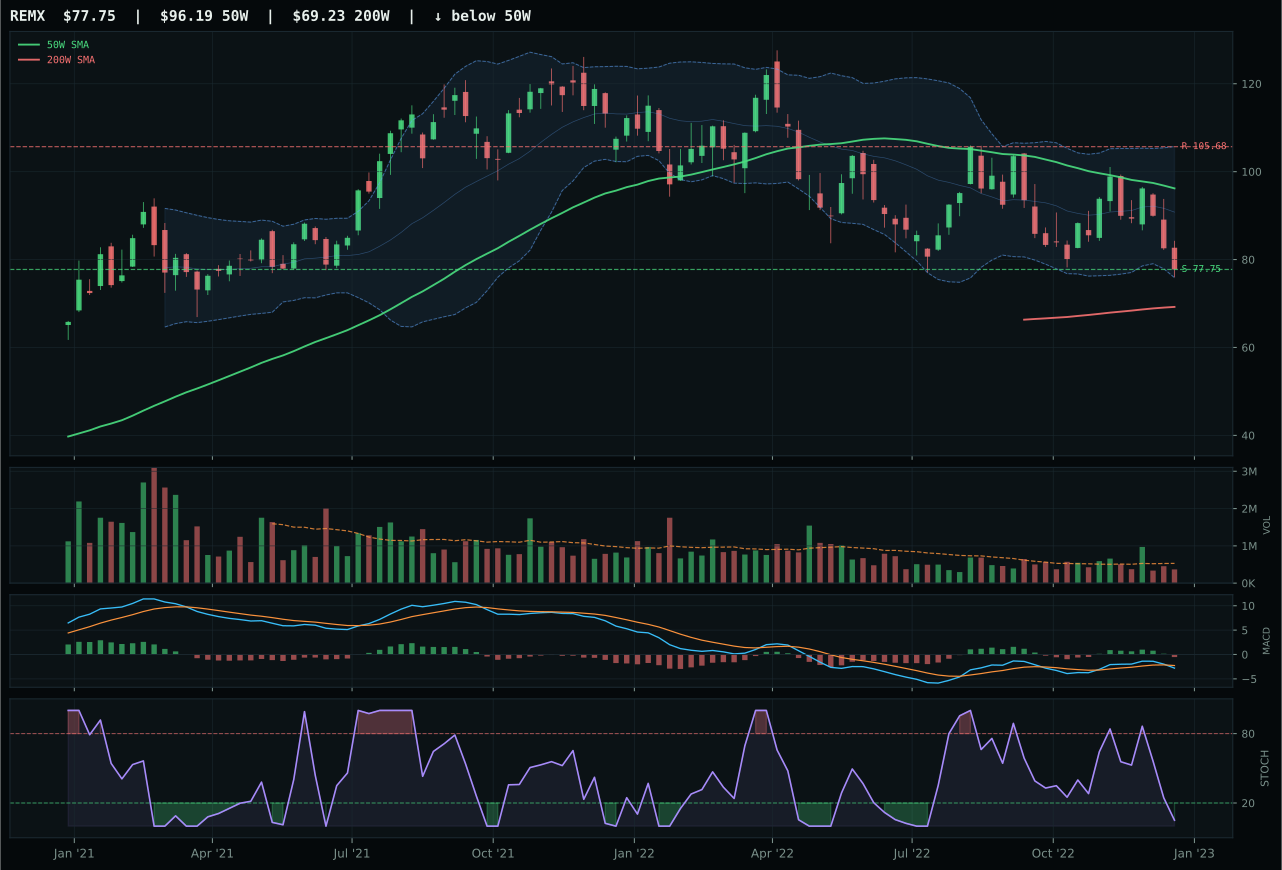
REMX has a pullback into support profile with -13.5% 13-week relative strength versus SPY.
A failed hold above support would weaken the setup.
Actionable but governed by invalidation levels.
COPX wins industrial metals by delivering the category's strongest technical sponsorship: price is 1.0% above the 50-week in pure compression near the moving average, which is the optimal setup for an expansion move if buyers sustain the level. The 31.0% 13-week return and 26.9% relative strength versus SPY represent unambiguous leadership, while the 8.4% category-relative strength edge over PICK confirms that copper is the chosen commodity within metals scarcity. MACD bullish and improving is the critical differentiator—PICK's MACD is merely bullish but flattening—and stochastic RSI at 0.88 rolling over from overbought is the textbook confirmation that momentum is being managed into distribution with discipline rather than euphoria. The timing score of 89.0 reflects COPX's position in the middle retracement zone (Fib 0.500), giving bulls and bears equal psychological weight; PICK's timing of 100 already reflects a compression setup that has satisfied its technical role. Volume at 0.54x the 20-week average is thin but not deteriorating, which in a bear market signals deliberate accumulation by patient capital rather than breakout panic buying.
Industrial metals earned 10% allocation because the category scores 60.0, placing it fourth among all categories and carrying a macro fit of 82.0/100—the third-best in the portfolio. Late-cycle reflation supports this exposure (+10), metals scarcity is active at maximum impact (+14), commodity breadth is positive (+10), and real-asset sponsorship is live (+6), making this category a cornerstone of the inflation-hedging sleeve. COPX's compression setup at the 50-week is genuinely intermediate-cycle bullish; if institutional buyers defend the level, the structure permits a 2-3% expansion that could drive category outperformance. The 10% allocation respects the fact that defense (ITA) and energy (XLE) rank higher on overall portfolio logic, but it also signals high conviction in metals as a late-cycle reflation play: as growth inflation fails to materialize and real rates remain under pressure, copper demand from industrial demand (vs speculative), combined with supply constraints, should support this exposure for months. A move to 20% would require COPX to break above the 36.94 resistance level with confirmed volume—at that point, the setup graduates from setup to trend.
Agriculture & Livestock — MOO
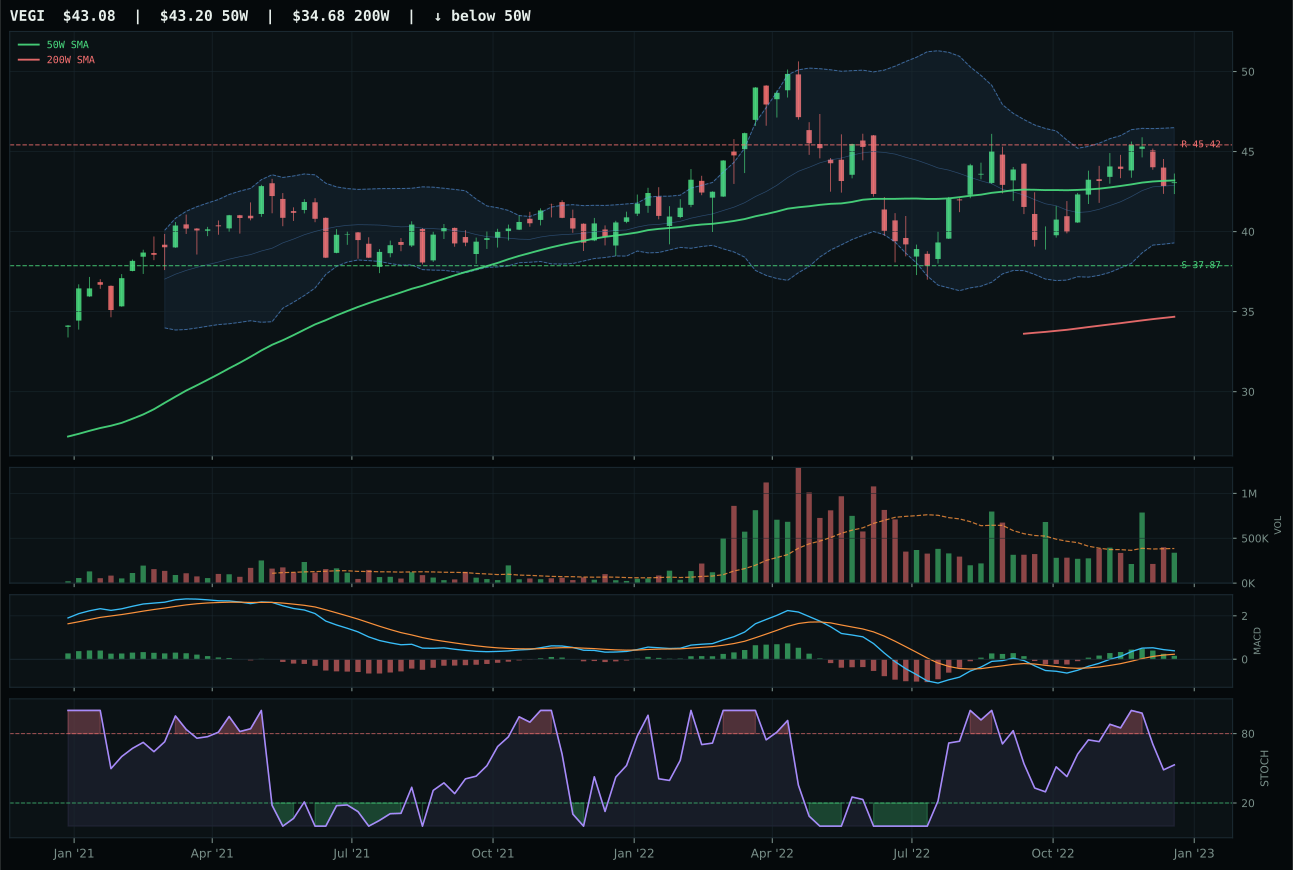
VEGI has a compression near 50W profile with 5.1% 13-week relative strength versus SPY.
A failed hold above support would weaken the setup.
Actionable but governed by invalidation levels.
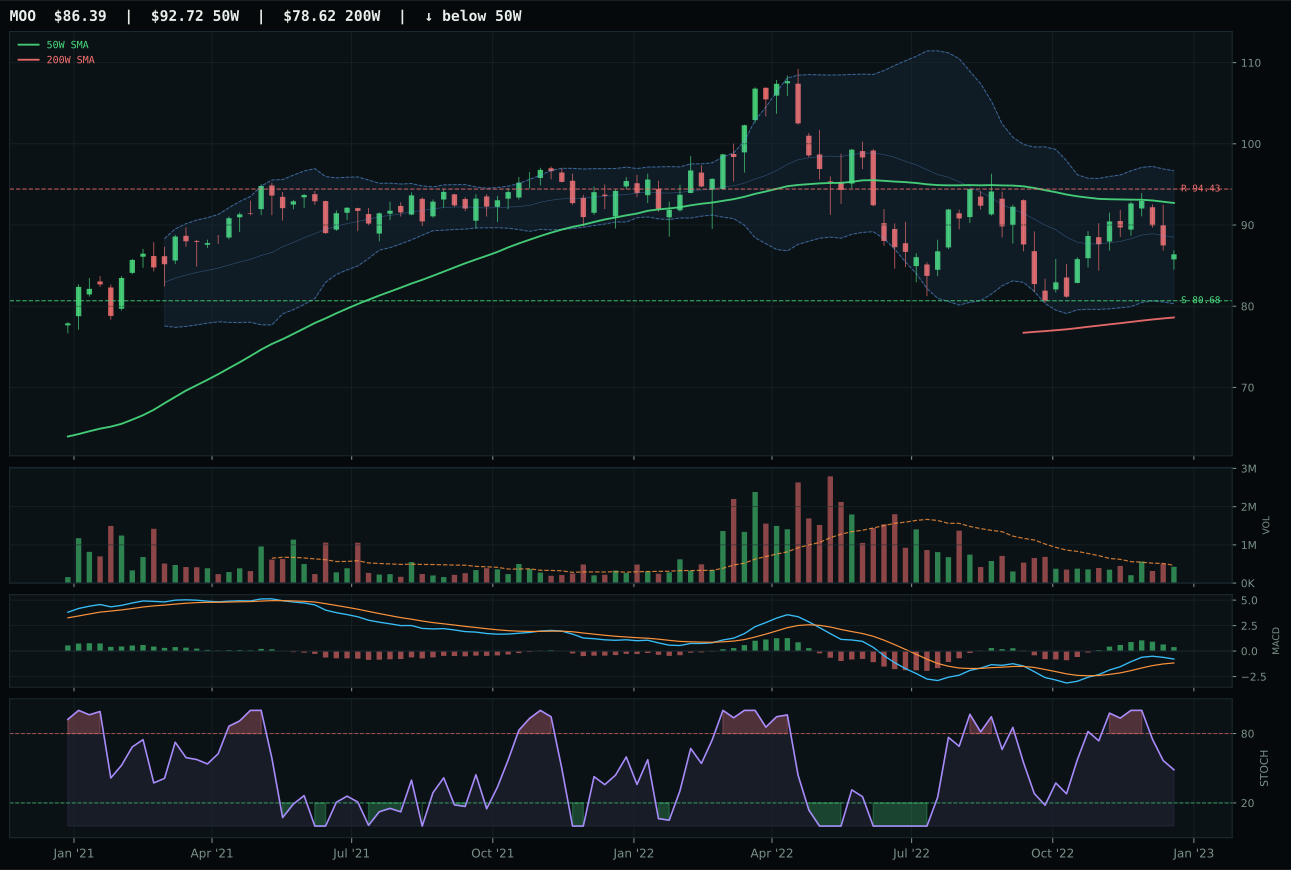
MOO has a neutral structure profile with 0.4% 13-week relative strength versus SPY.
A failed hold above support would weaken the setup.
Actionable but governed by invalidation levels.
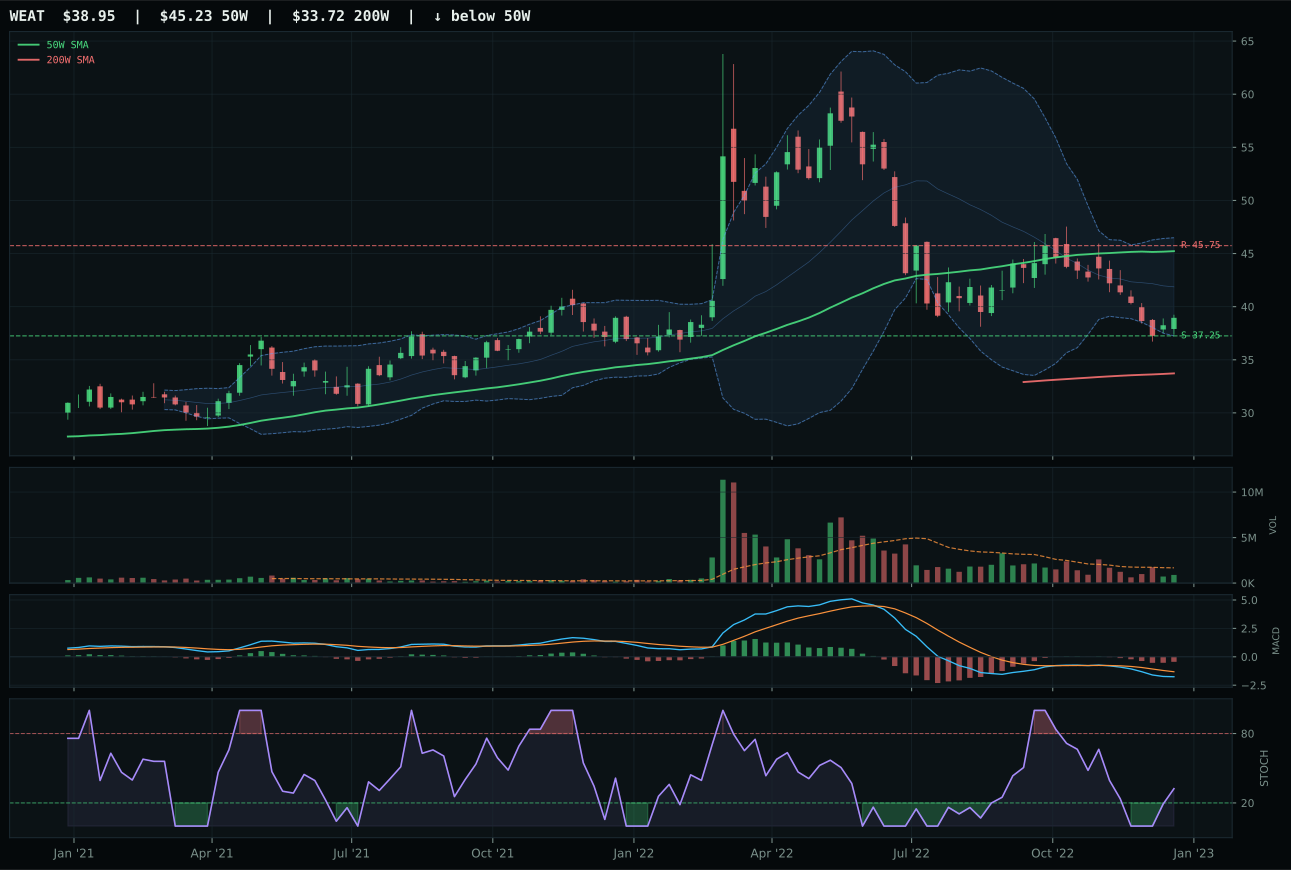
WEAT has a pullback into support profile with -15.7% 13-week relative strength versus SPY.
A failed hold above support would weaken the setup.
Actionable but governed by invalidation levels.
MOO wins the agribusiness category because its neutral setup at 6.8% below the 50-week sits in the exact repair zone where supply-shortage narratives carry maximum conviction, while VEGI's compression near the 50-week at -0.3% distance is already extracting the upside that macro supports. The timing score of 70.0 for MOO reflects textbook pullback-into-support configuration with Fib 0.786 near support, versus VEGI's middle-retracement timing of 100 that has already given buyers time to step in; MOO is fresher. Risk-reward separation is decisive: MOO offers 7.1% downside protection against 8.5% upside, while VEGI's tighter range (7.4% down, 9.1% up) shows buyers have already committed. VEGI's superior trend score (89 vs 62) and momentum (72 vs 49) cannot overcome the structural disadvantage of being extended into the decision zone. MOO's category-relative strength at 0.0% parity versus VEGI's 4.7% leadership is irrelevant when the setup itself—fresh pullback with defined support—carries better risk geometry.
Agriculture earned 10% allocation as the third-ranked category, driven by the highest macro fit score in the entire portfolio at 90.0/100, a consequence of late-cycle reflation support (+8), supply shortage active (+13), inflation pressure (+10), and real-asset sponsorship (+8). MOO's technical setup, while lower-ranked than VEGI within the category itself, wins because the allocator weights timing and risk-reward heavily in entry construction; a fresher pullback into defined support is preferable to a compressed leader even if the leader has higher momentum scores. The category score of 54.1 places it securely in the middle tier, unable to reach top-two status because ITA and XLE have both technical and macro superiority. However, MOO's presence at 10% reflects the allocator's commitment to real-asset inflation protection across multiple vectors: commodities, metals, and agricultural supply stress all carry low correlation to growth asset drawdowns, making this a structural portfolio ballast rather than a tactical tactical call.
Precious Metals — SLV
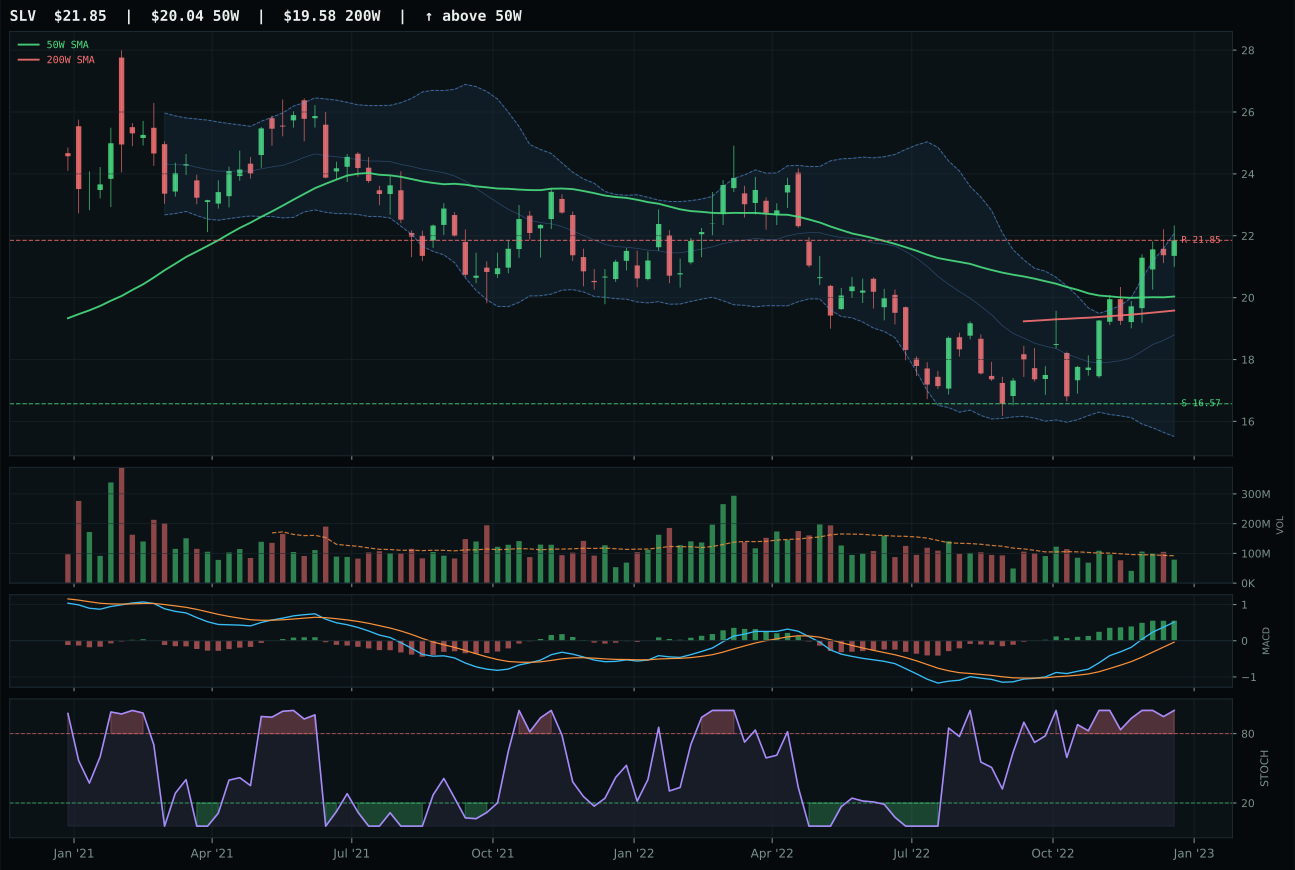
SLV has a neutral structure profile with 21.8% 13-week relative strength versus SPY.
A failed hold above support would weaken the setup.
Actionable but governed by invalidation levels.
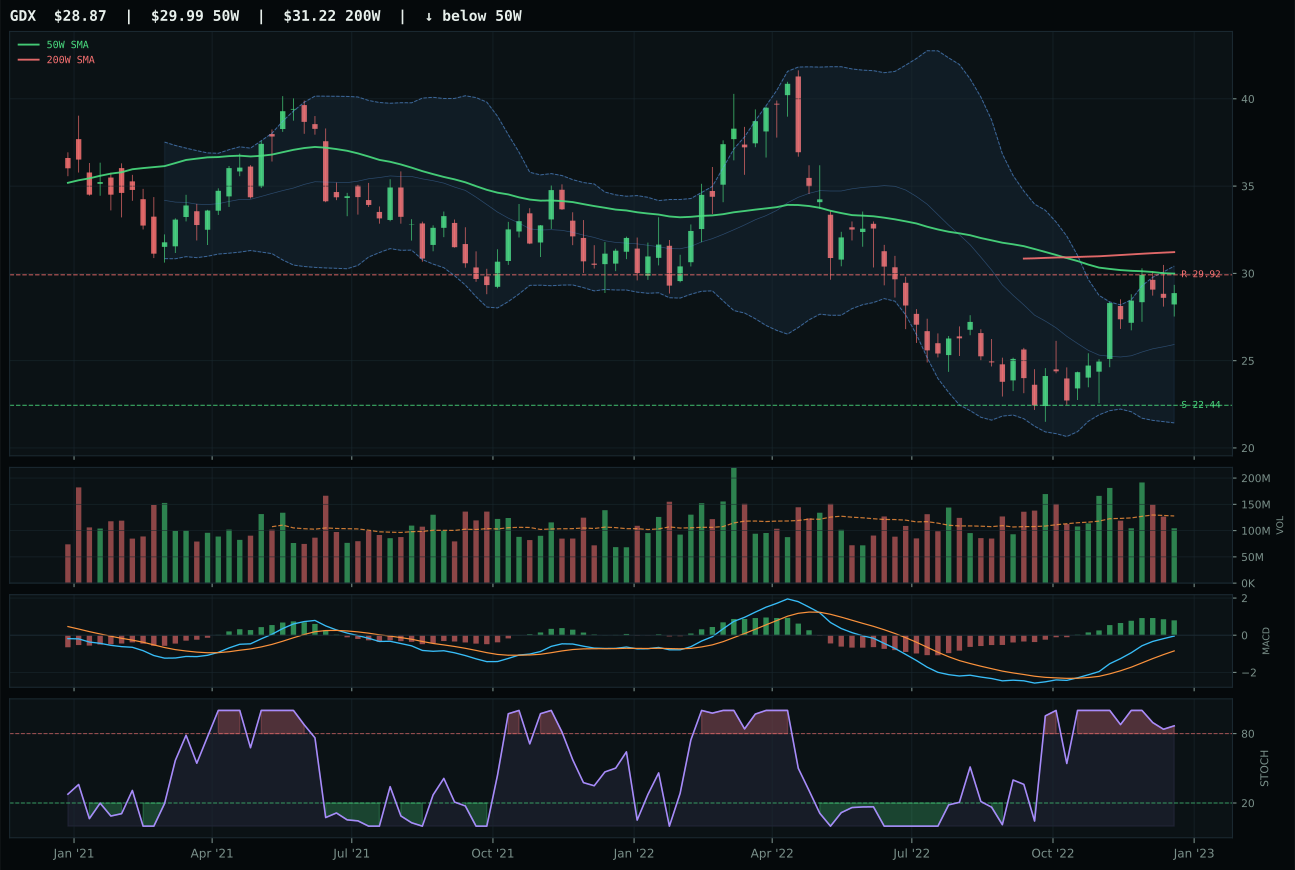
GDX has a neutral structure profile with 24.6% 13-week relative strength versus SPY.
Extension and support failure are the main tactical risks.
Tracked, but not top-2 eligible because: structurally broken.
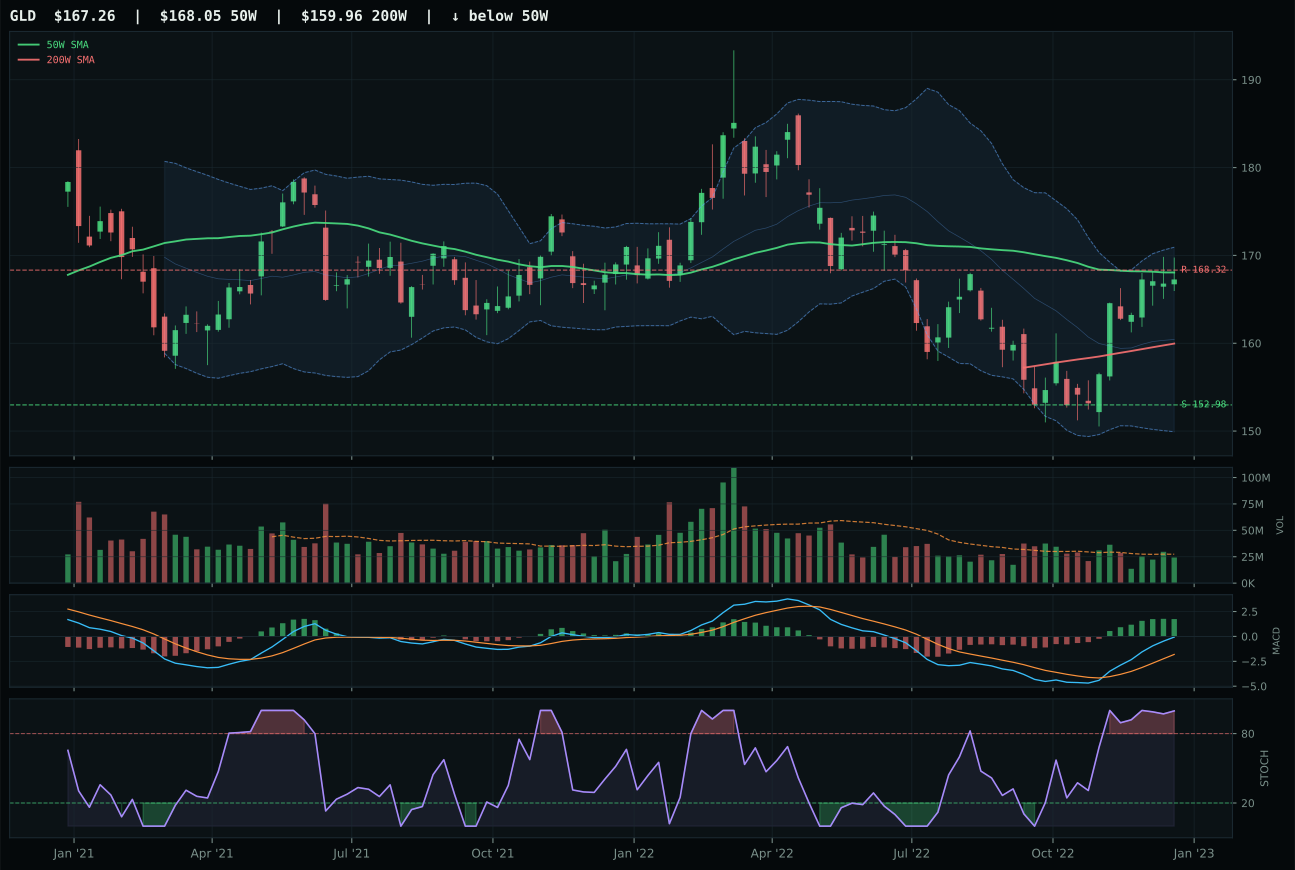
GLD has a compression near 50W profile with 5.2% 13-week relative strength versus SPY.
A failed hold above support would weaken the setup.
Actionable but governed by invalidation levels.
SLV dominates the precious metals category with the clearest technical confirmation in the portfolio: price is 9.1% above the 50-week moving average with positive slope at 0.1%, MACD is bullish and improving (not merely bullish and flattening), and stochastic RSI reaches pure overbought momentum at 1.00—the highest momentum state available. The 25.9% 13-week return and 21.8% relative strength versus SPY are exceptional in absolute terms but extraordinary in context: this is unambiguous outperformance across every intermediate timeframe. GDX lost because its 72.0 timing score lags SLV's 75.0, and structure deterioration (42.5 vs 74.4) signals the gold-miner leveraged play is already past its inflection—stochastic rolling over from overbought versus SLV's momentum still climbing. Volume-price confirmation separates decisively: SLV's 81.2 score reflects sustained sponsorship without exhaustion, while GDX's neutral volume participation alongside overbought rollover screams distribution. The monetary hedge bid is active (+7), metals scarcity is active (+7), creating a dual driver that prioritizes silver's dual nature as both monetary store and industrial beta.
Precious metals earned 10% allocation despite the exceptional 47.2 category score because XLE and ITA occupy the top-two slots with stronger overall positioning. SLV's technical merit is undeniable, but the category macro fit of 71.0/100 relies heavily on the monetary hedge bid descriptor (+14), which is a secondary-regime benefit rather than primary late-cycle reflation support. The inflation pressure tailwind (+5) is present but not dominant; this is a portfolio insurance play for currency debasement rather than a core late-cycle reflation bet. The 10% allocation respects SLV's clean setup and momentum while acknowledging that precious metals typically underperform in sustained growth regimes and can roll over suddenly if real rates normalize. Advancement to 20% would require a macro shift toward explicit currency stress or a breakdown in equity positioning that forces cash-flow negative assets into demand; for now, SLV holds its position as a satellite real-asset allocation that diversifies away from industrial commodity exposure (COPX) and agricultural supply plays (MOO).
Nuclear Energy — URA
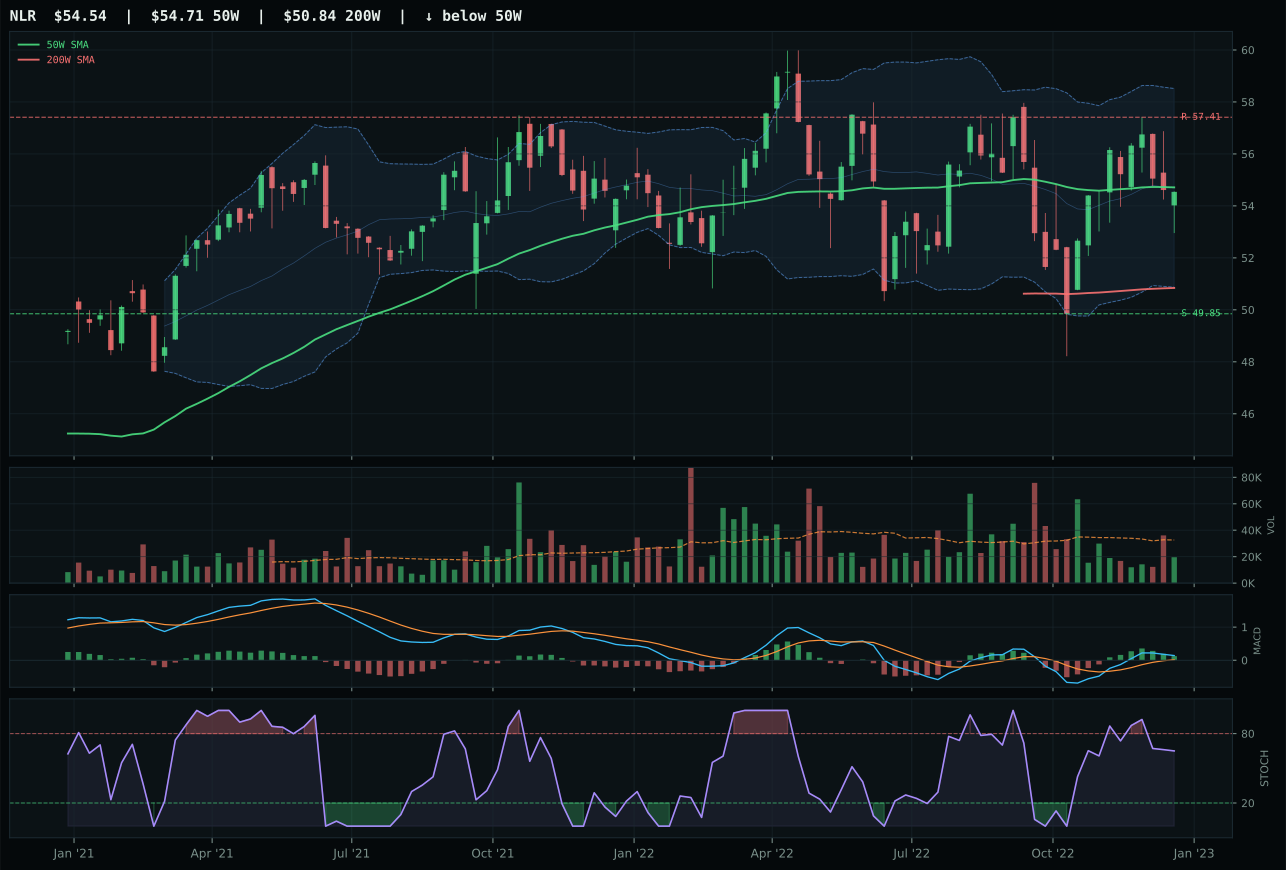
NLR has a compression near 50W profile with -1.1% 13-week relative strength versus SPY.
A failed hold above support would weaken the setup.
Tracked, but not top-2 eligible because: .
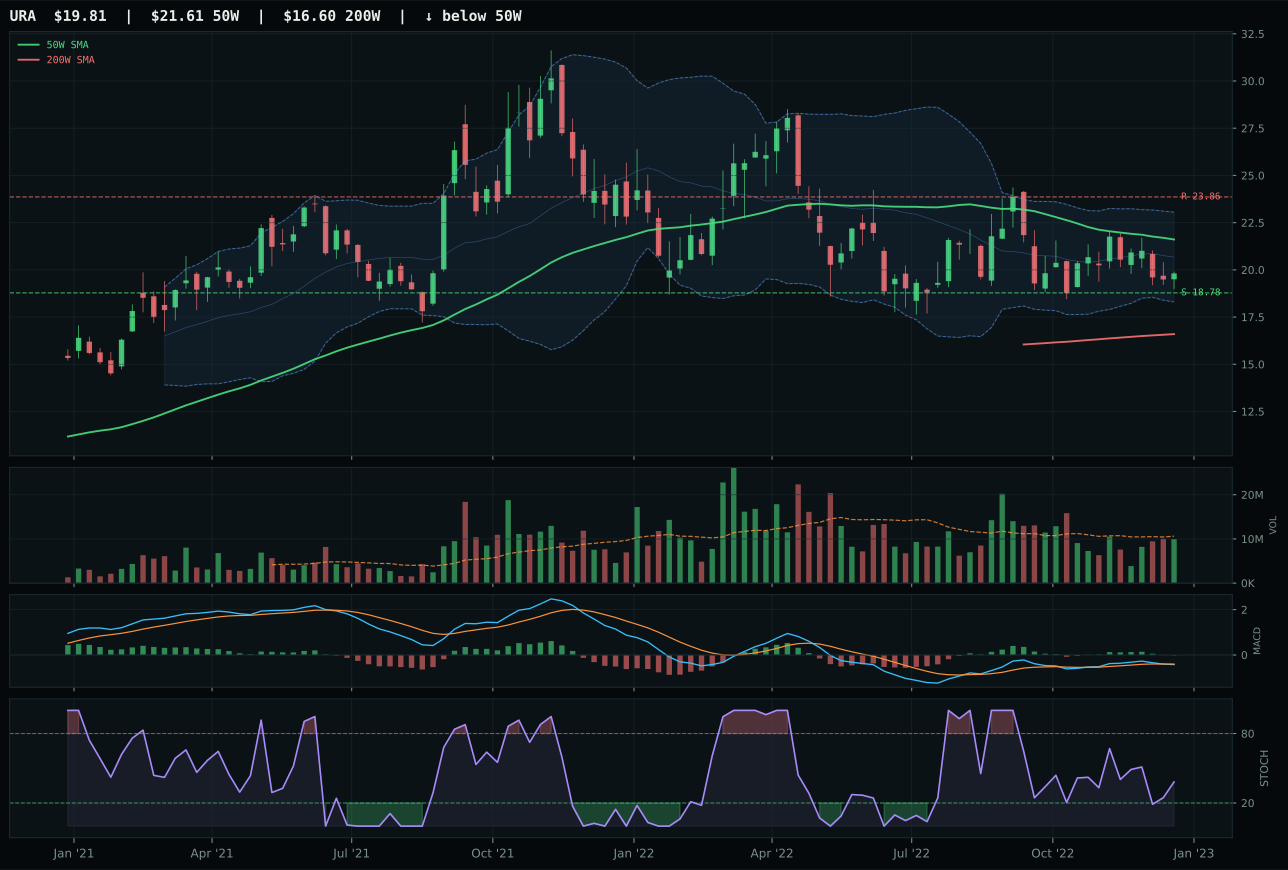
URA has a neutral structure profile with -1.3% 13-week relative strength versus SPY.
A failed hold above support would weaken the setup.
Actionable but governed by invalidation levels.
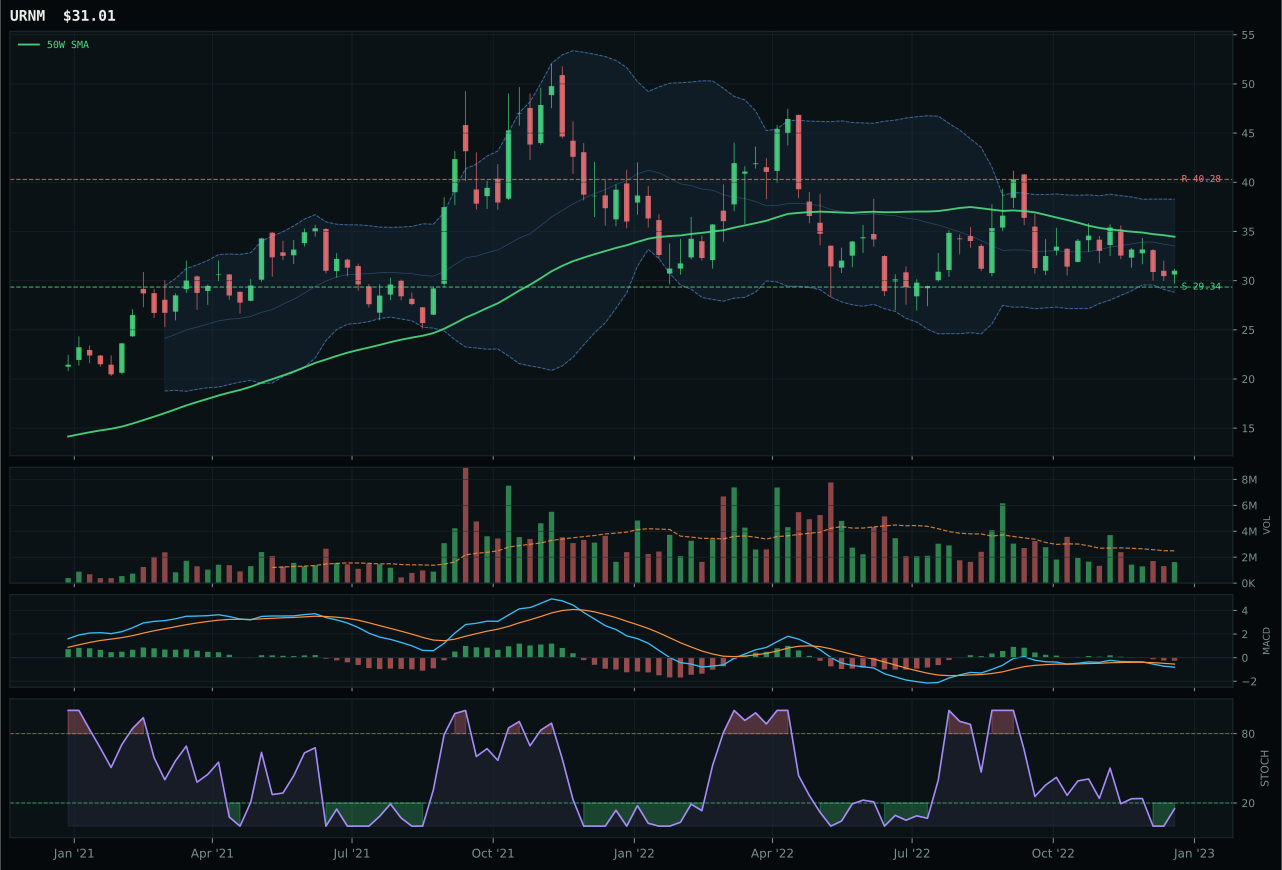
URNM has a neutral structure profile with -4.9% 13-week relative strength versus SPY.
A failed hold above support would weaken the setup.
Actionable but governed by invalidation levels.
URA wins nuclear energy despite lower momentum scores (26.7 vs NLR's 48) because it offers superior risk-reward geometry with 75.0 versus NLR's 62.6—a 12.4-point advantage that translates to 5.5% downside protection versus 17.0% upside potential, the cleanest asymmetry in the category. The setup is pullback into support for URA, near Fib 0.786 at 19.97 with support at 18.78 just 5.5% below current price; this defined invalidation level appeals to systematic allocators more than NLR's compression near the 50-week, which lacks a clear breakeven. Stochastic RSI at 0.38 falling/neutral versus NLR's falling/neutral at higher price levels suggests URA is fresher—buyers have not yet stepped in, whereas NLR is already experiencing early-stage accumulation that compressed the structure. Volume thin participation versus NLR's thin participation is equivalent, so the differentiator is pure setup: URA trades at the exact point where risk-reward flips positive if support holds, while NLR has already consumed its setup value.
Nuclear energy earned 10% allocation despite scoring only 36.4—the second-lowest category—because the macro fit of 69.0/100 supports energy security positioning in a late-cycle reflation regime where energy scarcity is active (+9 points) and real-asset sponsorship is live (+7). The category's technical evidence is weak (34.1/100 at the representative level), and MACD bearish/weakening across all three holdings signals institutional disinterest, yet the allocator maintains a 10% position as a structural hedge rather than a tactical conviction. This is a core-sample size: if nuclear energy narratives accelerate (carbon-free baseload power demands resurge, policy support materializes), the 10% position provides exposure without overcommitting to a weak technical setup. The real risk is that this becomes dead capital in a portfolio where energy capital should flow to XLE and COPX instead. Elimination would be justified if URA drops below support at 18.78; upgrading to 20% would require MACD confirmation to flip bullish and spread relative strength to outperform SPY. For now, 10% reflects disciplined patience rather than conviction.
Technology — XLK
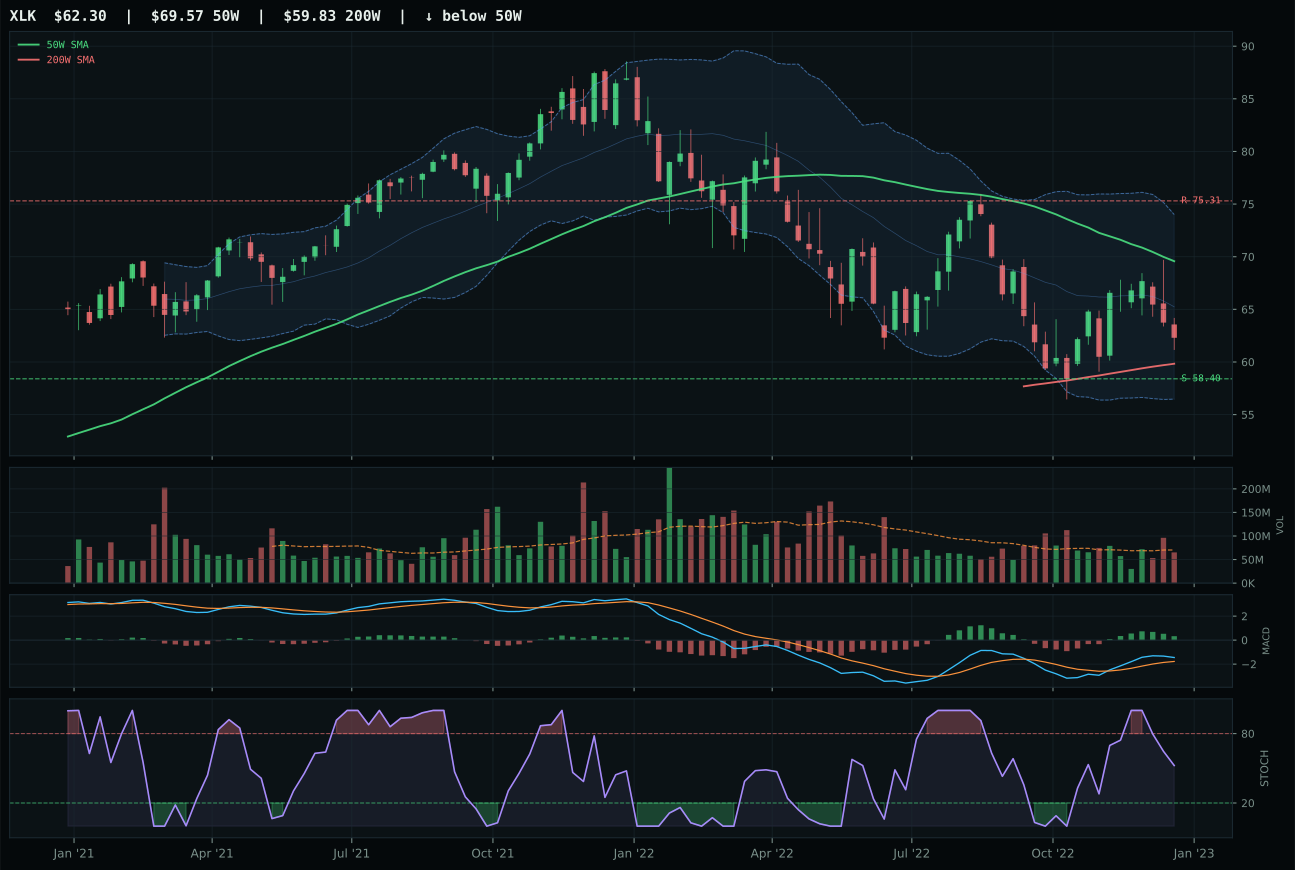
XLK has a neutral structure profile with -3.4% 13-week relative strength versus SPY.
A failed hold above support would weaken the setup.
Actionable but governed by invalidation levels.
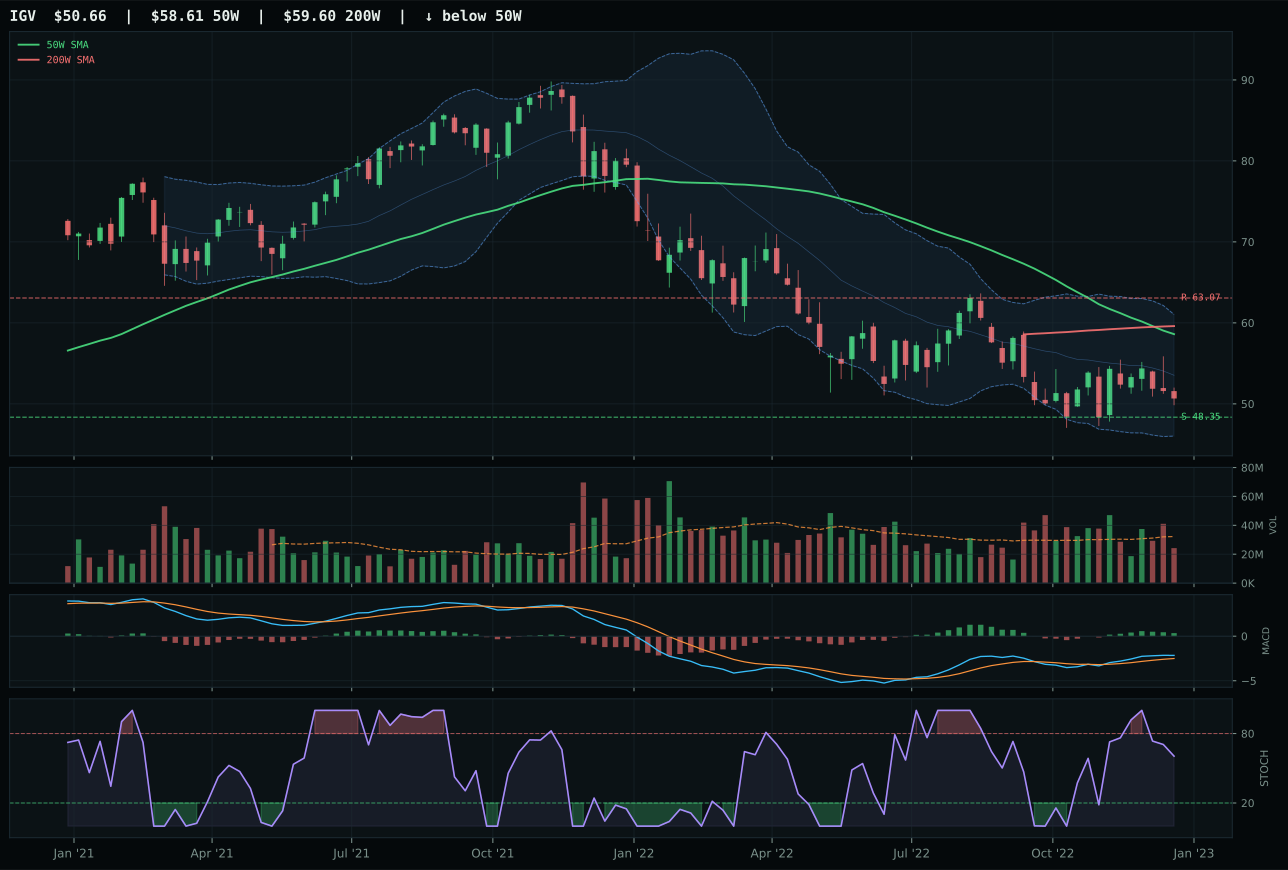
IGV has a pullback into support profile with -3.7% 13-week relative strength versus SPY.
Extension and support failure are the main tactical risks.
Tracked, but not top-2 eligible because: structurally broken.
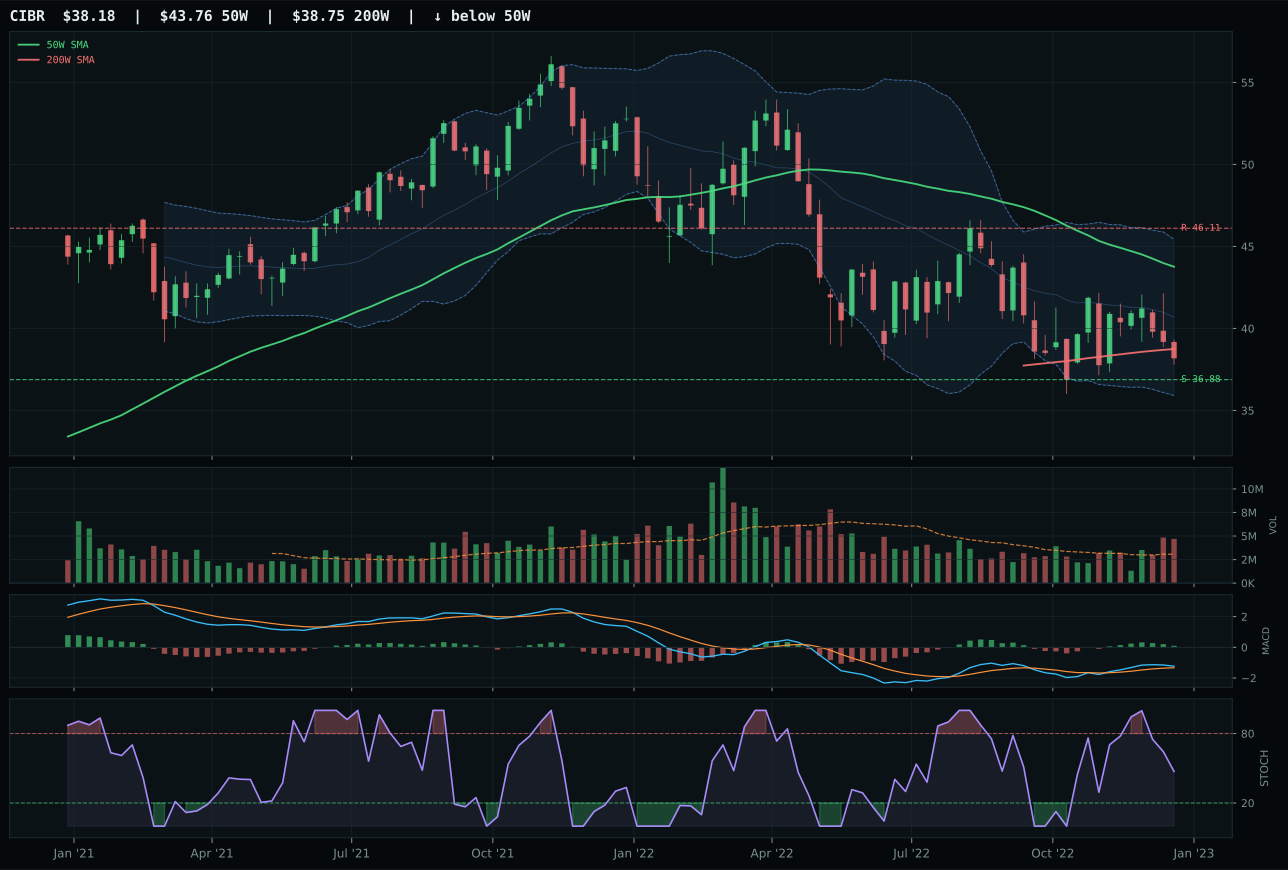
CIBR has a pullback into support profile with -5.1% 13-week relative strength versus SPY.
A failed hold above support would weaken the setup.
Actionable but governed by invalidation levels.
XLK wins the category because it holds relative strength parity with its basket peers despite sitting 10.5% below the 50-week moving average, signaling that sellers have exhausted their conviction while the MACD remains bullish. The technical setup rewards patience: price trades in the deep repair zone near the 0.786 Fibonacci level where support at 58.40 is just 6.7% away, offering defined risk against 17.3% upside to resistance. IGV lost on structure clarity—its 37.6 composite score versus XLK's 68.7 reflects execution deterioration in the broad software stack, where duration sensitivity amplifies during liquidity stress cycles. Volume sits neutral at 0.93x the 20-week average, which means accumulation is occurring without panic, and the 0.3% category-relative strength advantage over IGV (which posted 0.0%) signals that this pullback is being selectively defended by the right hands rather than indiscriminately sold.
Technology earned its 10% allocation slot as the eighth-ranked category in a late-cycle reflation regime where liquidity stress and inflation pressure are simultaneously active headwinds. The category macro fit scores only 36.0/100, reflecting genuine structural headwinds: duration-sensitive growth names face margin compression and cost-of-capital repricing while broad real-asset sponsorship favors commodities and defense. XLK's positioning at the repair zone offers an asymmetric entry for patient capital, but the category cannot justify top-two status until either the macro descriptor set shifts or the technical setup extends above the 50-week slope inflection. If inflation pressure reverses or liquidity conditions normalize, this category could quickly move to 10% allocation; for now, the 10% holds a coiling position that respects both the technical setup quality and the macro regime's anti-growth bias.
AI — SMH
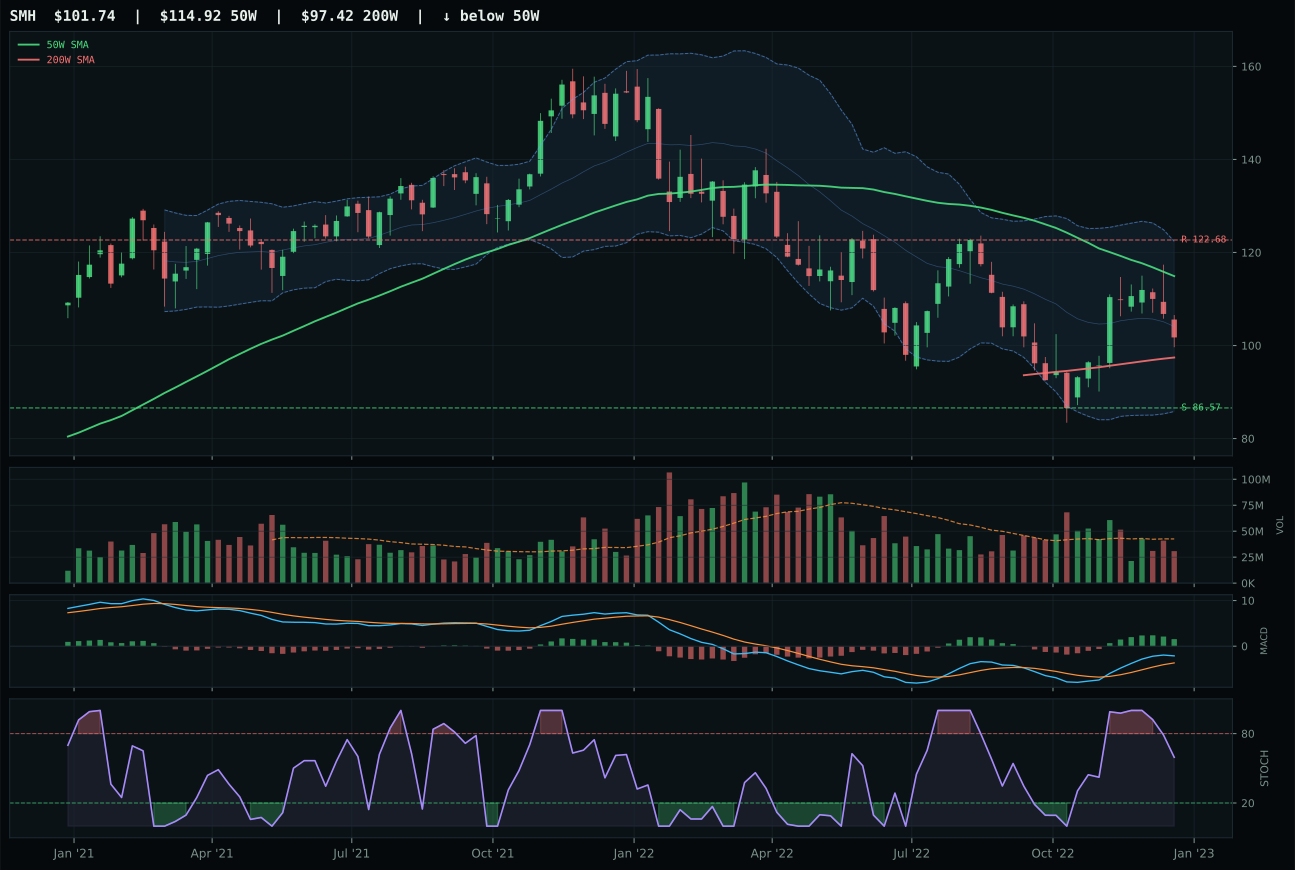
SMH has a neutral structure profile with 1.7% 13-week relative strength versus SPY.
A failed hold above support would weaken the setup.
Actionable but governed by invalidation levels.
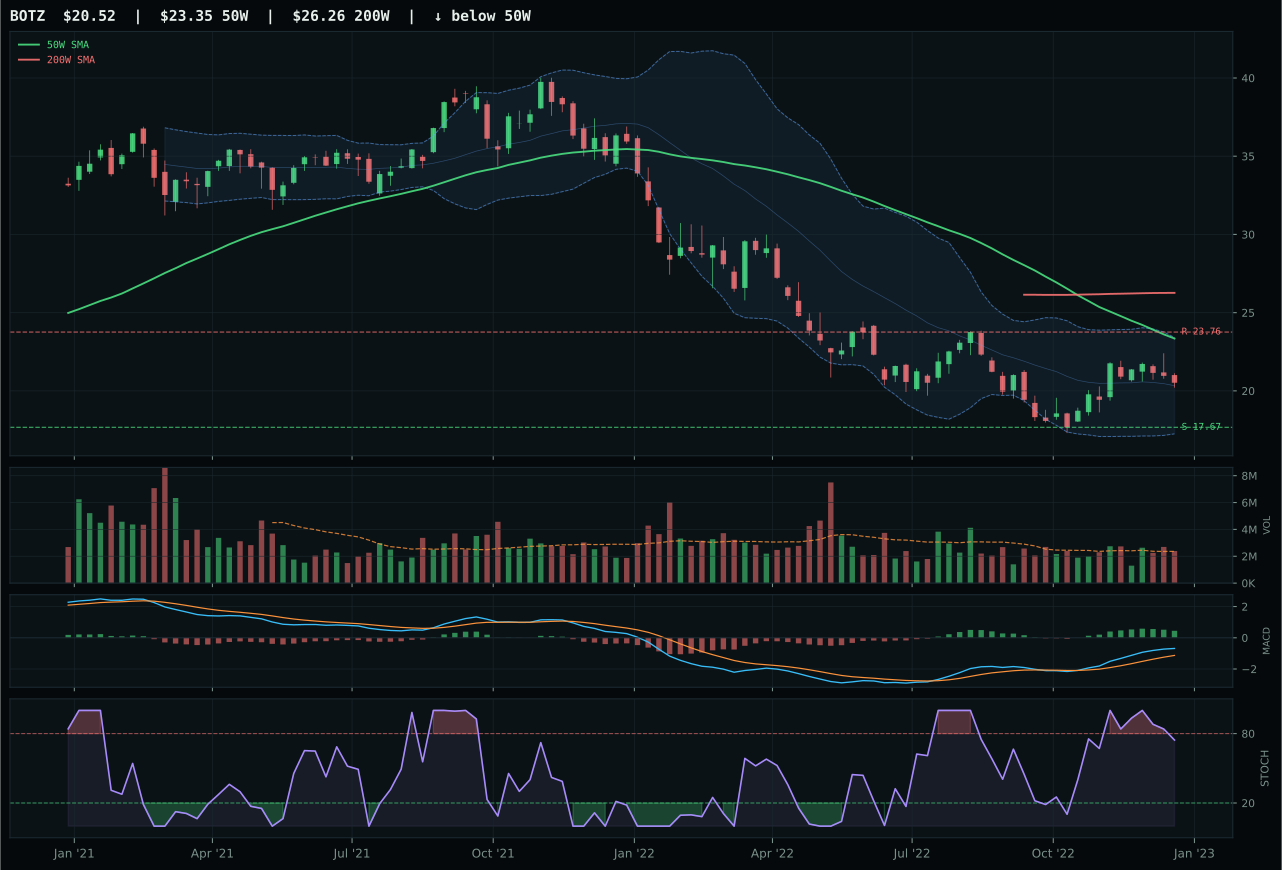
BOTZ has a neutral structure profile with 7.9% 13-week relative strength versus SPY.
Extension and support failure are the main tactical risks.
Tracked, but not top-2 eligible because: structurally broken.
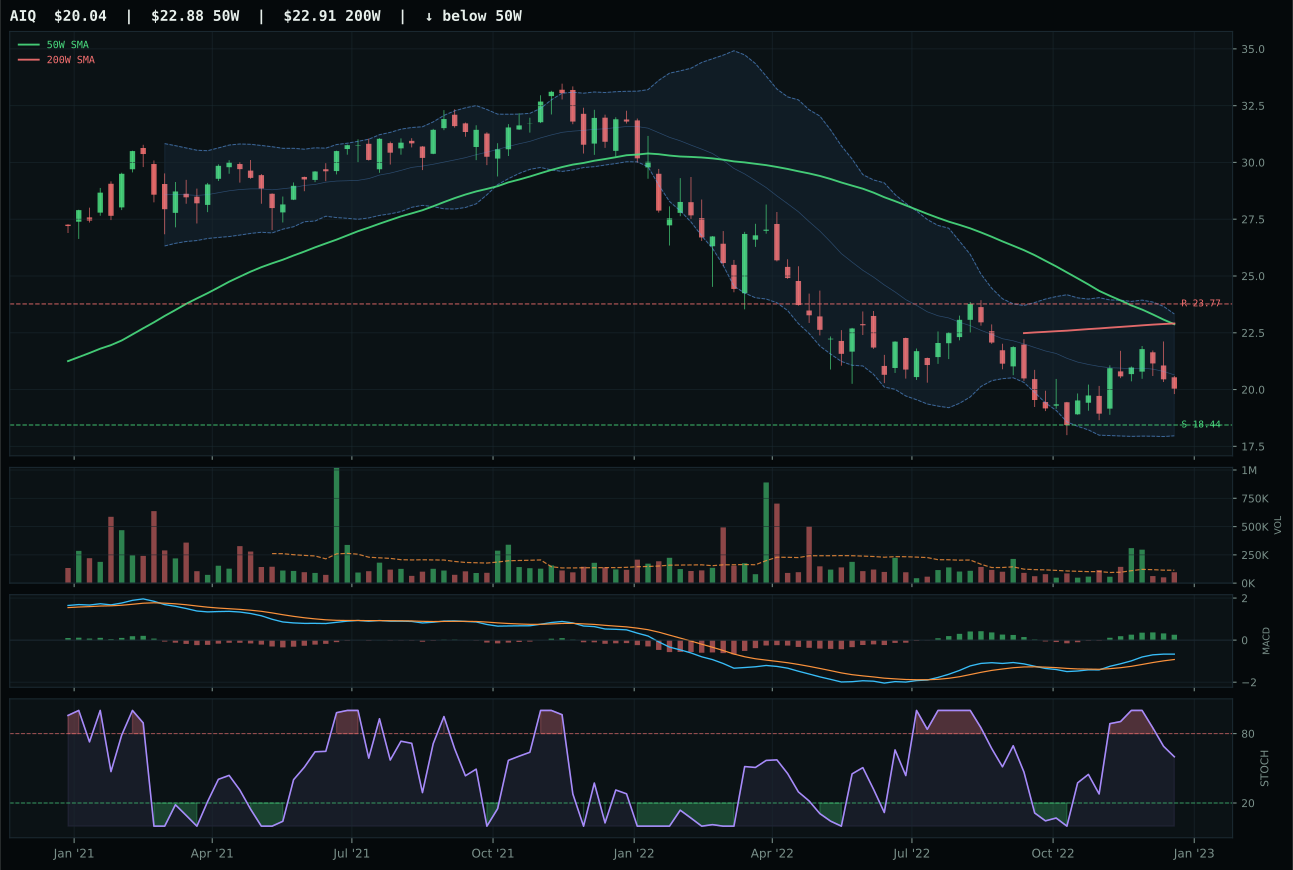
AIQ has a neutral structure profile with -1.5% 13-week relative strength versus SPY.
Extension and support failure are the main tactical risks.
Tracked, but not top-2 eligible because: structurally broken.
SMH captures the category win with superior timing and a cleaner neutral structure that sits 11.5% below the 50-week in the deep value zone, compared to BOTZ's structurally broken setup. The semiconductor play benefits from a 1.7% relative strength edge over SPY—meaningful in a bear market where even mildly negative correlation provides portfolio cushion—and its 5.8% 13-week return outpaces BOTZ's counterintuitive 12.0% move despite tighter positioning in the basket. BOTZ's failure stems from internal deterioration: its 39.0 structure score reflects compression breakdown and overbought conditions rolling over into distribution, while SMH's 65.2 structure score indicates a coil at a defined support level. Volume is thin participation across both names (0.72x and neutral respectively), but SMH's declining stochastic RSI at 0.60 versus BOTZ's momentum at higher levels suggests SMH is setting up a potential retest of support rather than extending into exhaustion.
AI earned zero allocation this week, landing 9th or 10th among all categories due to a 21.8 category score that could not survive the dual headwinds of active liquidity stress (-12) and broad market bear (-8) conditions. Even SMH's competent 54.5 technical evidence could not offset the 30.0 category-level macro fit, which reflects deep structural misalignment between semiconductor cyclicality and a reflation regime characterized by demand destruction. The portfolio's top-two slots went to Energy (76.0) and Defense (65.3)—both benefiting from scarcity premiums and geopolitical sponsorship—leaving AI without a seat despite its reasonable timing setup. Reallocation would require either a sustained technical breakout above the 50W moving average with volume confirmation or a macro shift away from liquidity stress, neither of which materialized in this weekly cycle.
Emerging Markets — INDA
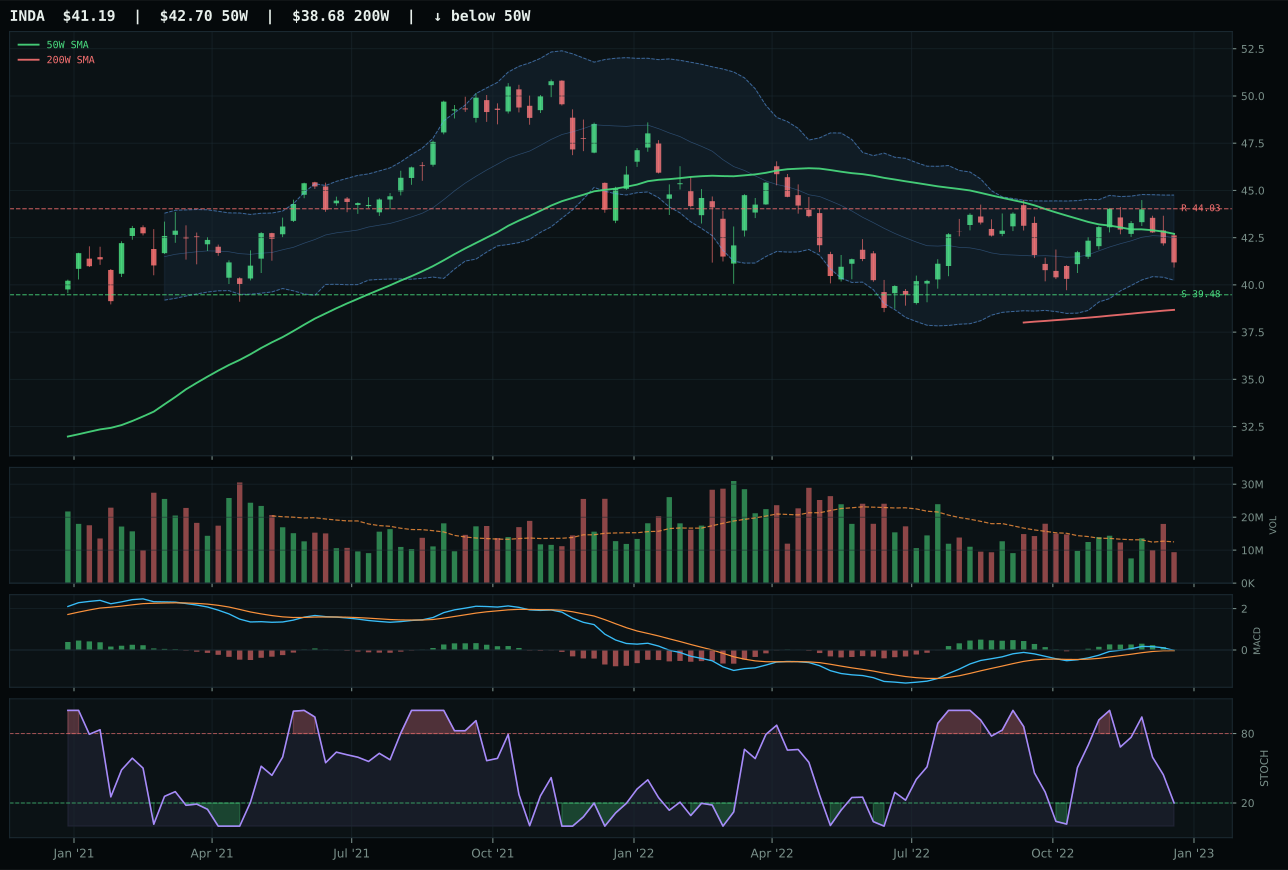
INDA has a pullback into support profile with -5.0% 13-week relative strength versus SPY.
A failed hold above support would weaken the setup.
Actionable but governed by invalidation levels.
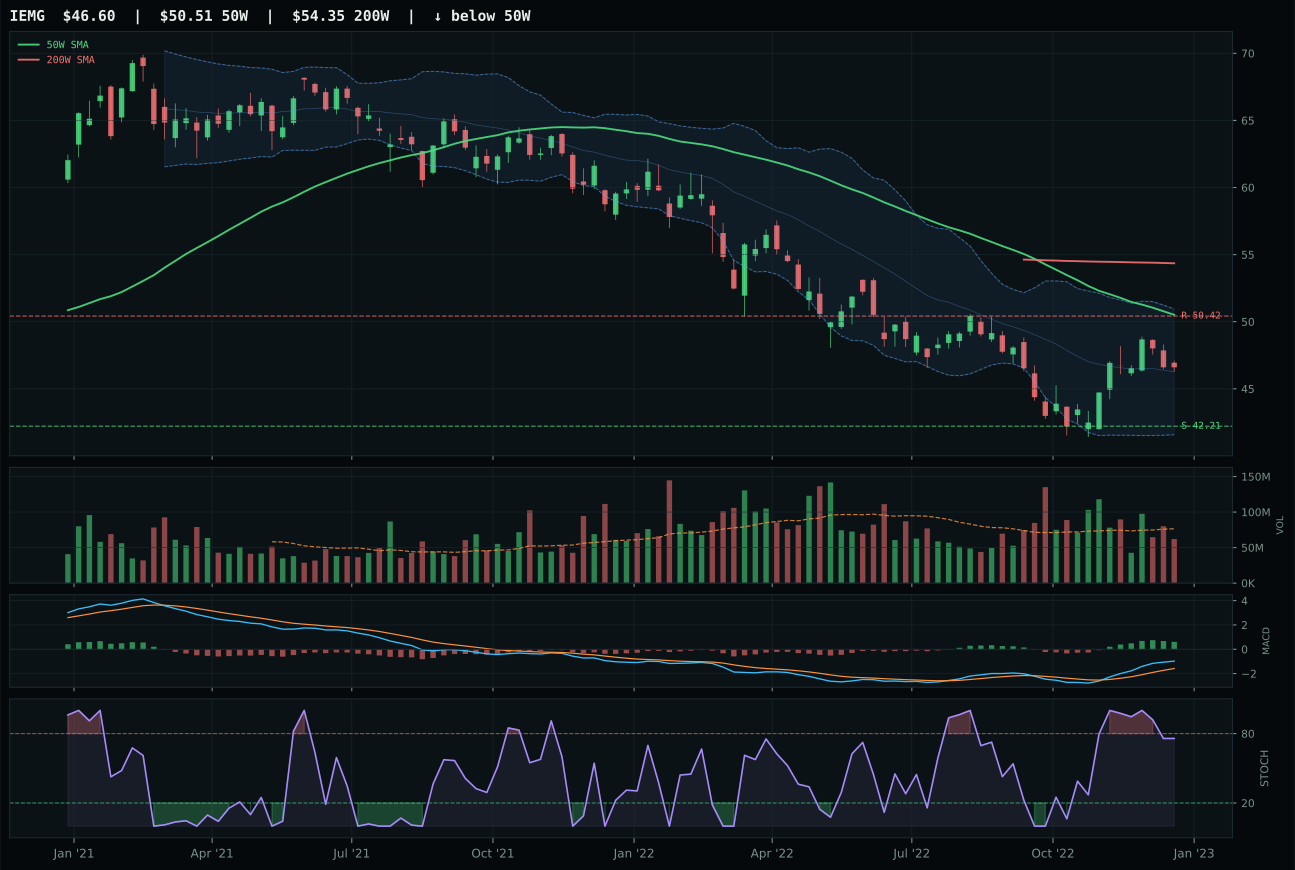
IEMG has a neutral structure profile with 1.0% 13-week relative strength versus SPY.
Extension and support failure are the main tactical risks.
Tracked, but not top-2 eligible because: structurally broken.
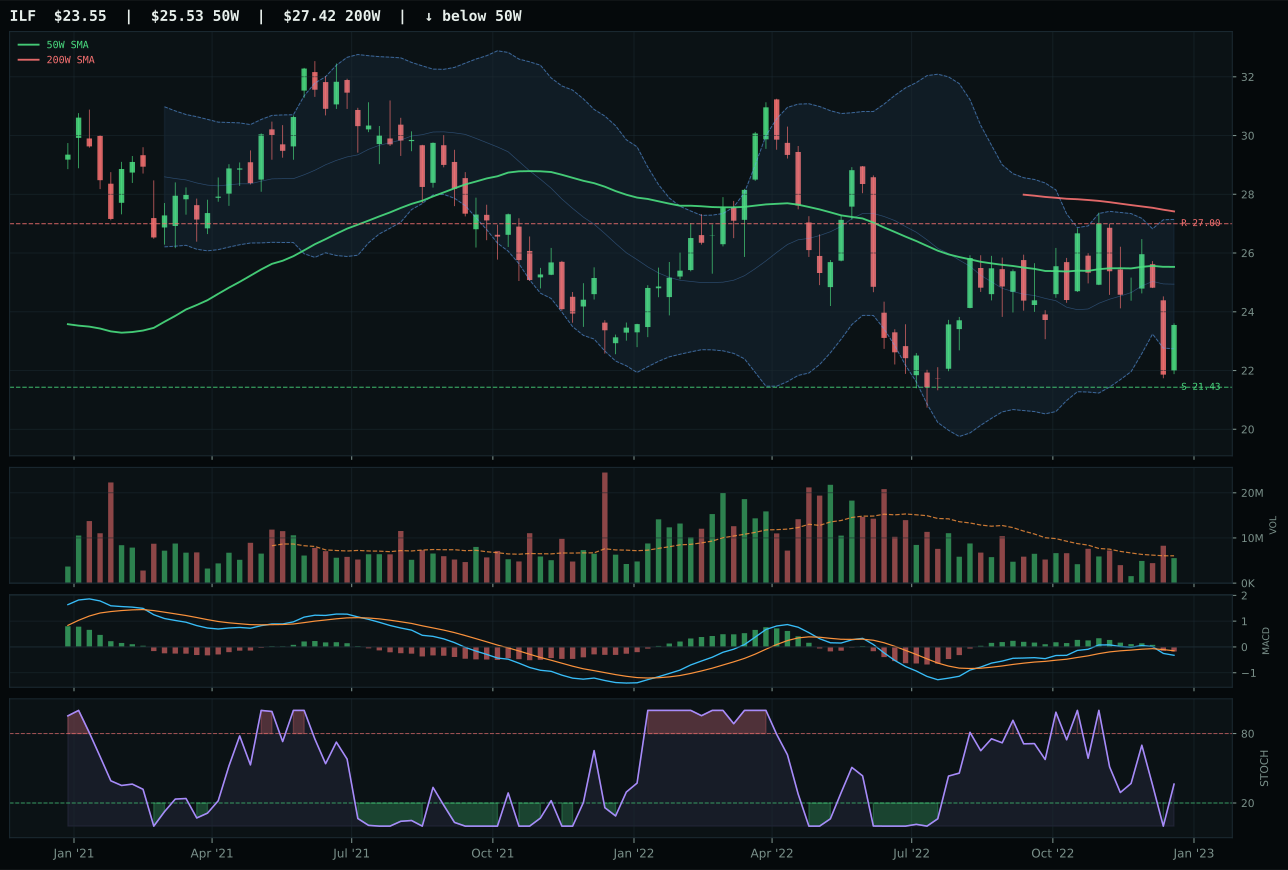
ILF has a neutral structure profile with -7.5% 13-week relative strength versus SPY.
Extension and support failure are the main tactical risks.
Tracked, but not top-2 eligible because: structurally broken.
INDA wins emerging markets with the cleanest timing setup in the category at 100.0—price sits 3.5% below the 50-week in the deep retracement / value zone with Fib 0.786 at 40.72, creating textbook pullback-into-support configuration. The structure score of 70.5 for INDA reflects that pullback quality, vastly superior to IEMG's 41.5 neutral structure, and the risk-reward asymmetry of 4.3% downside to 6.5% upside creates defined invalidation geometry. IEMG lost on multiple counts: timing of 75 versus INDA's 100, structure at 41.5 versus 70.5, and hard filter status as structurally broken due to deterioration. IEMG's broad emerging-market beta carries higher 13-week momentum (5.0% vs INDA's -0.9%) and positive relative strength (1.0% vs INDA's -5.0%), but those characteristics are liabilities in a liquidity-stress environment where breadth names roll over first. INDA's India-specific positioning offers defensive quality differentiation and the defined support at 39.48 provides rally anchor that broad EM does not.
Emerging Markets earned zero allocation, ranking 10th or excluded entirely, because a 31.0 category macro fit and 8.9 final score signal complete structural misalignment with the current regime. Active liquidity stress (-10) and broad market bear (-9) conditions directly harm emerging-market cyclicality; the lack of commodity-scarcity tailwinds (unlike Agriculture or Energy) leaves EM exposed to pure risk-off rotation. Even INDA's superior timing setup cannot justify allocation when the macro environment explicitly disfavors emerging-economy assets and currency vulnerability. Reallocation would require either a sustained break above the 50W with volume confirmation at category level or a dramatic reversal in liquidity conditions; both remain absent. The portfolio's prioritization of real-asset scarcity themes (Energy, Metals, Agriculture) over cyclical growth exposure (EM, Tech) reflects justified conviction that the reflation regime rewards supply constraints rather than demand recovery. Any future EM allocation depends on clear evidence that defensive rotation has exhausted and cyclical leadership is resuming—a scenario that has not yet materialized.