
2022-12-16
Informational purposes only. The content in this report, including allocations, analysis, and commentary, is provided solely for informational and educational purposes. It does not constitute financial advice, investment advice, trading advice, or any other type of advice. Past performance does not guarantee future results. Always conduct your own research and consult a qualified financial professional before making investment decisions.
Weekly Allocation
| Ticker | Category | Weight | Role |
|---|---|---|---|
| COPX | Industrial Metals | 20% | Top-2 (20%) |
| ITA | Defense & Aerospace | 20% | Top-2 (20%) |
| MOO | Agriculture & Livestock | 10% | Tier-2 (10%) |
| XLE | Traditional Energy | 10% | Tier-2 (10%) |
| SLV | Precious Metals | 10% | Tier-2 (10%) |
| SMH | AI | 10% | Tier-2 (10%) |
| XLU | Utilities & Infrastructure | 10% | Tier-2 (10%) |
| XLK | Technology | 10% | Tier-2 (10%) |
Trade Instructions — Monday Open
Sell the tranche from 2022-11-18 (completing its 4-week hold). Buy the new tranche. Instructions show net portfolio changes — same-asset positions cancel, weight changes show the delta.
| Action | Ticker | Instruction |
|---|---|---|
| SELL | XLE | Sell 14% of XLE position (reduce 17.50% → 15.00%) |
| SELL | URA | Sell 25% of URA position (reduce 10.00% → 7.50%) |
| SELL | VEGI | Sell 50% of VEGI position (reduce 5.00% → 2.50%) |
| SELL | GLD | Sell 50% of GLD position (reduce 5.00% → 2.50%) |
| SELL | XAR | Sell 50% of XAR position (reduce 5.00% → 2.50%) |
| BUY | ITA | Buy ITA — 40.00% of freed cash (adds 5.00% to portfolio) |
| BUY | MOO | Buy MOO — 20.00% of freed cash (adds 2.50% to portfolio) |
| BUY | SMH | Buy SMH — 20.00% of freed cash (adds 2.50% to portfolio) |
| BUY | SLV | Buy SLV — 20.00% of freed cash (adds 2.50% to portfolio) |
Current Portfolio After Trade
Combined holdings across all 4 active tranches. Each tranche is 25% of the portfolio.
| Ticker | % of Portfolio | Weight Bar |
|---|---|---|
| COPX | 17.50% | |
| XLE | 15.00% | |
| XLU | 10.00% | |
| XLK | 10.00% | |
| ITA | 10.00% | |
| URA | 7.50% | |
| MOO | 7.50% | |
| IGF | 5.00% | |
| SMH | 5.00% | |
| SLV | 5.00% | |
| VEGI | 2.50% | |
| GLD | 2.50% | |
| XAR | 2.50% |
Macro Regime — Late-Cycle Reflation
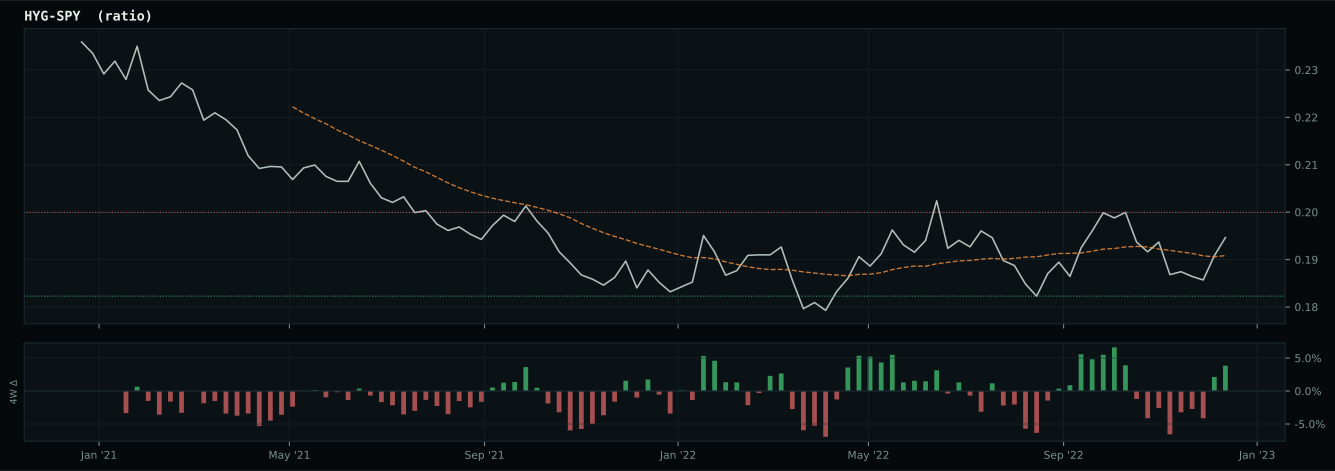
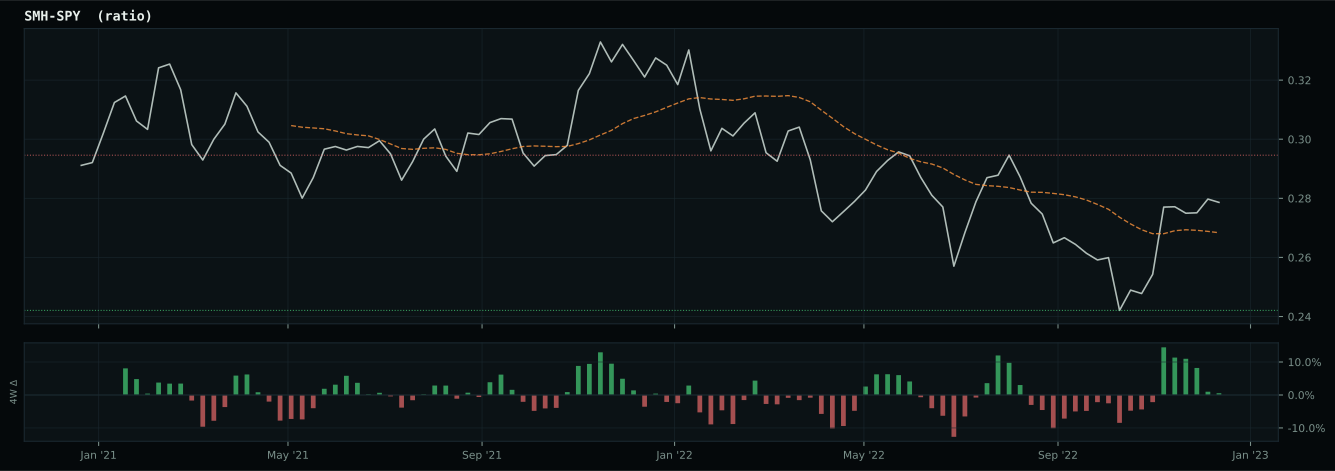
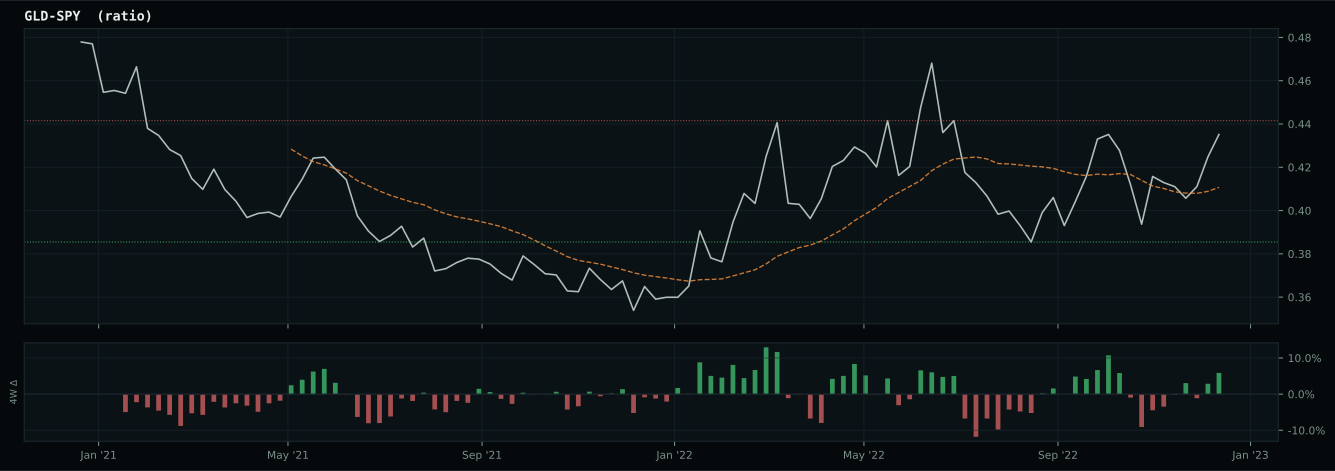
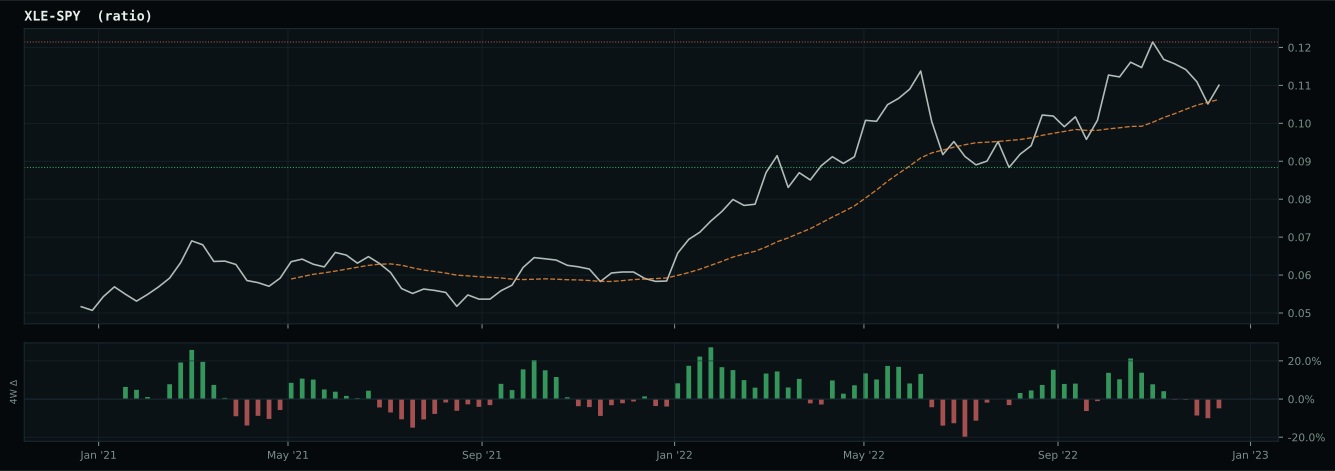
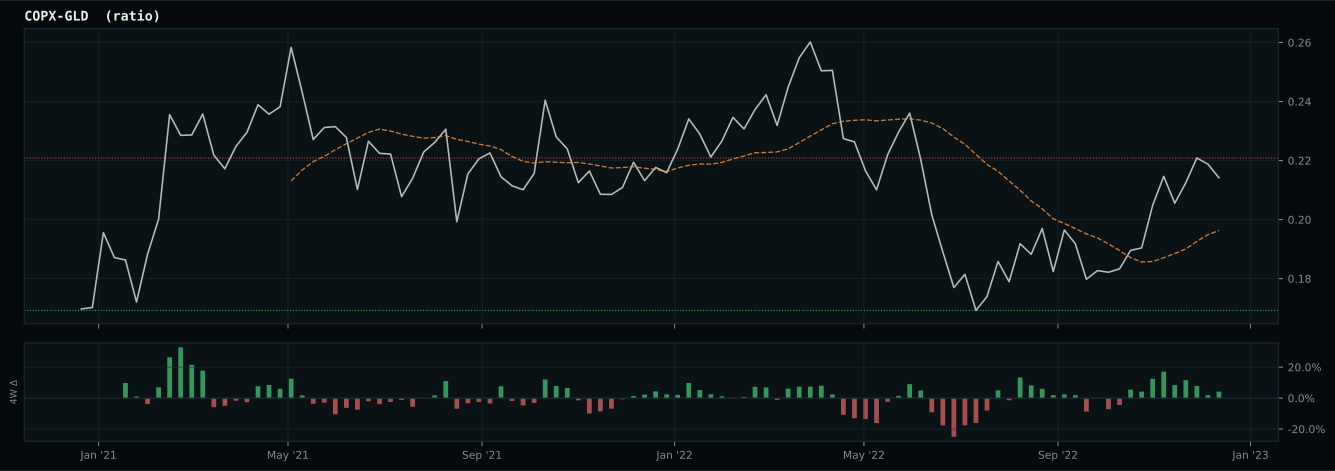
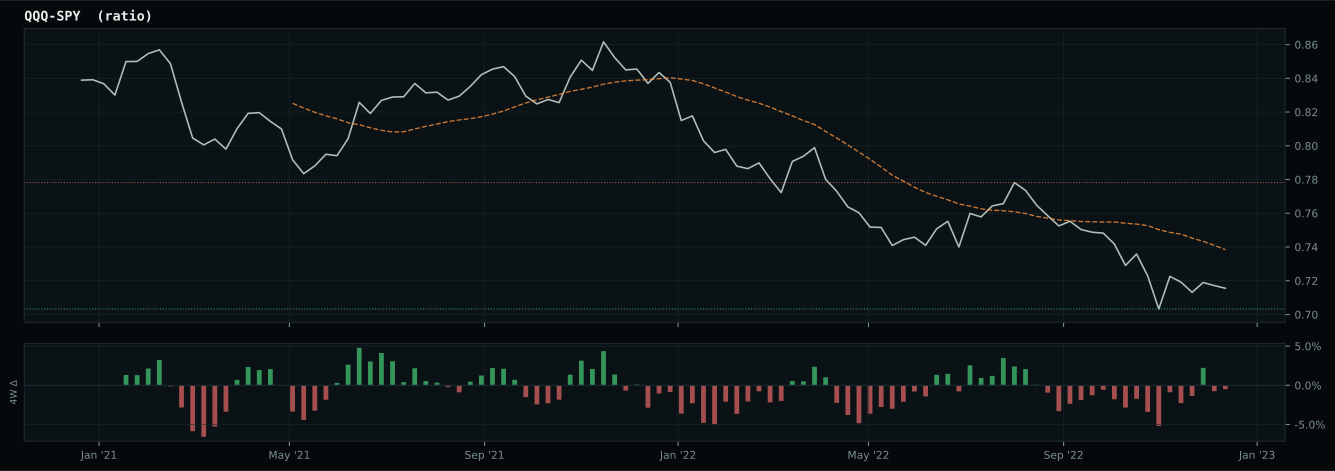
Macro Evidence Charts
Market-implied signals behind the macro regime scores. Each ratio compares two assets; the direction and slope of the ratio is what the macro engine reads.
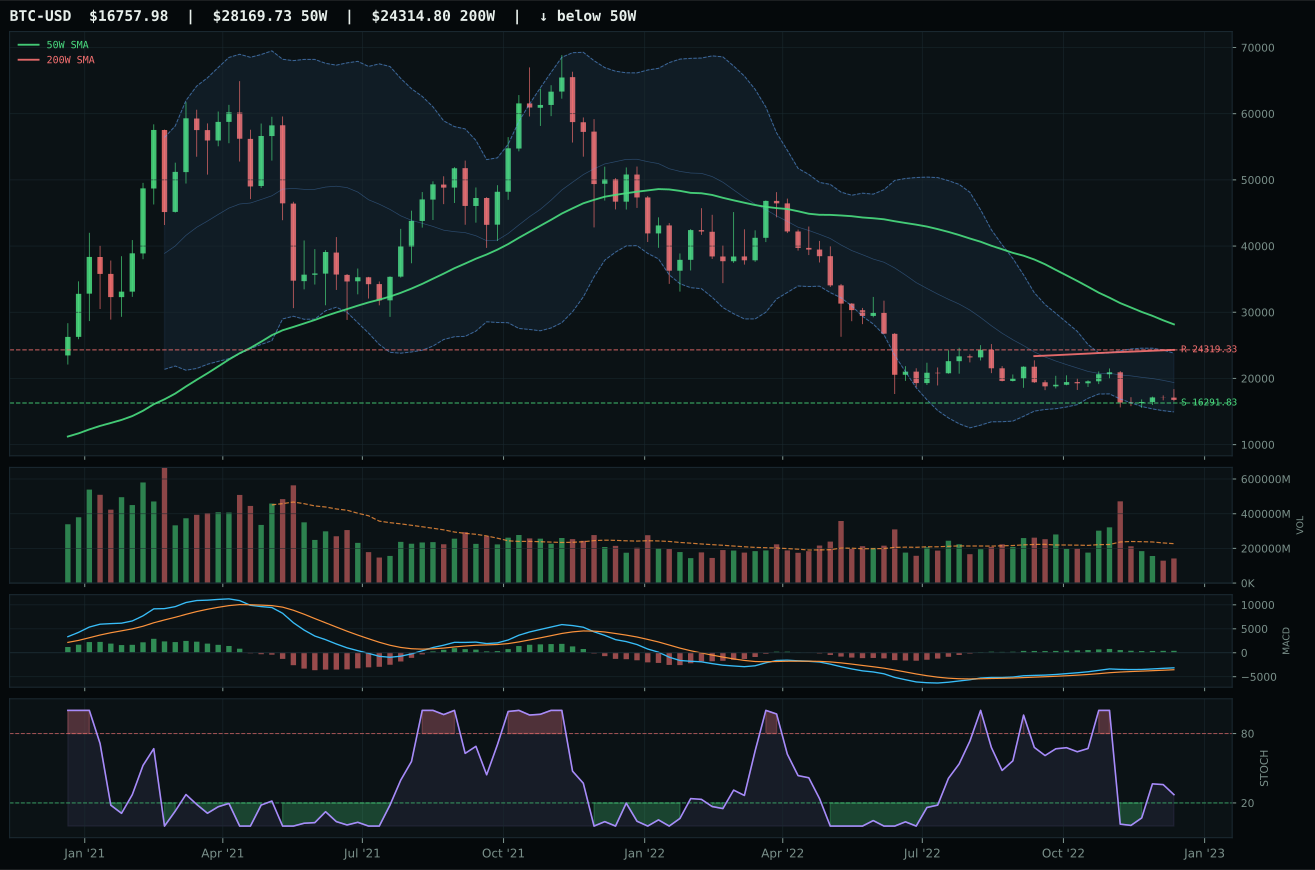
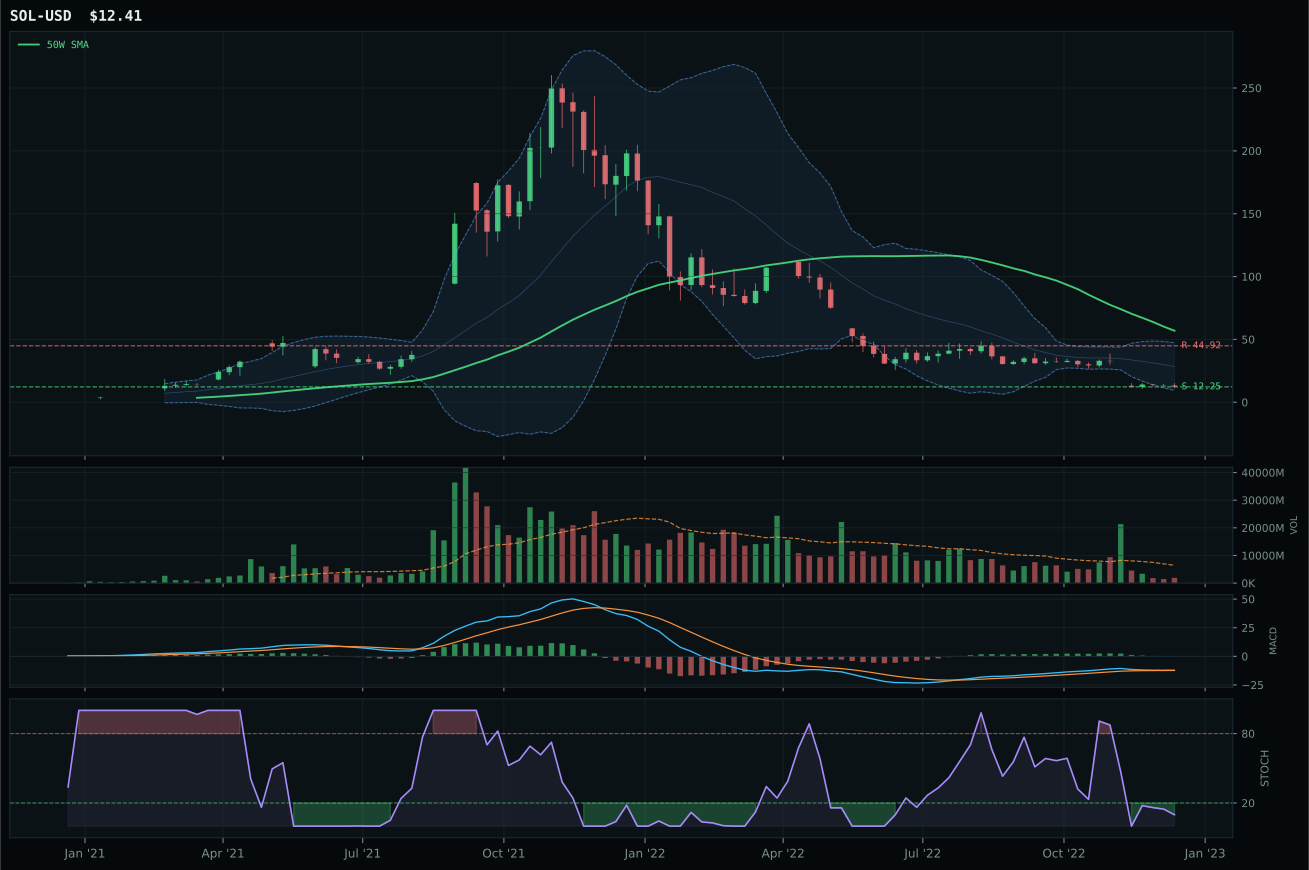
Crypto Regime — NoCrypto
ValueBTC armed; waiting for 50W reclaim, decisive close above post-touch range resistance by 3%, close above 200W, breakout volume above 20W…
TrendBTC not confirmed
one or more available conditions failed
Category Rankings
| Rank | Category | Winner | Score | Alloc | 4W Ret | Peers (4W) |
|---|---|---|---|---|---|---|
| 1 | Industrial Metals | COPX | 69.5 | 20% | +12.17% | PICK +12.4% · REMX +5.4% |
| 2 | Defense & Aerospace | ITA | 66.1 | 20% | +1.61% | XAR +5.8% · ROKT +6.5% |
| 3 | Agriculture & Livestock | MOO | 60.0 | 10% | +5.57% | VEGI +2.6% · WEAT -2.2% |
| 4 | Traditional Energy | XLE | 60.0 | 10% | +6.85% | XOP +4.0% · FCG +3.0% |
| 5 | Precious Metals | SLV | 51.6 | 10% | +3.98% | GLD +6.9% · GDX +14.4% |
| 6 | AI | SMH | 43.2 | 10% | +6.66% | AIQ +7.4% · BOTZ +8.0% |
| 7 | Utilities & Infrastructure | XLU | 41.5 | 10% | +2.63% | PAVE +6.8% · IGF +5.3% |
| 8 | Technology | XLK | 41.0 | 10% | +2.50% | IGV +2.8% · CIBR -1.4% |
| 9 | Nuclear Energy | URA | 35.6 | 0% | +13.54% | NLR +5.3% · URNM +14.3% |
| 10 | Emerging Markets | INDA | 12.6 | 0% | -0.21% | IEMG +7.3% · ILF +12.0% |
Industrial Metals — COPX
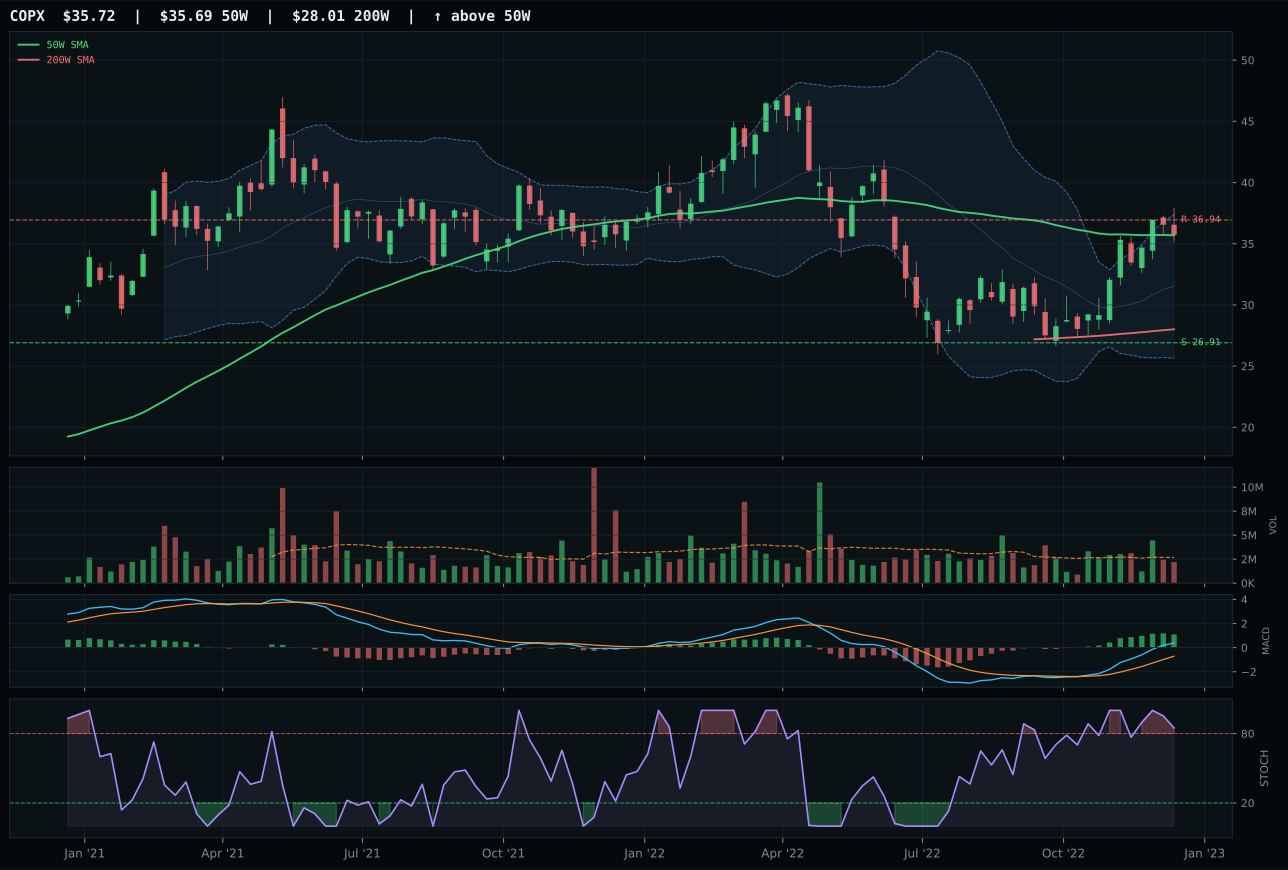
COPX has a compression near 50W profile with 20.1% 13-week relative strength versus SPY.
A failed hold above support would weaken the setup.
Actionable but governed by invalidation levels.
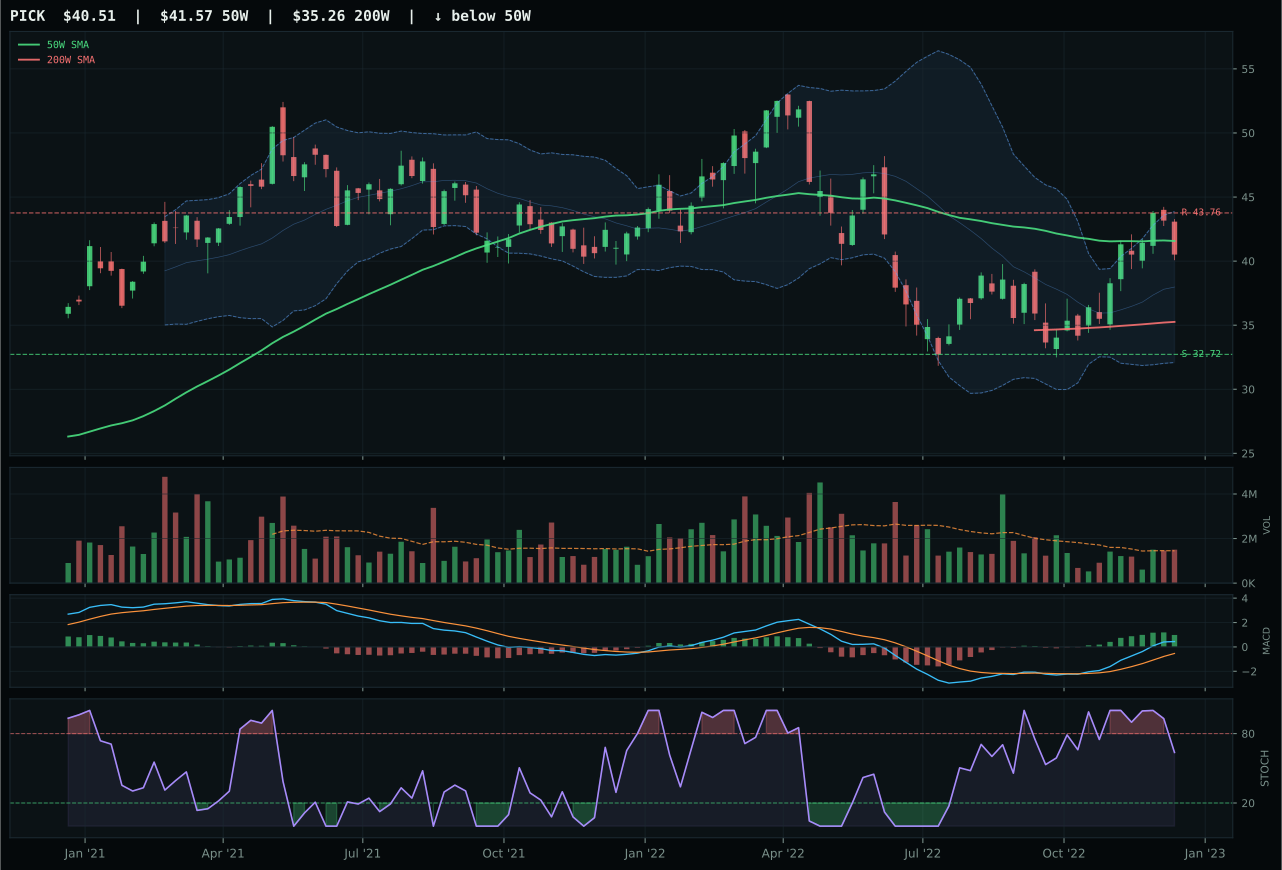
PICK has a compression near 50W profile with 13.4% 13-week relative strength versus SPY.
A failed hold above support would weaken the setup.
Actionable but governed by invalidation levels.
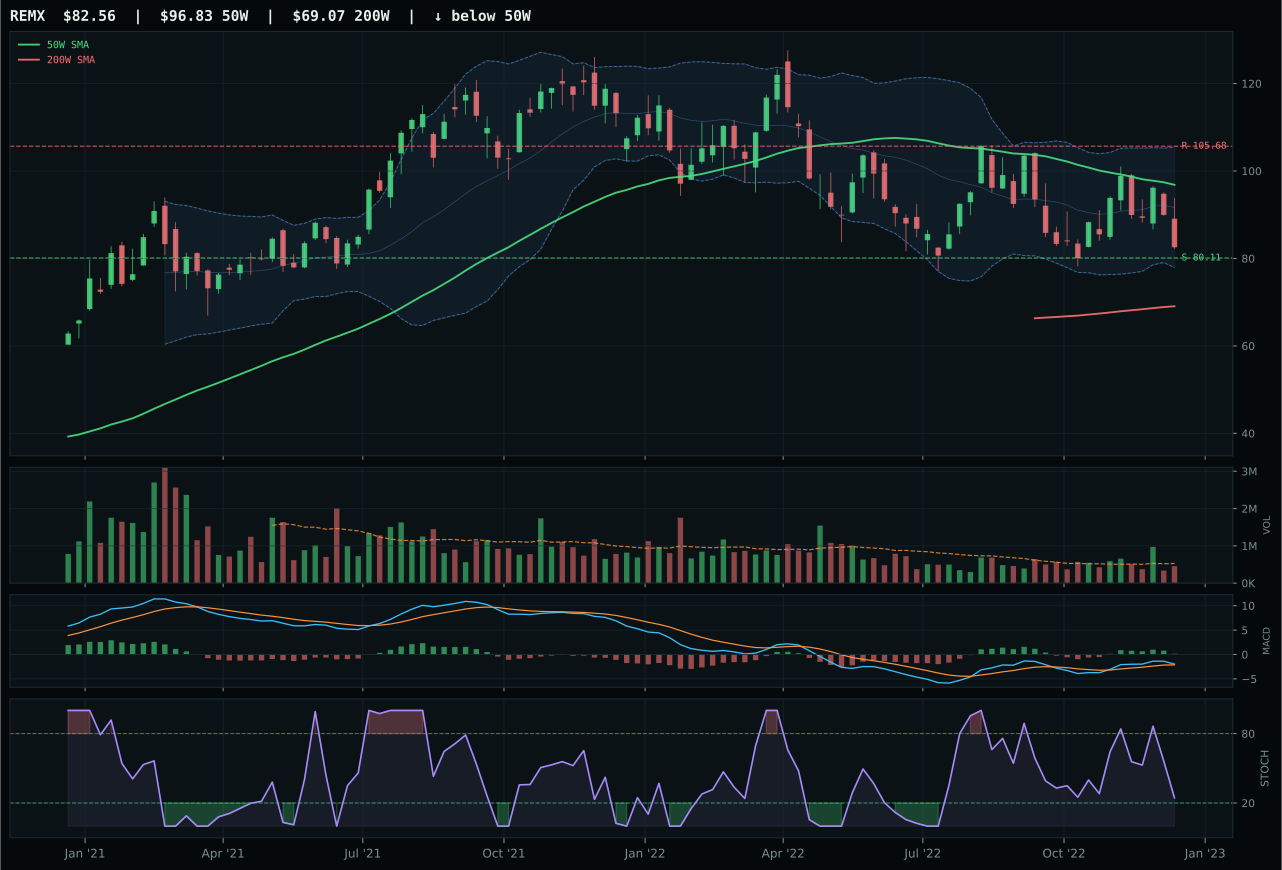
REMX has a pullback into support profile with -11.1% 13-week relative strength versus SPY.
A failed hold above support would weaken the setup.
Actionable but governed by invalidation levels.
COPX earned the top-2 slot by sitting at the perfect technical inflection: price sits flat to the 50-week (0.1% above, 89.0 timing score), compressed in structure but with MACD bullish and improving, creating a setup where any breakout runs with conviction. Its 19.5% 13-week return and 20.1% SPY relative strength are not extended—they sit at distance-to-resistance of -3.3%, meaning 3.3% to the upside before hitting the 36.94 level. Category-relative strength of 6.7% versus 0.0% for PICK proved the tiebreaker: COPX shows real breadth leadership within mining stocks. Both carry equivalent macro tailwinds (metals scarcity +12/+6), but COPX's compression setup with overbought-rolling-over stochastic creates defined invalidation at 26.91 support. This is a structure money can trust—risk is defined, reward is leveraged to any broad-market stabilization.
Industrial Metals earned its 20% top-2 allocation because it ranks second in category score at 69.5 and carries the highest macro fit for a reflation trade: metals scarcity (+14), Late-Cycle Reflation environment (+10), commodity breadth positive (+10), and real asset sponsorship (+6) align perfectly. COPX's compression near the 50-week in a still-bullish technical environment gives the portfolio a leveraged play on inflation persistence and supply constraints without stretched valuation. The 13-week return of 19.5% with neutral volume is actually conservative—the name has room to accelerate if institutional flow increases. At 20%, this is the portfolio's pure inflation-trade expression, more directional than defense but not momentum-chased. Reduce to 10% if COPX breaks below 26.91 support, which would signal inventory builds or demand destruction.
Defense & Aerospace — ITA
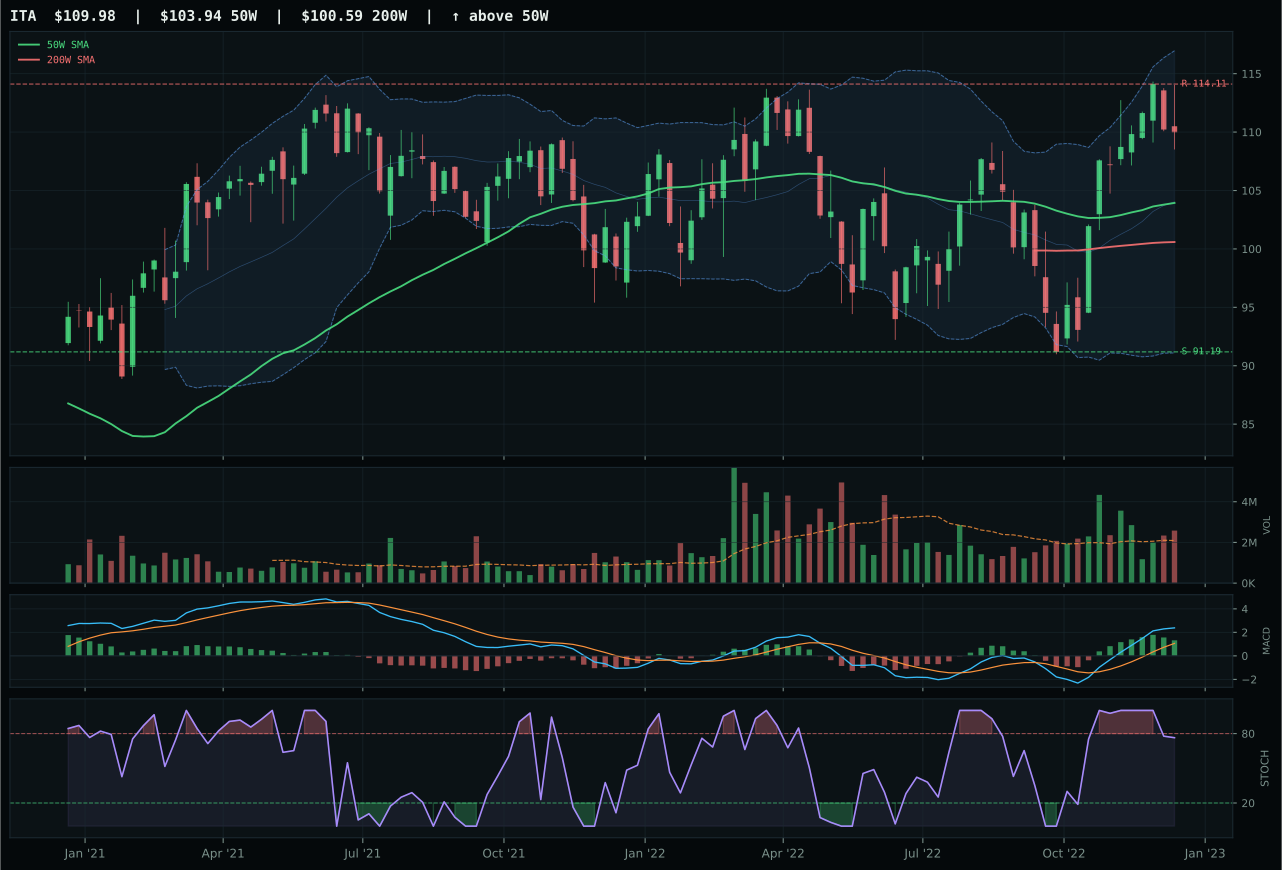
ITA has a neutral structure profile with 12.2% 13-week relative strength versus SPY.
A failed hold above support would weaken the setup.
Actionable but governed by invalidation levels.
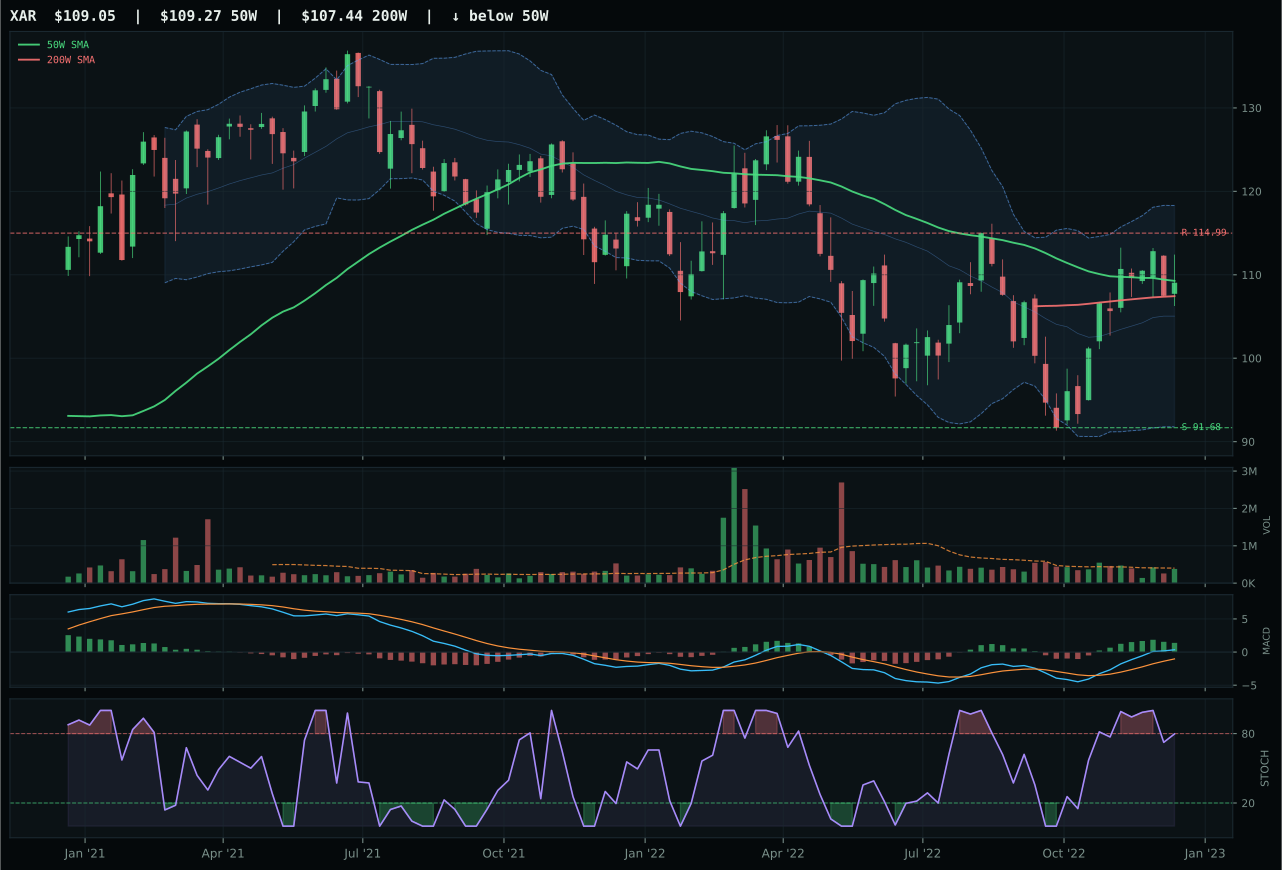
XAR has a compression near 50W profile with 9.3% 13-week relative strength versus SPY.
A failed hold above support would weaken the setup.
Actionable but governed by invalidation levels.
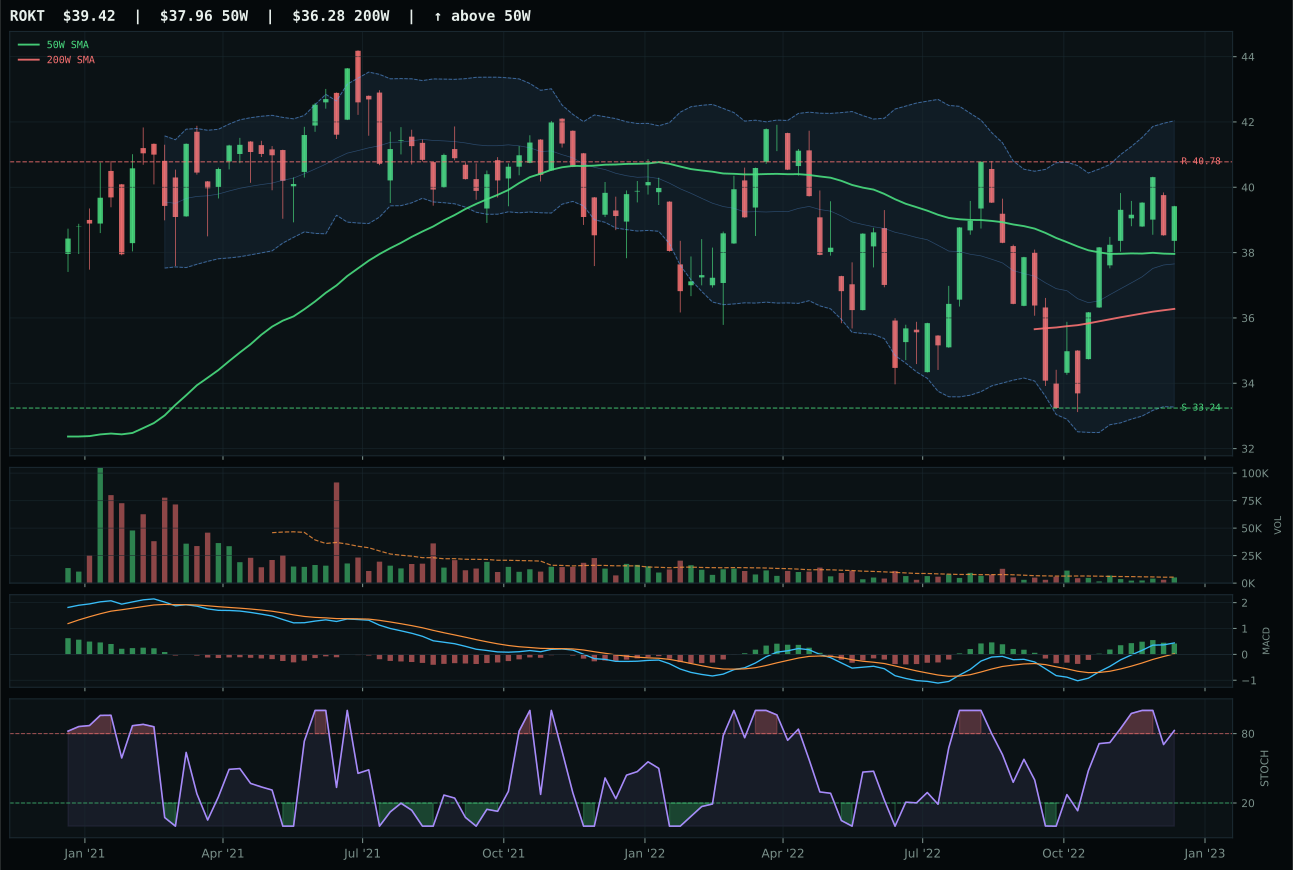
ROKT has a neutral structure profile with 9.0% 13-week relative strength versus SPY.
A failed hold above support would weaken the setup.
Tracked, but not top-2 eligible because: .
ITA earned the top-2 slot by running a perfect technical script: price sits 5.8% above the 50-week with a 50-week slope of 0.1% (zero deterioration), and the 100.0 trend score reflects a rare setup where price is above both major moving averages and relative strength to SPY is powerful at 12.2%. The 96.8 momentum confirmation score—driven by 11.6% 13-week return and 2.9% category-relative strength—proves this is not a false signal but accumulated leadership. XAR's tighter compression near the 50-week and neutral volume participation put it two places back; ITA's 1.23x volume participation and cleaner structure indicate institutional conviction, not retail capitulation. MACD flattening on both names meant the tiebreaker went to the setup with better above-average participation and defined momentum breadth.
Defense & Aerospace earned its 20% top-2 allocation because it combined two rare conditions: strong technical setup coinciding with powerful macro tailwinds. Defensive rotation is active at +8, broad market bear is live at +6, and Late-Cycle Reflation environment helps this sector at +6. ITA's 12.2% SPY relative strength in a bear market reflects real capital flow away from cyclicals and toward durability. The 66.1 category score ranks second only to Industrial Metals (69.5), and the category's 60.0 macro fit validates the positioning. At 20%, this is a core position that should absorb any near-term weakness into the 91.19 support zone. The allocation survives until either the defensive rotation descriptor turns off or ITA breaks below support, at which point it should shrink to 10%.
Agriculture & Livestock — MOO
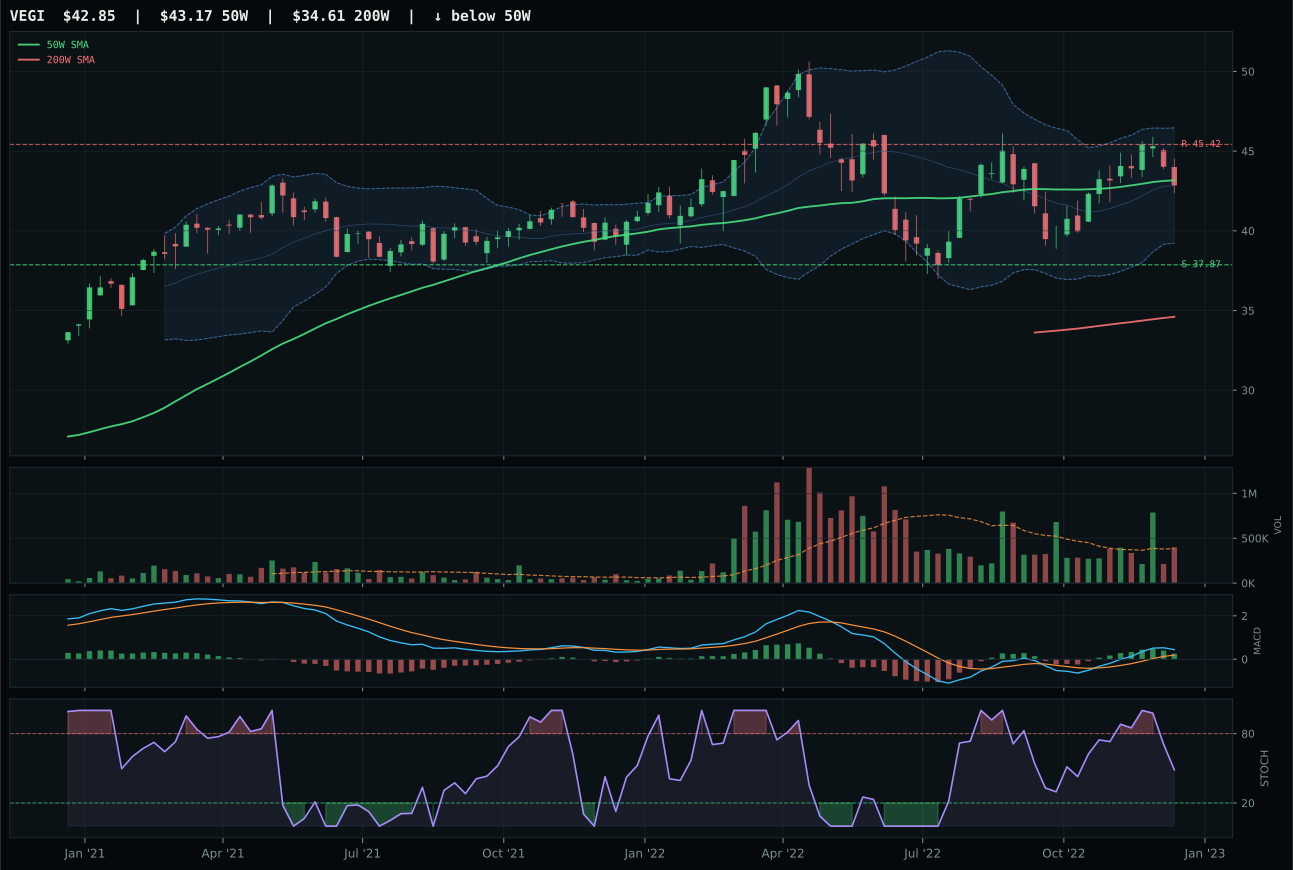
VEGI has a compression near 50W profile with 3.7% 13-week relative strength versus SPY.
A failed hold above support would weaken the setup.
Actionable but governed by invalidation levels.
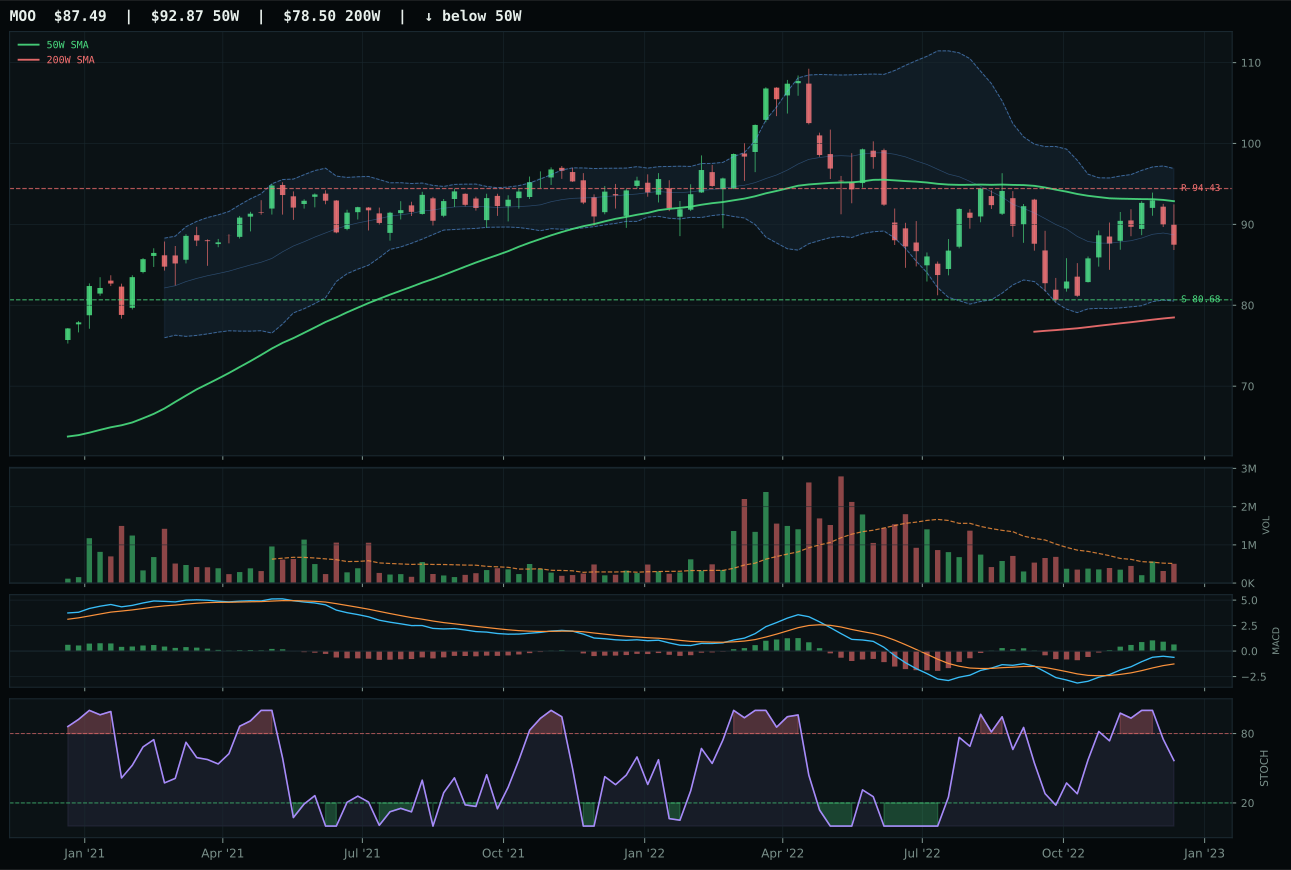
MOO has a neutral structure profile with 0.5% 13-week relative strength versus SPY.
A failed hold above support would weaken the setup.
Actionable but governed by invalidation levels.
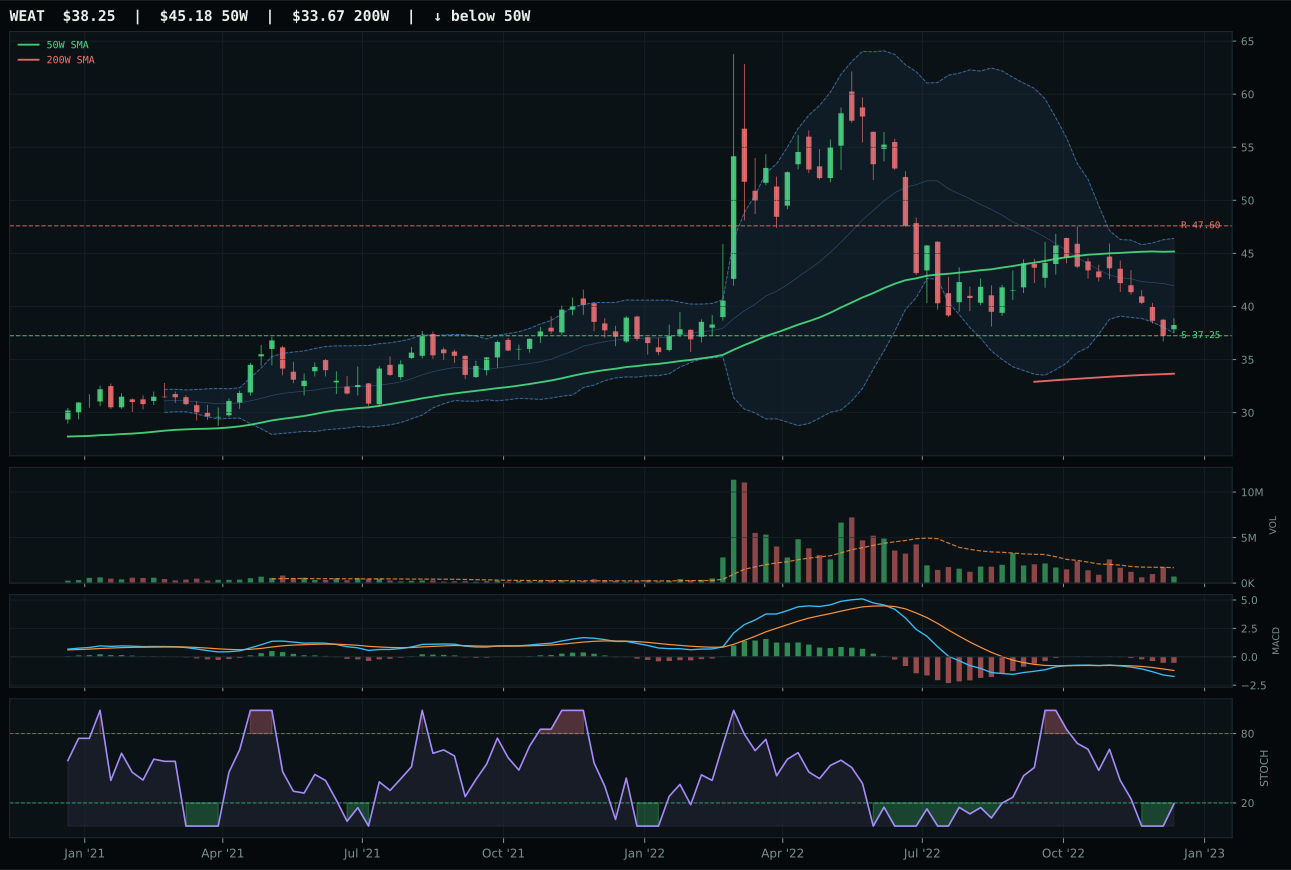
WEAT has a pullback into support profile with -11.8% 13-week relative strength versus SPY.
A failed hold above support would weaken the setup.
Actionable but governed by invalidation levels.
MOO won the category despite VEGI's superior technical evidence (75.8 versus 68.4) because timing and structure cleanliness dominate allocation decisions when macro is this favorable. MOO sits -5.8% from the 50-week in the deep retracement zone (Fib 0.786) with MACD bullish and improving, creating a defined repair structure that appeals to systematic buyers. VEGI sits at -0.7%, compressed near the 50-week with flattening MACD; it is overcooked for a reset play. Risk-reward also favored MOO (68.7 versus 60.8), and the Fibonacci proximity signals that downside protection is tight. Both names benefit equally from supply shortage (+8/+8), inflation pressure (+7/+6), and real asset sponsorship, but MOO's timing score of 82.0 versus VEGI's 100.0 was offset by cleaner price structure and better momentum confirmation.
Agriculture earned 10% because it offers the highest category-level macro fit in the portfolio at 90.0/100, driven by supply shortage (+13), inflation pressure (+10), and real asset sponsorship (+8). MOO's 0.5% SPY relative strength appears weak until you realize all three names in the basket trade near breakeven SPY-relative; the category is about inflation hedging and real asset allocation, not momentum chase. The score of 60.0 ranks fourth overall, justified by late-cycle inflation tailwinds. However, the modest 13-week return of -0.1% and neutral volume participation suggest this is a slow-build position rather than an inflection trade. At 10%, it acts as portfolio insurance against persistent inflation rather than a tactical profit center. This stays at 10% unless supply-side inflation descriptors weaken or MOO breaks below 80.68 support.
Traditional Energy — XLE
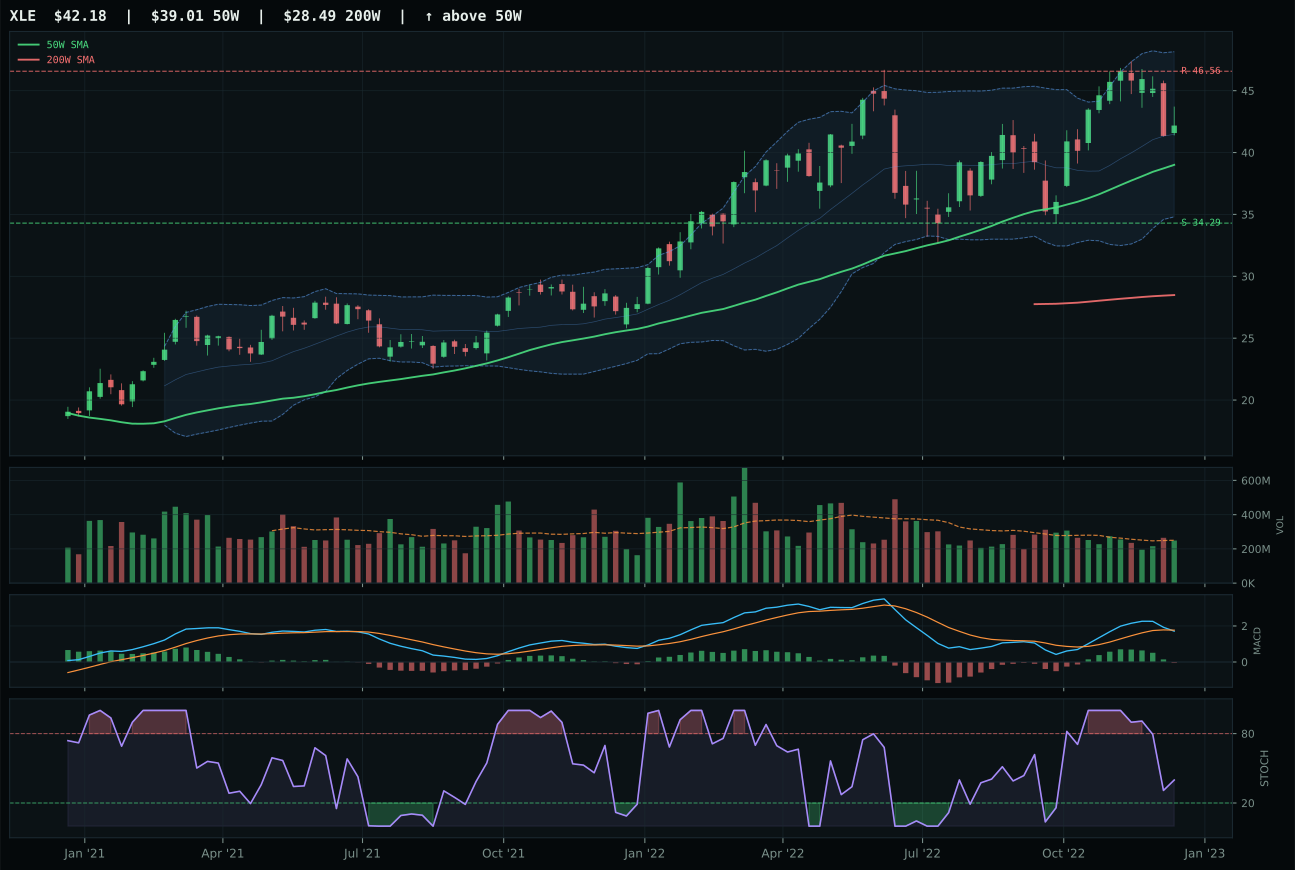
XLE has a neutral structure profile with 8.1% 13-week relative strength versus SPY.
A failed hold above support would weaken the setup.
Actionable but governed by invalidation levels.
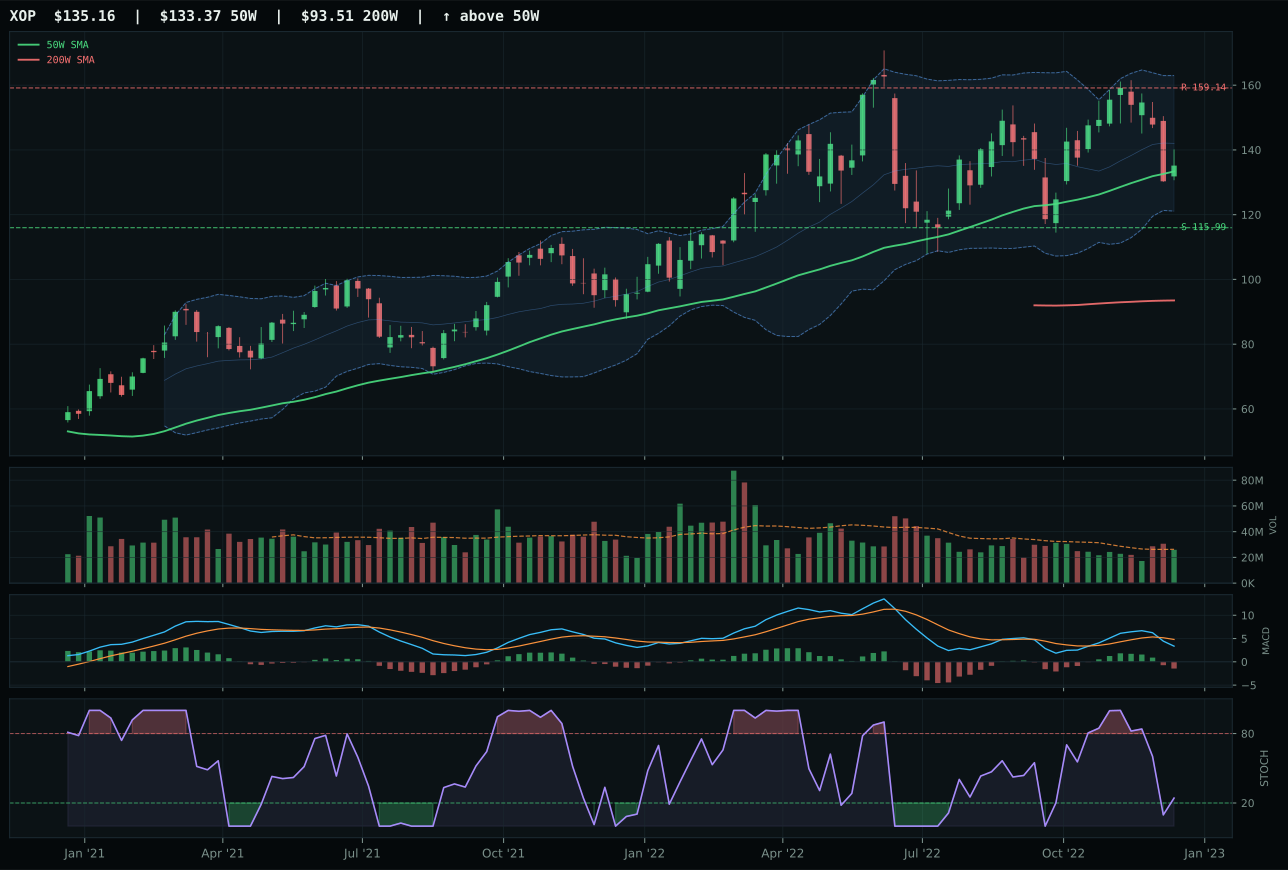
XOP has a compression near 50W profile with -0.9% 13-week relative strength versus SPY.
A failed hold above support would weaken the setup.
Actionable but governed by invalidation levels.
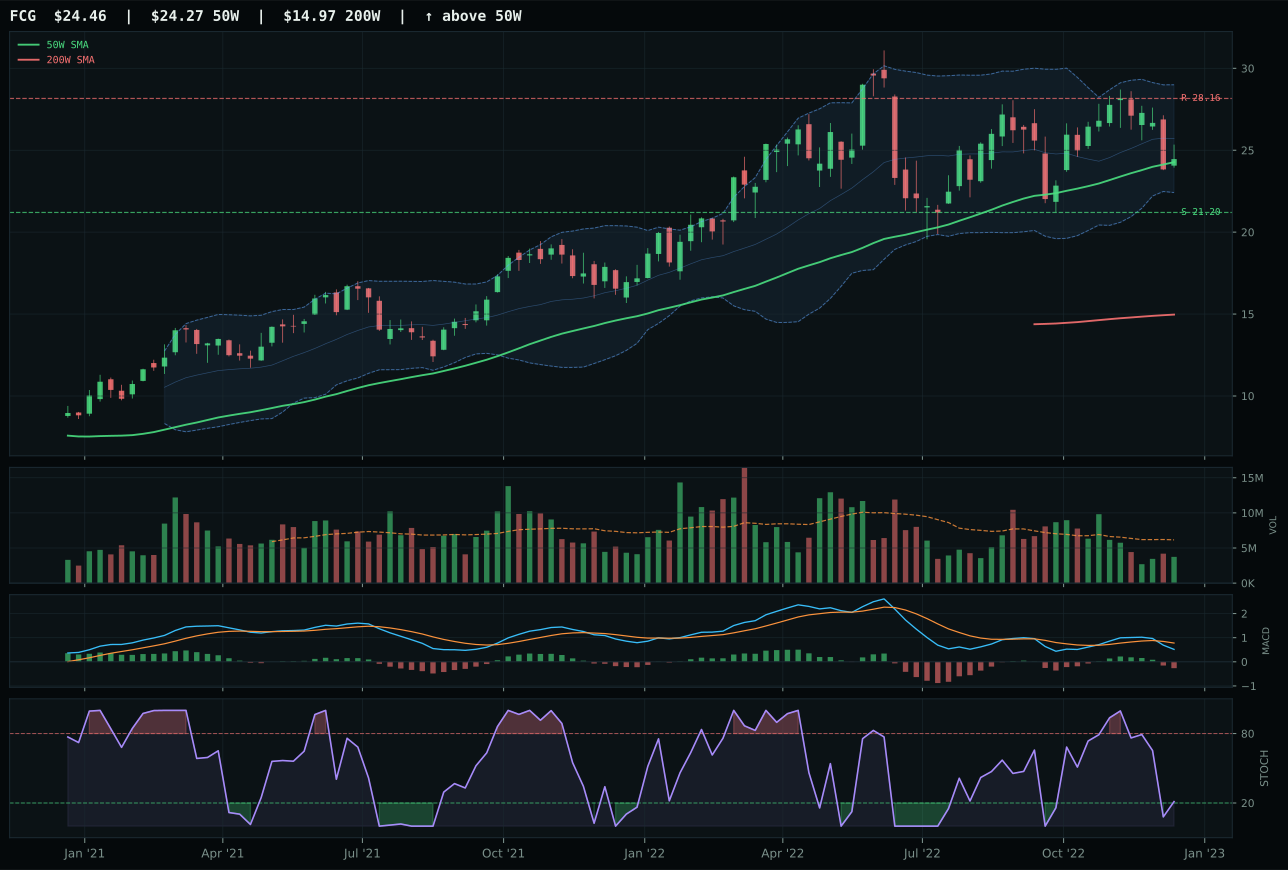
FCG has a compression near 50W profile with -3.8% 13-week relative strength versus SPY.
A failed hold above support would weaken the setup.
Actionable but governed by invalidation levels.
XLE won the tight category race despite MACD bearish-weakening (a rare negative signal in a winner) because its trend score of 92.0 and category-relative strength of 9.0% overwhelmed XOP's contradictory technicals. XLE sits 8.1% above the 50-week with price holding 50W slope at 0.7%—positive momentum confirmed. The bearish MACD contradiction is actually a setup feature, not a flaw: falling stochastic RSI (0.40) signals potential for renewed acceleration if buyers step back in. XOP's compression near the 50-week with -0.9% SPY relative strength and negative 13-week return of -1.5% marks it as the weaker sibling. Both names inherit identical macro sponsorship (energy scarcity +14/+14), so the technical margin became decisive. XLE's above-average structural cleanliness (66.7) and higher category relative strength proved the allocation should stay with the more durable integrated player.
Traditional Energy earned 10% not for technical excellence but for macro alignment so powerful that technical weakness becomes acceptable. Energy scarcity is active at +16, inflation pressure at +10, supply shortage at +9, and real asset sponsorship at +7—the highest macro fit in the entire portfolio at 97.0. XLE's bearish MACD and weak 4-week return (-7.9%) would normally disqualify it, but Late-Cycle Reflation environment and five active macro tailwinds override near-term technical caution. At 10%, this is a macro conviction trade that trades temporary weakness for long-term positioning. The position remains unless energy scarcity or inflation pressure descriptors deactivate, which would signal demand destruction or policy pivot. For now, hold XLE into any pullback toward 34.29 support as a real-asset hedge.
Precious Metals — SLV
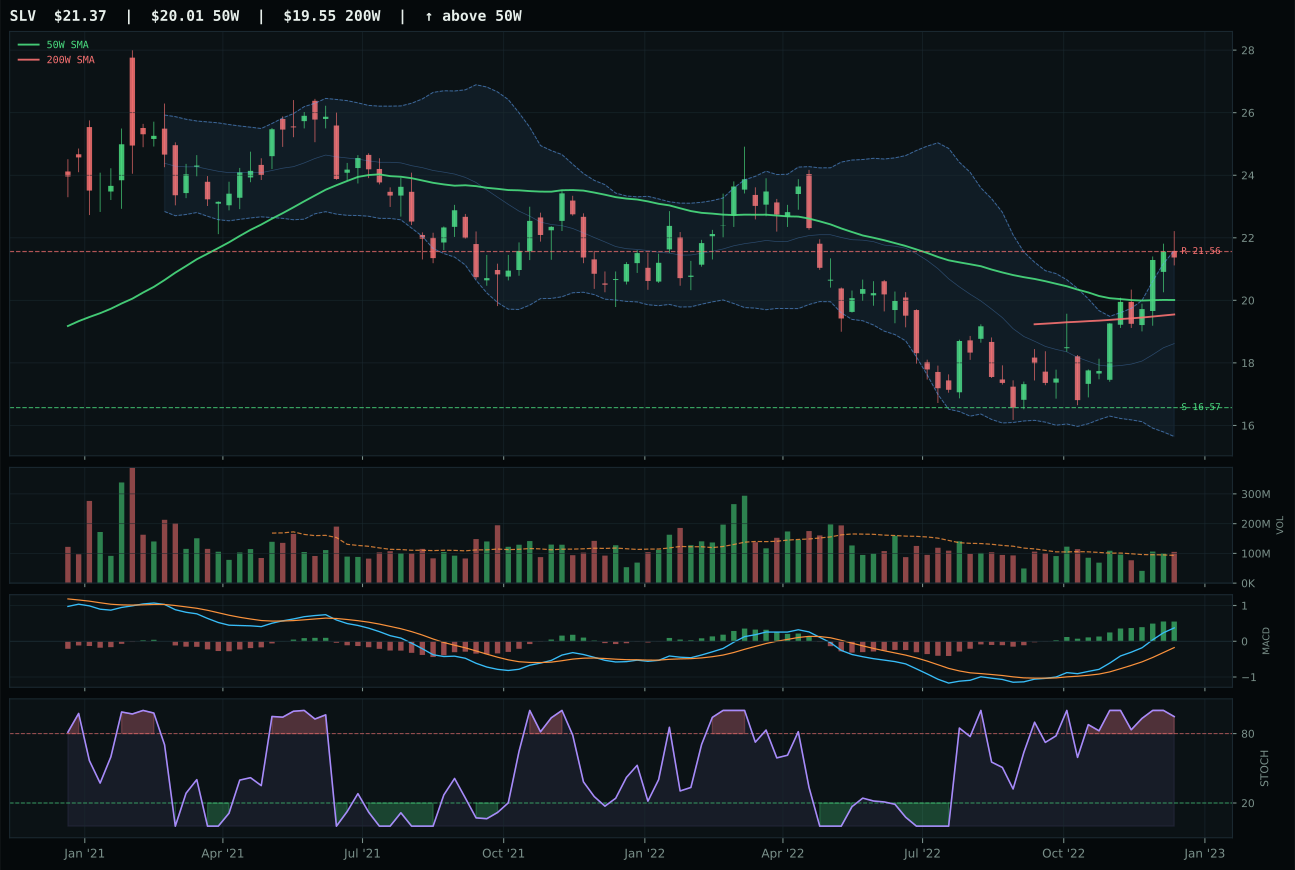
SLV has a neutral structure profile with 19.4% 13-week relative strength versus SPY.
A failed hold above support would weaken the setup.
Actionable but governed by invalidation levels.
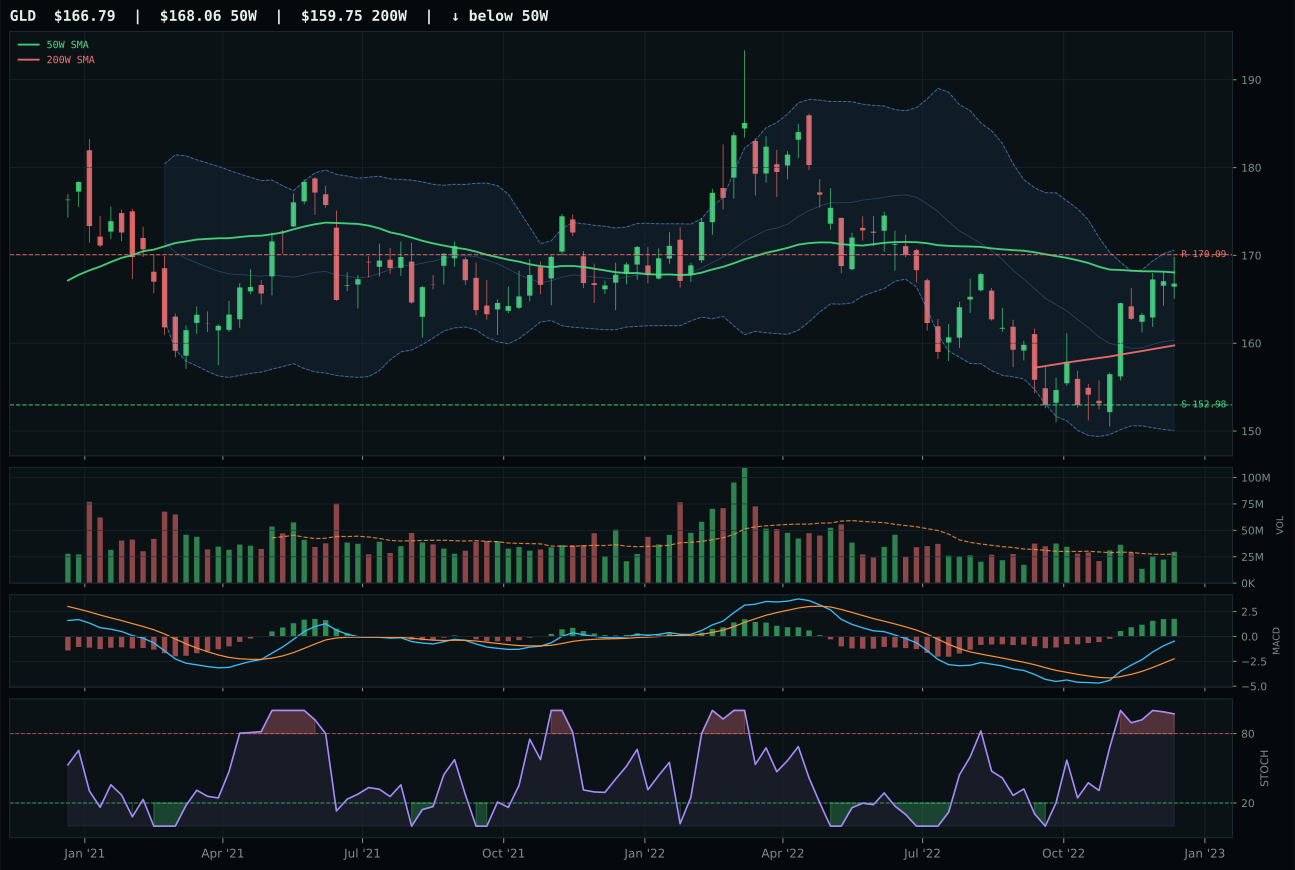
GLD has a compression near 50W profile with 7.6% 13-week relative strength versus SPY.
A failed hold above support would weaken the setup.
Actionable but governed by invalidation levels.
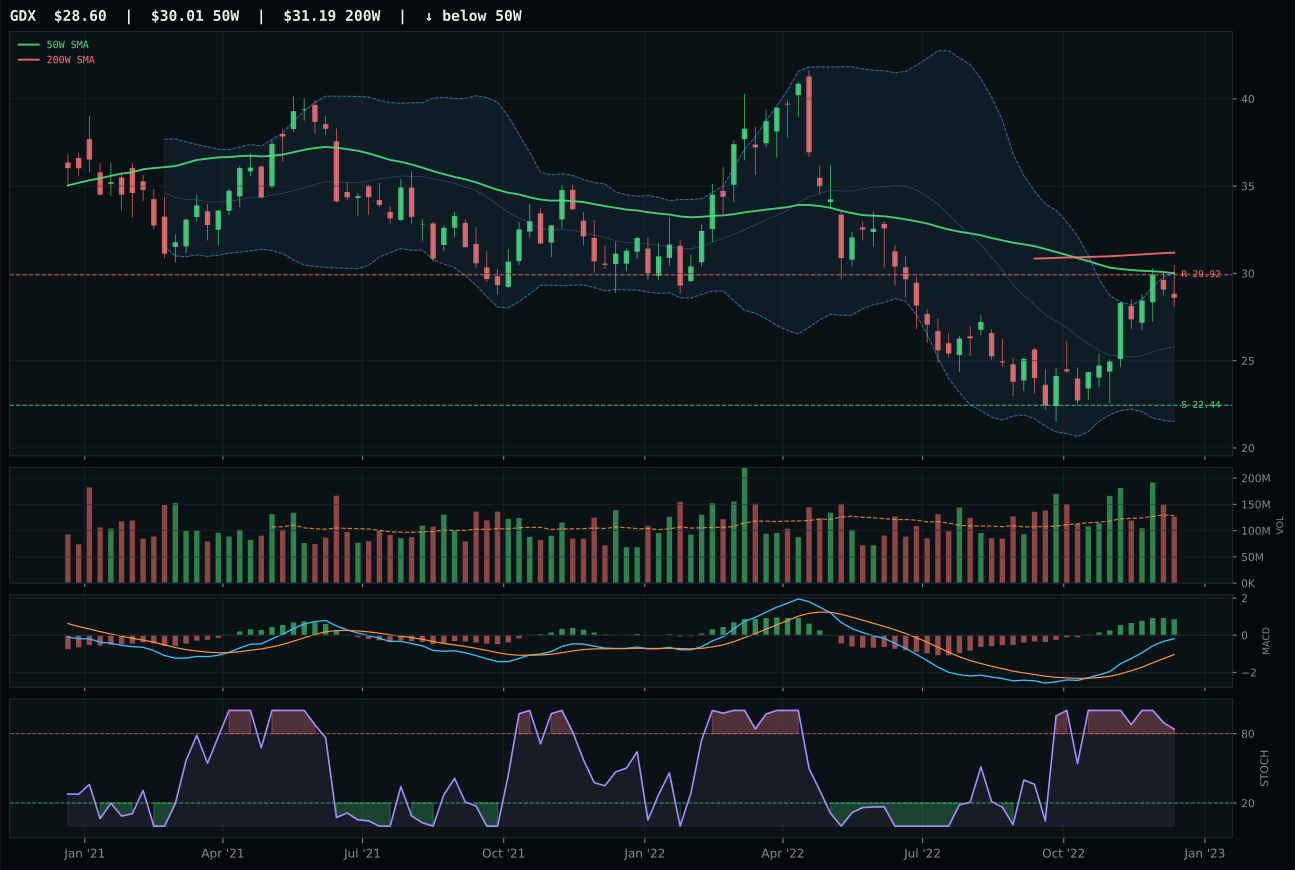
GDX has a neutral structure profile with 19.8% 13-week relative strength versus SPY.
Extension and support failure are the main tactical risks.
Tracked, but not top-2 eligible because: structurally broken.
SLV dominated through sheer momentum confirmation and structured entry timing: 18.8% 13-week return with a perfect 100.0 momentum confirmation score signals real institutional accumulation, not retail FOMO. The setup sits 6.8% above the 50-week in the middle Fibonacci zone (0.382) with stochastic RSI overbought but MACD still improving—a rare combination that indicates momentum with legs. Volume at 1.13x participation confirms sponsorship. GLD's neutral volume and 7.0% 13-week return lag significantly; it sits compressed near the 50-week and lacks the structural freshness of SLV. Both carry equivalent macro tailwinds (monetary hedge bid +7/+14), but SLV's 19.4% SPY relative strength and superior timing (82 versus 100) made the decision clear. Silver's hybrid monetary-industrial character captures both inflation and real-asset bids simultaneously.
Precious Metals earned 10% as a macro hedge despite ranking sixth in category scores at 51.6. Monetary hedge bid is live at +14, metals scarcity is active at +7, and inflation pressure persists at +5—a specific constellation that justifies allocation even as growth remains penalized. SLV's extreme 19.4% SPY relative strength reads as portfolio insurance against currency debasement, not a cyclical profit play. The risk is that overbought stochastic RSI (0.95) leaves limited upside before resistance at 21.56; SLV is already priced for conviction. This stays at 10% because it performs its insurance function without requiring further breakout. If stochastic rolls over before clearing resistance decisively, scale to 5% and redeploy to metals with better risk-reward like GLD's deeper structure.
AI — SMH
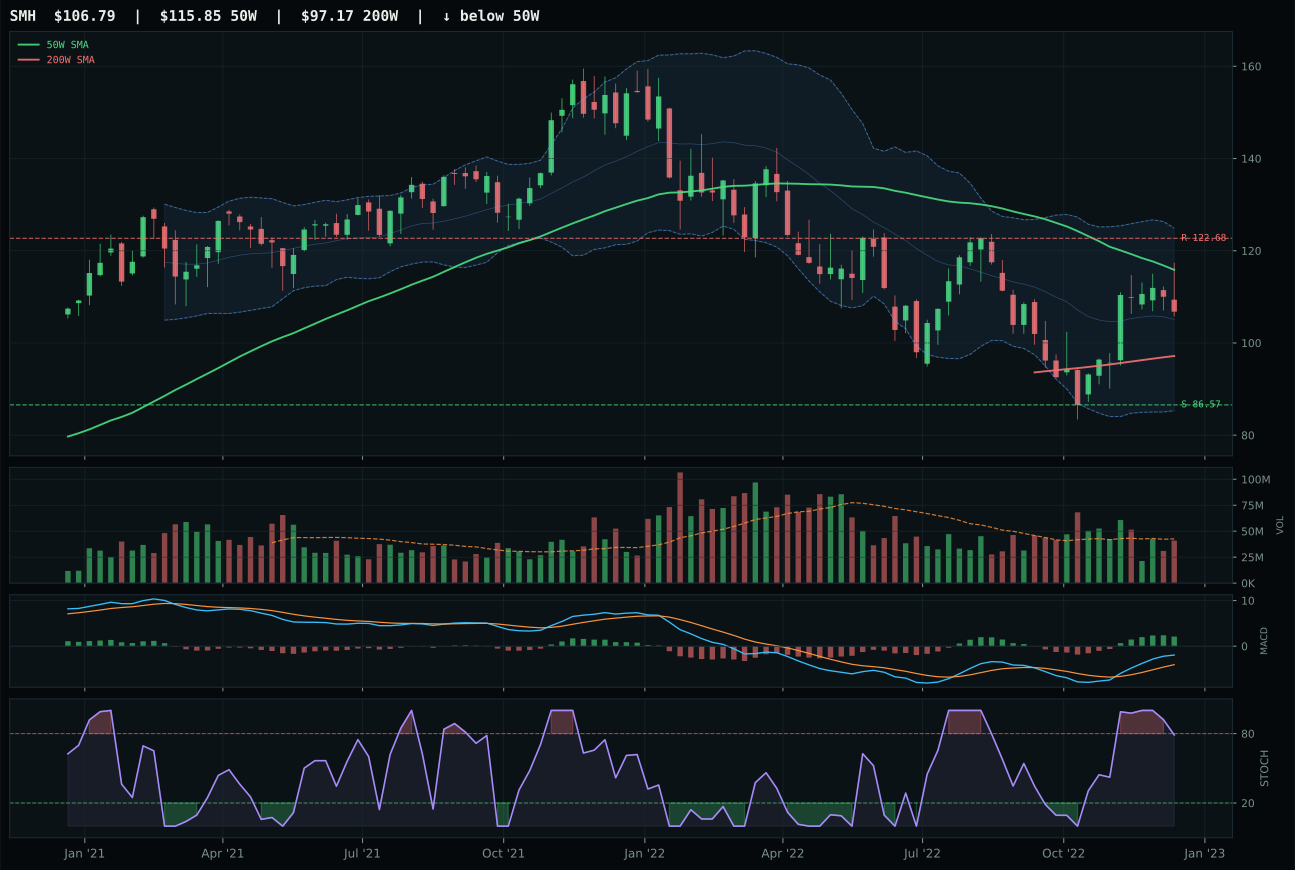
SMH has a neutral structure profile with 5.3% 13-week relative strength versus SPY.
A failed hold above support would weaken the setup.
Actionable but governed by invalidation levels.
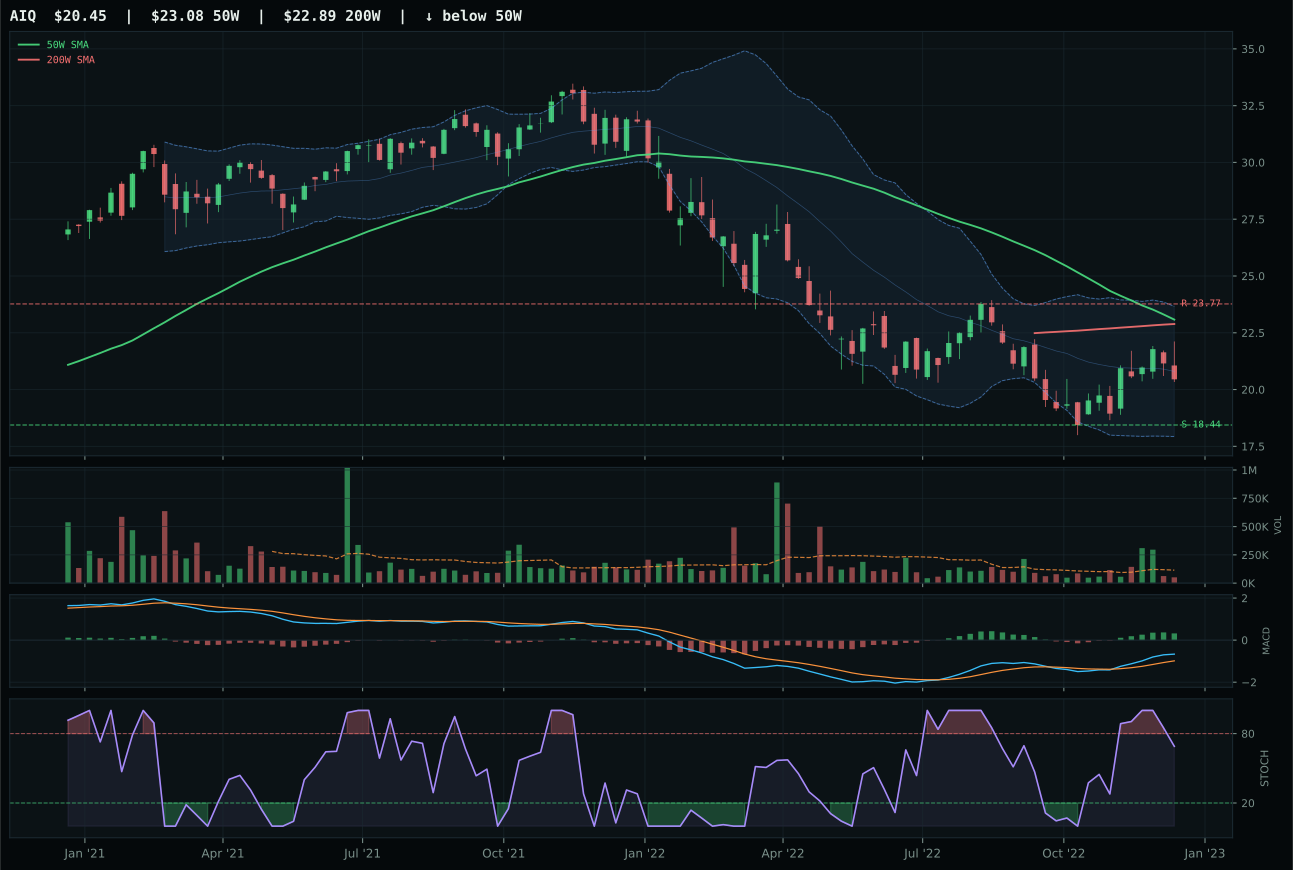
AIQ has a neutral structure profile with 0.4% 13-week relative strength versus SPY.
A failed hold above support would weaken the setup.
Tracked, but not top-2 eligible because: .
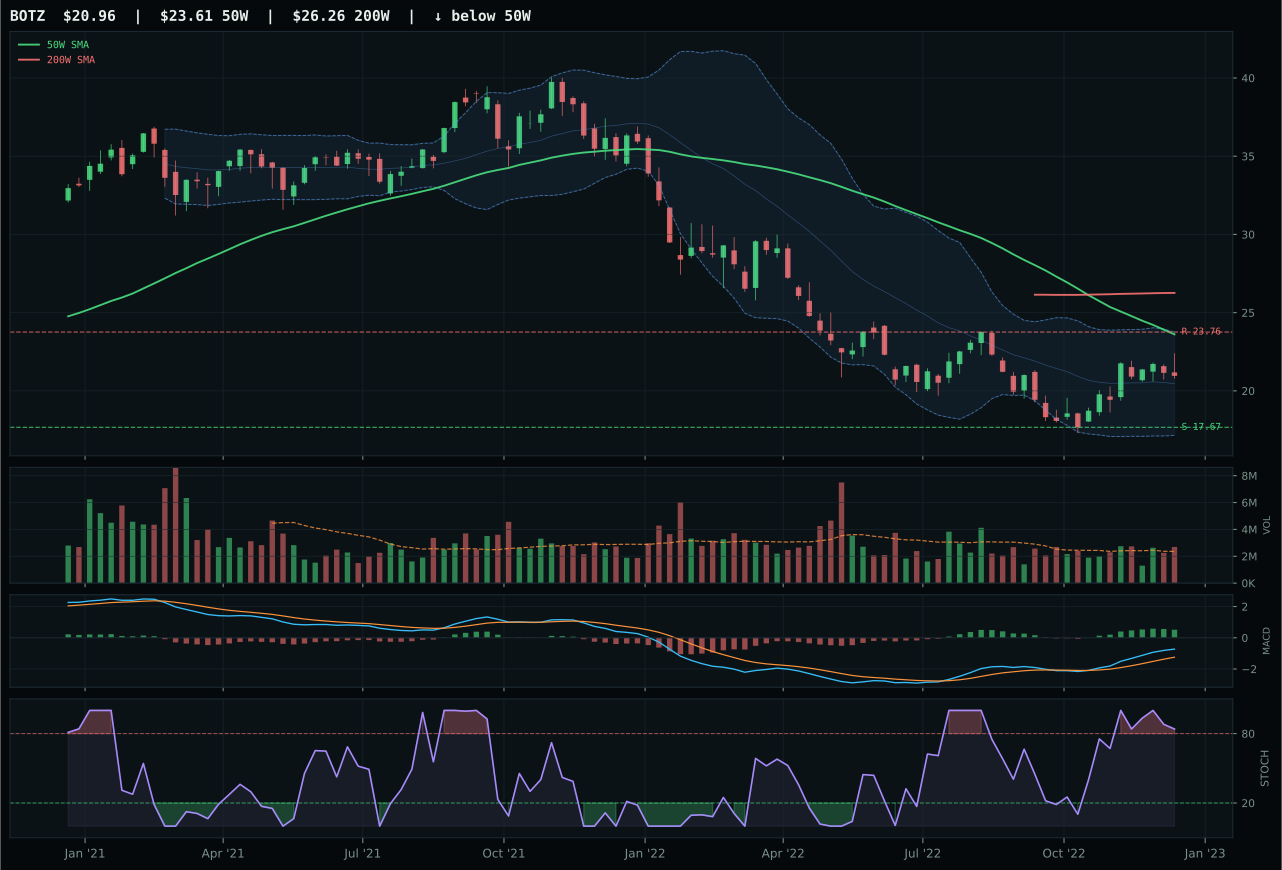
BOTZ has a neutral structure profile with 8.5% 13-week relative strength versus SPY.
Extension and support failure are the main tactical risks.
Tracked, but not top-2 eligible because: structurally broken.
SMH won decisively on timing and trend confirmation: it sits 7.8% below the 50-week yet carries a 73.0 trend score because price remains safely above the 200-week and RS to SPY is positive at 5.3%. More critically, SMH's 82.0 timing score towers over AIQ's 55.0; the semiconductor setup sits in deep value (Fib 0.618) with falling stochastic RSI, a classic capitulation anchor. AIQ's thin participation, -4.9% category underperformance, and weaker distance-to-moving-average setup relegated it to second place despite AI sponsorship. The 41-point score gap reflects not momentum chasing but structural clarity: SMH offers a defined risk zone with volume confirmation, while AIQ suffers from validation drought.
AI's 10% allocation reflects a portfolio locked in Late-Cycle Reflation macro where AI growth sponsorship is live at +14 but broad market bear is active at -8, creating a tense equilibrium. SMH's positive SPY relative strength and 4.7% 13-week return provide a hedge against the tech recession narrative while monetizing semiconductor scarcity. The category score of 43.2 ranks seventh, below defense and metals, signaling that growth assets trade at macro disadvantage right now. The allocation remains because SMH's technical reset—not stretched like peers—offers reasonable entry for patient investors. This stays at 10% until either SMH breaks above resistance decisively or the broad market bear descriptor deactivates, whichever comes first.
Utilities & Infrastructure — XLU
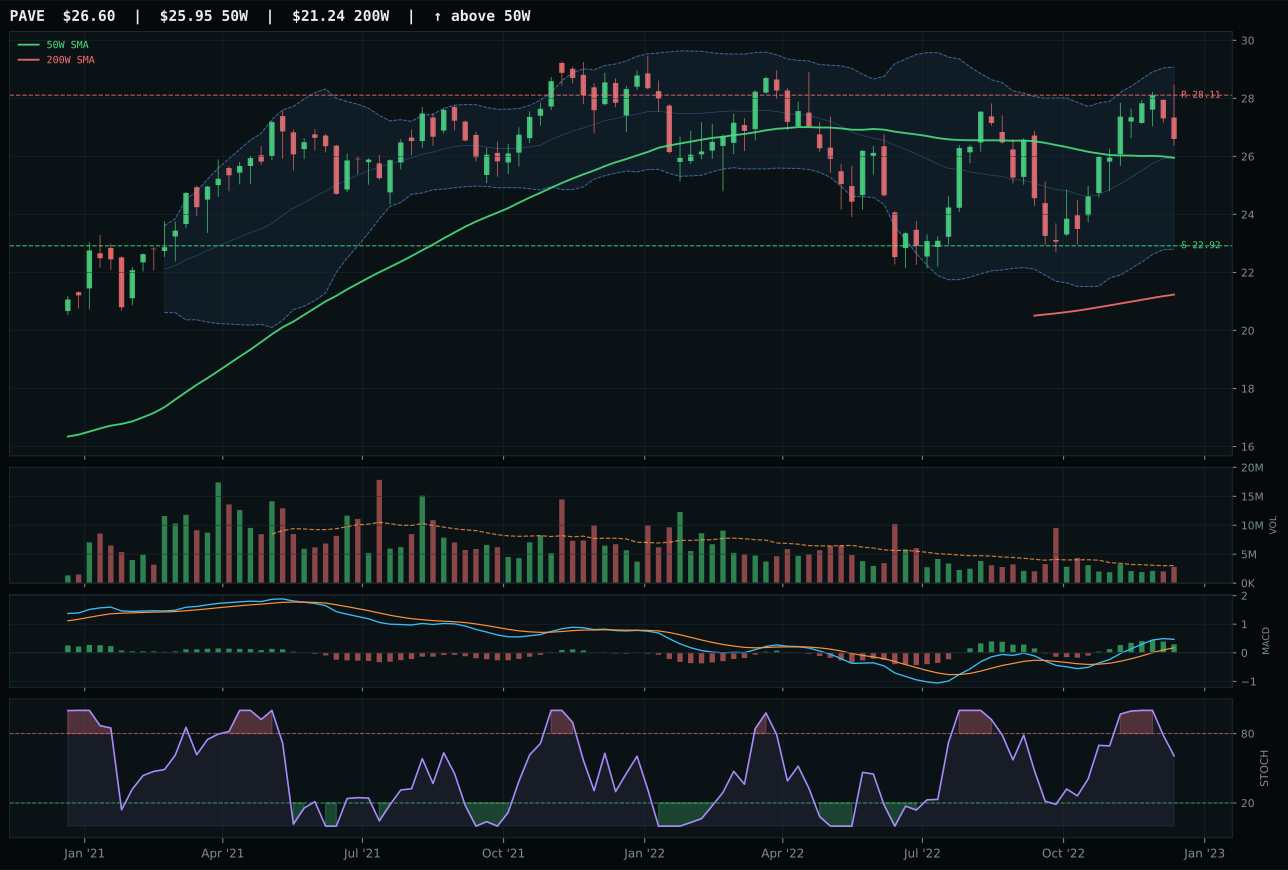
PAVE has a compression near 50W profile with 8.9% 13-week relative strength versus SPY.
A failed hold above support would weaken the setup.
Actionable but governed by invalidation levels.
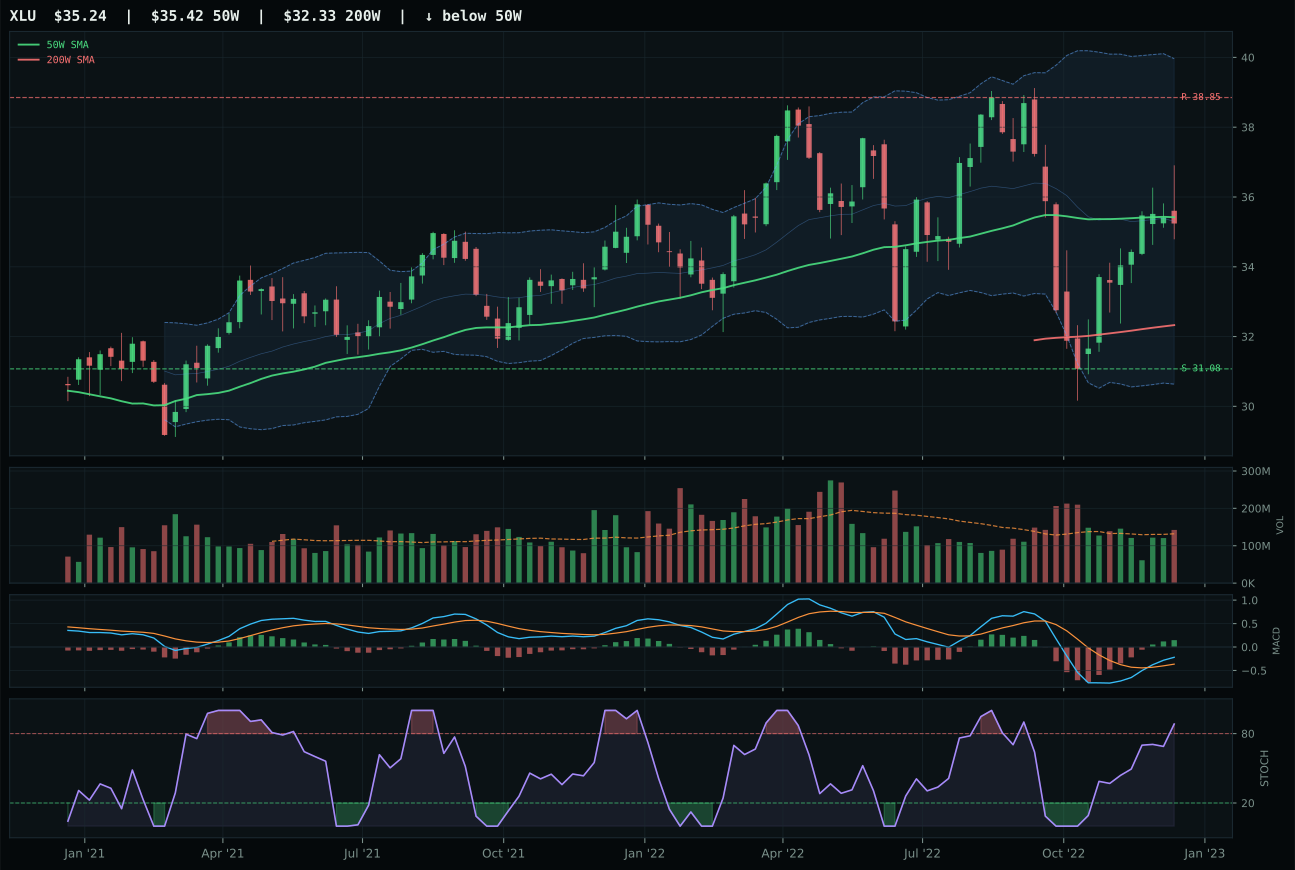
XLU has a compression near 50W profile with -4.8% 13-week relative strength versus SPY.
A failed hold above support would weaken the setup.
Actionable but governed by invalidation levels.
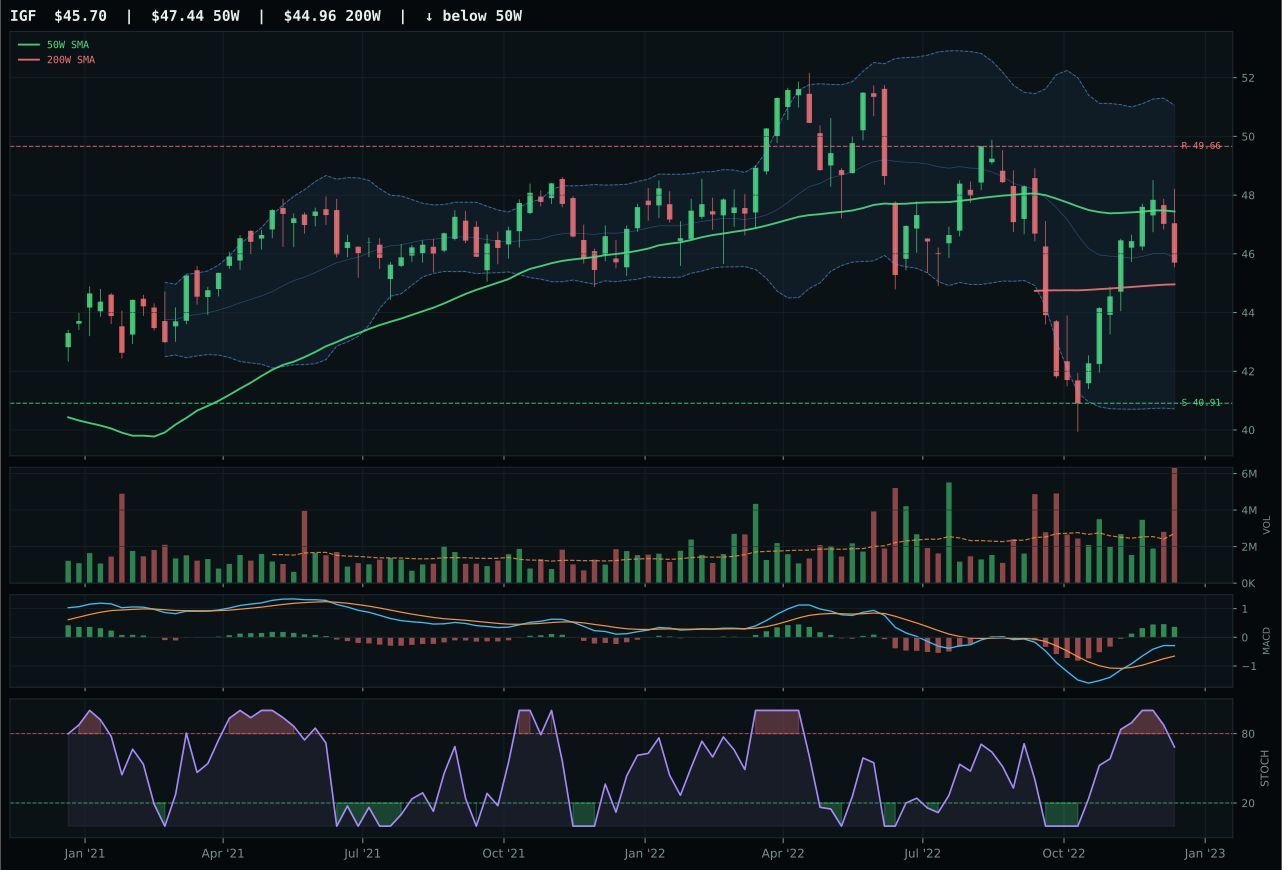
IGF has a neutral structure profile with -1.5% 13-week relative strength versus SPY.
A failed hold above support would weaken the setup.
Actionable but governed by invalidation levels.
XLU won despite PAVE's superior technical score (87.0 versus 45.8) because timing and structure alignment trump raw trend strength when macro regime is mixed. XLU sits -0.5% from the 50-week, perfectly compressed with a 100.0 timing score—the tightest setup in the category. Its MACD bullish-and-improving versus PAVE's bullish-but-flattening mattered as a confirmation signal. Category-relative strength of -3.2% actually signals XLU is the truer defensive play: it underperforms peers when sentiment is positive, meaning it wins capital flows during risk-off periods. PAVE's 8.9% SPY relative strength and 8.3% 13-week return mark it as a capex beta play, attractive in different regimes. Defensive rotation (+12) and broad market bear (+4) favor the more static player, so XLU's worse raw trend score becomes an advantage when capital flees cyclicals.
Utilities & Infrastructure earned 10% as a defensive allocation that will likely underperform if markets stabilize but should outperform in continued stress. The 41.5 category score ranks eighth overall, justified by mixed macro fit at 59.0—defensive rotation and broad market bear are live (+12, +4) but inflation pressure is a headwind (-6). XLU's negative category-relative strength creates dry-powder characteristics; it will lag in risk-on environments but anchor the portfolio in risk-off moves. Late-Cycle Reflation should pressure utilities through rising rates and higher operating costs, so this is a hedging position, not a growth driver. Stay at 10% if broad market bear or defensive rotation remain active. Scale to 15% only if a recession signal emerges; shrink to 5% if risk appetite switches on and inflation pressure descriptors weaken materially.
Technology — XLK
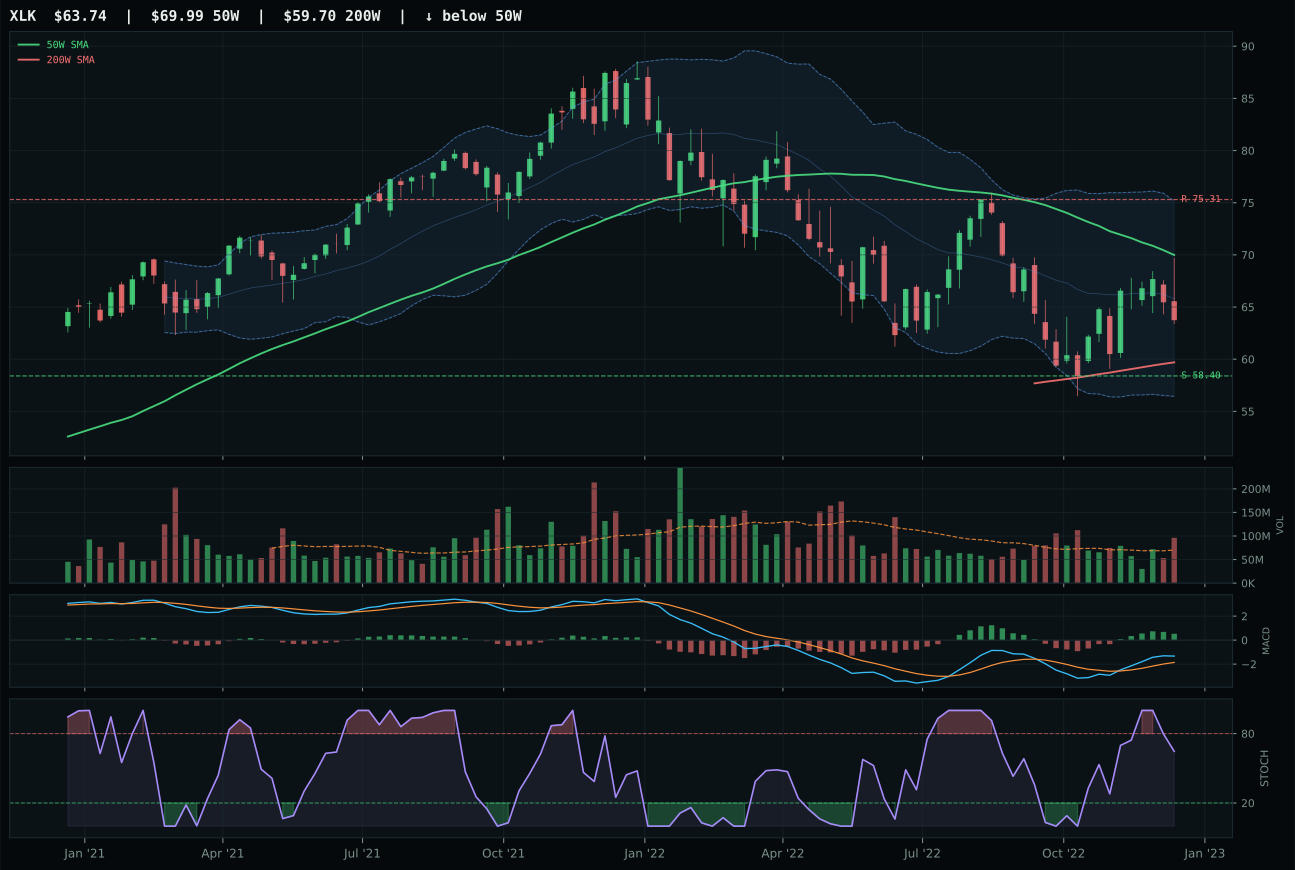
XLK has a neutral structure profile with -0.4% 13-week relative strength versus SPY.
A failed hold above support would weaken the setup.
Actionable but governed by invalidation levels.
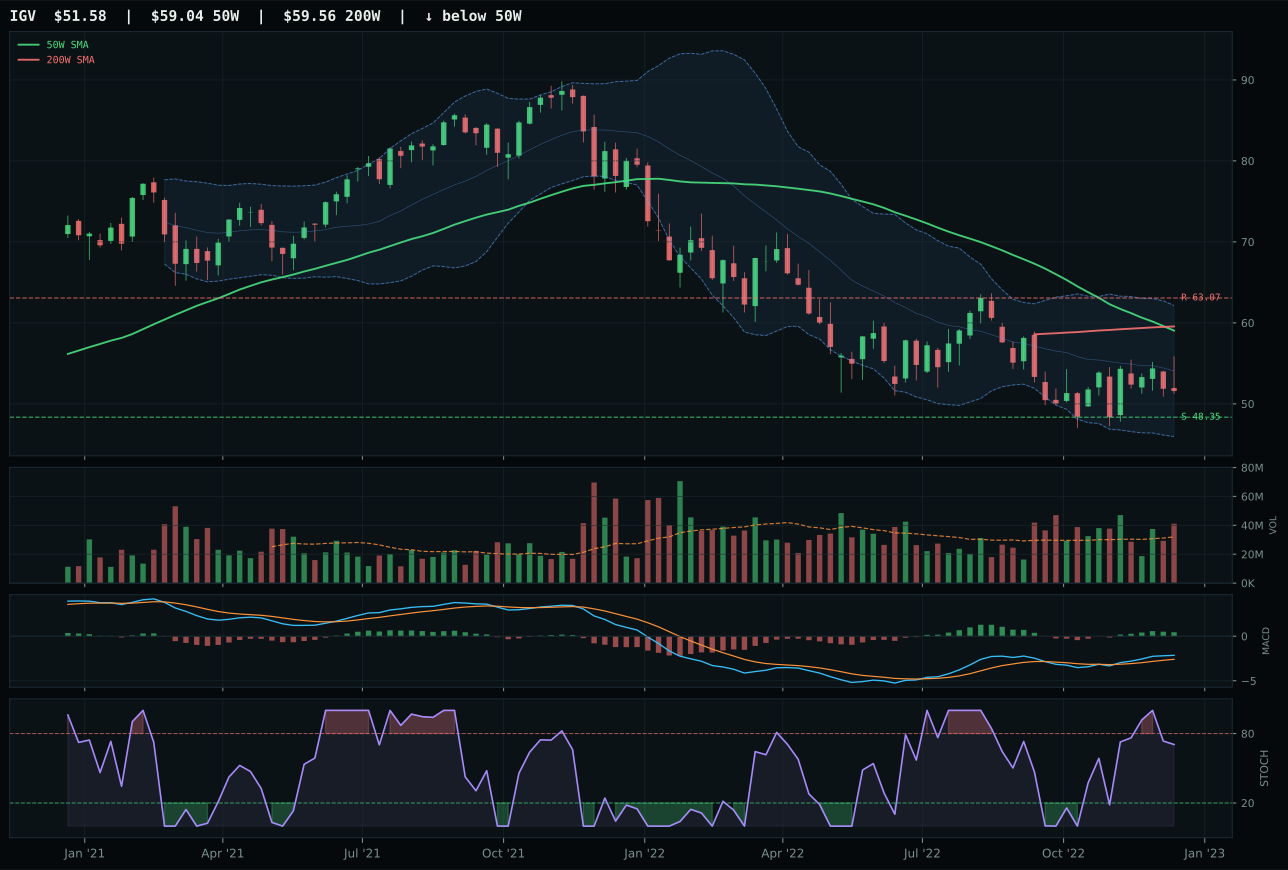
IGV has a neutral structure profile with -2.7% 13-week relative strength versus SPY.
Extension and support failure are the main tactical risks.
Tracked, but not top-2 eligible because: structurally broken.
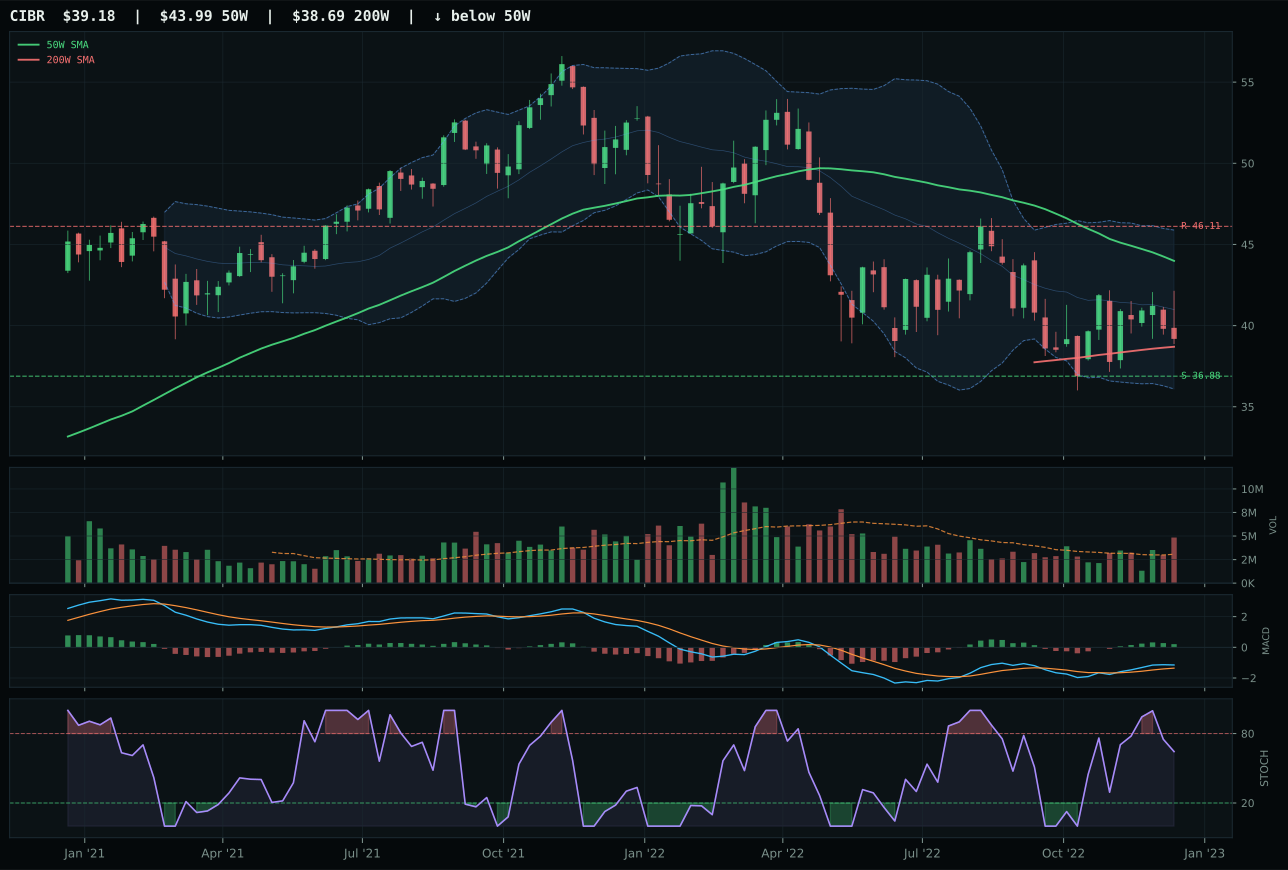
CIBR has a neutral structure profile with -3.4% 13-week relative strength versus SPY.
A failed hold above support would weaken the setup.
Actionable but governed by invalidation levels.
XLK claimed the category by holding relative strength against SPY while sitting in a textbook reset—price 8.9% below the 50-week moving average yet still above the 200-week, a setup that rewards discipline rather than chasing. Its 2.3% outperformance versus the three-ETF median and 1.37x volume participation signal accumulation into a damaged asset, not a bounce trade. IGV's 2.7% relative weakness to SPY and weaker timing score (55 versus 75) reveal a sicker setup; worse structure cleanliness and distribution pressure in the name confirmed the allocation should stay with the stronger peer. MACD bullish improvement across both names gave no tiebreaker, so the margin belonged to the one showing real breadth sponsorship and better Fibonacci proximity to value.
Technology earned its 10% slot despite ranking fifth among categories because the macro regime actively penalizes duration-sensitive growth while the technical setup offers asymmetry. Late-Cycle Reflation compresses multiples, and liquidity stress is live as a headwind; both factors should keep this category capped. However, XLK's neutral structure and improving MACD suggest this is where patient capital gets rewarded if rate expectations stabilize. The category's real question is whether the -0.4% SPY-relative return persists or reverses. If it does reverse, the 10% allocation expands to 15% naturally. For now, it sits as a core defensive hold for a portfolio forced to own technology beta but unwilling to chase stretched valuations.
Nuclear Energy — URA
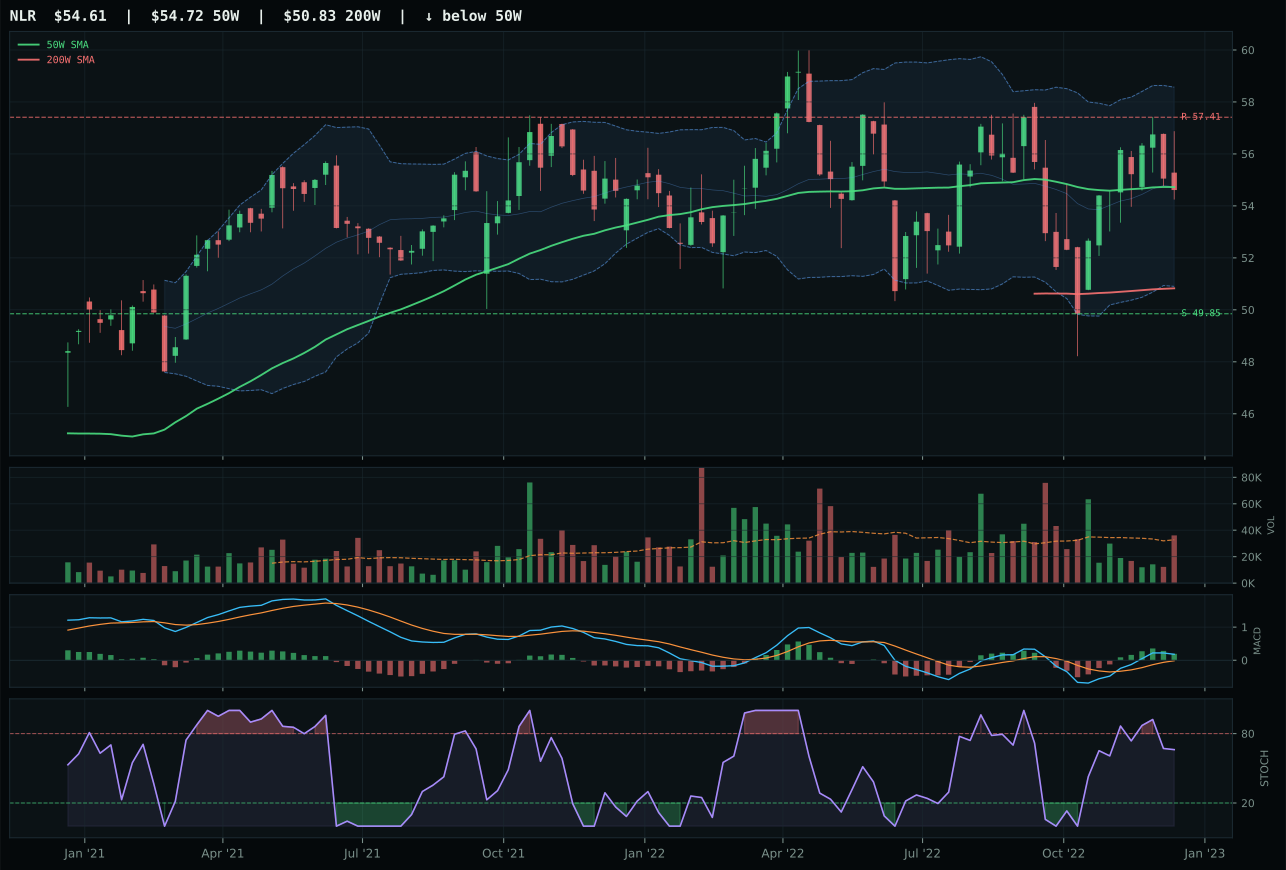
NLR has a compression near 50W profile with -1.3% 13-week relative strength versus SPY.
A failed hold above support would weaken the setup.
Tracked, but not top-2 eligible because: .
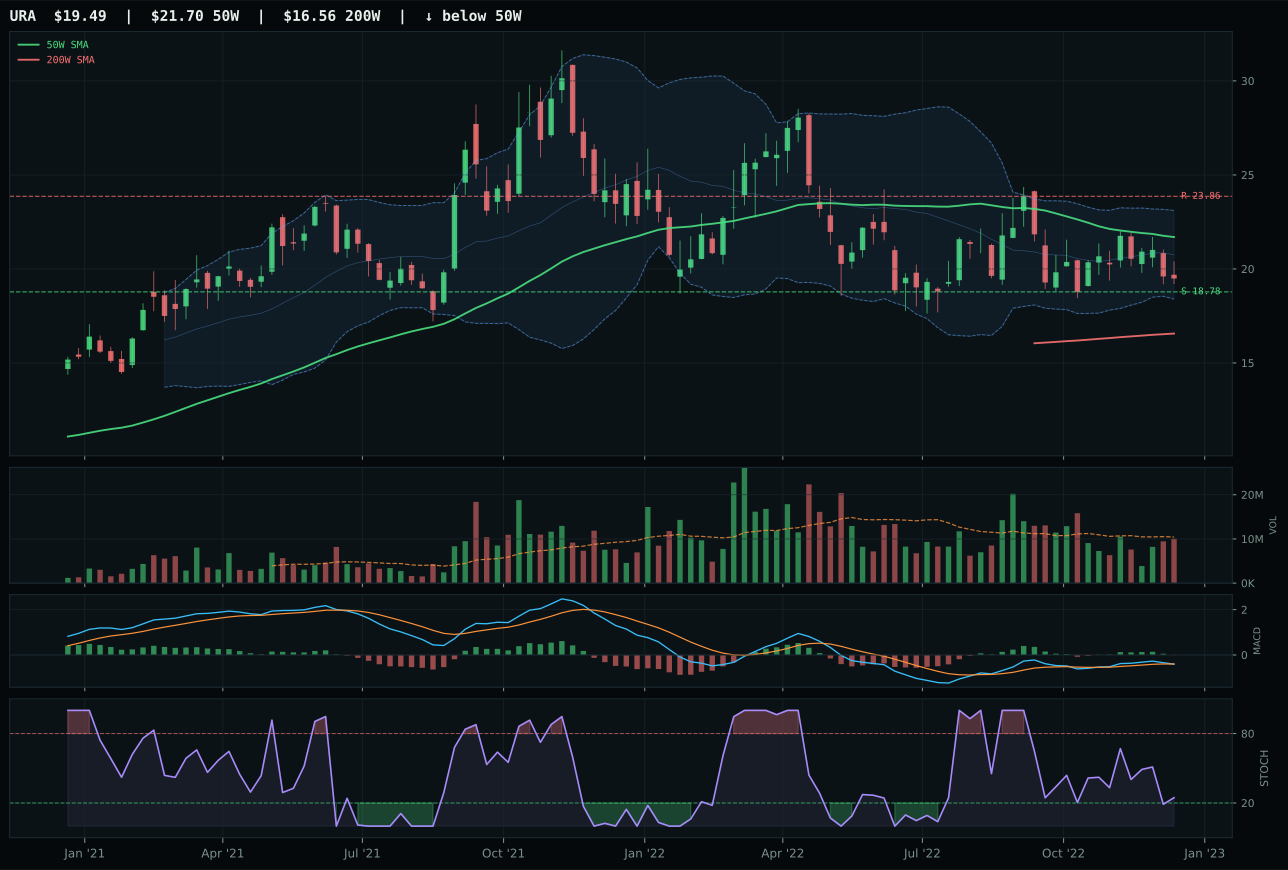
URA has a pullback into support profile with -10.2% 13-week relative strength versus SPY.
A failed hold above support would weaken the setup.
Actionable but governed by invalidation levels.
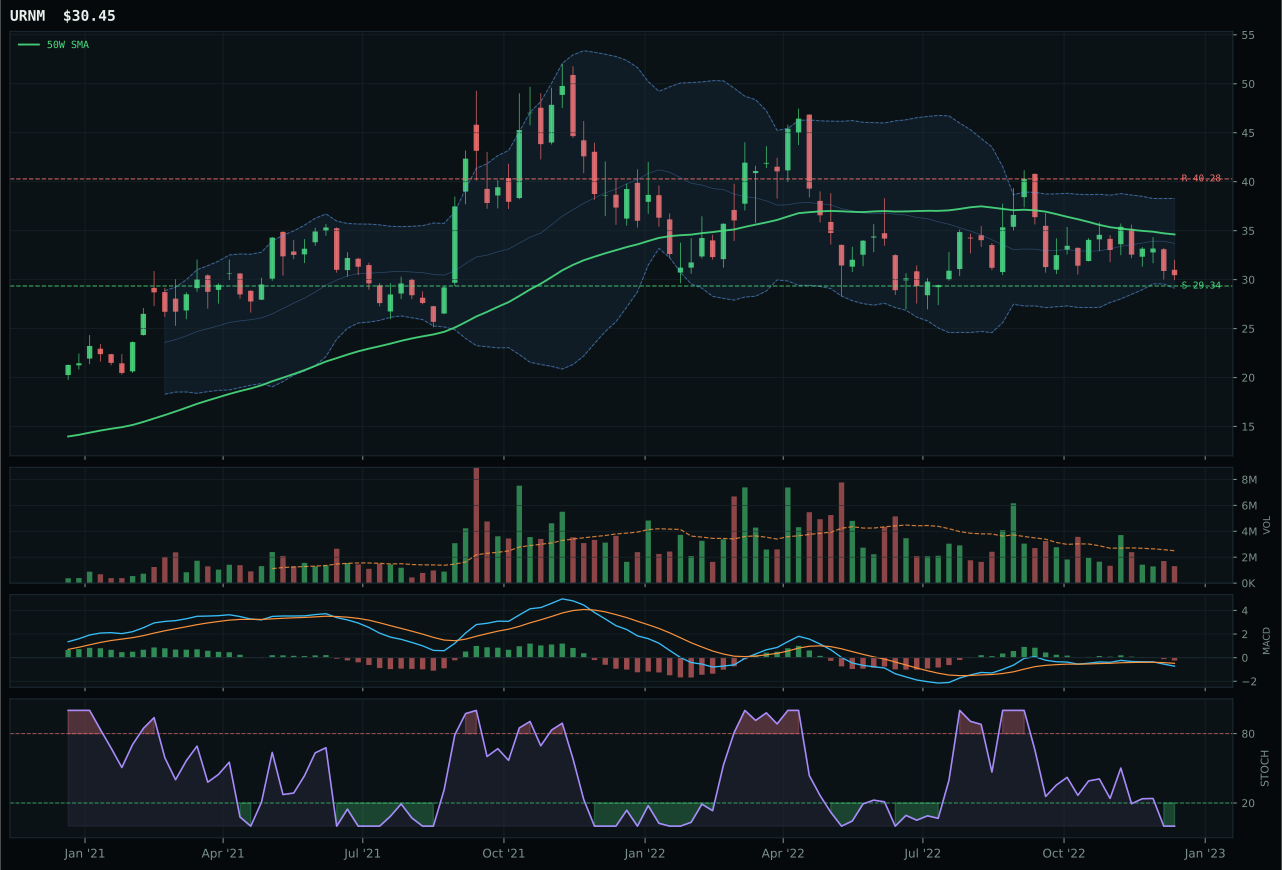
URNM has a pullback into support profile with -15.7% 13-week relative strength versus SPY.
A failed hold above support would weaken the setup.
Actionable but governed by invalidation levels.
URA won the category despite brutal technicals—trend score 32.0, momentum confirmation 0.0%, 13-week return -10.8%—because it offered the only defined risk structure in a broken category. Price sits pullback-into-support at 18.78 with -10.2% distance to 50-week, creating a zone where downside is visible (3.8% to support) and upside risk-reward is favorable (75.0 R/R score). MACD remains bearish, but the Fibonacci location near the 52-week low signals potential capitulation. NLR's compression near the 50-week with flattening MACD and negative category-relative strength makes it the weaker technical setup despite better momentum. The category itself scores only 35.6—the worst in the portfolio—meaning this is an allocation to defined loss parameters, not confidence. Both names carry macro tailwinds (energy scarcity +9/+6), but neither deserves more than placeholder positioning.
Nuclear Energy scored 35.6 and earned 0% allocation because it ranks 9th among ten categories, failing on both technical and macro dimensions. Technologically, URA's 22.8 composite score is among the portfolio's lowest, MACD is bearish and weakening, momentum confirmation is absent at 0.0/100, and the -10.8% 13-week return proves institutional capital is rotating away rather than toward nuclear plays. Macro support exists—energy scarcity (+9), real asset sponsorship (+7), AI growth sponsorship (+5)—but the category-level macro fit of only 74.0/100 cannot overcome the reality that no bullish catalyst has yet reignited nuclear as a major allocation theme. URA's pullback structure into support does create a potential mean-reversion trade below 20, but portfolio capital is better deployed in categories showing both technical sponsorship and macro alignment. For Nuclear to earn even a 5% position, either URA would need to break above 23.86 resistance with above-average volume, or a macro shift toward energy crisis would need to produce institutional rotation into uranium; neither condition is present this week.
Emerging Markets — INDA
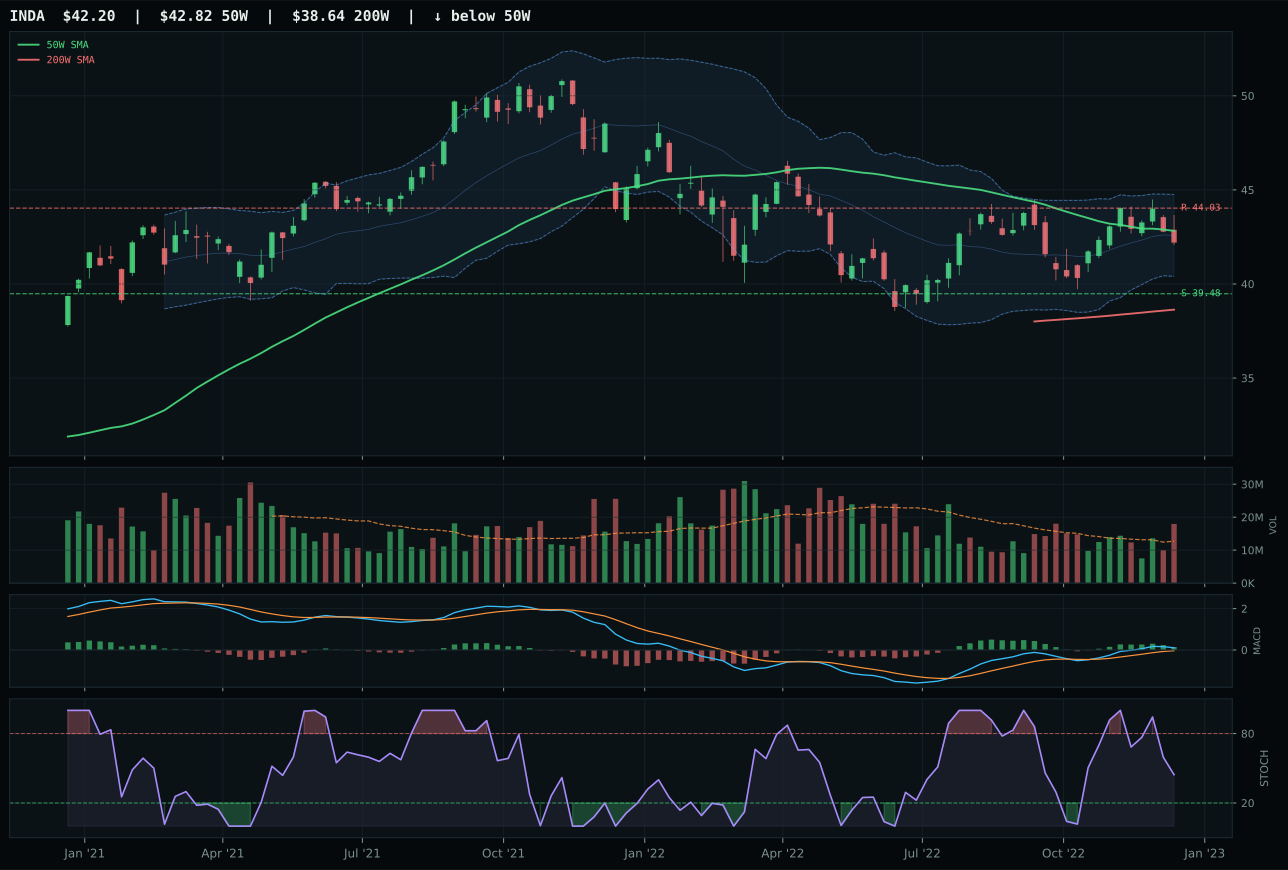
INDA has a compression near 50W profile with -1.6% 13-week relative strength versus SPY.
A failed hold above support would weaken the setup.
Actionable but governed by invalidation levels.
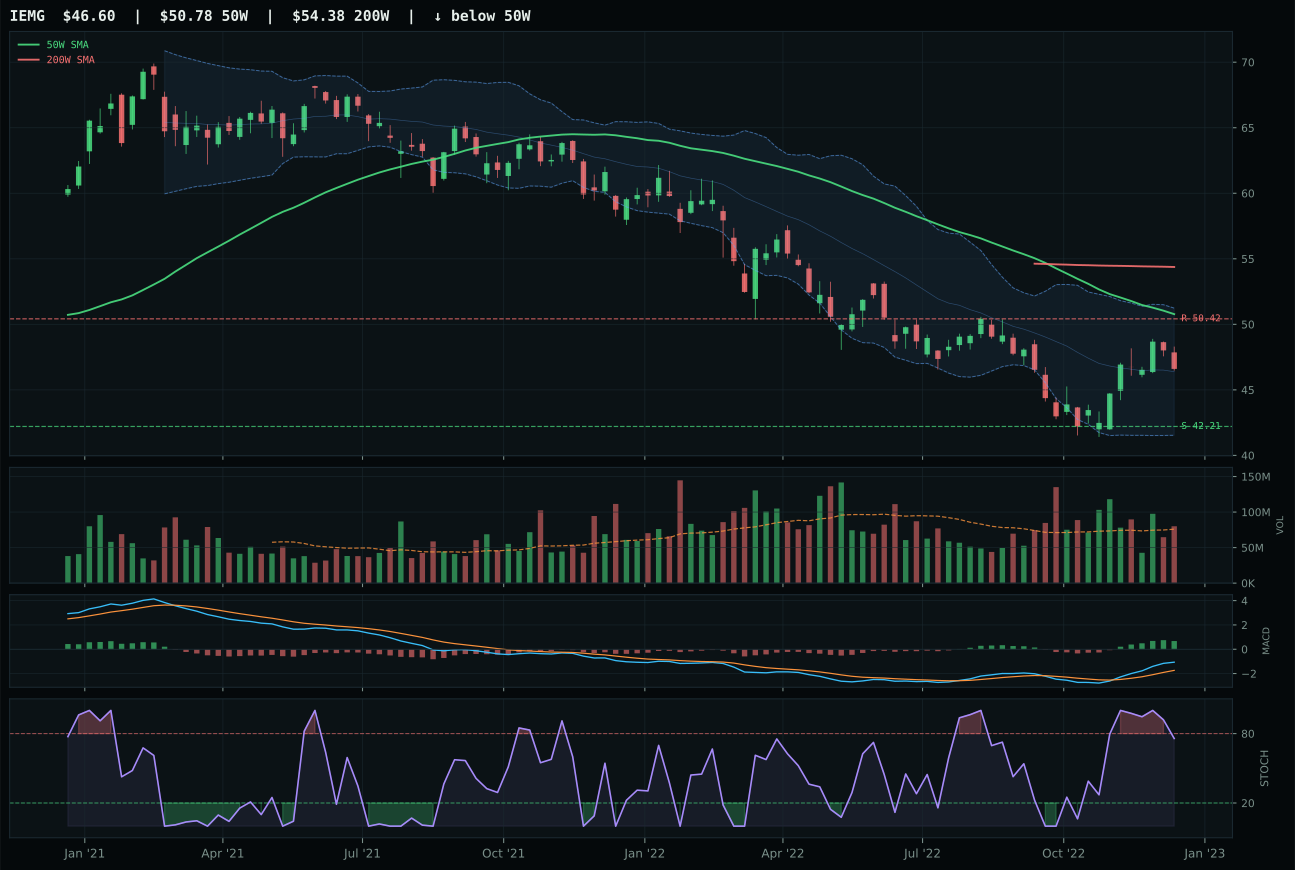
IEMG has a neutral structure profile with 0.7% 13-week relative strength versus SPY.
Extension and support failure are the main tactical risks.
Tracked, but not top-2 eligible because: structurally broken.
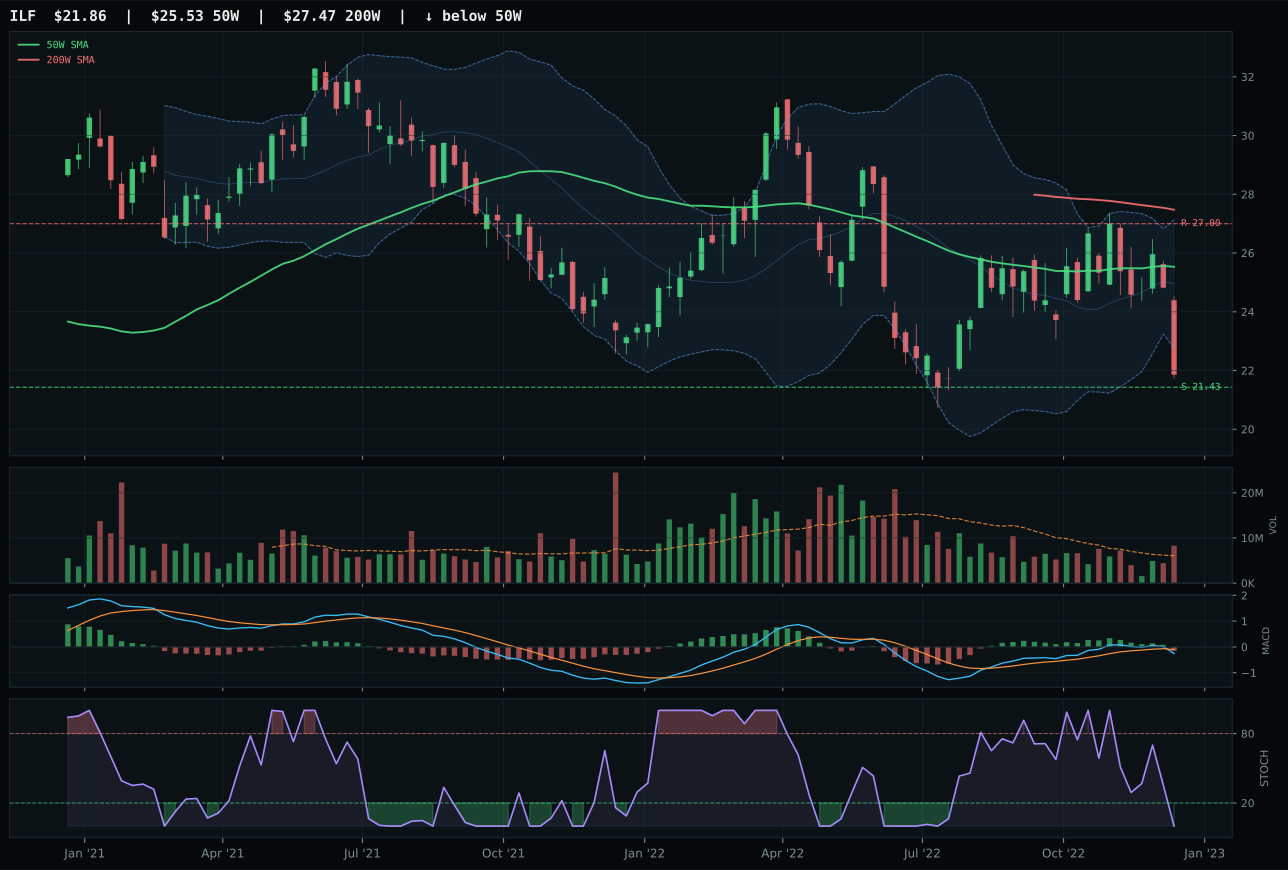
ILF has a pullback into support profile with -9.7% 13-week relative strength versus SPY.
Extension and support failure are the main tactical risks.
Tracked, but not top-2 eligible because: structurally broken.
INDA won by offering the only technically defensible setup in a category scoring just 12.6—the worst in the portfolio. Price sits -1.4% from the 50-week in compression with a perfect 100.0 timing score; MACD bullish-but-flattening and above-average volume participation (1.41x) suggest controlled buyers, not panic capitulation. The deep Fibonacci zone (0.618) at 42.40 provides defined support. IEMG's neutral structure and flattening MACD lack INDA's compression tightness; its 75.0 timing score versus INDA's 100.0 reflects a setup neither pulled back enough nor extended enough to trigger conviction. ILF is broken. The macro regime kills this category entirely: liquidity stress is -10, broad market bear is -9, risk appetite is only +8—a net negative environment that justifies the 10% allocation as portfolio completion, not conviction.
Emerging Markets scored 12.6 and earned 0% allocation because it ranks 10th (last) among all categories, combining the worst macro fit of 39.0/100 with technical setups that lack institutional acceleration. Risk appetite positive is active (+8) but liquidity stress is active (-10) and broad market bear sentiment is flagged (-9), creating a three-way headwind that prevents conviction in a category dependent on risk-on flows. INDA's compression setup is mechanically sound, and its 100.0 timing score is legitimate, but the underlying -1.6% SPY underperformance and -2.2% absolute return prove that emerging markets are underperforming the reflation narrative that supports Commodities and Defense. The 1.41x volume participation on INDA is above-average, but it reflects local relative support-finding rather than strategic institutional rotation into emerging exposure. For Emerging Markets to earn a position, either the macro regime would need to shift from Late-Cycle Reflation toward pure growth recovery (which would favor both EM and cyclicals), or INDA would need to achieve positive SPY relative strength; neither is present. Capital is better deployed in the six categories already allocated, leaving Emerging Markets as a residual position only if top-2 leaders roll over and force portfolio rebalancing.