
2022-12-09
Informational purposes only. The content in this report, including allocations, analysis, and commentary, is provided solely for informational and educational purposes. It does not constitute financial advice, investment advice, trading advice, or any other type of advice. Past performance does not guarantee future results. Always conduct your own research and consult a qualified financial professional before making investment decisions.
Weekly Allocation
| Ticker | Category | Weight | Role |
|---|---|---|---|
| COPX | Industrial Metals | 20% | Top-2 (20%) |
| XLU | Utilities & Infrastructure | 20% | Top-2 (20%) |
| MOO | Agriculture & Livestock | 10% | Tier-2 (10%) |
| SLV | Precious Metals | 10% | Tier-2 (10%) |
| ITA | Defense & Aerospace | 10% | Tier-2 (10%) |
| XLK | Technology | 10% | Tier-2 (10%) |
| XLE | Traditional Energy | 10% | Tier-2 (10%) |
| URA | Nuclear Energy | 10% | Tier-2 (10%) |
Trade Instructions — Monday Open
Sell the tranche from 2022-11-11 (completing its 4-week hold). Buy the new tranche. Instructions show net portfolio changes — same-asset positions cancel, weight changes show the delta.
| Action | Ticker | Instruction |
|---|---|---|
| SELL | XLE | Sell 12% of XLE position (reduce 20.00% → 17.50%) |
| SELL | XAR | Sell 33% of XAR position (reduce 7.50% → 5.00%) |
| SELL | PAVE | Sell entire PAVE position (2.50% of portfolio) |
| SELL | VEGI | Sell 33% of VEGI position (reduce 7.50% → 5.00%) |
| SELL | GLD | Sell 33% of GLD position (reduce 7.50% → 5.00%) |
| BUY | XLU | Buy XLU — 40.00% of freed cash (adds 5.00% to portfolio) |
| BUY | ITA | Buy ITA — 20.00% of freed cash (adds 2.50% to portfolio) |
| BUY | MOO | Buy MOO — 20.00% of freed cash (adds 2.50% to portfolio) |
| BUY | SLV | Buy SLV — 20.00% of freed cash (adds 2.50% to portfolio) |
Current Portfolio After Trade
Combined holdings across all 4 active tranches. Each tranche is 25% of the portfolio.
| Ticker | % of Portfolio | Weight Bar |
|---|---|---|
| XLE | 17.50% | |
| COPX | 17.50% | |
| URA | 10.00% | |
| XLK | 10.00% | |
| XLU | 10.00% | |
| XAR | 5.00% | |
| VEGI | 5.00% | |
| GLD | 5.00% | |
| IGF | 5.00% | |
| ITA | 5.00% | |
| MOO | 5.00% | |
| SMH | 2.50% | |
| SLV | 2.50% |
Macro Regime — Late-Cycle Reflation
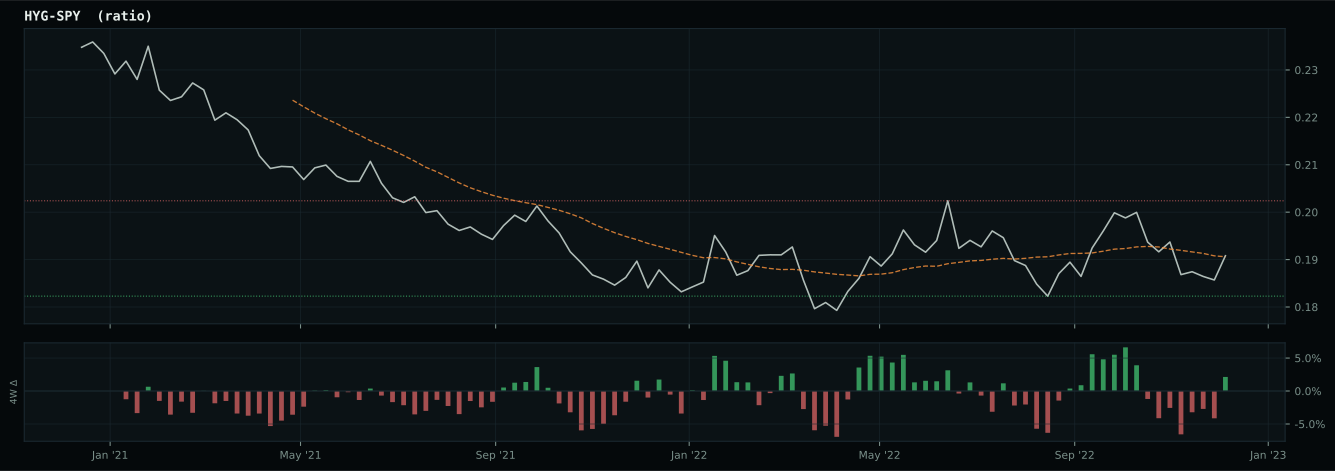
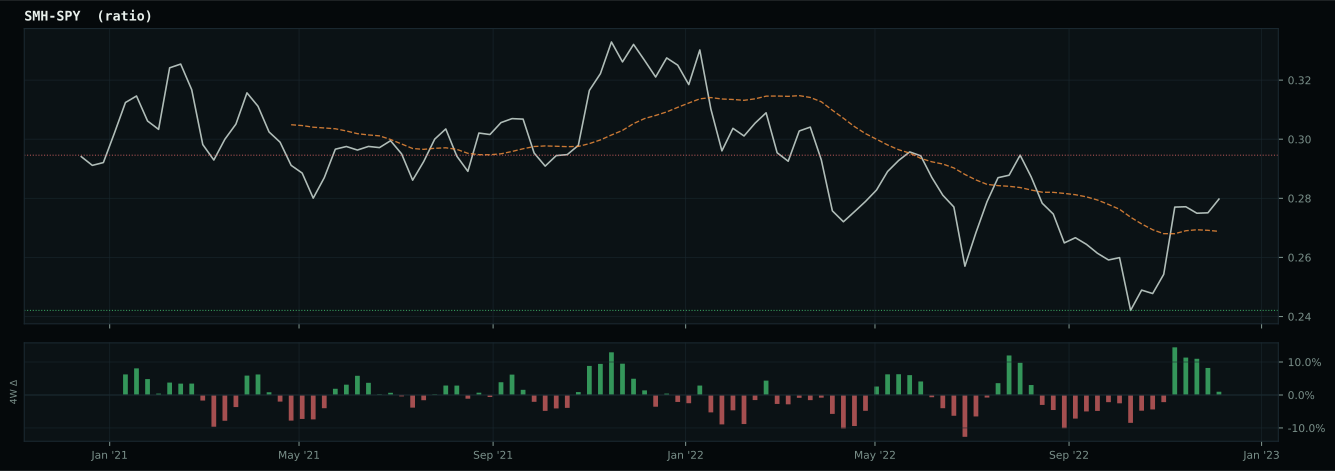
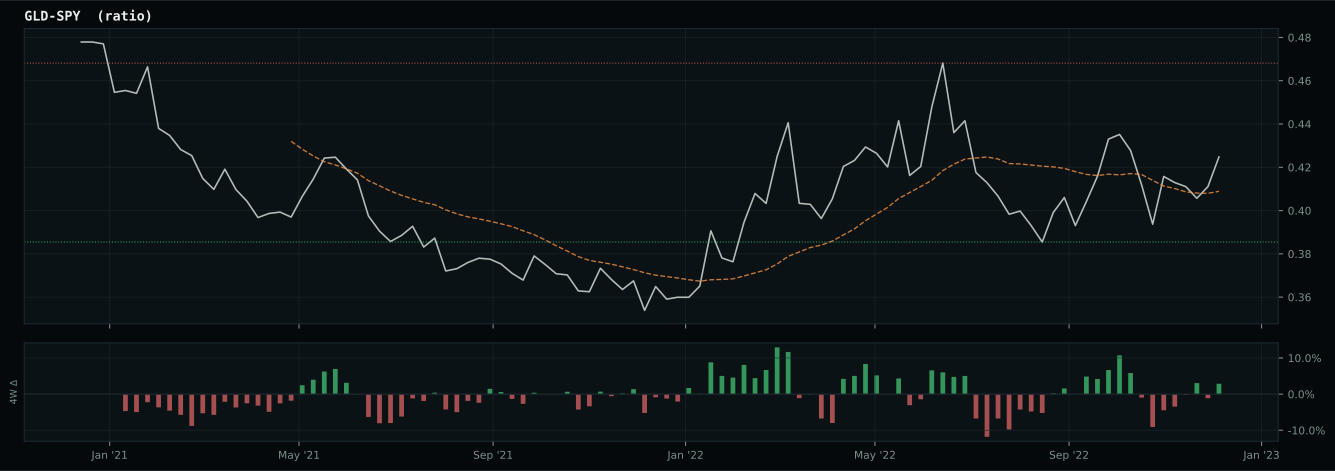
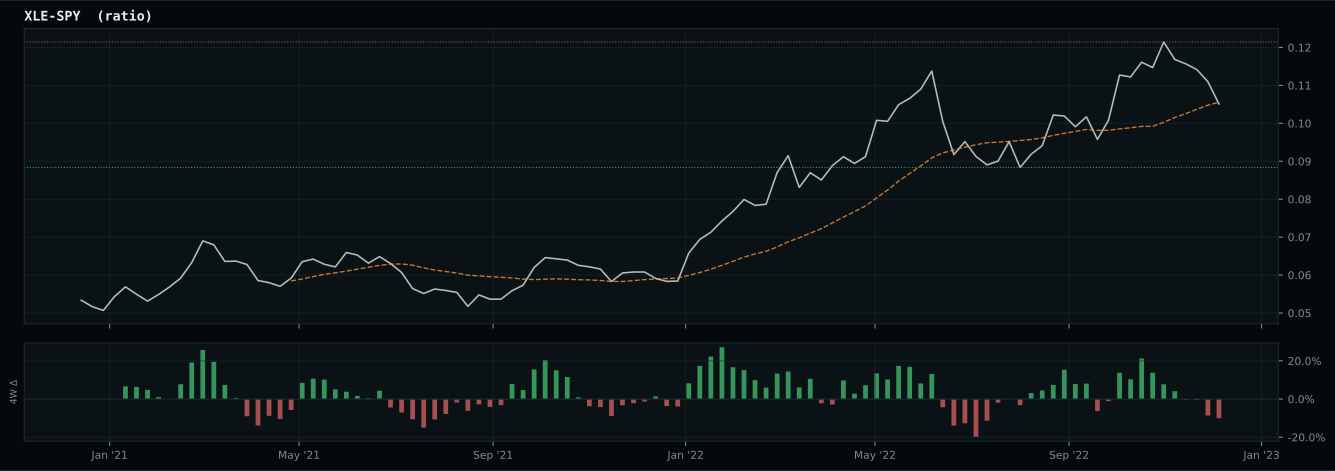
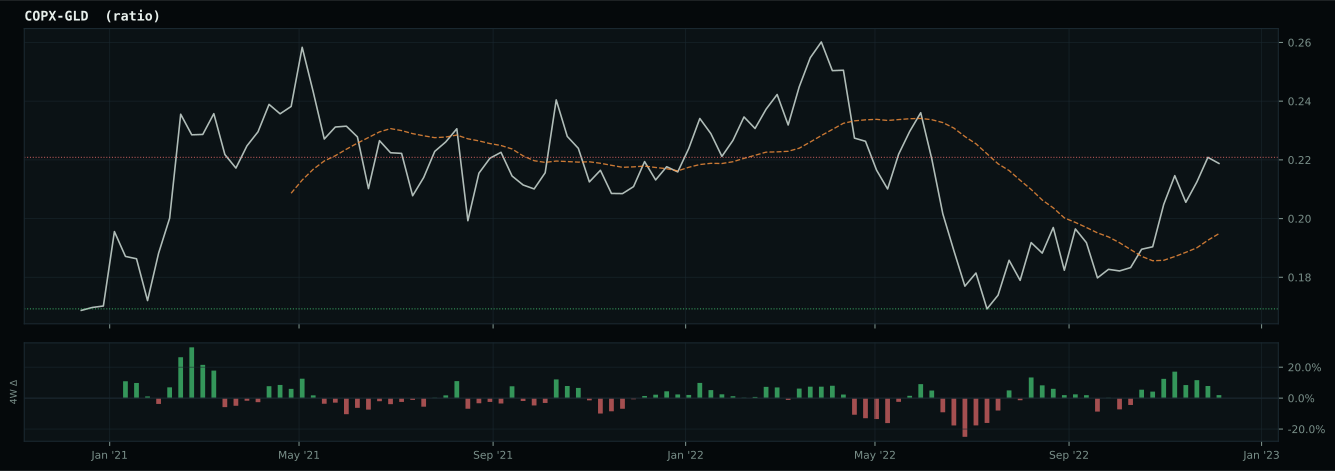
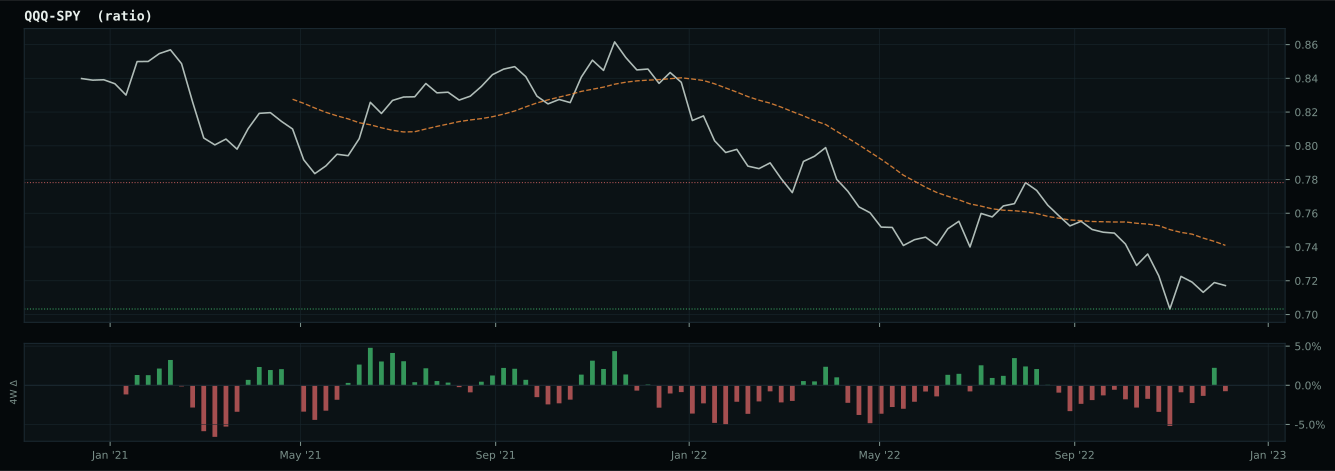
Macro Evidence Charts
Market-implied signals behind the macro regime scores. Each ratio compares two assets; the direction and slope of the ratio is what the macro engine reads.
Crypto Regime — NoCrypto
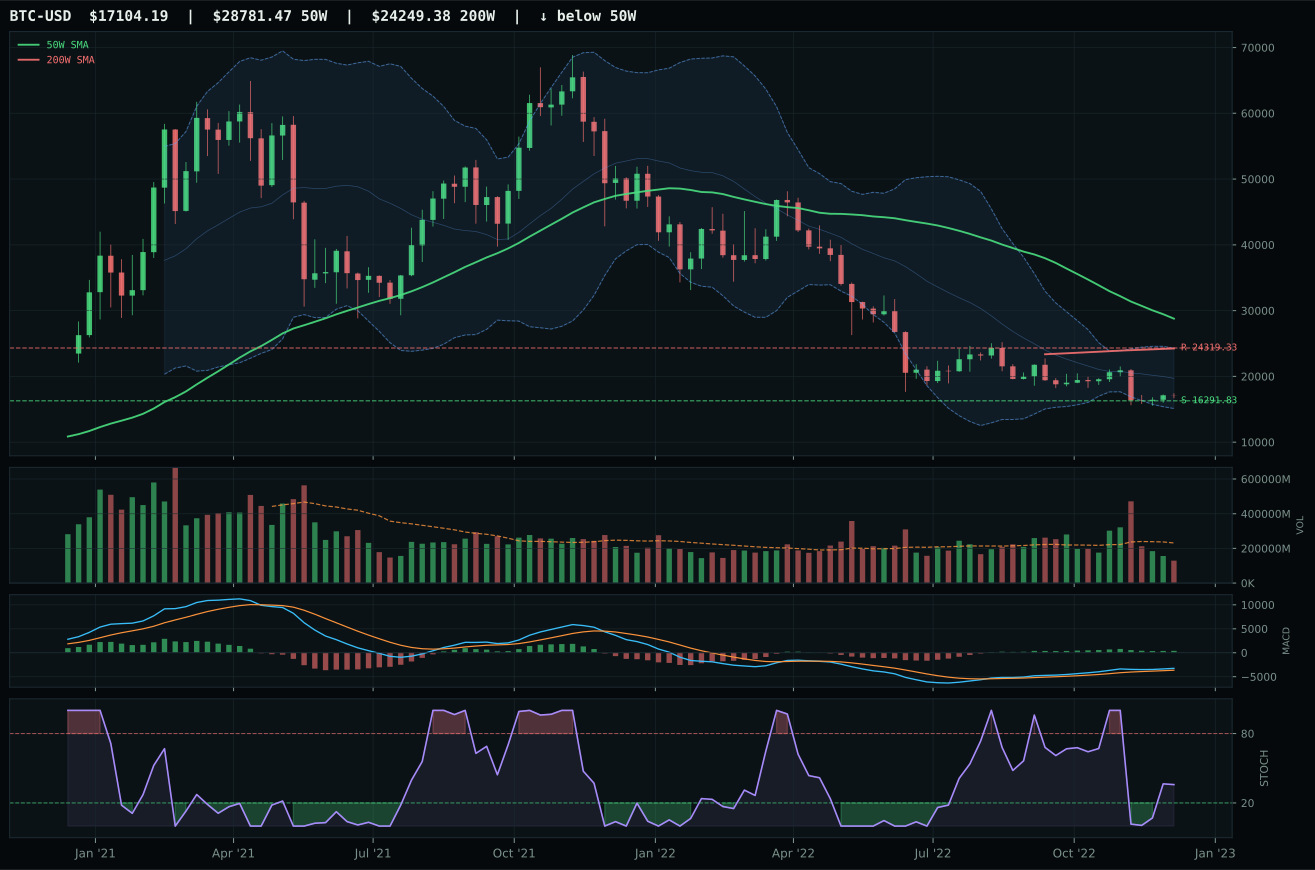
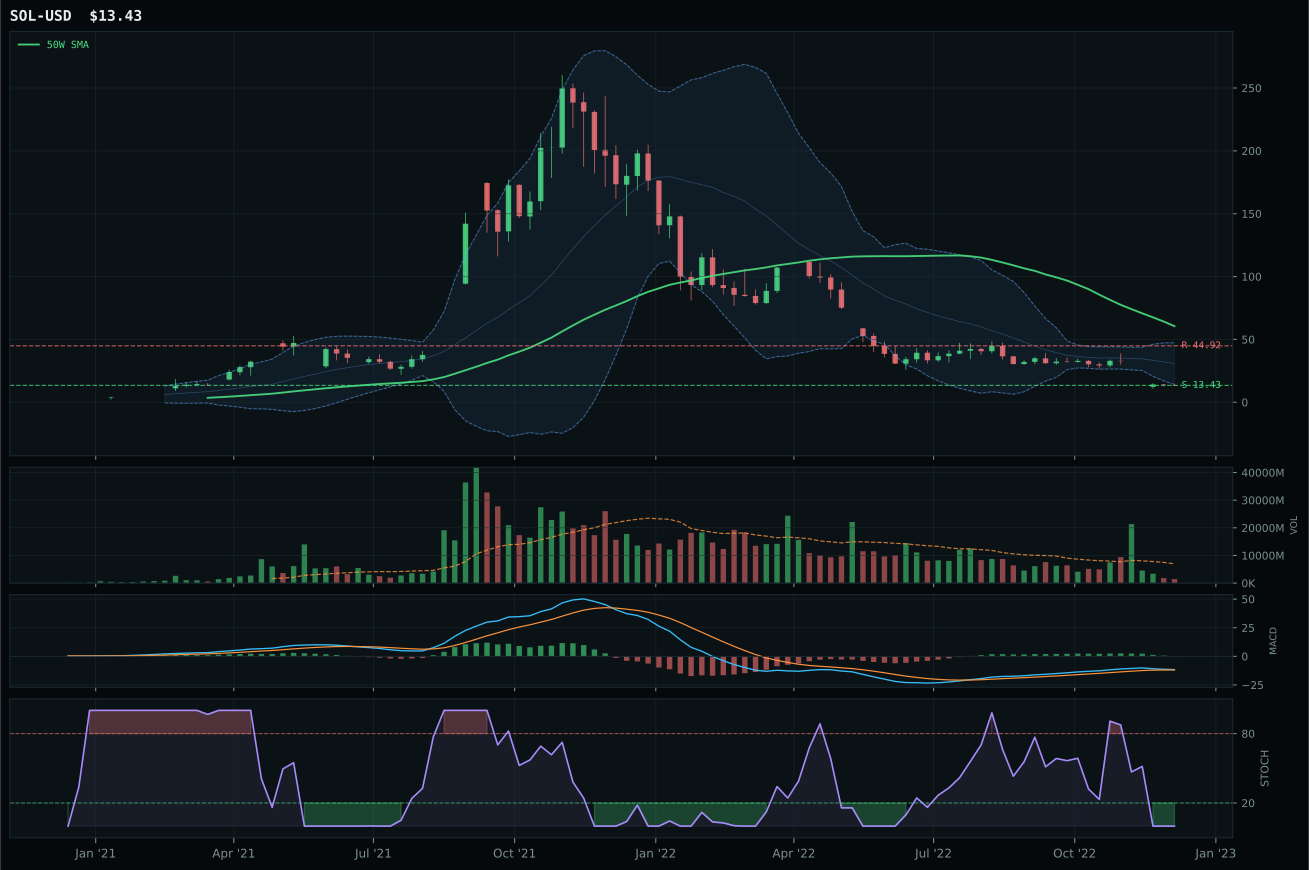
ValueBTC armed; waiting for 50W reclaim, decisive close above post-touch range resistance by 3%, close above 200W, breakout volume above 20W…
TrendBTC not confirmed
one or more available conditions failed
Category Rankings
| Rank | Category | Winner | Score | Alloc | 4W Ret | Peers (4W) |
|---|---|---|---|---|---|---|
| 1 | Industrial Metals | COPX | 69.4 | 20% | +7.55% | PICK +3.1% · REMX -5.3% |
| 2 | Utilities & Infrastructure | XLU | 62.3 | 20% | -0.31% | PAVE +0.4% · IGF +0.7% |
| 3 | Agriculture & Livestock | MOO | 56.0 | 10% | -2.37% | VEGI -1.2% · WEAT -0.8% |
| 4 | Precious Metals | SLV | 51.9 | 10% | +1.95% | GLD +4.8% · GDX +10.8% |
| 5 | Defense & Aerospace | ITA | 51.5 | 10% | +3.17% | XAR +5.3% · ROKT +6.9% |
| 6 | Technology | XLK | 47.7 | 10% | -4.02% | CIBR -4.2% · IGV -1.4% |
| 7 | Traditional Energy | XLE | 41.6 | 10% | +6.89% | FCG +1.4% · XOP +2.2% |
| 8 | Nuclear Energy | URA | 39.6 | 10% | +9.24% | NLR +1.8% · URNM +10.7% |
| 9 | AI | SMH | 37.4 | 0% | -1.46% | AIQ +0.2% · BOTZ +1.9% |
| 10 | Emerging Markets | INDA | 8.1 | 0% | -1.45% | IEMG +4.1% · ILF -4.0% |
Industrial Metals — COPX
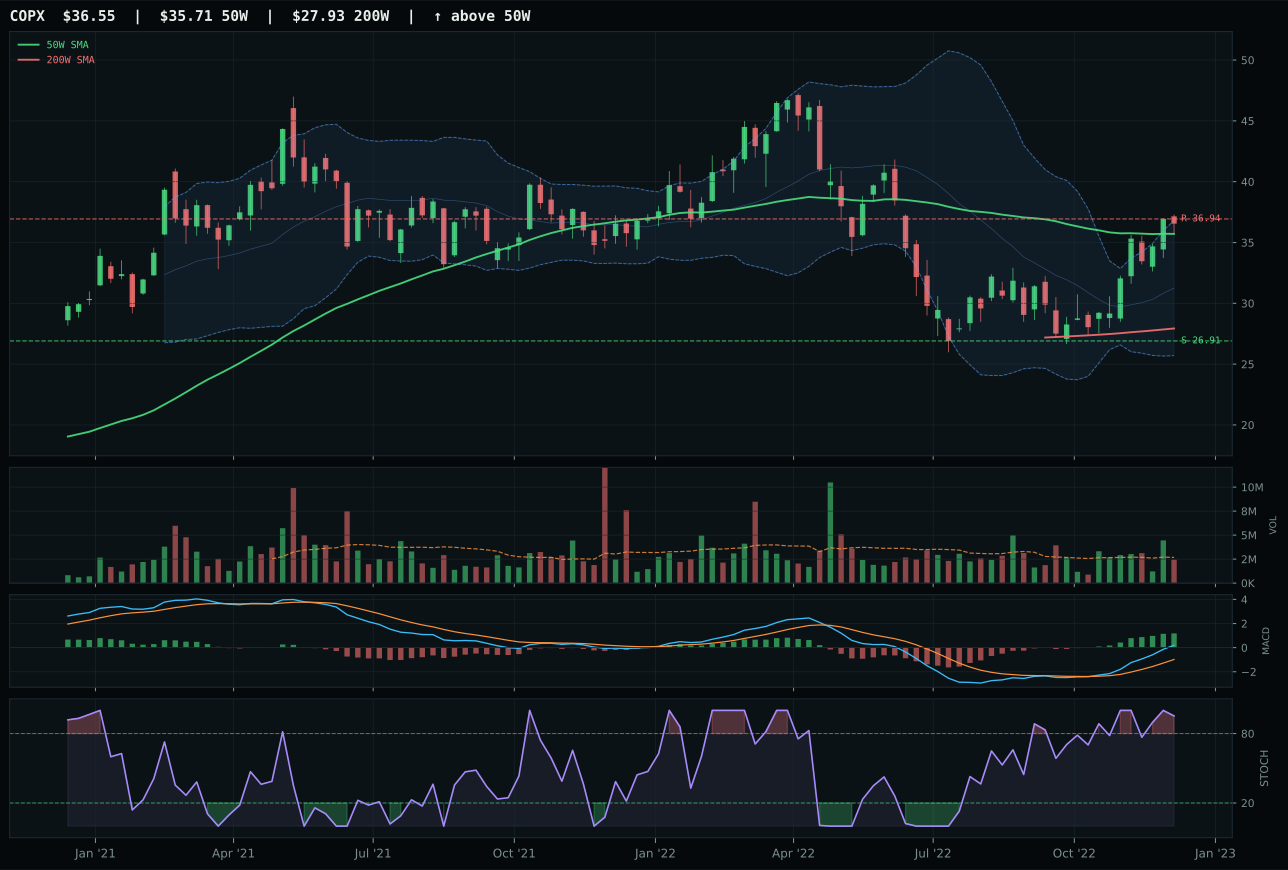
COPX has a compression near 50W profile with 19.7% 13-week relative strength versus SPY.
A failed hold above support would weaken the setup.
Actionable but governed by invalidation levels.
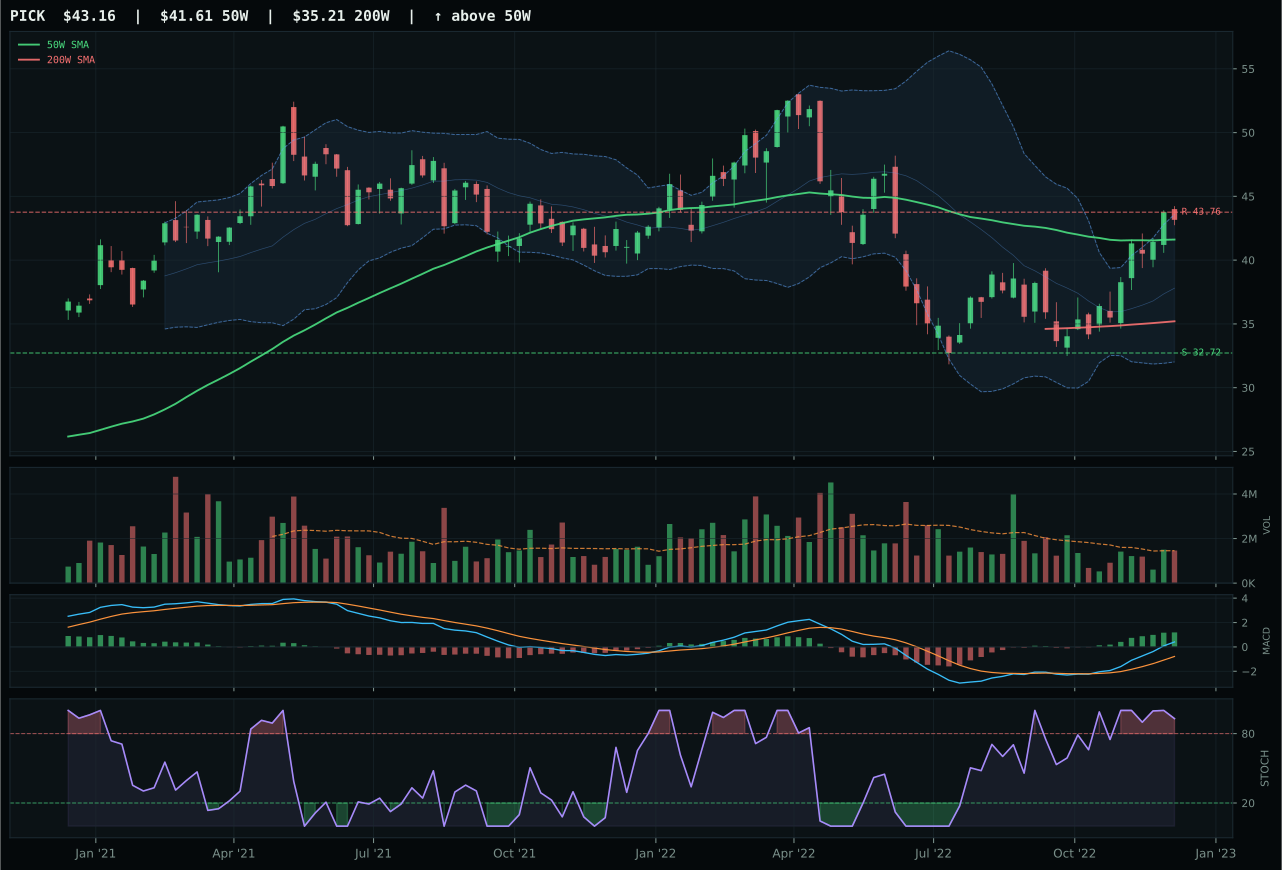
PICK has a neutral structure profile with 16.2% 13-week relative strength versus SPY.
A failed hold above support would weaken the setup.
Actionable but governed by invalidation levels.
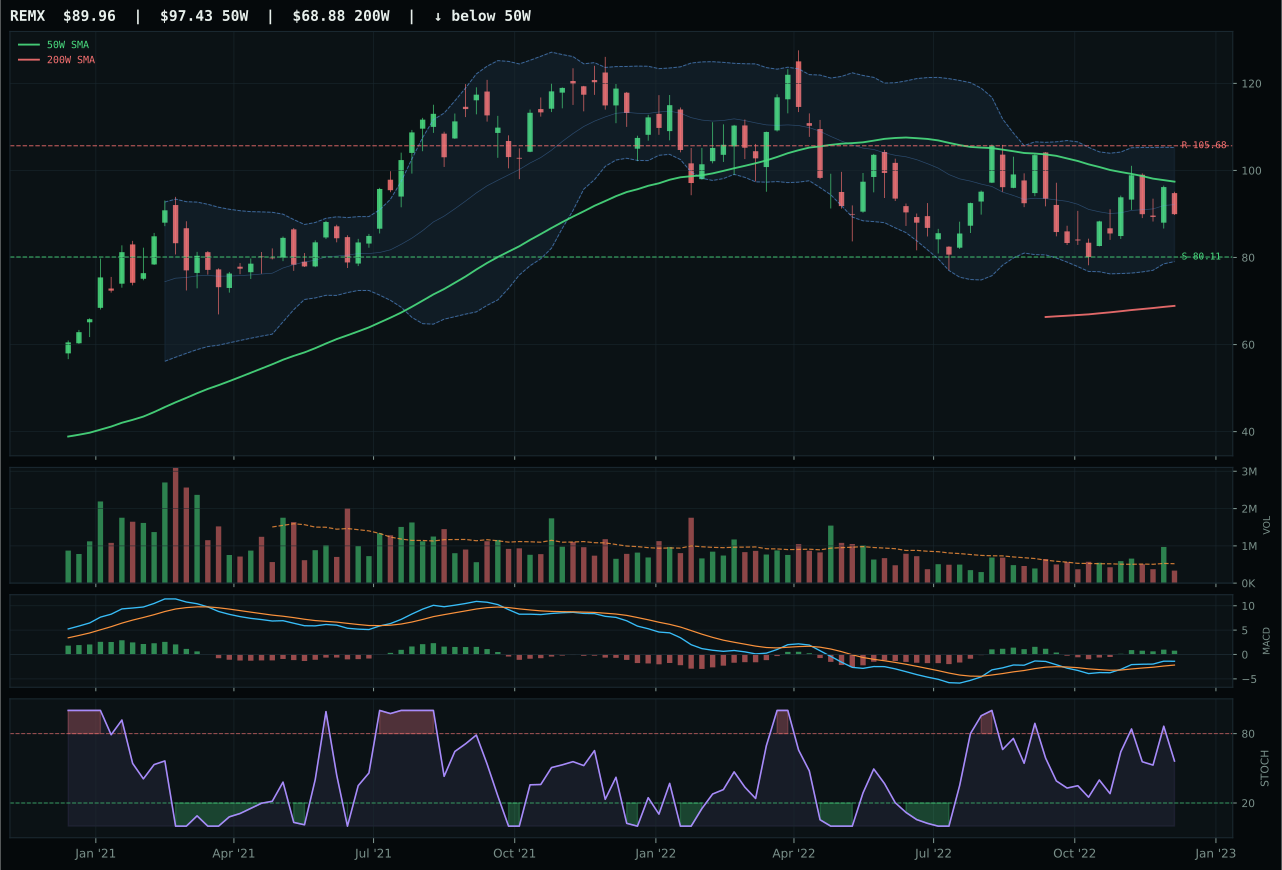
REMX has a neutral structure profile with -9.8% 13-week relative strength versus SPY.
A failed hold above support would weaken the setup.
Actionable but governed by invalidation levels.
COPX wins Industrial Metals and earns top-2 allocation at 20% because it combines a perfect storm of technical confirmation: trend score of 100 (price above both moving averages, RS vs SPY at 19.7%), timing score of 100 (only 2.3% from the 50-week, MACD bullish and improving, stochastic RSI overbought at 0.95), and momentum confirmation of 100 (13-week return of 16.4%, category-relative strength of 3.4%, volume neutral at 0.91x). The chart is compressing near the 50-week rather than extended above it, meaning there is expansion potential if buyers defend the level—a technical setup that invites conviction capital. PICK trails by only 2.2 points with 88 composite, but its timing of 97 versus COPX's perfect 100 and its -0.0% category-relative strength versus COPX's 3.4% tip the edge to the more outperforming name. Copper's industrial and EV demand tailwinds plus metals scarcity descriptors (+12 macro) provide the macro justification for COPX's technical leadership.
Industrial Metals ranks 69.4 and earns 20% top-2 allocation because the macro fit is exceptional at 75.0/100—late-cycle reflation, metals scarcity, commodity breadth positive, and real asset sponsorship all converge—and COPX's technical evidence of 95.3 is the cleanest setup in the entire portfolio. The category-level technical composite is weighted 62% versus macro 38%, and COPX passes both: near-perfect technicals with expansionist compression setup, plus genuine macro tailwind from EV build-out and supply constraints. The 20% allocation signals conviction that copper's structural demand from energy transition is not priced in, and that the compression near the 50-week has more upside before COPX becomes extended. Risk/reward is tight at 53.5 (only 1.1% upside to 36.94 resistance), but that is acceptable because the compressing structure promises range expansion, not a breakdown. COPX and XLU form the core defensive real-assets hedge in this late-cycle bear environment.
Utilities & Infrastructure — XLU
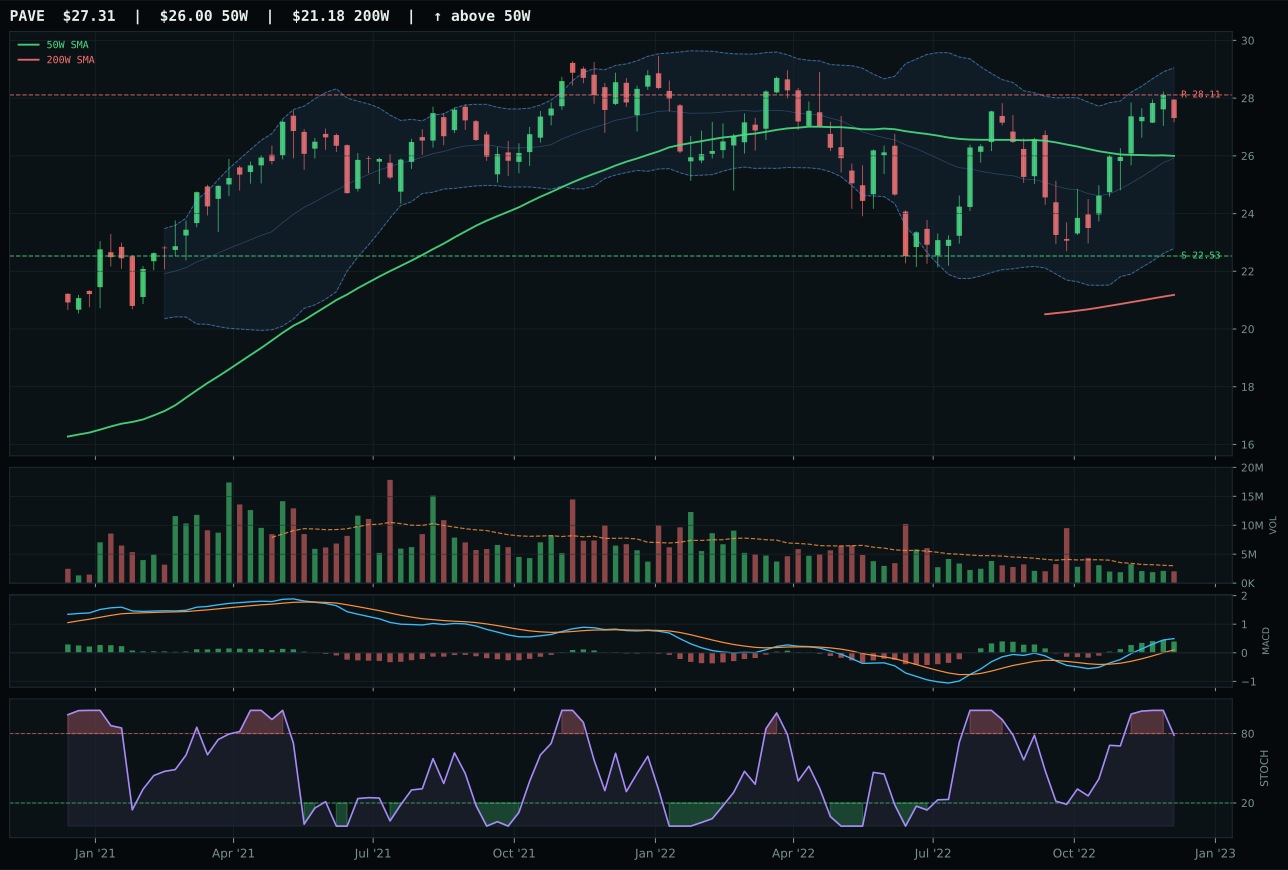
PAVE has a neutral structure profile with 6.1% 13-week relative strength versus SPY.
A failed hold above support would weaken the setup.
Actionable but governed by invalidation levels.
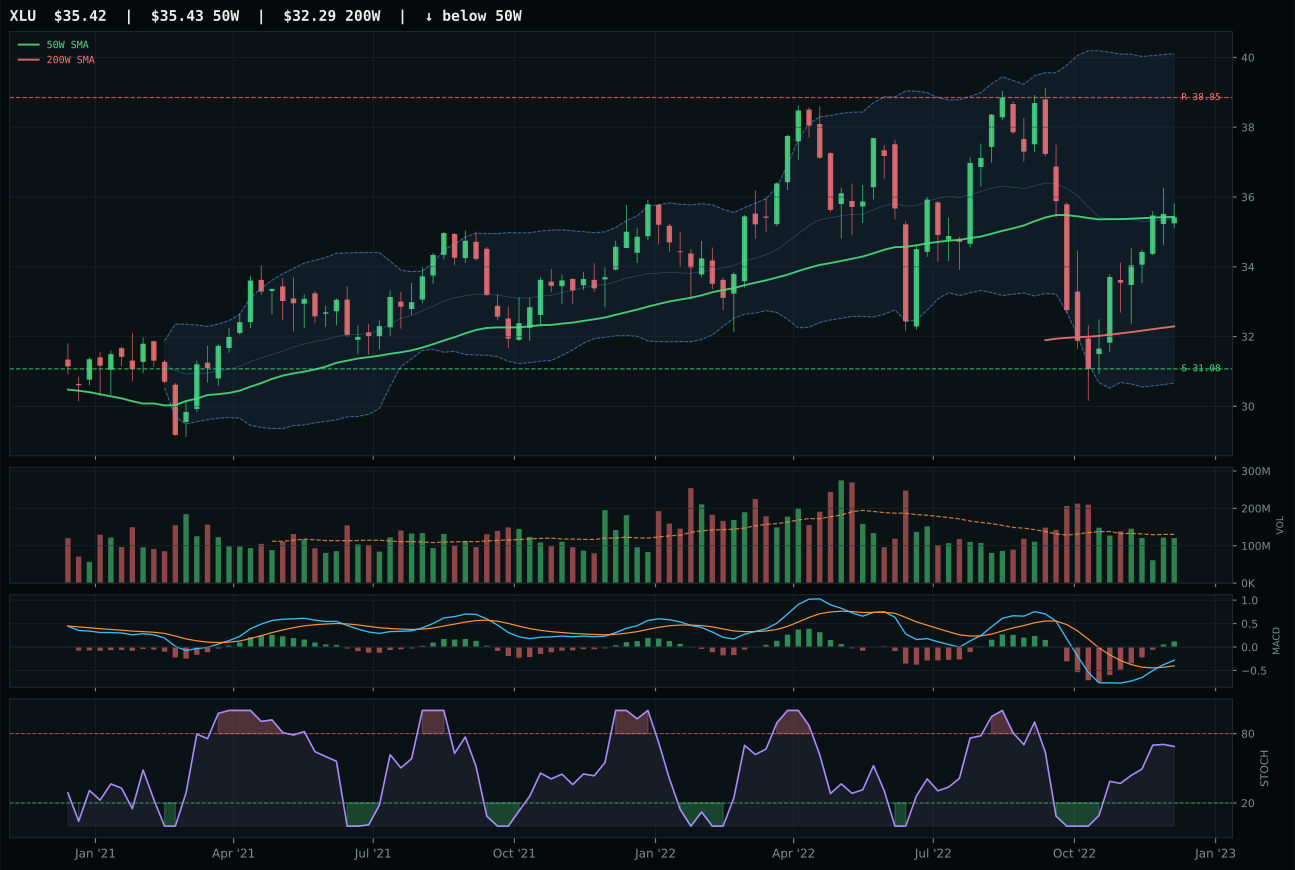
XLU has a compression near 50W profile with -5.2% 13-week relative strength versus SPY.
A failed hold above support would weaken the setup.
Actionable but governed by invalidation levels.
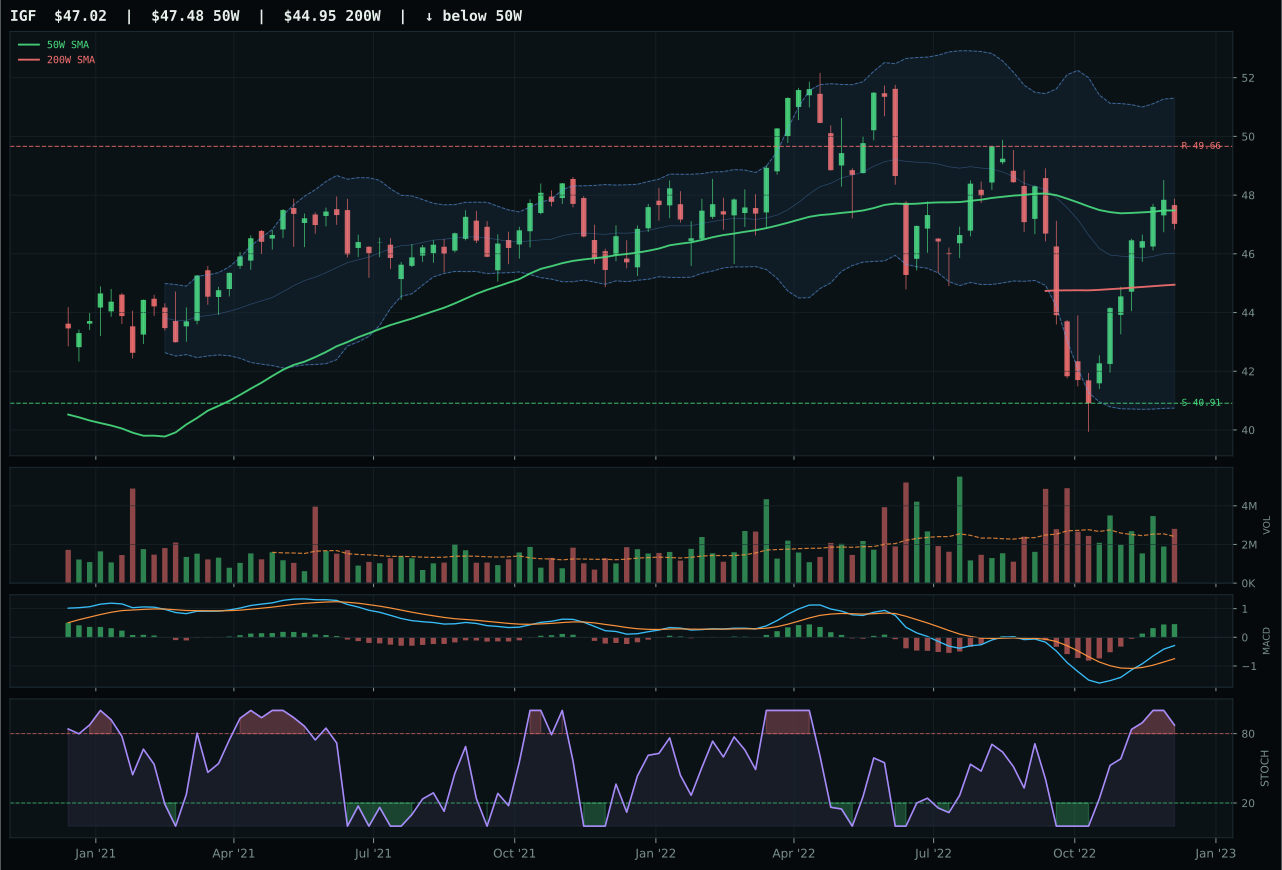
IGF has a compression near 50W profile with 0.6% 13-week relative strength versus SPY.
A failed hold above support would weaken the setup.
Actionable but governed by invalidation levels.
XLU wins Utilities & Infrastructure and earns top-2 allocation at 20% because its timing score of 100 is dominant—price is right at the 50-week (distance of -0.0%), MACD is bullish and improving, stochastic RSI is rising mid-zone at 0.69 (not overbought, not oversold, but directionally improving), and the compression near the 50-week at 74.3 creates expansion potential. Price sits in the middle retracement zone near Fib 0.382 at 35.70, neutral structure, and while the 13-week return of -8.5% looks awful, that is precisely the definition of a broken-and-reset setup: utilities have been sold indiscriminately and are now coiling at a critical technical level. PAVE trails because timing is only 75 (it is extended 5.0% above its 50-week), stochastic RSI is falling/neutral (not improving), and its risk/reward of 47.4 is poor relative to XLU's 64.4. The category-relative strength of -5.8% on XLU signals it is a laggard, not a leader, but that is appropriate in late-cycle—the point is that XLU is compressed and ready to re-expand if buyers step in.
Utilities & Infrastructure ranks 62.3 and earns 20% top-2 allocation because defensive rotation is aggressively active (+12 macro), broad market bear is active (+4), and XLU's timing setup at the exact 50-week inflection with improving stochastic RSI promises a measured entry for defensive capital. The category macro fit of 59.0 is solid but not exceptional (PAVE scores better at 80.4 technical evidence because it is further along its move), yet XLU's perfect timing of 100 and compression near support make it the lower-risk entry point into a defensive category. The momentum confirmation of only 44.1 reflects genuine weakness (4W return of 4.0% is barely positive, 13W return is -8.5%), but this is the setup's strength, not weakness—utilities are exhausted and oversold, waiting for a 4-week turn. The 20% allocation pairs with COPX to create a real-assets, defensive, inflation-hedge core: COPX captures industrial/EV demand upside, XLU captures defensive yield and inflation protection. Together they work in late-cycle reflation; XLU alone at this extreme compression is worth the full 20% conviction that buyers are ready to redeploy into safety and income.
Agriculture & Livestock — MOO
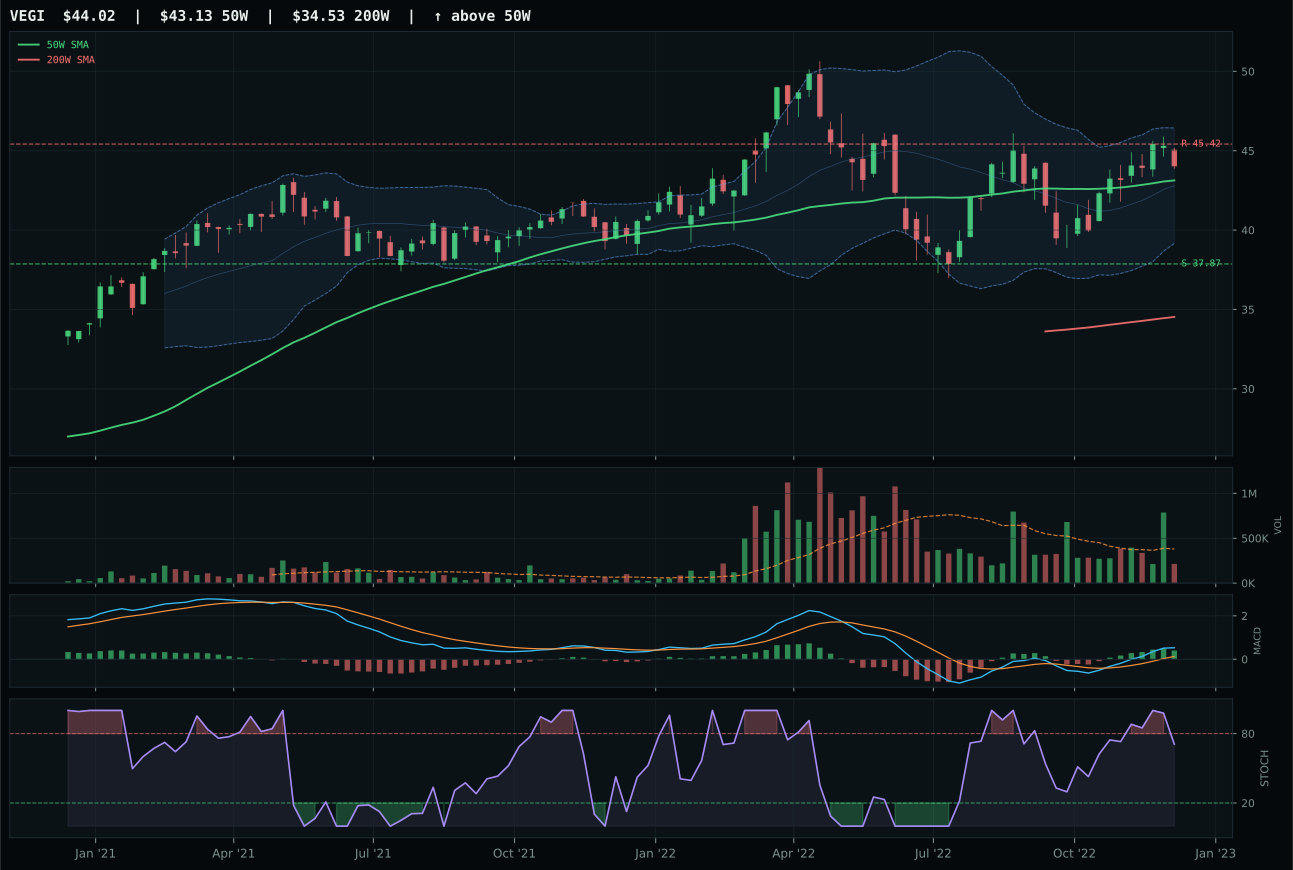
VEGI has a compression near 50W profile with 3.6% 13-week relative strength versus SPY.
A failed hold above support would weaken the setup.
Actionable but governed by invalidation levels.
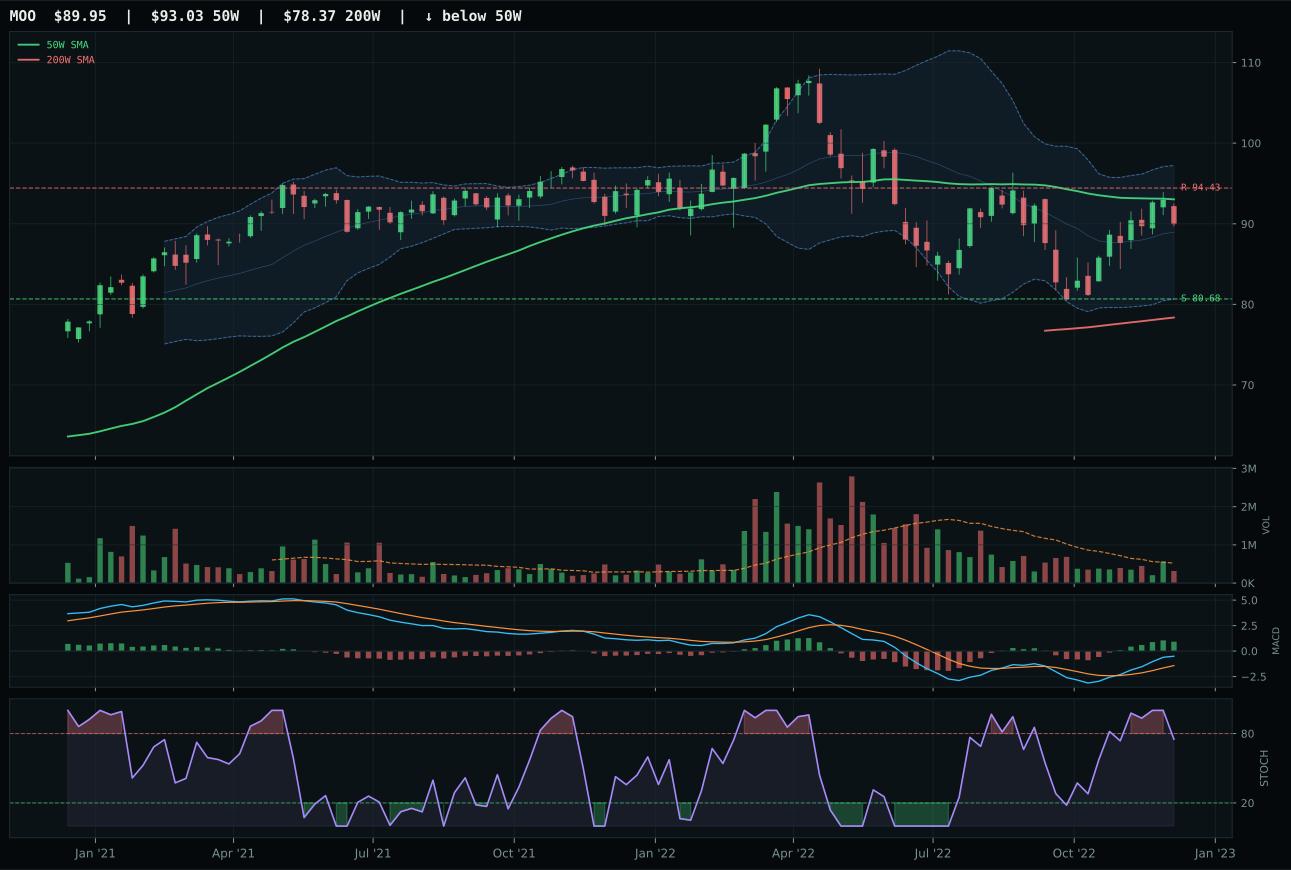
MOO has a neutral structure profile with 0.8% 13-week relative strength versus SPY.
A failed hold above support would weaken the setup.
Actionable but governed by invalidation levels.
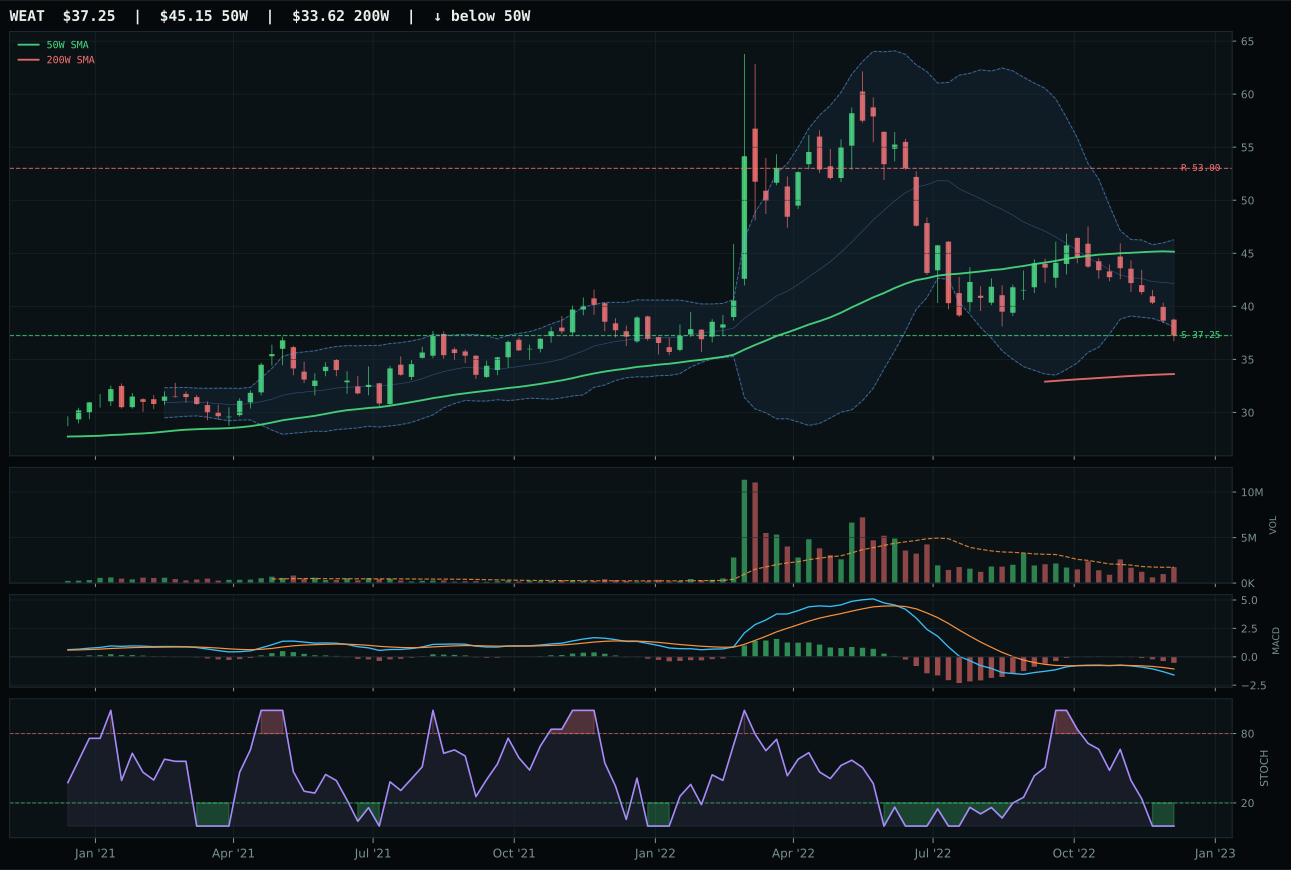
WEAT has a pullback into support profile with -12.2% 13-week relative strength versus SPY.
A failed hold above support would weaken the setup.
Actionable but governed by invalidation levels.
MOO wins the agriculture category because its timing score of 97/100 is dominant—price is only 3.3% below the 50-week, MACD is bullish and improving, stochastic RSI is falling/neutral at 0.75 (a stable mid-range read), and the Fib zone placement at 0.618 near 91.46 is the classic value retracement. The setup is neutral structure with 0.0% category-relative strength, meaning MOO is neither a leader nor a laggard; what matters is that VEGI—the technical composite 87 runner-up—is 2.1% extended above its 50-week, creating a timing asymmetry that favors the pullback candidate over the stretched one. MOO's risk/reward of 60.4 shows balanced odds: 11.5% downside to support 80.68 versus only 4.7% upside to 94.43 resistance, which is appropriate for a deep-retracement setup awaiting conviction buyers. Volume at 0.61x is thin, but that is not a sell signal in a mean-reversion context—low participation means the setup is not yet crowded.
Agriculture & Livestock earns 10% allocation despite scoring a solid 56.0 and having exceptional macro fit at 90.0/100—supply shortage and inflation pressure are both active, real asset sponsorship is on, and late-cycle reflation directly supports commodities and agriculture. MOO's technical evidence of 67.6 is respectable but not exceptional, and the momentum confirmation of 55.1 reflects weak 13-week performance of -2.5%, so the setup is tactical timing-based, not a conviction buy. VEGI's superior technical score of 84.5 and better 13-week return of +0.3% signal that global agriculture producers are actually performing better, but VEGI is already extended and compressed near its 50-week—a textbook reason to pass on the better absolute technicals in favor of the better entry point. The 10% weight positions for an agriculture rebound if food inflation accelerates, but it is not a top allocation because the actual buying (volume, relative strength) is modest; this is macro conviction expressed at low conviction price.
Precious Metals — SLV
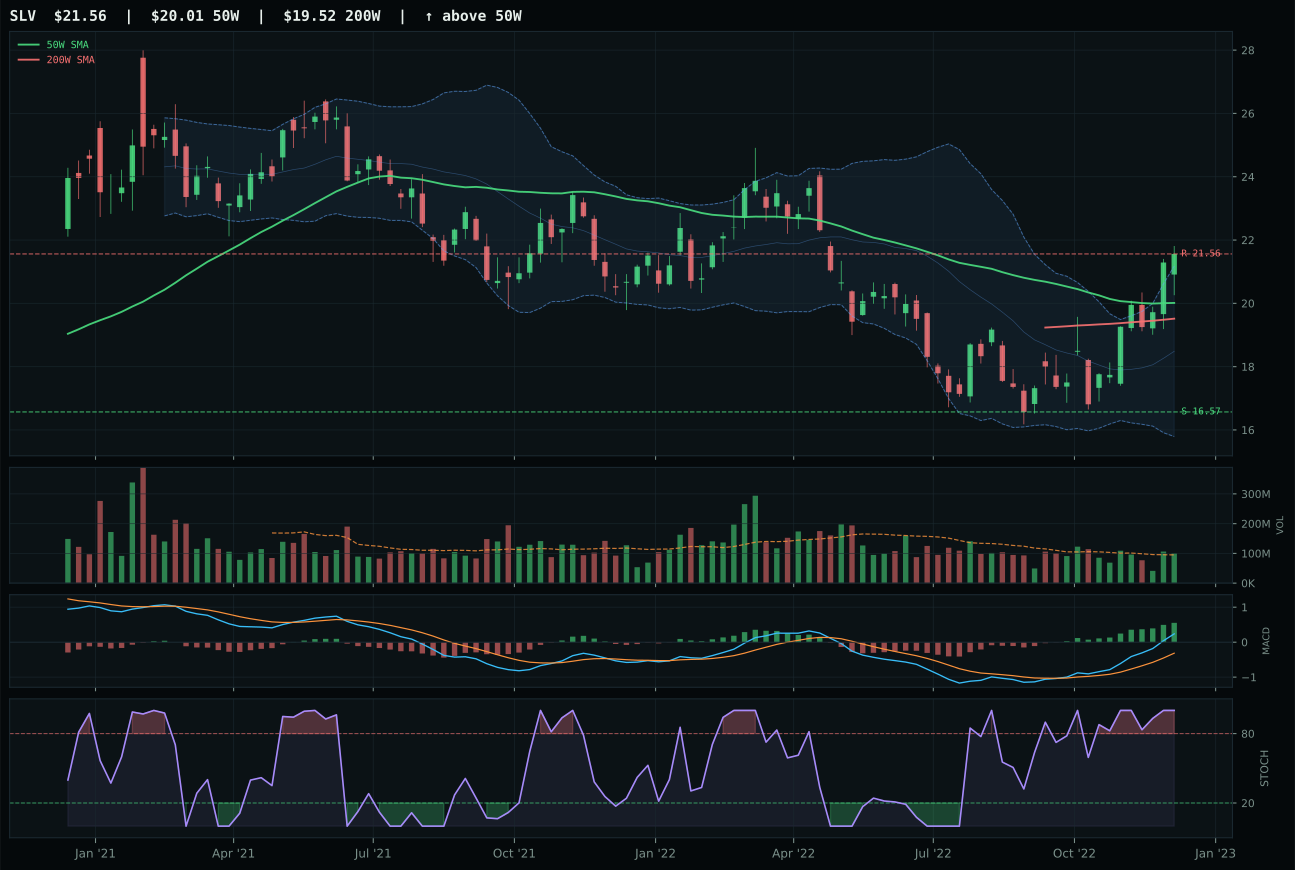
SLV has a neutral structure profile with 27.8% 13-week relative strength versus SPY.
A failed hold above support would weaken the setup.
Actionable but governed by invalidation levels.
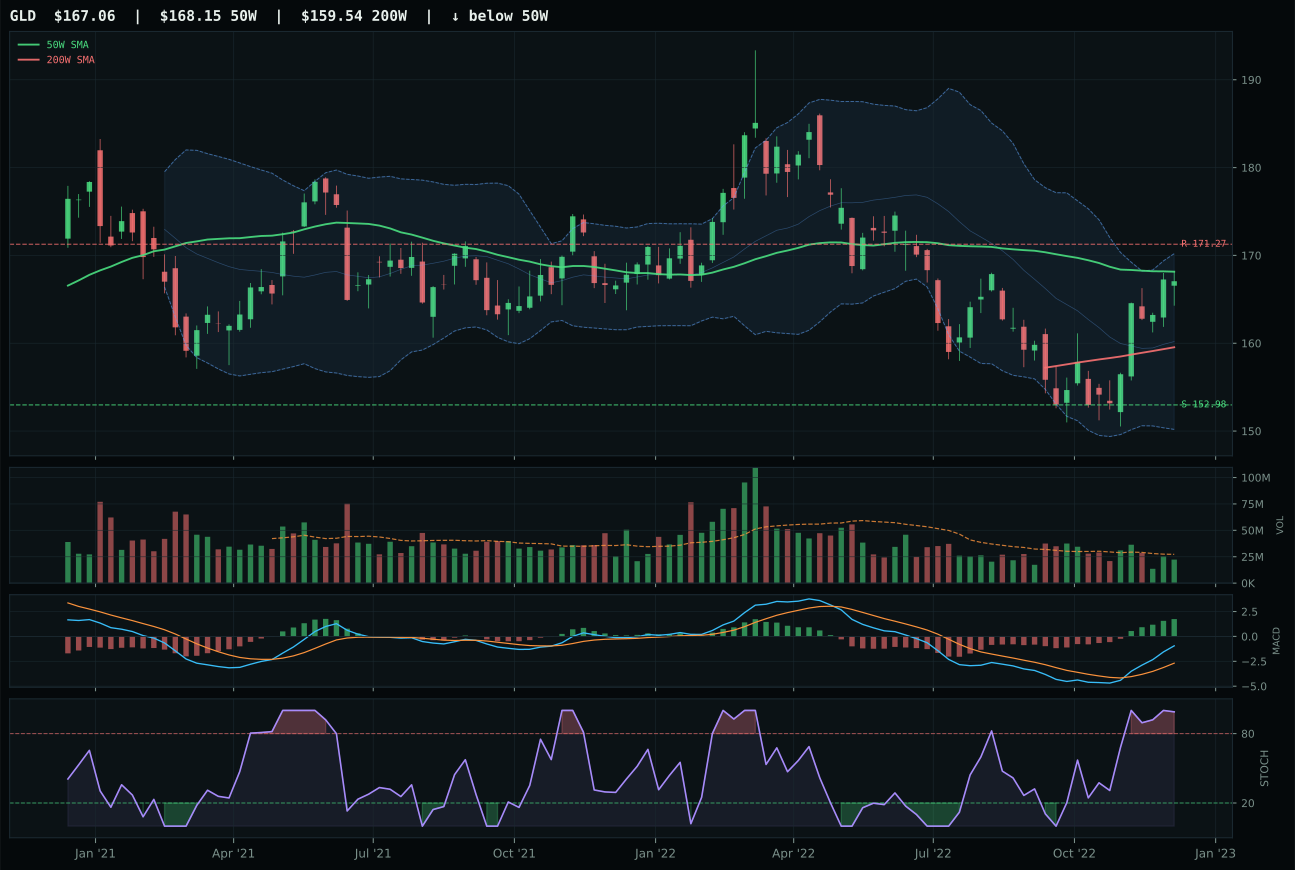
GLD has a compression near 50W profile with 7.8% 13-week relative strength versus SPY.
A failed hold above support would weaken the setup.
Actionable but governed by invalidation levels.
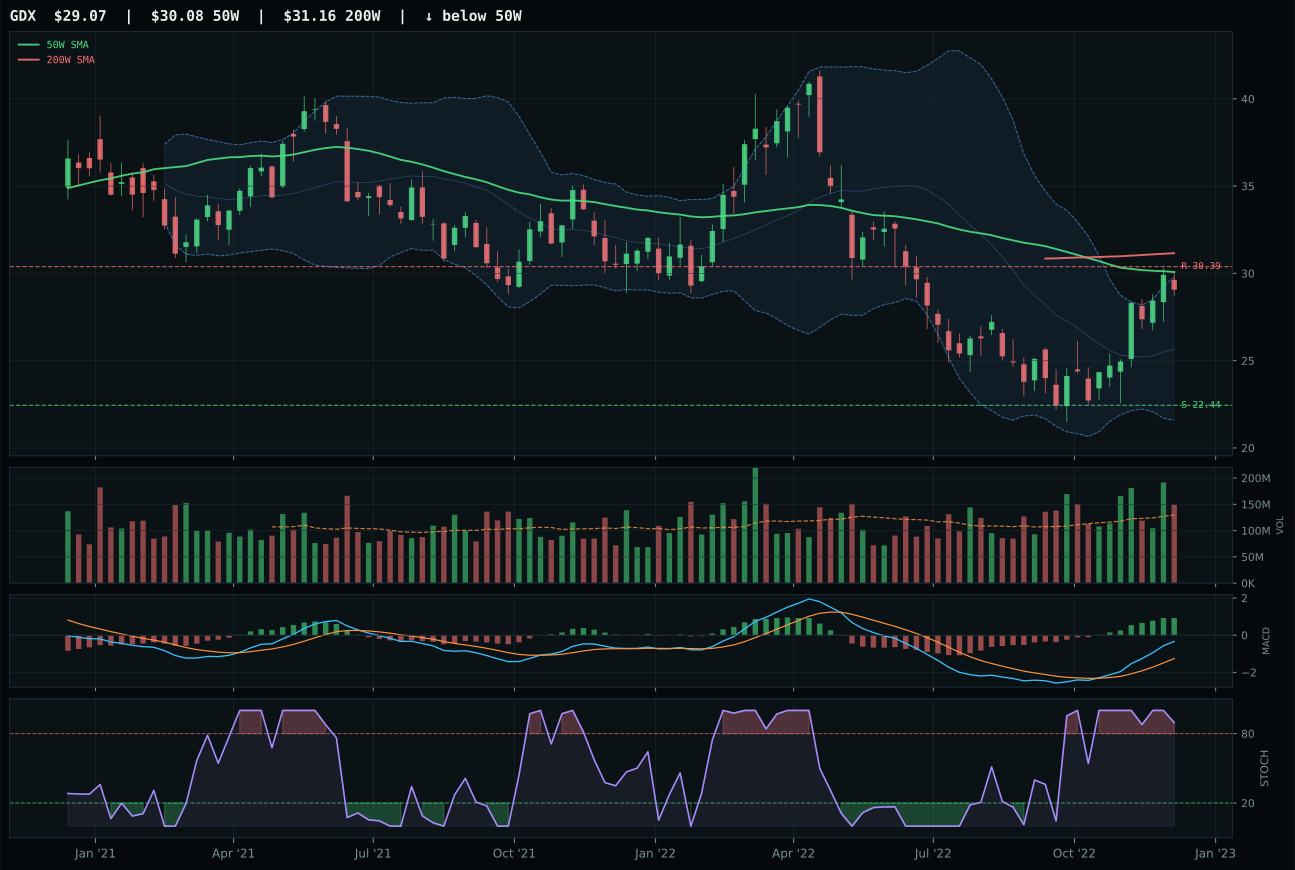
GDX has a neutral structure profile with 19.1% 13-week relative strength versus SPY.
Extension and support failure are the main tactical risks.
Tracked, but not top-2 eligible because: structurally broken.
SLV wins decisively because it is the only name in the basket posting positive real momentum: 24.5% 13-week return, 27.8% relative strength versus SPY, and 8.7% category-relative strength that leaves GLD and GDX in the dust. Price is above both the 50-week and 200-week, sitting in the middle retracement zone near Fib 0.382 at 21.57, and both MACD and momentum confirmation score 100/100—there are no red flags or divergences, just clean price discovery with buying power. Stochastic RSI is overbought at 1.00 but that reflects genuine strength rather than exhaustion; silver's industrial use case plus monetary hedge bid are both working. The composite score of 84 crushes GLD's 69 because GLD's category-relative strength is -11.3%, revealing that gold is actually underperforming the metals complex despite its monetary premium. SLV is extended and offers no upside to the 21.56 resistance, but that is the chart telling you the move is real, not overheated.
Precious Metals earns 10% allocation with a category score of 51.9 because the macro fit is strong at 67.0/100—monetary hedge bid and metals scarcity are both active descriptors—but SLV's overbought exhaustion and poor risk/reward of 57.8 (zero upside, 30% downside) argue against adding to an extended position. The technical evidence of 94.7 on SLV is the highest in the entire portfolio, a signal that silver has completed its near-term move and is now vulnerable to mean reversion or consolidation. This is exactly when you hold 10% for conviction, not add at market prices. The category would earn 20% only if SLV broke above 21.56 on volume and confirmed fresh upside, or if GLD and gold regained relative strength against the dollar. For now, the allocation respects the macro tailwind and silver's real momentum while acknowledging that technical extension makes this a 'sell into strength' candidate, not a buy-the-dip setup.
Defense & Aerospace — ITA
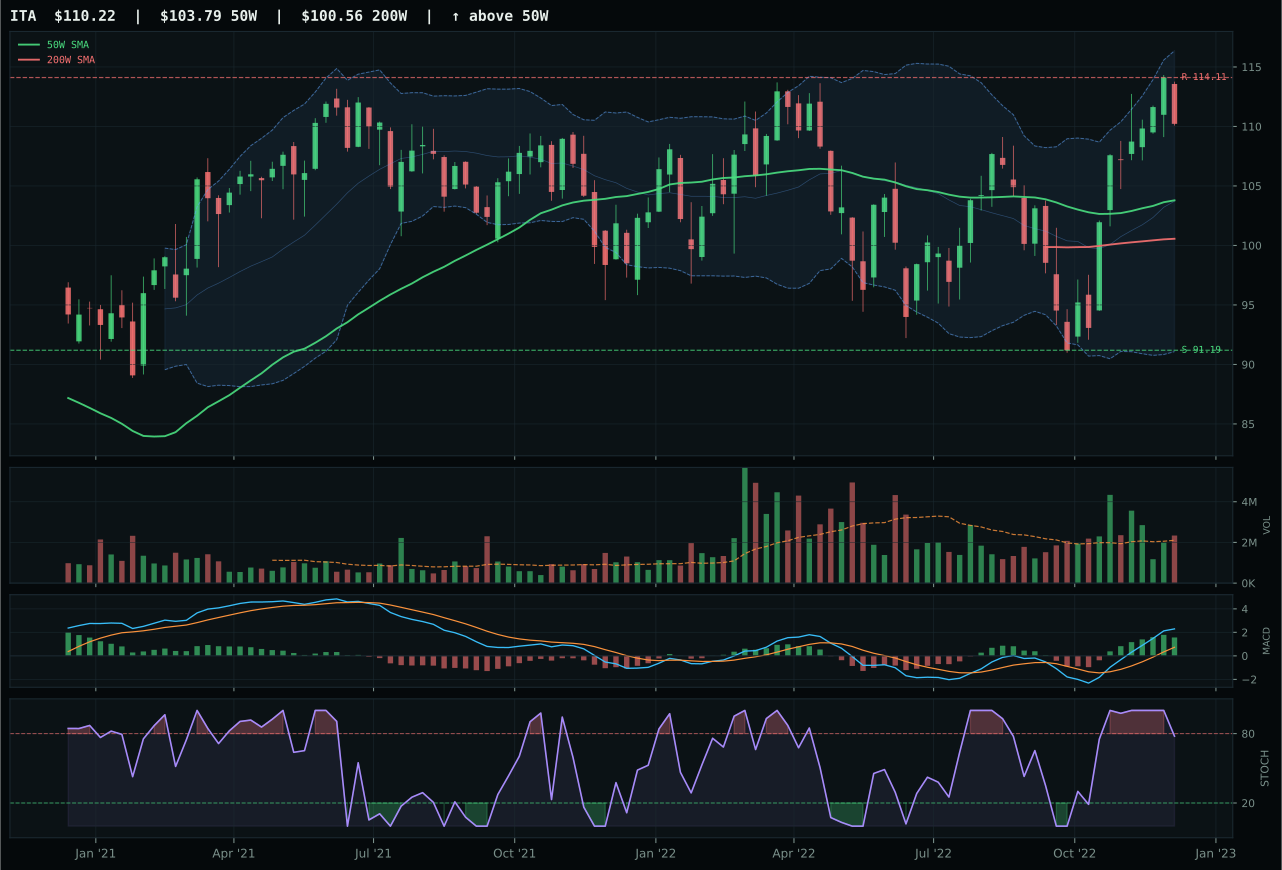
ITA has a neutral structure profile with 10.2% 13-week relative strength versus SPY.
A failed hold above support would weaken the setup.
Actionable but governed by invalidation levels.
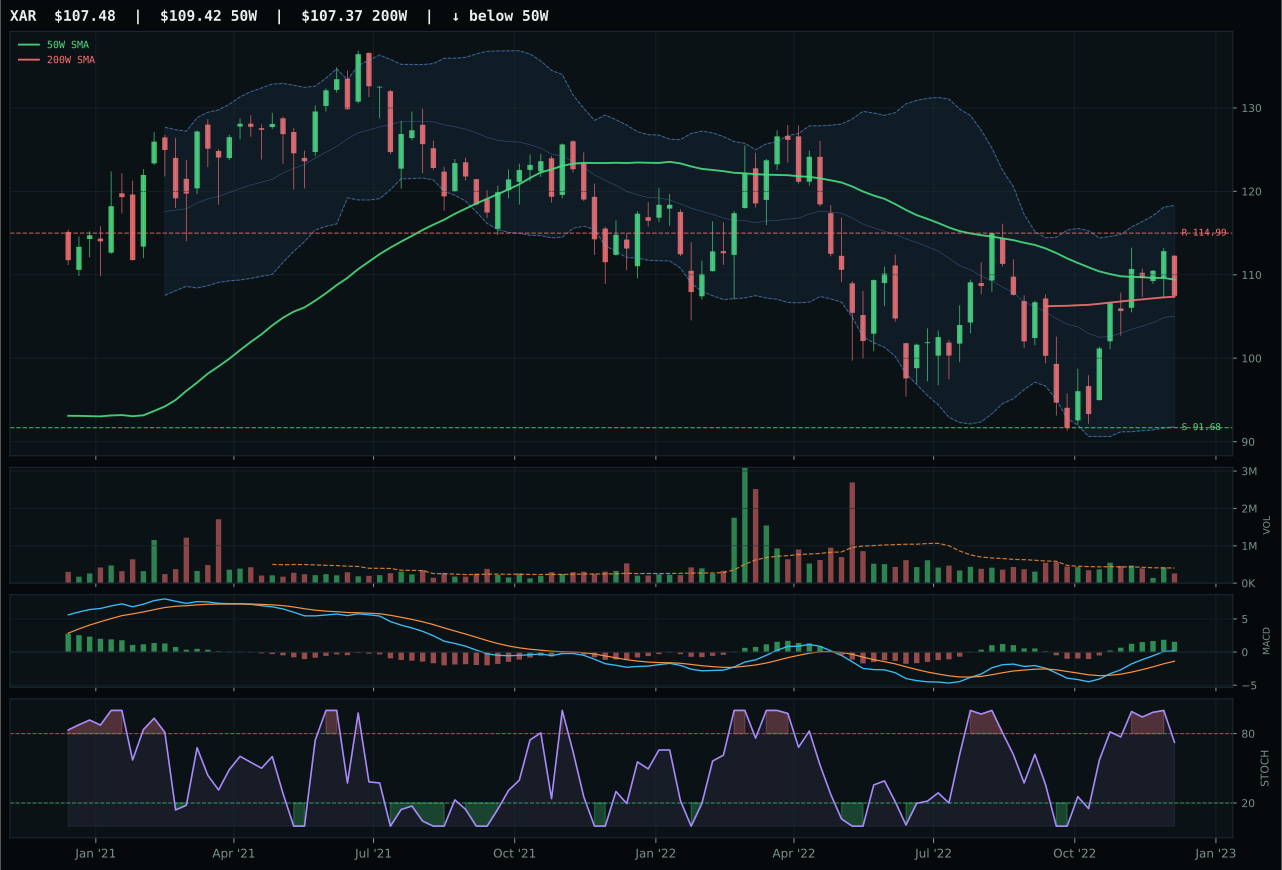
XAR has a compression near 50W profile with 4.0% 13-week relative strength versus SPY.
A failed hold above support would weaken the setup.
Actionable but governed by invalidation levels.
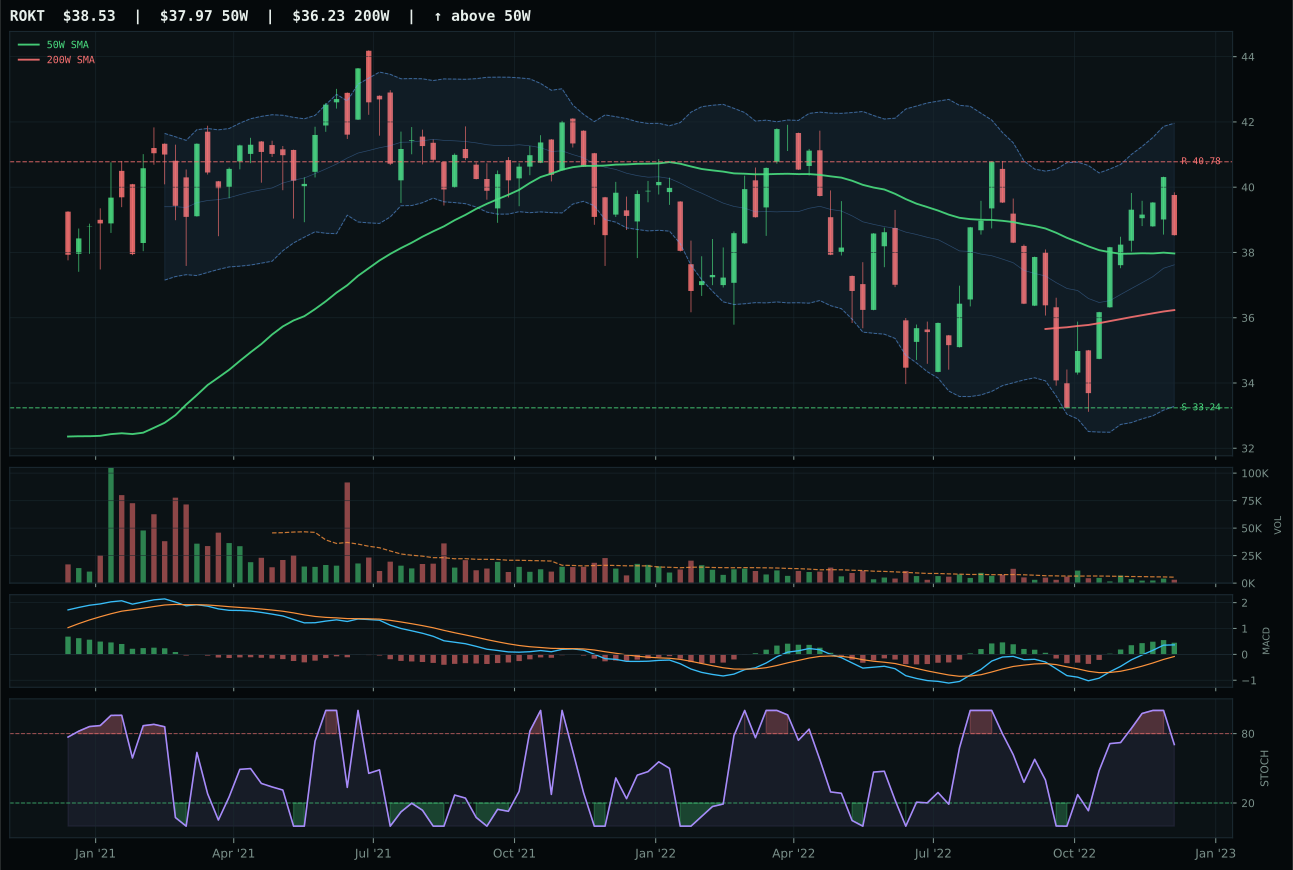
ROKT has a compression near 50W profile with 5.0% 13-week relative strength versus SPY.
A failed hold above support would weaken the setup.
Tracked, but not top-2 eligible because: .
ITA wins decisively with a trend score of 100/100 because price is above both the 50-week and 200-week with a near-flat 50W slope of 0.2%, and its 10.2% relative strength versus SPY combined with 6.9% 13-week return is genuine momentum, not a bounce. Above-average volume participation at 1.11x the 20-week average confirms institutions are accumulating, and the momentum confirmation score of 99.6 reflects a 13-week return of 6.9% reinforced by MACD bullish and improving and category-relative strength of 5.1%. The score gap versus XAR is 19.6 points—XAR is in a compression near its 50-week with only thin participation and -1.0% category-relative strength, so there is no contest. ITA's risk/reward of 47.9 reflects that only 3.4% upside remains to 114.11 resistance, but that is appropriate for a leader; the chart is not screaming to buy, it is confirming that buyers already have.
Defense & Aerospace ranks 51.5 and earns 10% allocation because the macro fit is strong at 71.0/100—late-cycle reflation, defensive rotation, and broad market bear all support this category—yet ITA's extended structure and thin upside room keep it from top-2 selection. The sector is working as a defensive haven, but ITA is already bought; fresh money should wait for pullbacks or seek categories with more expansion ahead. At 10%, the allocation respects the genuine technical leadership and macro tailwind while avoiding the risk of chasing an already-elevated setup. XAR and ROKT are both compressing near their 50-weeks with weaker breadth, meaning if ITA consolidates or pulls back, the backup candidates are ready—but that's a reason to hold 10% tactically, not to add at these levels. The category deserves inclusion in a bear-market hedge portfolio; the specific entry in ITA does not.
Technology — XLK
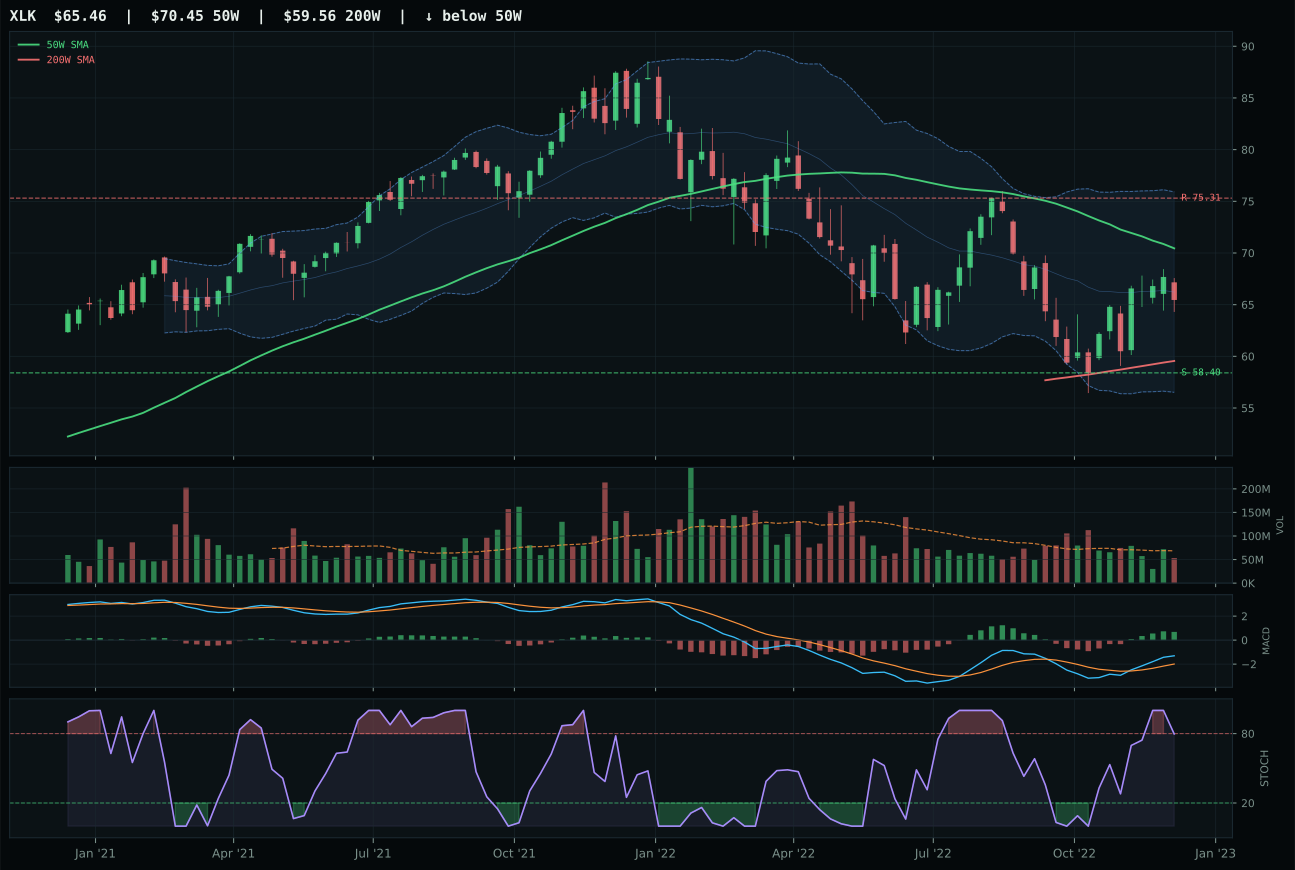
XLK has a neutral structure profile with -1.3% 13-week relative strength versus SPY.
A failed hold above support would weaken the setup.
Actionable but governed by invalidation levels.
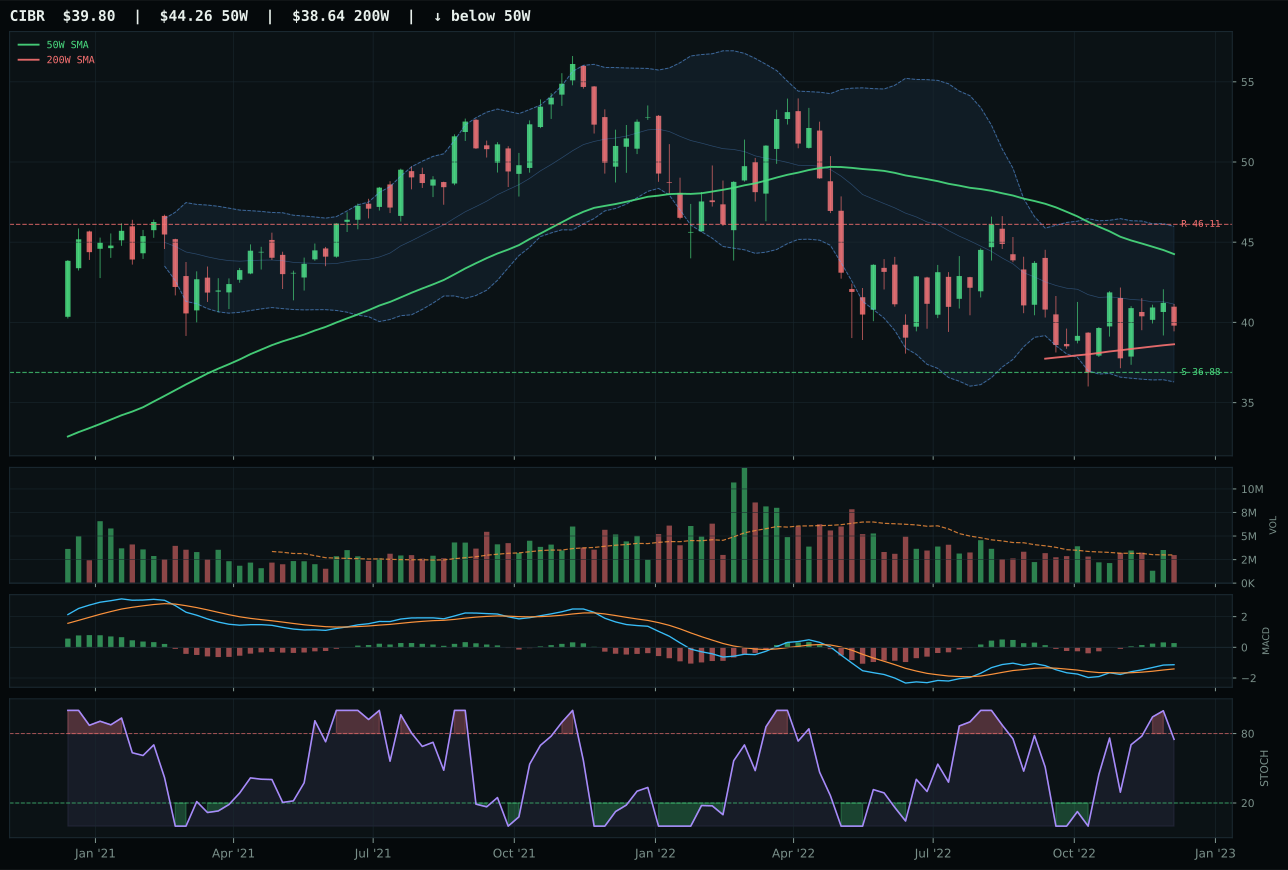
CIBR has a neutral structure profile with -5.7% 13-week relative strength versus SPY.
A failed hold above support would weaken the setup.
Actionable but governed by invalidation levels.
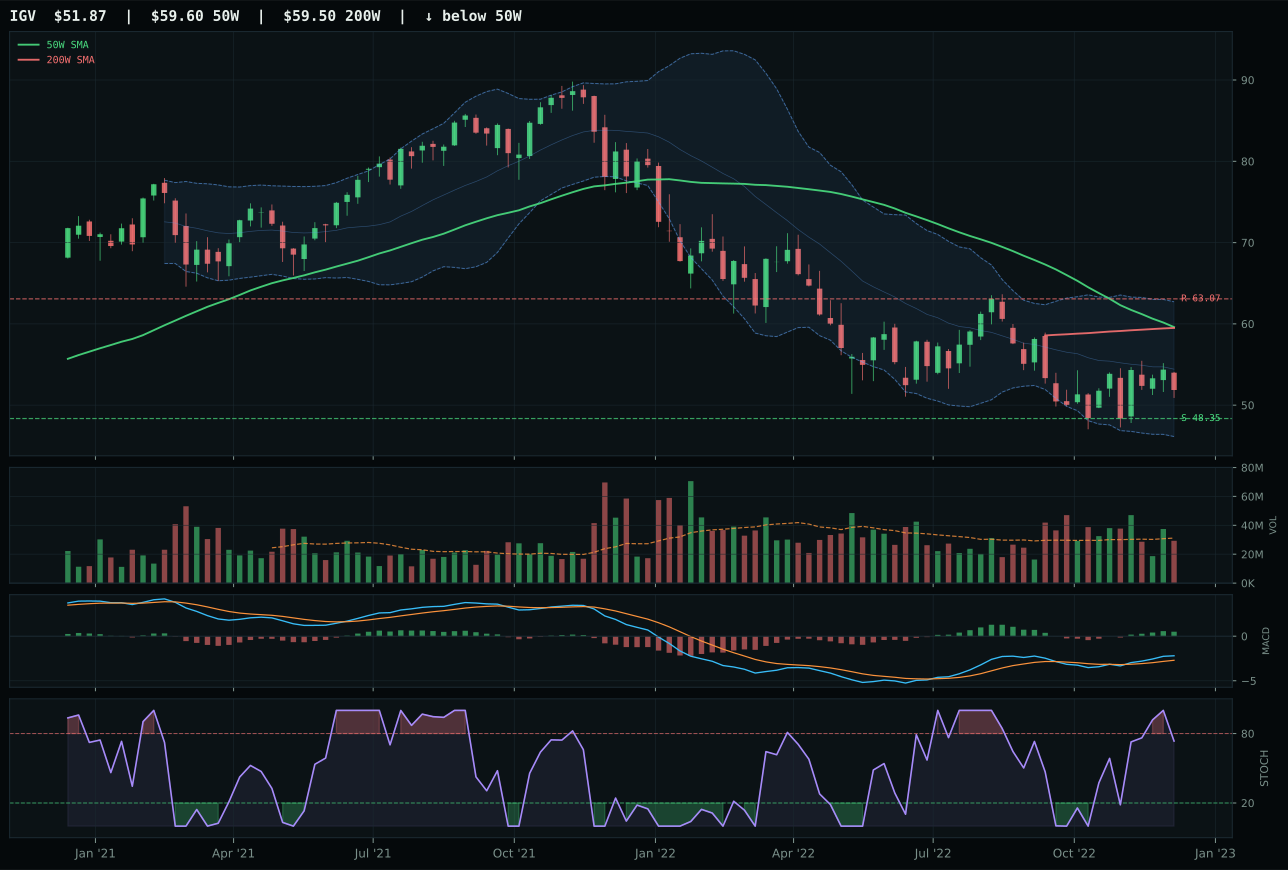
IGV has a neutral structure profile with -7.5% 13-week relative strength versus SPY.
A failed hold above support would weaken the setup.
Actionable but governed by invalidation levels.
XLK wins the category because it sits in a neutral pullback structure with price 7.1% below the 50-week moving average but still above the 200-week, creating a value-zone setup rather than a chase. The 4.4% relative strength advantage versus the category median and rising stochastic RSI mid-zone signal accumulation beginning to work, while MACD is bullish and improving—a clean confirmation without overbought extremes. Volume at 0.77x the 20-week average is neutral, not rejecting the setup, and the technical composite score of 67 beats CIBR's 59 largely because timing scored 90 versus CIBR's 55; CIBR's stochastic is falling/neutral rather than rising, a meaningful momentum divergence. The 13-week return of -4.6% versus SPY's relative underperformance of -1.3% shows XLK is lagging but not broken—exactly the kind of reset that attracts patient capital when technicals align.
Technology earns 10% allocation as a lower-ranked category in a late-cycle reflation regime where risk appetite remains positive but liquidity stress and credit concerns are active headwinds. The category macro fit scores only 44.0/100 because broad technology faces headwinds from tightening conditions, yet XLK's 4.4% category-relative strength and clean setup provide a tactical foothold if the market's appetite for profitable large-cap tech holds. This is not a top-2 conviction play—the final category score of 47.7 sits below COPX and XLU—but the 10% weight acknowledges that AI growth sponsorship is still active and XLK's neutral structure avoids the extended momentum traps visible in the broader market. To graduate to 20%, technology would need to clear the 50-week with volume confirmation and SPY-relative strength to reaccelerate; right now it is being held at portfolio weight on technical merit alone, not macro tailwind.
Traditional Energy — XLE
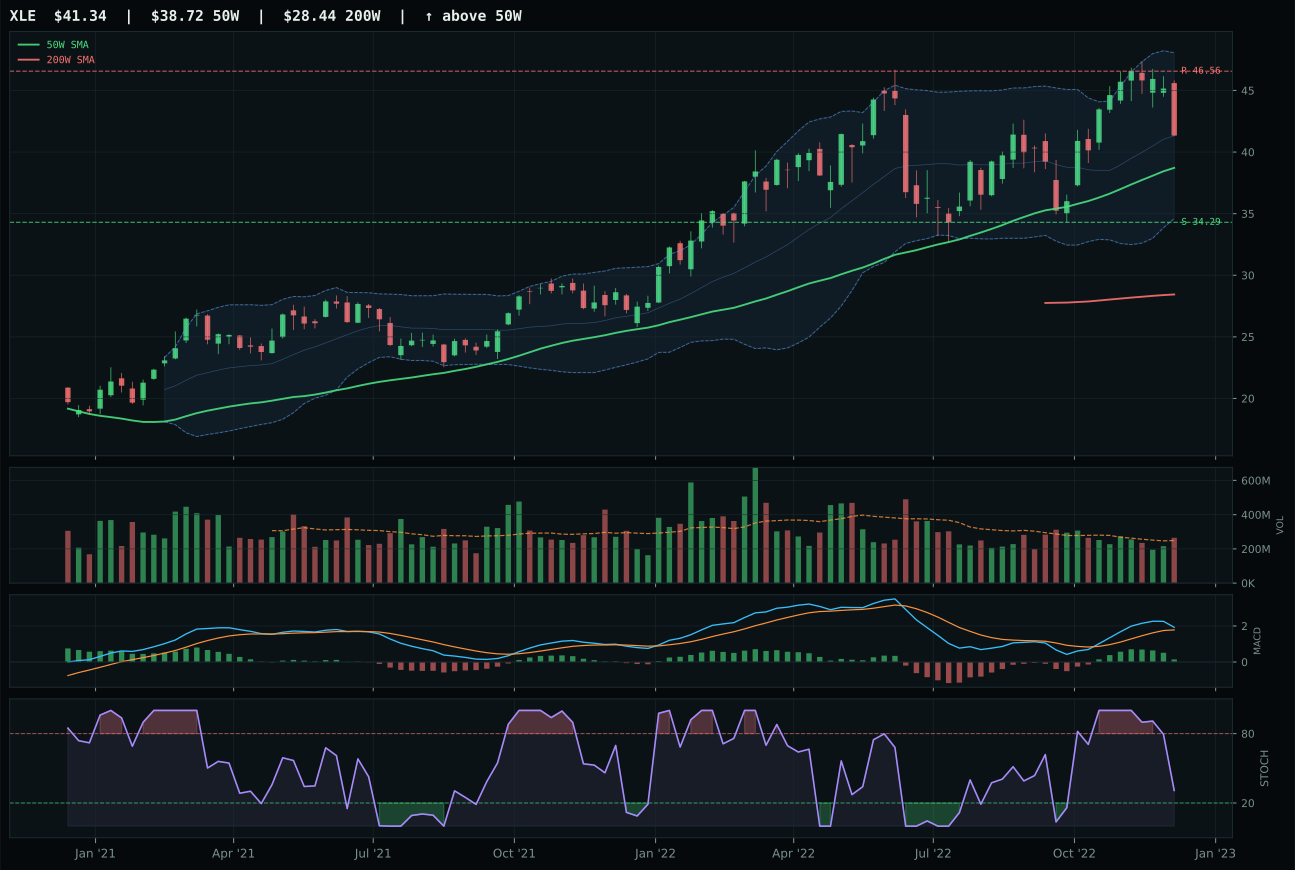
XLE has a neutral structure profile with 5.9% 13-week relative strength versus SPY.
A failed hold above support would weaken the setup.
Actionable but governed by invalidation levels.
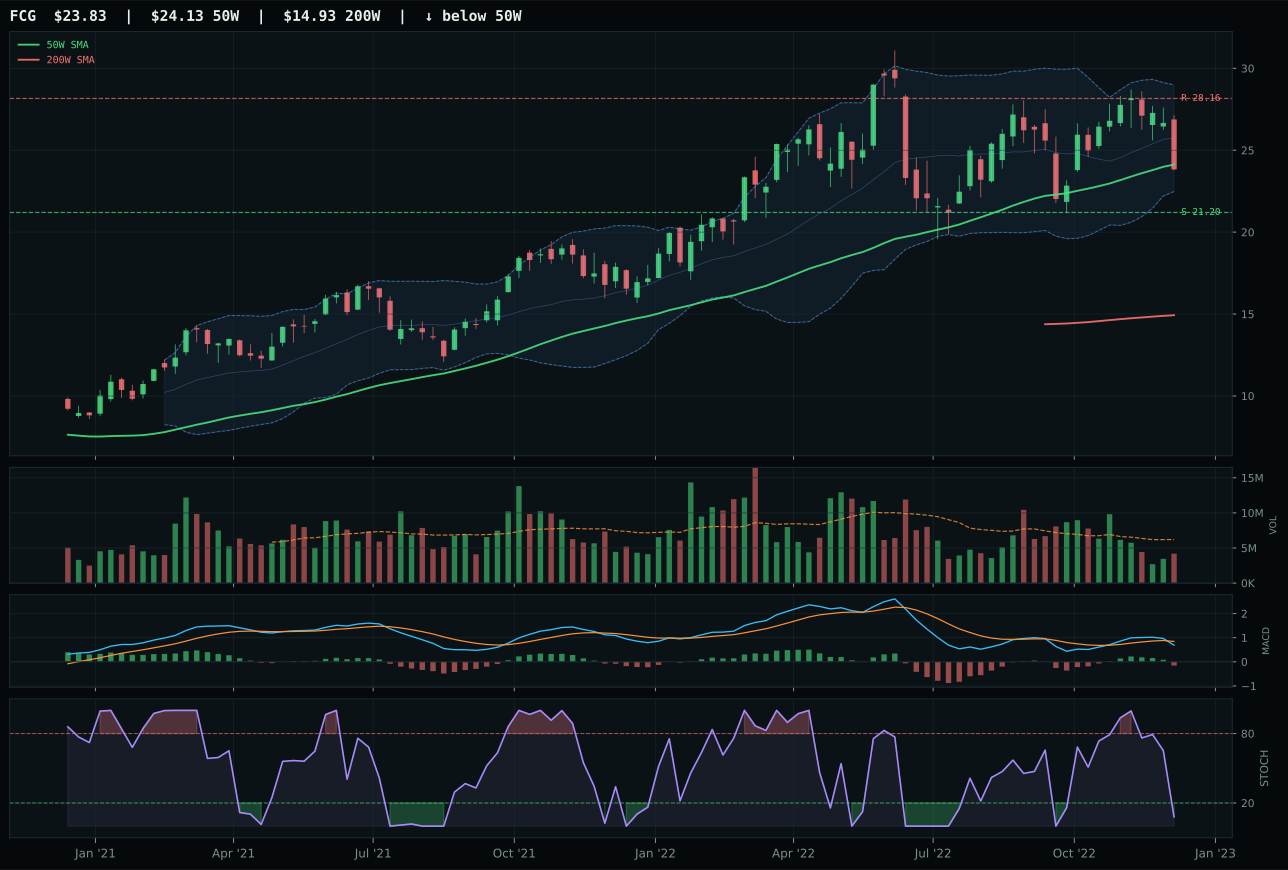
FCG has a compression near 50W profile with -6.0% 13-week relative strength versus SPY.
A failed hold above support would weaken the setup.
Actionable but governed by invalidation levels.
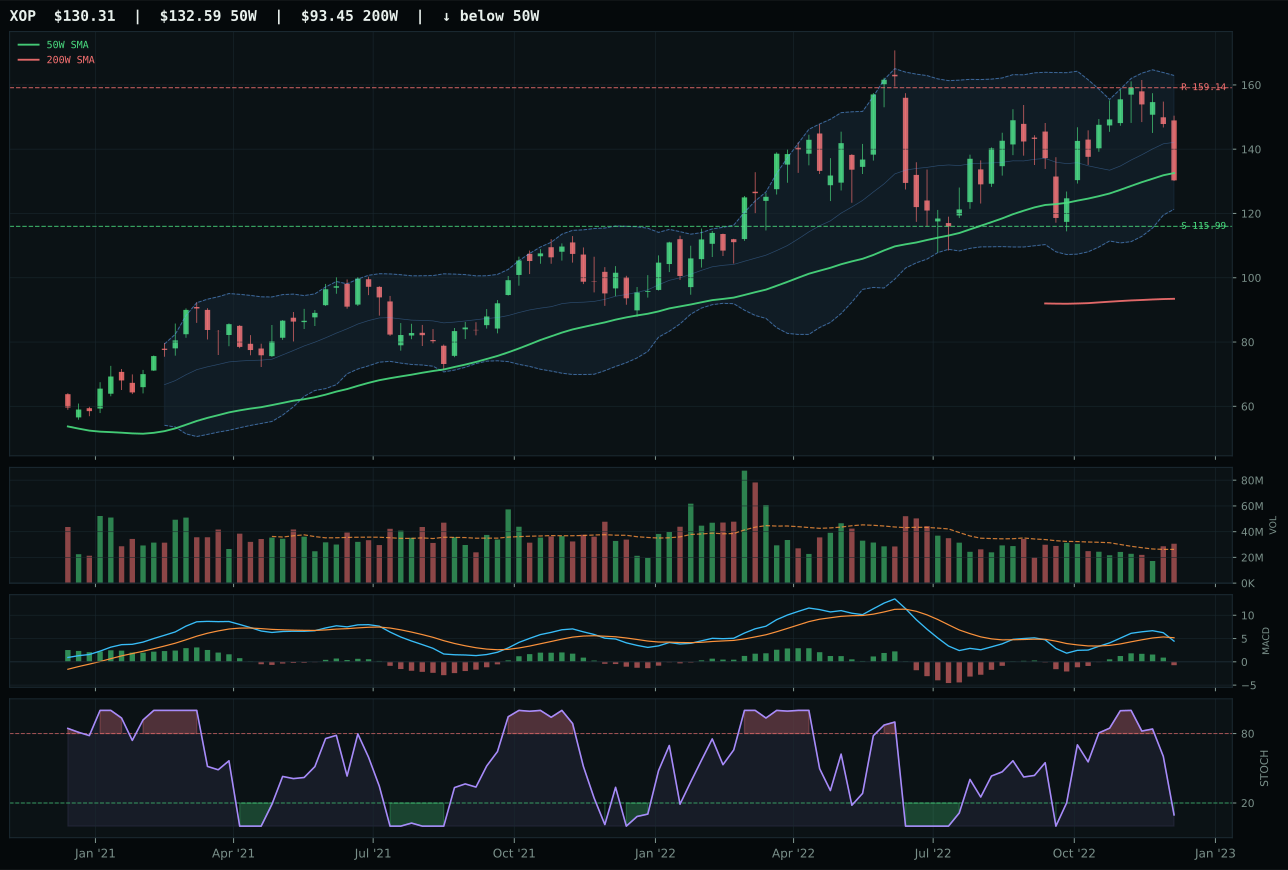
XOP has a compression near 50W profile with -5.7% 13-week relative strength versus SPY.
A failed hold above support would weaken the setup.
Actionable but governed by invalidation levels.
XLE wins energy and earns 10% allocation because price is above both moving averages, the 50W slope is positive at 0.7%, and 11.6% category-relative strength decisively outpaces FCG and XOP. The 13-week return of 2.6% may look modest, but it is positive when SPY has underperformed, and the RS vs SPY of 5.9% confirms XLE is in the buyers' camp. MACD is bullish but flattening (not bullish and improving like the winners in other categories), and stochastic RSI is falling/neutral at 0.31, which is a measured read—not overbought, not exhausted. Volume at 1.06x is neutral, and the setup is clean neutral structure with a defined support at 34.29. FCG lost decisively because MACD is bearish/weakening, stochastic RSI is oversold, and it posted -9.3% 13-week return; that is a category breakdown signal, not a timing bounce. XLE's trend score of 100 versus FCG's 58 tells the story—energy leadership is consolidated in integrated oil, not in nat gas.
Traditional Energy earns 10% allocation despite an excellent category macro fit of 90.0/100 (energy scarcity, inflation pressure, supply shortage all active at +16, +10, +9 respectively) because XLE's technical evidence is only 74.1 and the momentum confirmation of 66.5 lags other categories. The 4W return is negative at -11.2%, signaling recent selling pressure, and the risk/reward of 54.8 shows 11.2% upside versus 20.5% downside—a poor asymmetry. What keeps energy at 10% is the macro conviction: late-cycle reflation and energy scarcity are real structural tailwinds, and XLE's positive trend plus category-relative strength edge mean that if the market rotates toward real assets, energy will perform. However, the category's final score of 41.6 ranks it below all top-2 contenders and below Agriculture, Metals, and even AI on technical merit. The 10% is a macro hedge that acknowledges oil's essential role in inflation scenarios, not a tactical technical entry. Adding to XLE here would require either a break above 46.56 resistance on volume or deteriorating financial conditions that boost the safe-haven bid.
Nuclear Energy — URA
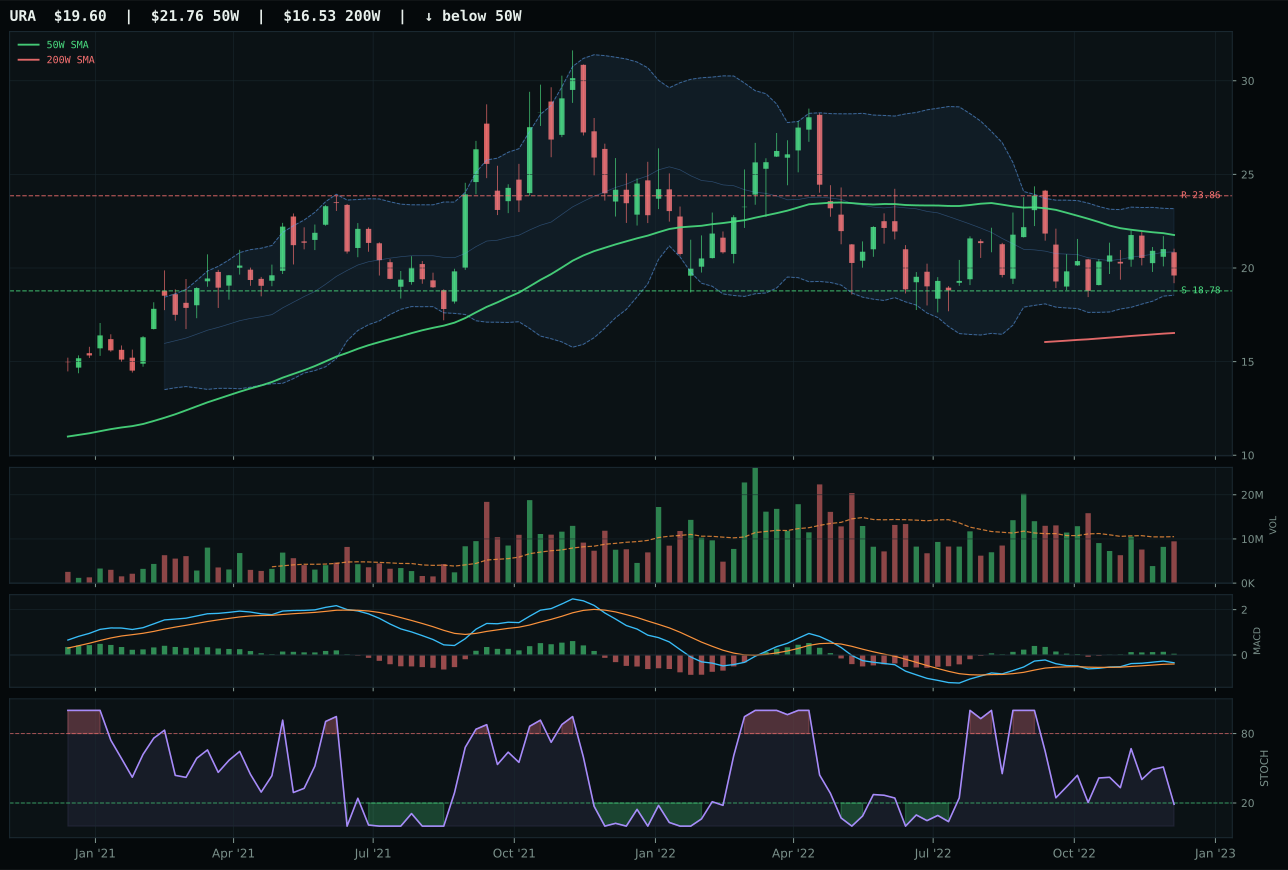
URA has a pullback into support profile with -14.6% 13-week relative strength versus SPY.
A failed hold above support would weaken the setup.
Actionable but governed by invalidation levels.
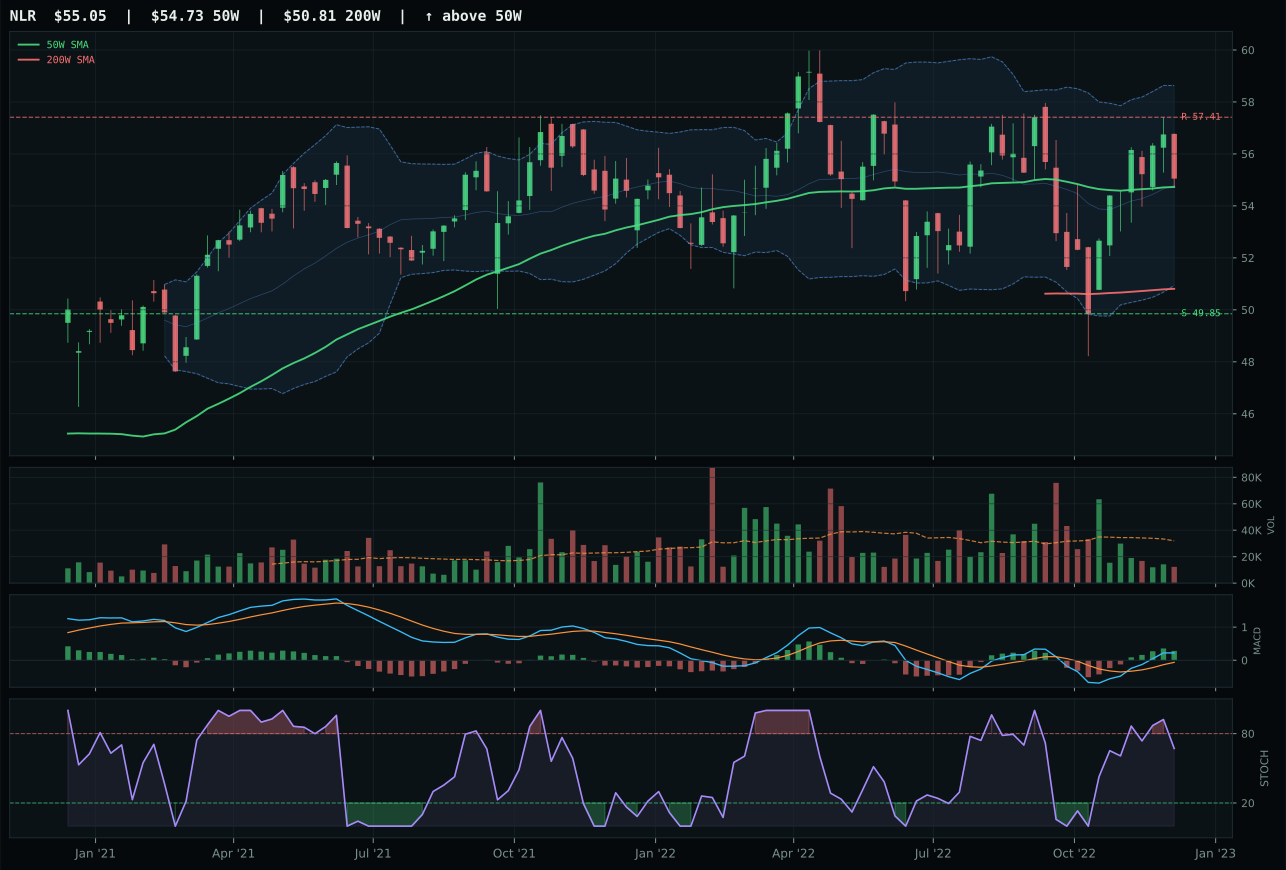
NLR has a compression near 50W profile with -0.8% 13-week relative strength versus SPY.
A failed hold above support would weaken the setup.
Tracked, but not top-2 eligible because: .
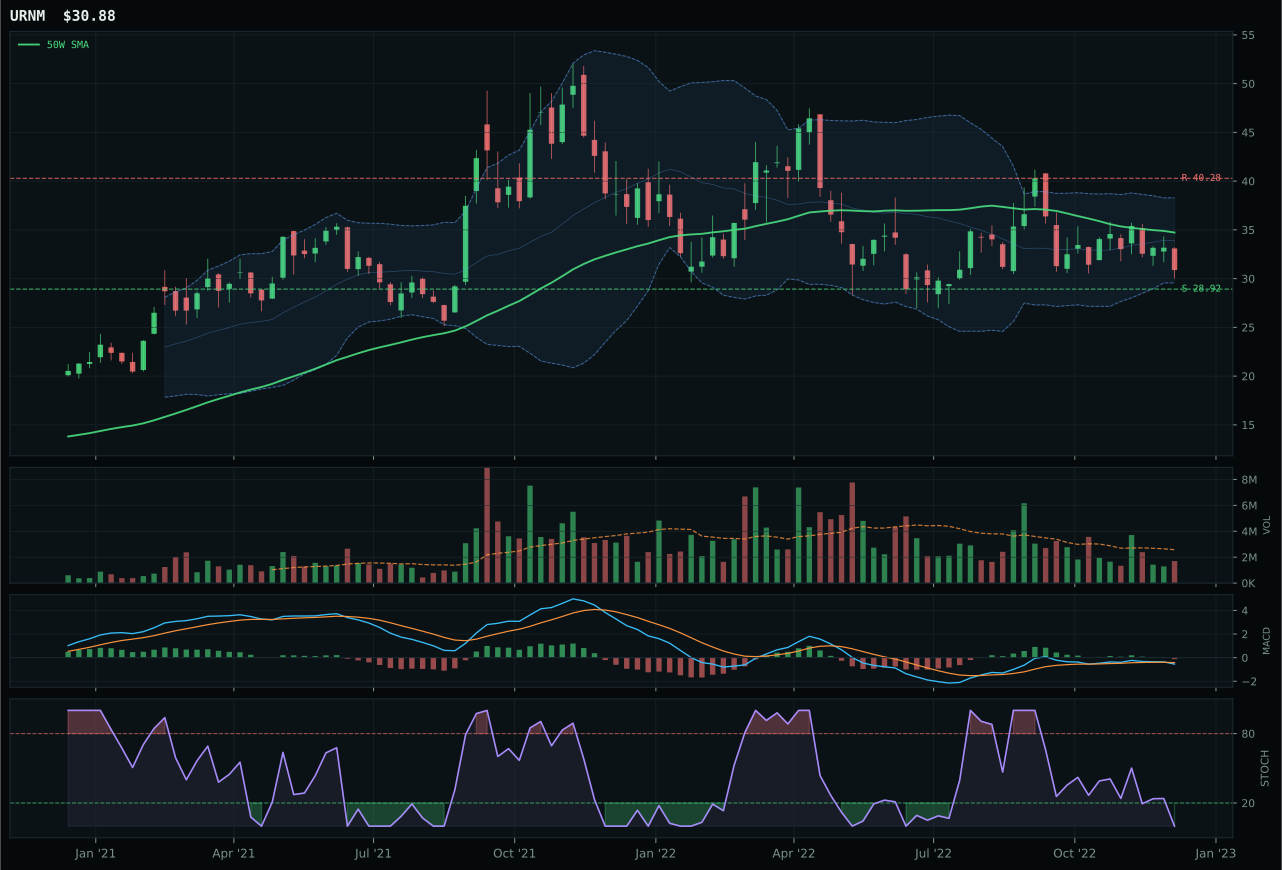
URNM has a neutral structure profile with -20.1% 13-week relative strength versus SPY.
A failed hold above support would weaken the setup.
Actionable but governed by invalidation levels.
URA wins Nuclear Energy because its risk/reward of 75.0 is the cleanest in the category—the setup is a pullback into support at 18.78 with only 4.4% downside risk versus 17.9% upside to the 23.86 resistance, creating a favorable entry asymmetry. Price is 9.9% below the 50-week, in the repair zone near Fib 0.786 at 19.97, and the timing score of 80 reflects MACD bullish but flattening and stochastic RSI oversold at 0.19—a textbook reversal setup awaiting volume confirmation. NLR scores higher on trend (99 vs 46) and timing (100 vs 80) but trades at compression near the 50-week (0.6% distance), which is extended relative to URA's deep pullback; NLR's risk/reward of 60.1 gives away 15 points to URA. The momentum confirmation of 0.0 on URA reflects the recent -17.9% 13-week decline, but that is precisely the definition of a broken-down reset—the absolute worst performance becomes the best-risk-adjusted entry when support holds. NLR's better technicals are undermined by worse entry geometry.
Nuclear Energy scores only 39.6 and earns 10% allocation because the macro fit of 69.0/100 is decent (energy scarcity and real asset sponsorship are active) but momentum confirmation is nearly dead across all three names, with URA's 0.0/100 reflecting a genuine -17.9% waterfall. This is not a category winning on strength; it is a sector getting a 10% slot on macro conviction and URA's favorable risk/reward setup for a mean-reversion trade. The technical evidence of 41.2 on URA is below 50, indicating this is not a clean technical entry, but the setup quality (pullback into support) and risk geometry (4.4% to lose, 17.9% to gain) justify a tactical position in a portfolio hedging against energy shocks. URA would graduate to larger allocation only if it holds the 18.78 support and posts a 4W return turning positive; without that confirmation, the 10% is a speculative real-assets hedge, not a conviction play. The broader nuclear energy complex is broken and awaiting repair; URA offers the best reward-to-risk, but the category itself is a no-conviction hold.
AI — SMH
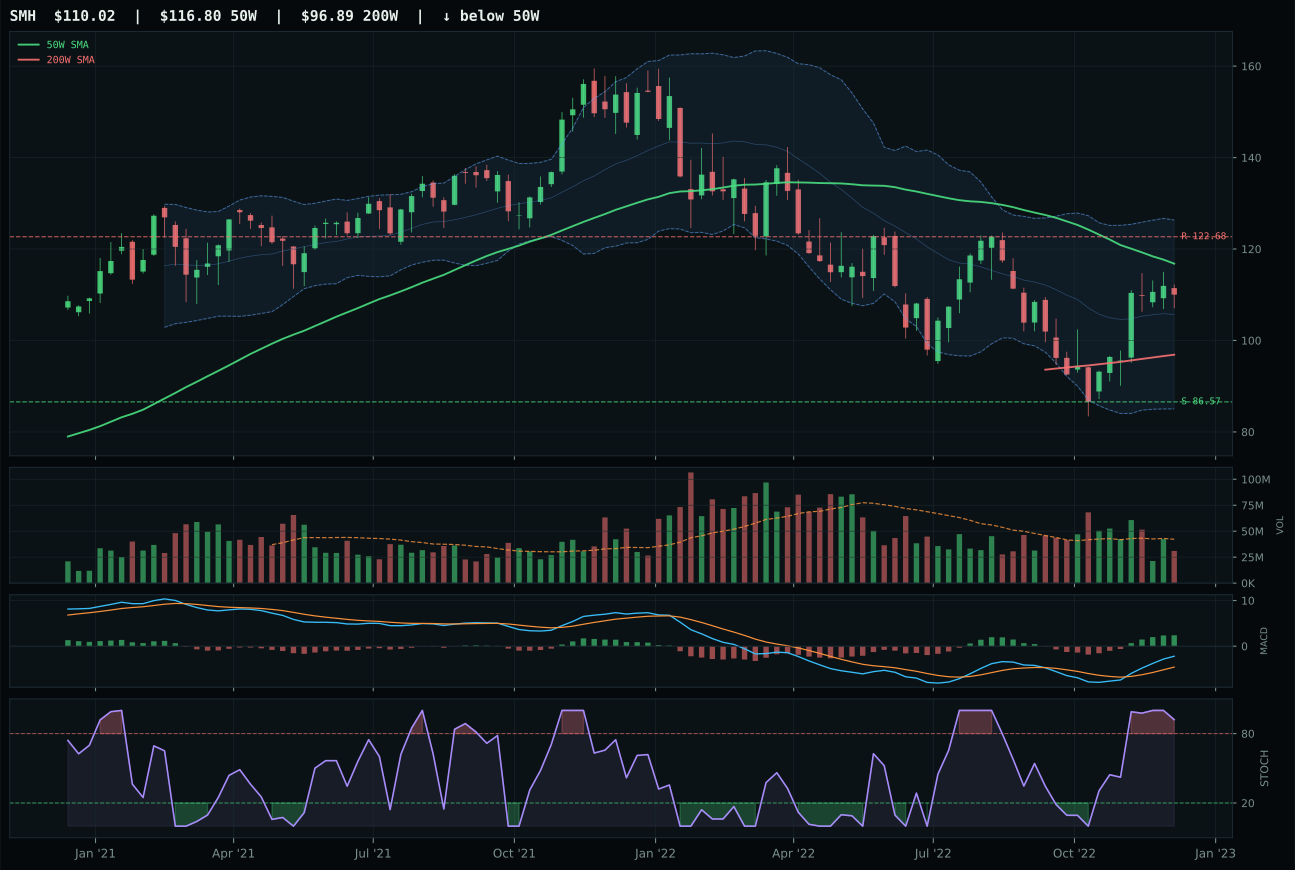
SMH has a neutral structure profile with 4.7% 13-week relative strength versus SPY.
A failed hold above support would weaken the setup.
Actionable but governed by invalidation levels.
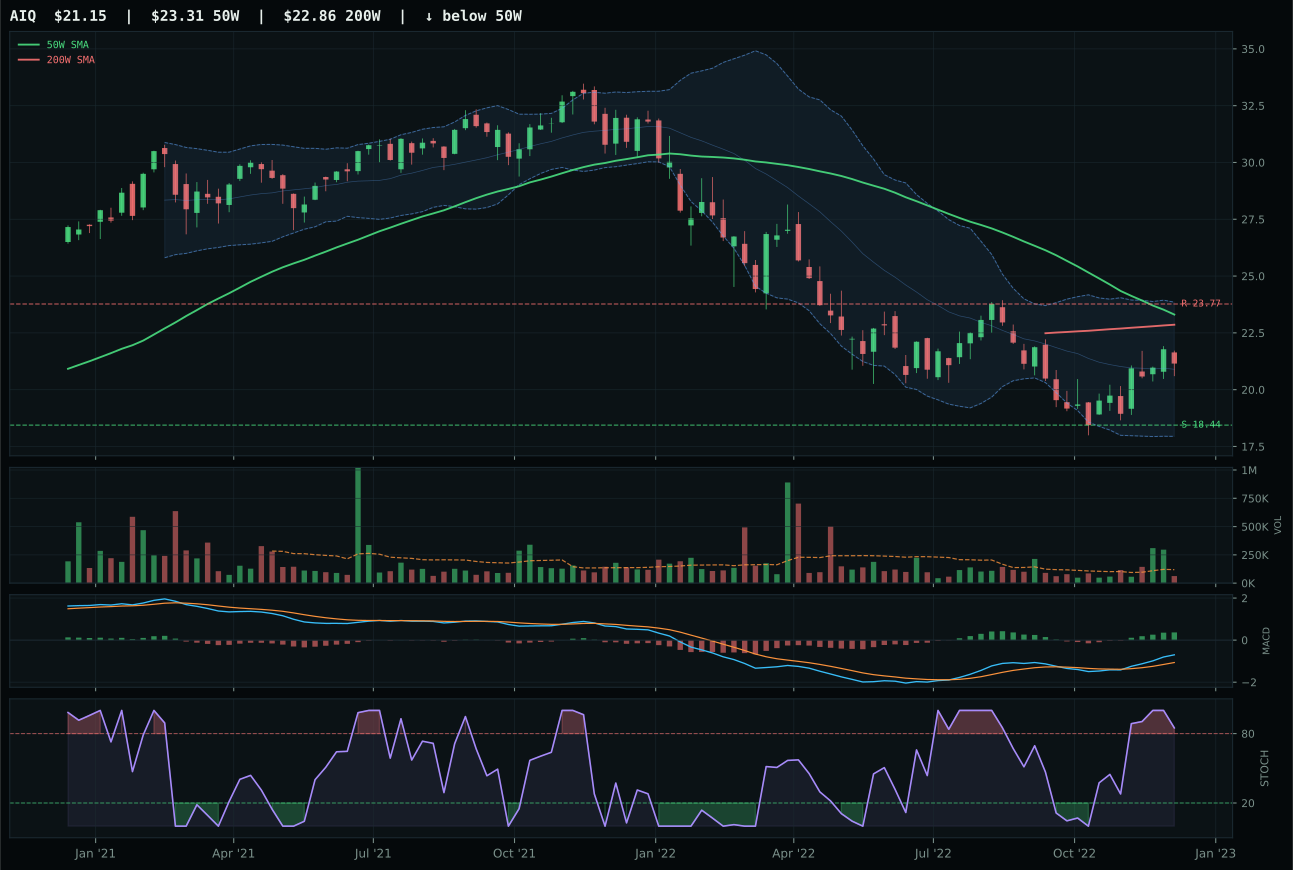
AIQ has a neutral structure profile with -0.0% 13-week relative strength versus SPY.
A failed hold above support would weaken the setup.
Tracked, but not top-2 eligible because: .
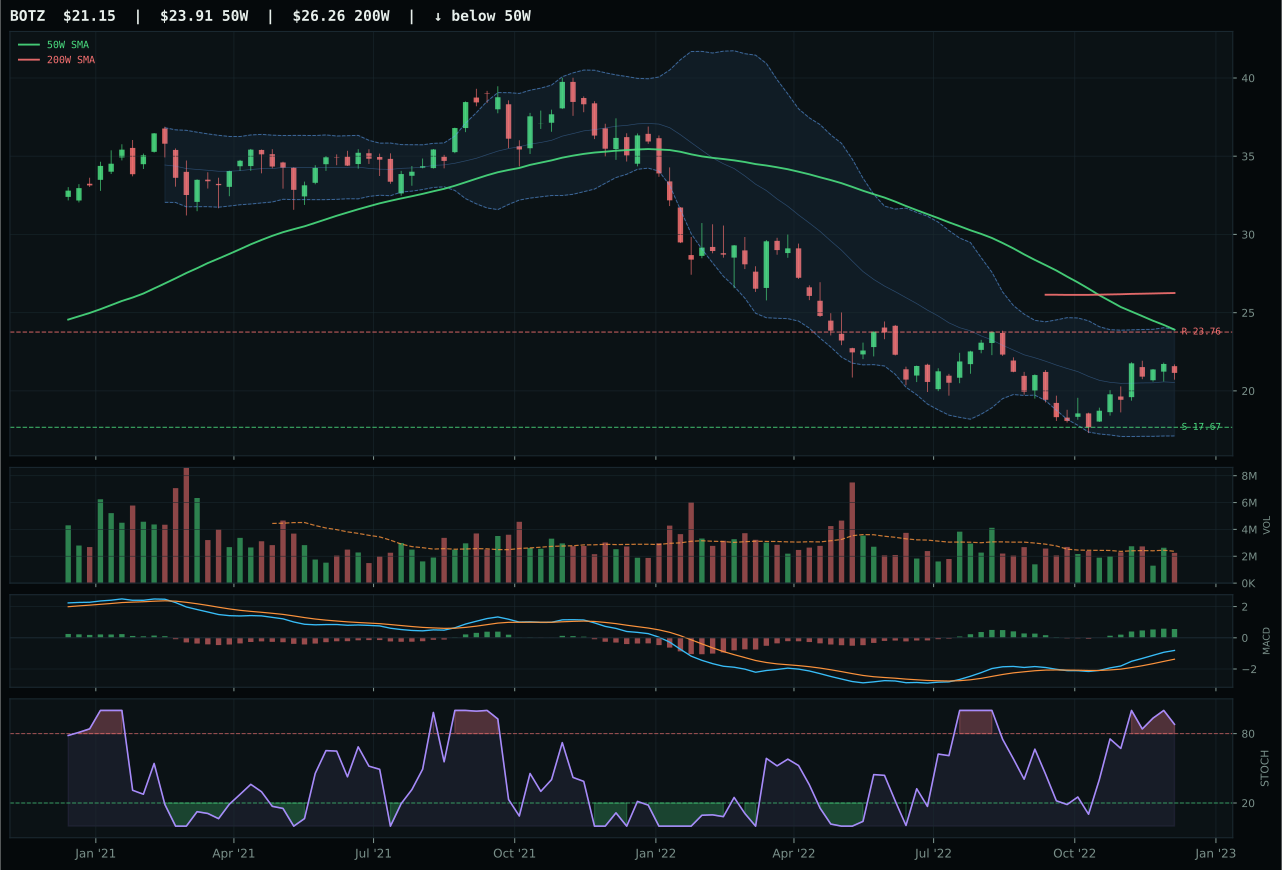
BOTZ has a neutral structure profile with 3.9% 13-week relative strength versus SPY.
Extension and support failure are the main tactical risks.
Tracked, but not top-2 eligible because: structurally broken.
SMH wins because it combines the only positive 13-week return in the basket (1.5%) with 4.7% relative strength versus SPY and a neutral-to-bullish setup that avoids the extremes plaguing AI sentiment. Price sits 5.8% below the 50-week in the value zone near Fib 0.618 at 112.46, MACD is bullish and improving, and stochastic RSI is overbought rolling over—a measured momentum signal that hasn't collapsed into bear territory. The technical composite of 65 decisively beats AIQ's 26 because SMH's trend score is 72 versus AIQ's 55, and its volume-price confirmation of 48 versus AIQ's likely lower threshold shows semiconductors are being accumulated even at thin 0.73x volume. The category-relative strength gap is stark: SMH leads at 0.8% versus AIQ's -4.0%, meaning buyers are choosing compute infrastructure over software breadth in this regime.
AI scores 37.4 and ranks 9th or 10th in the current allocation framework, earning zero capital this week despite its +14 active macro tailwind. The fundamental issue is that late-cycle reflation privileges real assets and cash-generative defensive names over growth narratives, and credit stress (-8) plus liquidity stress (-12) are actively penalizing risk-on exposures. SMH's overbought-rolling-over timing combined with thin volume participation means the setup offers poor near-term asymmetry—every new buyer is entering at a relative high, and the retracement has not yet established a clean institutional demand zone. The category would need either a material macro regime shift away from liquidity stress, a clear technical capitulation into support with volume confirmation, or a sustained breakout above current resistance at 122.68 to warrant allocation. Until one of those catalysts arrives, AI remains a fascinating long-term thesis but a poor current timing fit.
Emerging Markets — INDA
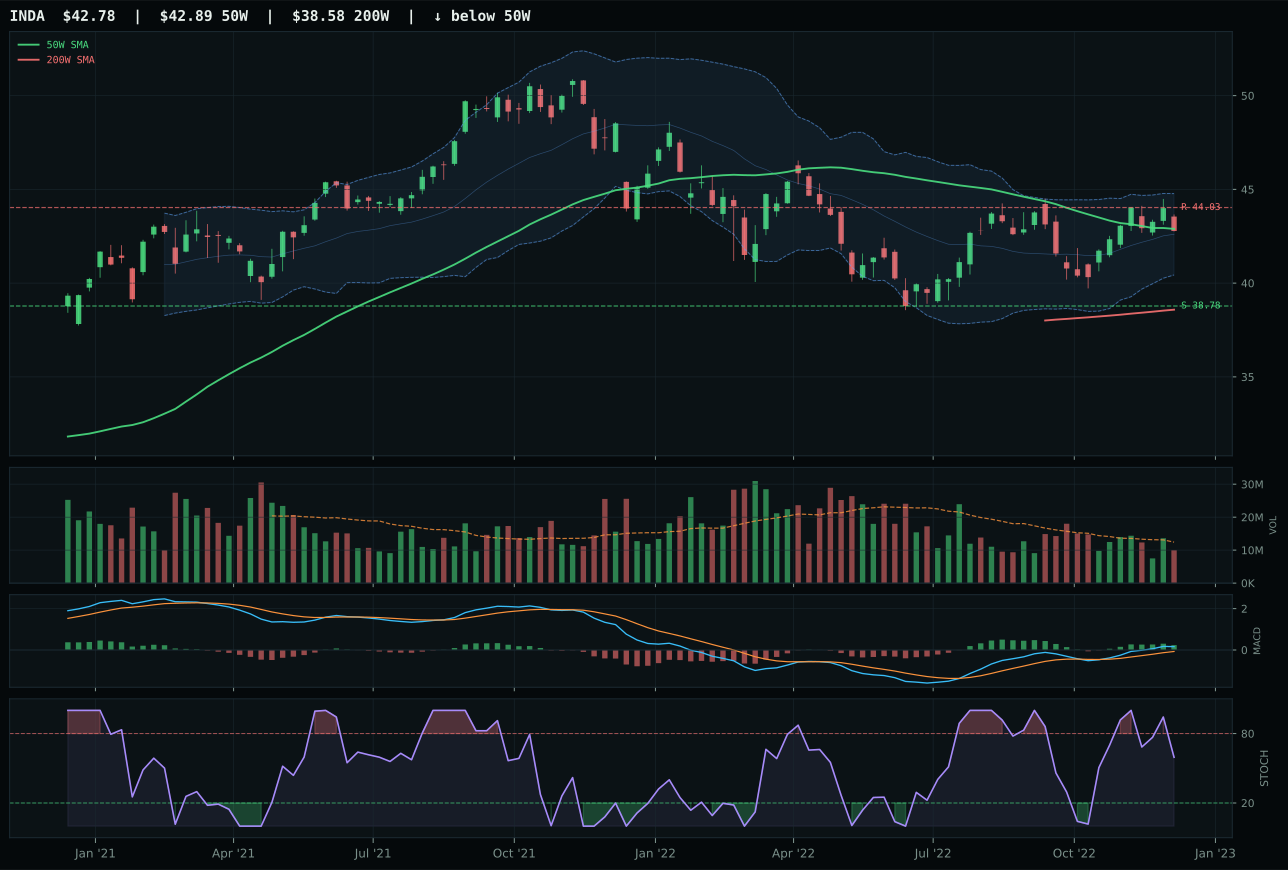
INDA has a compression near 50W profile with 1.0% 13-week relative strength versus SPY.
A failed hold above support would weaken the setup.
Actionable but governed by invalidation levels.
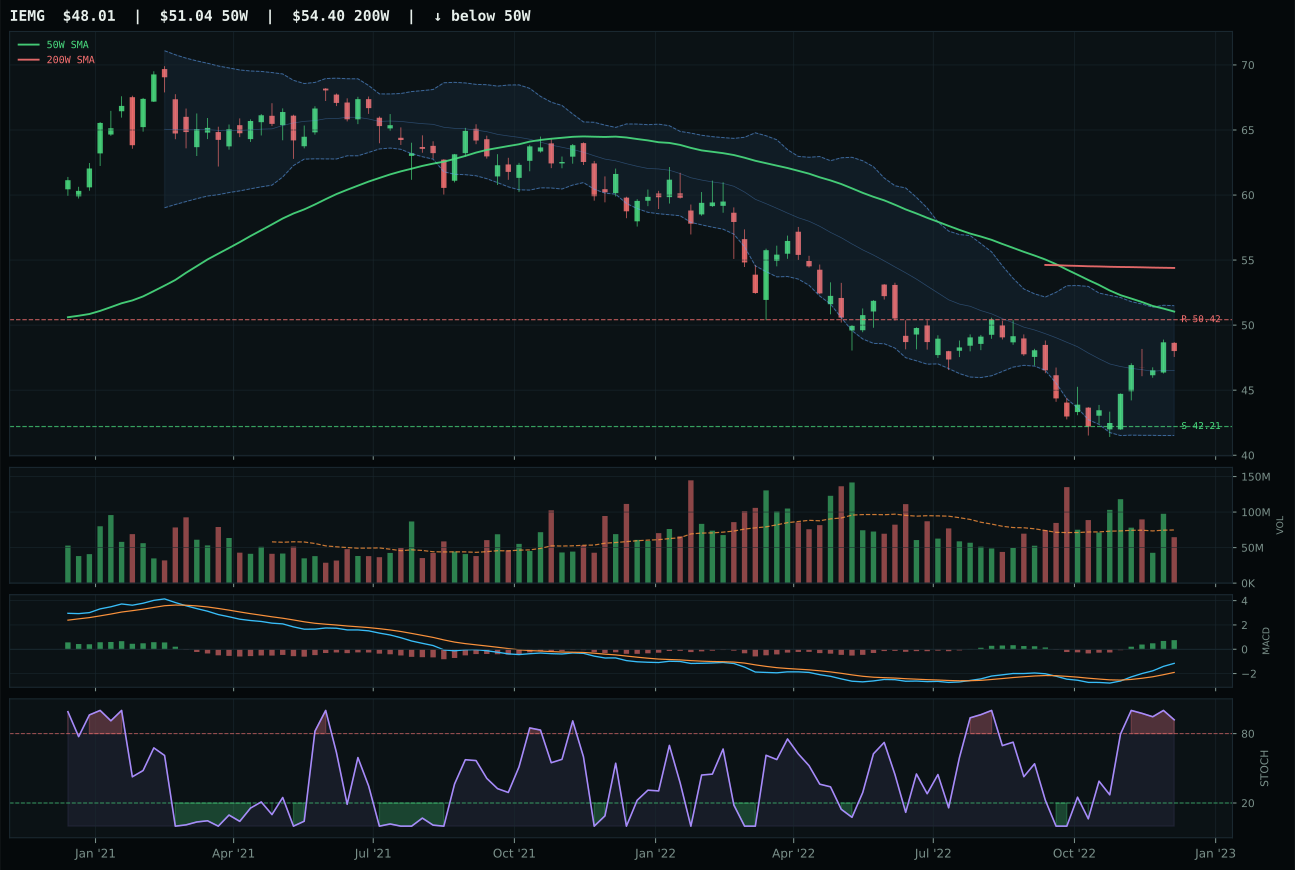
IEMG has a neutral structure profile with 3.2% 13-week relative strength versus SPY.
Extension and support failure are the main tactical risks.
Tracked, but not top-2 eligible because: structurally broken.
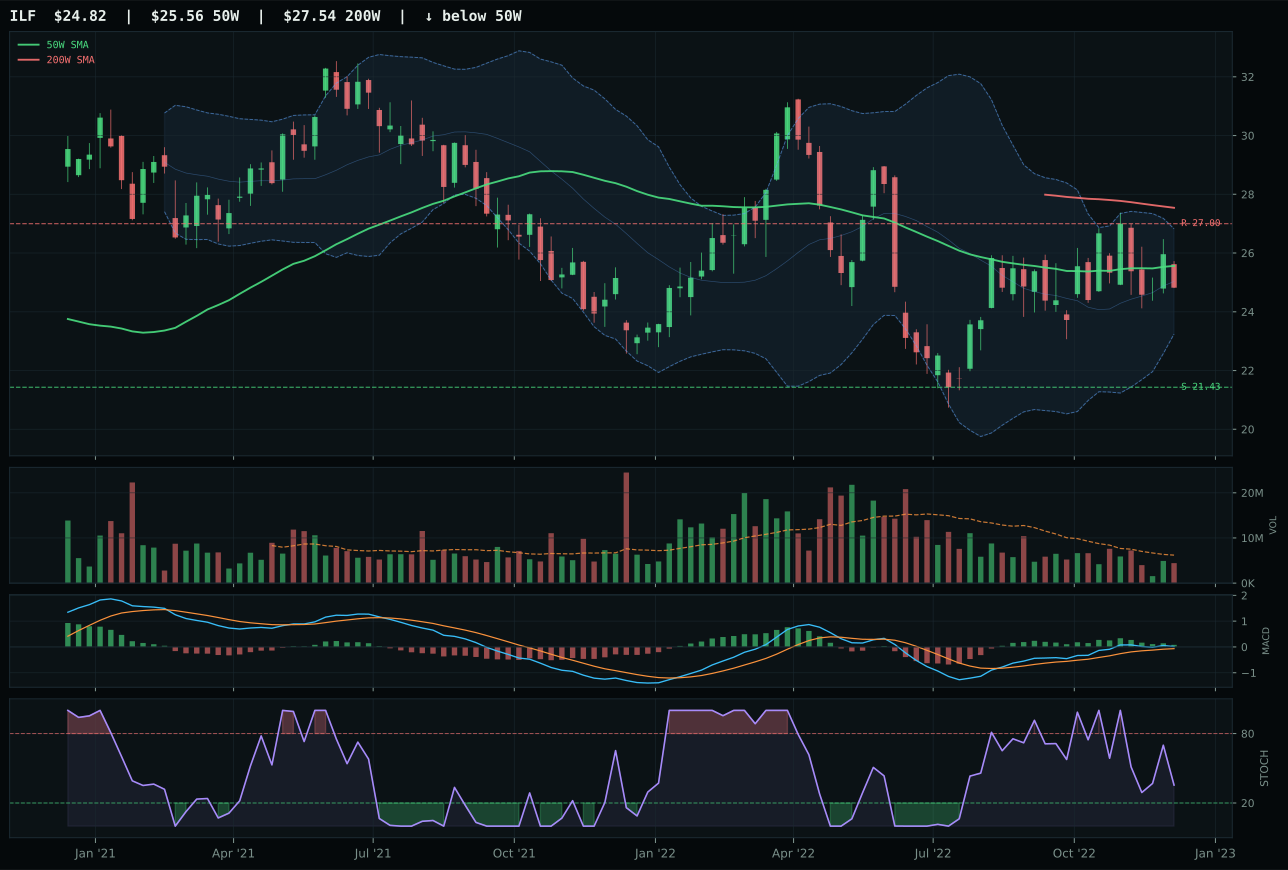
ILF has a compression near 50W profile with 1.1% 13-week relative strength versus SPY.
Extension and support failure are the main tactical risks.
Tracked, but not top-2 eligible because: structurally broken.
INDA wins Emerging Markets because its timing score of 100 is a standout in a weak category—price is virtually on the 50-week at -0.3% distance, MACD is bullish but flattening, stochastic RSI is falling/neutral at 0.60, and the Fib zone placement at 0.618 near 42.40 is a textbook decision point. The compression near the 50-week (84.5 compression score) is tight and orderly, suggesting buyers and sellers are balanced at a critical inflection. IEMG loses because timing is only 57 (it is already extended 2.8% above the 50-week with overbought stochastic rolling over), structure is broken at 38.9 (neutral structure is inherently weaker than compression), and the hard filter flags 'structurally broken'—meaning the chart has already completed its setup and moved away. RS vs SPY for INDA is only 1.0%, meaning it is not leading, but that is expected in emerging markets during a broad market bear; the value is in the timing and structure, not in relative outperformance.
Emerging Markets scores only 8.1 and receives zero allocation this week, ranking 9th or 10th among all ten categories. Macro fit scores just 29.0 out of 100 because credit stress (-10) and liquidity stress (-10) are actively penalizing risk-on EM exposures, while broad market bear sentiment (-9) creates additional headwind. Risk appetite positive (+8) provides minimal offset against the macro headwinds. INDA's compression setup at the 50W with falling volume participation (0.81x average) and 51.5% momentum confirmation score reveal no institutional conviction behind the setup—the chart is coiled but dormant. To earn even 10% allocation, Emerging Markets would require a decisive macro shift that neutralizes credit stress, a genuine capitulation flush that clears the technicals and establishes clean support with volume, or a sustained multi-day breakout above the 44.03 resistance level demonstrating fresh risk-on sponsorship. Current regime simply does not favor illiquid EM beta over domestic real assets and cash-generative defense.