
2022-12-02
Informational purposes only. The content in this report, including allocations, analysis, and commentary, is provided solely for informational and educational purposes. It does not constitute financial advice, investment advice, trading advice, or any other type of advice. Past performance does not guarantee future results. Always conduct your own research and consult a qualified financial professional before making investment decisions.
Weekly Allocation
| Ticker | Category | Weight | Role |
|---|---|---|---|
| COPX | Industrial Metals | 20% | Top-2 (20%) |
| XLE | Traditional Energy | 20% | Top-2 (20%) |
| XAR | Defense & Aerospace | 10% | Tier-2 (10%) |
| VEGI | Agriculture & Livestock | 10% | Tier-2 (10%) |
| XLU | Utilities & Infrastructure | 10% | Tier-2 (10%) |
| XLK | Technology | 10% | Tier-2 (10%) |
| SMH | AI | 10% | Tier-2 (10%) |
| URA | Nuclear Energy | 10% | Tier-2 (10%) |
Trade Instructions — Monday Open
Sell the tranche from 2022-11-04 (completing its 4-week hold). Buy the new tranche. Instructions show net portfolio changes — same-asset positions cancel, weight changes show the delta.
| Action | Ticker | Instruction |
|---|---|---|
| SELL | XLE | Sell 33% of XLE position (reduce 30.00% → 20.00%) |
| SELL | REMX | Sell entire REMX position (2.50% of portfolio) |
| SELL | MOO | Sell 33% of MOO position (reduce 3.75% → 2.50%) |
| SELL | ITA | Sell 33% of ITA position (reduce 3.75% → 2.50%) |
| SELL | PAVE | Sell 33% of PAVE position (reduce 3.75% → 2.50%) |
| SELL | GLD | Sell 14% of GLD position (reduce 8.75% → 7.50%) |
| SELL | ILF | Sell entire ILF position (1.25% of portfolio) |
| BUY | URA | Buy URA — 6.67% of freed cash (adds 1.25% to portfolio) |
| BUY | COPX | Buy COPX — 26.67% of freed cash (adds 5.00% to portfolio) |
| BUY | XAR | Buy XAR — 13.33% of freed cash (adds 2.50% to portfolio) |
| BUY | VEGI | Buy VEGI — 13.33% of freed cash (adds 2.50% to portfolio) |
| BUY | XLK | Buy XLK — 13.33% of freed cash (adds 2.50% to portfolio) |
| BUY | XLU | Buy XLU — 13.33% of freed cash (adds 2.50% to portfolio) |
| BUY | SMH | Buy SMH — 13.33% of freed cash (adds 2.50% to portfolio) |
Current Portfolio After Trade
Combined holdings across all 4 active tranches. Each tranche is 25% of the portfolio.
| Ticker | % of Portfolio | Weight Bar |
|---|---|---|
| XLE | 20.00% | |
| COPX | 17.50% | |
| URA | 10.00% | |
| XLK | 10.00% | |
| XAR | 7.50% | |
| VEGI | 7.50% | |
| GLD | 7.50% | |
| XLU | 5.00% | |
| IGF | 5.00% | |
| MOO | 2.50% | |
| ITA | 2.50% | |
| PAVE | 2.50% | |
| SMH | 2.50% |
Macro Regime — Late-Cycle Reflation
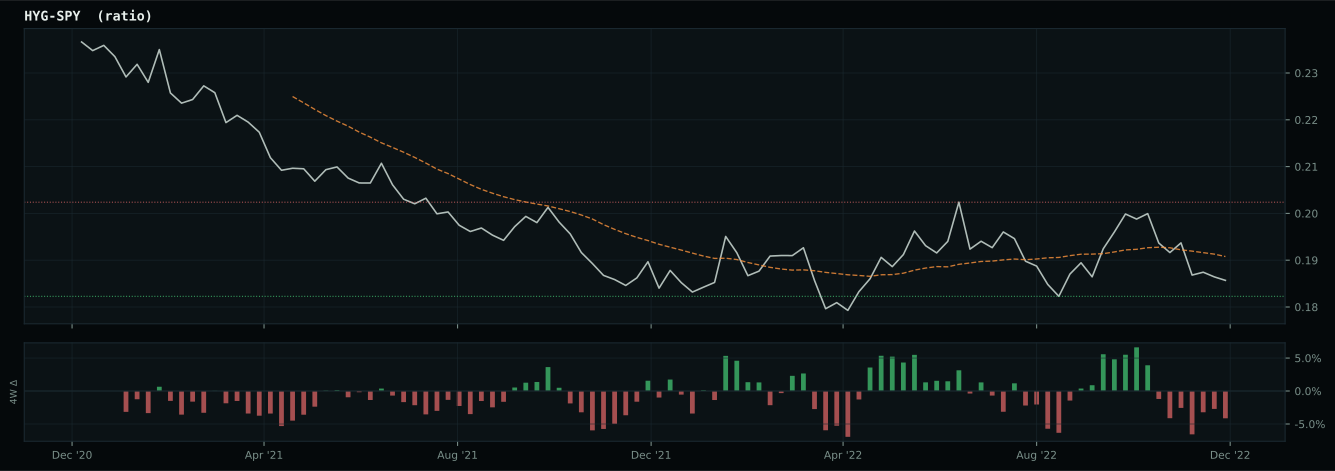
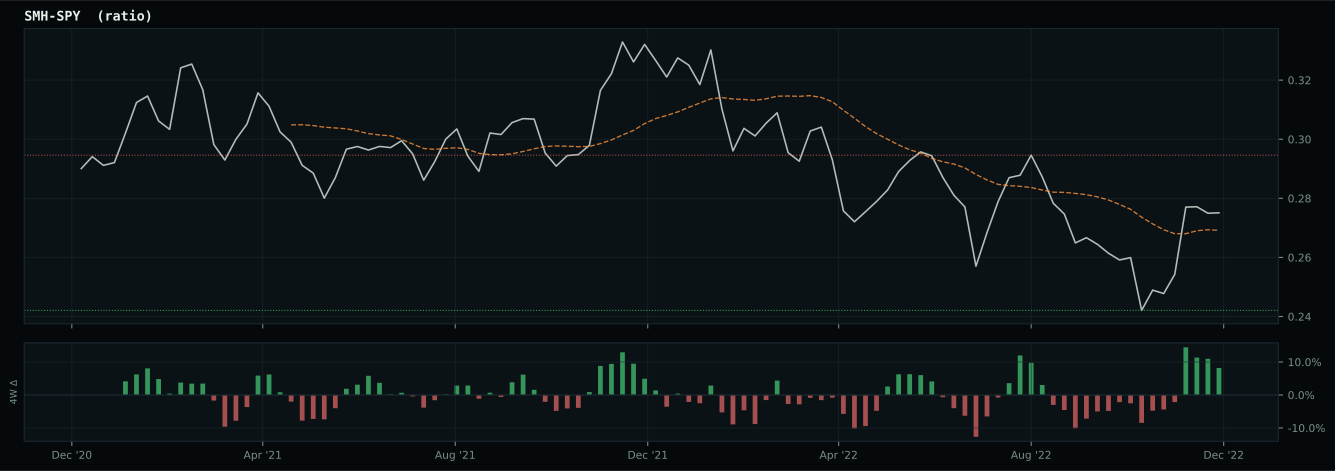
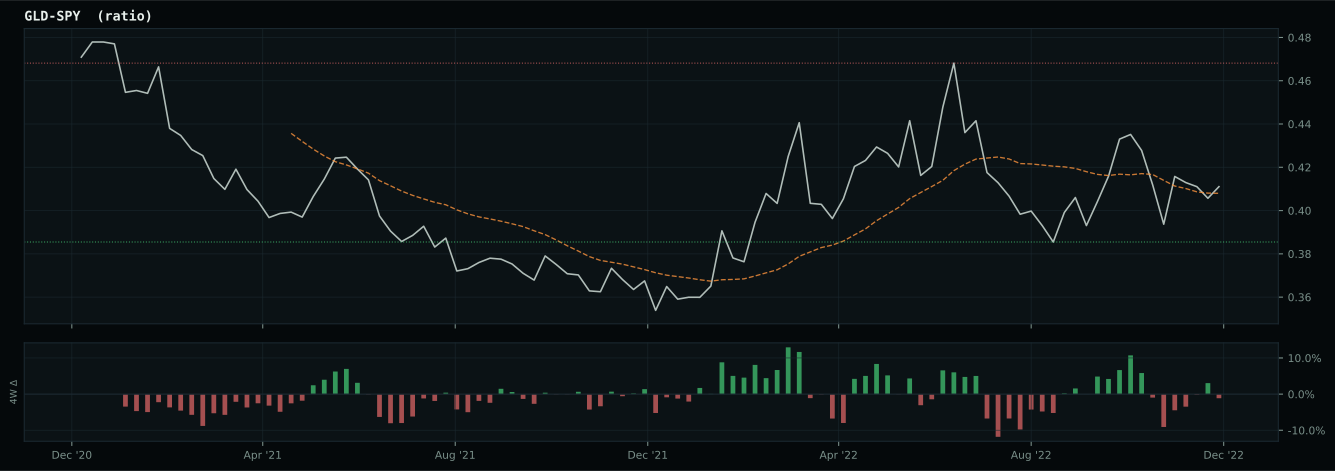
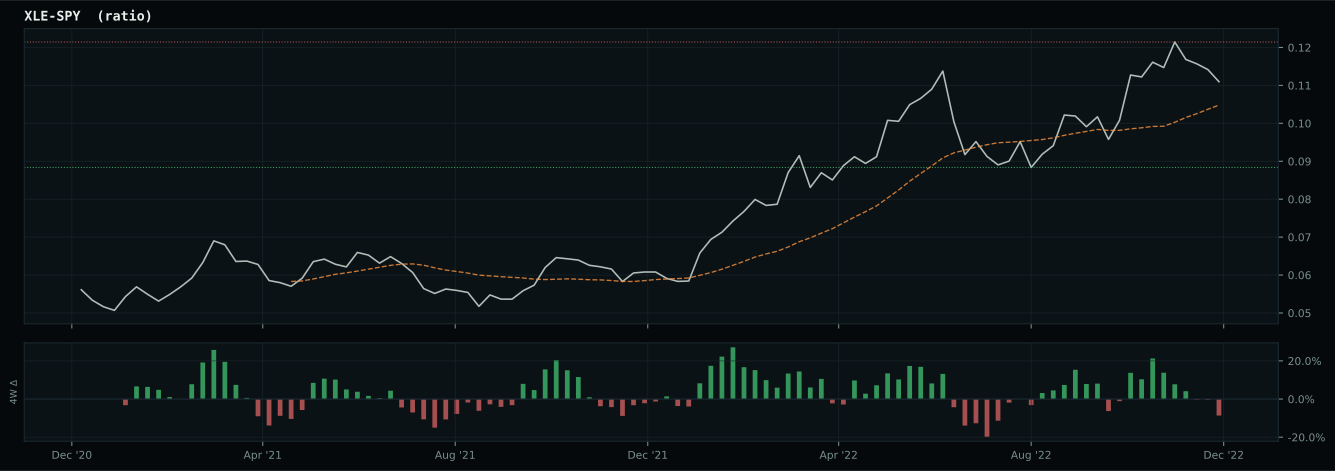
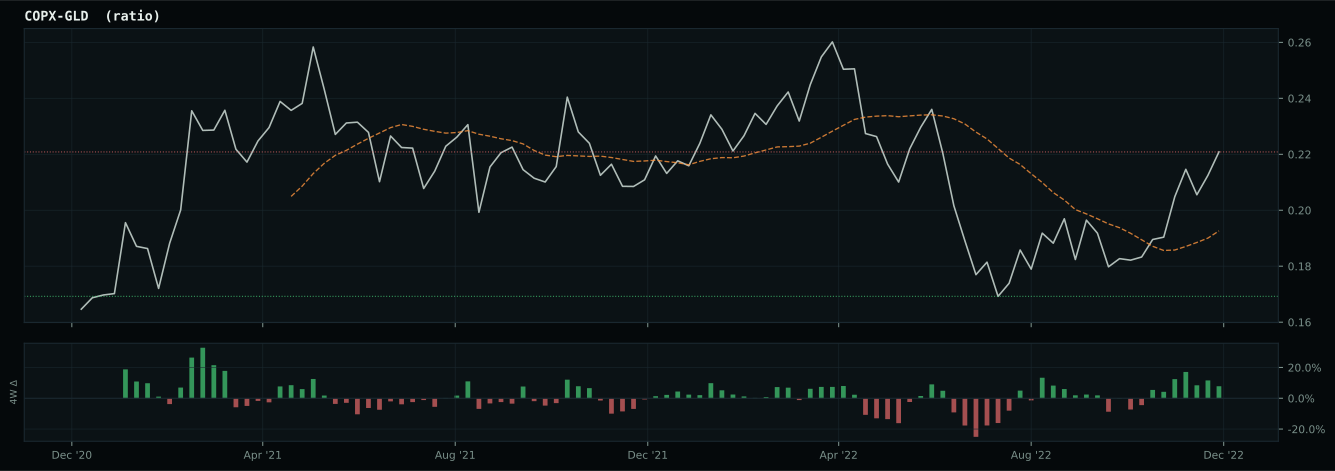
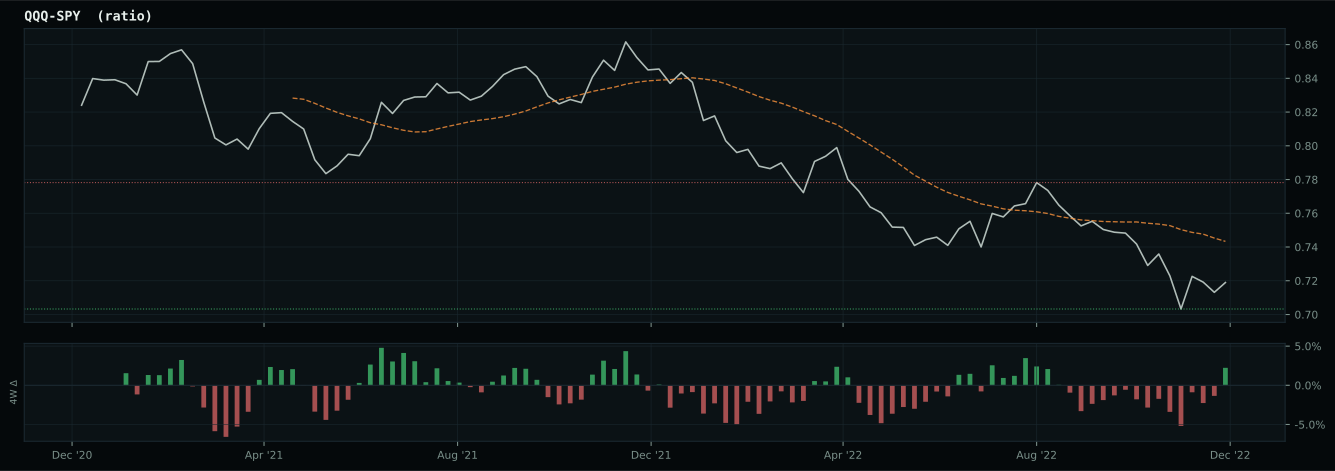
Macro Evidence Charts
Market-implied signals behind the macro regime scores. Each ratio compares two assets; the direction and slope of the ratio is what the macro engine reads.
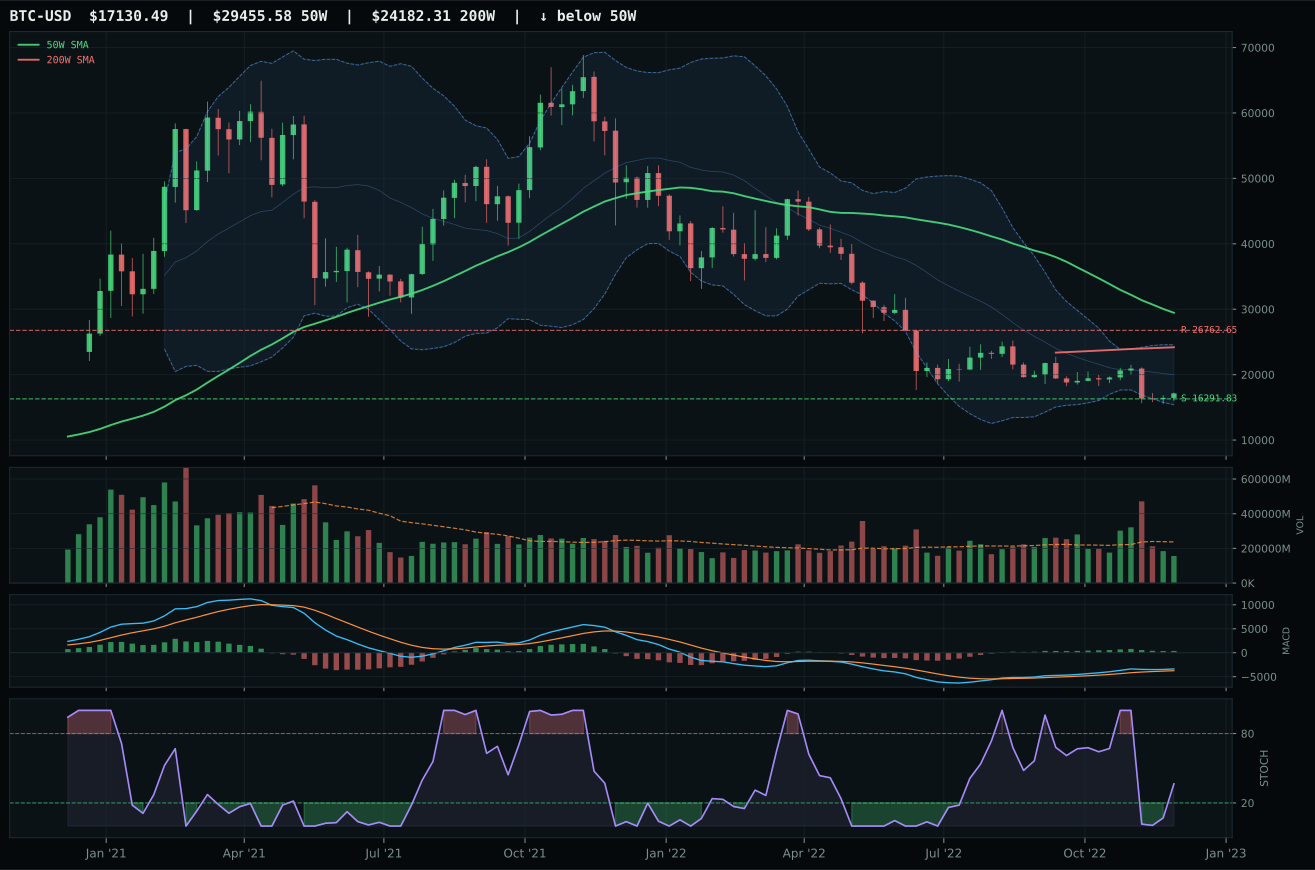
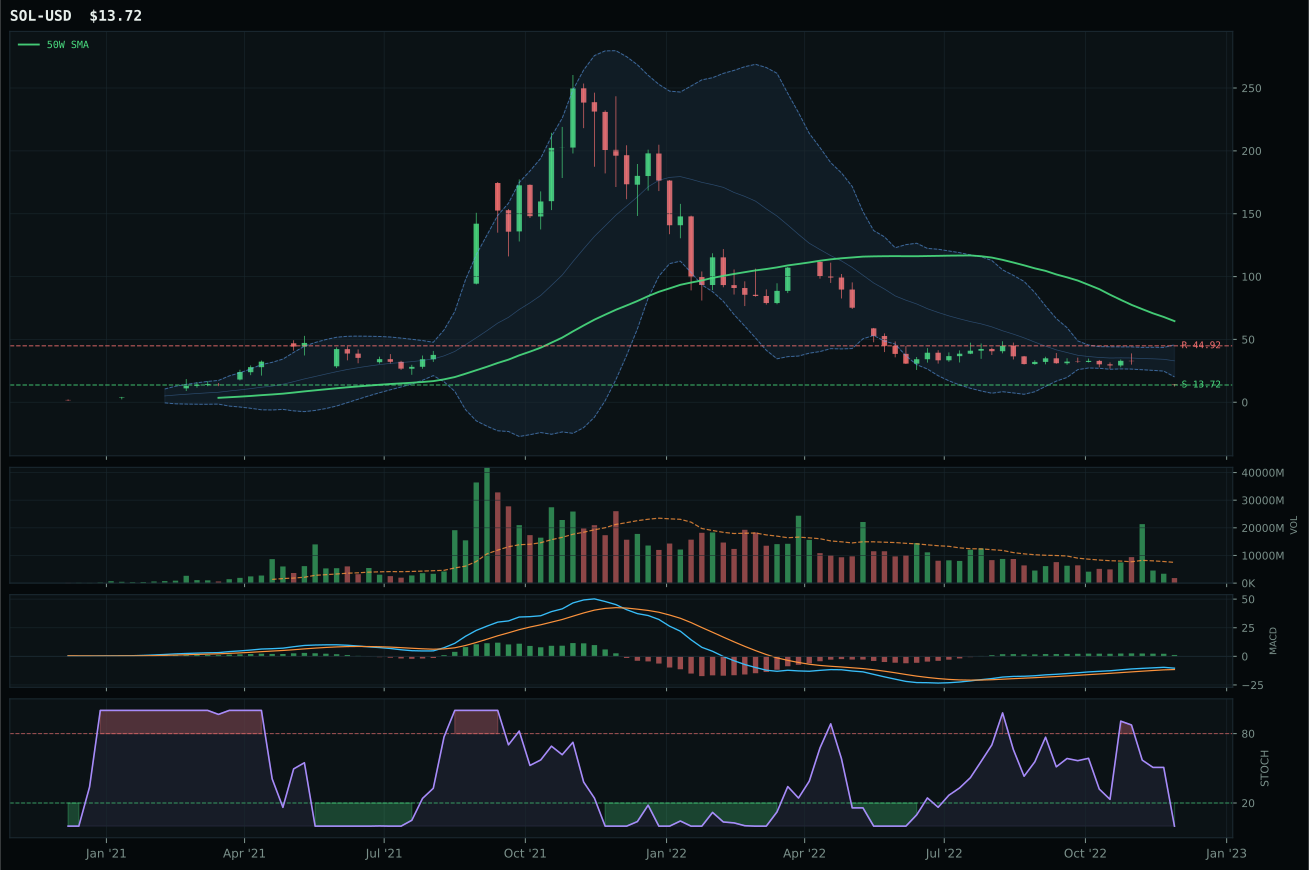
Crypto Regime — NoCrypto
ValueBTC armed; waiting for 50W reclaim, decisive close above post-touch range resistance by 3%, close above 200W, breakout volume above 20W…
TrendBTC not confirmed
one or more available conditions failed
Category Rankings
| Rank | Category | Winner | Score | Alloc | 4W Ret | Peers (4W) |
|---|---|---|---|---|---|---|
| 1 | Industrial Metals | COPX | 79.9 | 20% | -3.74% | PICK -5.9% · REMX -18.9% |
| 2 | Traditional Energy | XLE | 74.3 | 20% | -4.69% | XOP -10.0% · FCG -10.0% |
| 3 | Defense & Aerospace | XAR | 60.0 | 10% | -1.36% | ITA -1.2% · ROKT -0.7% |
| 4 | Agriculture & Livestock | VEGI | 58.4 | 10% | -4.86% | MOO -6.3% · WEAT +3.0% |
| 5 | Utilities & Infrastructure | XLU | 54.7 | 10% | +0.30% | PAVE -4.7% · IGF -3.5% |
| 6 | Technology | XLK | 53.3 | 10% | -6.37% | IGV -4.3% · CIBR -4.7% |
| 7 | AI | SMH | 43.9 | 10% | -7.33% | AIQ -6.0% · BOTZ -3.1% |
| 8 | Nuclear Energy | URA | 43.9 | 10% | -3.12% | URNM -3.7% · NLR -2.7% |
| 9 | Precious Metals | SLV | 42.7 | 0% | +7.36% | GLD +2.9% · GDX -1.0% |
| 10 | Emerging Markets | INDA | 26.2 | 0% | -3.56% | ILF -12.2% · IEMG -2.9% |
Industrial Metals — COPX
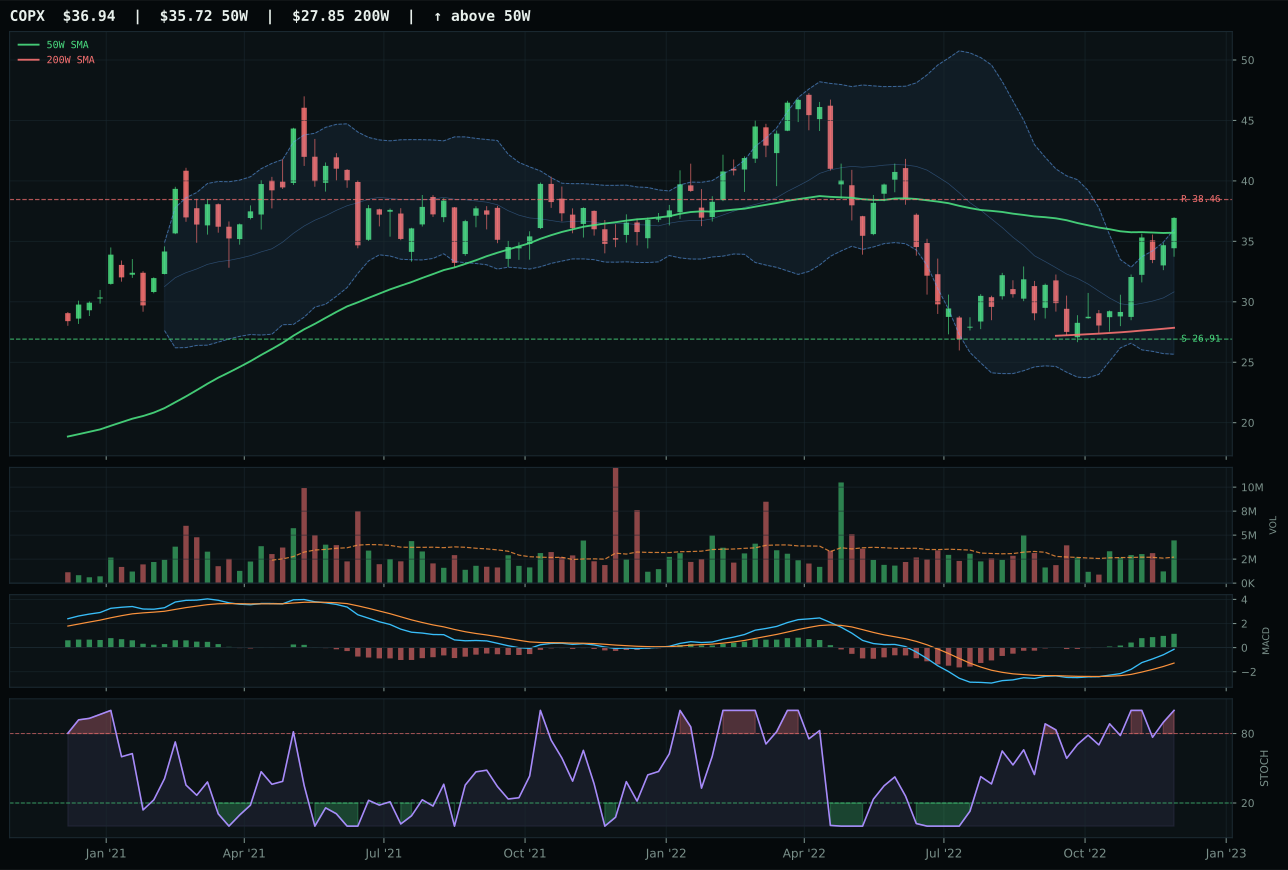
COPX has a neutral structure profile with 23.4% 13-week relative strength versus SPY.
A failed hold above support would weaken the setup.
Actionable but governed by invalidation levels.
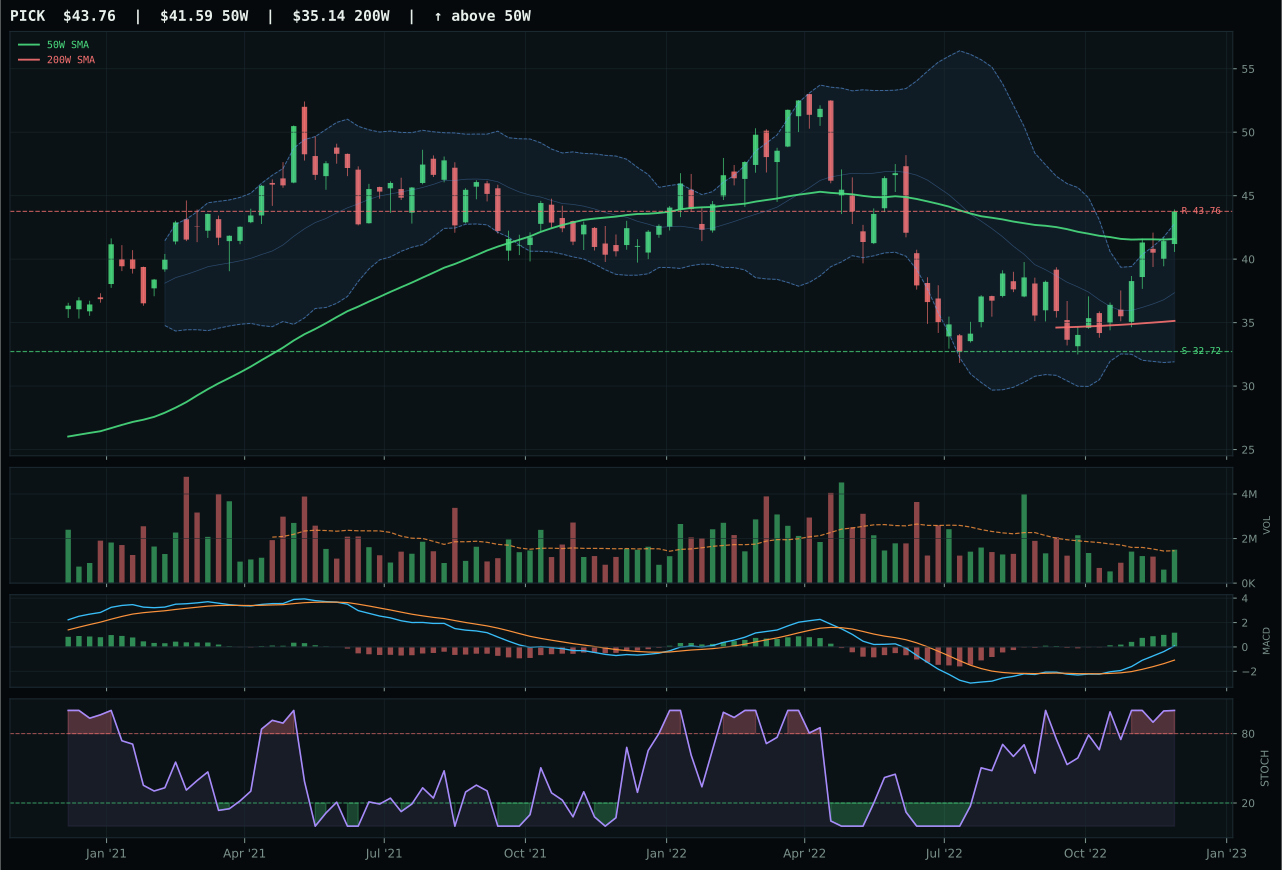
PICK has a neutral structure profile with 19.3% 13-week relative strength versus SPY.
A failed hold above support would weaken the setup.
Actionable but governed by invalidation levels.
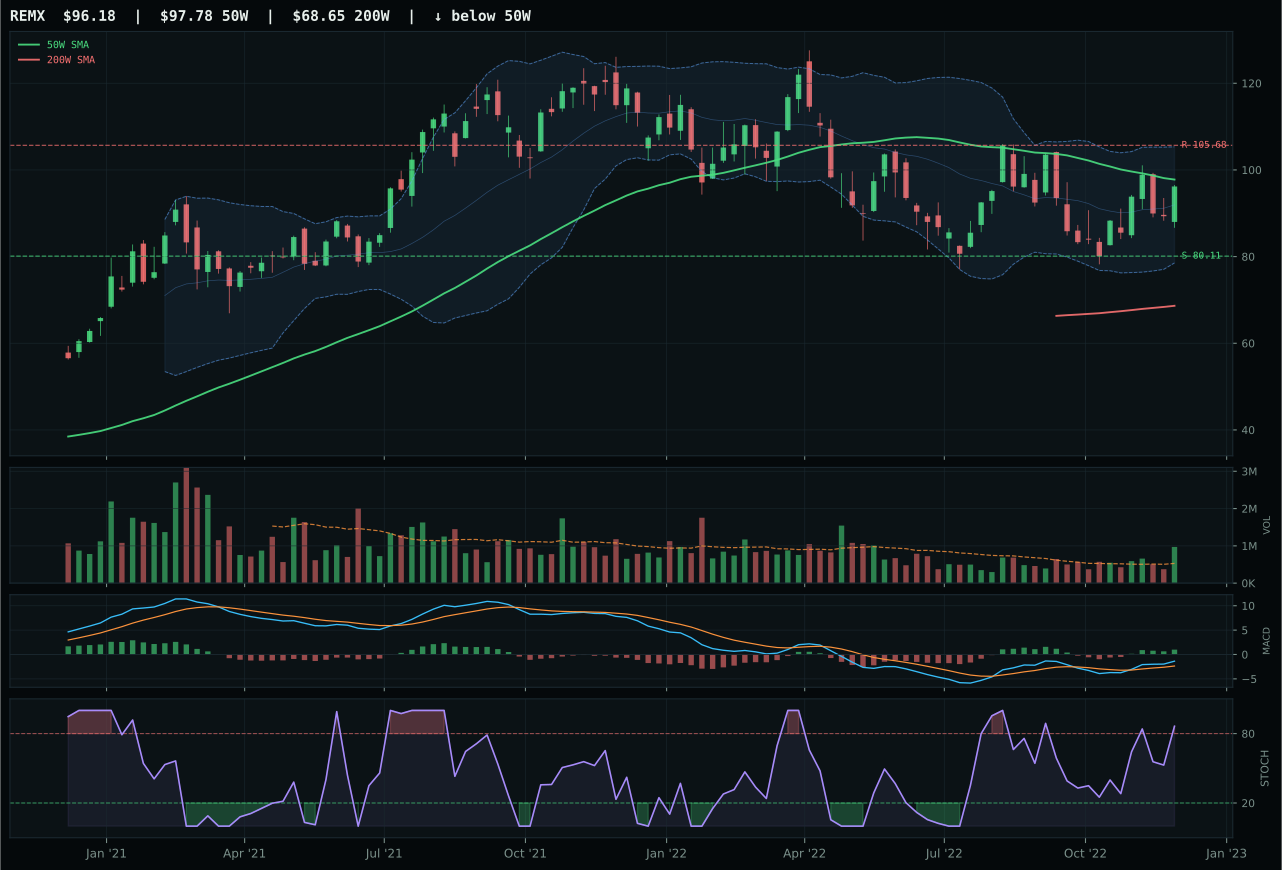
REMX has a compression near 50W profile with 0.3% 13-week relative strength versus SPY.
A failed hold above support would weaken the setup.
Actionable but governed by invalidation levels.
COPX wins decisively with a 3.7-point lead over PICK by maximizing every technical dimension: superior timing (97 vs 82), cleaner structure (76.6 vs 71.0), better volume confirmation (98.4 vs lower), and dominant category-relative strength (4.1% vs 0.0%). Price 3.4% above the 50W in the middle Fibonacci 0.500 decision zone near 36.62 creates perfect expansion potential with 37.3% downside to support, whereas PICK at 0.0% category-relative strength carries latent rotation risk. COPX's volume acceleration to 1.64x confirms accumulation; PICK runs neutral, creating divergence where strength is being concentrated into one vehicle. 27.2% thirteen-week return and 23.4% relative strength versus SPY establish COPX as the institutionally-favored copper scarcity play. MACD bullish and improving, stochastic RSI overbought at 1.00, and perfect momentum confirmation at 100/100 across both COPX and PICK—the tiebreaker is timing and volume sponsorship. Every metal miner shows overbought momentum; COPX's 3.4% proximity to 50W gives it entry advantage while PICK sits closer to exhaustion. This is manufacturing leadership versus general mining breadth.
Industrial Metals earned top-2 status with 20% allocation because it ranks second overall at 79.9/100 final score, behind only COPX's technical dominance at 100.0/100 and the category's exceptional 75.0/100 macro fit. Late-Cycle Reflation (+10), metals scarcity (+14), and commodity breadth (+10) combine for +34 points of structural tailwind—the single strongest macro support in the portfolio. Real asset sponsorship (+6) and supply shortage implicit in scarcity descriptor provide additional confirmation. COPX's perfect trend score of 100 and momentum confirmation of 100 leave zero room for doubt about category direction. The 20% allocation reflects both exceptional technical breadth (COPX/PICK both rank in top tier) and macro regime alignment: Late-Cycle Reflation with scarcity pressure is precisely where industrial metals dominate. This is a core conviction position where macro sponsors price discovery and technical setup confirms participation.
Traditional Energy — XLE
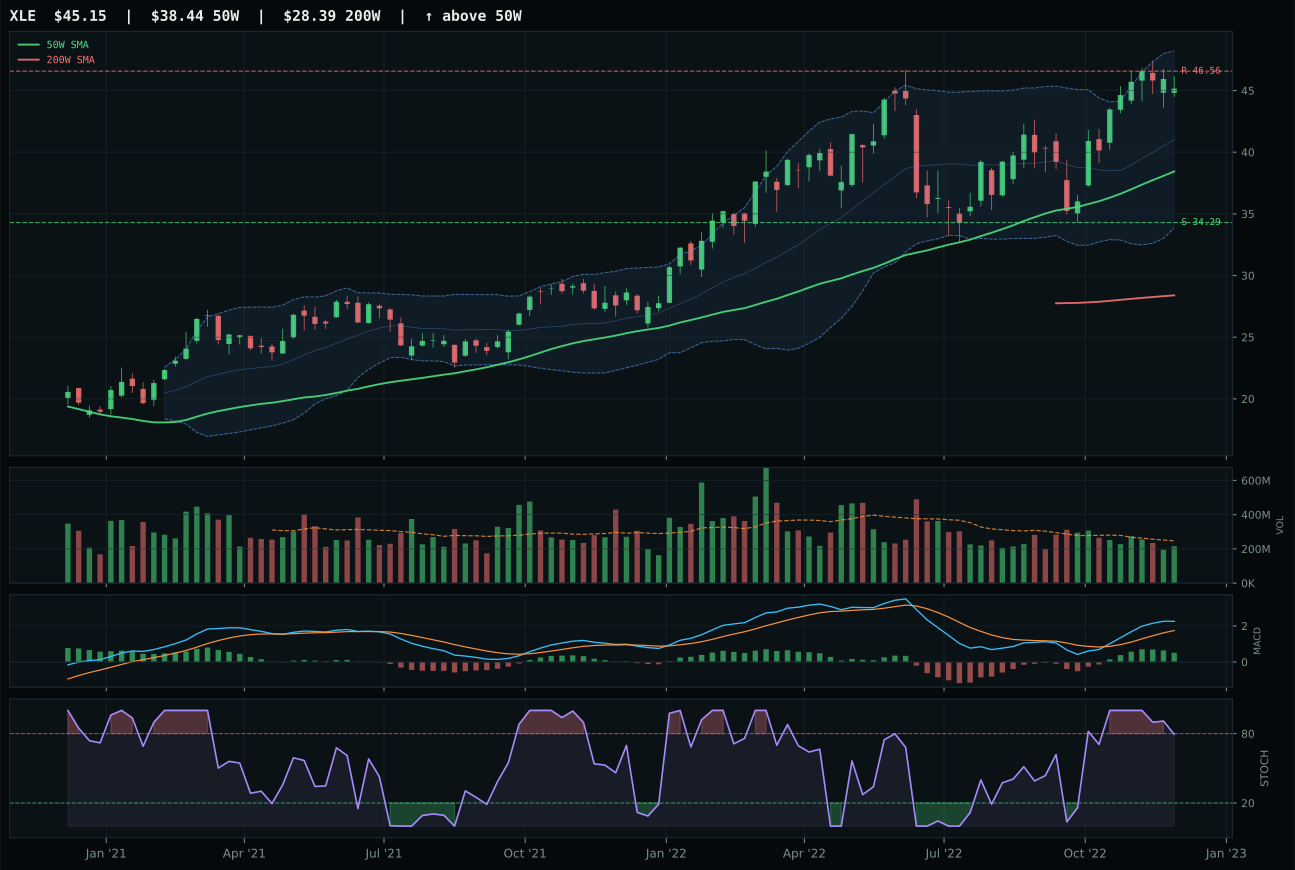
XLE has a vertical extension profile with 9.2% 13-week relative strength versus SPY.
A failed hold above support would weaken the setup.
Actionable but governed by invalidation levels.
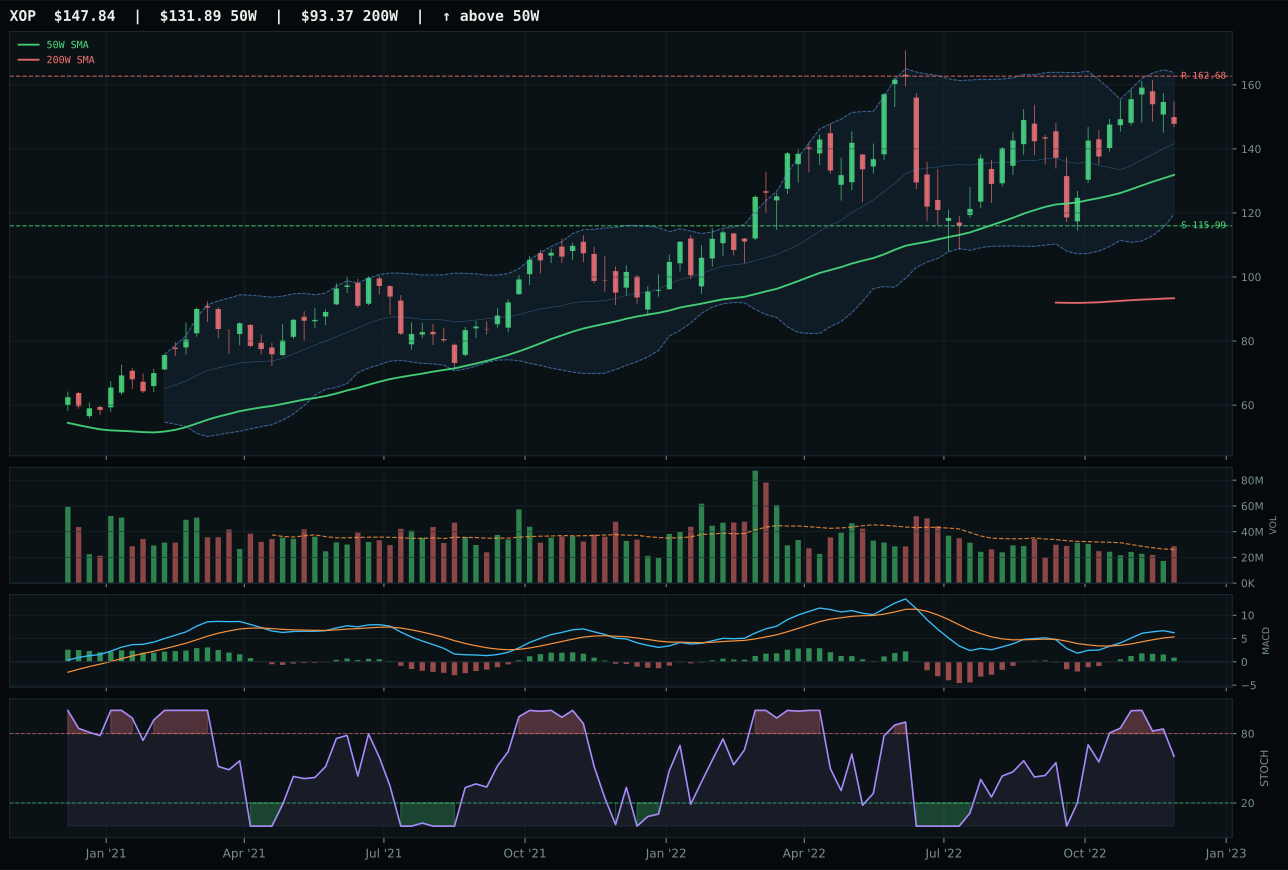
XOP has a neutral structure profile with 0.1% 13-week relative strength versus SPY.
A failed hold above support would weaken the setup.
Actionable but governed by invalidation levels.
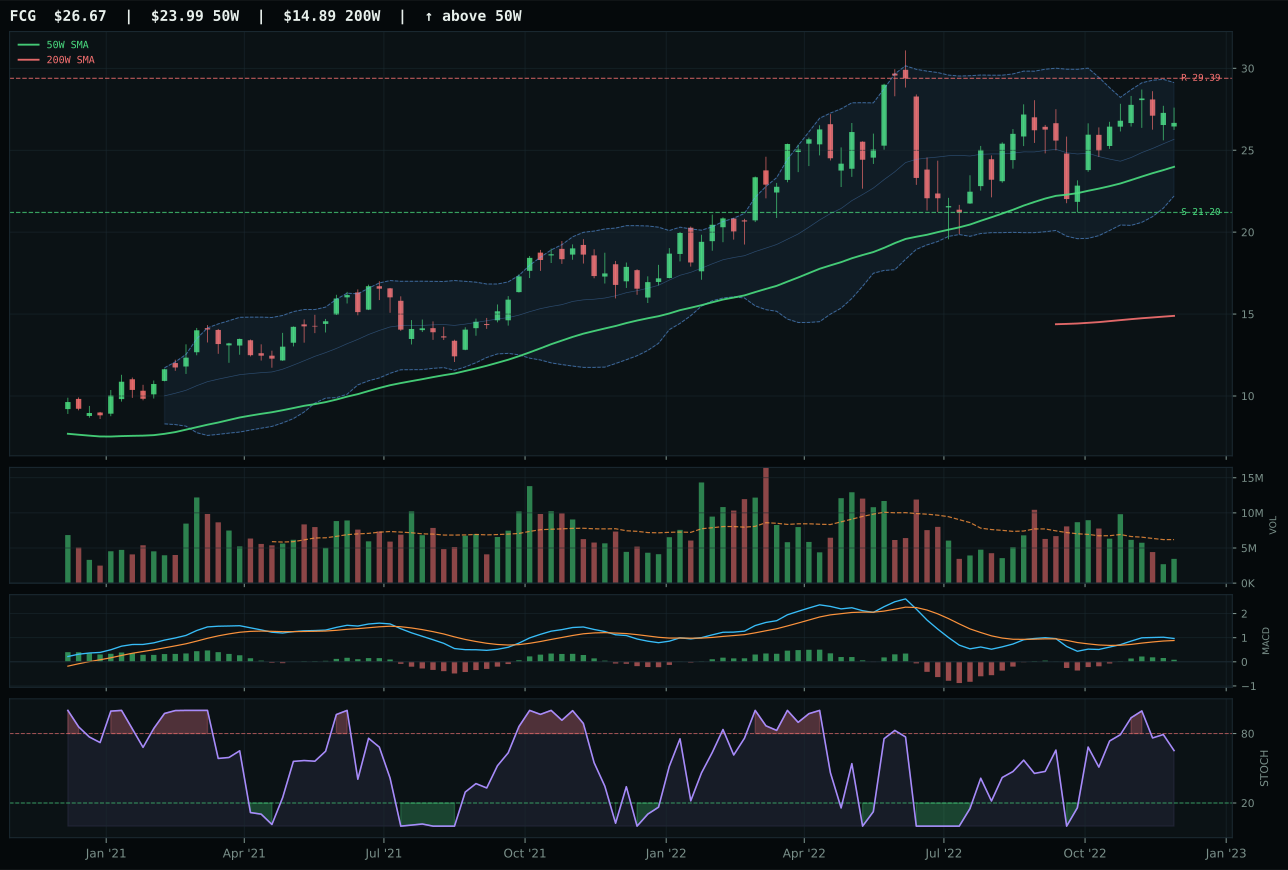
FCG has a neutral structure profile with -2.0% 13-week relative strength versus SPY.
A failed hold above support would weaken the setup.
Actionable but governed by invalidation levels.
XLE edges PICK by 1.5 points in a near-perfect setup by capturing superior category-relative strength (9.1% vs 0.0%), cleaner structure (71.2 vs tighter compression), and the macro scarcity narrative advantage. XLE sits 17.5% extended above the 50W, which normally costs timing points, yet that extension reflects institutional accumulation into supply constraints; the middle Fibonacci 0.236 upper zone confirms this is expansion, not exhaustion. XOP's 0.1% neutral category-relative strength versus XLE's 9.1% dominance reveals concentrated buying into integrated energy cash-flow defense. Both show identical trend scores at 100 and near-identical momentum confirmation (96 vs 95), yet XLE's volume-price confirmation at 73.4 versus broader participation proves integrated stocks are preferred over exploration beta. 12.9% thirteen-week return and 9.2% relative strength versus SPY establish XLE as supply-shock beneficiary in a late cycle where energy reinvestment creates cash-flow defensibility. MACD bullish but flattening signals maturation, yet the move remains sponsored. This is mature bull market positioning in energy: late entry but institutionally confirmed.
Traditional Energy earned top-2 status with 20% allocation because it ranks second at 74.3/100 final score, driven by exceptional 90.0/100 macro fit—the strongest category-macro alignment in the portfolio. Energy scarcity (+16), Late-Cycle Reflation (+12), inflation pressure (+10), and supply shortage (+9) combine for +47 points of structural tailwind. Real asset sponsorship (+7) adds final confirmation. XLE's 69.1/100 technical evidence is strong but not perfect; the 20% allocation rests equally on macro regime and technical breadth. Late-Cycle Reflation with explicit energy scarcity descriptor means energy is the portfolio's hedge against inflation acceleration and geopolitical supply disruption. XLE's 17.5% extension above 50W normally would cap allocation, yet in a late-cycle reflation regime, extended real assets outperform as inflation feeds through supply chains. This allocation says: supply constraints are real, central banks tolerate higher energy prices, and integrated producers will defend margins. Energy would drop to 10% only if relative strength deteriorates or MACD loses bullish slope confirmation.
Defense & Aerospace — XAR
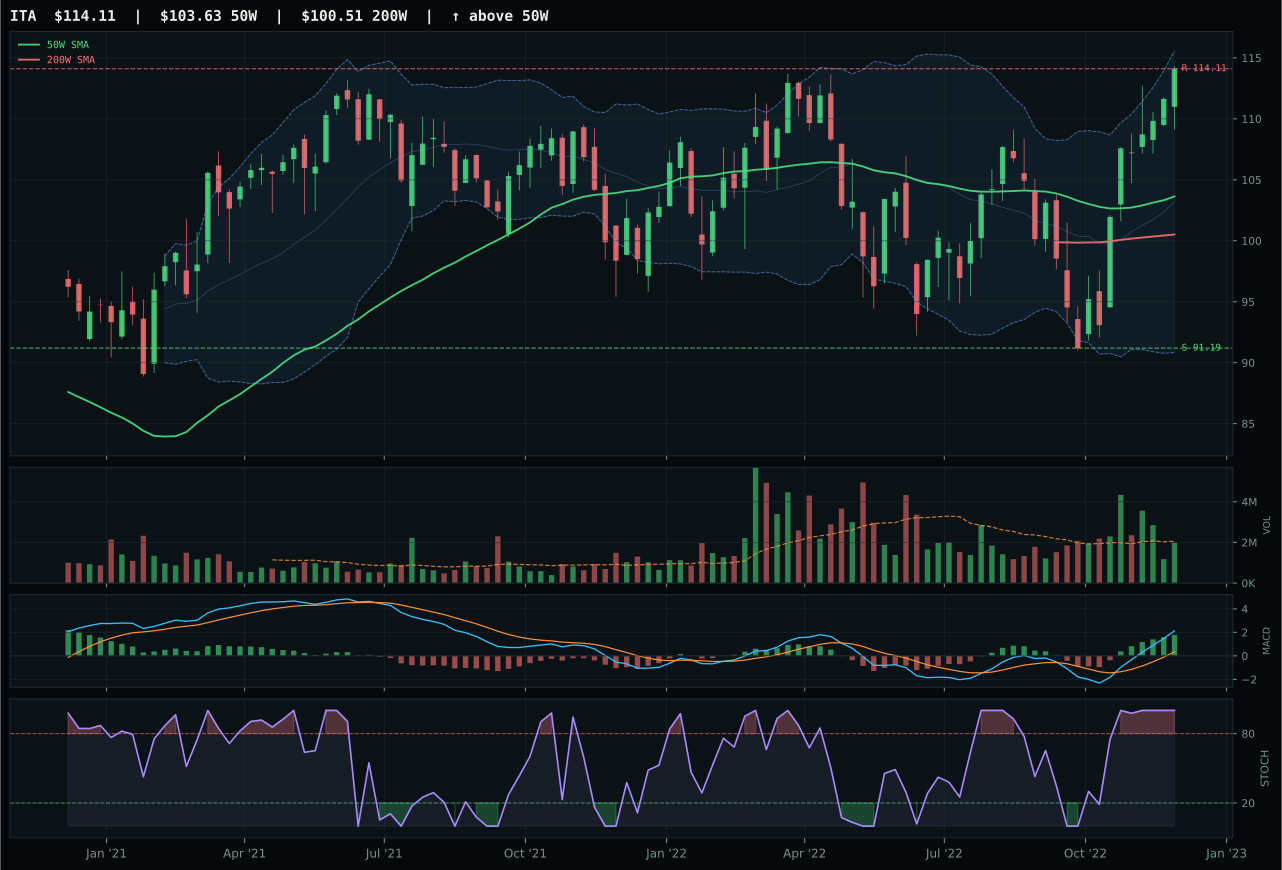
ITA has a neutral structure profile with 10.2% 13-week relative strength versus SPY.
A failed hold above support would weaken the setup.
Actionable but governed by invalidation levels.
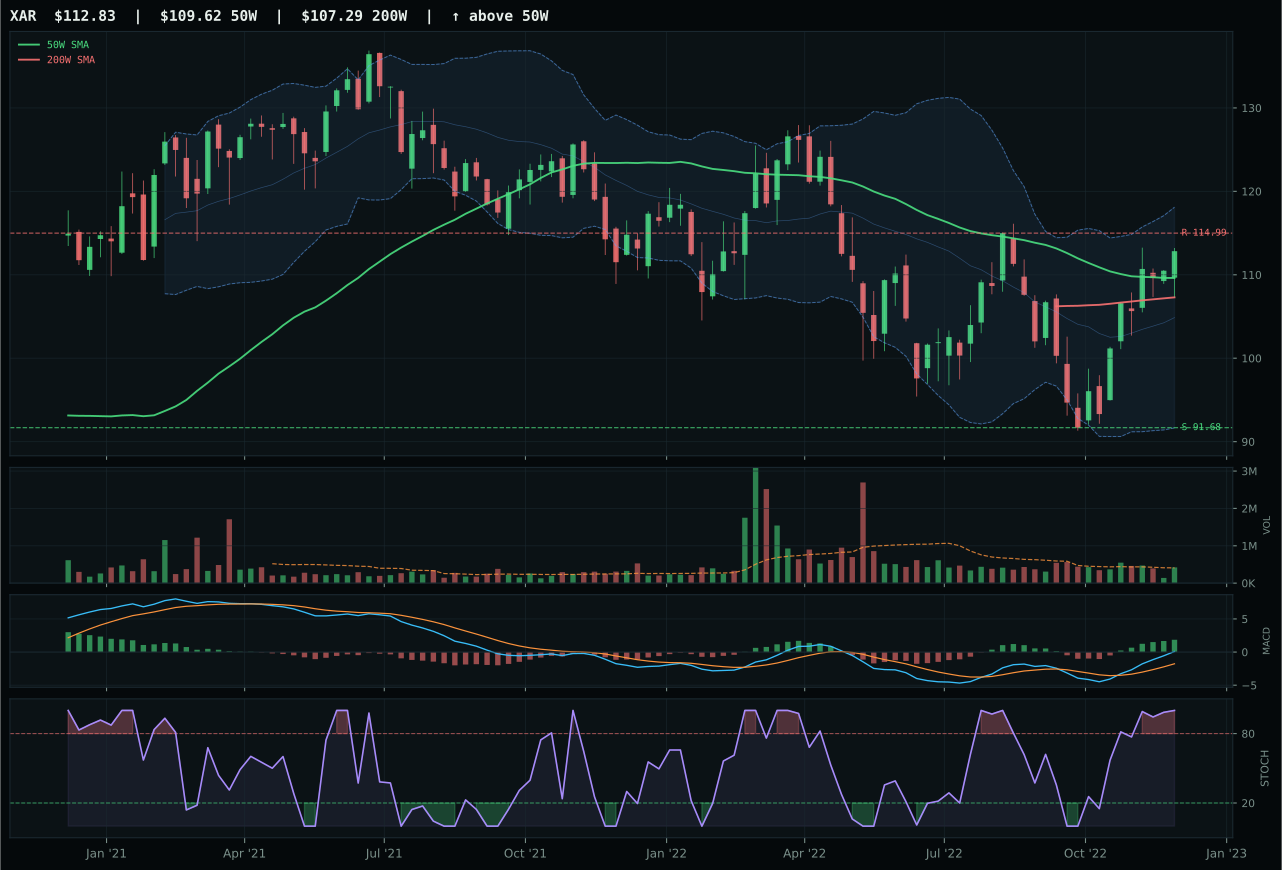
XAR has a compression near 50W profile with 6.9% 13-week relative strength versus SPY.
A failed hold above support would weaken the setup.
Actionable but governed by invalidation levels.
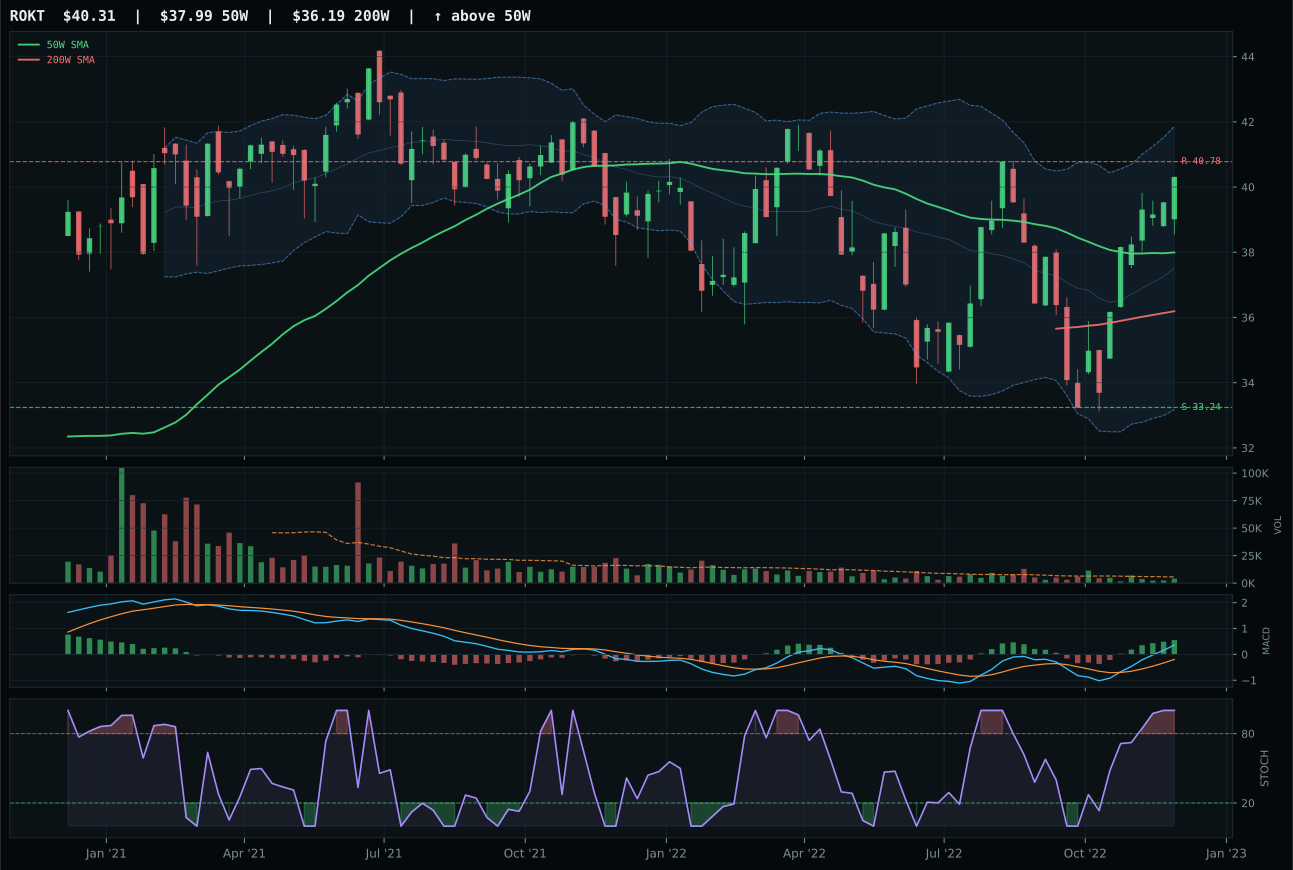
ROKT has a neutral structure profile with 6.9% 13-week relative strength versus SPY.
A failed hold above support would weaken the setup.
Tracked, but not top-2 eligible because: .
XAR edges out ITA by 5.3 points through superior timing and compression structure that offers expansion upside with minimal downside risk. Price 2.9% above the 50W sits in the middle Fibonacci 0.382 decision zone near 113.95, exactly where compressed consolidation can resolve with velocity; ITA's 10.1% extension above the 50W costs 41 points of timing score (59 vs 100) because new buyers are structurally disadvantaged when entries are this extended. Both show identical 90+/100 trend scores and perfect MACD/stochastic RSI bullish confirmation, but XLU's neutral structure with 73.7 compression versus ITA's stretched setup separates the two. 13W returns favor ITA at 14.0% versus 10.6%, yet XAR's 6.9% relative strength versus SPY and category-relative -0.1% prove the move is accumulating into strength. Volume neutral across both, so the timing score becomes the deciding factor: XAR's 100 timing versus ITA's 59 on distance-to-50W alone explains the category decision.
Defense & Aerospace earned 10% despite XAR's superior entry setup because the category ranks third with a 60.0 score, missing top-2 status by narrow margin against COPX and XLE. The 57.0/100 macro fit shows balanced tension: Late-Cycle Reflation (+6) and Transition / Mixed (+3) provide modest support, yet liquidity stress (-4) and credit stress offset any tailwind. XAR's technical evidence of 82.7/100 is strong but not exceptional in absolute terms; ITA's higher-ranked 85.2/100 technical score shows that Defense as a category has breadth, but neither ETF commands the portfolio's largest conviction. The category would earn 20% if XAR sustains above 114.99 resistance with volume acceleration, or if geopolitical risk premiums expand the macro descriptor for defense spending. For now, 10% captures the timing opportunity without betting the portfolio on military-industrial strength in a late cycle where risk appetite remains tentatively positive.
Agriculture & Livestock — VEGI
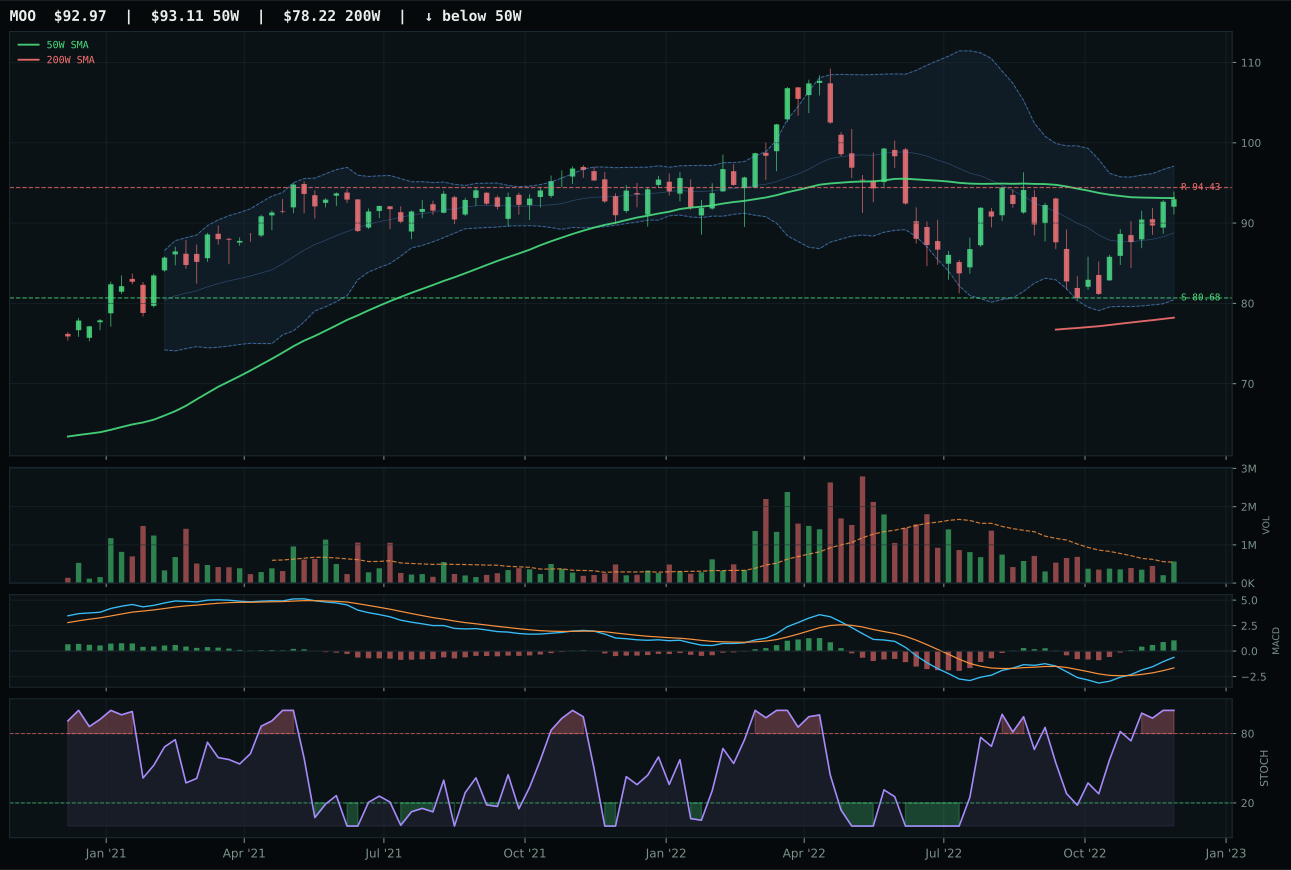
MOO has a compression near 50W profile with -0.2% 13-week relative strength versus SPY.
A failed hold above support would weaken the setup.
Actionable but governed by invalidation levels.
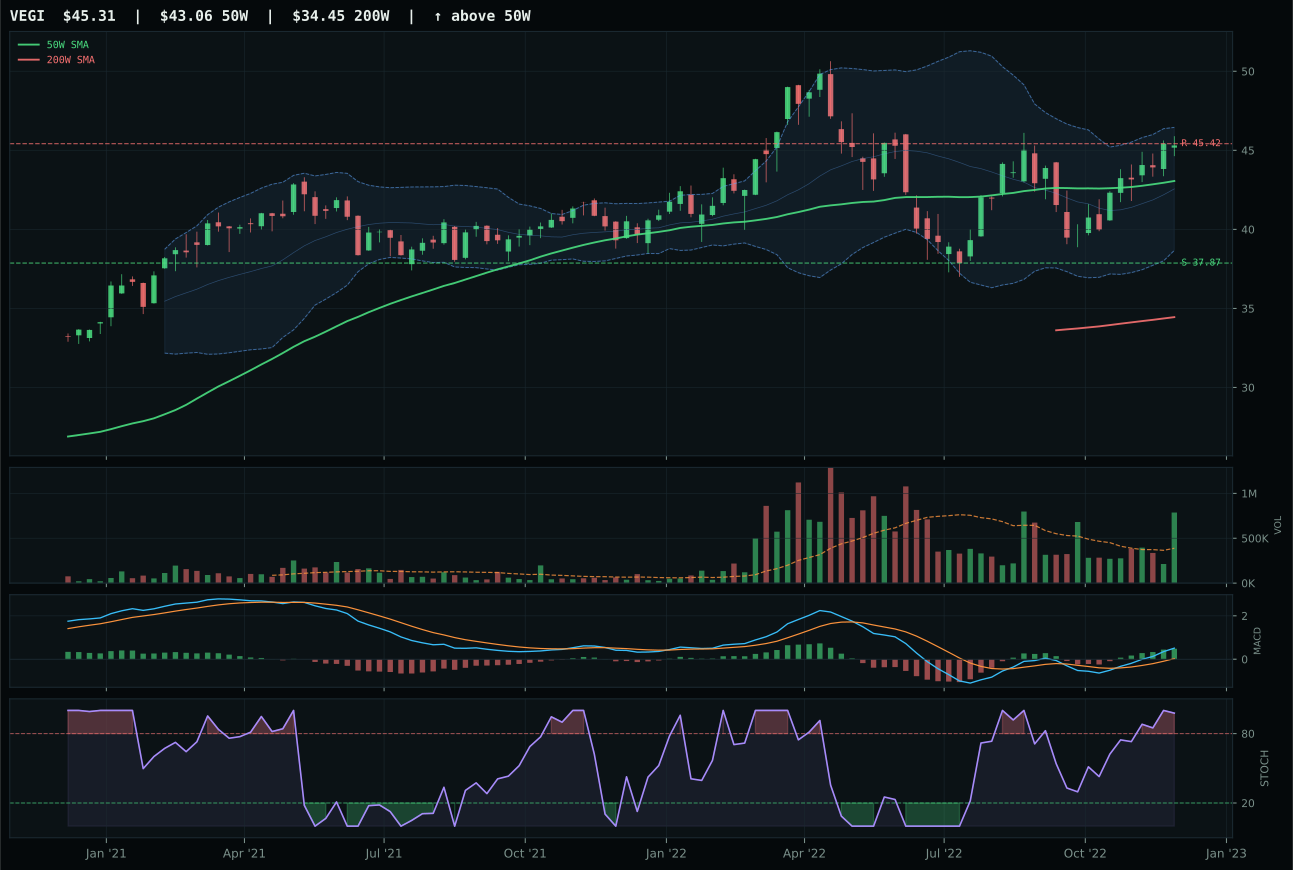
VEGI has a neutral structure profile with 1.8% 13-week relative strength versus SPY.
A failed hold above support would weaken the setup.
Actionable but governed by invalidation levels.
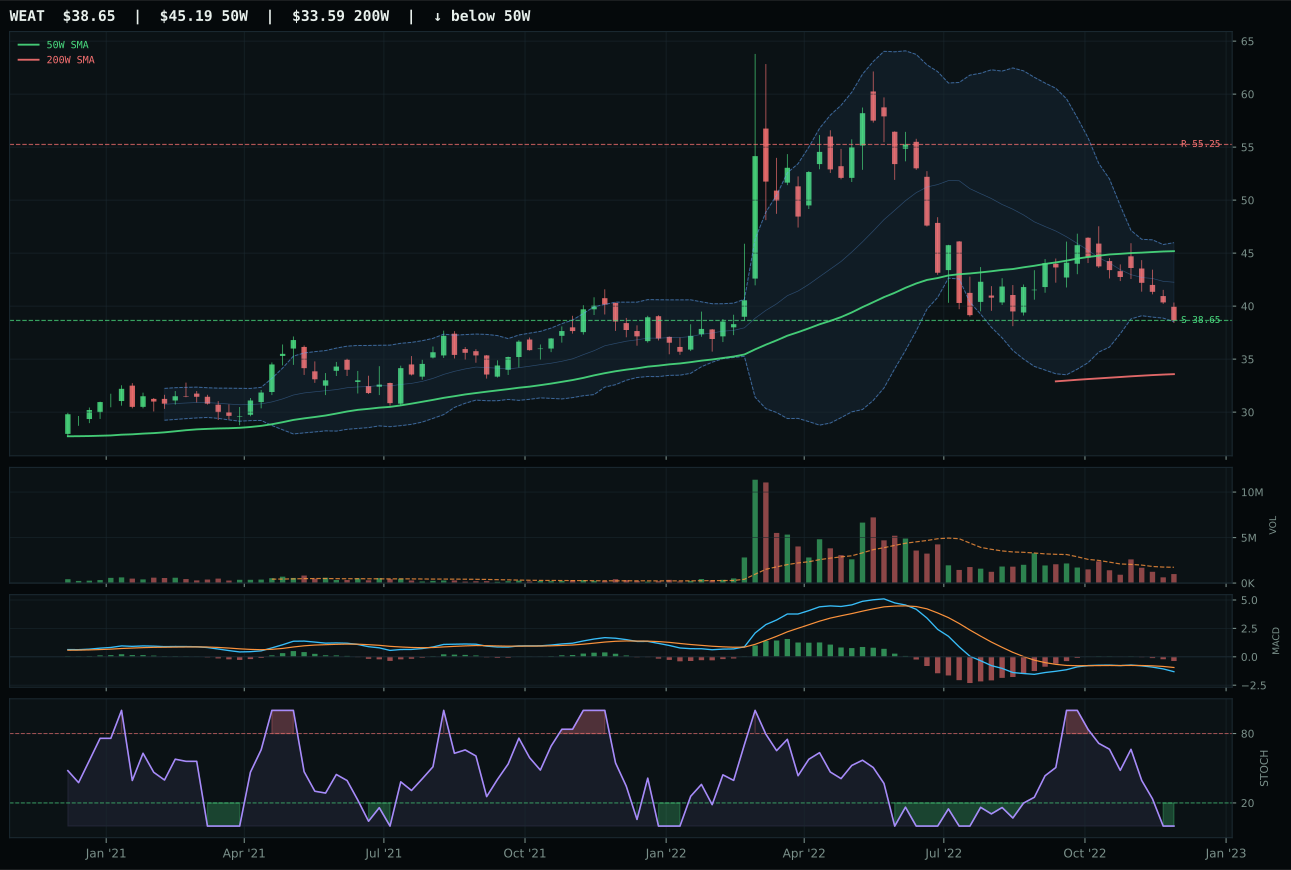
WEAT has a pullback into support profile with -10.7% 13-week relative strength versus SPY.
A failed hold above support would weaken the setup.
Actionable but governed by invalidation levels.
VEGI wins a close 1.9-point decision over MOO by capturing superior category-relative strength (2.1% vs 0.0%) and bullish MACD improvement despite weaker technical components across trend and momentum. Price above both the 50W and 200W with a non-deteriorating 0.3% slope confirms uptrend structure, and the middle Fibonacci 0.382 zone near 45.42 places VEGI in decision territory where compression can resolve upward. The critical difference lies in volume and relative positioning: VEGI runs at 2.03x twenty-week volume (distribution pressure), yet the +2.1% category-relative strength suggests institutional accumulation despite the volume spike. MOO's compression near 50W appears cleaner technically (100 timing vs 82), but MOO's 0.0% category-relative strength—flat versus the basket—disqualifies it from winning in a close call. Both show identical bullish MACD and overbought stochastic RSI at 0.98/1.0, making breadth the tiebreaker: VEGI wins because category peers are buying it into distribution pressure.
Agriculture earned 10% despite category-level macro fit hitting 90.0/100—the second-highest across all ten categories—because the 58.4 final category score ranks fifth in total portfolio quality. Supply shortage (+13), inflation pressure (+10), and real asset sponsorship (+8) combine for massive structural tailwinds, yet MOO's superior 75.9 technical ranking versus VEGI's 59.0 creates a technical-macro mismatch: the best-positioned ETF (MOO) fights -0.2% relative weakness versus SPY. VEGI's victory margin of 1.9 points is too thin to carry full conviction. The portfolio allocates 10% to capture long-dated inflation optionality and commodity breadth exposure, but would require either VEGI to break cleanly above 45.42 resistance or MOO to regain category-relative strength before upgrading to 20%. Late-Cycle Reflation with supply shortage active creates a structural case, yet weak momentum in the category's leading positions prevents top-tier allocation.
Utilities & Infrastructure — XLU
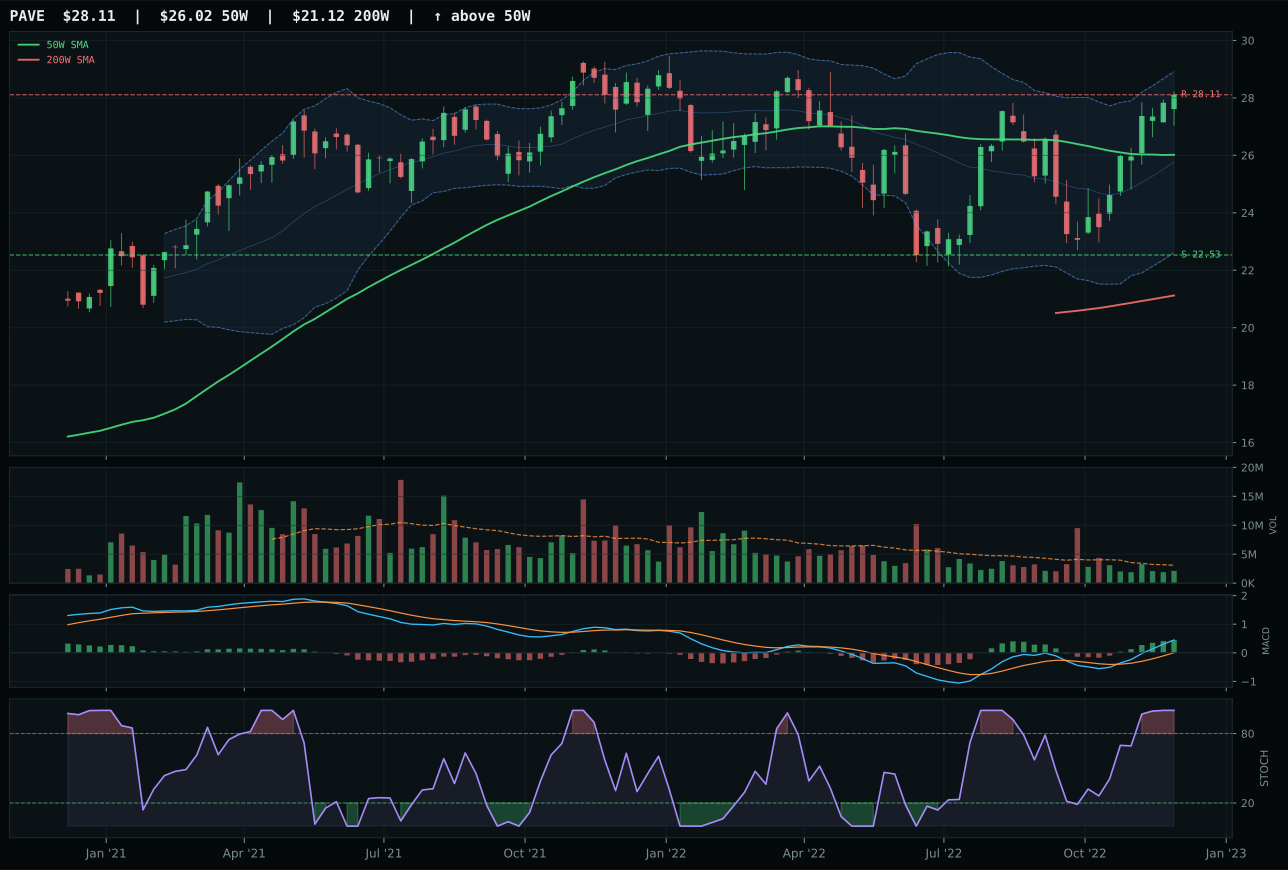
PAVE has a neutral structure profile with 7.5% 13-week relative strength versus SPY.
A failed hold above support would weaken the setup.
Actionable but governed by invalidation levels.
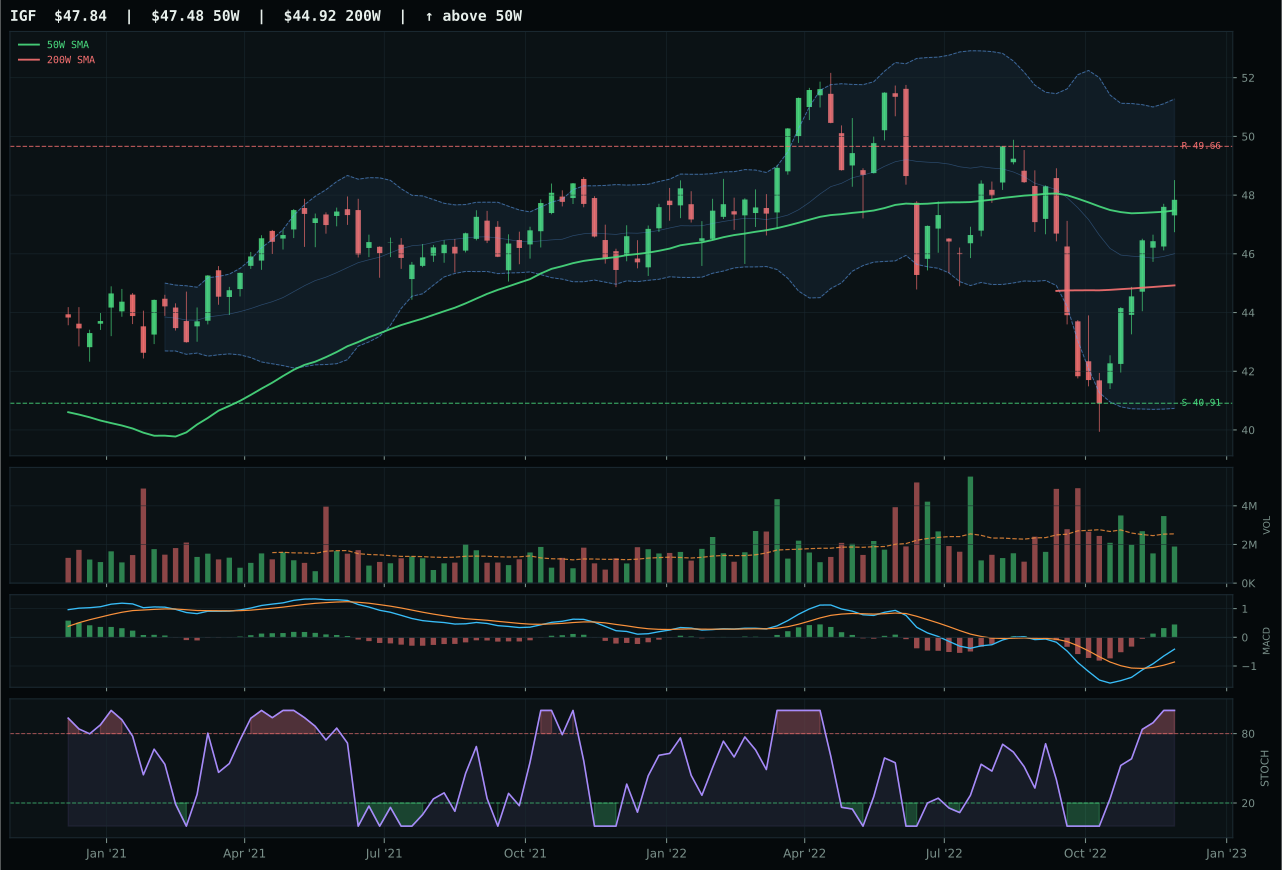
IGF has a compression near 50W profile with -2.1% 13-week relative strength versus SPY.
A failed hold above support would weaken the setup.
Actionable but governed by invalidation levels.
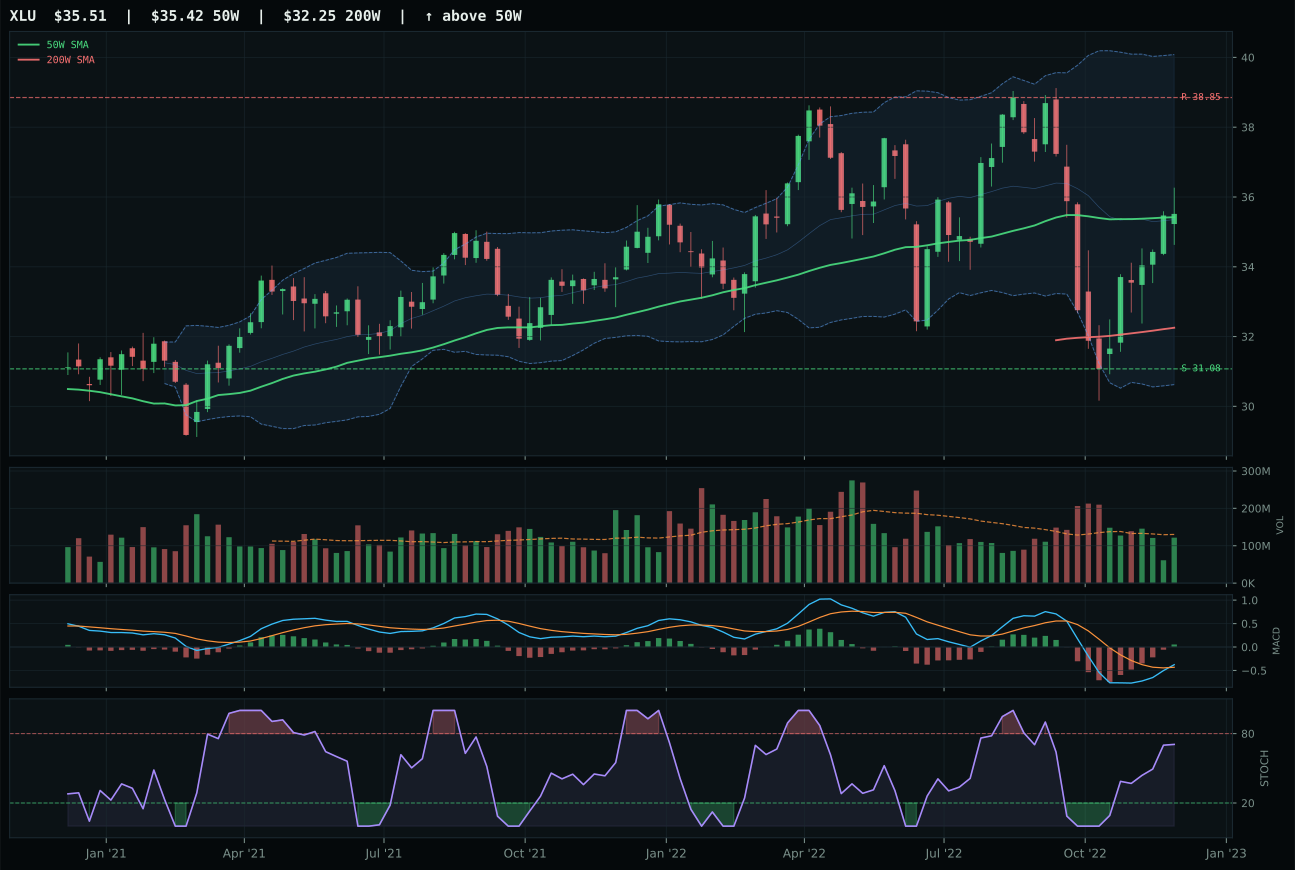
XLU has a compression near 50W profile with -8.5% 13-week relative strength versus SPY.
A failed hold above support would weaken the setup.
Actionable but governed by invalidation levels.
XLU wins a defensive category by capturing perfect timing (100/100) at 0.3% distance from the 50W—essentially kissing the moving average in the middle Fibonacci decision zone near 35.70—combined with stronger risk/reward (63.8 vs 50.8) and better stochastic RSI rising mid-zone signal (0.71) versus PAVE's overbought extremes (1.00). Both show compression structure and bullish MACD improving, yet PAVE's 8.0% extension above 50W costs 25 timing points (75 vs 100) and creates late-entry risk in a category fighting regime headwinds. XLU's -4.8% thirteen-week return and -6.4% category-relative weakness show utilities are lagging, yet perfect timing at 50W provides entry advantage over PAVE's stretched positioning. Volume neutral across both, so structure is the tiebreaker: XLU's compression near moving average gives asymmetric risk (11.9% to support, 8.6% to resistance) versus PAVE's momentum exhaustion setup. This is a category where the winner is determined by 'least bad' entry timing, not momentum conviction.
Utilities & Infrastructure earned 10% despite excellent 70.4/100 technical evidence because the 54.7/100 final score ranks sixth overall, fighting a 43.0/100 macro fit that penalizes defensive utilities in positive risk appetite environments. Inflation pressure (-6 points) and positive risk appetite (-2 points) create regime headwinds for duration-heavy sectors. XLU's -8.5% relative weakness versus SPY reflects this precisely: in Late-Cycle Reflation where real yields are supported, utilities underperform as terminal rates hold. The 10% allocation captures XLU's perfect 50W entry timing without betting the portfolio on the cycle extending to defensive rotation. PAVE's +7.5% relative strength and superior technical evidence (79.3 vs 70.4) actually argues that infrastructure beta—capex-linked—may outperform pure utilities, yet even PAVE carries negative macro fit. Utilities would earn 20% only if inflation pressure reverses or if credit stress intensifies enough to trigger flight-to-safety rotation. Current positioning holds the sector tactically at entry while macro regime remains tilted toward real assets over financial liabilities.
Technology — XLK
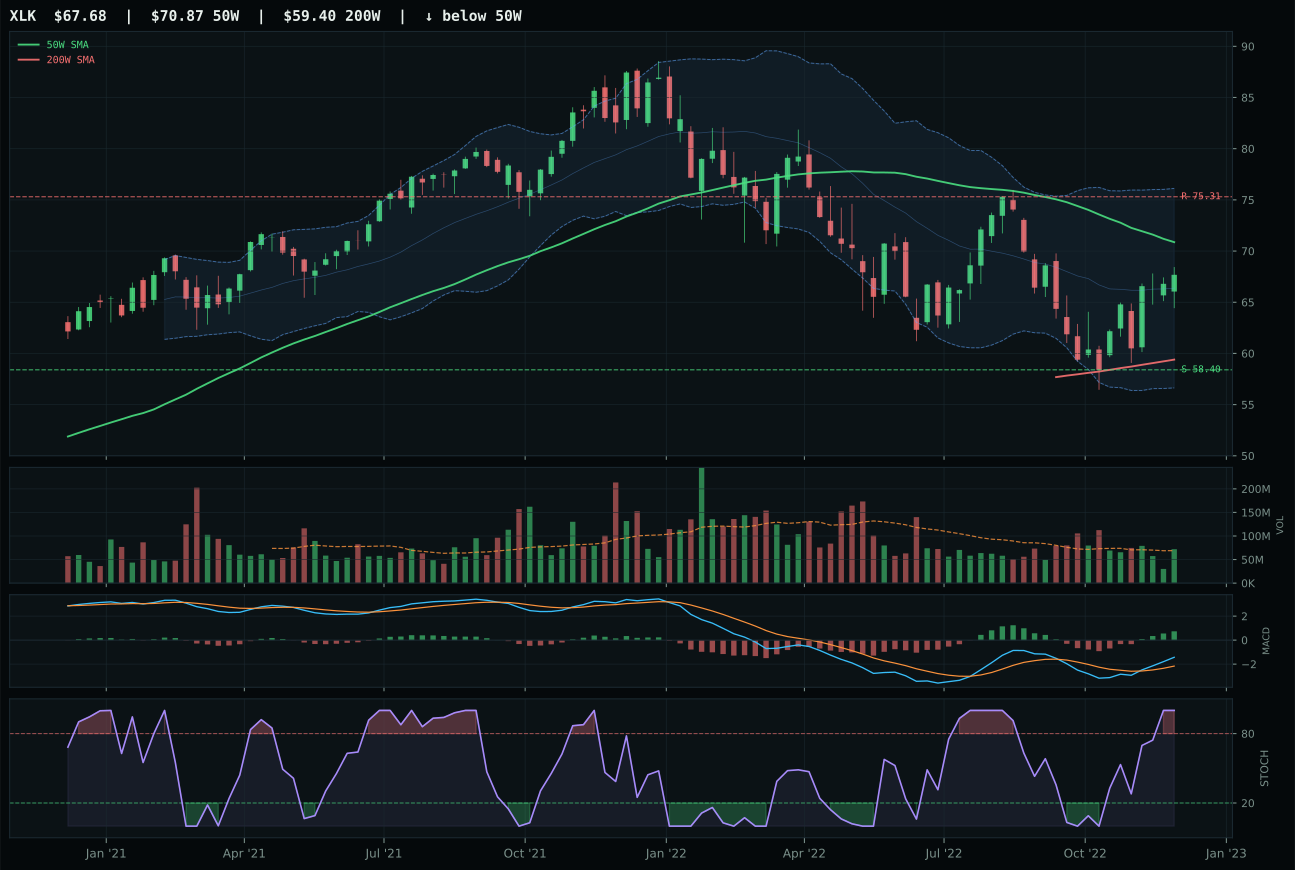
XLK has a neutral structure profile with -1.9% 13-week relative strength versus SPY.
A failed hold above support would weaken the setup.
Actionable but governed by invalidation levels.
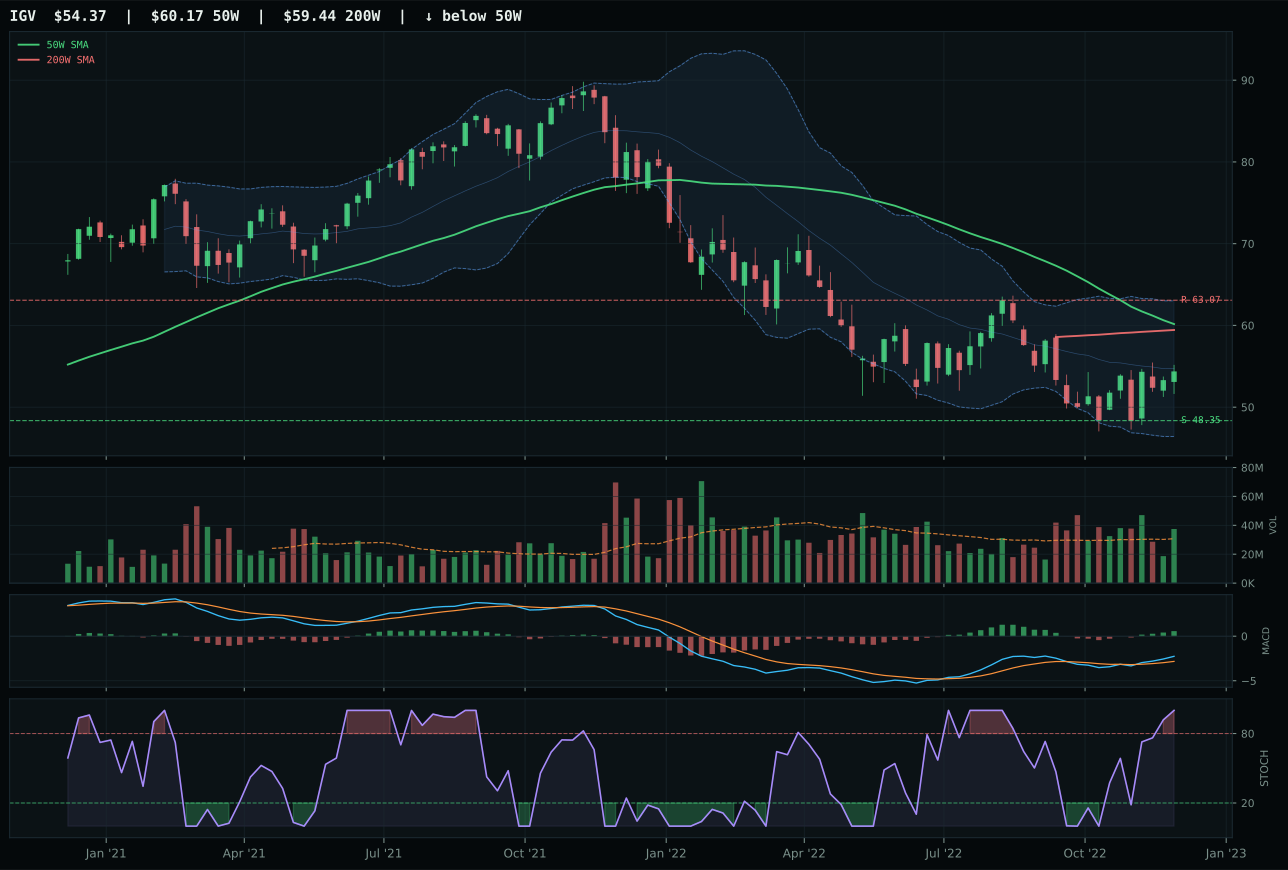
IGV has a neutral structure profile with -5.0% 13-week relative strength versus SPY.
A failed hold above support would weaken the setup.
Actionable but governed by invalidation levels.
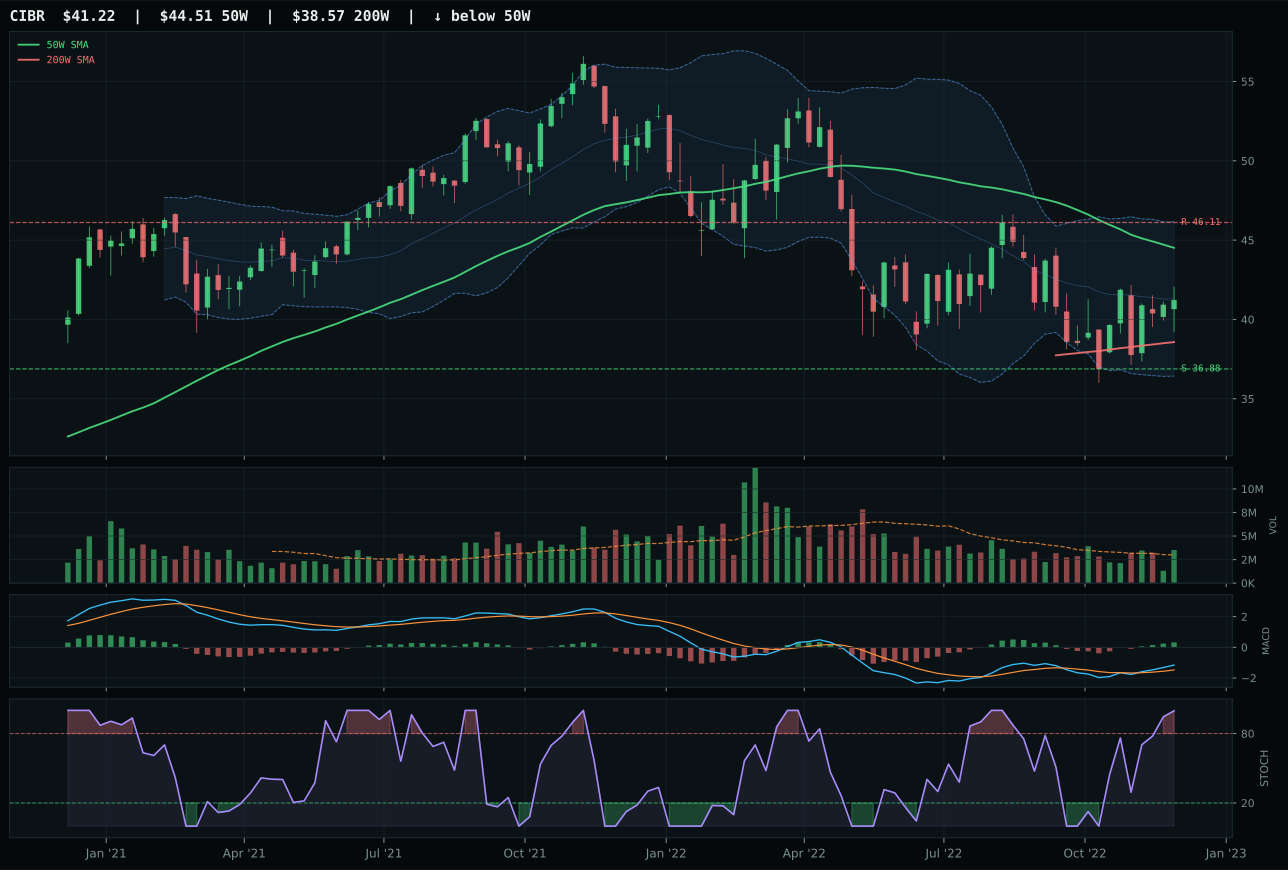
CIBR has a neutral structure profile with -3.4% 13-week relative strength versus SPY.
A failed hold above support would weaken the setup.
Actionable but governed by invalidation levels.
XLK wins the category with a 18.9-point margin over IGV by capturing superior timing and category-relative strength in a setup that rewards pullback entries rather than momentum chases. Price sitting 4.5% below the 50W while maintaining position above the 200W creates a clean retracement structure; MACD is bullish and improving, stochastic RSI shows overbought momentum without rejection, and the Fibonacci 0.618 zone near 68.72 provides institutional support. The 1.5% relative strength advantage within the three-ETF basket—versus IGV's -1.7% category drag—confirms XLK as the sponsored vehicle for broad profitable technology exposure. IGV's timing score collapsed to 75 from XLK's 97 because the setup sits deeper in repair territory, and its -5.0% relative weakness versus SPY indicates late-cycle duration sensitivity that the macro regime penalizes. Volume neutral at 1.05x confirms accumulation rather than distribution, allowing the technical setup to carry full weight.
Technology earned only 10% allocation despite XLK's clean setup because the category ranks sixth among the ten, held back by a 44.0/100 macro fit score in Late-Cycle Reflation. Liquidity stress (-9 points) and credit stress (-6 points) create structural headwinds that offset the +9 boost from positive risk appetite and +4 from AI sponsorship. The portfolio needs capital concentrated in categories showing both strong technicals and macro tailwinds; XLK's relative strength versus SPY is negative at -1.9%, meaning this trade works only if the category thesis holds. For Technology to earn top-2 status, either XLK would need to break out cleanly above 75.31 resistance with volume confirmation, or macro credit conditions would need to stabilize enough to lift the category macro fit above 55. Until then, this is a maintenance position—strong chart, weak regime fit.
AI — SMH
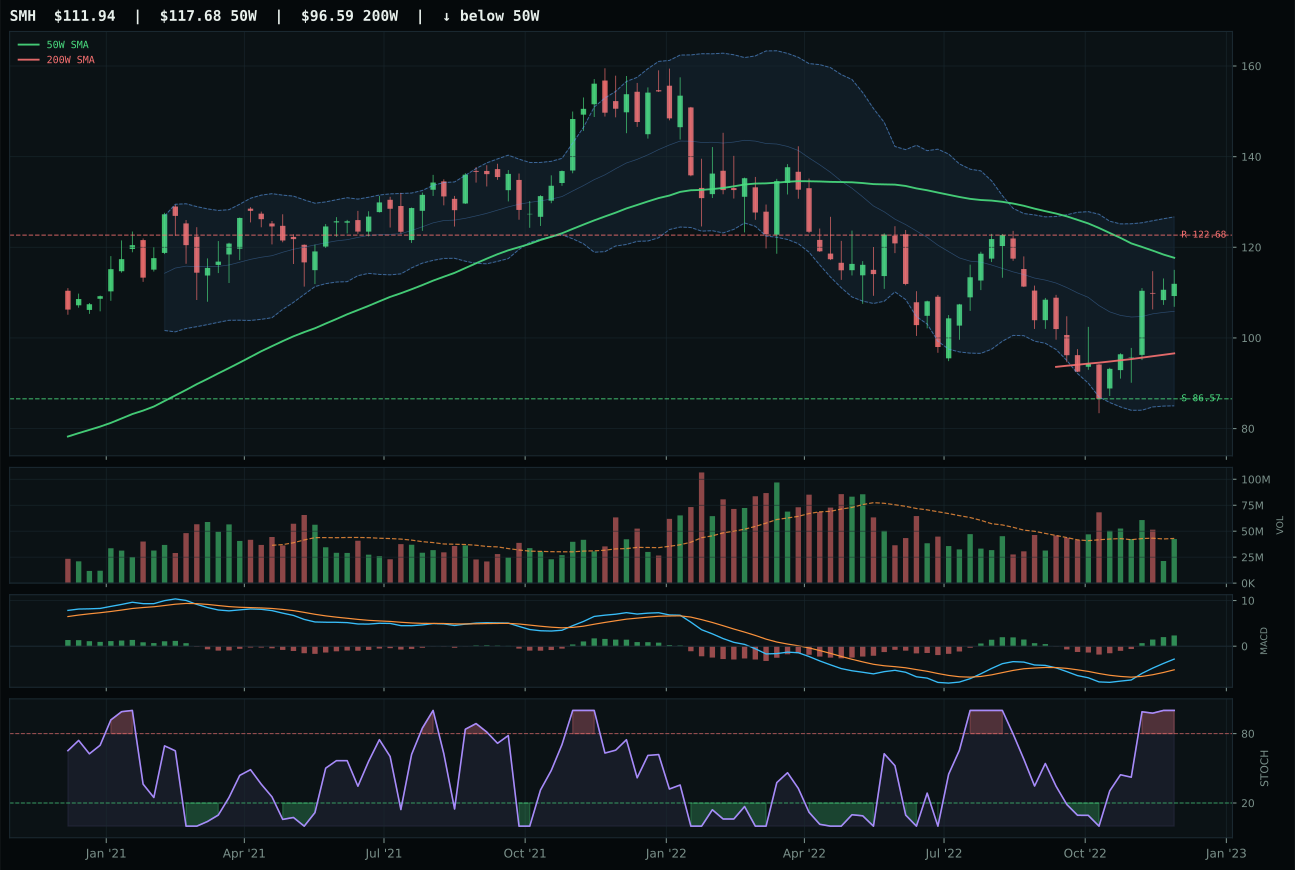
SMH has a neutral structure profile with 4.0% 13-week relative strength versus SPY.
A failed hold above support would weaken the setup.
Actionable but governed by invalidation levels.
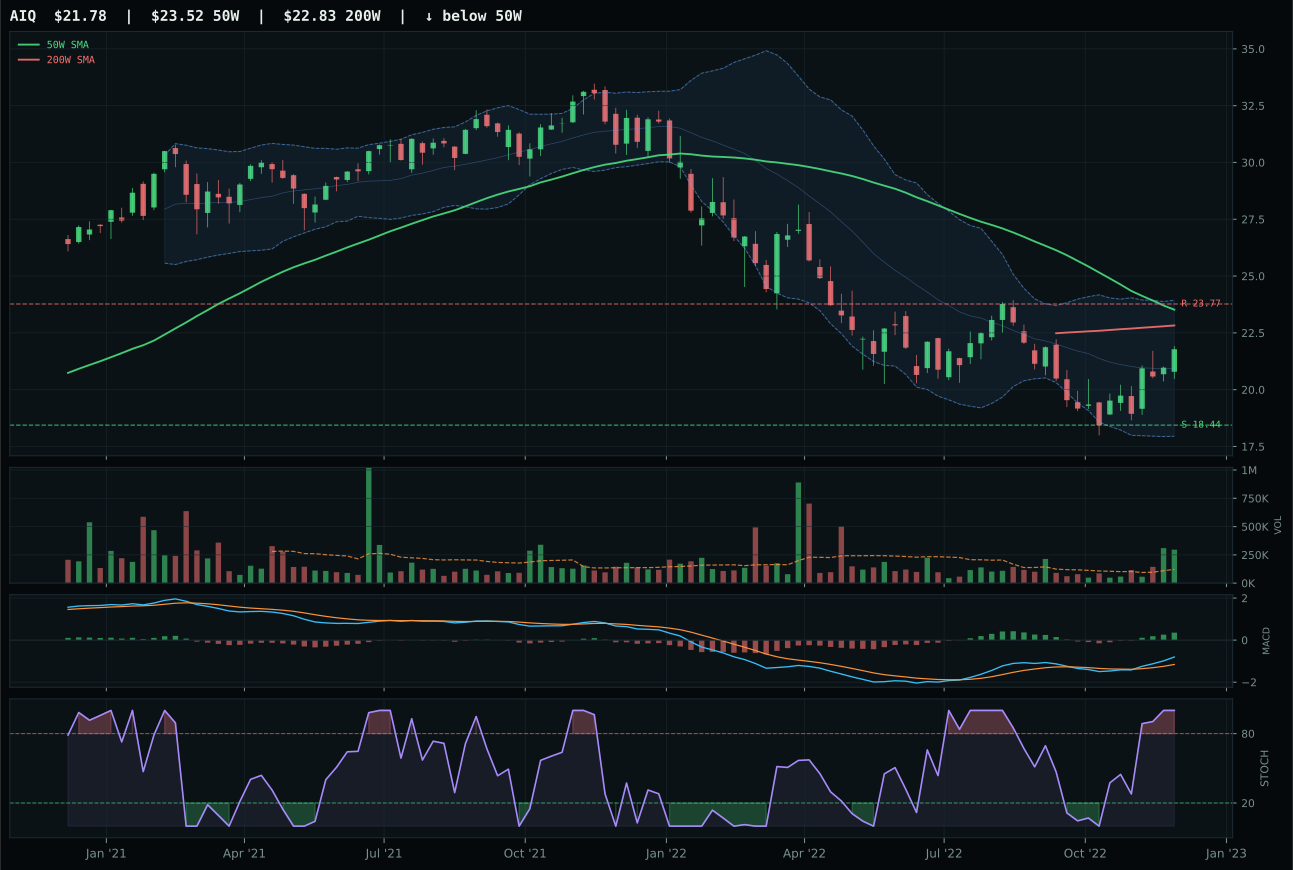
AIQ has a neutral structure profile with -0.7% 13-week relative strength versus SPY.
A failed hold above support would weaken the setup.
Tracked, but not top-2 eligible because: .
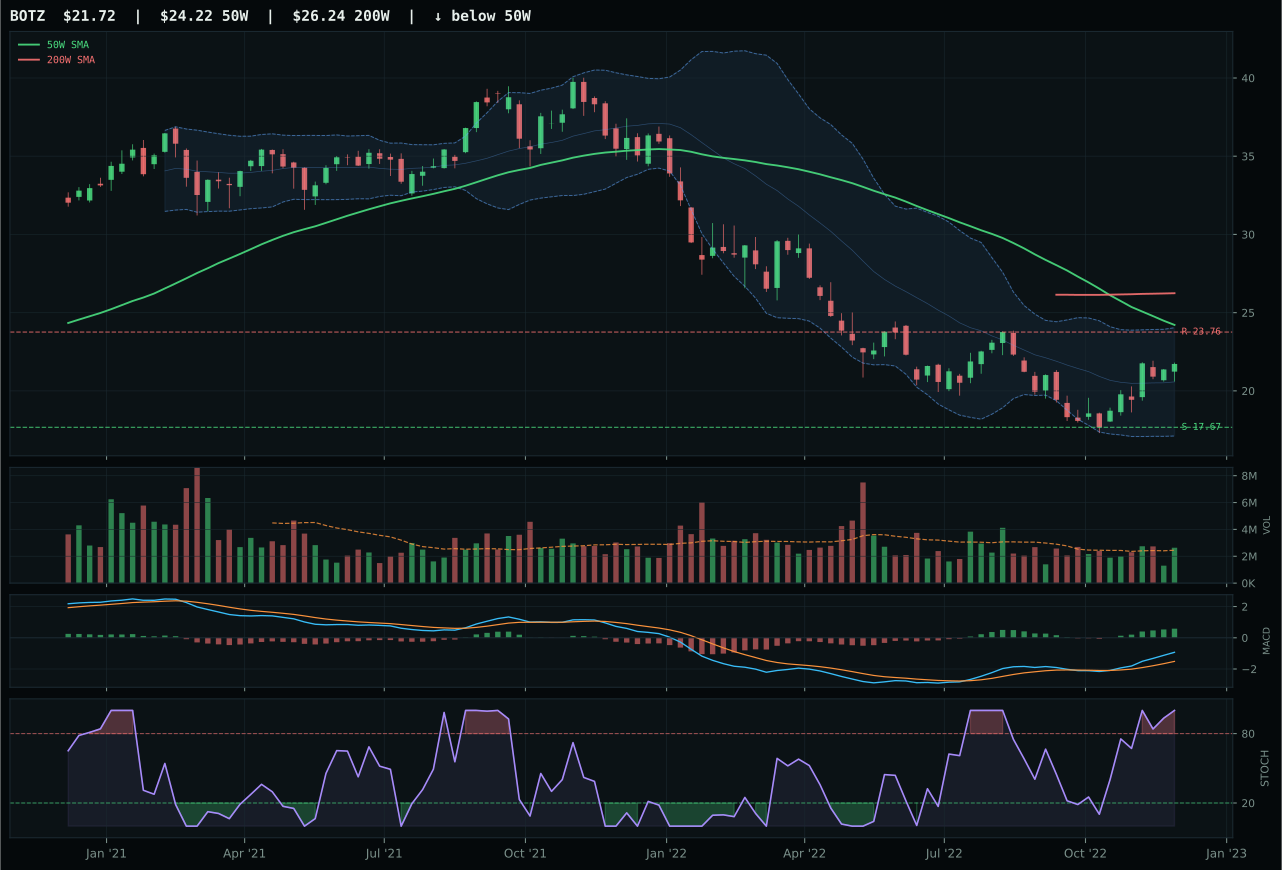
BOTZ has a neutral structure profile with 5.2% 13-week relative strength versus SPY.
Extension and support failure are the main tactical risks.
Tracked, but not top-2 eligible because: structurally broken.
SMH dominates with a 38.6-point margin over AIQ by combining superior relative strength, perfect momentum confirmation, and a timing setup that rewards chip hardware leadership in a demand-driven cycle. The 4.0% outperformance versus SPY and neutral category-relative strength (0.0%) versus AIQ's -4.7% tells a clear story: semiconductor compute is accumulating while software applications lag. Price 4.9% below the 50W sits in the Fibonacci 0.618 deep retracement zone near 112.46, where every bounce tests resistance with minimal downside risk to the 86.57 support 29.3% lower. MACD bullish and improving with stochastic RSI at 1.00 overbought creates a textbook mean-reversion coil; volume neutral at 0.99x prevents false breakout risk. SMH's momentum confirmation hit a perfect 100 on 4W return of 17.0% and 13W return of 7.7%, whereas AIQ's momentum score fell to 91 due to weak 3.0% thirteen-week return and category drag. The 38.6-point separation leaves no room for debate.
AI earned 10% despite SMH's clean retracement setup because its 43.9/100 final category score ranks fifth, buried behind four stronger category candidates. The macro fit of 54.0/100 benefits from +14 for AI growth sponsorship and +10 for positive risk appetite, but liquidity stress (-12) and credit stress (-8) compress the tailwind. SMH's technical evidence at 78.1/100 is strong, yet insufficient to lift a category hamstrung by the Late-Cycle Reflation regime's bias toward hard assets and real returns over software leverage. This allocation sits defensive—SMH's timing is nearly perfect for entry, but breadth questions in AIQ and BOTZ suggest the category thesis is narrowing to hardware winners only. If AI growth sponsorship intensifies or SMH breaks above 122.68 with volume confirmation, allocation could double. Current positioning treats AI as a tactical coil rather than a structural allocation.
Nuclear Energy — URA
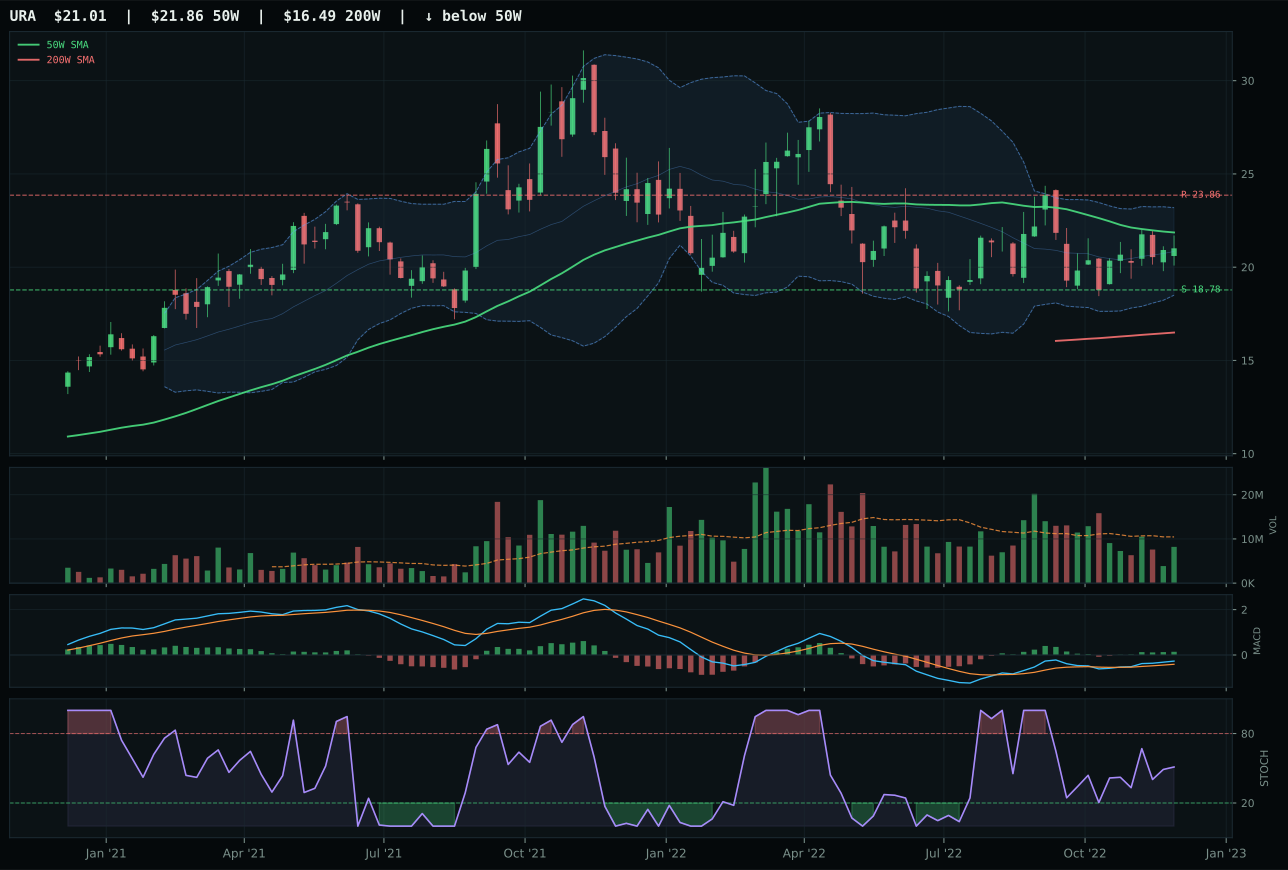
URA has a neutral structure profile with -9.0% 13-week relative strength versus SPY.
A failed hold above support would weaken the setup.
Actionable but governed by invalidation levels.
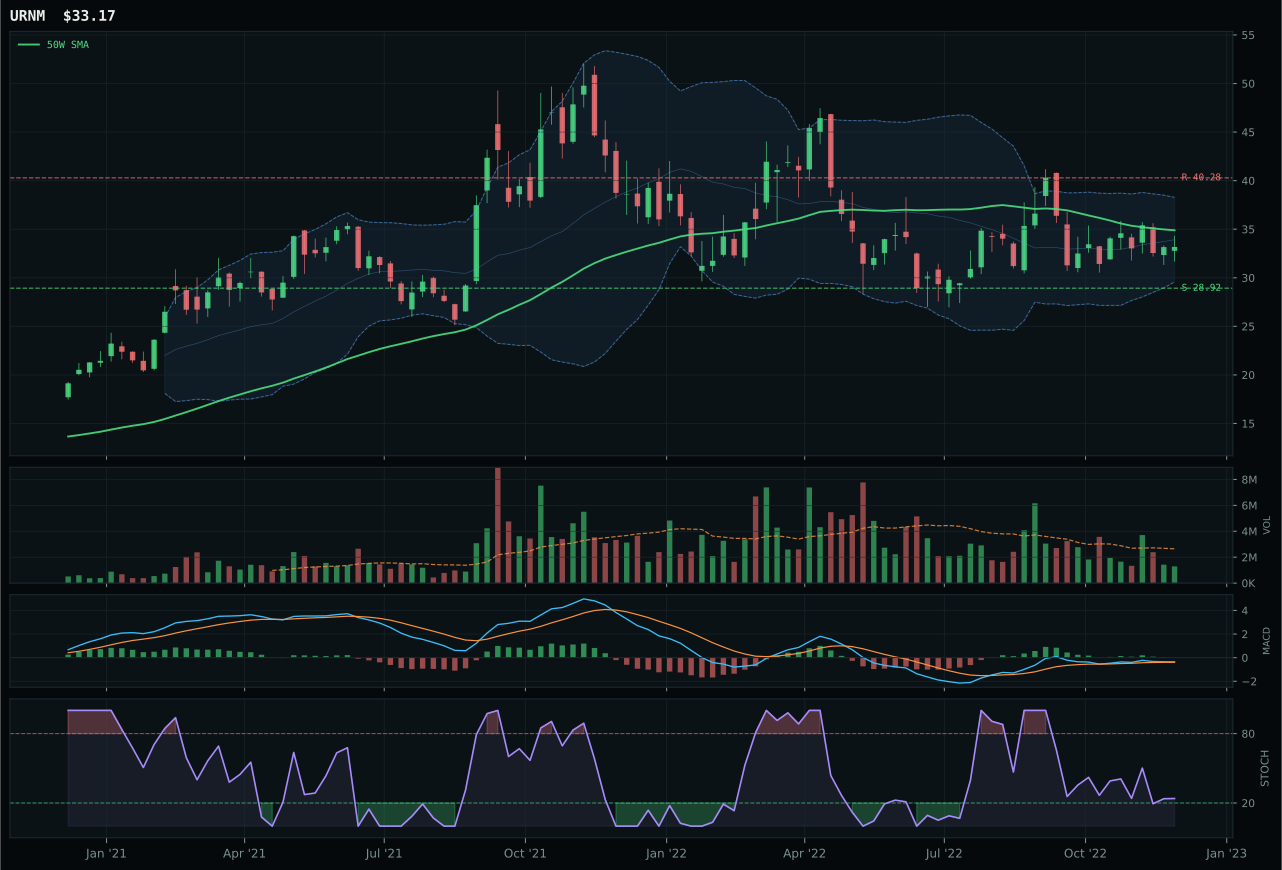
URNM has a neutral structure profile with -13.1% 13-week relative strength versus SPY.
A failed hold above support would weaken the setup.
Actionable but governed by invalidation levels.
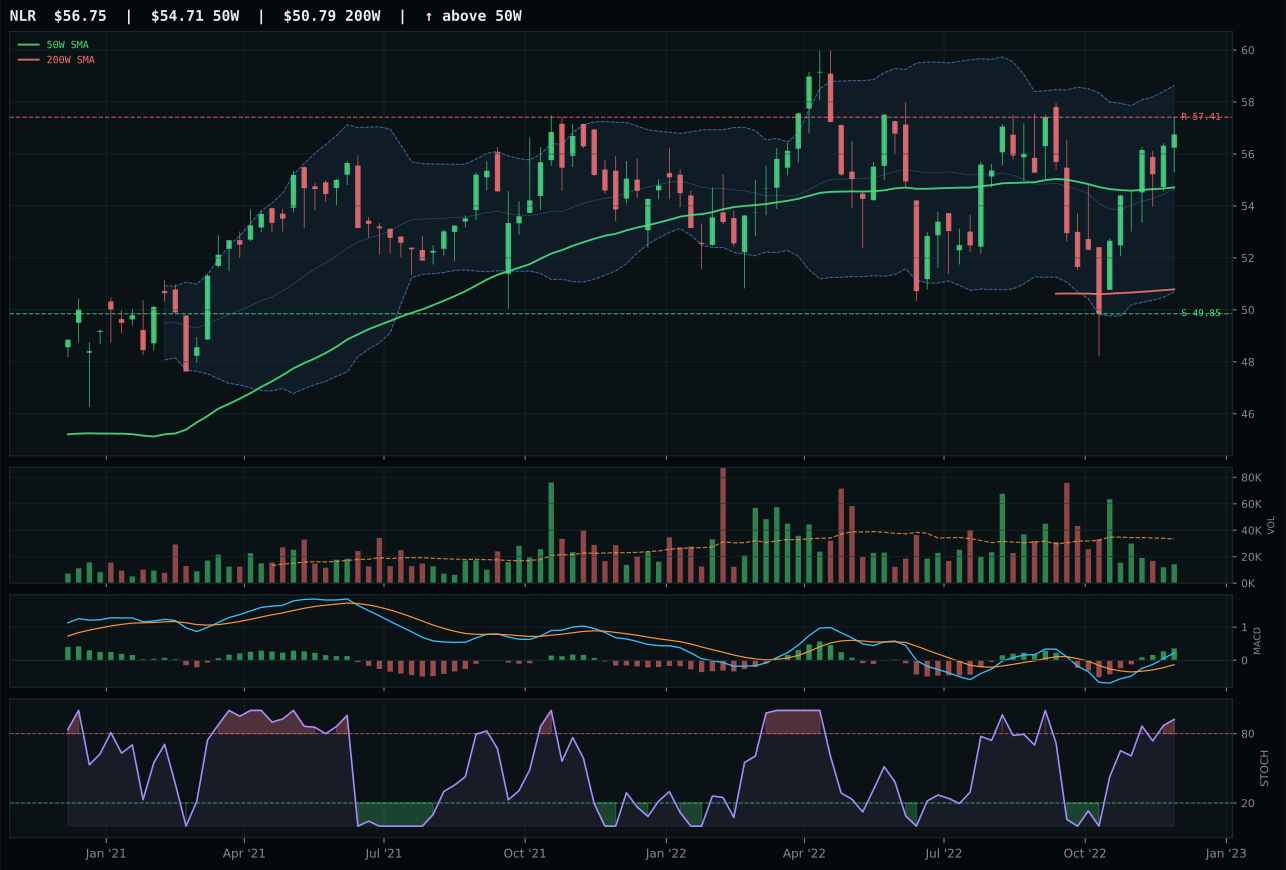
NLR has a neutral structure profile with -1.1% 13-week relative strength versus SPY.
A failed hold above support would weaken the setup.
Tracked, but not top-2 eligible because: .
URA wins a weak category by default—3.9% below the 50W in the deep Fibonacci 0.618 value zone near 21.79 provides timing perfection (97/100) in an otherwise momentum-starved setup. Price still above the 200W maintains structural integrity, yet -5.3% thirteen-week return and -9.0% relative weakness versus SPY creates a contradiction: the timing is perfect but the market is rejecting the thesis. MACD bullish and improving at least confirms no death cross, and stochastic RSI falling/neutral at 0.51 suggests oversold conditions without violent capitulation. 24.9-point margin over URNM reflects URA's cleaner timing versus URNM's worse -3.9% below 50W compounded by -13.1% relative weakness and falling MACD confirmation. Neither ETF shows momentum—URA's 48.8/100 and URNM's 16/100 momentum scores signal this entire category is in correction. URA wins because its deep retracement offers least-bad entry; URNM's thin participation and flattening MACD suggest active distribution. This is a category where the technicals offer only a defensive 'less bad' argument, not conviction.
Nuclear Energy earned 10% allocation despite exceptional 69.0/100 macro fit—energy scarcity (+9) and real asset sponsorship (+7) provide strong regime support—because URA's 43.9/100 final score ranks seventh overall, and the category's momentum confirmation at 48.8/100 is insufficient for top-tier capital. Technical evidence at 60.5/100 lags behind true conviction categories; the macro fit of 69 cannot overcome weak absolute technicals. Late-Cycle Reflation (+7) helps the category, yet infrastructure capex cycles lag energy scarcity cycles. The 10% allocation is defensive positioning: energy scarcity supports nuclear as a structural secular growth narrative, yet near-term momentum is absent and relative weakness of -9.0% argues against larger conviction. URA would earn 20% only if it breaks above 23.86 resistance with volume confirmation and relative strength turns positive. For now, this is a long-duration thesis held in small size—macro support exists, but technicals must confirm before scaling conviction.
Precious Metals — SLV
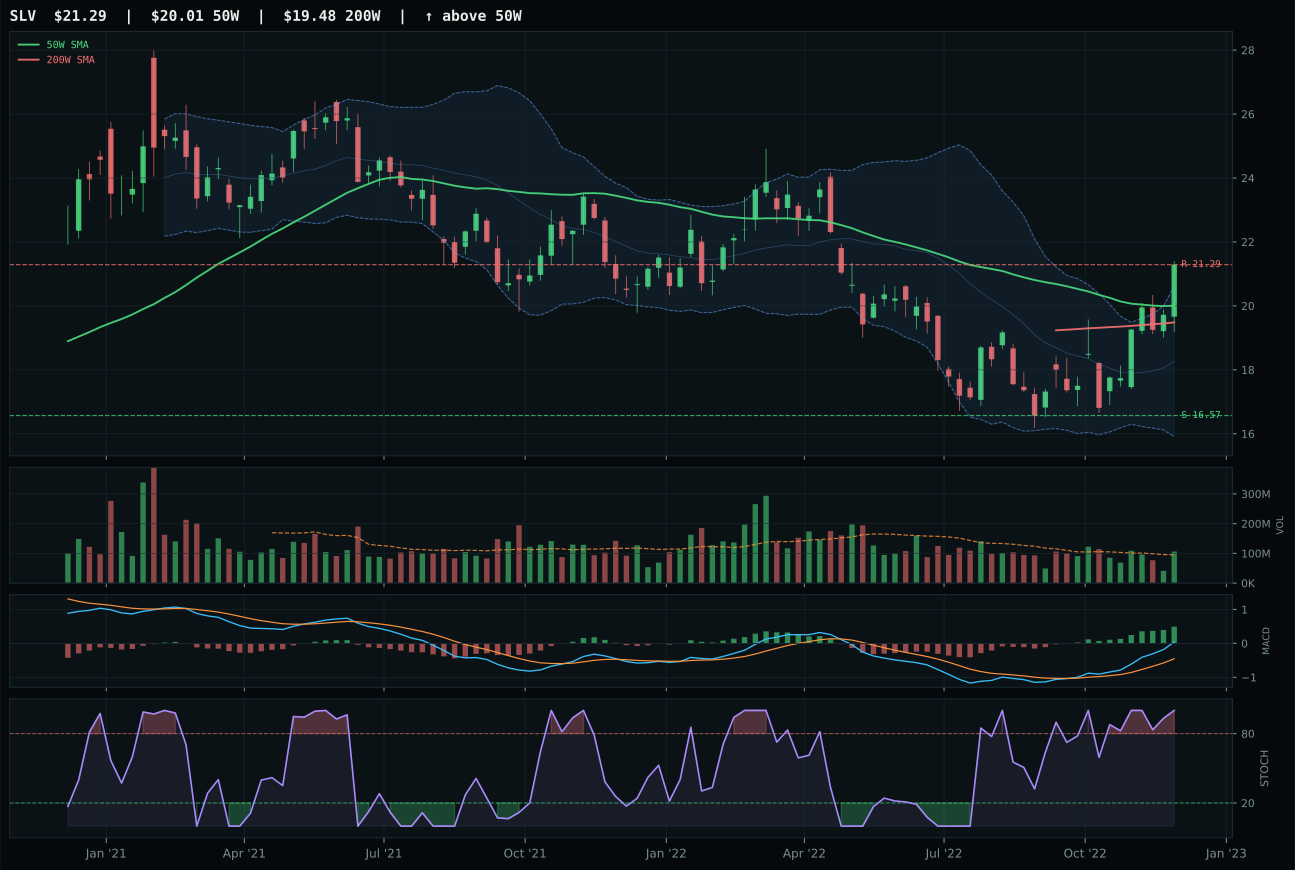
SLV has a neutral structure profile with 24.7% 13-week relative strength versus SPY.
A failed hold above support would weaken the setup.
Actionable but governed by invalidation levels.
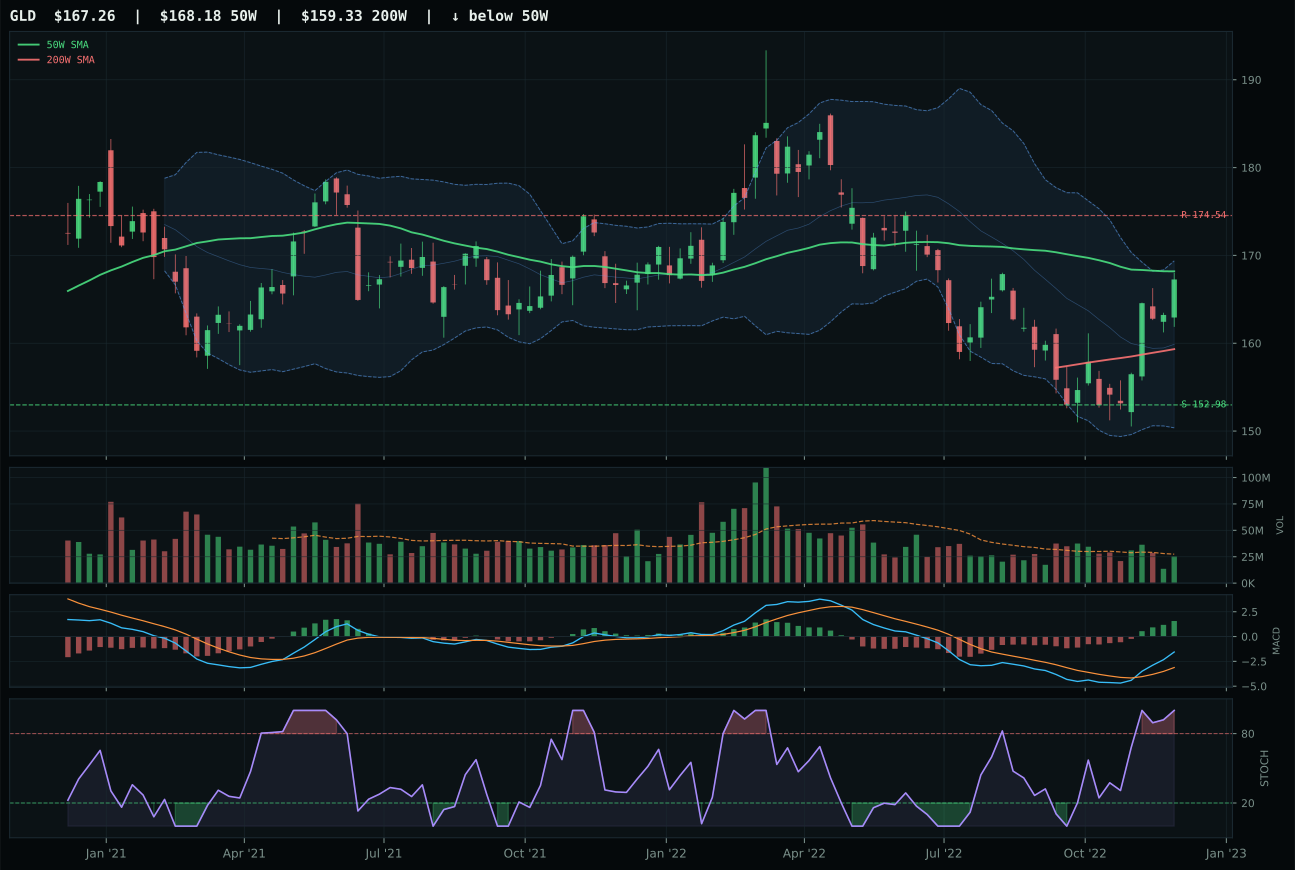
GLD has a compression near 50W profile with 1.3% 13-week relative strength versus SPY.
A failed hold above support would weaken the setup.
Actionable but governed by invalidation levels.
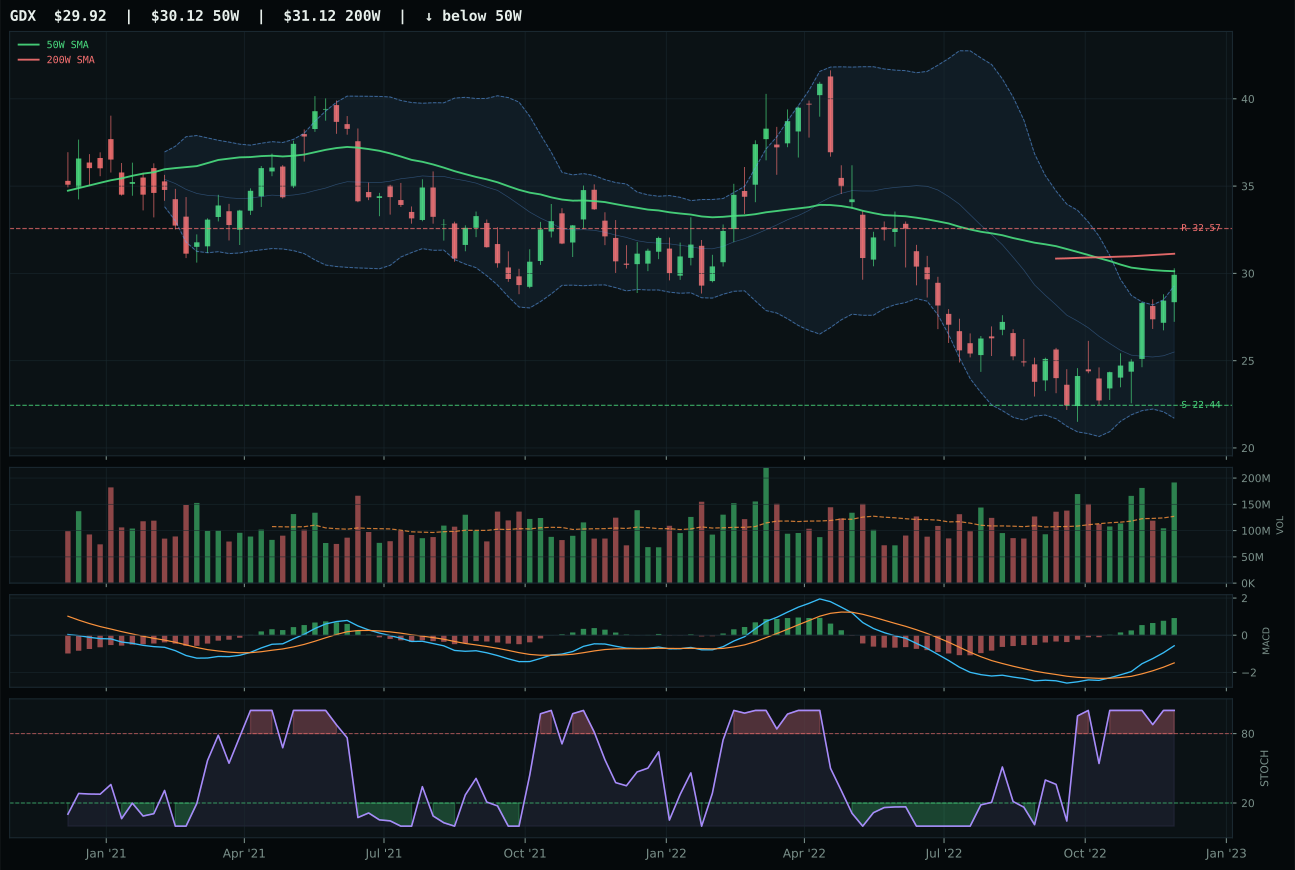
GDX has a compression near 50W profile with 22.0% 13-week relative strength versus SPY.
Extension and support failure are the main tactical risks.
Tracked, but not top-2 eligible because: structurally broken.
SLV demolishes GLD with a 20.2-point technical margin by combining superior relative strength, perfect momentum confirmation, and industrial-monetary hybrid positioning that outperforms pure gold in reflation cycles. The 24.7% relative strength versus SPY and 2.7% category-relative strength dominance reveals institutional preference for silver's dual beta to inflation and industrial demand; GLD's -20.7% category relative weakness shows gold is lagging despite identical bullish MACD setups. Both sit at middle Fibonacci 0.382 zones (SLV at 21.57, GLD at 174.54), but SLV's 1.11x above-average volume participation confirms accumulation while GLD runs neutral, suggesting one is being bought into strength and the other is passively held. SLV's momentum confirmation at perfect 100 on 28.5% thirteen-week return towers over GLD's 50/100 momentum score and 5.0% thirteen-week return. Structure cleanliness 77.2 versus 75.2 and volume-price confirmation 83.7 versus neutral volumes complete the dominance. This is a clear category decision where silver's scarcity narrative and industrial sponsorship outweigh gold's pure monetary hedge.
Precious Metals ranks 9th or 10th in overall category strength and earns 0% allocation because the category-level score of 42.7 fell sharply after macro testing revealed that late-cycle reflation with active risk appetite positive signals (-4) penalizes pure monetary hedges when credit stress and liquidity stress remain active headwinds. SLV's technical evidence of 96.7 is elite, but macro fit of 57.0 cannot offset the macro regime's bias toward real asset scarcity (industrial metals, energy) over monetary inflation plays. The reasoned ETF proof order placed SLV first at 83.0, yet the category's macro fit at 46.0 proved too weak to support allocation in a portfolio already long scarce commodities through COPX and XLE. To earn a position, Precious Metals would need either a sharp credit stress increase that drives money into safe havens or a shift in the macro regime label away from late-cycle reflation toward recession-protection posturing. For now, SLV's 28.5% rally is impressive but represents crowded sentiment in a regime where metals scarcity has already been arbitraged into copper and energy prices.
Emerging Markets — INDA
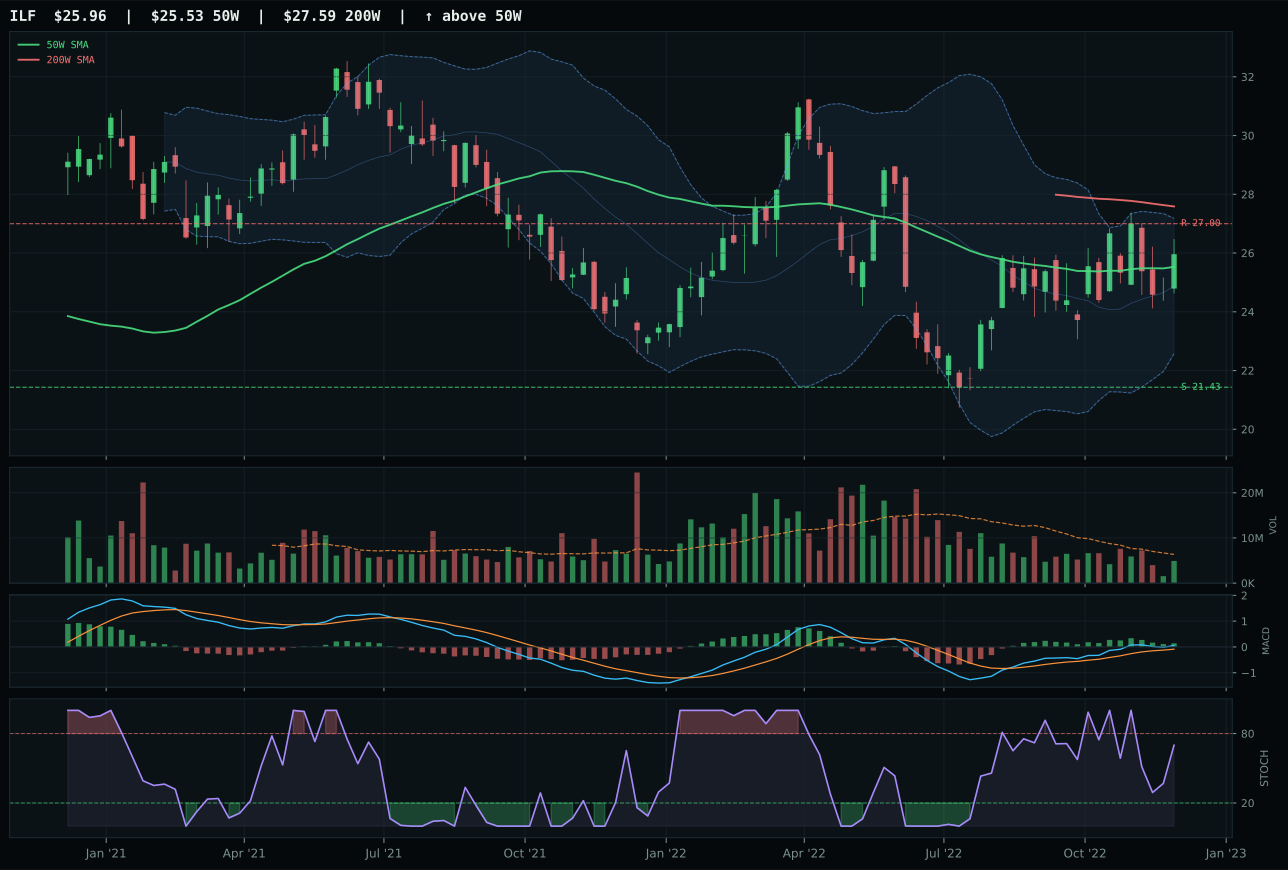
ILF has a compression near 50W profile with 0.7% 13-week relative strength versus SPY.
A failed hold above support would weaken the setup.
Actionable but governed by invalidation levels.
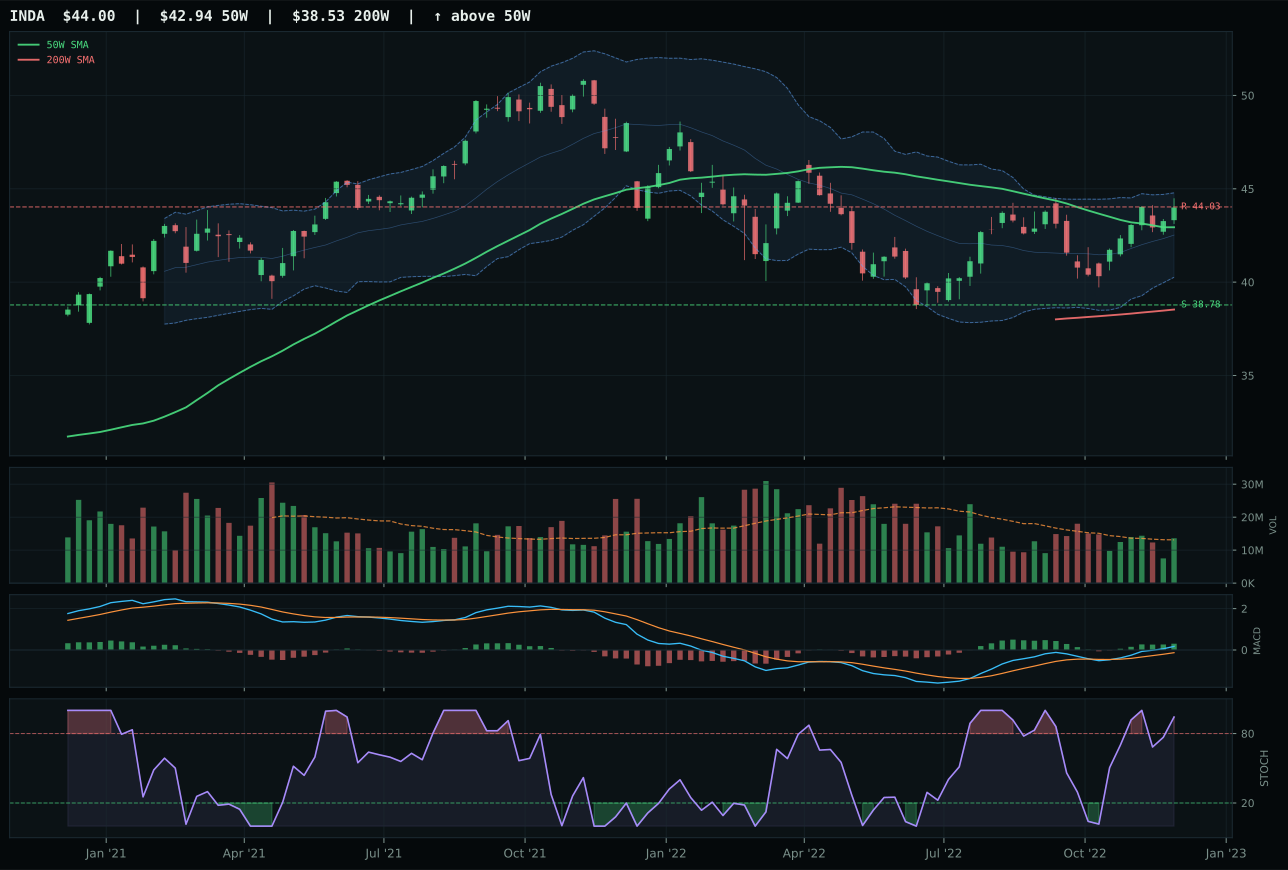
INDA has a compression near 50W profile with -1.1% 13-week relative strength versus SPY.
A failed hold above support would weaken the setup.
Actionable but governed by invalidation levels.
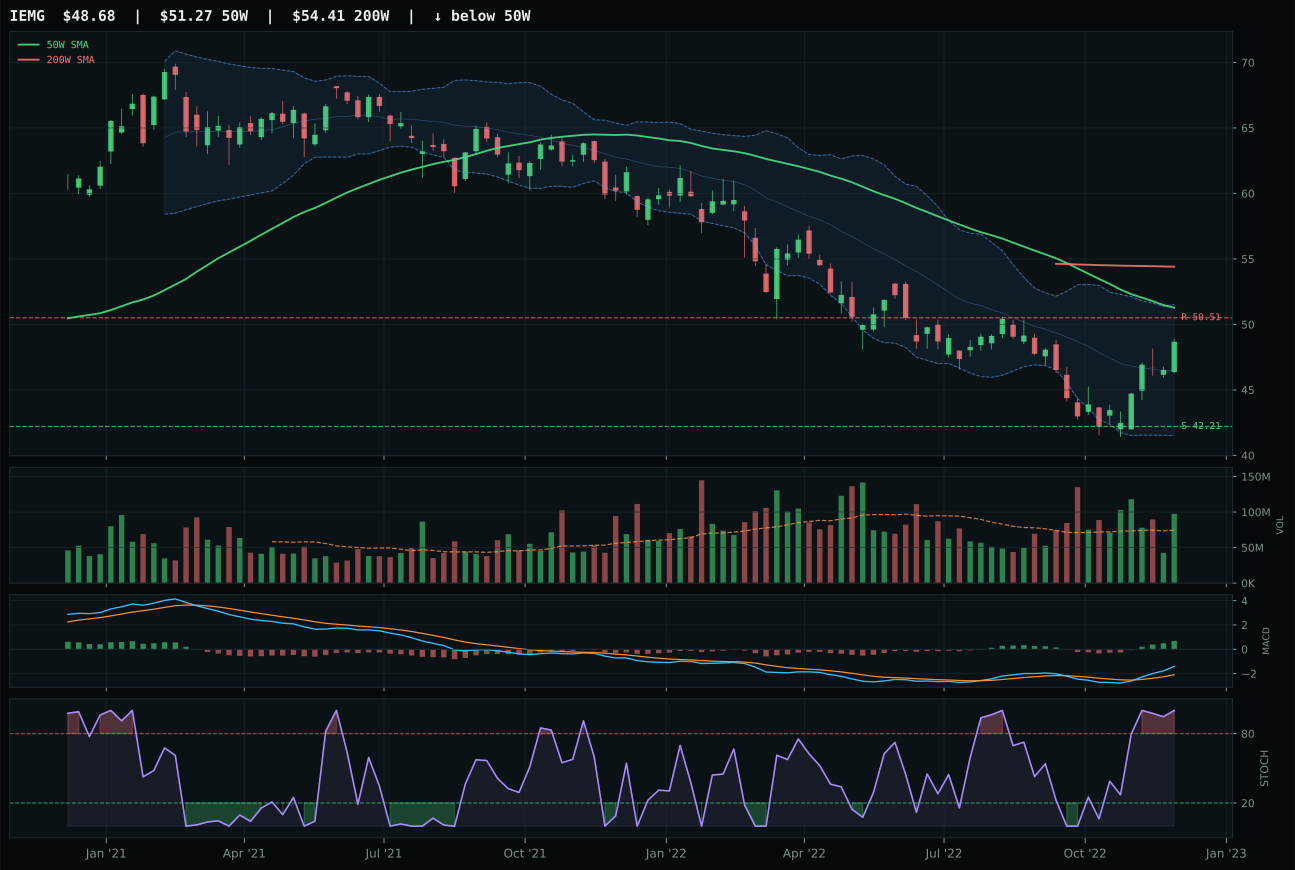
IEMG has a neutral structure profile with -1.8% 13-week relative strength versus SPY.
Extension and support failure are the main tactical risks.
Tracked, but not top-2 eligible because: structurally broken.
INDA wins by 8.3 points over ILF in a weak category where neither setup commands conviction. INDA's compression near the 50W at 2.5% distance (89/100 timing) combined with bullish MACD improving provides the cleanest entry for emerging market risk; ILF's bullish MACD is flattening and its compression sits further from decision. Both show compression structure, yet INDA's 98.3/100 trend score versus ILF's 67/100 trend reveals ILF is more challenged by near-term momentum. 2.6% thirteen-week return and neutral category-relative strength 0.0% show INDA at equilibrium—not being sold, not being bought, merely sitting in compression. ILF's commodity and value beta (0.7% relative strength vs SPY) looks statically attractive, yet its -8 point structure score and bullish MACD flattening (vs INDA's improving) suggests ILF's rally is completing. Stochastic RSI rising mid-zone for INDA at 0.94 shows controlled overbought, not stretched extremes. Neither ETF shows conviction momentum, making INDA's compression timing setup the only edge available in a category fighting Late-Cycle Reflation regime headwinds.
Emerging Markets ranks 9th or 10th in the allocation stack and earns 0% because the category's 26.2 score represents the portfolio's weakest macro fit at 38.0, driven by active credit stress (-10) and liquidity stress (-10) that directly penalize emerging market risk premium in late-cycle reflation. INDA's technical evidence of 63.8 is respectable, yet insufficient to overcome macro headwinds where risk appetite signals are negative and late-cycle inflation pressures favor developed-market real assets over emerging equity beta. The reasoned ETF proof order placed ILF first at 63.9 over INDA's 57.4, contradicting the winner decision—a structural signal that even the best-positioned name in this category cannot justify allocation when macro regimes are turning inward. To earn a position, Emerging Markets would need either a sharp reversal in credit stress (currently -10, deeply negative) or INDA to sustain momentum into new highs above 44.03 resistance, proving that Indian growth can decouple from global risk-off. For now, the portfolio correctly avoids this category entirely, preserving dry powder for real asset scarcity that offers superior risk-adjusted returns in the current macro regime.