
2022-11-25
Informational purposes only. The content in this report, including allocations, analysis, and commentary, is provided solely for informational and educational purposes. It does not constitute financial advice, investment advice, trading advice, or any other type of advice. Past performance does not guarantee future results. Always conduct your own research and consult a qualified financial professional before making investment decisions.
Weekly Allocation
| Ticker | Category | Weight | Role |
|---|---|---|---|
| XLE | Traditional Energy | 20% | Top-2 (20%) |
| IGF | Utilities & Infrastructure | 20% | Top-2 (20%) |
| ITA | Defense & Aerospace | 10% | Tier-2 (10%) |
| MOO | Agriculture & Livestock | 10% | Tier-2 (10%) |
| COPX | Industrial Metals | 10% | Tier-2 (10%) |
| GLD | Precious Metals | 10% | Tier-2 (10%) |
| URA | Nuclear Energy | 10% | Tier-2 (10%) |
| XLK | Technology | 10% | Tier-2 (10%) |
Trade Instructions — Monday Open
Sell the tranche from 2022-10-28 (completing its 4-week hold). Buy the new tranche. Instructions show net portfolio changes — same-asset positions cancel, weight changes show the delta.
| Action | Ticker | Instruction |
|---|---|---|
| SELL | XLE | Sell 25% of XLE position (reduce 40.00% → 30.00%) |
| SELL | PAVE | Sell 25% of PAVE position (reduce 5.00% → 3.75%) |
| SELL | URNM | Sell entire URNM position (1.25% of portfolio) |
| BUY | MOO | Buy MOO — 10.00% of freed cash (adds 1.25% to portfolio) |
| BUY | COPX | Buy COPX — 10.00% of freed cash (adds 1.25% to portfolio) |
| BUY | GLD | Buy GLD — 10.00% of freed cash (adds 1.25% to portfolio) |
| BUY | XLK | Buy XLK — 10.00% of freed cash (adds 1.25% to portfolio) |
| BUY | URA | Buy URA — 20.00% of freed cash (adds 2.50% to portfolio) |
| BUY | IGF | Buy IGF — 40.00% of freed cash (adds 5.00% to portfolio) |
Current Portfolio After Trade
Combined holdings across all 4 active tranches. Each tranche is 25% of the portfolio.
| Ticker | % of Portfolio | Weight Bar |
|---|---|---|
| XLE | 30.00% | |
| COPX | 12.50% | |
| GLD | 8.75% | |
| URA | 8.75% | |
| XLK | 7.50% | |
| XAR | 5.00% | |
| VEGI | 5.00% | |
| IGF | 5.00% | |
| ITA | 3.75% | |
| MOO | 3.75% | |
| PAVE | 3.75% | |
| REMX | 2.50% | |
| XLU | 2.50% | |
| ILF | 1.25% |
Macro Regime — Late-Cycle Reflation
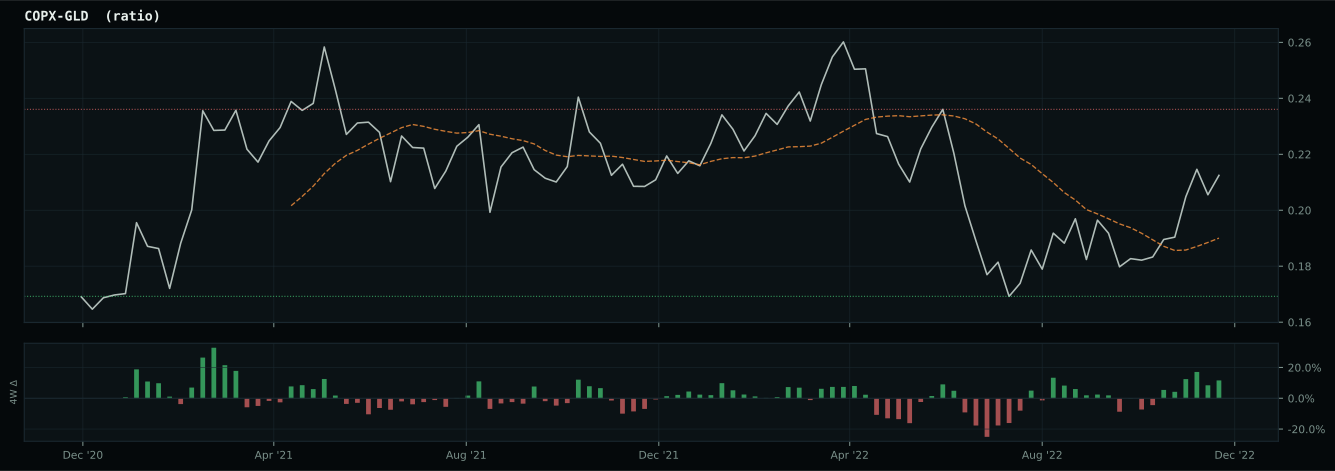
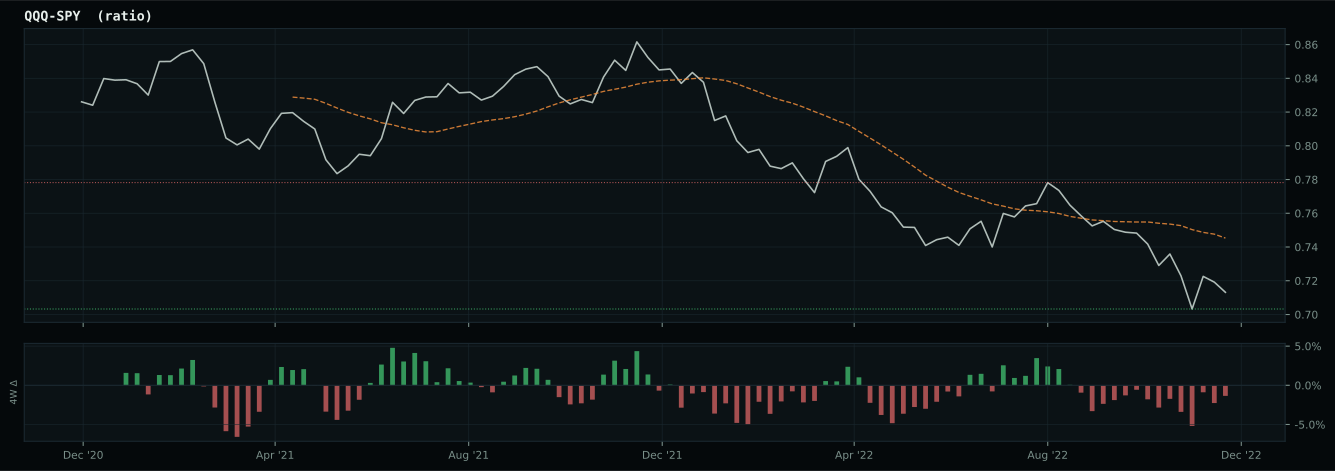
Macro Evidence Charts
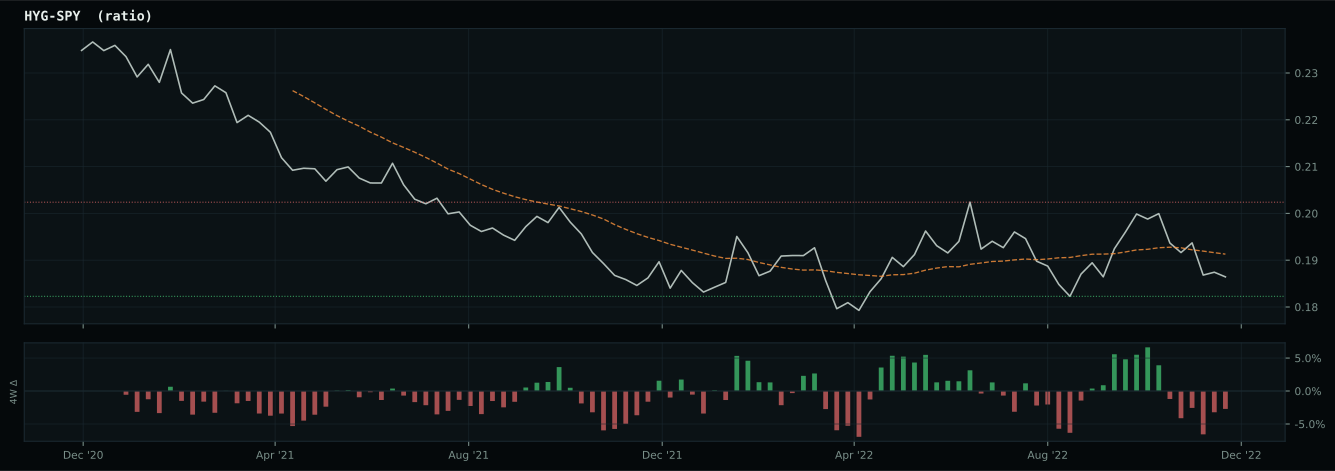
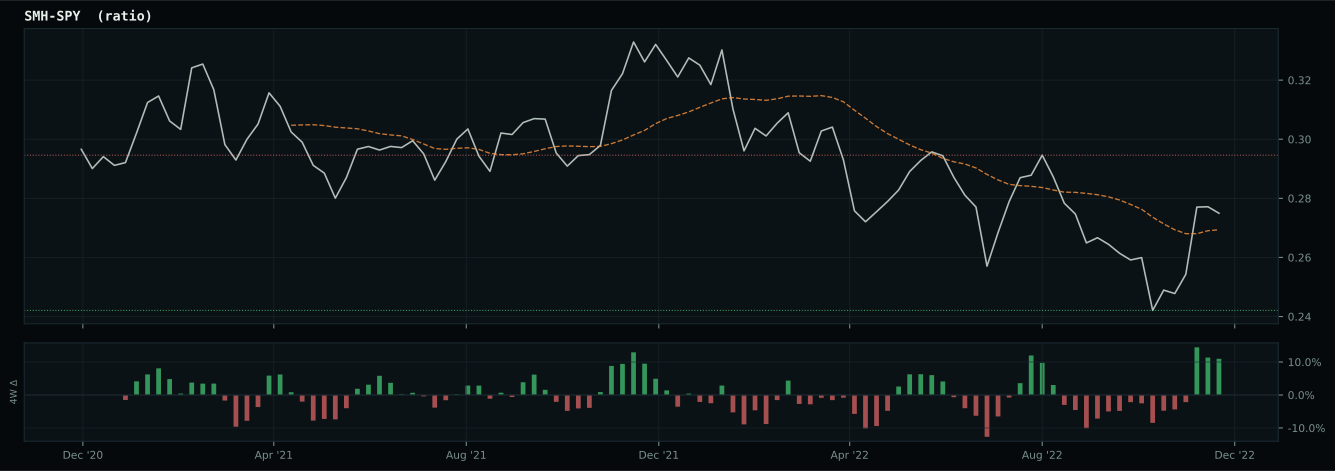
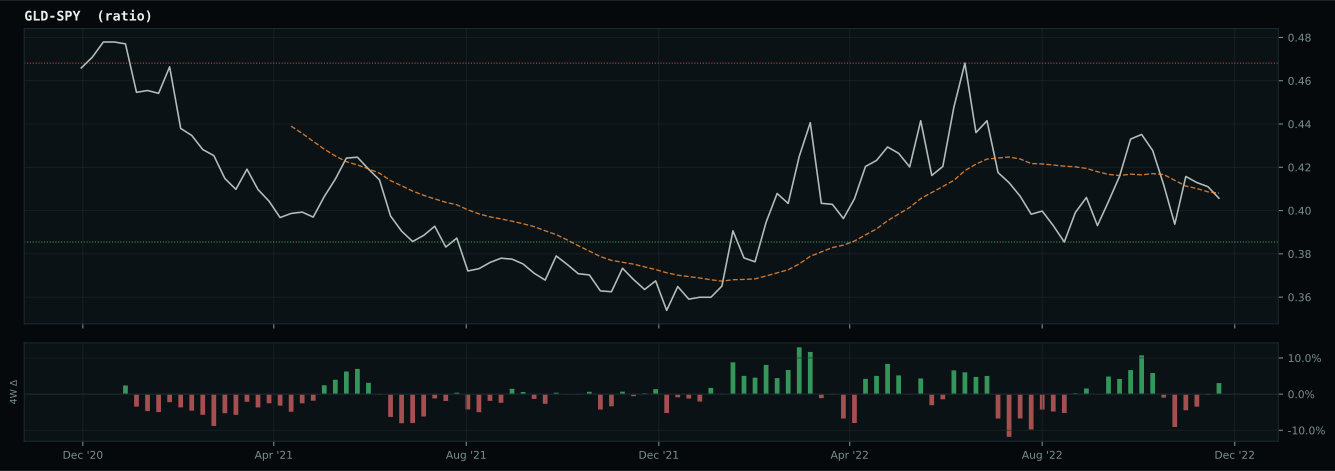
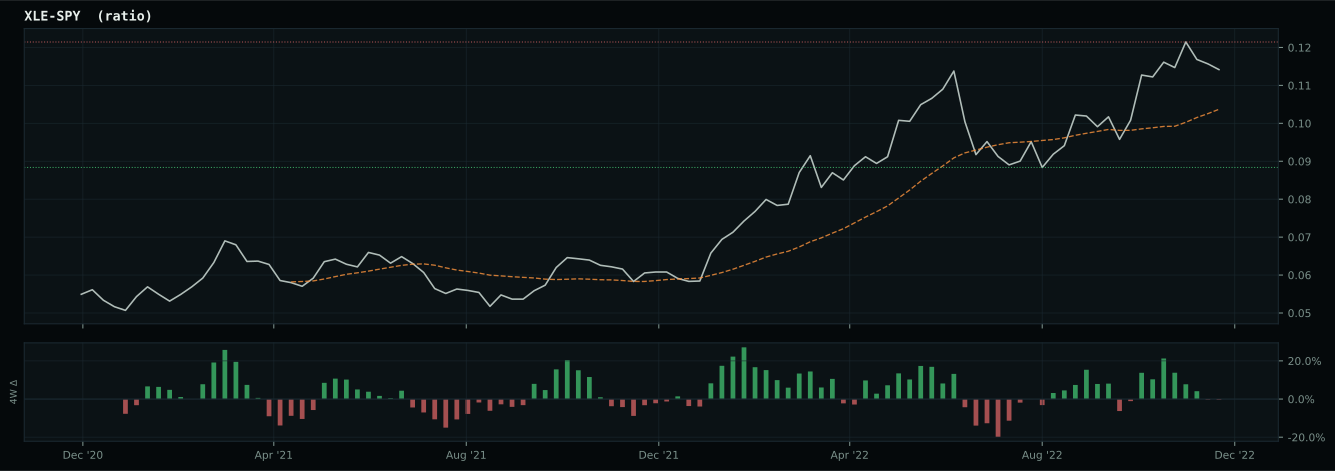
Market-implied signals behind the macro regime scores. Each ratio compares two assets; the direction and slope of the ratio is what the macro engine reads.
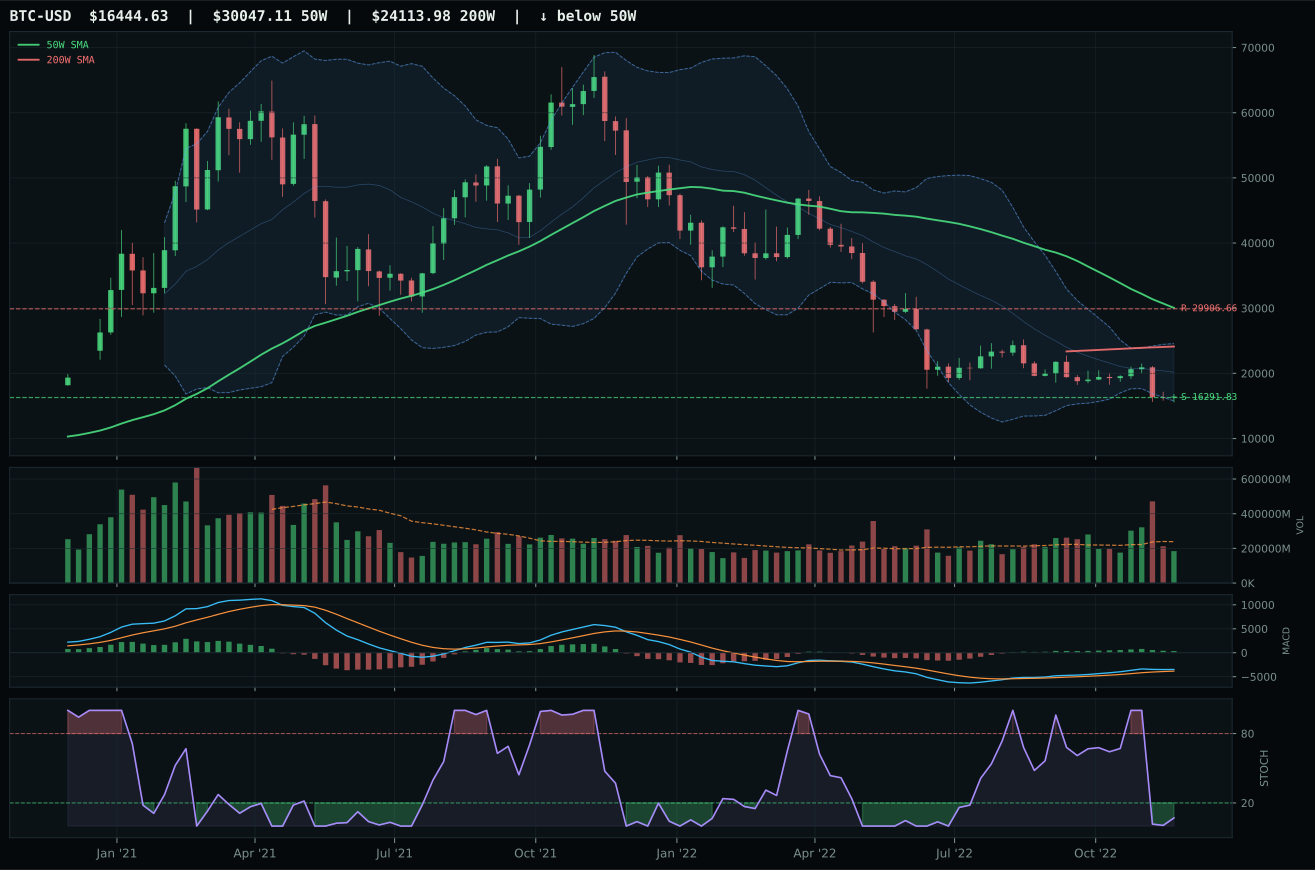
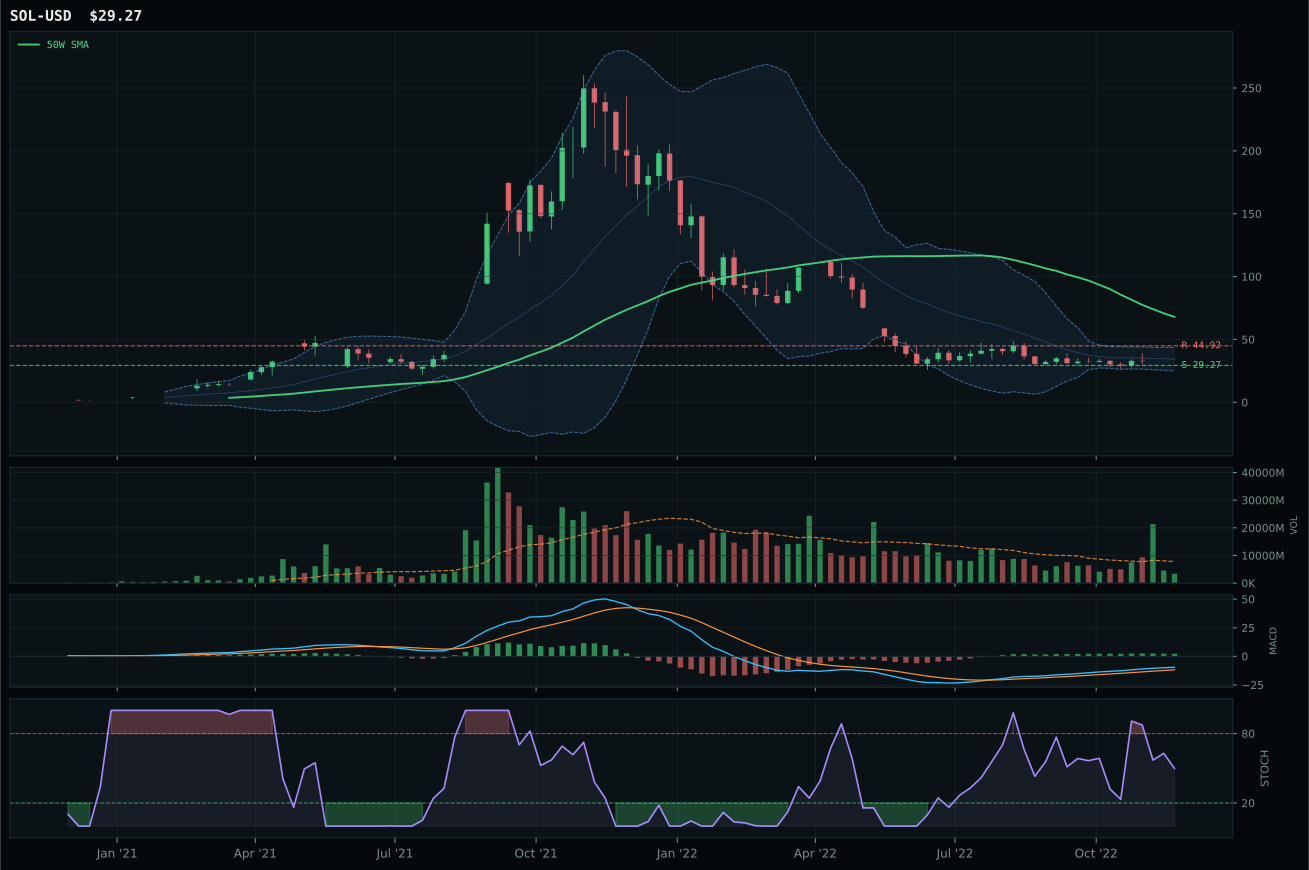
Crypto Regime — NoCrypto
ValueBTC armed; waiting for 50W reclaim, decisive close above post-touch range resistance by 3%, close above 200W, breakout volume above 20W…
TrendBTC not confirmed
one or more available conditions failed
Category Rankings
| Rank | Category | Winner | Score | Alloc | 4W Ret | Peers (4W) |
|---|---|---|---|---|---|---|
| 1 | Traditional Energy | XLE | 74.5 | 20% | -2.43% | FCG -5.7% · XOP -7.8% |
| 2 | Utilities & Infrastructure | IGF | 66.0 | 20% | -1.84% | PAVE -2.9% · XLU +0.9% |
| 3 | Defense & Aerospace | ITA | 63.4 | 10% | +0.43% | XAR -0.3% · ROKT +0.4% |
| 4 | Agriculture & Livestock | MOO | 60.0 | 10% | -6.17% | VEGI -4.1% · WEAT -2.1% |
| 5 | Industrial Metals | COPX | 60.0 | 10% | +6.01% | PICK +1.1% · REMX -11.0% |
| 6 | Precious Metals | GLD | 47.7 | 10% | +3.04% | SLV +11.7% · GDX +2.6% |
| 7 | Nuclear Energy | URA | 42.9 | 10% | -3.11% | URNM -4.4% · NLR -2.6% |
| 8 | Technology | XLK | 29.8 | 10% | -6.00% | CIBR -6.3% · IGV -5.1% |
| 9 | AI | SMH | 18.8 | 0% | -7.52% | AIQ -3.7% · BOTZ -3.2% |
| 10 | Emerging Markets | INDA | 7.4 | 0% | -3.25% | IEMG +1.4% · ILF -7.2% |
Traditional Energy — XLE
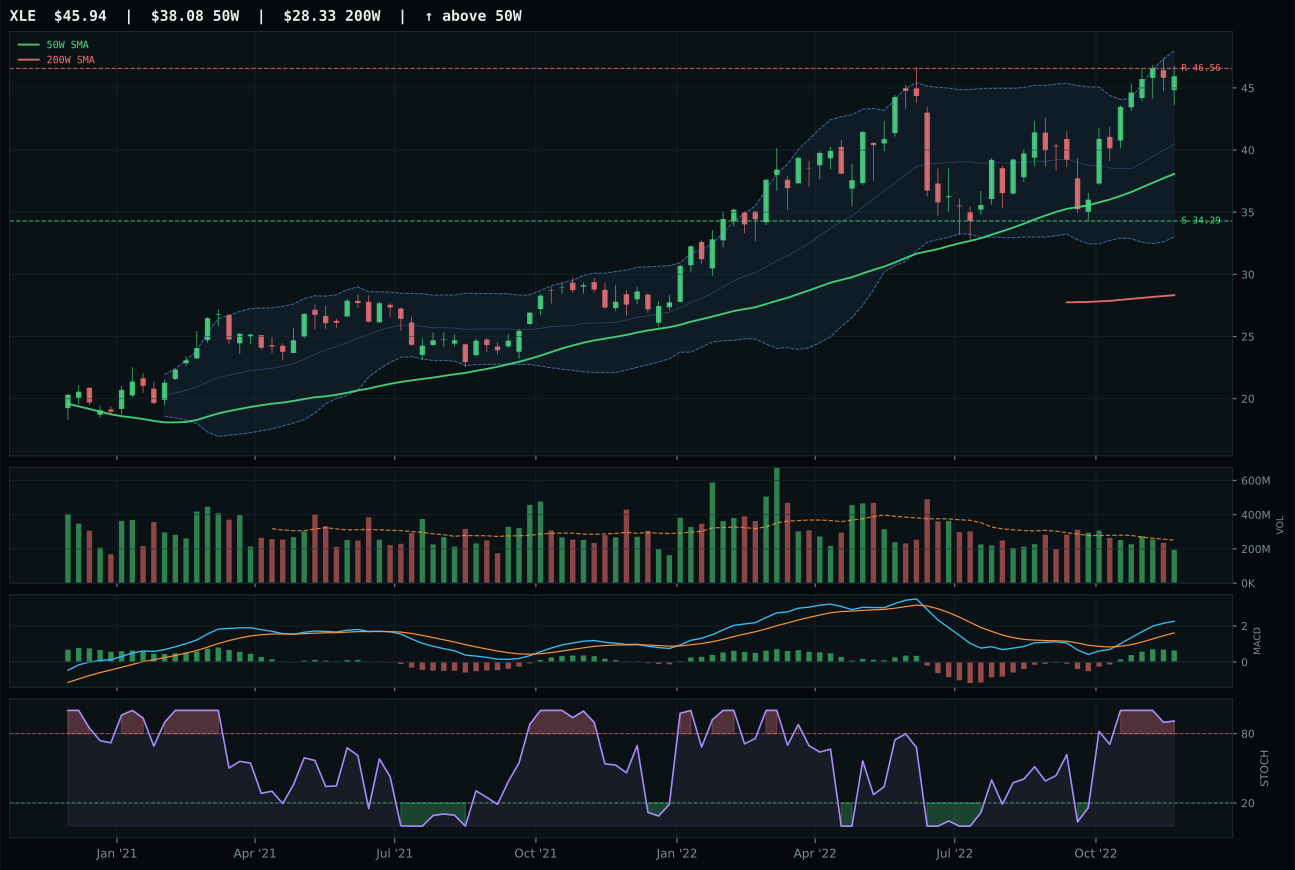
XLE has a vertical extension profile with 11.6% 13-week relative strength versus SPY.
A failed hold above support would weaken the setup.
Actionable but governed by invalidation levels.
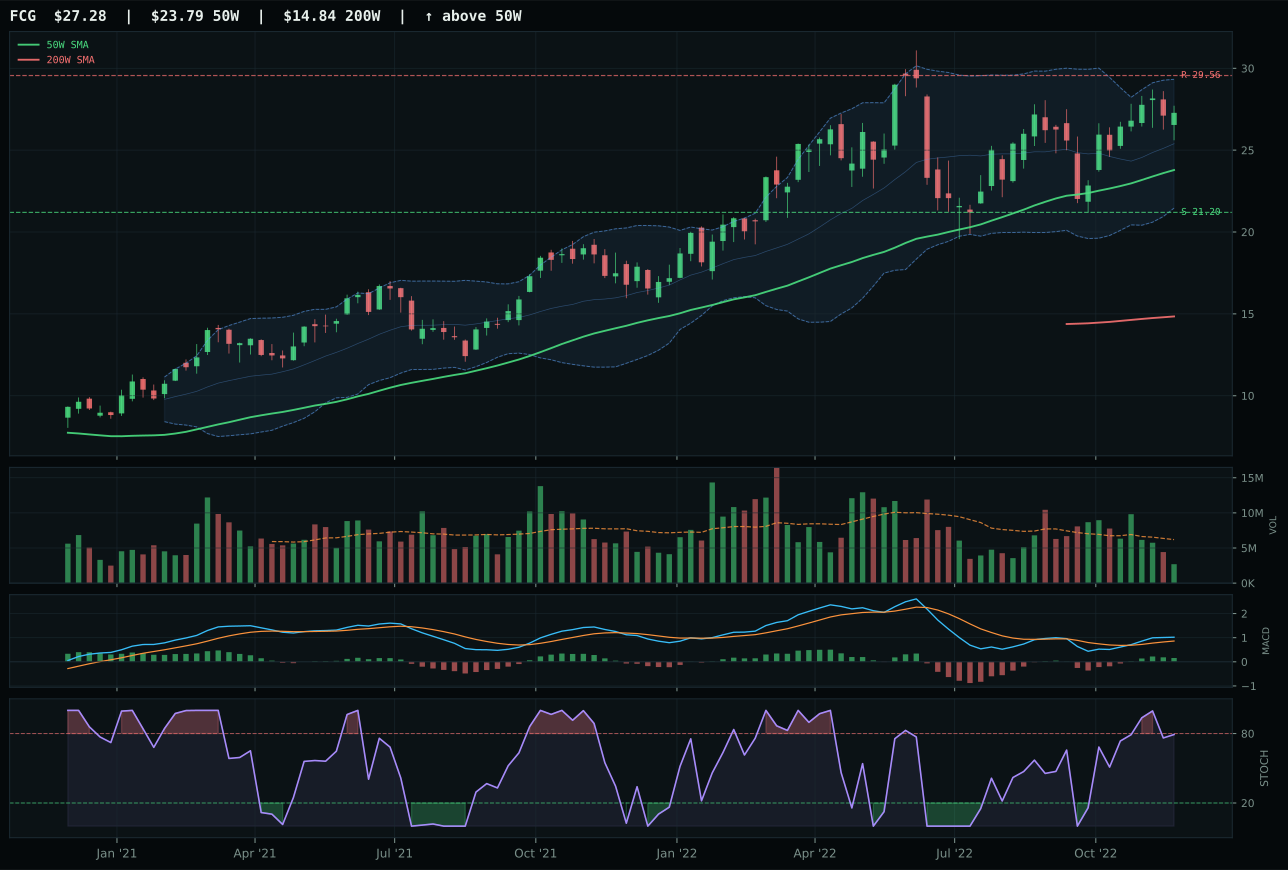
FCG has a neutral structure profile with 1.1% 13-week relative strength versus SPY.
A failed hold above support would weaken the setup.
Actionable but governed by invalidation levels.
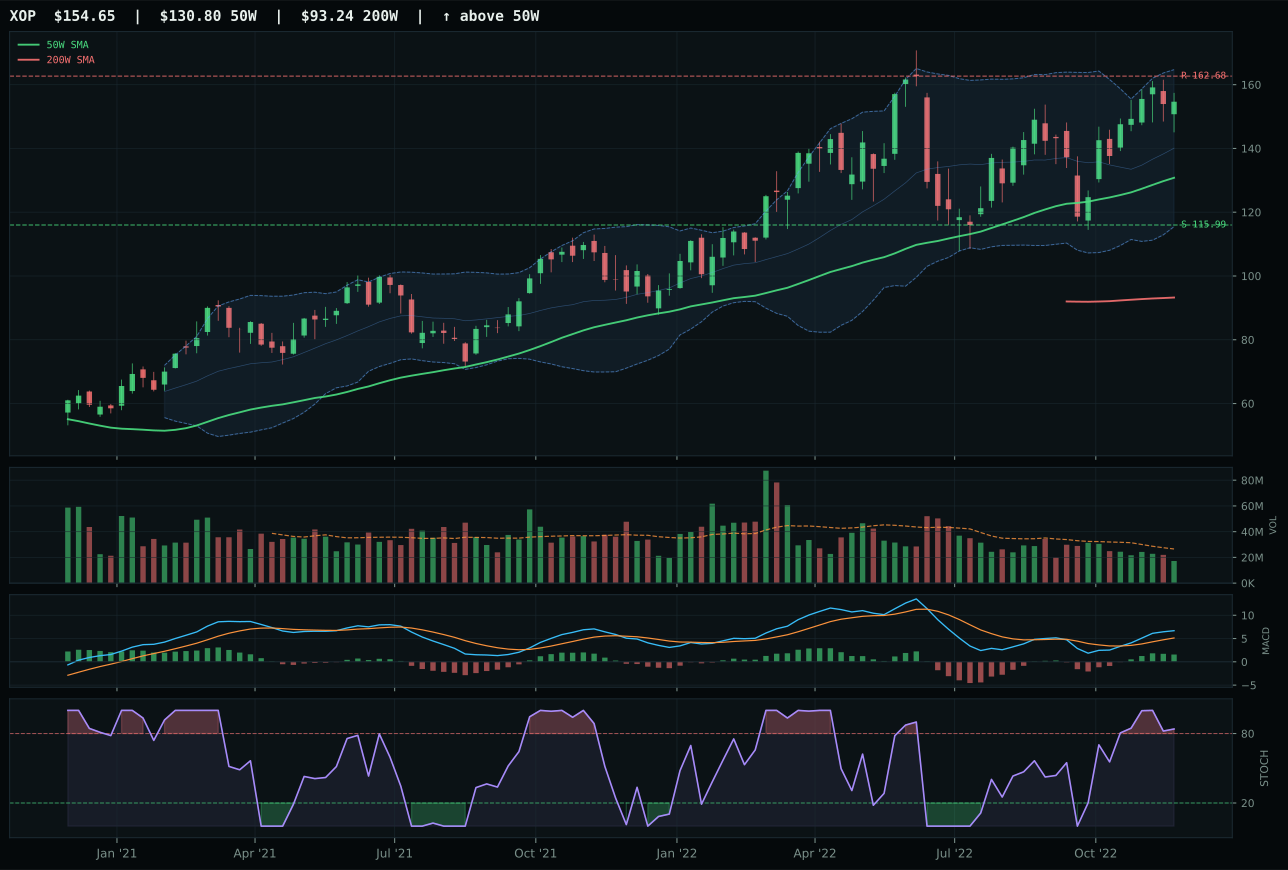
XOP has a vertical extension profile with 4.5% 13-week relative strength versus SPY.
A failed hold above support would weaken the setup.
Actionable but governed by invalidation levels.
XLE won the category decisively and earned its top-2 allocation slot with a 74.5 score, driven by perfect trend strength (100.0/100) and near-perfect momentum confirmation (99.5/100). Price trades 20.6% above the 50-day in vertical extension near 52-week highs, a setup that typically signals late-stage participation rather than early accumulation. Yet the 13-week return of 10.9% paired with 11.6% relative strength versus SPY proves that XLE is not a tired move but a structural repositioning into energy security. The 50-week slope at positive 0.9% shows acceleration, not deceleration. FCG lost despite posting 100/100 trend because it offered zero category-relative strength advantage (-3.4% vs 7.1%), meaning XLE's outperformance is real and justified. The setup is extended and risky, but the sponsorship is institutional.
Traditional Energy earned 20% because it posted the highest final category score of 74.5 and carries the strongest macro fit at 90.0/100. Energy scarcity is the most active single macro descriptor (+16), supply shortage is live (+9), and inflation pressure remains entrenched (+10). Late-cycle reflation explicitly supports energy exposure (+12), making this category the core tactical view. XLE's 20.6% extension above the 50-day creates entry risk for new capital, but the extended position reflects institutional conviction that energy will persist as a portfolio ballast through the cycle. The volume at 0.78x (neutral participation) is concerning—the move has already attracted most opportunistic buyers—but that constraint also means forced liquidations are unlikely. This is a defensive growth holding: energy dividends provide income in a late-cycle environment, and supply constraints support long-term price floors. Add only on pullbacks toward 34.29 support; riding the existing position is the core strategy.
Utilities & Infrastructure — IGF
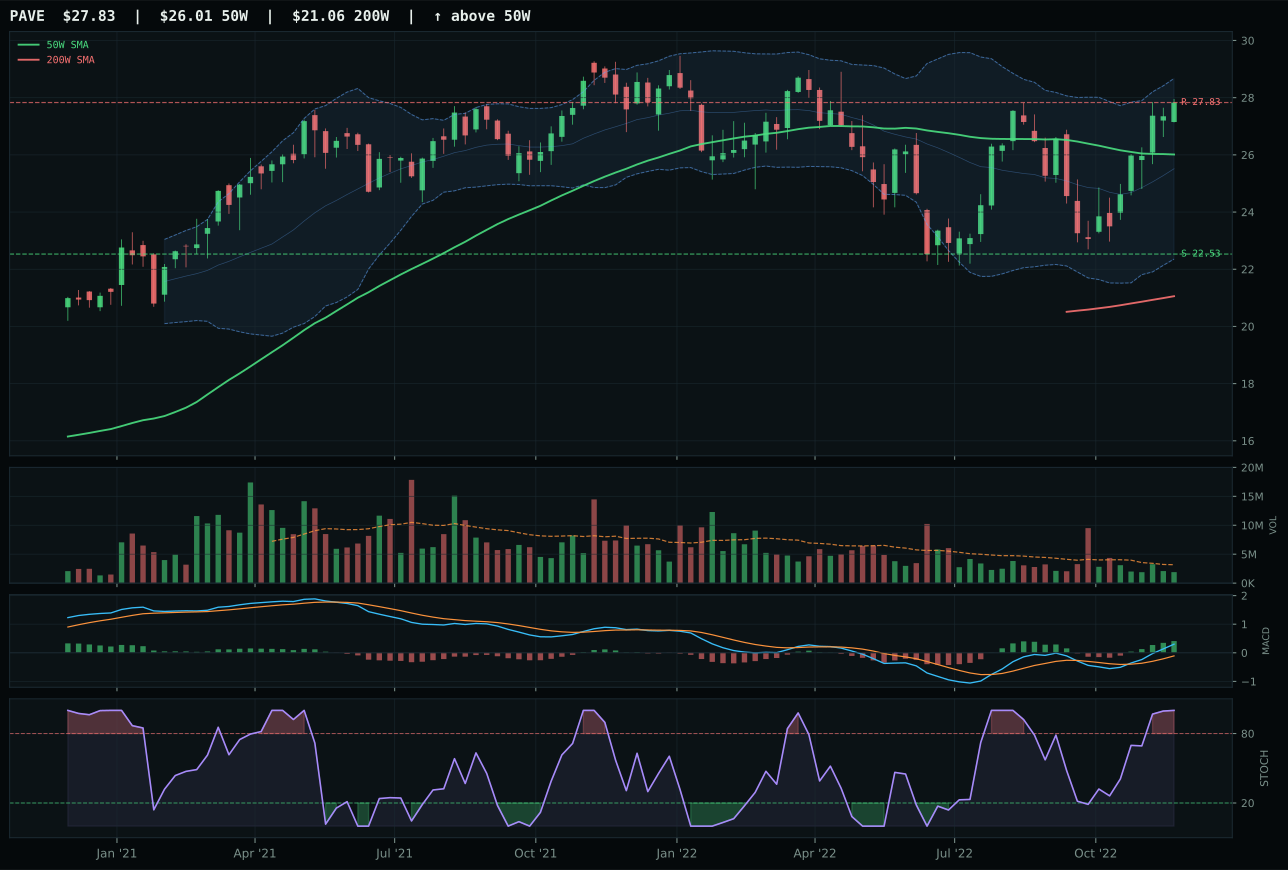
PAVE has a neutral structure profile with 5.8% 13-week relative strength versus SPY.
A failed hold above support would weaken the setup.
Actionable but governed by invalidation levels.
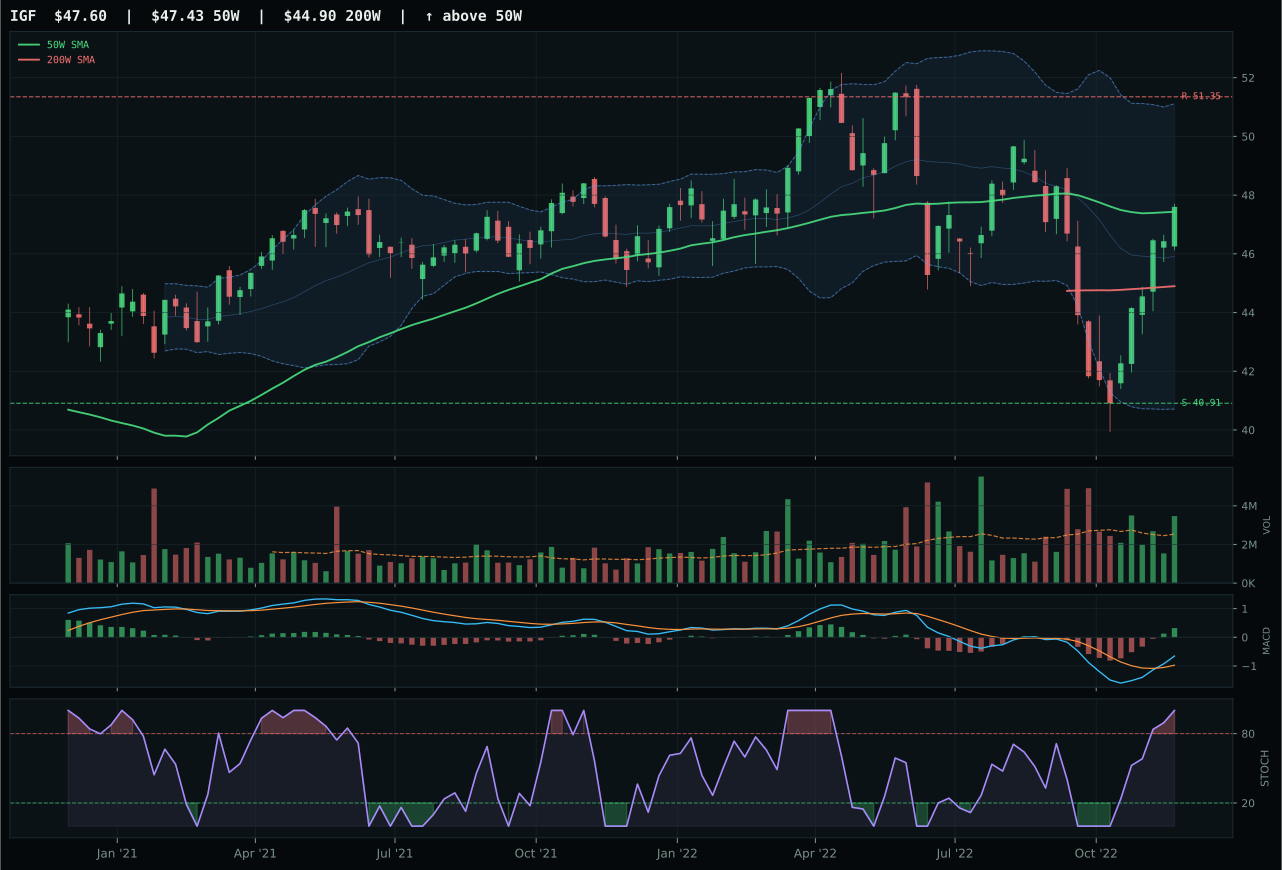
IGF has a compression near 50W profile with -1.0% 13-week relative strength versus SPY.
A failed hold above support would weaken the setup.
Actionable but governed by invalidation levels.
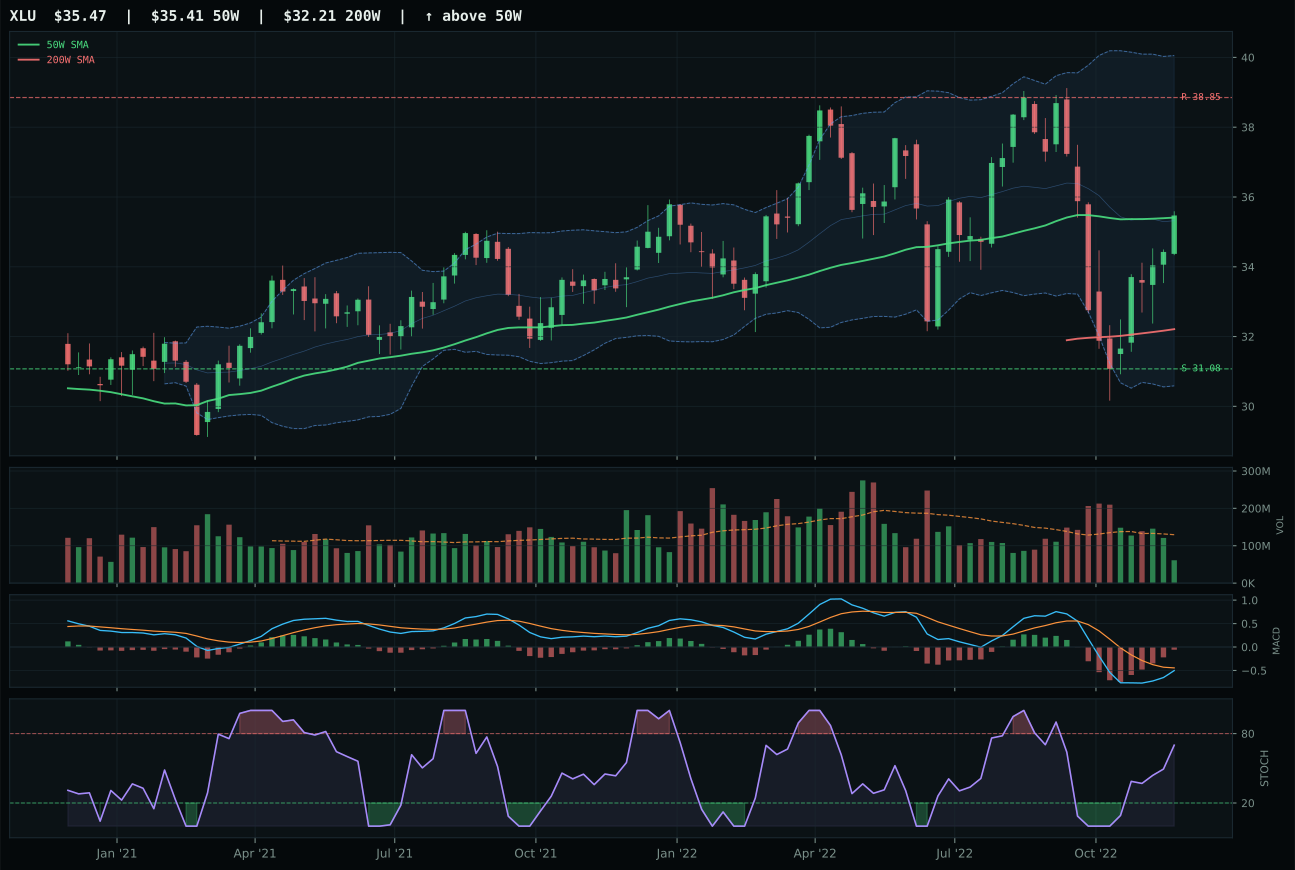
XLU has a compression near 50W profile with -5.6% 13-week relative strength versus SPY.
A failed hold above support would weaken the setup.
Actionable but governed by invalidation levels.
IGF wins the category with a 66.0 final score and merits its top-2 allocation by posting the highest volume-price confirmation score in the portfolio at 70.9/100, combined with perfect timing (100.0). Price sits just 0.4% above the 50-day in tight compression, and volume at 1.37x (above-average participation) proves institutional accumulation is active. Stochastic RSI is overbought momentum, yet MACD is bullish and improving, creating a bull continuation setup rather than a tired momentum peak. PAVE lost ground on timing (75 vs 100), structure cleanliness (68.2 vs 74.2), and most critically, volume confirmation (thin participation vs above-average): PAVE's 7.0% stretch above the 50-day into momentum zone sacrificed entry quality. IGF's compression creates maximum expansion potential if support at 40.91 holds.
Utilities & Infrastructure earned 20% allocation because IGF scored 66.0 (second-best category behind Energy) and the category-level macro fit is 61.0/100 with explicit support from defensive rotation (+12) and broad-market bear conditions (+4). This is a classic late-cycle positioning: utilities and infrastructure provide dividend income and inflation hedging when growth slows and rate pressures persist. IGF's above-average volume shows professional money rotating into safety—the 1.37x participation is the only entry signal in the entire category that shows conviction rather than position-covering. The 4-week return of 7.8% signals fresh sponsorship despite the negative 13-week return, meaning recent buyers are supporting the setup. Risk/reward is tight at -7.3% to resistance, but that resistance at 51.35 should be viewed as profit-taking point, not a ceiling. This is a core defensive holding that should persist even as macro risk shifts; infrastructure income does not depend on economic growth, only on operational stability.
Defense & Aerospace — ITA
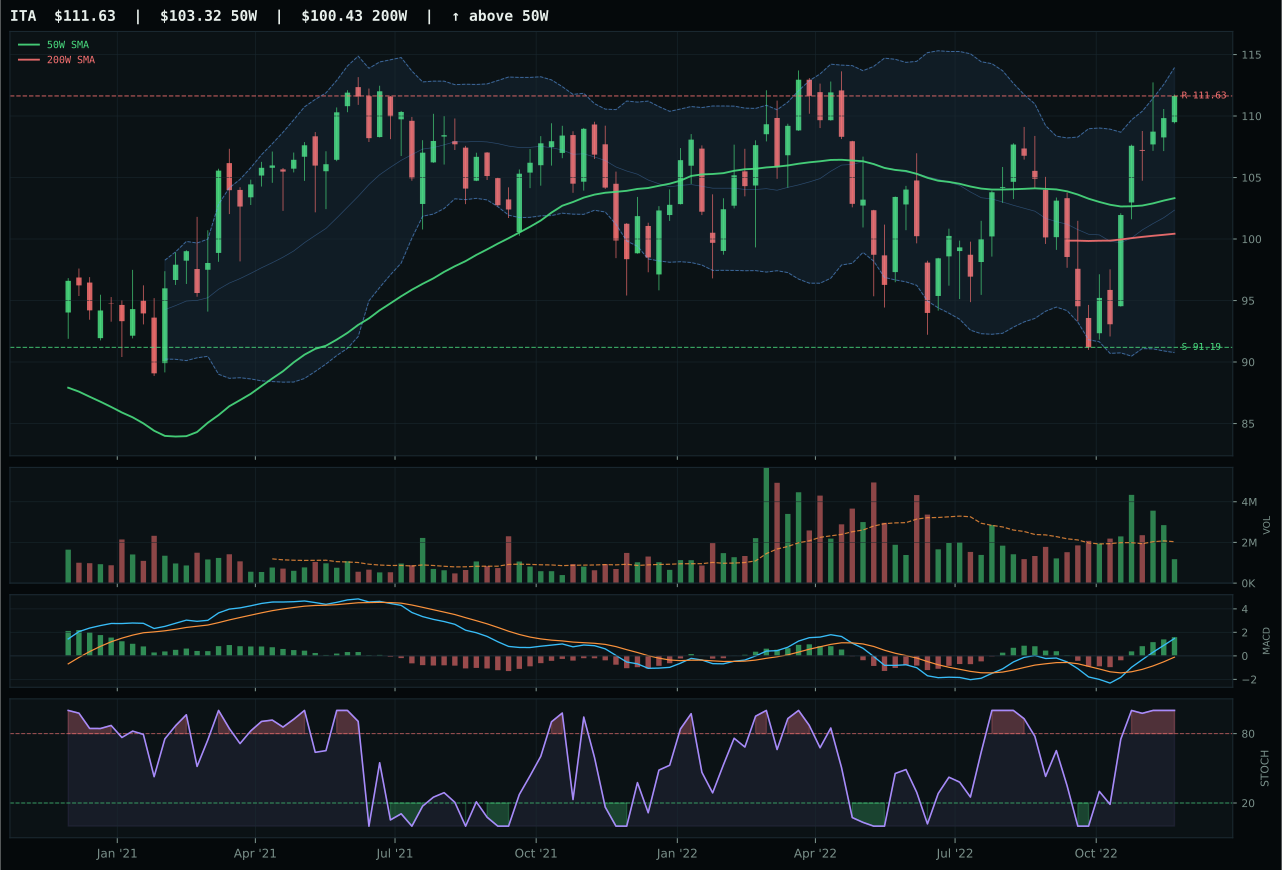
ITA has a neutral structure profile with 7.2% 13-week relative strength versus SPY.
A failed hold above support would weaken the setup.
Actionable but governed by invalidation levels.
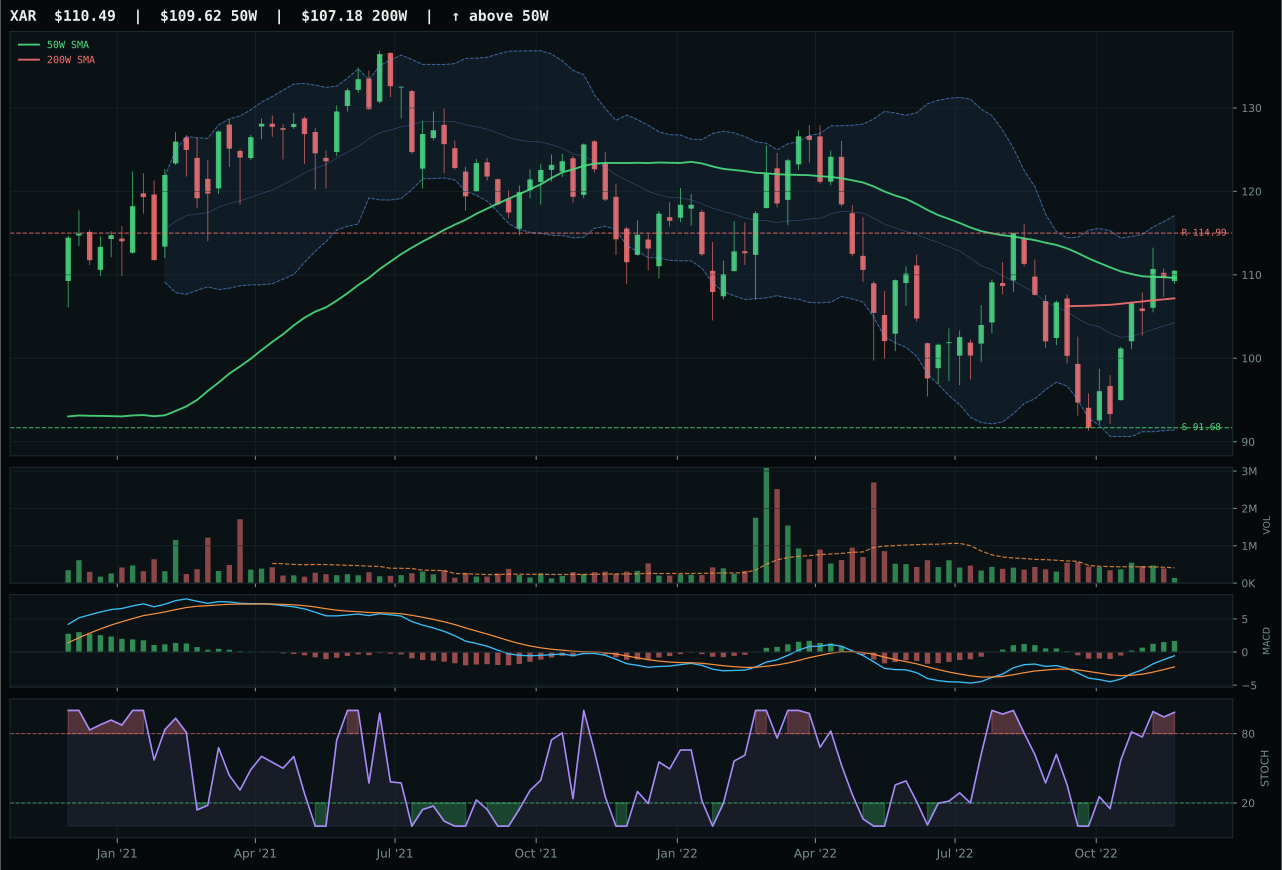
XAR has a compression near 50W profile with 3.4% 13-week relative strength versus SPY.
A failed hold above support would weaken the setup.
Actionable but governed by invalidation levels.
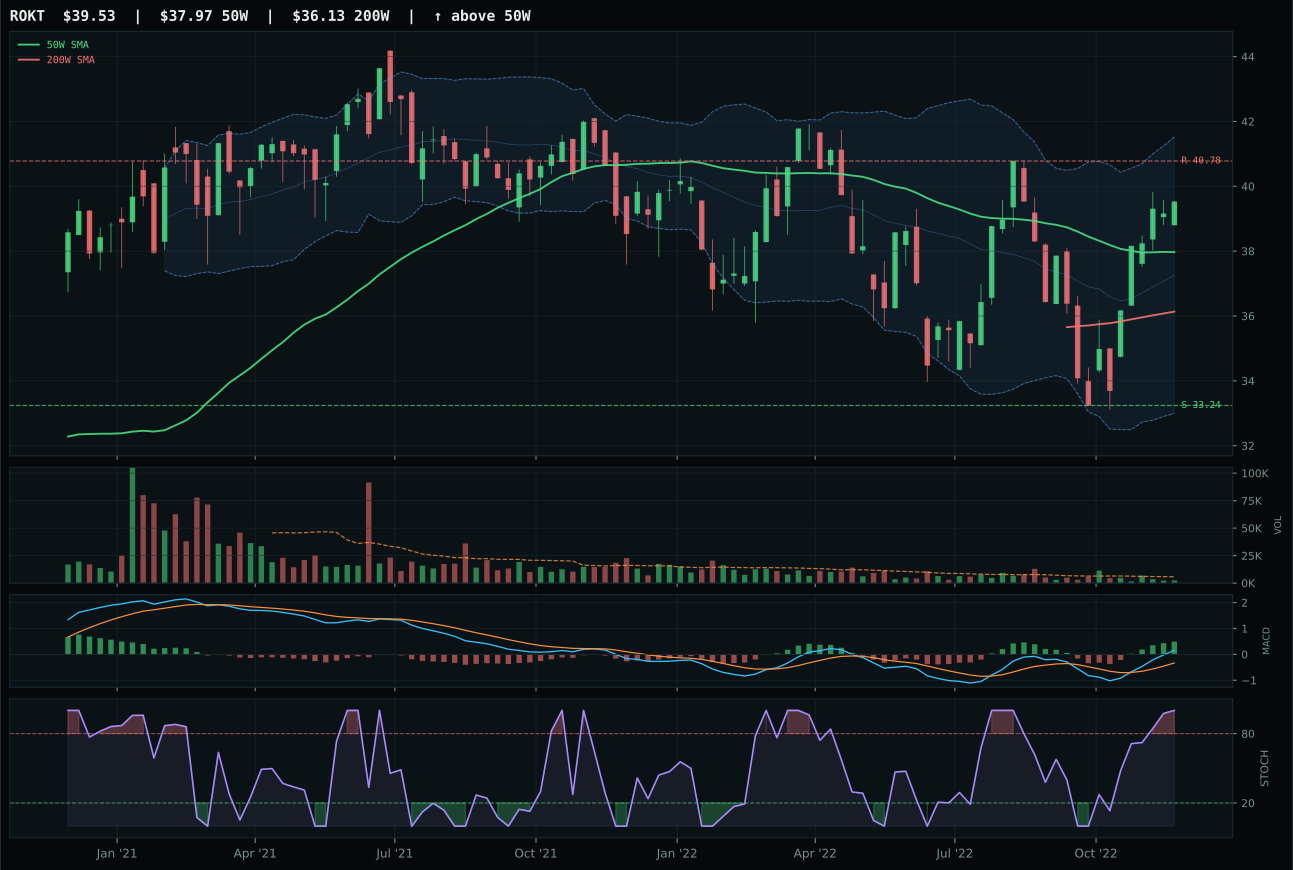
ROKT has a neutral structure profile with 3.9% 13-week relative strength versus SPY.
A failed hold above support would weaken the setup.
Tracked, but not top-2 eligible because: .
ITA won a razor-thin category decision over XAR, separated by just 0.1 points on a 63.4 basket score, but the difference lies entirely in structure quality (71.6 vs 68.4) and category-relative strength (3.2% vs -0.5%). ITA trades 8.0% above the 50-day with a positive 0.2% slope—the only chart in this category that shows genuine uptrend structure rather than compression or pullback. The 13-week return of 6.4% paired with 7.2% relative strength versus SPY demonstrates that defense primes are outperforming on both absolute and risk-adjusted terms. XAR's failure to build on its superior timing score (100 vs 75) reflects that compression near the 50-day has not yet translated into institutional accumulation; volume remains thin participation, meaning the technical setup lacks conviction.
Defense & Aerospace earned 10% despite a 63.4 category score because the macro regime actively supports it. Defensive rotation is live (+8), broad-market bear conditions are confirmed (+6), and the category benefits from real-asset tailwinds in late-cycle reflation. The 71.0/100 category-level macro fit places this in the top quartile, yet it ranks only third by final score, suggesting strong structural support beneath the charts. ITA's 100/100 trend score—price above both moving averages with positive slope—is the cleanest trend in the entire portfolio, yet risk/reward is only 43.4/100 because the ETF sits at resistance with minimal upside left. The allocation reflects a confidence that defensive positioning will persist and that ITA's current extension will stabilize rather than roll over. Entry was cleaner two weeks ago; current risk/reward favors adding on weakness toward the 91.19 support level.
Agriculture & Livestock — MOO
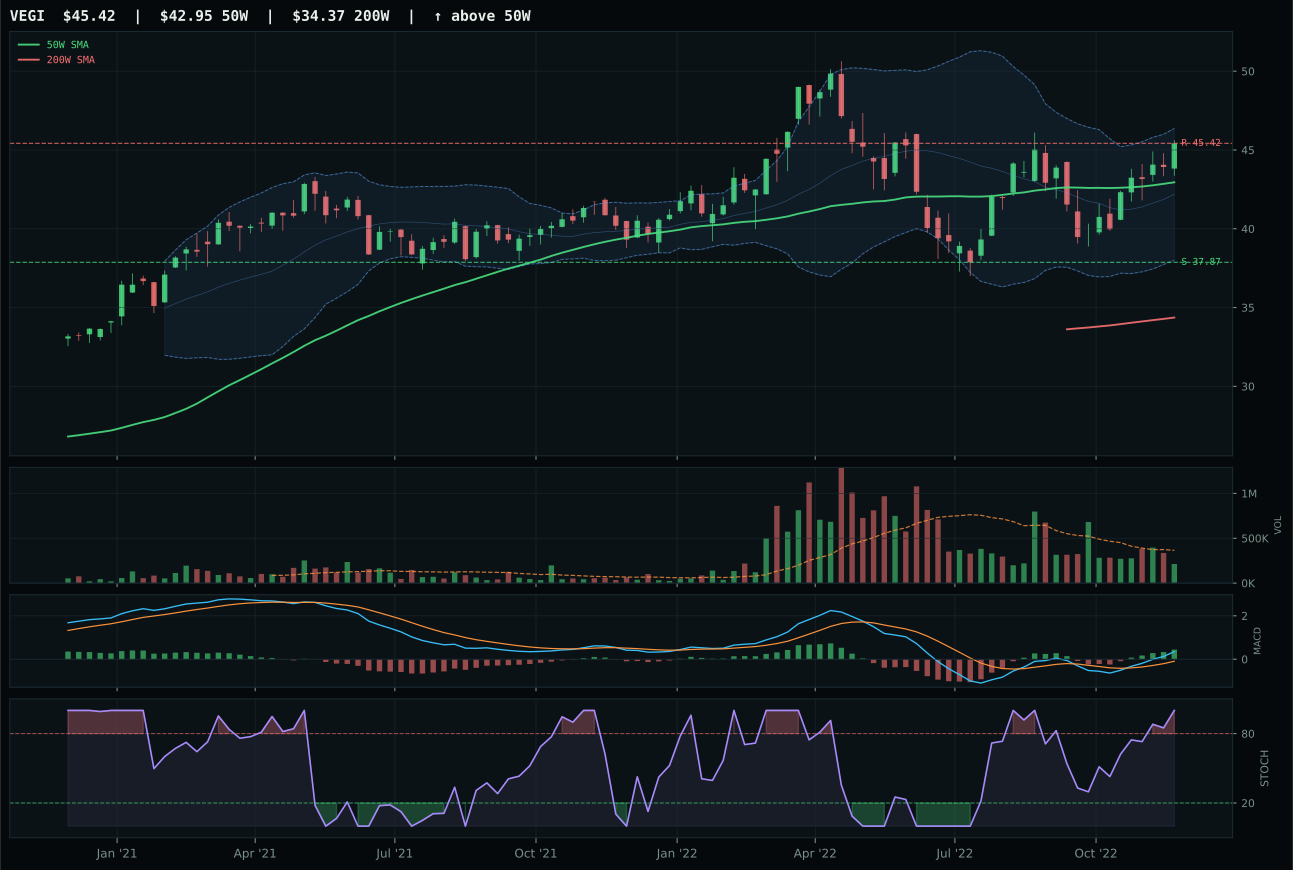
VEGI has a neutral structure profile with 1.6% 13-week relative strength versus SPY.
A failed hold above support would weaken the setup.
Actionable but governed by invalidation levels.
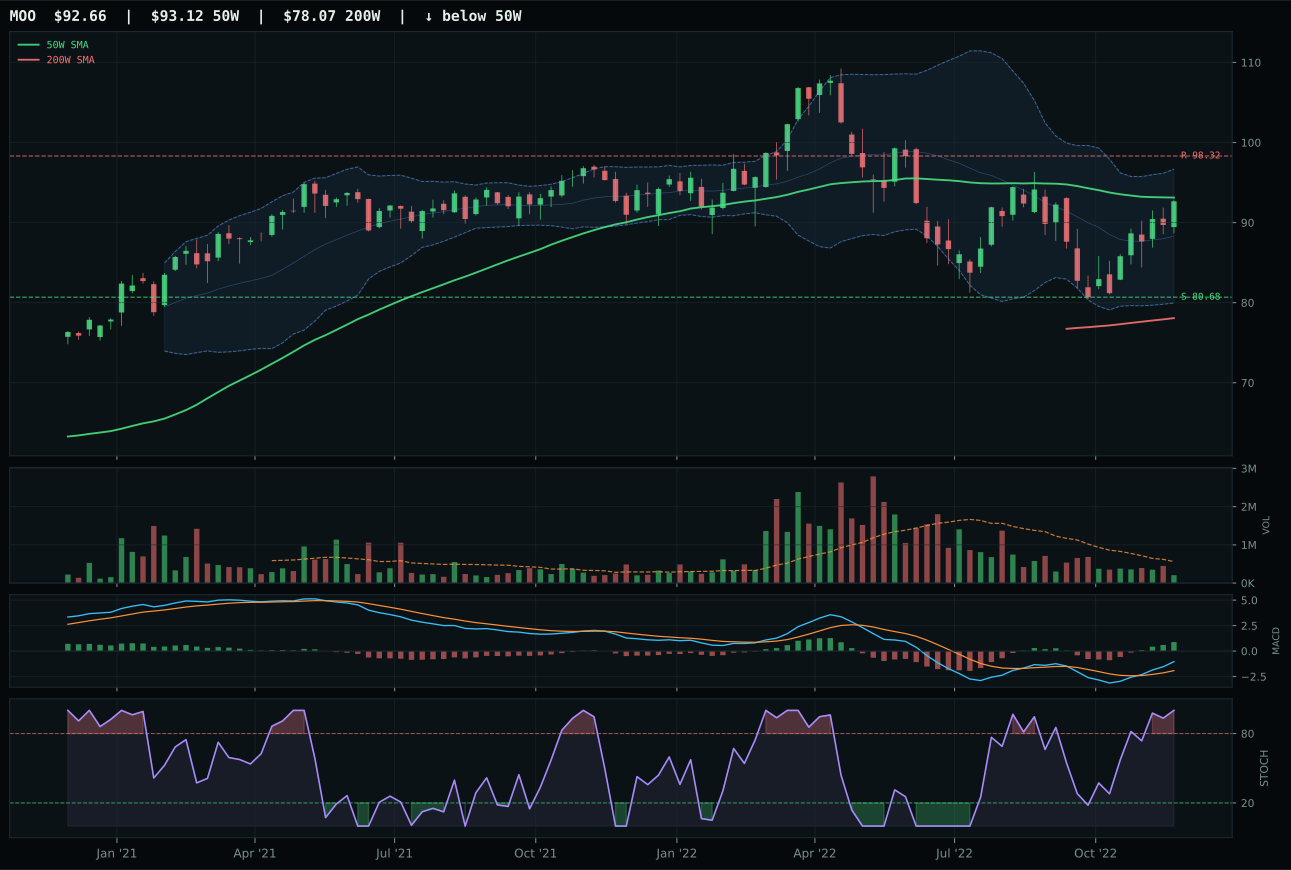
MOO has a compression near 50W profile with -0.8% 13-week relative strength versus SPY.
A failed hold above support would weaken the setup.
Actionable but governed by invalidation levels.
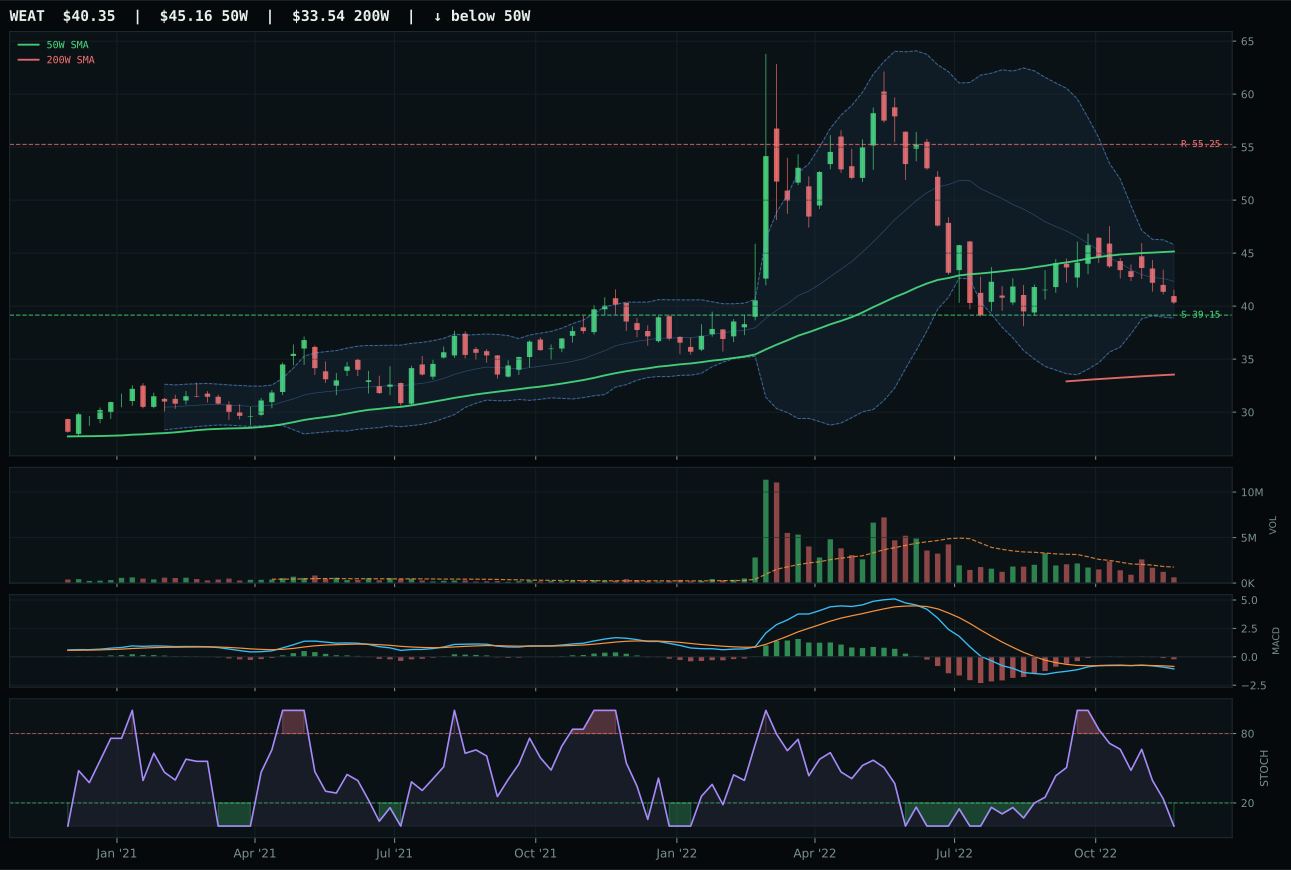
WEAT has a pullback into support profile with -2.7% 13-week relative strength versus SPY.
A failed hold above support would weaken the setup.
Actionable but governed by invalidation levels.
MOO wins a tight race against VEGI despite inferior trend strength (73.8 vs 100) because it posted the category's only perfect timing score at 100.0/100. Price compressed just 0.5% below the 50-day and sat exactly in the middle Fibonacci retracement zone—the setup offers maximum expansion potential if buyers defend the level. VEGI stretched 5.8% above the 50-day into the upper retracement zone, sacrificing timing for trend purity; while its 100/100 trend score is cleaner, that extension into momentum zone created technical fatigue. MOO's compression near the 50-day combined with bullish MACD and overbought stochastic creates a textbook coil-and-spring pattern. The 4-week return of 4.5% shows recent sponsorship, though the 13-week return of -1.6% confirms this is bounce-back action, not new trend.
Agriculture & Livestock earned 10% because supply shortage and inflation pressure are among the most active macro descriptors (+13 and +10 respectively), delivering a 90.0/100 category-level macro fit—the highest in the portfolio. MOO's 60.0 final score places it sixth by rank, making the allocation both technically and macro-justified. The late-cycle reflation environment supports real assets broadly, and agricultural commodities benefit from simultaneous supply shocks and pricing pressure. MOO's thin volume at 0.37x warns that this setup could stall if recent buyers step aside, but the macro case is durable. The risk/reward shows -5.8% to resistance and 14.8% to support, meaning the category offers downside protection through the support level at 80.68 while leaving room to run if the 98.32 resistance breaks. This is a core holding in a real-asset rotation that has only just begun.
Industrial Metals — COPX
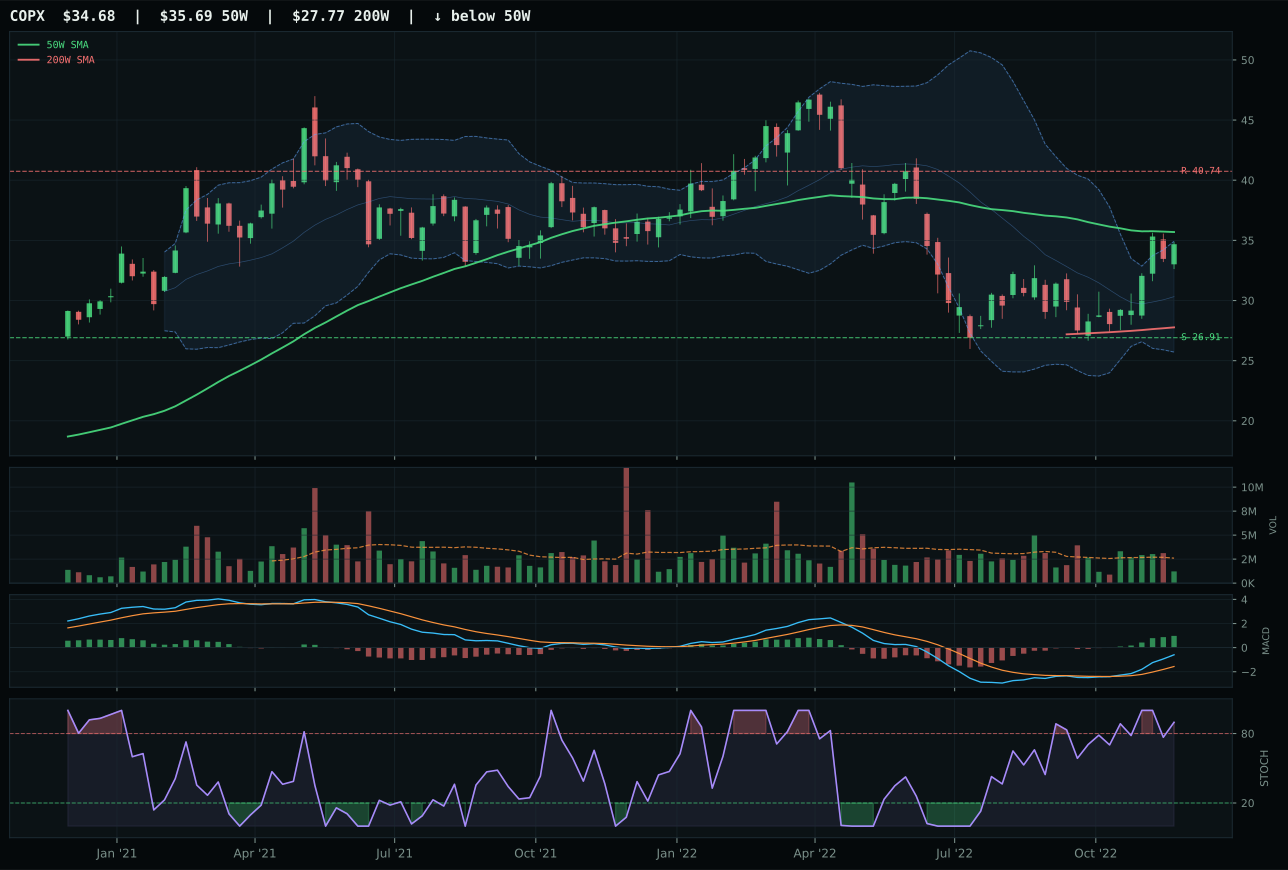
COPX has a compression near 50W profile with 9.6% 13-week relative strength versus SPY.
A failed hold above support would weaken the setup.
Actionable but governed by invalidation levels.
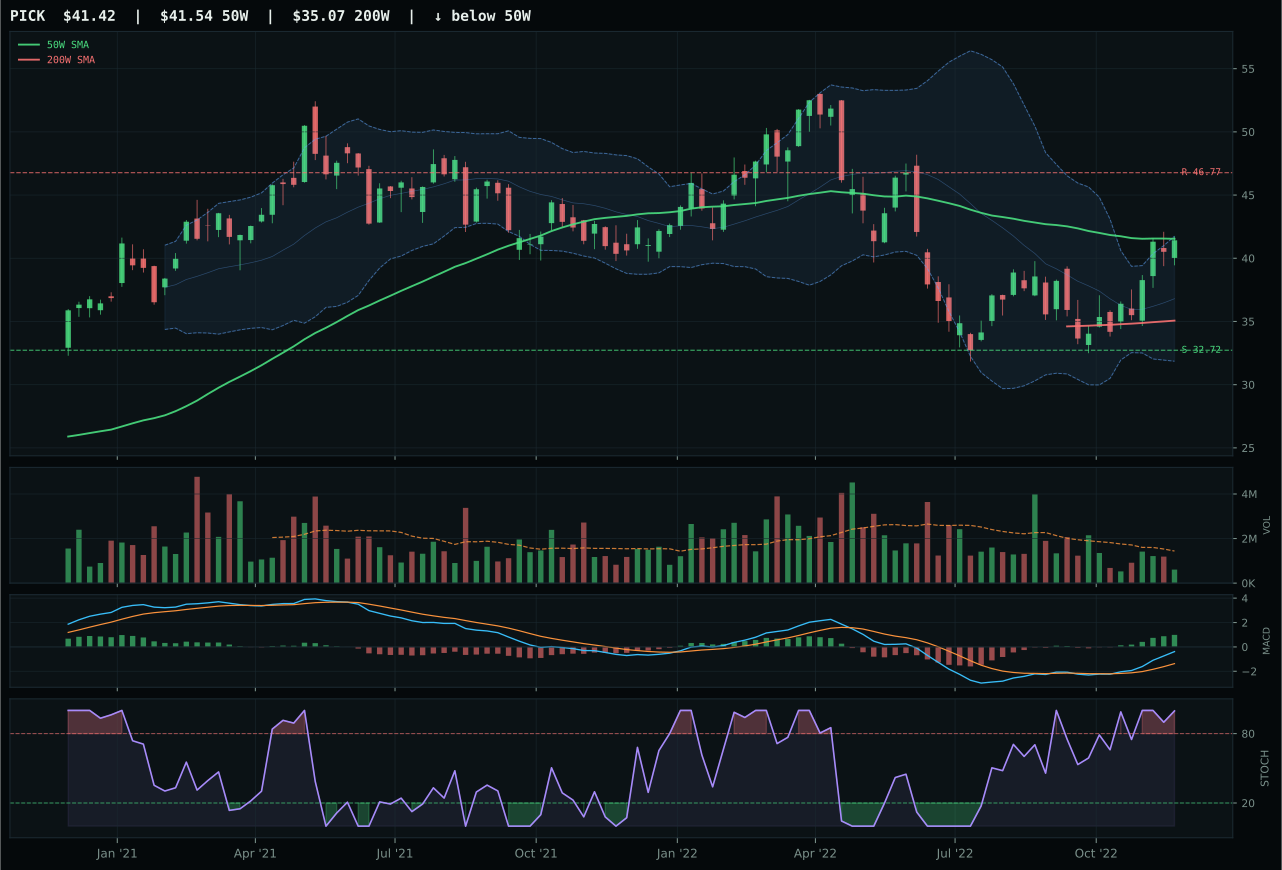
PICK has a compression near 50W profile with 8.2% 13-week relative strength versus SPY.
A failed hold above support would weaken the setup.
Actionable but governed by invalidation levels.
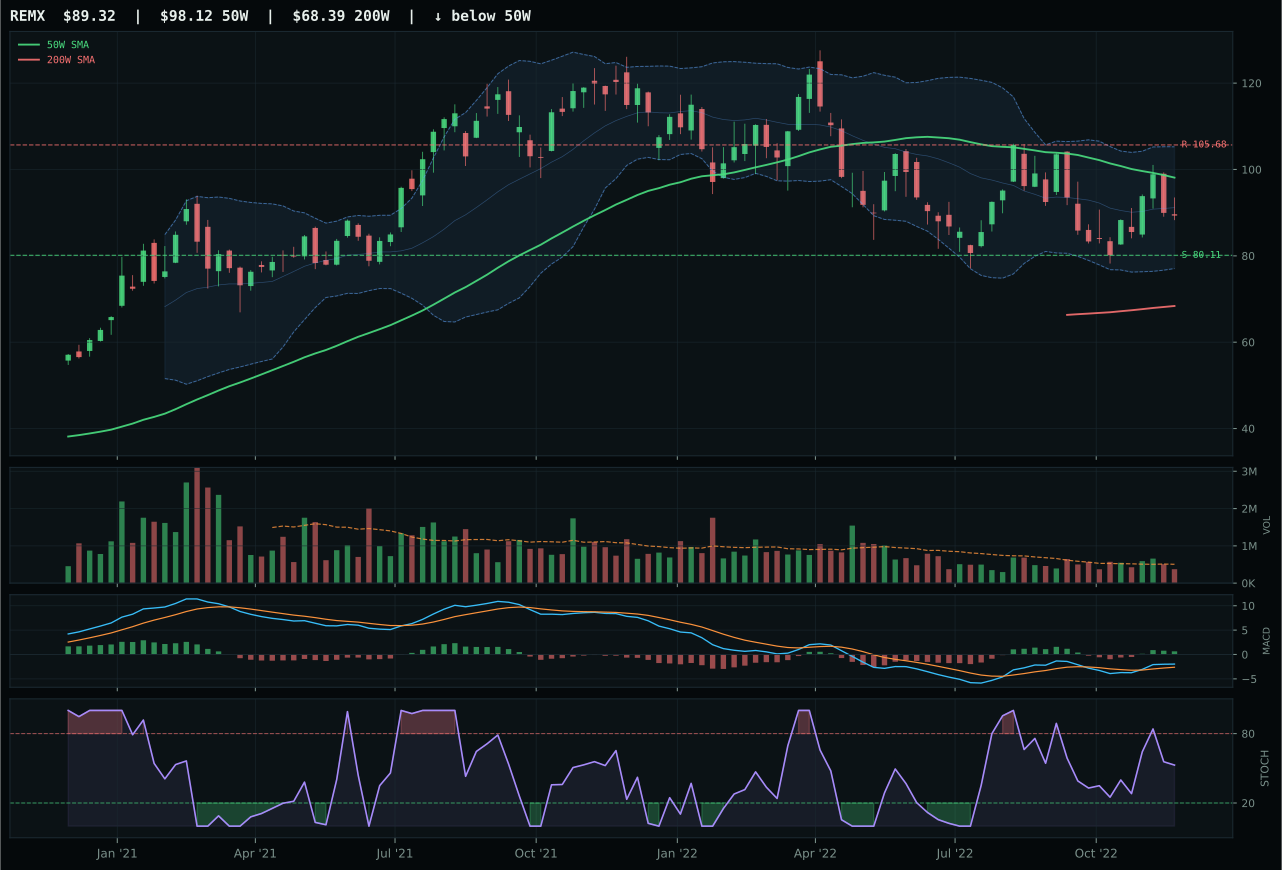
REMX has a neutral structure profile with -9.1% 13-week relative strength versus SPY.
A failed hold above support would weaken the setup.
Actionable but governed by invalidation levels.
COPX edges PICK in an essentially tied technical race (both 81 composite, both compression near 50W) by posting the slightly superior 1.4% category-relative strength versus PICK's 0.0%. The momentum confirmation of 100.0/100 is the highest scorer for this category, driven by 18.9% four-week return paired with 8.9% thirteen-week return—copper miners are accelerating, not decelerating. Stochastic RSI is rolling over from overbought (0.90) rather than still rising, suggesting the short-term burst has peaked, yet MACD remains bullish and improving, indicating the intermediate trend is intact. The setup is compression near the 50-day at -2.8% with middle Fibonacci zone at 0.618, classic coil-and-spring. Risk/reward appears cramped at -14.9% to resistance, but that resistance at 40.74 should be viewed as a breakout target, not a ceiling.
Industrial Metals scored 60.0 and earned 10% based on the strongest category-level macro fit in the entire portfolio at 75.0/100. Metals scarcity is active (+14), commodity breadth is positive (+10), and late-cycle reflation explicitly helps this exposure (+10). COPX's 9.6% relative strength versus SPY signals that copper demand is outpacing general equity weakness, a bullish signal for industrial demand assumptions. The allocation reflects conviction that supply-side constraints in copper will persist and that late-cycle inflation dynamics support industrial commodity repricing. However, the risk/reward warning cannot be ignored: COPX sits just 14.9% below resistance with only 28.9% downside to support, creating uncomfortable asymmetry for position-adding. Current allocation should hold but resist scaling up until price breaks 40.74 on volume confirmation. The macro backdrop is exceptional; the technicals are already reflecting much of that good news.
Precious Metals — GLD
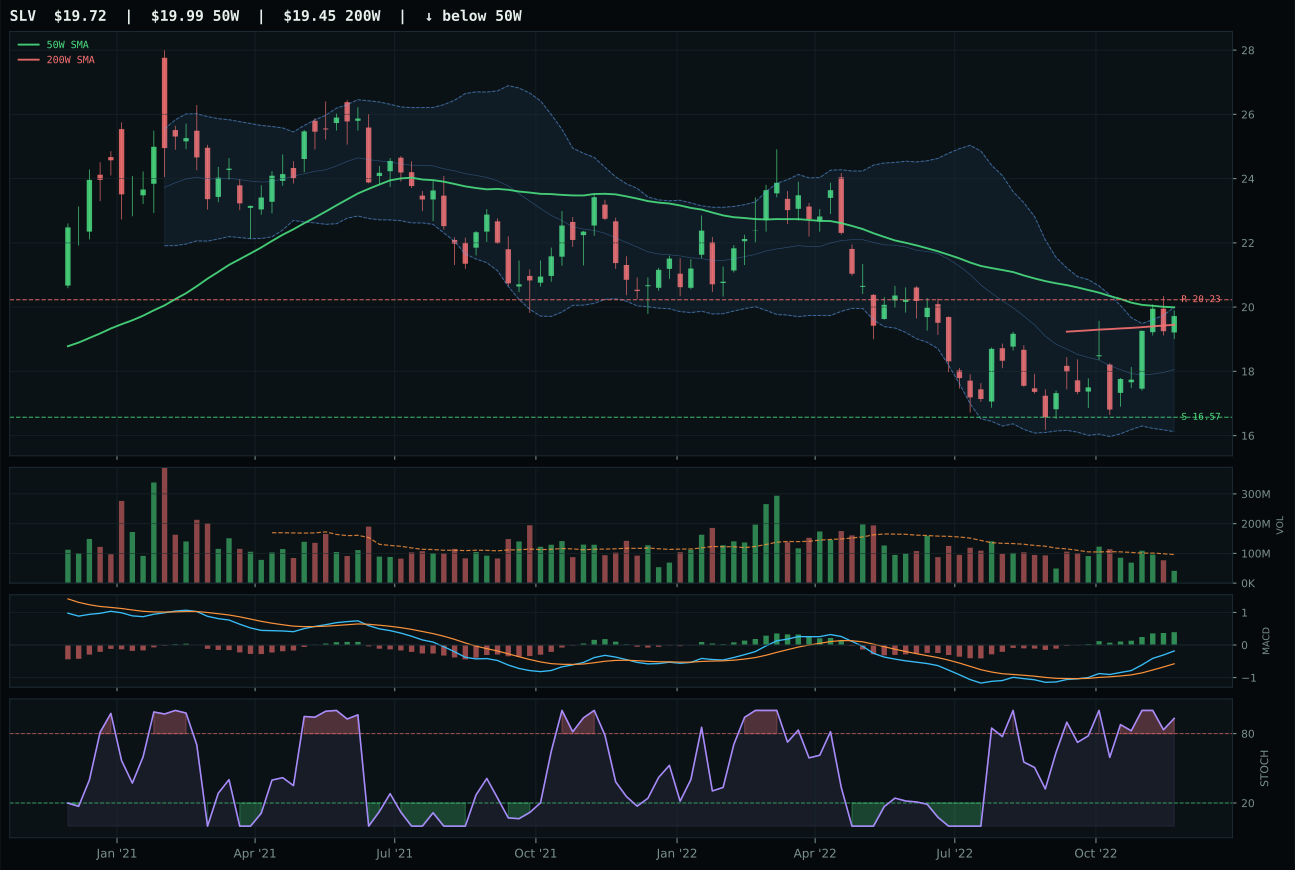
SLV has a compression near 50W profile with 14.3% 13-week relative strength versus SPY.
A failed hold above support would weaken the setup.
Actionable but governed by invalidation levels.
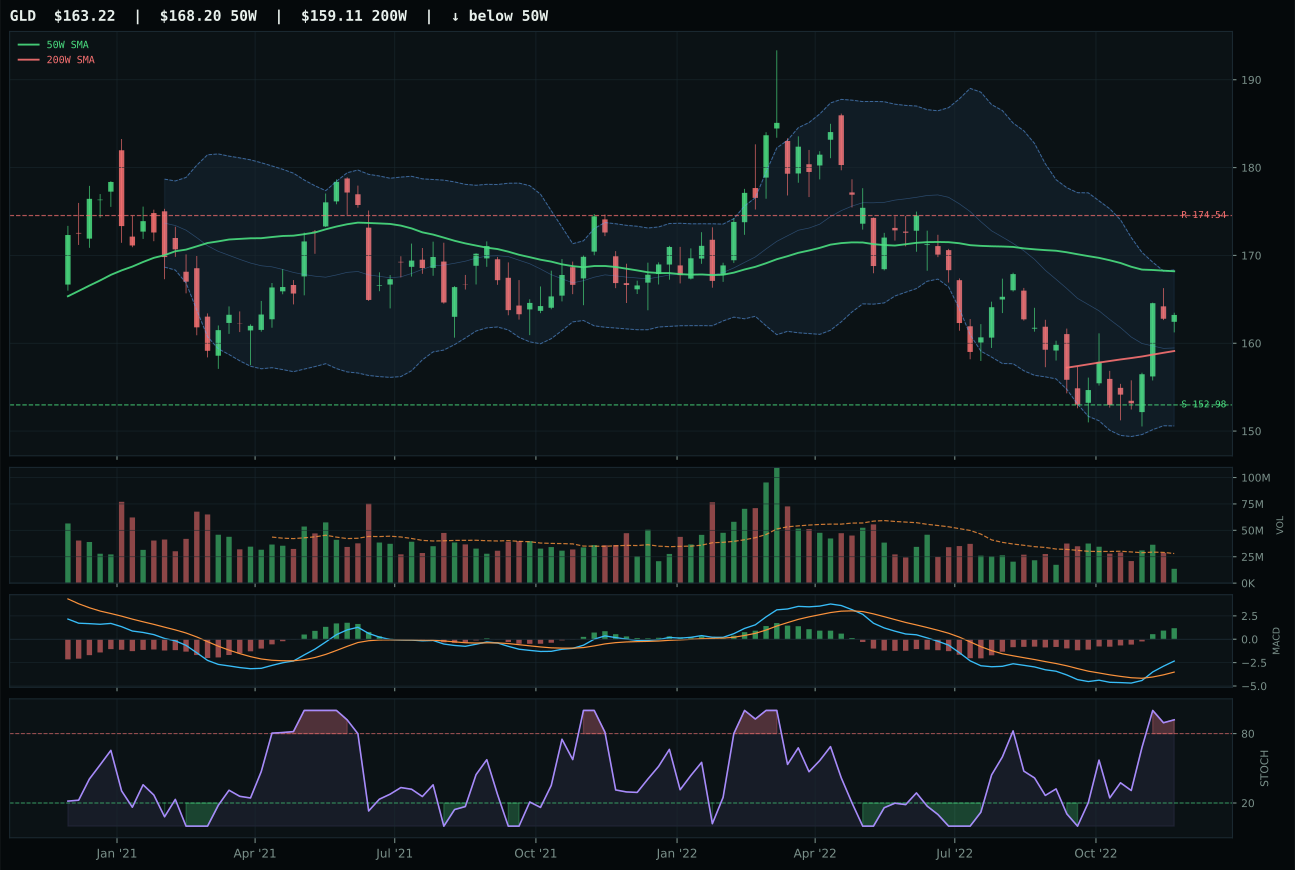
GLD has a compression near 50W profile with 1.6% 13-week relative strength versus SPY.
A failed hold above support would weaken the setup.
Actionable but governed by invalidation levels.
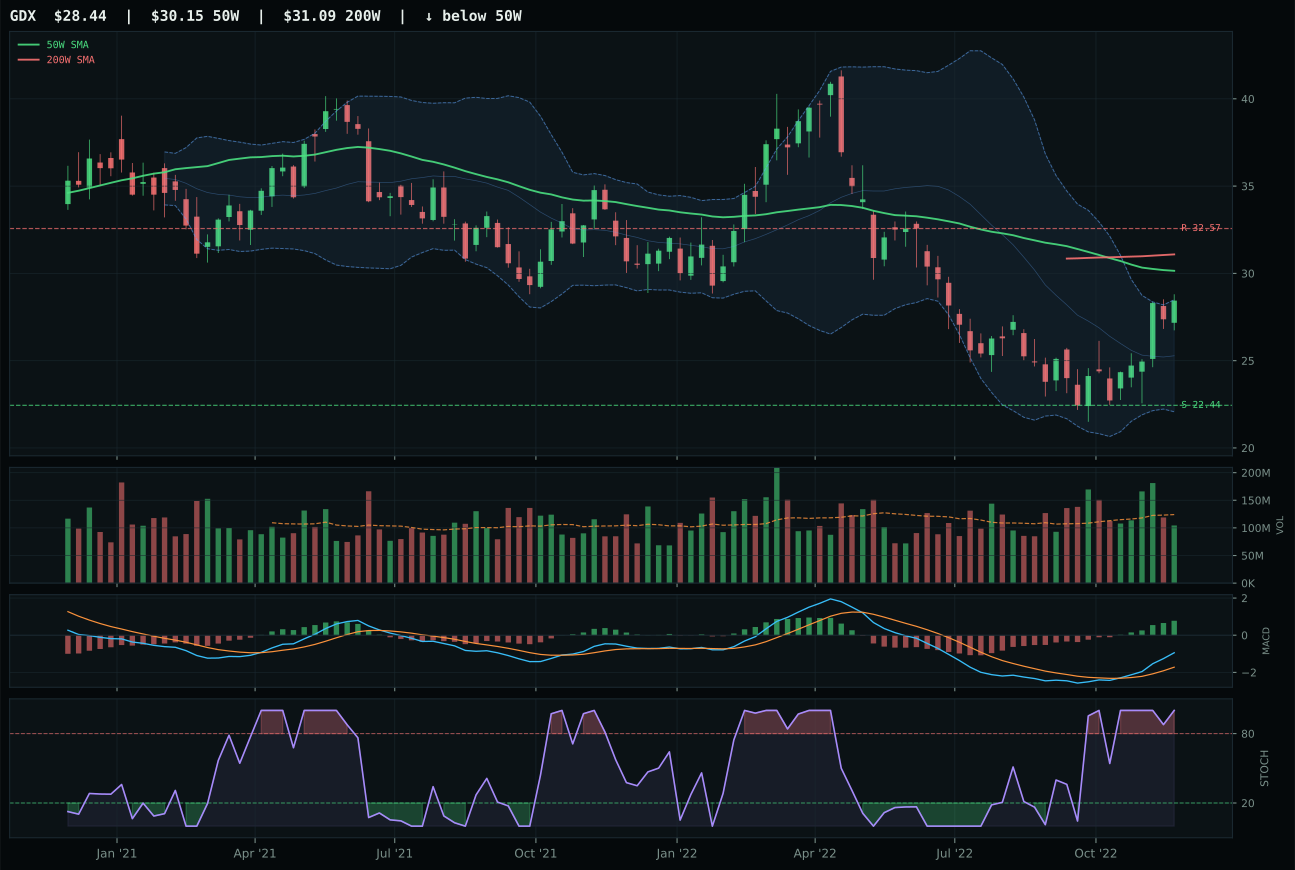
GDX has a neutral structure profile with 15.0% 13-week relative strength versus SPY.
Extension and support failure are the main tactical risks.
Tracked, but not top-2 eligible because: structurally broken.
GLD edged SLV despite trailing in momentum and trend strength, winning purely on timing (100.0 vs 89.0) and risk/reward (70.4 vs 55.4). Price compressed just 3.0% below the 50-day and sits in the deep Fibonacci zone at 0.786, the classical value-hunting level for defensive buyers. SLV's 14.3% relative strength versus SPY looked attractive, but that outperformance came from industrial beta rather than monetary-hedge strength; stochastic RSI was already rolling over from overbought, signaling fading momentum. GLD's category-relative strength collapsed to -12.7%, reflecting that gold lagged silver in the recent bounce, yet that underperformance combined with better entry timing creates asymmetry: buyers stepping in now get a cleaner setup with more room to run. The monetary-hedge bid is live (+14 weighting), supporting gold's defensive character in a credit-stressed environment.
Precious Metals scored 47.7, ranking eighth and earning 10% as a defensive core holding despite mid-tier technical strength. The 71.0/100 category-level macro fit reflects active monetary-hedge demand (+14) and defensive rotation signals (+7), making gold a true portfolio ballast. However, the allocation also reflects skepticism: GLD's volume-price confirmation score of only 32.0/100 suggests buyers are not enthusiastically accumulating at these levels. The category remains underweight relative to its macro support because conviction is absent—gold is being held, not accumulated. If credit stress deepens materially or if equity volatility spikes, this category should see natural rotation inflows. The technical setup at 152.98 support provides a clear invalidation point; if GLD breaks below that level on rising volume, the monetary-hedge narrative weakens and allocation should reduce.
Nuclear Energy — URA
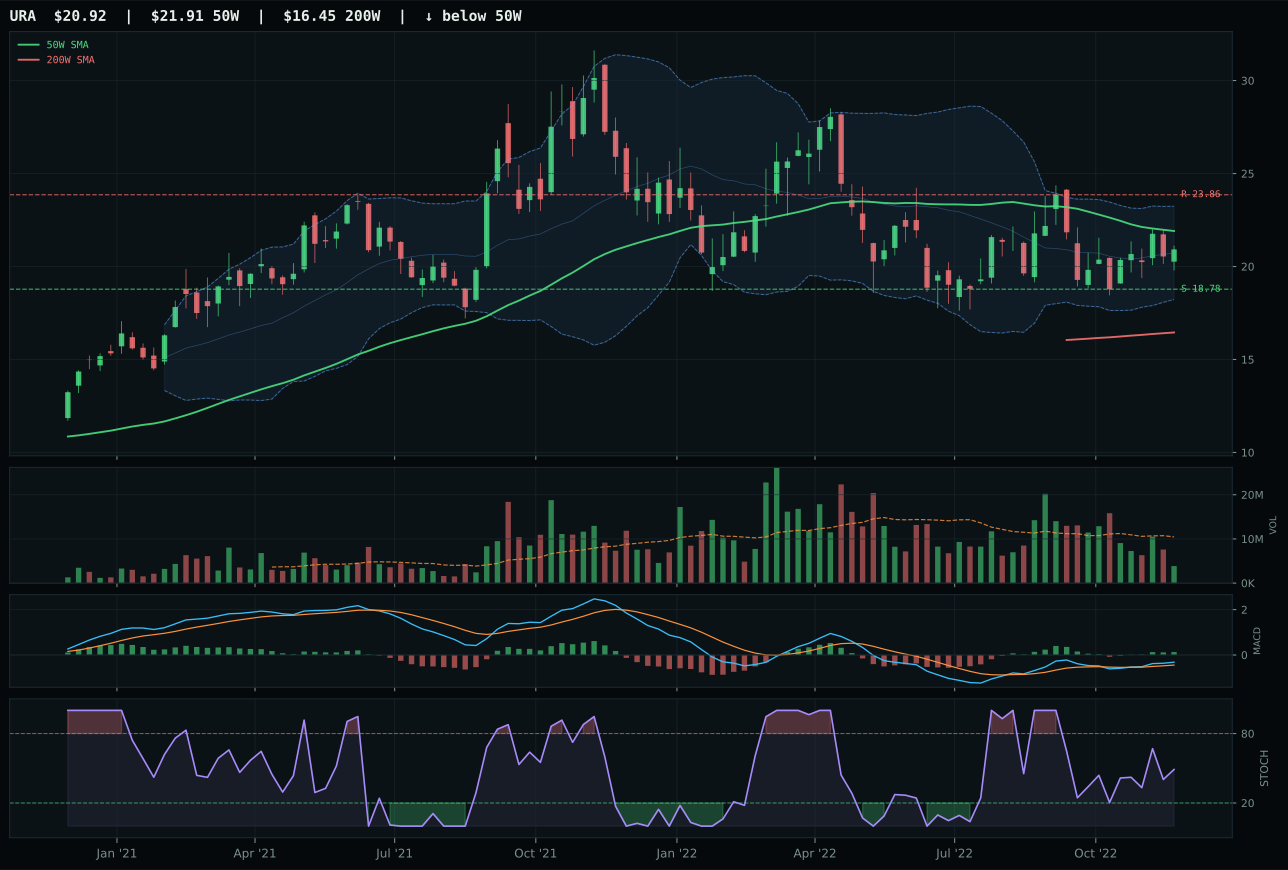
URA has a neutral structure profile with -3.2% 13-week relative strength versus SPY.
A failed hold above support would weaken the setup.
Actionable but governed by invalidation levels.
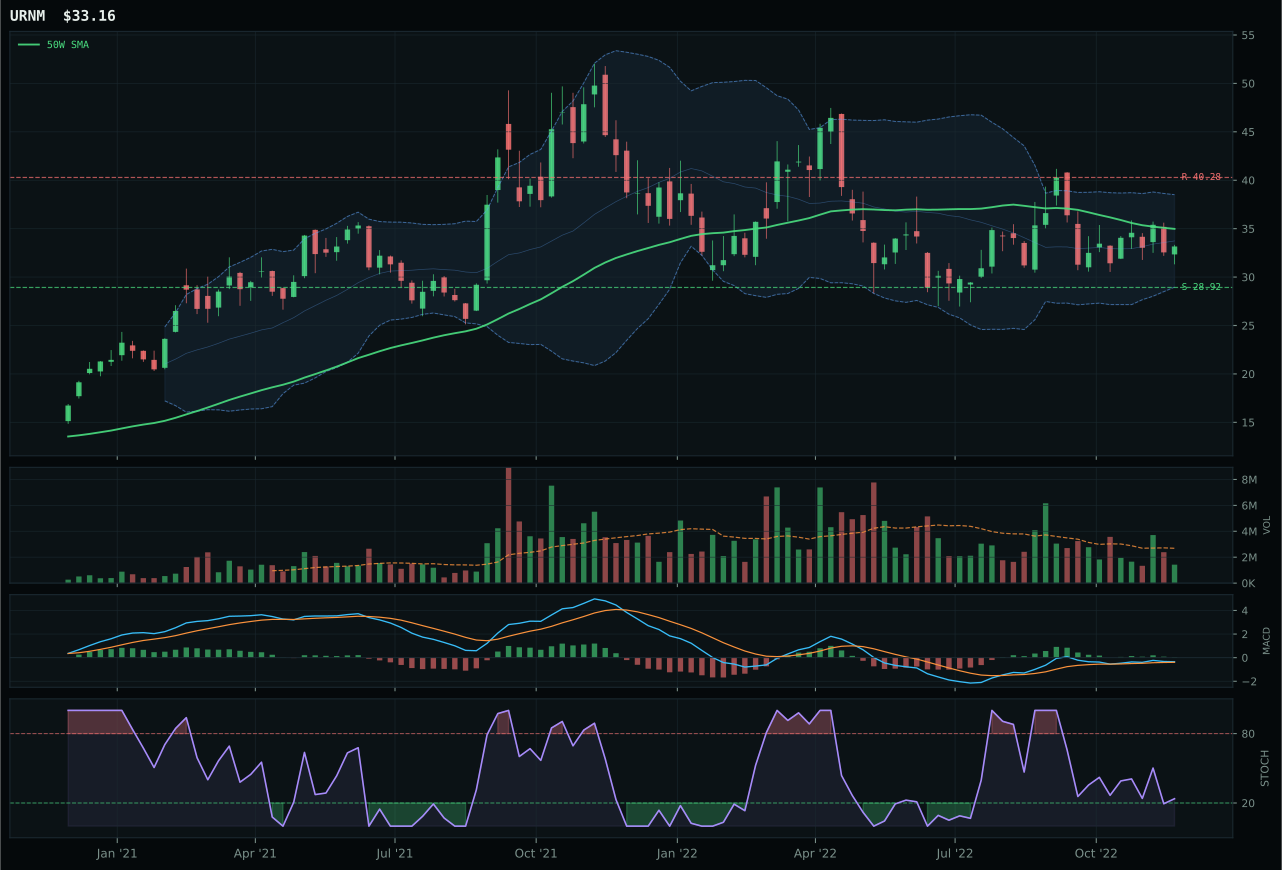
URNM has a neutral structure profile with -5.4% 13-week relative strength versus SPY.
A failed hold above support would weaken the setup.
Actionable but governed by invalidation levels.
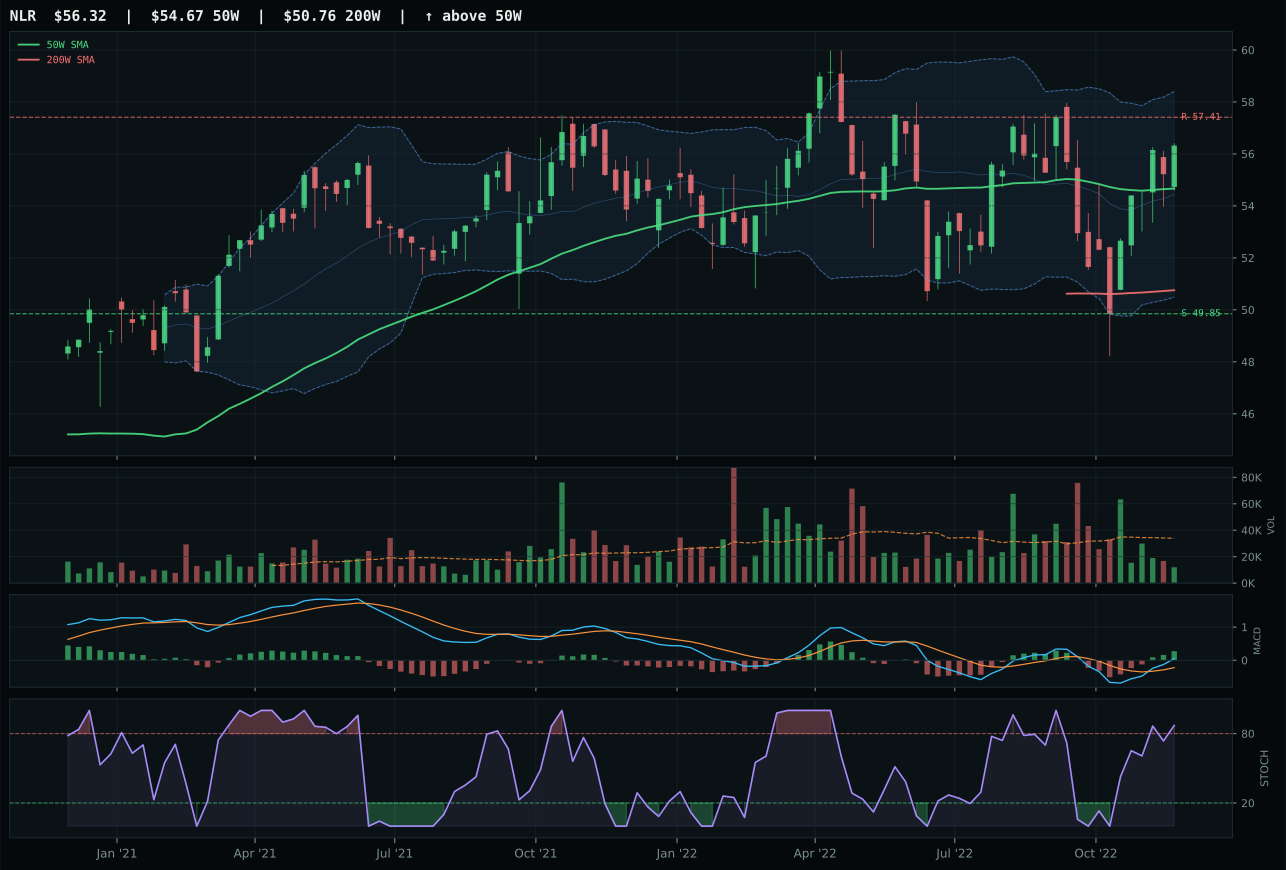
NLR has a neutral structure profile with 1.3% 13-week relative strength versus SPY.
A failed hold above support would weaken the setup.
Tracked, but not top-2 eligible because: .
URA captured the category with the highest timing score at 100.0/100, a perfect setup that overshadows its weaker trend (60.2 vs 100) and momentum (50.2) metrics. Price compressed just 4.5% below the 50-day in the deep Fibonacci repair zone, the classic entry point for patient buyers. URNM failed on every dimension: timing collapsed to 70.0, MACD is bullish but flattening (not improving), stochastic RSI is falling neutral rather than rising, and structure is looser. The 34.5-point score gap between URA and URNM reflects how much timing matters in oversold conditions; URA is sitting in the exact zone where new accumulation begins, while URNM is still in the grind lower phase. URA's volume is thin, but that is typical for nuclear plays and does not invalidate the setup—conviction will come if buyers defend the 18.78 support level.
Nuclear Energy scored 42.9, ranking ninth and earning 10% despite technical setup strength because the category-level macro fit is only 64.0/100—mid-portfolio strength. Energy scarcity is active (+9) and real-asset sponsorship is live (+7), yet the support is offset by liquidity stress (-7) that weighs on all growth narratives. URA's timing is excellent, but the momentum confirmation of only 50.2/100 warns that institutional money is not yet rushing to accumulate. This allocation is a levered bet on the macro thesis that energy scarcity will force governments and utilities to accelerate nuclear reopenings and new builds; that narrative is real but currently unsponsored in the tape. Hold the position as an optionality play on energy policy inflection, but understand it is the thinnest conviction play in the portfolio. If credit stress indicators stabilize and energy scarcity messaging accelerates into mainstream discourse, URA could re-rate sharply upward from current levels.
Technology — XLK
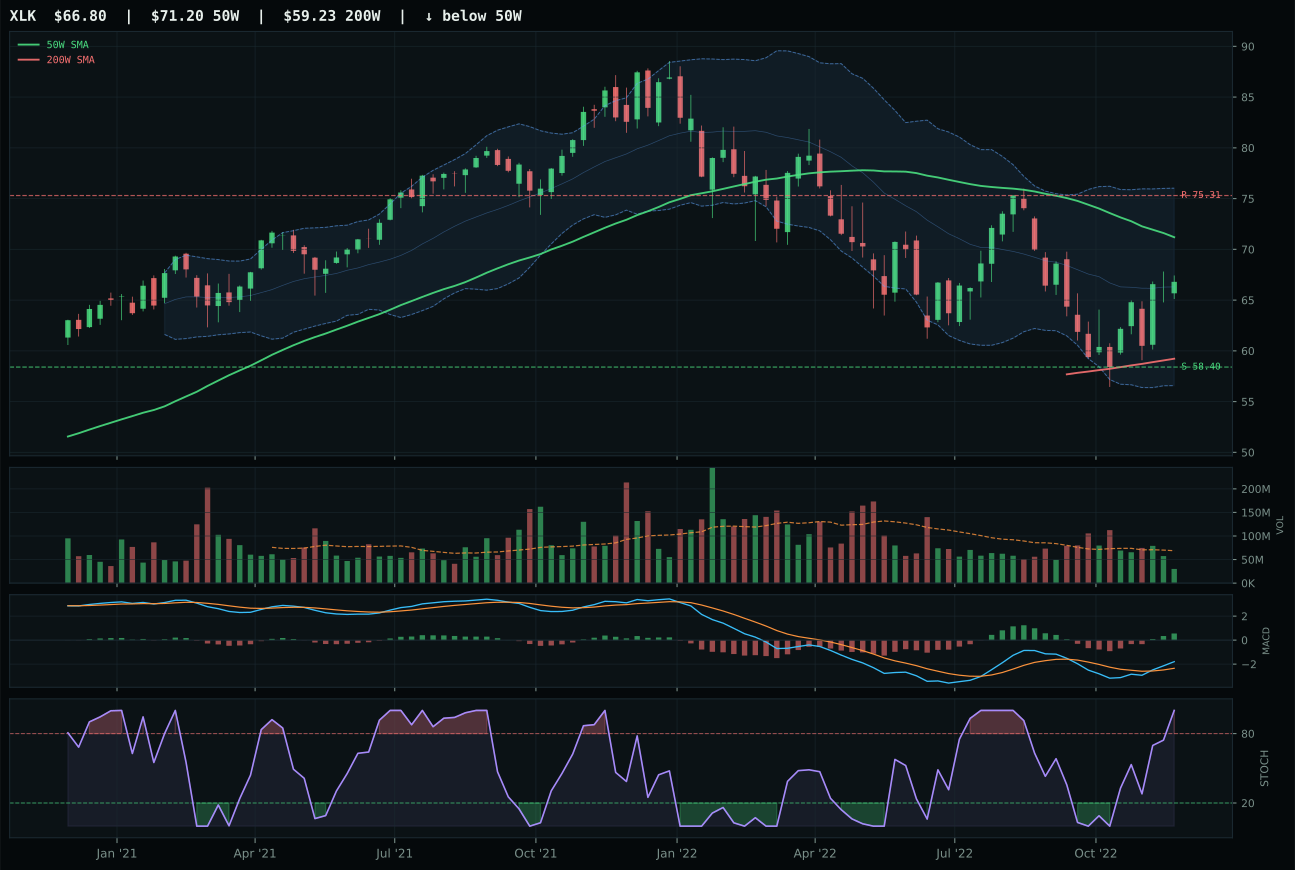
XLK has a neutral structure profile with -3.8% 13-week relative strength versus SPY.
A failed hold above support would weaken the setup.
Actionable but governed by invalidation levels.
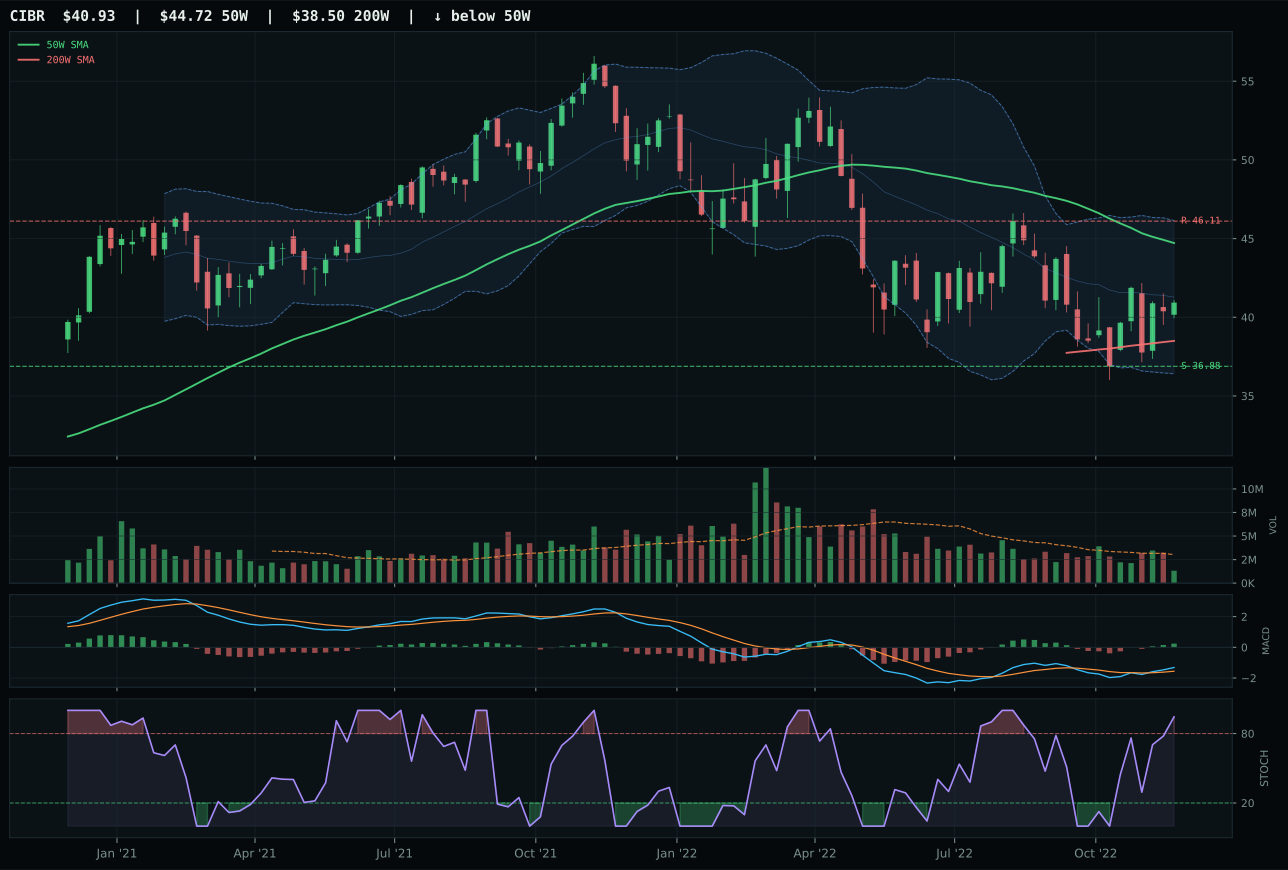
CIBR has a neutral structure profile with -6.0% 13-week relative strength versus SPY.
A failed hold above support would weaken the setup.
Actionable but governed by invalidation levels.
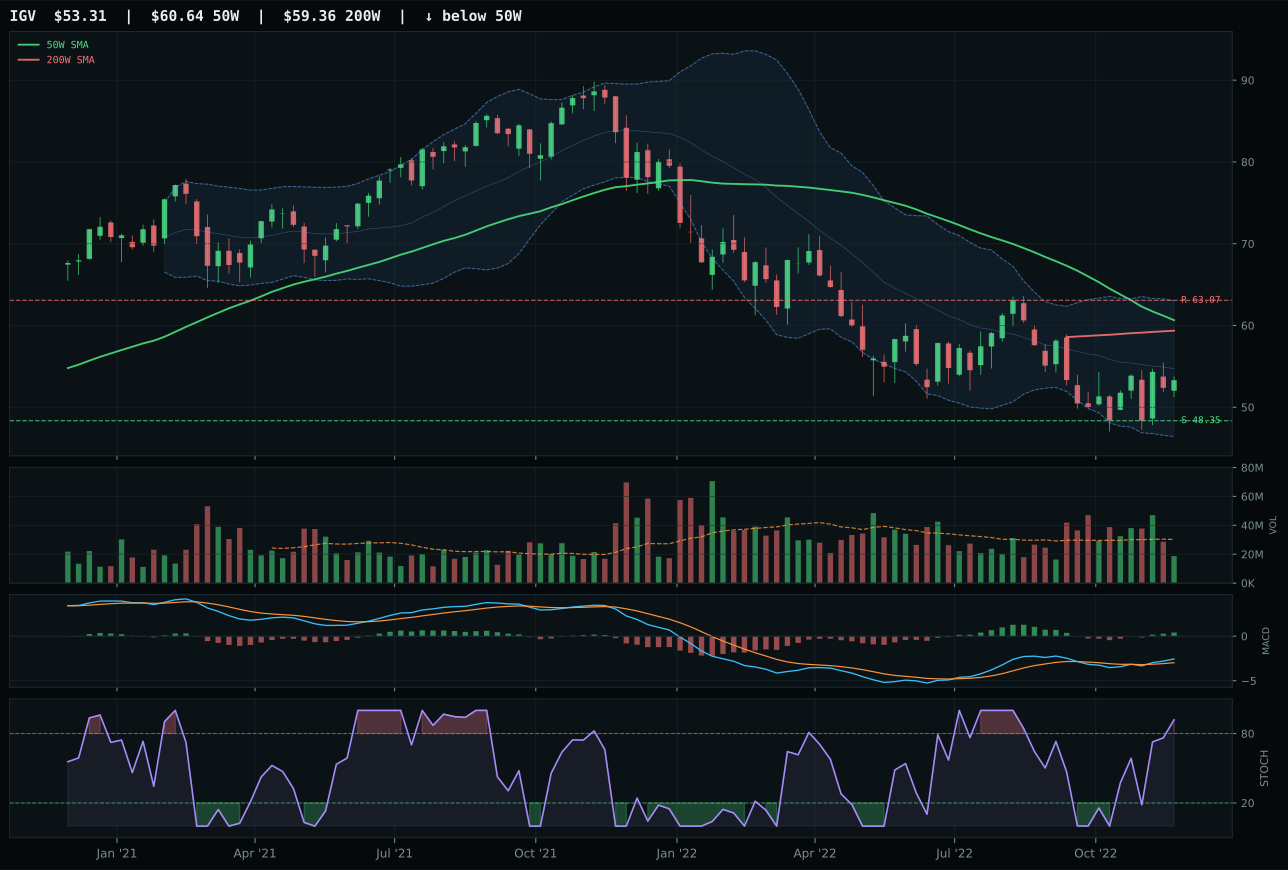
IGV has a neutral structure profile with -6.7% 13-week relative strength versus SPY.
A failed hold above support would weaken the setup.
Actionable but governed by invalidation levels.
XLK captured the category by posting the strongest category-relative strength at 2.2% against a median of zero, translating to genuine institutional accumulation inside a technically neutral setup. CIBR lost ground here because its -6.0% relative strength versus SPY signaled defensive positioning when the macro regime demanded conviction; the 3.4-point score gap reflects XLK's ability to generate momentum confirmation (55.5/100) despite thin volume participation at 0.44x. The setup is textbook mean-reversion architecture: price sits 6.2% below the 50-day moving average in the 0.618 Fibonacci zone, MACD is bullish and improving, and stochastic RSI has pushed to overbought, creating a classic recoil setup if buyers show up. Volume remains the vulnerability—participation at less than half normal suggests conviction is absent, not present.
Technology earned its 10% allocation slot because the macro regime actively punishes it. Liquidity stress and credit stress are live conditions (-10 and -7 weighting respectively), and a 29.0/100 category-level macro fit anchors this as a defensive holding rather than a growth commitment. The late-cycle reflation backdrop favors energy, real assets, and infrastructure far more than semiconductor and software exposure, which typically require multiple expansion in easier credit conditions. XLK's 59.4/100 trend score reflects that it trades below its 50-week moving average, meaning the structural downtrend remains intact even if oversold conditions are setting up a bounce. Holding this slot at minimum weight makes sense as a hedge against a sudden pivot to risk-on, but the technical setup would need to clear resistance at 75.31 and sustain volume above 0.70x before deserving elevation.
AI — SMH
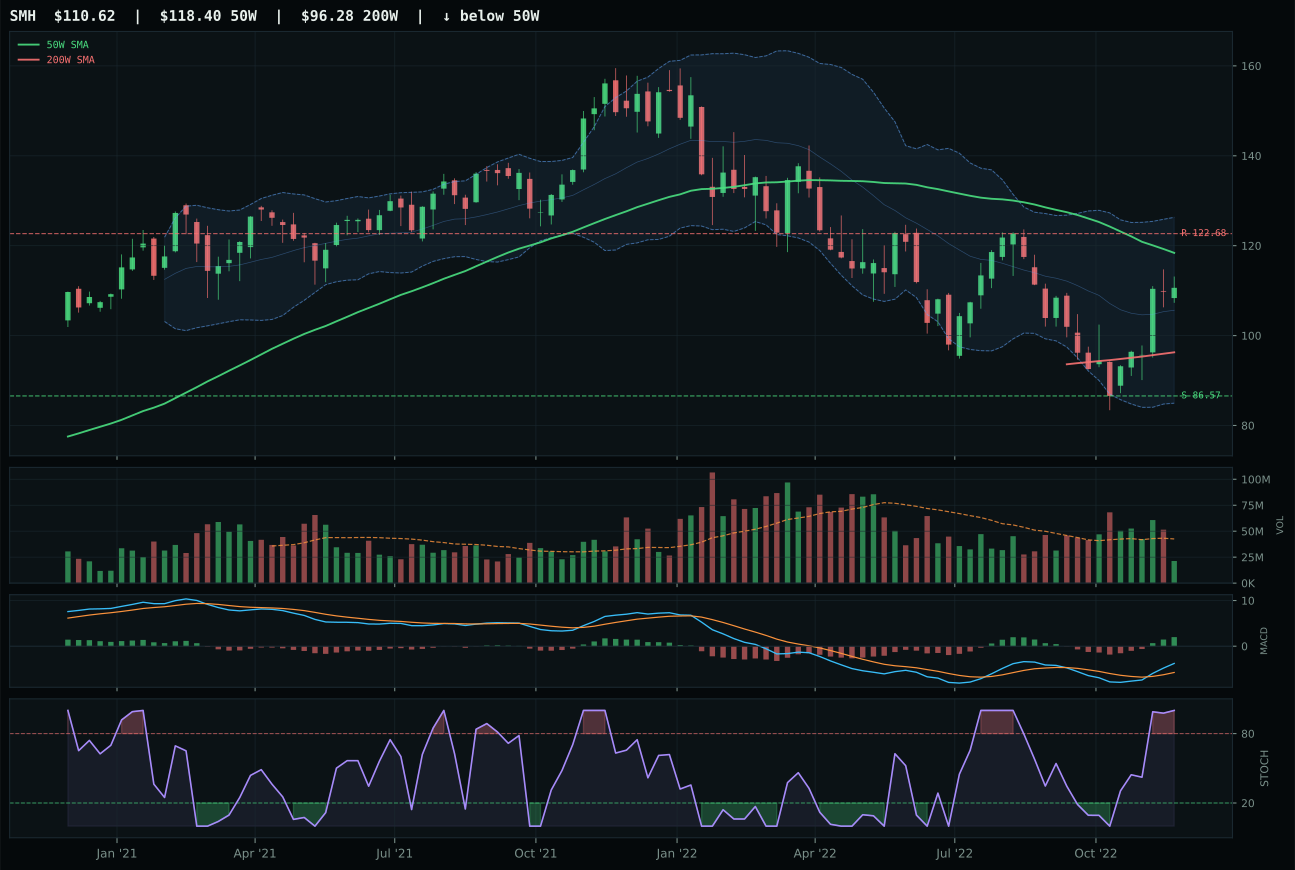
SMH has a neutral structure profile with 0.1% 13-week relative strength versus SPY.
A failed hold above support would weaken the setup.
Actionable but governed by invalidation levels.
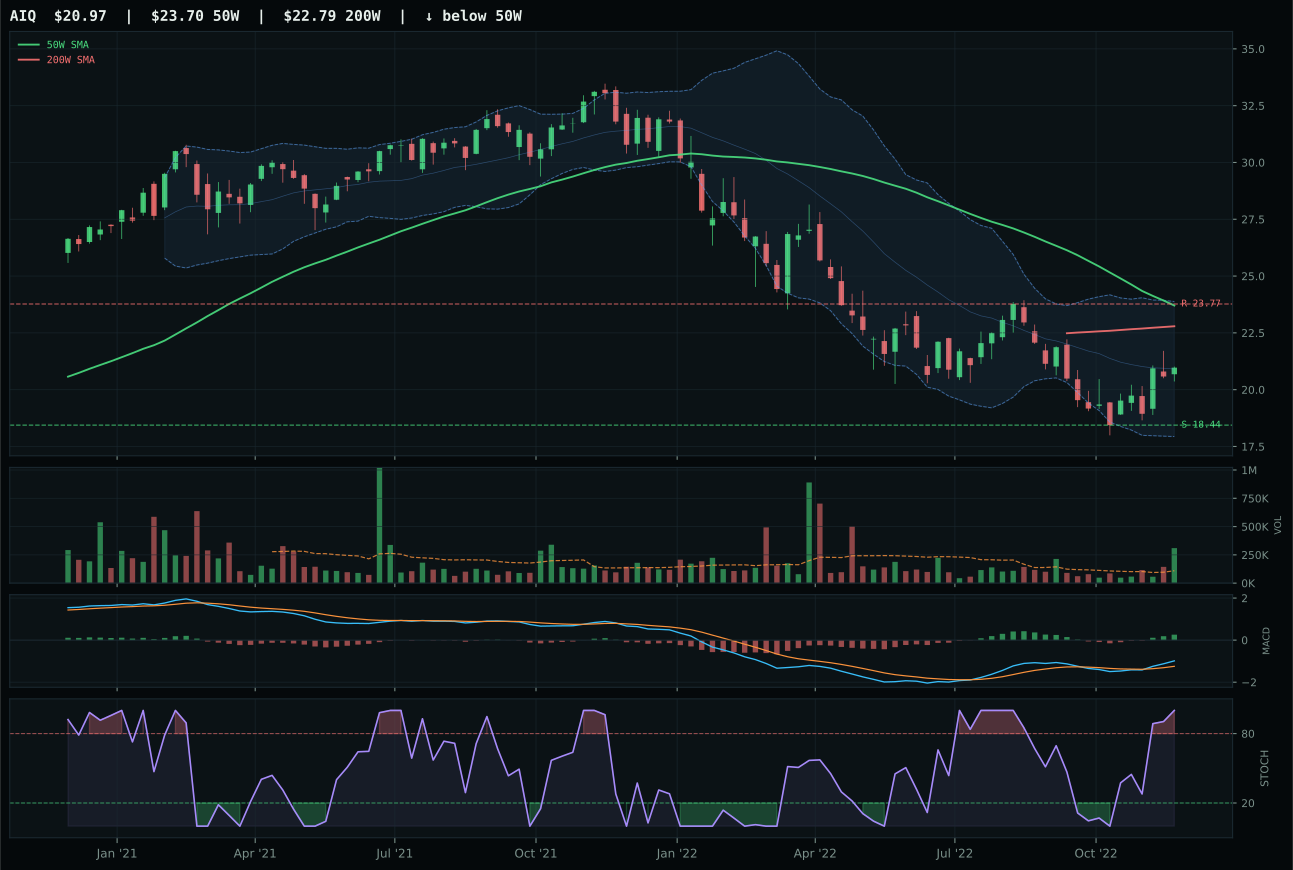
AIQ has a neutral structure profile with -4.2% 13-week relative strength versus SPY.
A failed hold above support would weaken the setup.
Tracked, but not top-2 eligible because: .
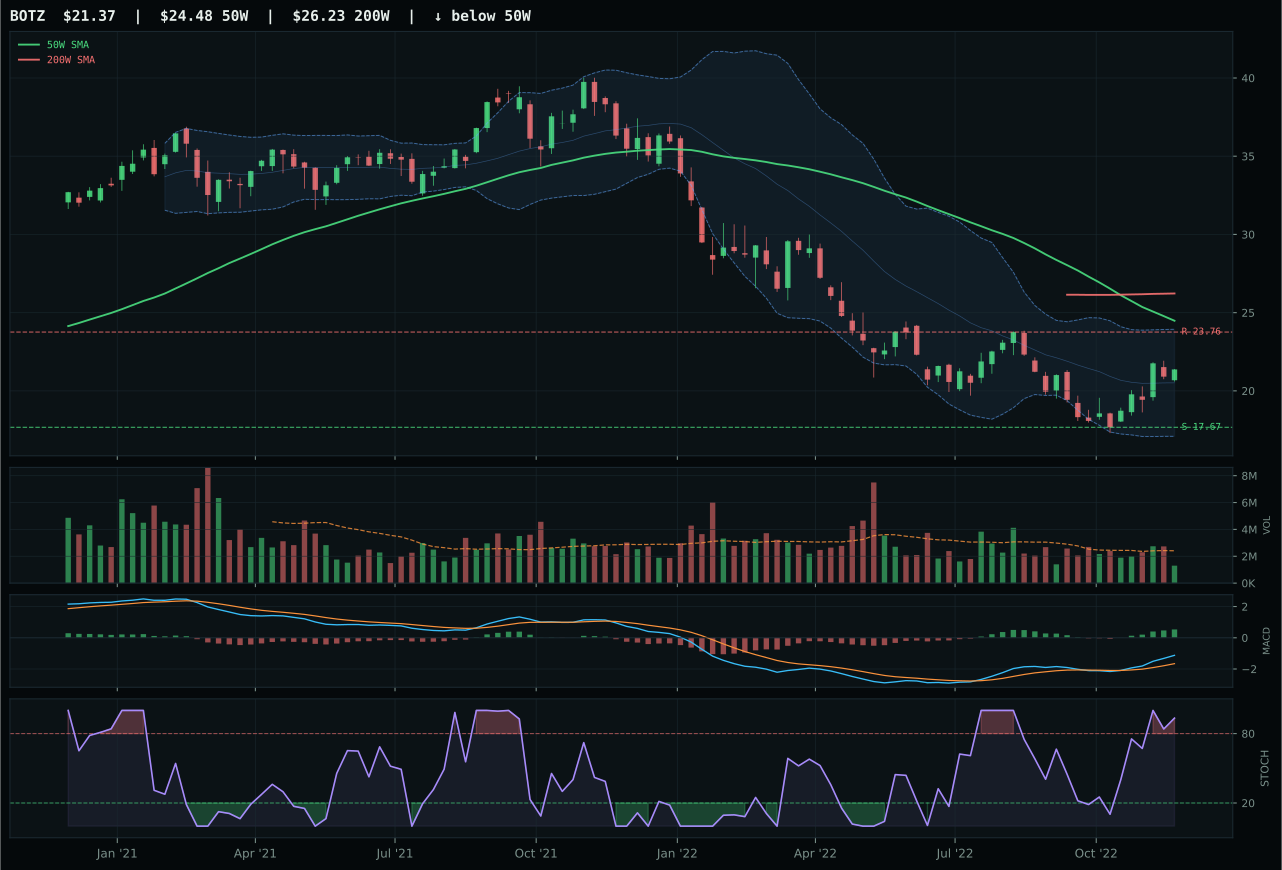
BOTZ has a neutral structure profile with 1.4% 13-week relative strength versus SPY.
Extension and support failure are the main tactical risks.
Tracked, but not top-2 eligible because: structurally broken.
SMH dominates this category with a 39.7-point rout of runner-up AIQ, driven by a momentum confirmation score of 83.2/100—the highest in the entire eight-category portfolio. The 4-week return of 14.8% signals recent buyer sponsorship even as the 13-week return of only -0.6% shows this momentum is fresh, not extended. AIQ stumbled on timing (55.0 vs 82.0), a critical miss because price sits exactly 4.5% below the 50-day and the Fibonacci zone sits in the 0.618 repair level—timing matters more than trend in oversold setups. SMH's neutral structure combined with rising momentum and MACD improving creates a coiled spring; the risk is asymmetric to the upside if 122.68 resistance breaks on volume confirmation.
AI received zero allocation because its 18.8 category score ranks ninth or tenth overall, and the macro environment is actively lethal to semiconductor and AI-software demand. Category-level macro fit is 22.0/100, the second-lowest reading in the 10-category universe, poisoned by three major active headwinds: liquidity stress (−12), credit stress (−8), and broad market bear (−8). In a Late-Cycle Reflation regime starved for capital and facing rising default risk, semiconductor capex cycles freeze and AI software-as-a-service customer acquisition costs spike. SMH's 61.6 technical composite is respectable but cannot overcome the gravity of collapsing liquidity; without institutional bid flow, even a reset near value support will struggle to hold. This category belongs on a watchlist for re-entry only after credit spreads normalize and the liquidity-stress descriptor flips to neutral or positive.
Emerging Markets — INDA
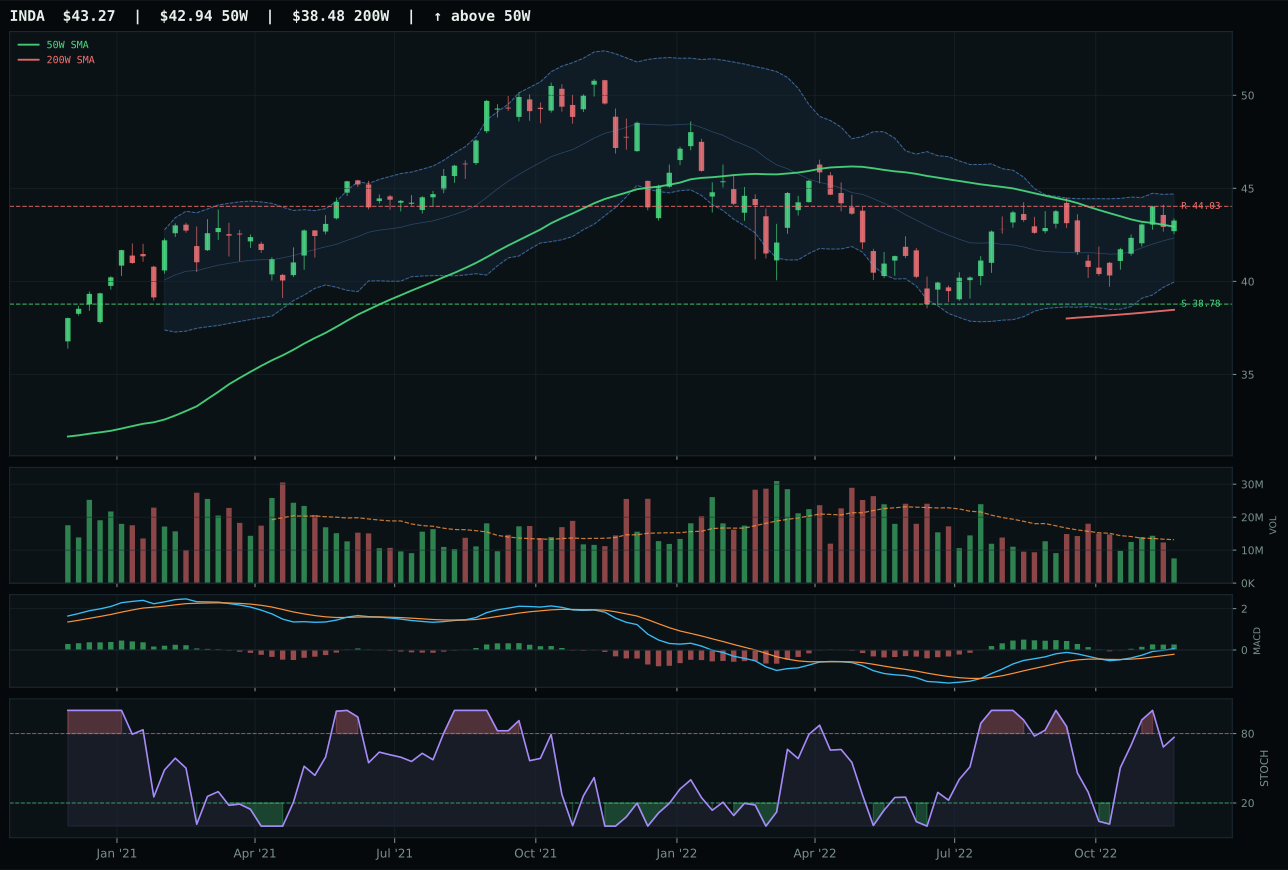
INDA has a compression near 50W profile with 2.3% 13-week relative strength versus SPY.
A failed hold above support would weaken the setup.
Actionable but governed by invalidation levels.
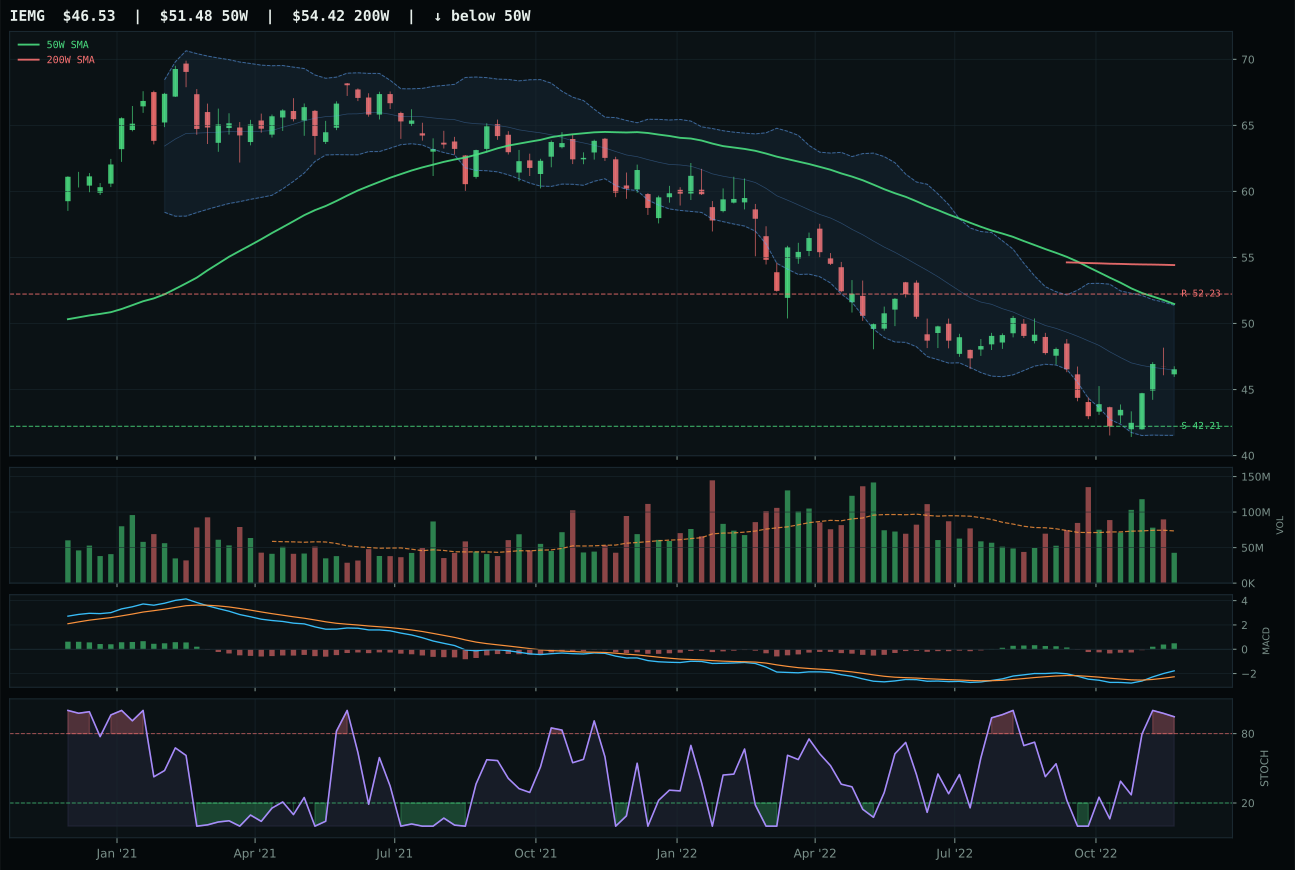
IEMG has a neutral structure profile with -4.6% 13-week relative strength versus SPY.
Extension and support failure are the main tactical risks.
Tracked, but not top-2 eligible because: structurally broken.
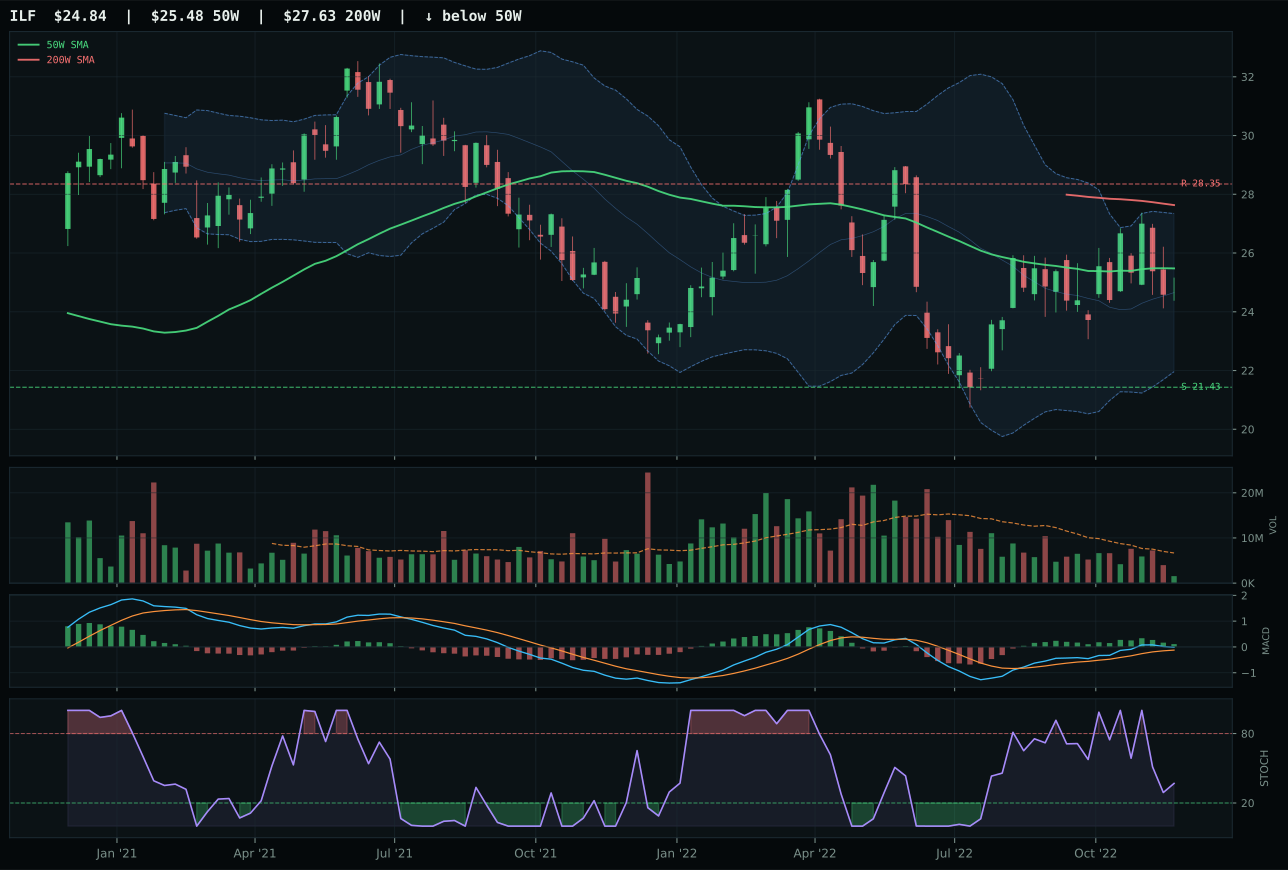
ILF has a compression near 50W profile with -1.8% 13-week relative strength versus SPY.
Extension and support failure are the main tactical risks.
Tracked, but not top-2 eligible because: structurally broken.
INDA demolished its competition with an 82.2/100 technical evidence score and a 64.2-point margin over IEMG, winning on trend (83.4), timing (perfect 100.0), and momentum (72.3). Price trades just 0.8% above the 50-day in pure compression, MACD is bullish and improving, and stochastic RSI is falling from neutral—the setup is coiled but not overbought, creating room to run without near-term vulnerability. IEMG's structural breakdown is real: stochastic sits overbought, structure is fragmented (37.0 vs 70.9), and trend is weakening (-1.0% relative strength). INDA's compression near the moving average offers maximum leverage if buyers step in; the middle Fibonacci zone at 0.500 is the decision point where conviction either builds or evaporates. Volume at 0.57x is thin, but INDA's tight price structure means even modest accumulation would register clearly.
Emerging Markets received zero allocation because its 7.4 category score is the lowest in the 10-category portfolio, poisoned by a 21.0/100 macro fit rating—the second-worst in the universe after AI. Three dominant headwinds explain the exclusion: credit stress (−10), liquidity stress (−10), and broad market bear (−9). Emerging markets are the first to suffer in a late-cycle liquidity event; when institutional investors panic, they dump EM equity and EM currency risk, regardless of local economic strength. India is structurally stronger than broad EM, but it is not strong enough to overcome the category-level macro headwind. INDA's 82.2 technical composite cannot override the reality that emerging-market allocators are rotating into cash and developed-market safe havens. This category belongs on the permanent watchlist but should not be allocated until credit spreads normalize and the liquidity stress descriptor flips neutral or positive—a conditional re-entry at +2 to +3 years out when the cycle turns toward recovery.