
2022-11-18
Informational purposes only. The content in this report, including allocations, analysis, and commentary, is provided solely for informational and educational purposes. It does not constitute financial advice, investment advice, trading advice, or any other type of advice. Past performance does not guarantee future results. Always conduct your own research and consult a qualified financial professional before making investment decisions.
Weekly Allocation
| Ticker | Category | Weight | Role |
|---|---|---|---|
| XLE | Traditional Energy | 20% | Top-2 (20%) |
| COPX | Industrial Metals | 20% | Top-2 (20%) |
| URA | Nuclear Energy | 10% | Tier-2 (10%) |
| VEGI | Agriculture & Livestock | 10% | Tier-2 (10%) |
| GLD | Precious Metals | 10% | Tier-2 (10%) |
| XLU | Utilities & Infrastructure | 10% | Tier-2 (10%) |
| XAR | Defense & Aerospace | 10% | Tier-2 (10%) |
| XLK | Technology | 10% | Tier-2 (10%) |
Trade Instructions — Monday Open
Sell the tranche from 2022-10-21 (completing its 4-week hold). Buy the new tranche. Instructions show net portfolio changes — same-asset positions cancel, weight changes show the delta.
| Action | Ticker | Instruction |
|---|---|---|
| SELL | XLE | Sell 20% of XLE position (reduce 50.00% → 40.00%) |
| SELL | PICK | Sell entire PICK position (2.50% of portfolio) |
| SELL | URNM | Sell 50% of URNM position (reduce 2.50% → 1.25%) |
| SELL | MOO | Sell 33% of MOO position (reduce 3.75% → 2.50%) |
| SELL | ITA | Sell 25% of ITA position (reduce 5.00% → 3.75%) |
| SELL | PAVE | Sell 20% of PAVE position (reduce 6.25% → 5.00%) |
| SELL | CIBR | Sell entire CIBR position (1.25% of portfolio) |
| BUY | GLD | Buy GLD — 6.67% of freed cash (adds 1.25% to portfolio) |
| BUY | COPX | Buy COPX — 26.67% of freed cash (adds 5.00% to portfolio) |
| BUY | XLK | Buy XLK — 13.33% of freed cash (adds 2.50% to portfolio) |
| BUY | URA | Buy URA — 13.33% of freed cash (adds 2.50% to portfolio) |
| BUY | XAR | Buy XAR — 13.33% of freed cash (adds 2.50% to portfolio) |
| BUY | VEGI | Buy VEGI — 13.33% of freed cash (adds 2.50% to portfolio) |
| BUY | XLU | Buy XLU — 13.33% of freed cash (adds 2.50% to portfolio) |
Current Portfolio After Trade
Combined holdings across all 4 active tranches. Each tranche is 25% of the portfolio.
| Ticker | % of Portfolio | Weight Bar |
|---|---|---|
| XLE | 40.00% | |
| COPX | 11.25% | |
| GLD | 7.50% | |
| XLK | 6.25% | |
| URA | 6.25% | |
| PAVE | 5.00% | |
| XAR | 5.00% | |
| VEGI | 5.00% | |
| ITA | 3.75% | |
| MOO | 2.50% | |
| REMX | 2.50% | |
| XLU | 2.50% | |
| URNM | 1.25% | |
| ILF | 1.25% |
Macro Regime — Late-Cycle Reflation
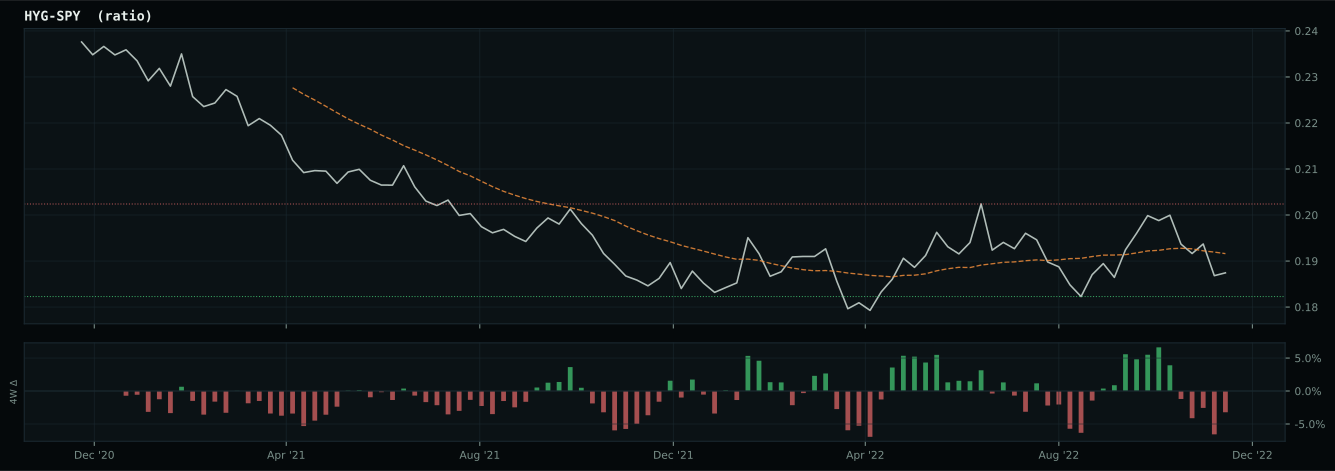
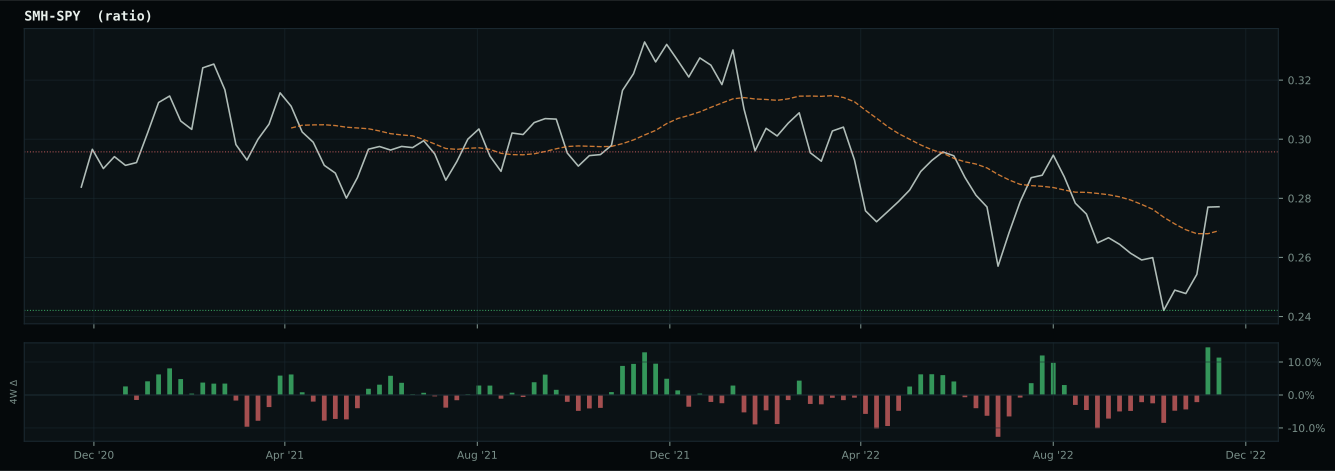
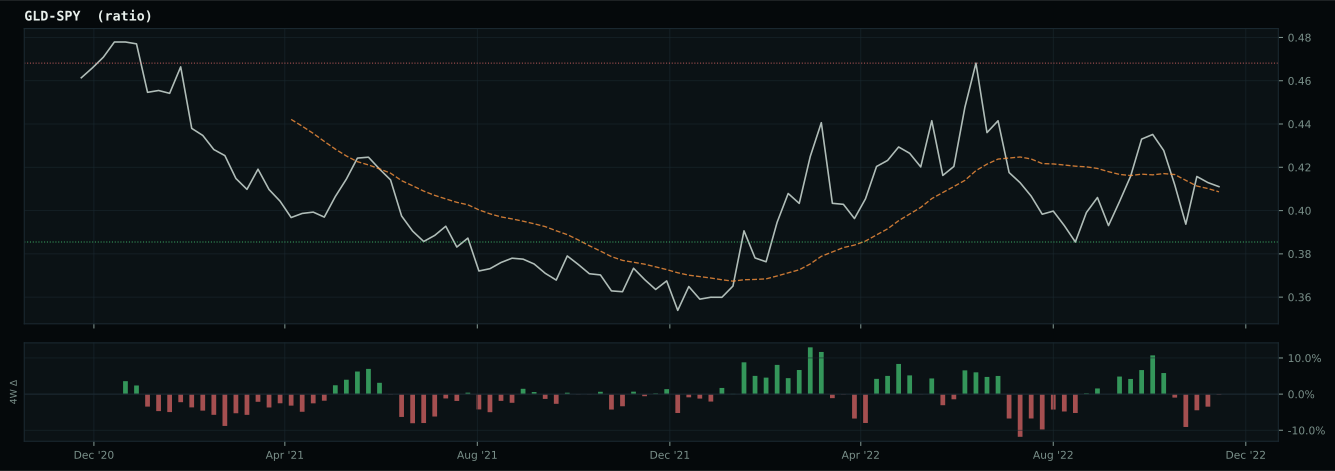
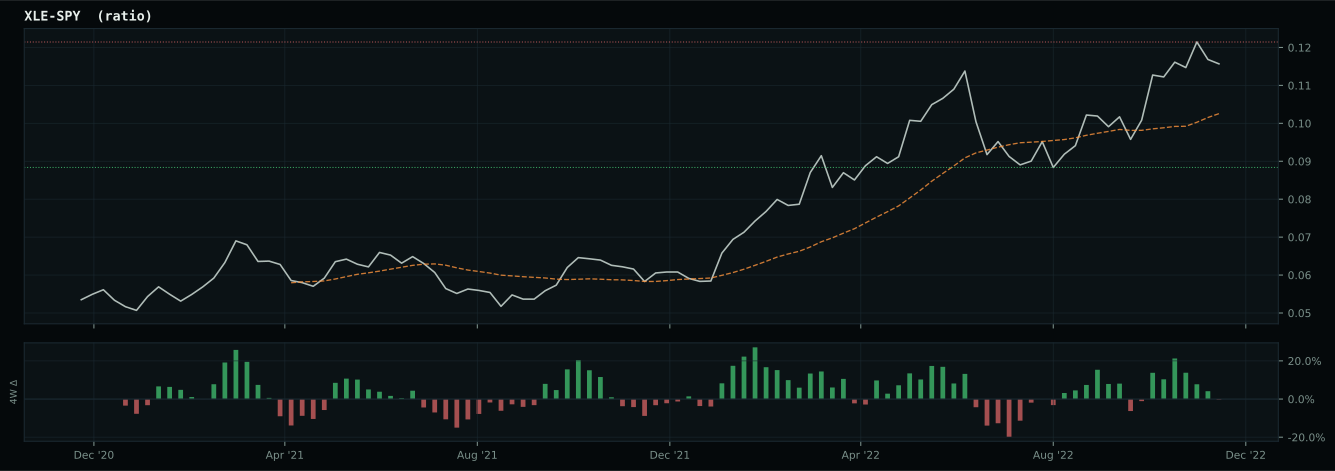
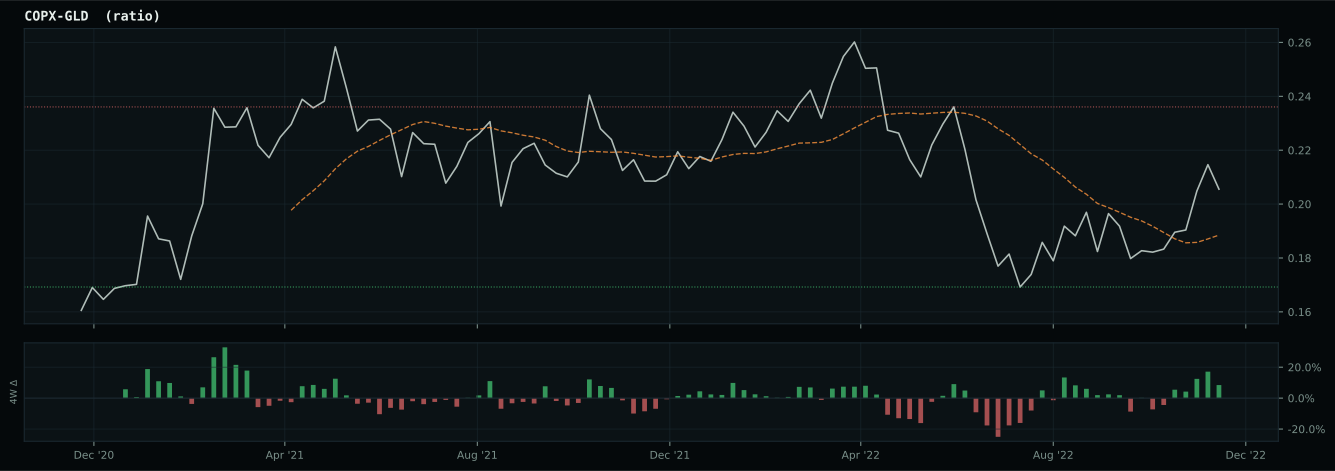
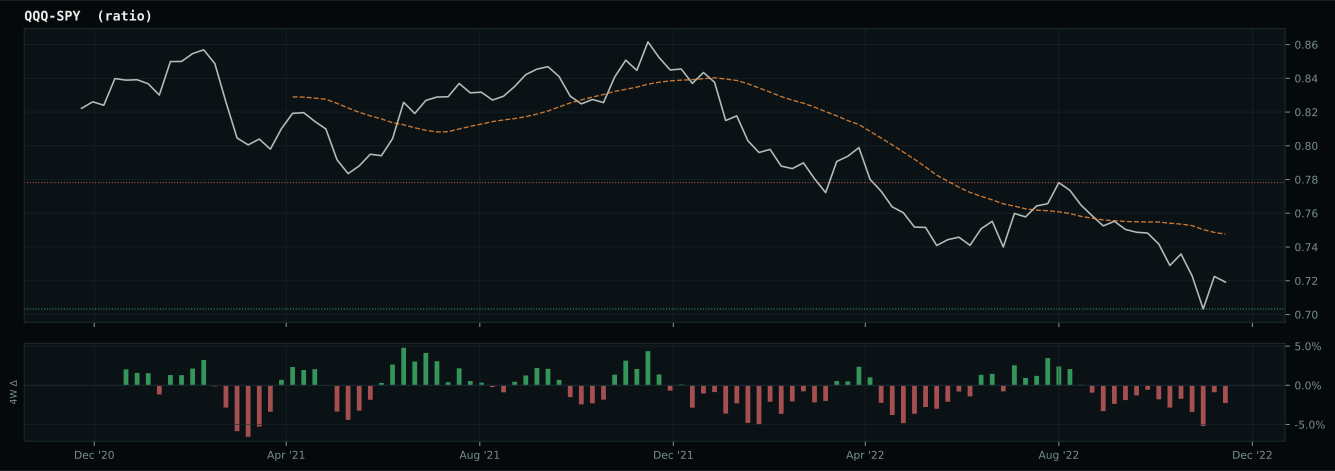
Macro Evidence Charts
Market-implied signals behind the macro regime scores. Each ratio compares two assets; the direction and slope of the ratio is what the macro engine reads.
Crypto Regime — NoCrypto
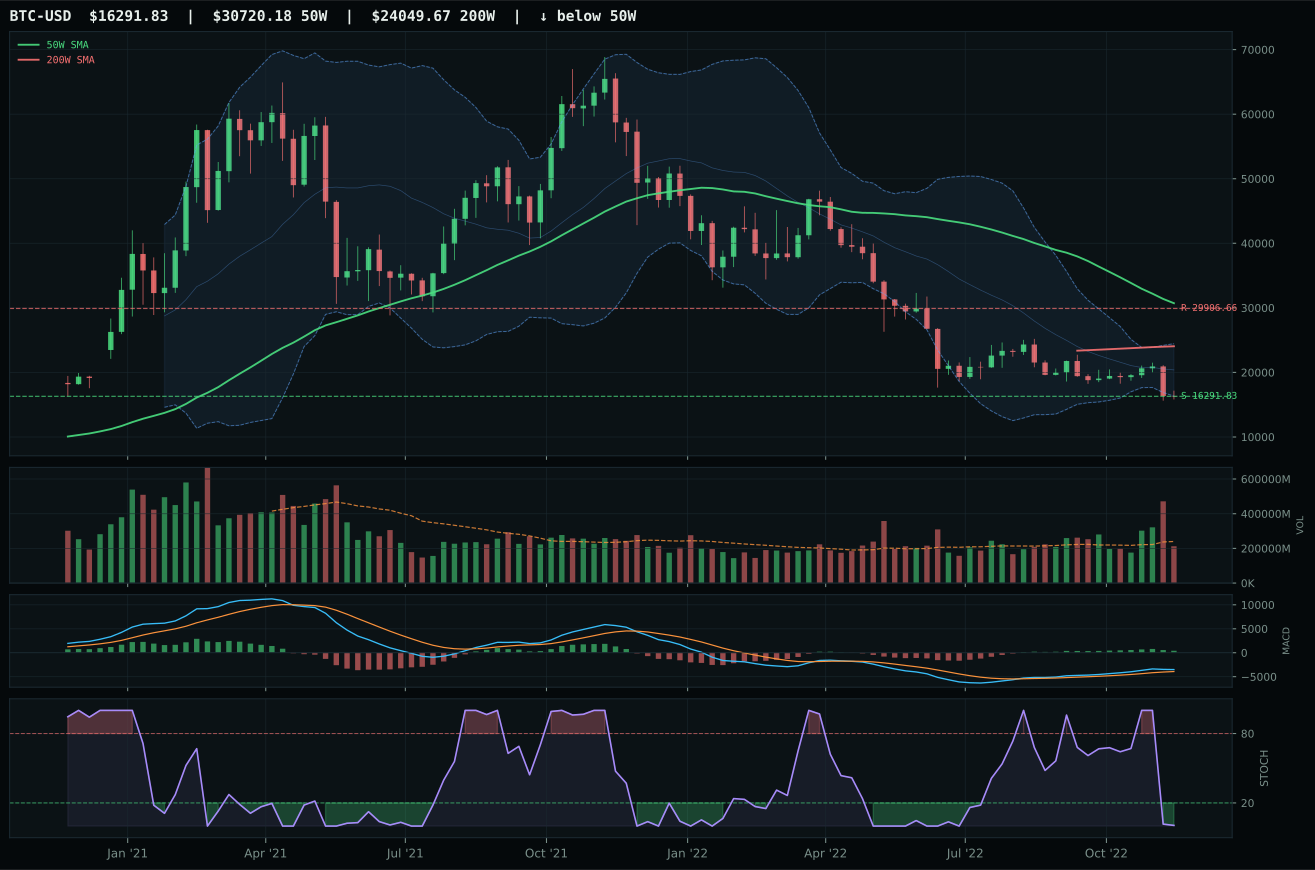
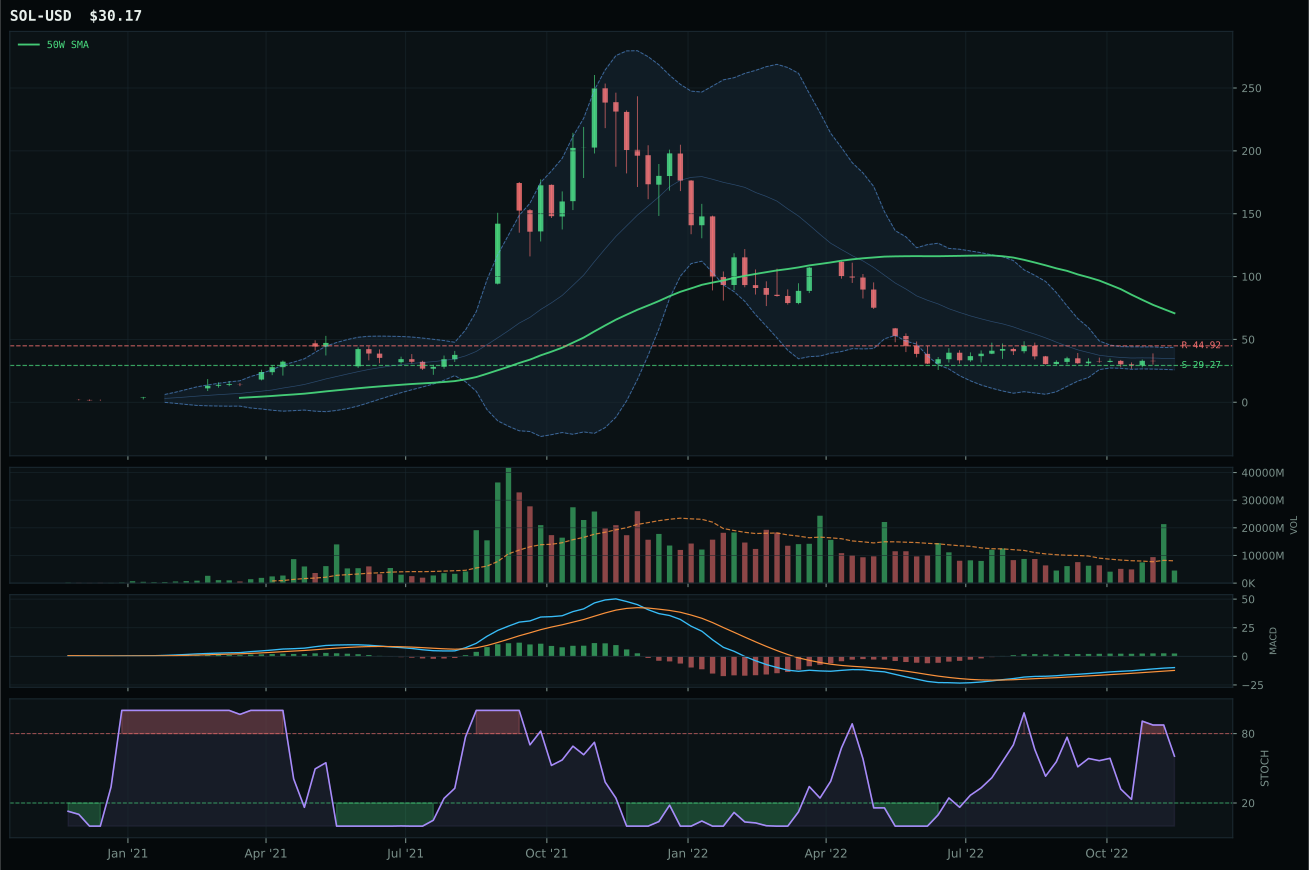
post-touch range has not been tested enough: support tests 1/2, resistance tests 3/2
TrendBTC not confirmed
one or more available conditions failed
Category Rankings
| Rank | Category | Winner | Score | Alloc | 4W Ret | Peers (4W) |
|---|---|---|---|---|---|---|
| 1 | Traditional Energy | XLE | 78.6 | 20% | -5.87% | FCG -7.5% · XOP -10.4% |
| 2 | Industrial Metals | COPX | 69.4 | 20% | +9.06% | PICK +2.4% · REMX -7.7% |
| 3 | Nuclear Energy | URA | 57.5 | 10% | -3.75% | URNM -5.3% · NLR -1.3% |
| 4 | Agriculture & Livestock | VEGI | 55.1 | 10% | -1.80% | MOO -4.1% · WEAT -7.4% |
| 5 | Precious Metals | GLD | 52.0 | 10% | +2.63% | SLV +11.1% · GDX +3.9% |
| 6 | Utilities & Infrastructure | XLU | 47.8 | 10% | +1.18% | PAVE -2.0% · IGF -0.7% |
| 7 | Defense & Aerospace | XAR | 47.6 | 10% | -0.13% | ITA +0.8% · ROKT +1.3% |
| 8 | Technology | XLK | 31.2 | 10% | -3.21% | CIBR -2.5% · IGV -0.9% |
| 9 | AI | SMH | 18.3 | 0% | -2.55% | AIQ -0.7% · BOTZ +1.6% |
| 10 | Emerging Markets | INDA | 10.1 | 0% | -0.19% | IEMG +1.7% · ILF -11.5% |
Traditional Energy — XLE
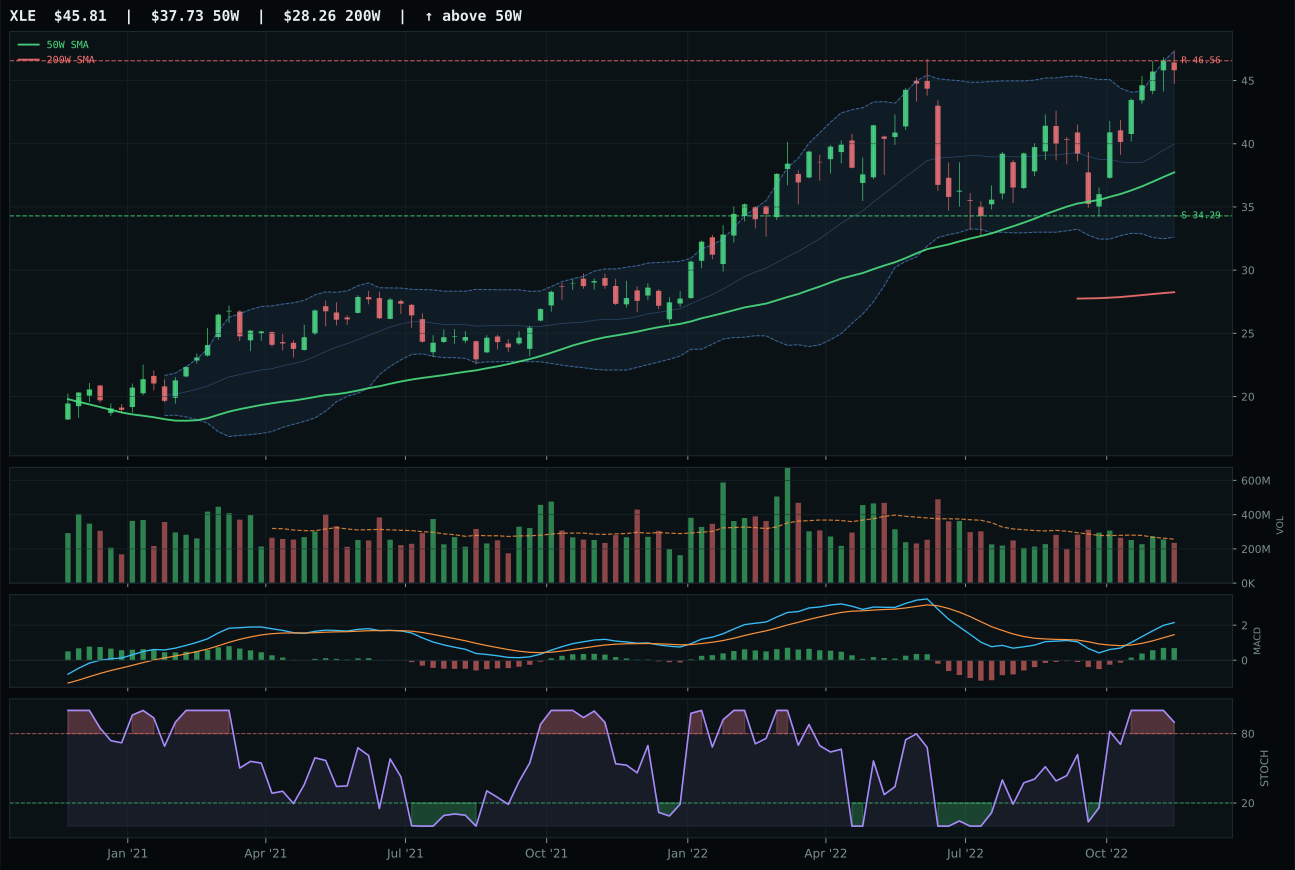
XLE has a vertical extension profile with 21.5% 13-week relative strength versus SPY.
A failed hold above support would weaken the setup.
Actionable but governed by invalidation levels.
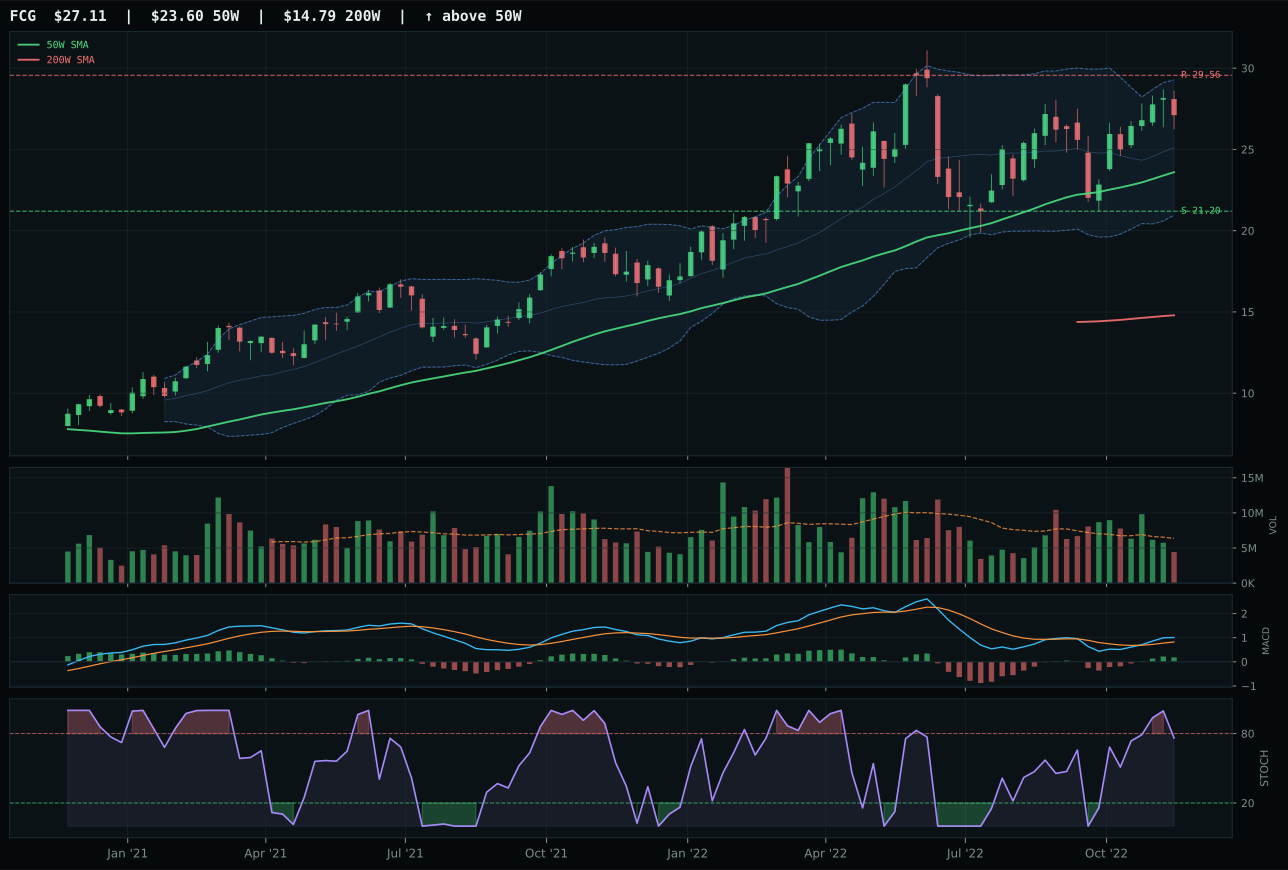
FCG has a neutral structure profile with 10.5% 13-week relative strength versus SPY.
A failed hold above support would weaken the setup.
Actionable but governed by invalidation levels.
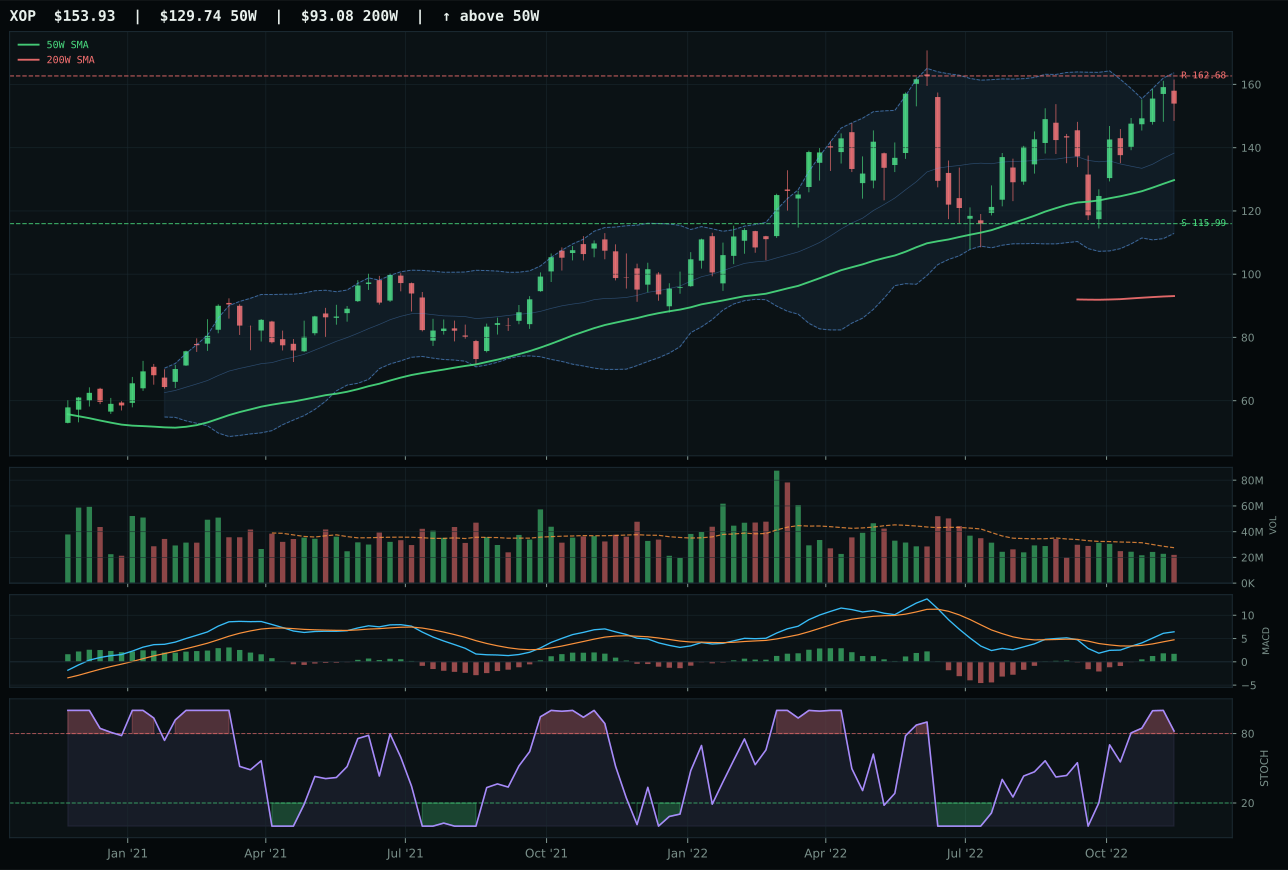
XOP has a vertical extension profile with 14.1% 13-week relative strength versus SPY.
A failed hold above support would weaken the setup.
Actionable but governed by invalidation levels.
XLE claimed top-2 status with a clean category win: 100.0 trend score (price above both moving averages, 1.0% positive 50-week slope) and identical 100.0 momentum confirmation (15.3% 13-week return, 21.5% SPY-relative strength, bullish MACD, above-average 0.92x volume). The setup's only weakness is timing: price sits 21.4% above the 50-week in the near-52-week-high zone, an extension that depressed timing to 27.0 and risk/reward to 37.9—reflecting the reality that strong trends are entries for believers, not bargain hunters. FCG's 75.4 macro evidence nearly matches XLE's 64.3, but thin volume participation, falling stochastic RSI, and weaker category-relative strength of -3.7% versus XLE's 7.4% exposed FCG as a laggard in a category where momentum and volume sponsorship are non-negotiable. Energy scarcity at +14 and inflation pressure at +10 are category-defining, not name-selecting, factors.
Traditional Energy earned 20% allocation on the portfolio's strongest category macro fit of 90.0/100, driven by energy scarcity (+16), inflation pressure (+10), supply shortage (+9), and real-asset sponsorship (+7). This is the one category where the macro regime—late-cycle reflation with active supply constraints—creates genuine structural tailwinds that extend beyond the current trading cycle. XLE's extension above the 50-week is a technical warning sign that late buyers will suffer, but the category's 78.6 score and XLE's momentum profile justify top-2 positioning as portfolio insurance against further inflation re-acceleration or geopolitical disruption. The 20% allocation reflects capital commitment to energy as both a tactical momentum play and a structural macro hedge; this is the only category where technical stretch coexists with macro conviction.
Industrial Metals — COPX
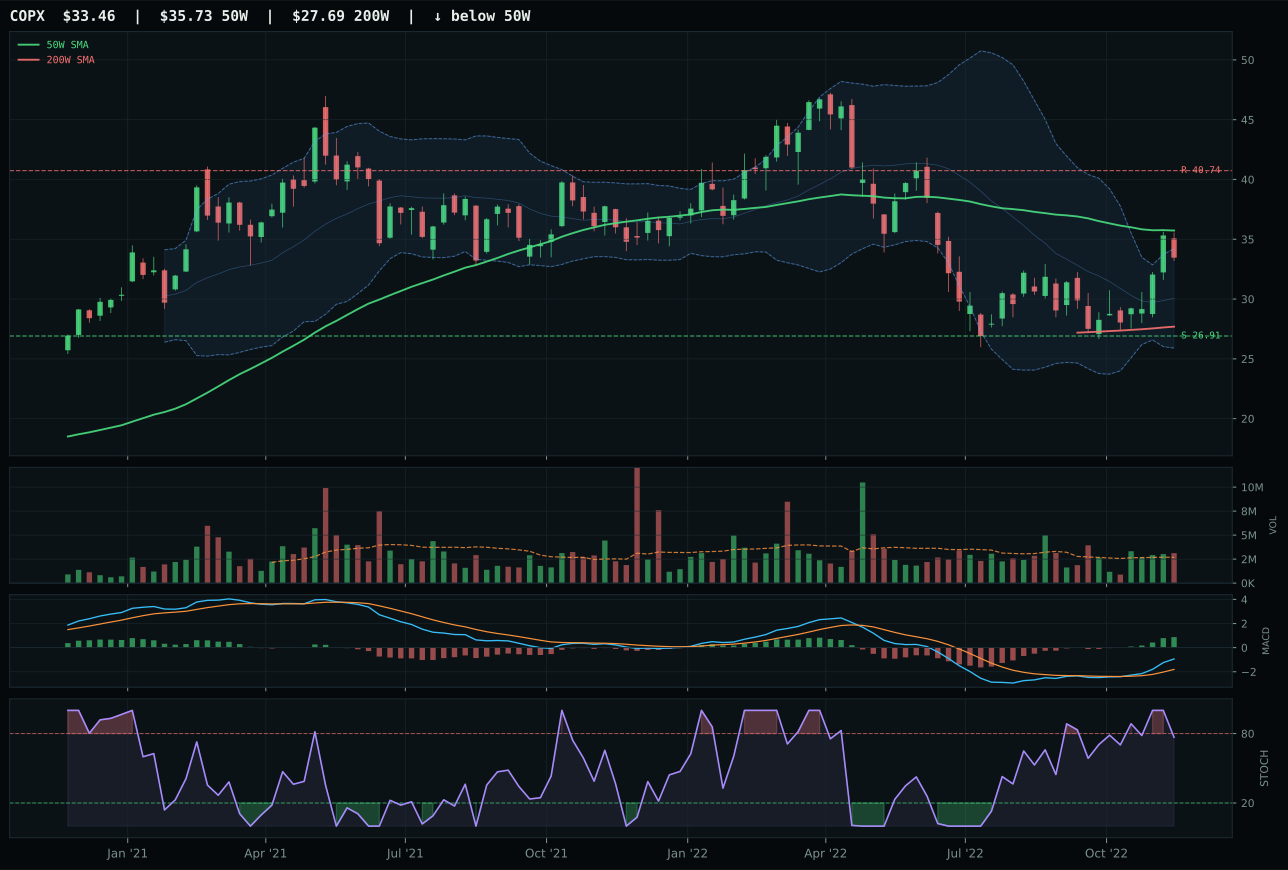
COPX has a neutral structure profile with 15.4% 13-week relative strength versus SPY.
A failed hold above support would weaken the setup.
Actionable but governed by invalidation levels.
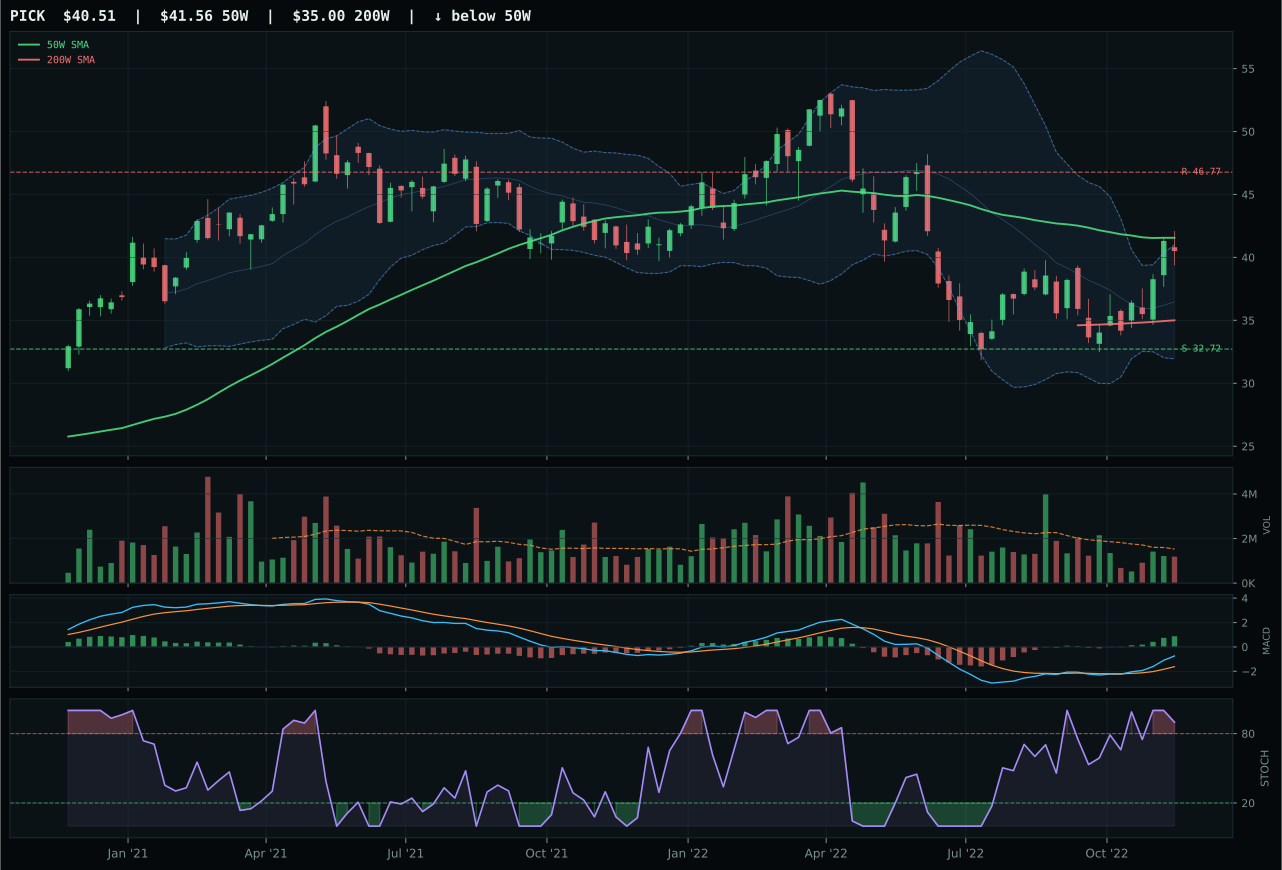
PICK has a compression near 50W profile with 13.9% 13-week relative strength versus SPY.
A failed hold above support would weaken the setup.
Actionable but governed by invalidation levels.
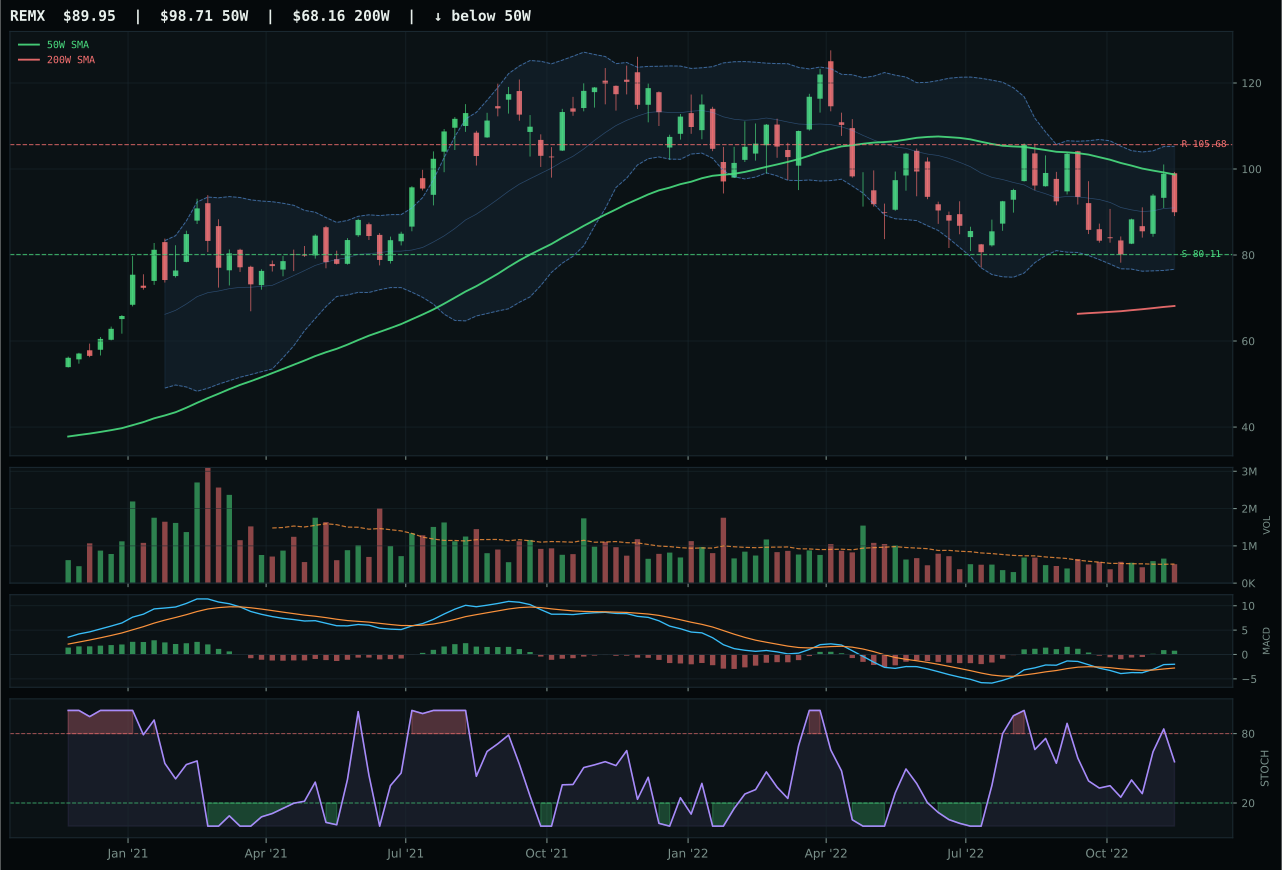
REMX has a neutral structure profile with -0.3% 13-week relative strength versus SPY.
A failed hold above support would weaken the setup.
Actionable but governed by invalidation levels.
COPX earned top-2 status by delivering a rare 100.0 momentum confirmation score—4-week return of 14.5% and 13-week return of 9.2% with above-average 1.16x volume participation—while sitting in the textbook value zone 6.4% below the 50-week moving average. The setup avoids both the stretched extremes of extended rallies and the dead-money traps of oversold debris; price in the Fibonacci 0.618 zone with neutral structure meant buyers were actively accumulating rather than capitulating. PICK's runner-up finish reflects a higher macro evidence score of 81.7 but critical technical failures: neutral volume (versus COPX's above-average participation), overbought stochastic RSI (versus COPX's falling/neutral 0.77), and zero category-relative strength (versus COPX's 1.6%). The cleanliness gap of 69.8 versus 68.1 is narrow, but volume-price confirmation of 74.7 for COPX versus 71 for PICK sealed the category win.
Industrial Metals earned 20% allocation as a top-2 category on both technical merit (85.2 ETF evidence for COPX) and exceptional macro alignment: metals scarcity active at +14, late-cycle reflation at +10, and real asset sponsorship at +6 create a 65.0/100 category macro fit centered on genuine supply constraints. COPX's momentum and volume participation differentiate it from defensive or value-trap positioning; 15.4% relative strength versus SPY reflects active institutional accumulation of copper thesis in a regime where industrial metals are no longer a cyclical luxury but a structural supply shock. The top-2 slot reflects both the technical setup and the portfolio's need for real-asset inflation protection. This is not speculative positioning—it is macro-driven capital allocation to a category where technical setup and fundamental scarcity align perfectly.
Nuclear Energy — URA
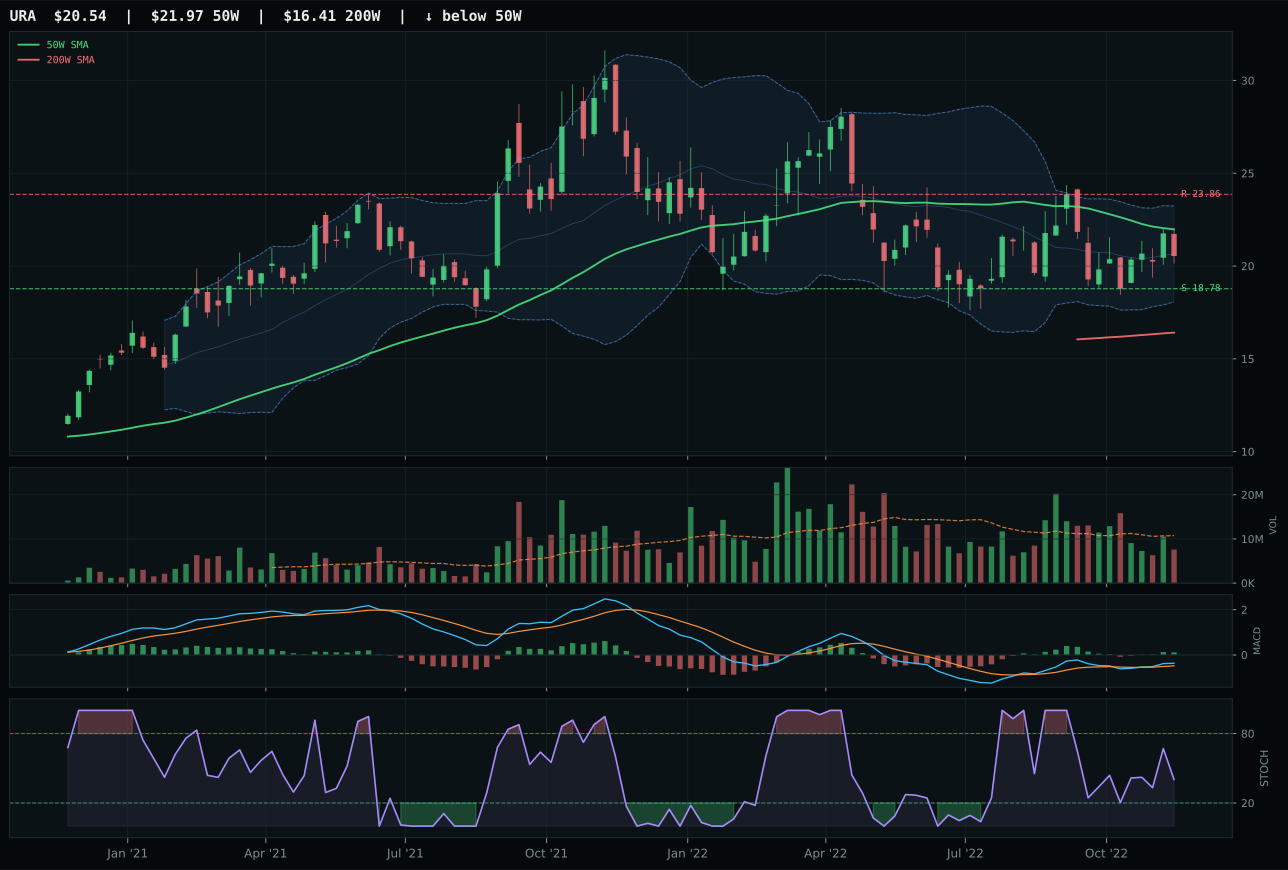
URA has a neutral structure profile with 10.8% 13-week relative strength versus SPY.
A failed hold above support would weaken the setup.
Actionable but governed by invalidation levels.
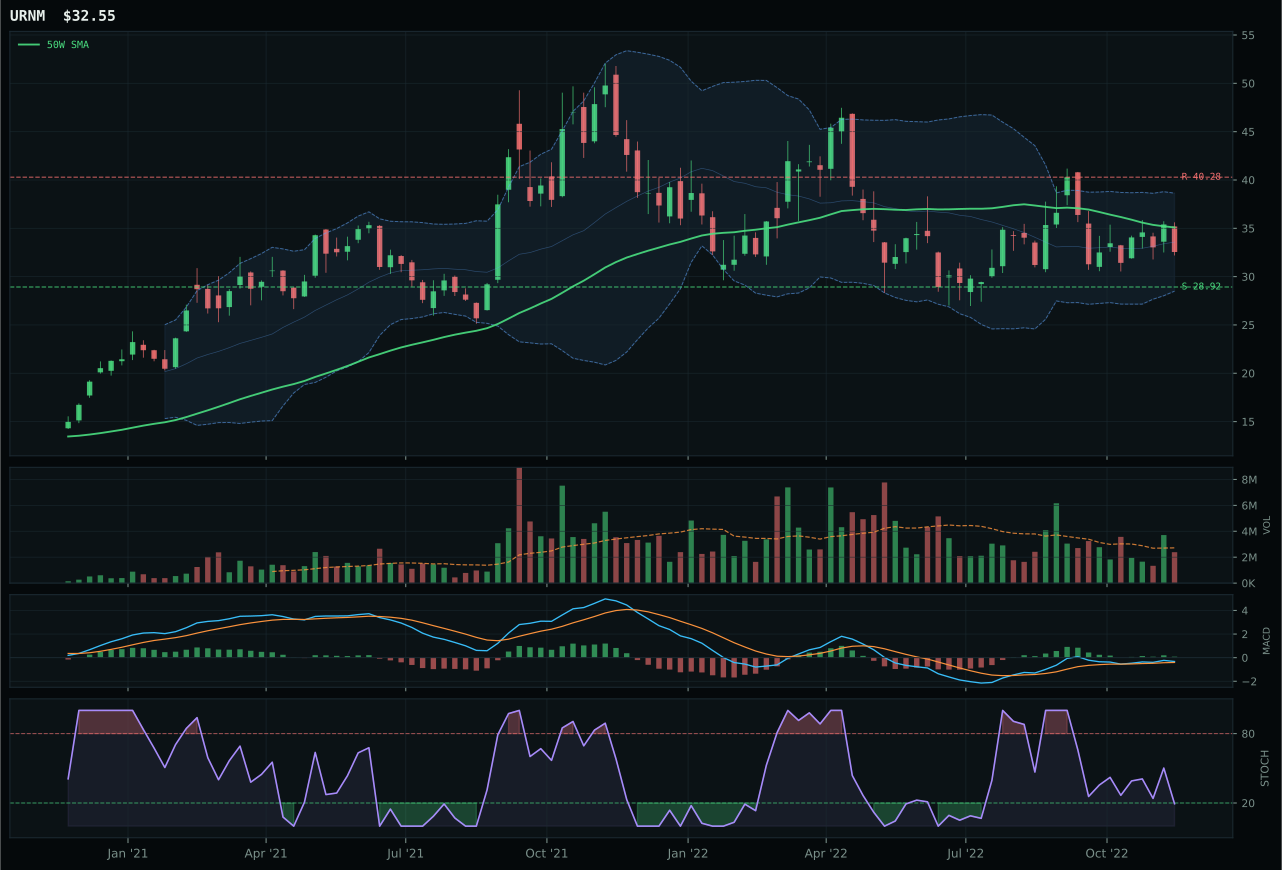
URNM has a neutral structure profile with 10.5% 13-week relative strength versus SPY.
A failed hold above support would weaken the setup.
Actionable but governed by invalidation levels.
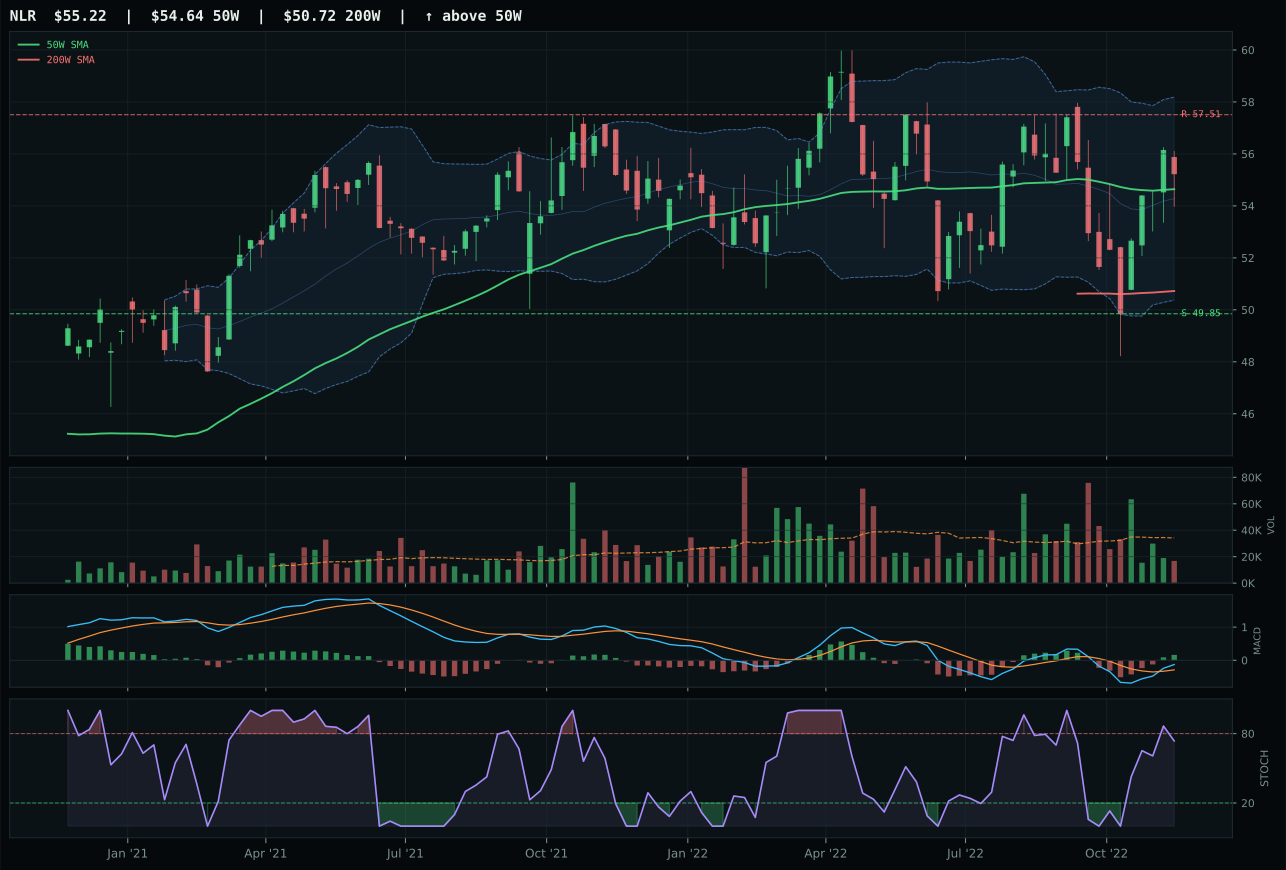
NLR has a compression near 50W profile with 4.9% 13-week relative strength versus SPY.
A failed hold above support would weaken the setup.
Tracked, but not top-2 eligible because: .
URA won narrowly over URNM on timing superiority (82.0 vs 75.0) and risk/reward clarity (64.7 vs 57.6), exploiting a setup 6.5% below the 50-week with falling/neutral stochastic RSI that allowed entry without chasing overbought conditions. Price sits in the deep Fibonacci value zone (0.786) where MACD is bullish despite thin 0.71x volume, signaling patient accumulation in a category where high-conviction buyers are scarce. URNM's uranium-miner beta exposure created MACD-stochastic divergence (overbought RSI while MACD was improving), forcing timing into a range where neither pure value nor pure momentum logic applied cleanly. URA's category-relative strength advantage of 0.3% is marginal, but it represents institutional preference for the broad uranium thesis over leveraged miner exposure in a regime where credit stress (-7) makes leveraged equities riskier.
Nuclear Energy earned 10% on a 57.5 category score and 64.0/100 macro fit anchored by energy scarcity (+9) and real asset sponsorship (+7), making it a credible late-cycle real-asset play despite thin technicals. Yet the allocation is constrained: URA's thin 0.71x volume and modest 4.6% 13-week return signal that conviction is low even among aligned macro believers, and stochastic RSI at falling/neutral (0.40) means there is no momentum confirmation to sustain positioning into weakness. The 10% slot reflects optionality on the energy-transition narrative and uranium scarcity, but does not represent conviction. Category would require either volume participation to double above 0.9x the 20-week average or URNM to demonstrate superior macro evidence to justify rotation; for now, this is a trailing-edge real-asset exposure that will be pruned if risk-off conditions intensify.
Agriculture & Livestock — VEGI
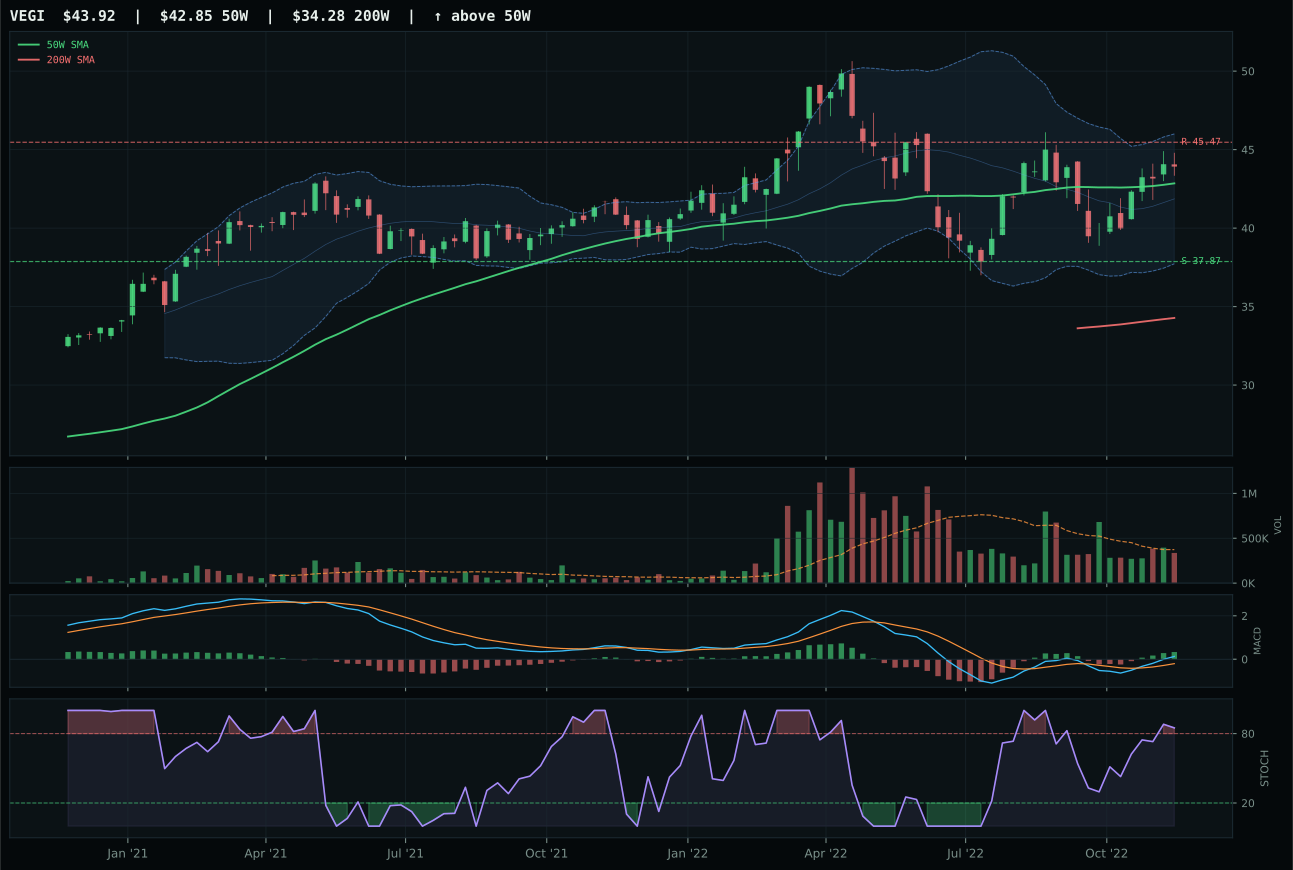
VEGI has a compression near 50W profile with 6.9% 13-week relative strength versus SPY.
A failed hold above support would weaken the setup.
Actionable but governed by invalidation levels.
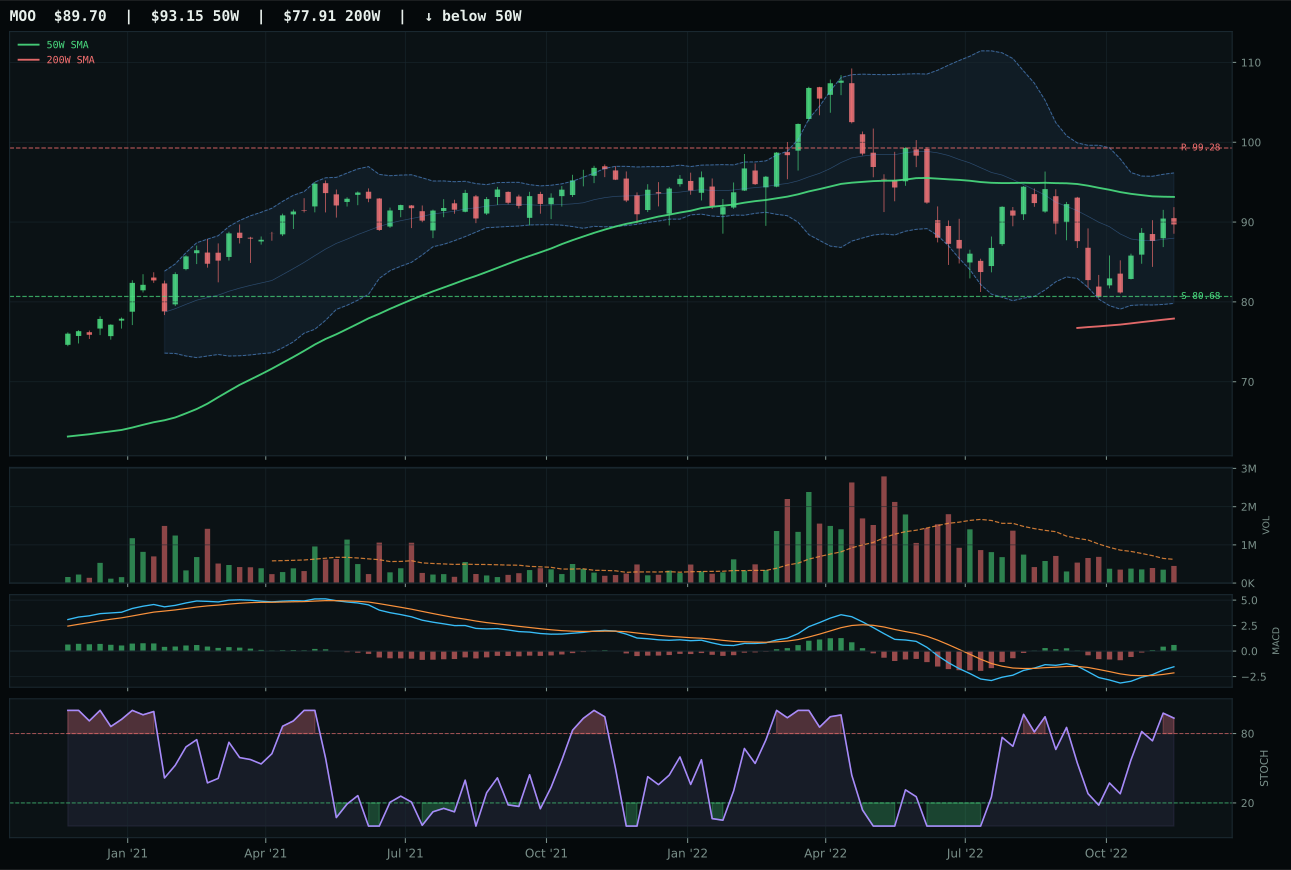
MOO has a neutral structure profile with 3.3% 13-week relative strength versus SPY.
A failed hold above support would weaken the setup.
Actionable but governed by invalidation levels.
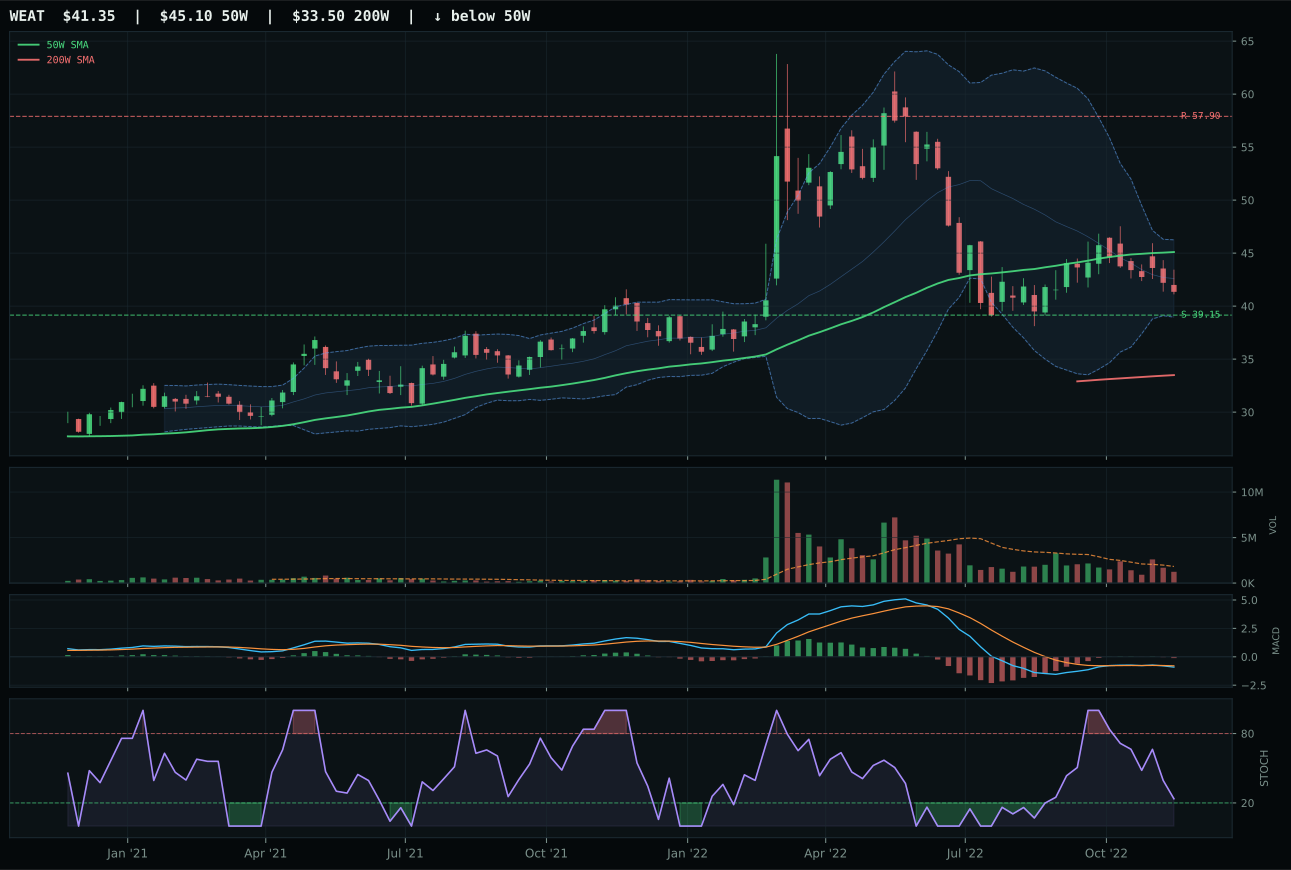
WEAT has a neutral structure profile with 10.9% 13-week relative strength versus SPY.
A failed hold above support would weaken the setup.
Actionable but governed by invalidation levels.
VEGI demolished the competition with perfect dual timing and trend scores of 100.0 each, sitting 2.5% above the 50-week with a positive 0.2% slope and 6.9% relative strength versus SPY—the only name in the category above both moving averages with a clean structure. Price compression near the 50-week combined with overbought stochastic RSI at 0.85 and bullish MACD created a textbook coil setup where expansion is neither stretched nor premature. MOO's category-relative weakness of -3.6% and thin volume participation (compared to VEGI's neutral 0.90x) exposed it as a straggler despite +8 supply shortage tailwinds and higher macro fit of 70.0 versus VEGI's 61.0. The 29.7-point gap between winners and runner-up is the largest margin in the portfolio, reflecting near-unanimous technical consensus.
Agriculture earned 10% because the category's 85.0/100 macro fit—the highest in the portfolio—stems from simultaneous supply shortage (+13) and inflation pressure (+10) signals that align with a 55.1 category score positioned in the middle-upper half of the field. Yet macro strength alone did not justify top-2 positioning; VEGI's 82.2 technical evidence and compression setup outweigh the category's macro narrative. The real tension is timing: VEGI is already extended at 100.0 timing, meaning further macro deterioration or volume confirmation loss could quickly flip this to a sale signal. The 10% allocation reflects a regime where agricultural scarcity is undeniable but technical structure is advanced enough to require defensive positioning—growth would come only if relative strength durably exceeds SPY by 8%+ and compression breaks decisively higher.
Precious Metals — GLD
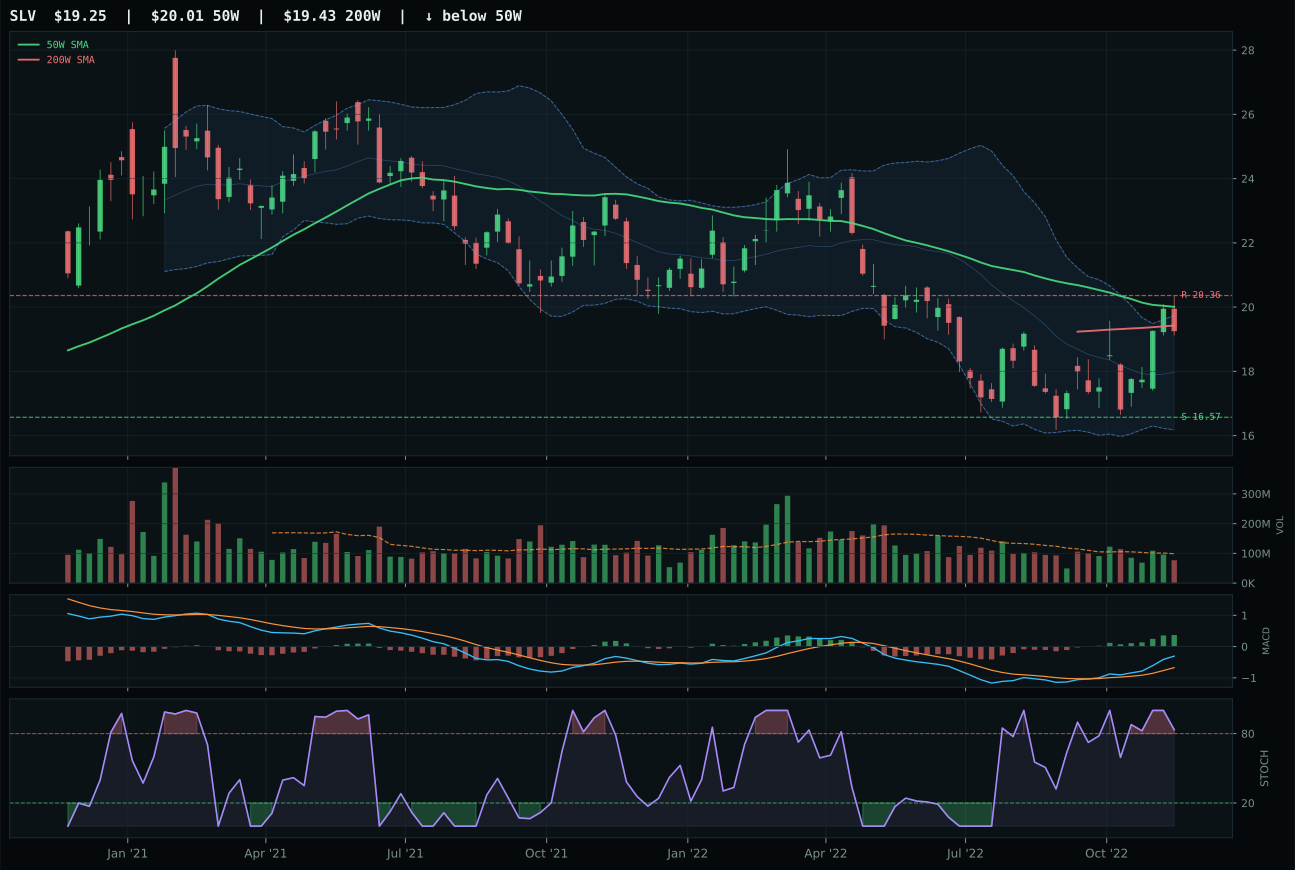
SLV has a neutral structure profile with 15.9% 13-week relative strength versus SPY.
A failed hold above support would weaken the setup.
Actionable but governed by invalidation levels.
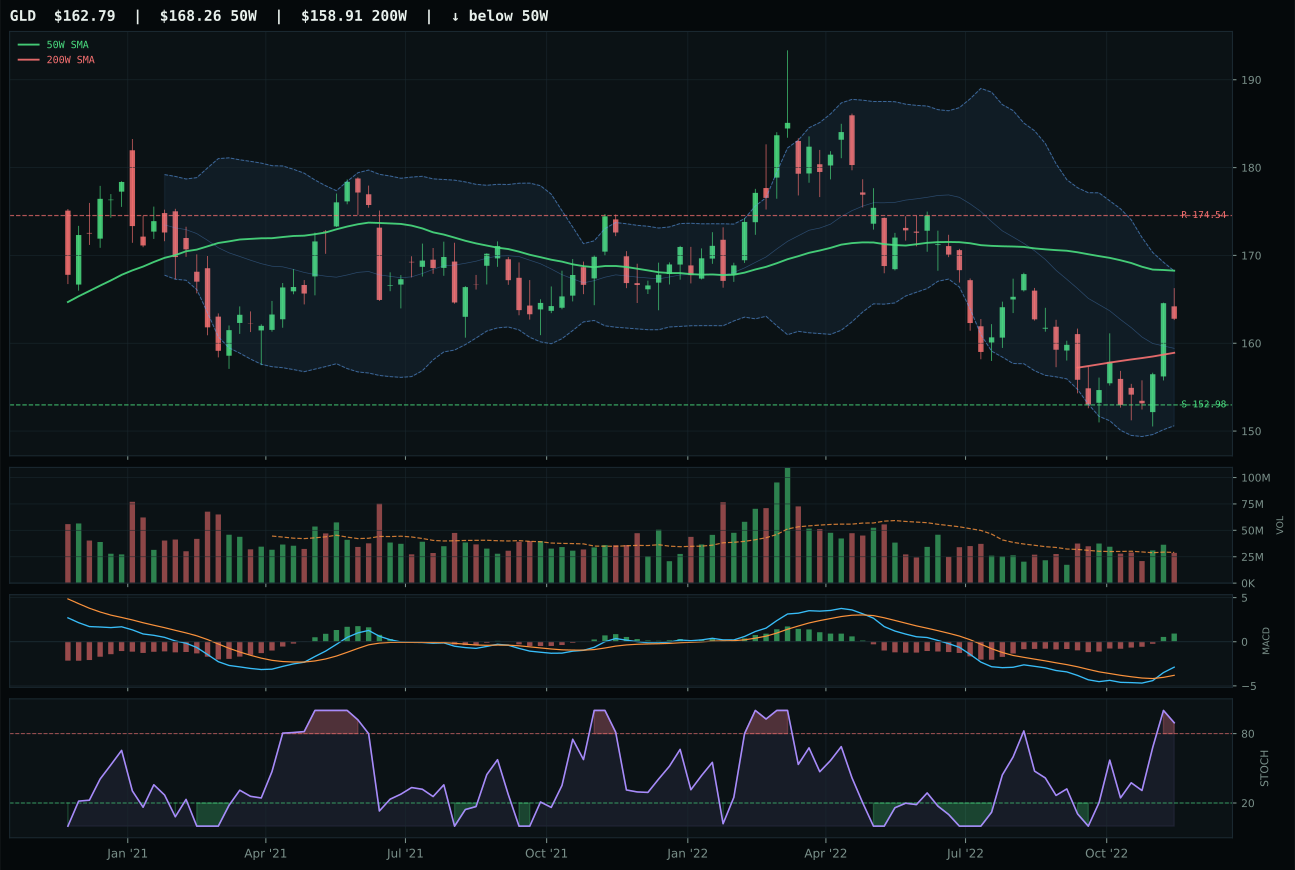
GLD has a neutral structure profile with 6.2% 13-week relative strength versus SPY.
A failed hold above support would weaken the setup.
Actionable but governed by invalidation levels.
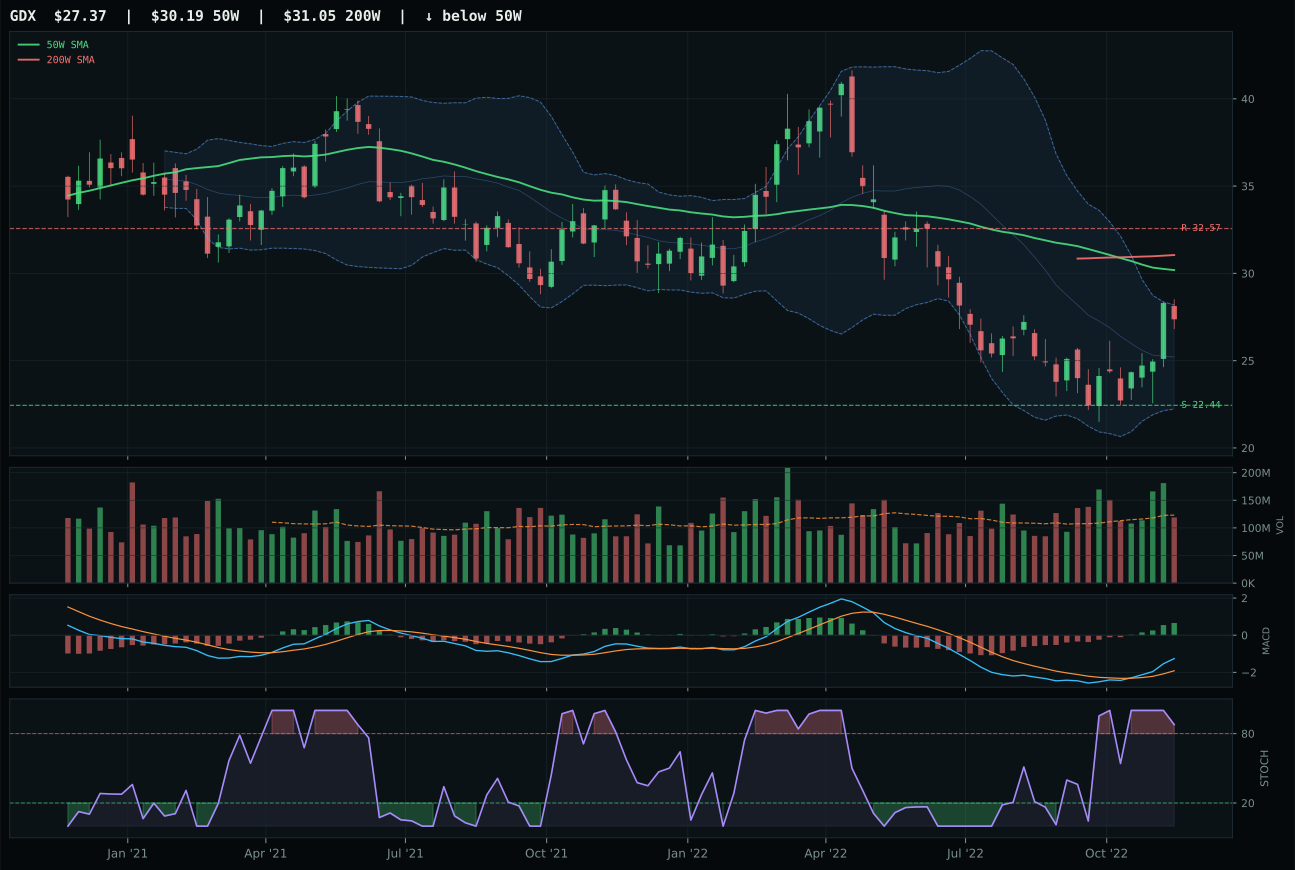
GDX has a neutral structure profile with 14.6% 13-week relative strength versus SPY.
Extension and support failure are the main tactical risks.
Tracked, but not top-2 eligible because: structurally broken.
GLD edged SLV on timing (97.0 vs 90.0) and superior risk/reward (71.9 vs 59.1), winning with a cleaner value-zone setup 3.3% below the 50-week rather than SLV's more aggressive positioning. The Fibonacci depth at 0.786 for GLD versus SLV's placement in the same zone creates different technical gravity: GLD's neutral volume and category-relative weakness of -8.4% signal authentic accumulation in a defensive flight context, while SLV's 15.9% relative strength suggests a trade that has already priced in some recovery. GLD's positioning as the monetary hedge (70.0 macro fit) versus SLV's hybrid monetary-industrial beta exposed a regime distinction—pure gold benefited from liquidity stress and credit concerns, while silver's industrial exposure became a liability in a demand-challenged environment. The 8.3-point gap is tight enough to warrant monitoring volume shifts.
Precious Metals earned 10% on a 52.0 category score and 71.0/100 macro fit driven by active monetary hedge bid (+14) and defensive rotation (+7). Yet the allocation is paradoxical: GLD is technically defensive (low momentum confirmation at 70.2), sitting in deep value with zero 13-week return, and relies entirely on macro headwinds to justify holding. The portfolio carries 10% metals exposure as insurance against credit stress and liquidity deterioration, not as an appreciation vehicle. This category would require either credit curves to steepen sharply (signaling genuine systemic concern) or GLD to demonstrate volume-backed directional momentum above 173 to justify 15%+ allocation. For now, precious metals are tactical defensive ballast; the macro fit is strong but the technical setup is inherently cautious.
Utilities & Infrastructure — XLU
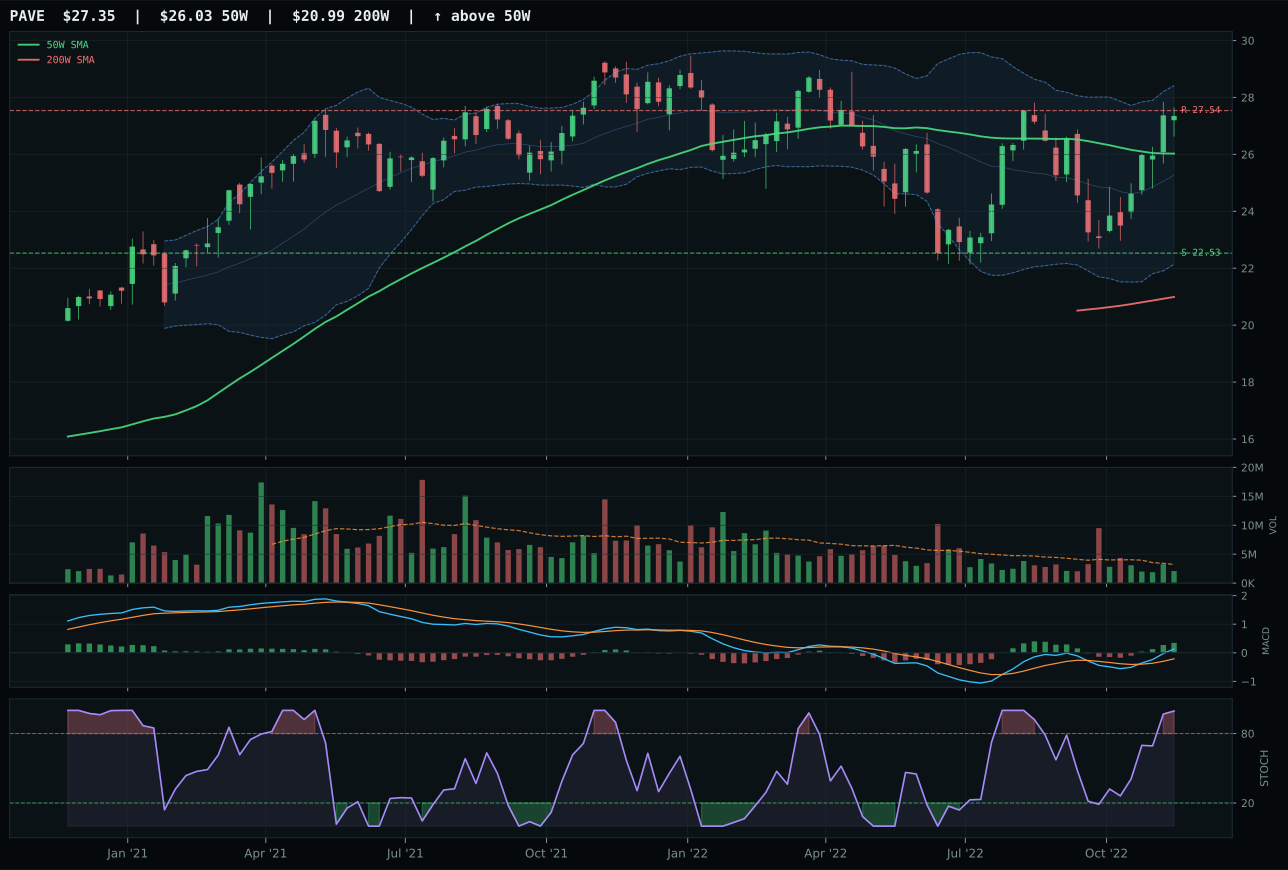
PAVE has a neutral structure profile with 6.9% 13-week relative strength versus SPY.
A failed hold above support would weaken the setup.
Actionable but governed by invalidation levels.
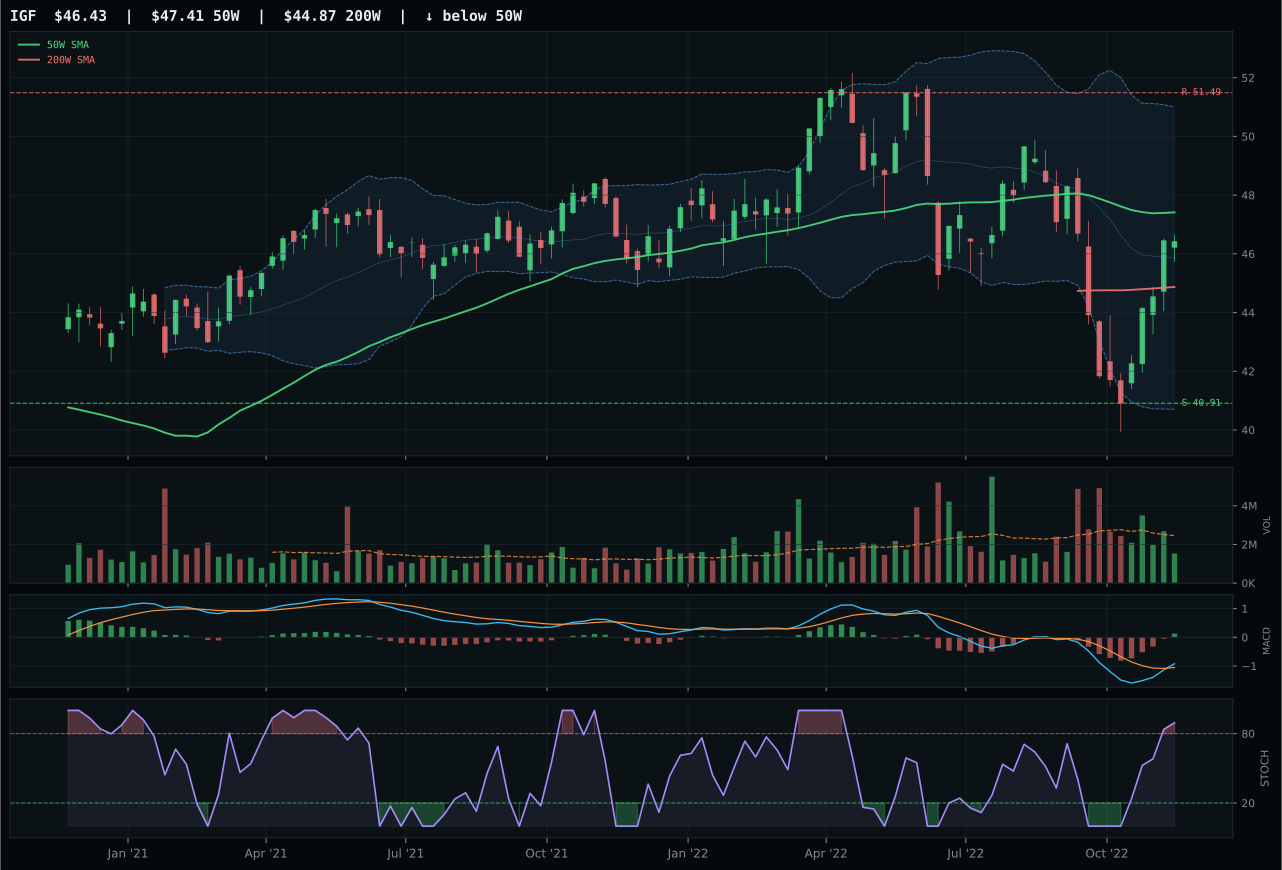
IGF has a compression near 50W profile with 0.5% 13-week relative strength versus SPY.
A failed hold above support would weaken the setup.
Actionable but governed by invalidation levels.
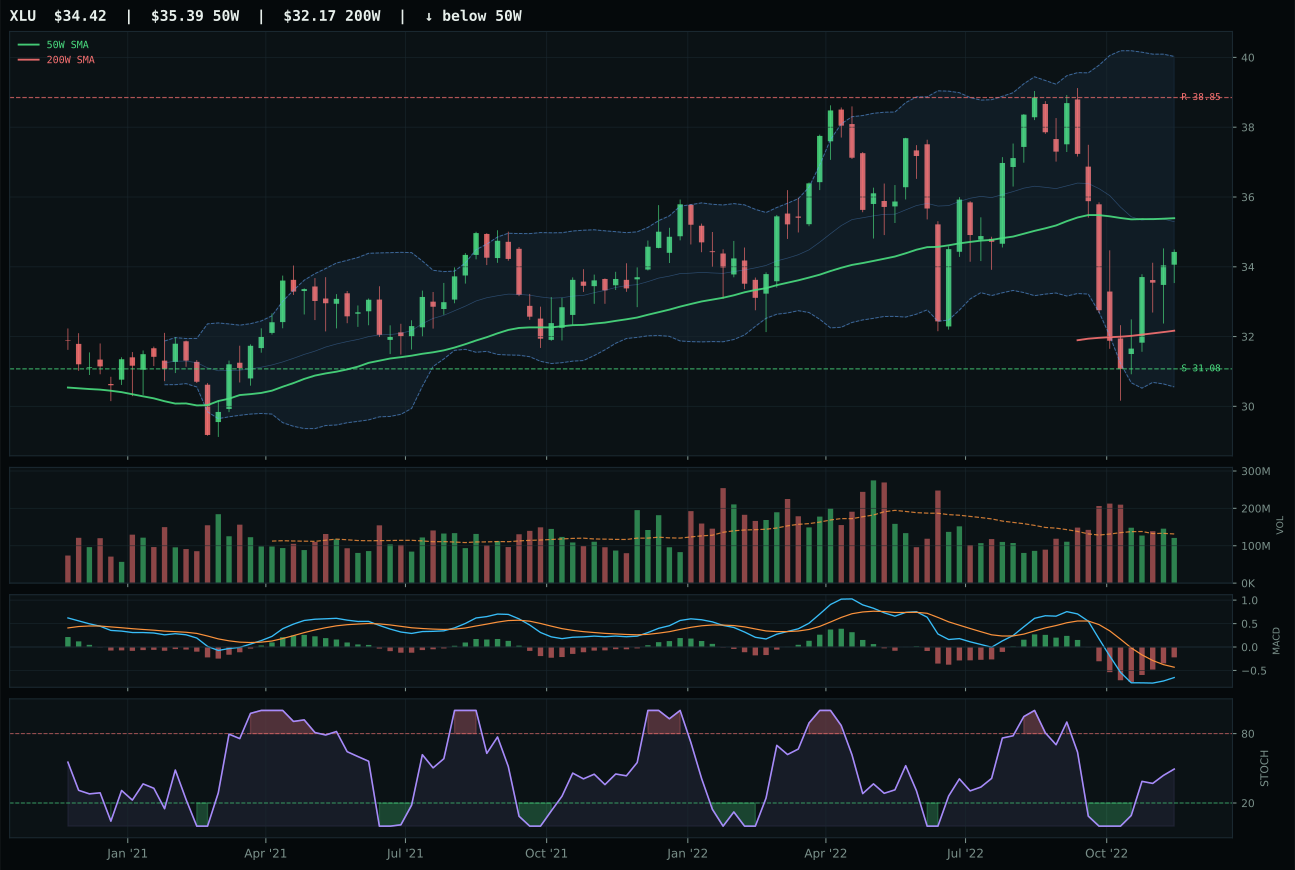
XLU has a compression near 50W profile with -5.2% 13-week relative strength versus SPY.
A failed hold above support would weaken the setup.
Actionable but governed by invalidation levels.
XLU upset runner-up PAVE on timing perfection (100.0 vs 75.0), exploiting the compression and near-zero distance to the 50-week moving average that allowed bearish-but-improving MACD and rising mid-zone stochastic RSI to serve as leading indicators of potential reversal. Price sits in the Fibonacci 0.500 middle decision zone—a neutral rather than desperate technical location—where XLU's -11.4% 13-week return and -5.2% SPY-relative weakness reflected true capitulation rather than trend damage. PAVE's weakness stems from extension 5.1% above the 50-week: overbought stochastic momentum at 0.99, thin volume participation, and upper Fibonacci zone placement that forced timing into a stretched entry zone despite strong category-relative strength of 6.4%. Risk/reward divergence of 72.0 for XLU versus 45.6 for PAVE reveals the asymmetry: XLU offers 11.4% upside to resistance with only 10.8% downside risk.
Utilities earned 10% allocation on a 47.8 category score despite negative technical conviction because defensive rotation is active at +12 and broad market bear at +4 provide genuine macro shelter in a regime where liquidity stress and credit concerns dominate positioning. The category's 61.0/100 macro fit ranks fourth, above only Emerging Markets, reflecting a mixed macro picture where defensive bid is offset by inflation pressure at -6. XLU's bearish MACD and negative momentum (40.1 confirmation score) represent genuine capitulation rather than strength, making it a defensive allocation appropriate for a regime where SPY itself is deteriorating. This is not a conviction play—it is portfolio insurance purchased at a moment when utilities' defensive characteristics and compression setup offer entry without further deterioration risk. Movement to 15% would require either MACD to decisively turn bullish or defensive rotation to activate more strongly; this allocation prioritizes downside cushion over upside participation.
Defense & Aerospace — XAR
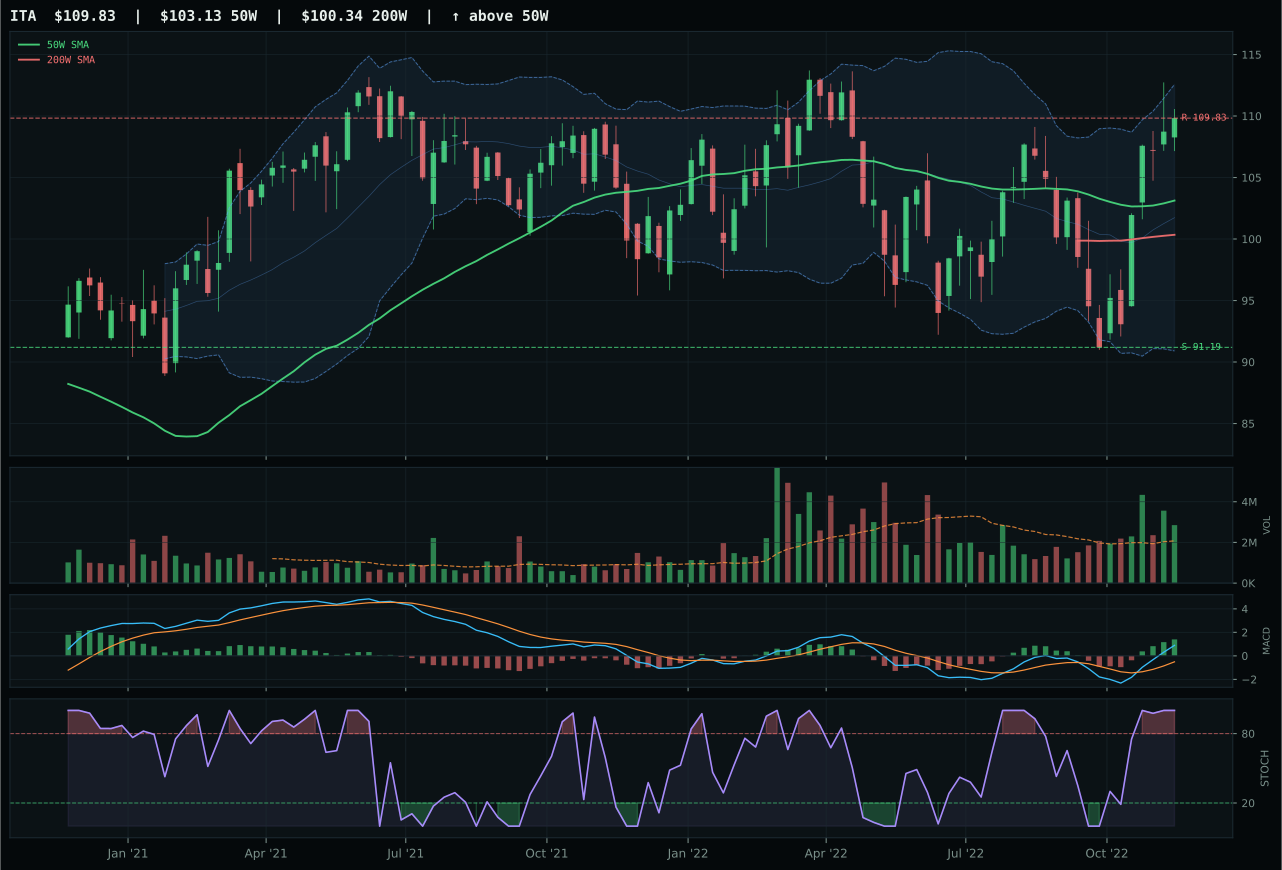
ITA has a neutral structure profile with 9.1% 13-week relative strength versus SPY.
A failed hold above support would weaken the setup.
Actionable but governed by invalidation levels.
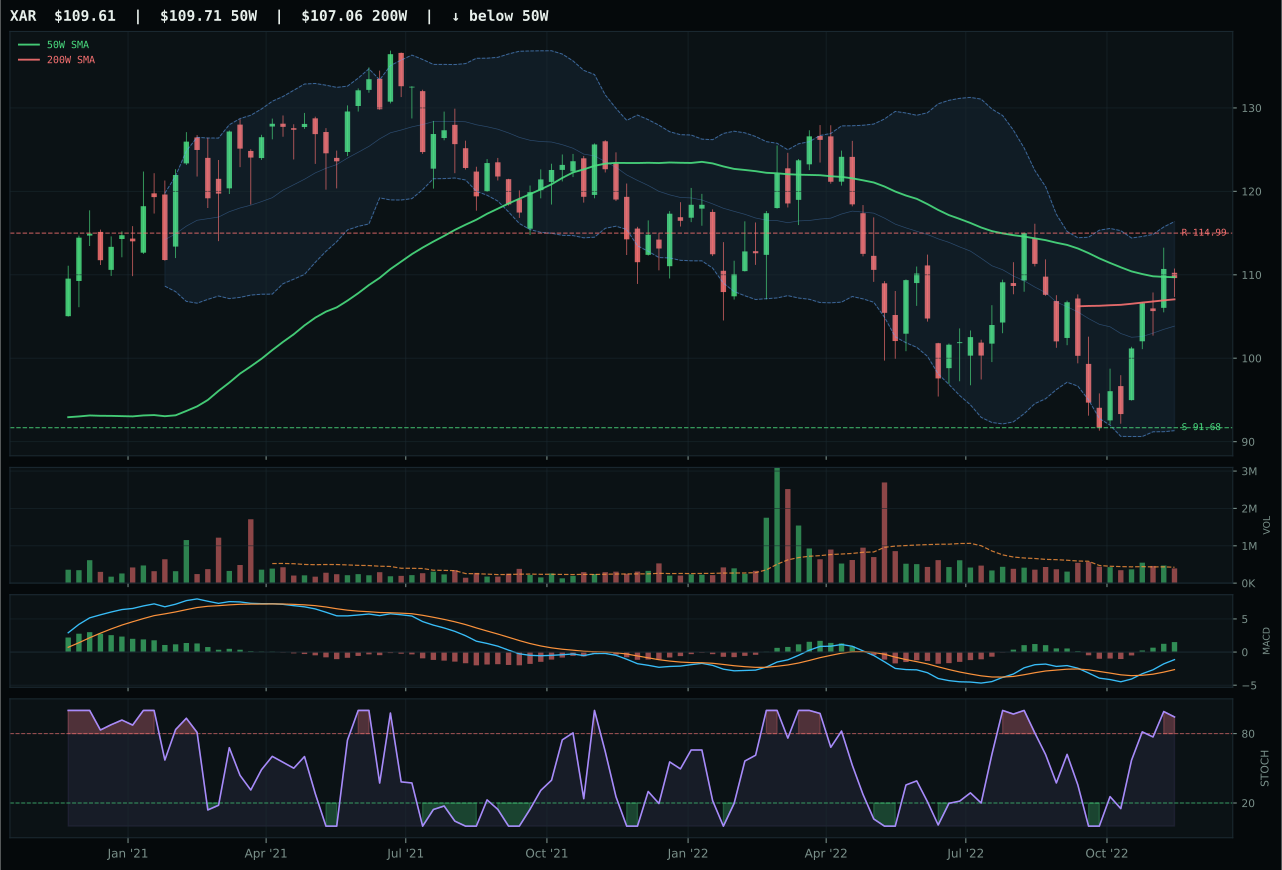
XAR has a compression near 50W profile with 4.7% 13-week relative strength versus SPY.
A failed hold above support would weaken the setup.
Actionable but governed by invalidation levels.
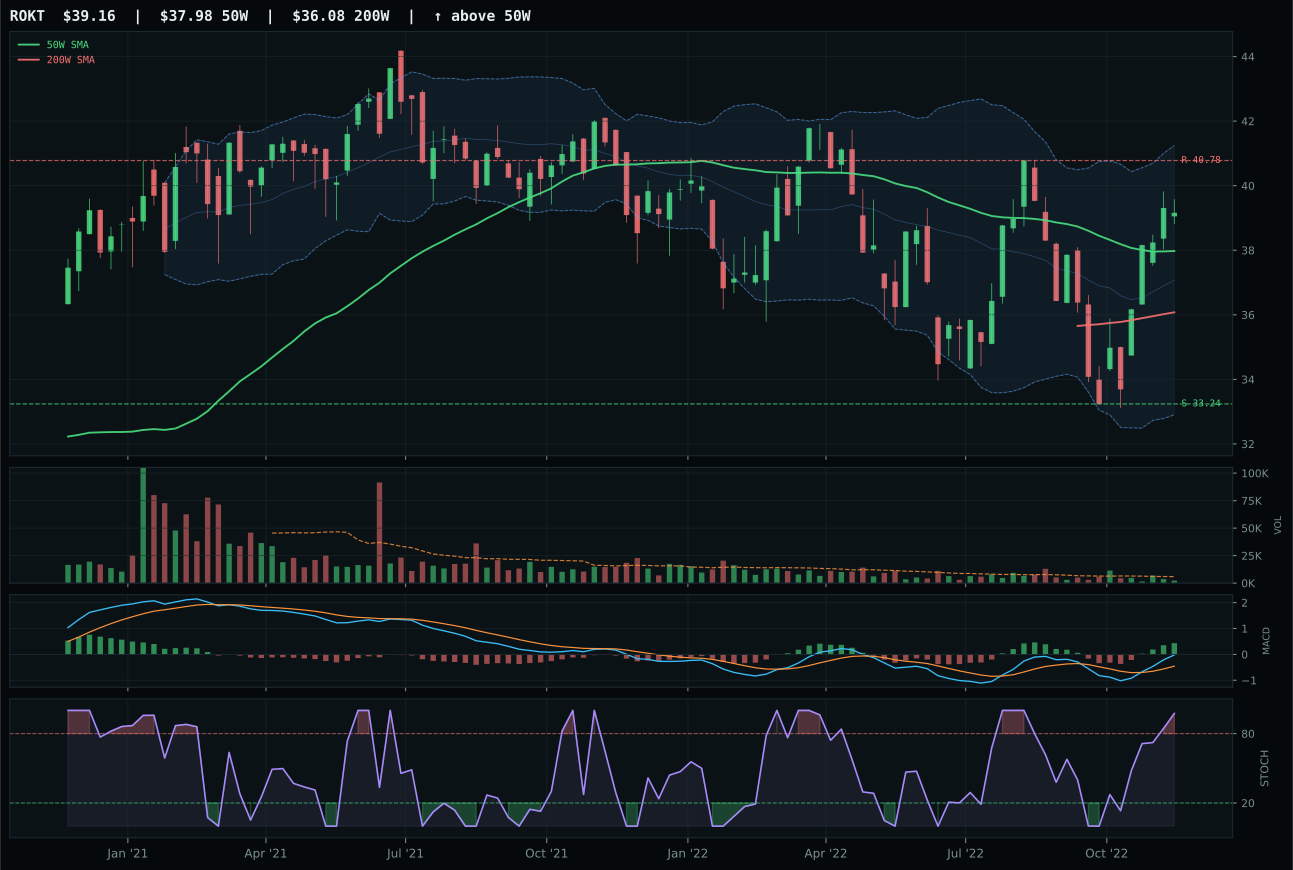
ROKT has a neutral structure profile with 5.2% 13-week relative strength versus SPY.
A failed hold above support would weaken the setup.
Tracked, but not top-2 eligible because: .
XAR won on timing perfection—a 100.0 timing score versus ITA's 75.0—by sitting precisely at the 50-week moving average with zero distance penalty, allowing its MACD and stochastic momentum to serve as pure entry timing rather than entry tax. The setup is compression near the 50-week with favorable risk/reward of 57.3 (ITA scored 52.0), meaning the resistance is a manageable 4.7% away while downside support sits 19.6% lower, a 4-to-1 asymmetry. ITA's 6.5% extension above the 50-week made every new buyer a late arrival; that distance penalty crushed timing from 100 to 75 and forced risk/reward into defensive territory. XAR's neutral volume and category-relative strength of -0.6% are modest weaknesses, but timing and structure dominate peer evaluation in a category where entry precision determines three-month forward returns.
Defense & Aerospace earned 10% despite a 47.6 category score because defensive rotation (+8) and late-cycle reflation (+6) provide genuine macro lift, and the category's 71.0/100 macro fit is the second-best in the portfolio behind only Energy. Yet the reasoning layer punished XAR for technical leadership: ITA scored 83.5 in macro-adjusted evidence, nearly 27 points higher, meaning the category's macro strength is being expressed through a different vehicle than the technical setup recommended. This tension reflects late-cycle dynamics: macro conditions favor defense, but pure technical timing points elsewhere. The 10% allocation preserves exposure to an improving narrative without overcommitting to a setup where timing and structure quality lag momentum. Movement to 15%+ would require either XAR or ITA to demonstrate sustained relative strength, not just macro alignment.
Technology — XLK
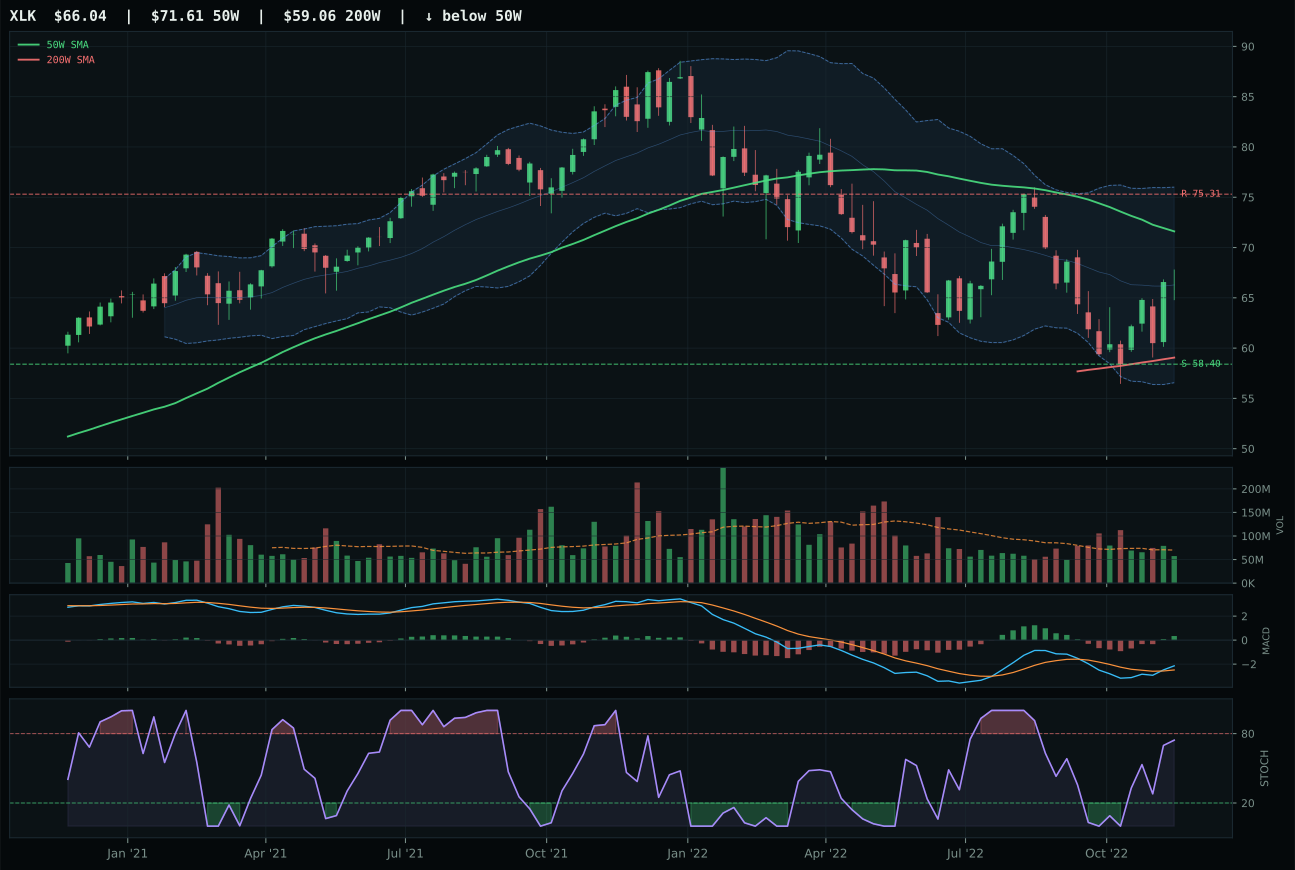
XLK has a neutral structure profile with -4.6% 13-week relative strength versus SPY.
A failed hold above support would weaken the setup.
Actionable but governed by invalidation levels.
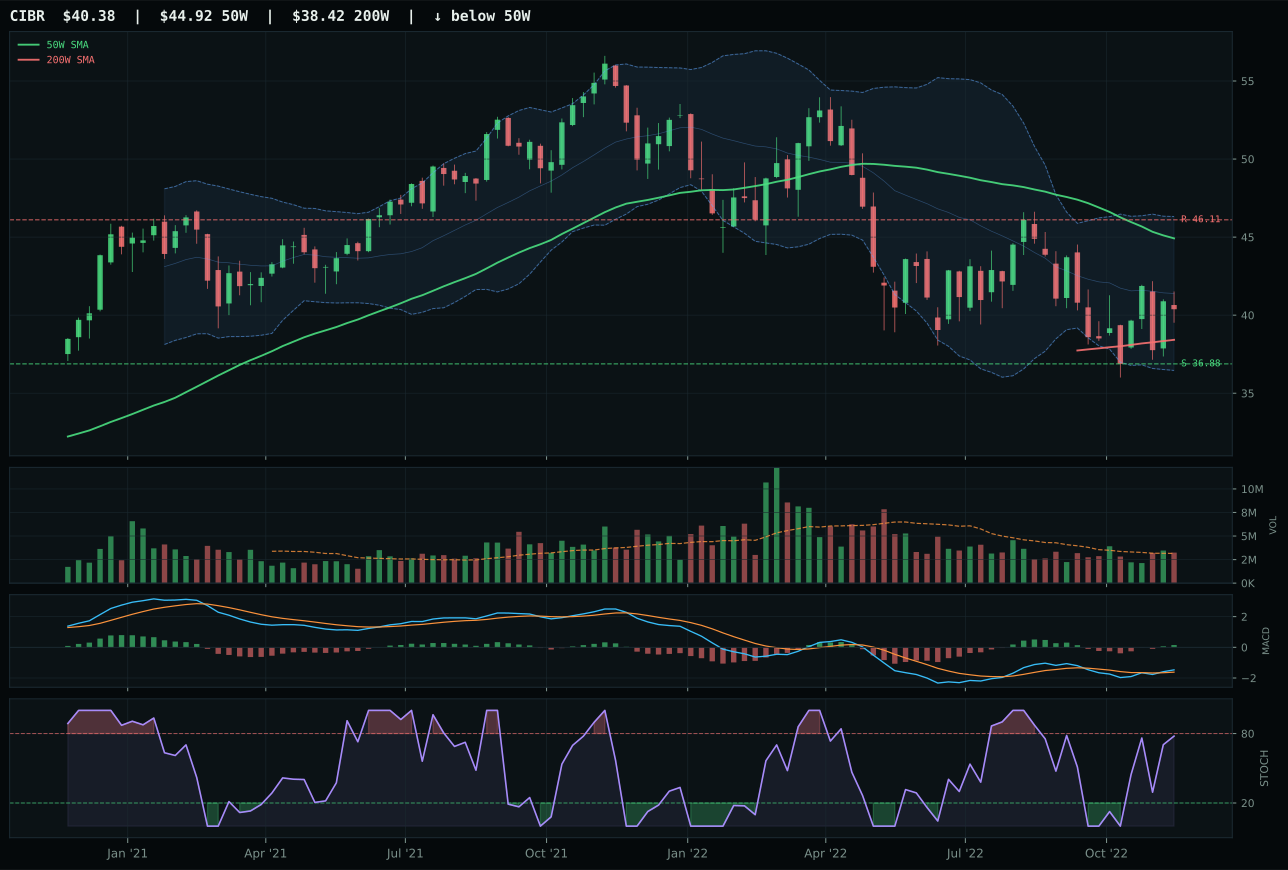
CIBR has a neutral structure profile with -3.9% 13-week relative strength versus SPY.
A failed hold above support would weaken the setup.
Actionable but governed by invalidation levels.
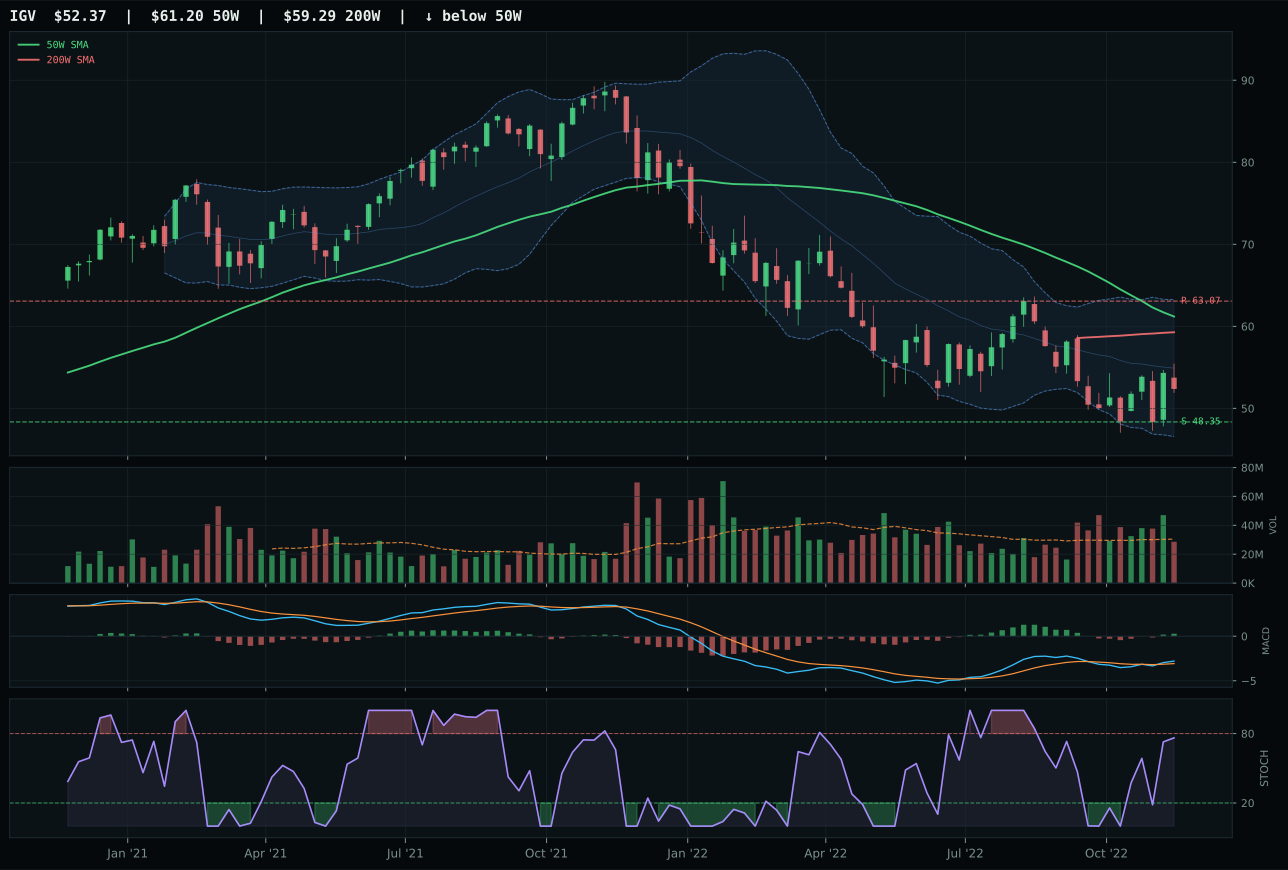
IGV has a neutral structure profile with -7.4% 13-week relative strength versus SPY.
A failed hold above support would weaken the setup.
Actionable but governed by invalidation levels.
XLK claimed the category on timing precision and neutral structure, outpacing CIBR with a 90.0 timing score versus 63.0 for the cybersecurity name. Price sits 7.8% below the 50-week moving average in the deep Fibonacci value zone, where MACD is bullish and stochastic RSI has climbed mid-zone—a textbook reset that rewards patient entry over late-stage chase. CIBR's weakness stems from a more compressed valuation signal and slower stochastic recovery, placing it in the 52-week repair zone where the technical burden remains higher. Category-relative strength of 0.0% across both names masks the technical divergence: XLK's neutral volume at 0.82x the 20-week average preserves optionality, while CIBR's identical neutral volume fails to provide the incremental confirmation XLK's setup demanded.
Technology earned 10% allocation because macro headwinds—active liquidity stress at -10, credit stress at -6, and inflation pressure at -4—compress the category's risk-adjusted return potential despite sound technical structure. The 29.0/100 macro fit score reflects a regime hostile to multiple expansion, and both XLK and CIBR are priced for mean reversion rather than outperformance. This category would require either credit conditions to stabilize or relative strength to durably clear SPY by 3-5% to justify movement toward top-2. For now, the allocation represents a placeholder for improving technical setup—the compression and proximity to value zones create future optionality if macro descriptors rotate—but does not command capital allocation when energy, metals, and agriculture offer cleaner macro-to-technical alignment.
AI — SMH
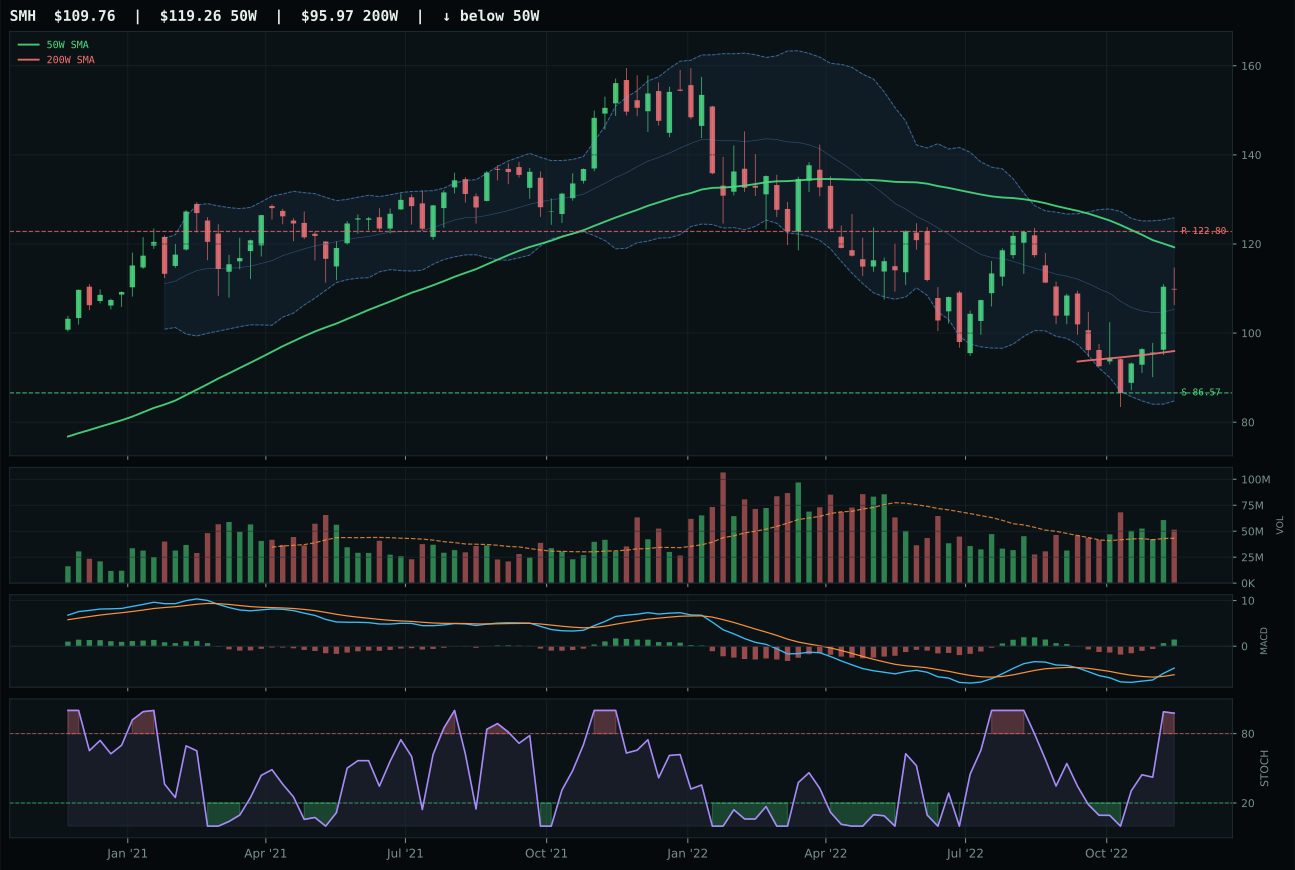
SMH has a neutral structure profile with -0.4% 13-week relative strength versus SPY.
A failed hold above support would weaken the setup.
Actionable but governed by invalidation levels.
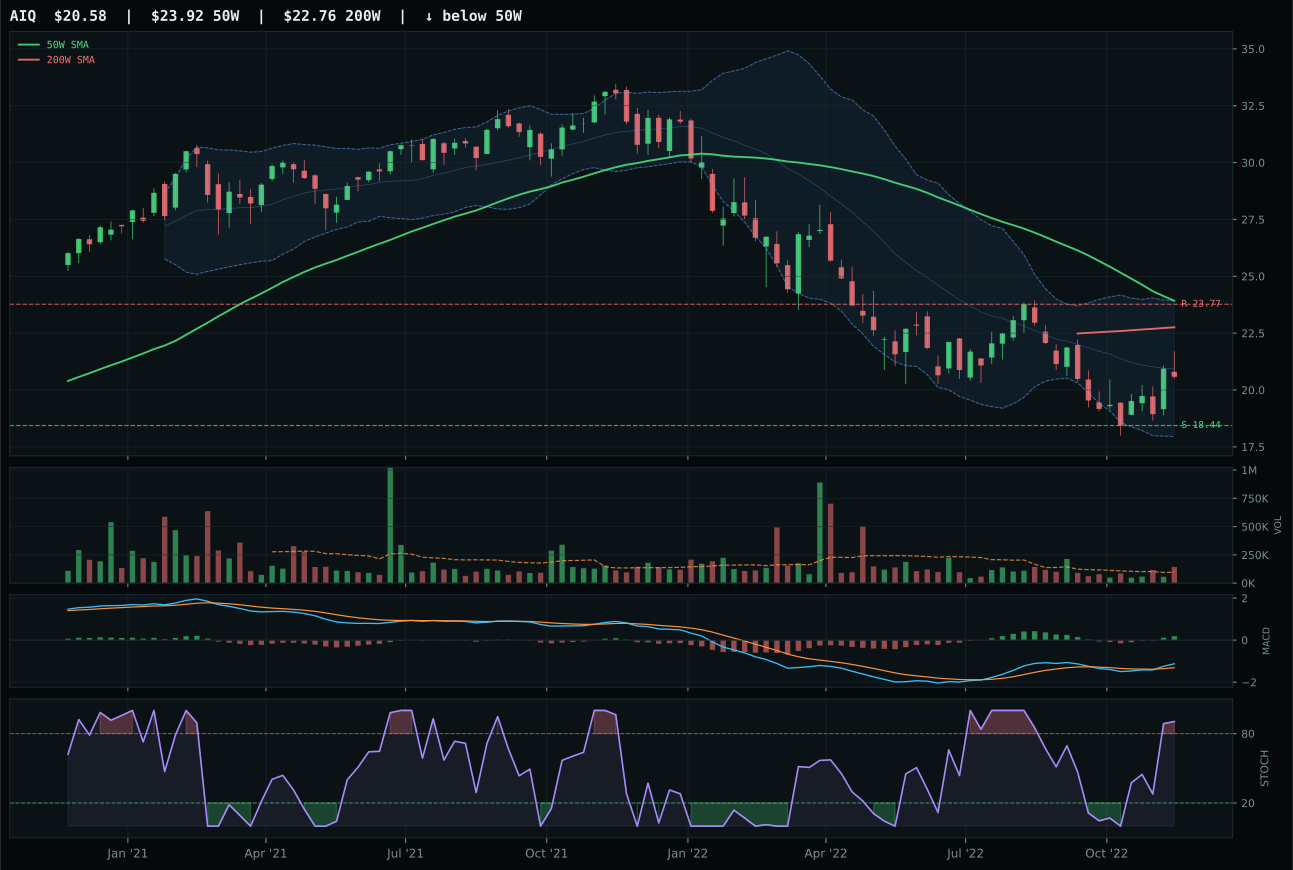
AIQ has a neutral structure profile with -4.2% 13-week relative strength versus SPY.
A failed hold above support would weaken the setup.
Tracked, but not top-2 eligible because: .
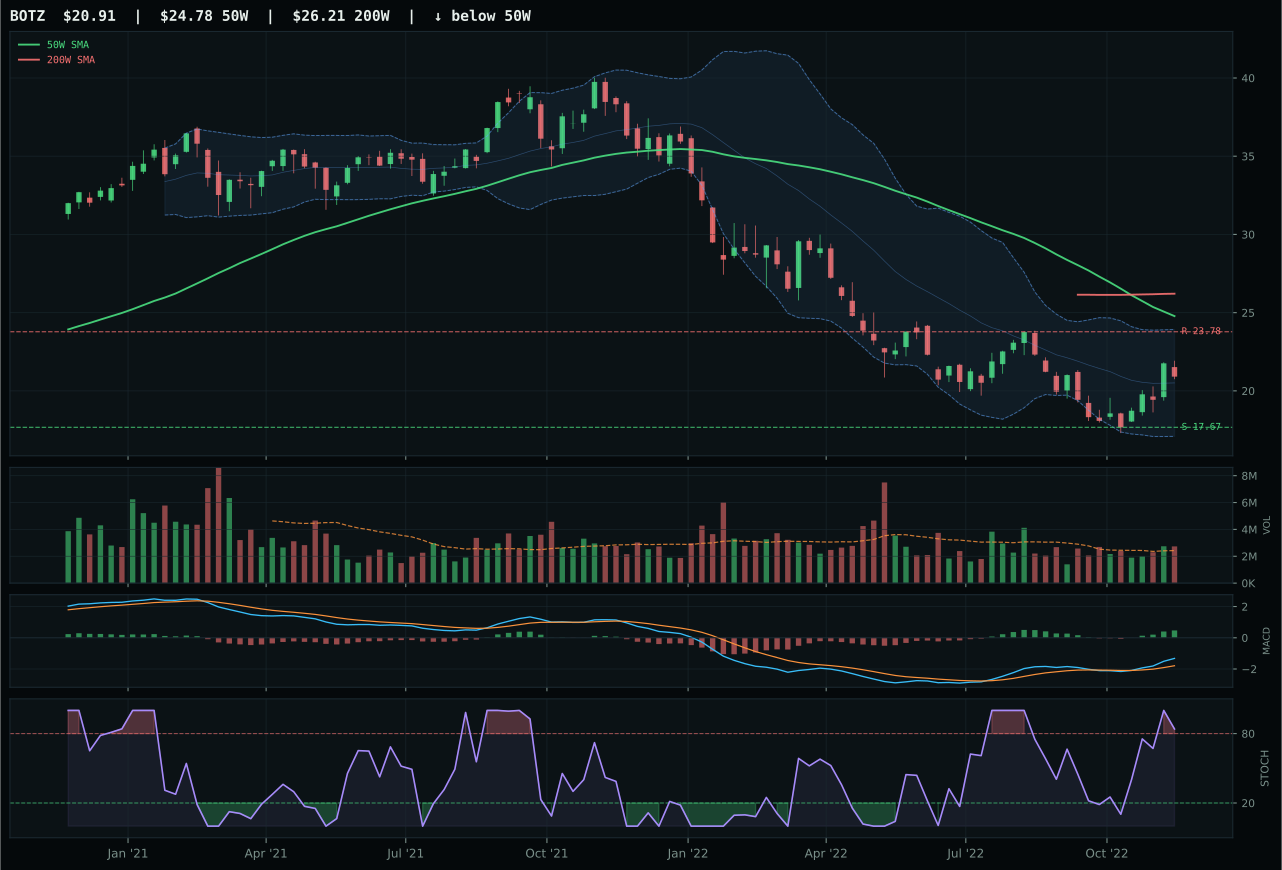
BOTZ has a neutral structure profile with -0.1% 13-week relative strength versus SPY.
Extension and support failure are the main tactical risks.
Tracked, but not top-2 eligible because: structurally broken.
SMH dominated AIQ and BOTZ on momentum confirmation (91.4 vs 54 for AIQ), driven by a crushing 4-week return of 17.8% that positioned the semiconductor leader as the only genuine accumulation candidate in the trio. At 8.0% below the 50-week moving average with above-average volume at 1.19x participation, SMH's setup combines the repair-zone promise of XLK with proven buyer commitment—the volume-price confirmation of 66.7 is a rare bright spot in a category plagued by thin technicals. AIQ's 13-week return of -10.4% paired with category-relative weakness of -3.8% exposed the software/applications thesis as a laggard within its own peer set; timing score divergence of 27 points tells the full story of a setup too stretched from support and lacking stochastic confirmation.
AI receives zero allocation and ranks 9th or 10th in the final scoring, eliminated entirely from the portfolio despite SMH's technically clean setup. The category macro fit of 22.0/100 is among the worst available, poisoned by three major headwinds: liquidity stress at -12, credit stress at -8, and broad market bear at -8. SMH's technical evidence of 76.7/100 is strong—it is the cleanest chart in the category—but it cannot compensate for a macro regime hostile to speculative technology hardware and AI infrastructure plays. In late-cycle conditions where funding is contracting and corporates are conserving cash, demand for AI chip buildouts collapses or slows sharply. The allocation system is explicit: technical merit alone does not override macro regime incompatibility. SMH would need to see two of the three macro stress signals reverse, or the category's fundamental macro fit score needs to recover to the 50+ range, before AI regains portfolio access. Until then, even the best technical setup in the category cannot justify capital deployment.
Emerging Markets — INDA
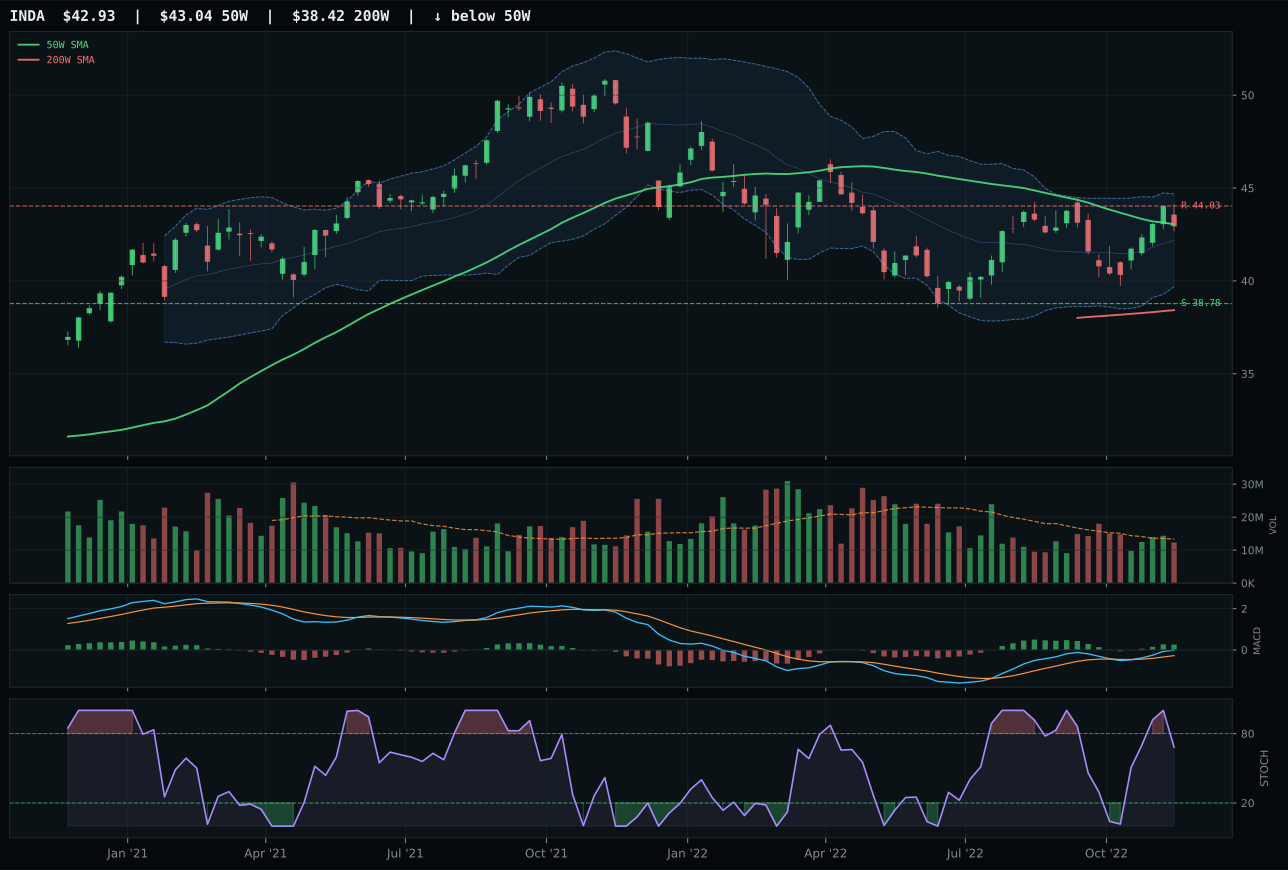
INDA has a compression near 50W profile with 5.3% 13-week relative strength versus SPY.
A failed hold above support would weaken the setup.
Actionable but governed by invalidation levels.
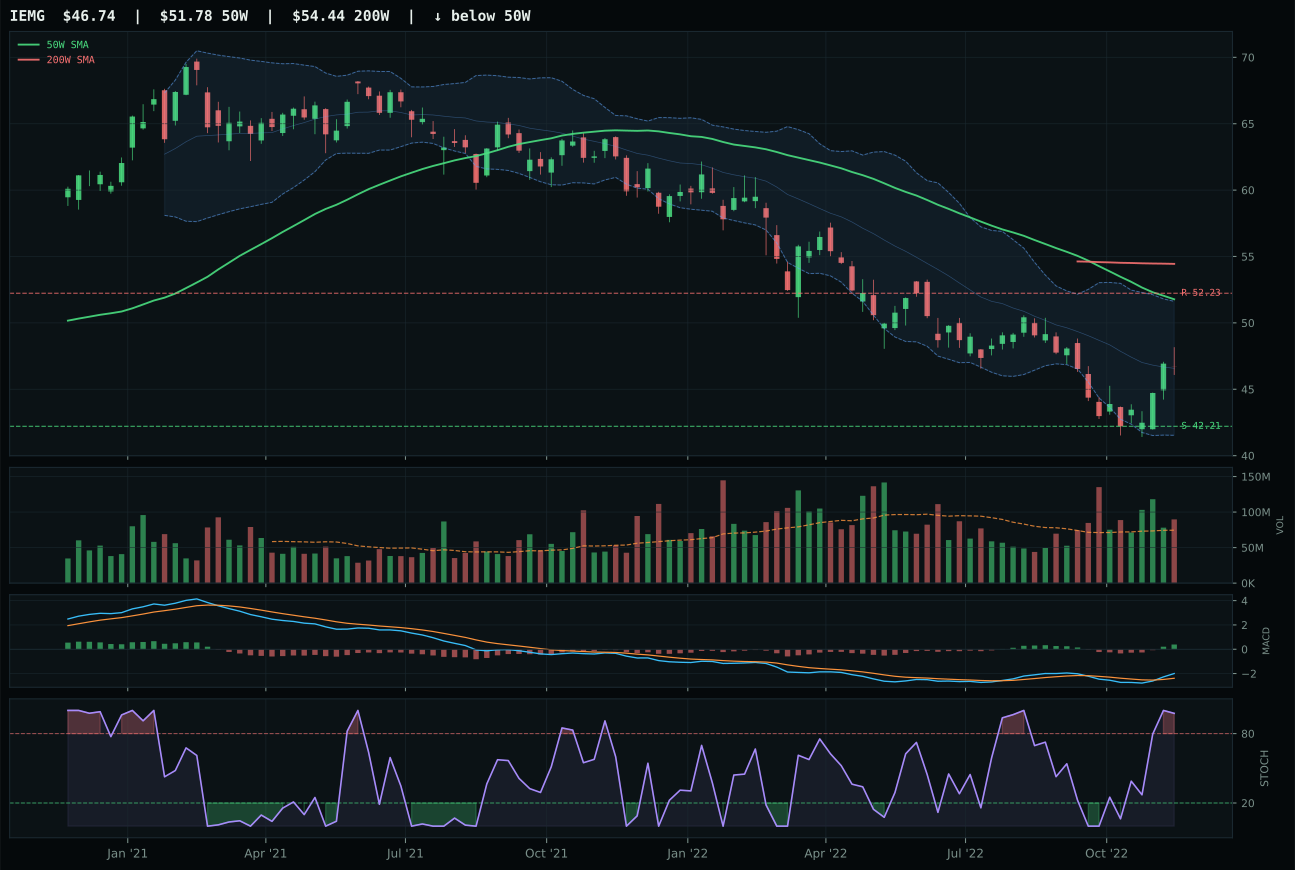
IEMG has a neutral structure profile with 1.5% 13-week relative strength versus SPY.
Extension and support failure are the main tactical risks.
Tracked, but not top-2 eligible because: structurally broken.
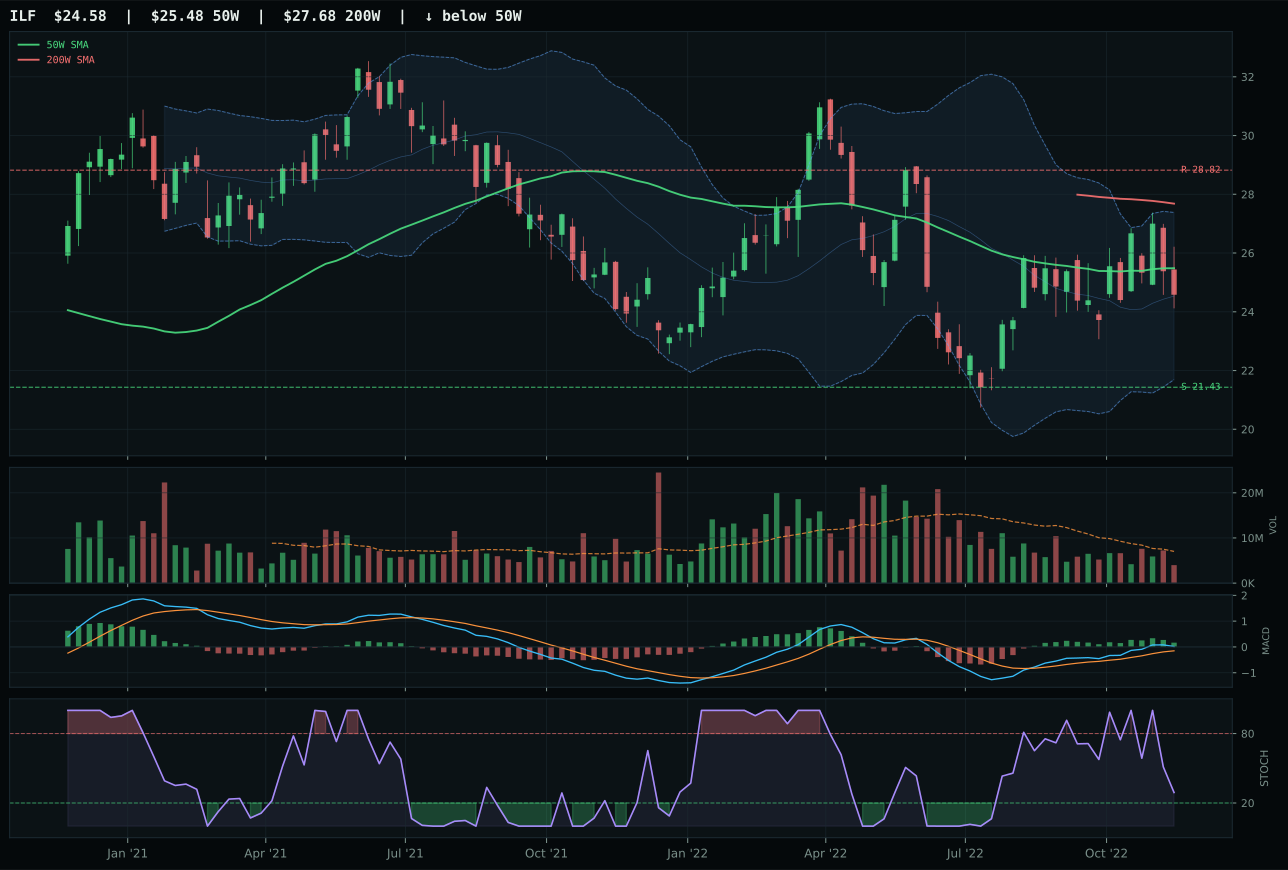
ILF has a neutral structure profile with 5.2% 13-week relative strength versus SPY.
Extension and support failure are the main tactical risks.
Tracked, but not top-2 eligible because: structurally broken.
INDA won decisively with a 100.0 timing score on perfect 50-week proximity (just -0.3% away) and compression structure, allowing stochastic RSI at falling/neutral 0.68 to act as a forward indicator of reviving interest rather than an overdone momentum signal. Category-relative strength advantage of 0.1% versus IEMG's -3.8% exposed the broad emerging-market ETF as damaged goods in a regime hostile to illiquid exposures; IEMG's 41.4 structure score versus INDA's 72.7 reflects a setup too broken to defend. INDA's compression near the 50-week with neutral volume at 0.93x participation created an asymmetry: downside support is only 10.7% away while upside resistance sits 2.5% distant, forcing entry without excessive capital commitment if the macro regime deteriorates. IEMG's overbought stochastic and above-average volume suggested late-cycle distribution rather than accumulation.
Emerging Markets receives zero allocation and ranks 9th or 10th in portfolio construction, despite INDA's technically sound setup, because the category macro fit is only 21.0/100—the second-lowest in the 10-category universe. Credit stress is active at -10 points, liquidity stress at -10 points, and broad market bear at -9 points, creating a 29-point macro headwind that INDA's 79.8 technical score cannot overcome. The allocation system is explicit: strong technical setups in hostile macro regimes do not merit portfolio capital. In Late-Cycle Reflation with active credit and liquidity stress, emerging markets face simultaneous headwinds: dollar strength, rate risks in EM sovereign debt, and slowing China growth. INDA is quality-protected and geopolitically favored, but it is not immune to category-level de-risking. The category would require a macro regime shift—either credit stress reversing or liquidity conditions improving—to regain portfolio access. Until then, even the top-ranked ETF in the category remains on the sidelines. This is not a reflection of INDA's merit but of regime incompatibility.