
2022-11-11
Informational purposes only. The content in this report, including allocations, analysis, and commentary, is provided solely for informational and educational purposes. It does not constitute financial advice, investment advice, trading advice, or any other type of advice. Past performance does not guarantee future results. Always conduct your own research and consult a qualified financial professional before making investment decisions.
Weekly Allocation
| Ticker | Category | Weight | Role |
|---|---|---|---|
| XLE | Traditional Energy | 20% | Top-2 (20%) |
| COPX | Industrial Metals | 20% | Top-2 (20%) |
| XAR | Defense & Aerospace | 10% | Tier-2 (10%) |
| URA | Nuclear Energy | 10% | Tier-2 (10%) |
| PAVE | Utilities & Infrastructure | 10% | Tier-2 (10%) |
| VEGI | Agriculture & Livestock | 10% | Tier-2 (10%) |
| GLD | Precious Metals | 10% | Tier-2 (10%) |
| XLK | Technology | 10% | Tier-2 (10%) |
Trade Instructions — Monday Open
Sell the tranche from 2022-10-14 (completing its 4-week hold). Buy the new tranche. Instructions show net portfolio changes — same-asset positions cancel, weight changes show the delta.
| Action | Ticker | Instruction |
|---|---|---|
| SELL | XLE | Sell 17% of XLE position (reduce 60.00% → 50.00%) |
| SELL | WEAT | Sell entire WEAT position (1.25% of portfolio) |
| SELL | URNM | Sell 33% of URNM position (reduce 3.75% → 2.50%) |
| SELL | ITA | Sell 20% of ITA position (reduce 6.25% → 5.00%) |
| SELL | INDA | Sell entire INDA position (1.25% of portfolio) |
| BUY | COPX | Buy COPX — 25.00% of freed cash (adds 3.75% to portfolio) |
| BUY | PAVE | Buy PAVE — 8.33% of freed cash (adds 1.25% to portfolio) |
| BUY | XLK | Buy XLK — 16.67% of freed cash (adds 2.50% to portfolio) |
| BUY | URA | Buy URA — 16.67% of freed cash (adds 2.50% to portfolio) |
| BUY | XAR | Buy XAR — 16.67% of freed cash (adds 2.50% to portfolio) |
| BUY | VEGI | Buy VEGI — 16.67% of freed cash (adds 2.50% to portfolio) |
Current Portfolio After Trade
Combined holdings across all 4 active tranches. Each tranche is 25% of the portfolio.
| Ticker | % of Portfolio | Weight Bar |
|---|---|---|
| XLE | 50.00% | |
| GLD | 6.25% | |
| COPX | 6.25% | |
| PAVE | 6.25% | |
| ITA | 5.00% | |
| MOO | 3.75% | |
| XLK | 3.75% | |
| URA | 3.75% | |
| URNM | 2.50% | |
| PICK | 2.50% | |
| REMX | 2.50% | |
| XAR | 2.50% | |
| VEGI | 2.50% | |
| CIBR | 1.25% | |
| ILF | 1.25% |
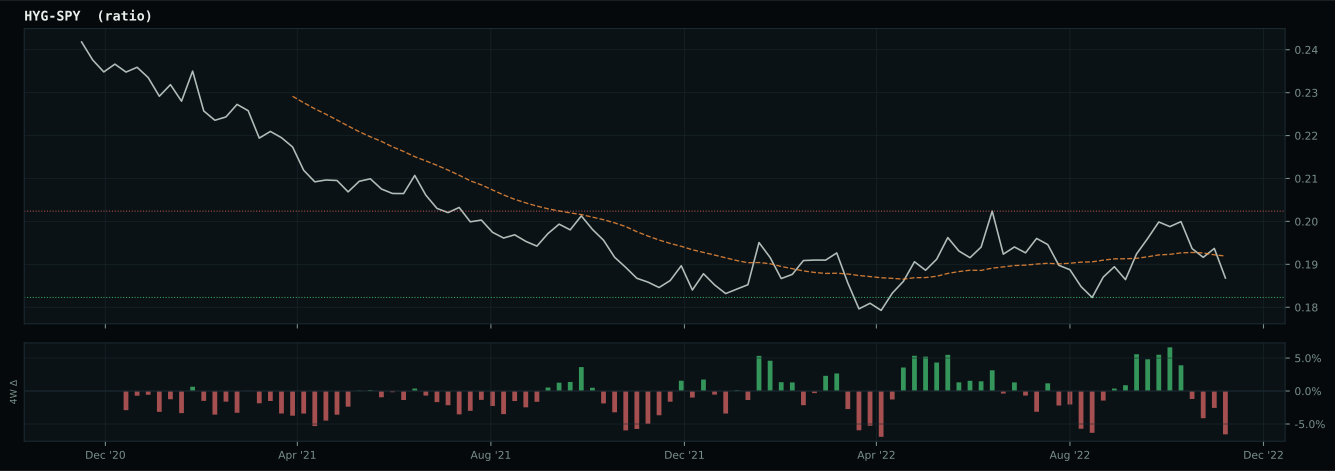
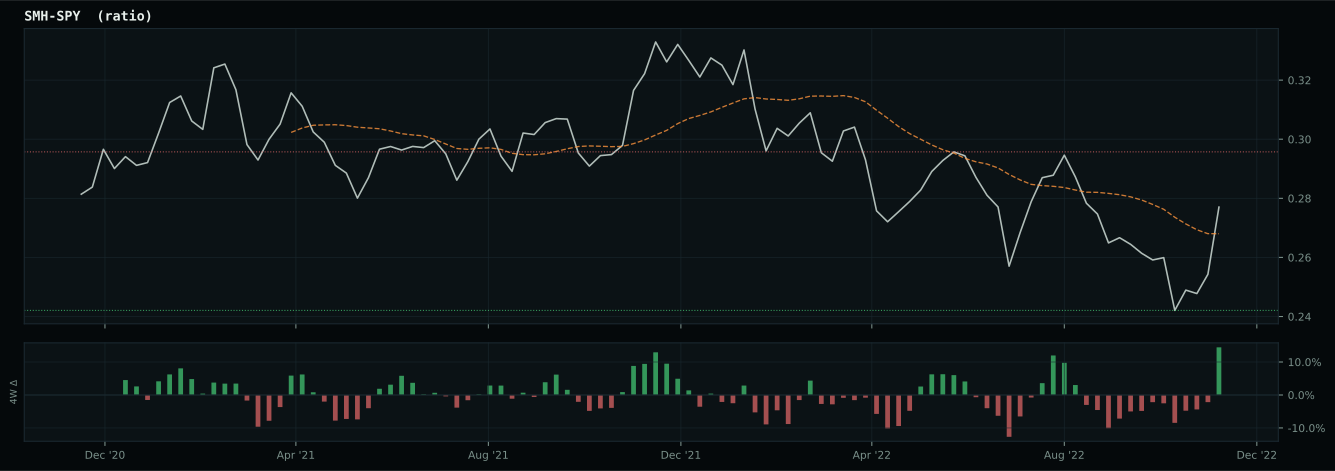
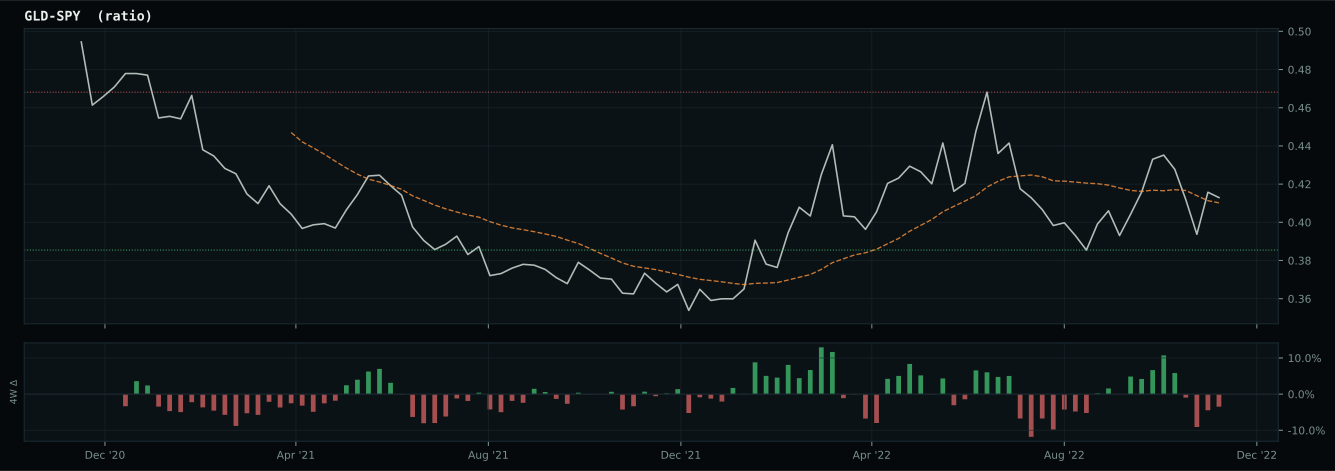
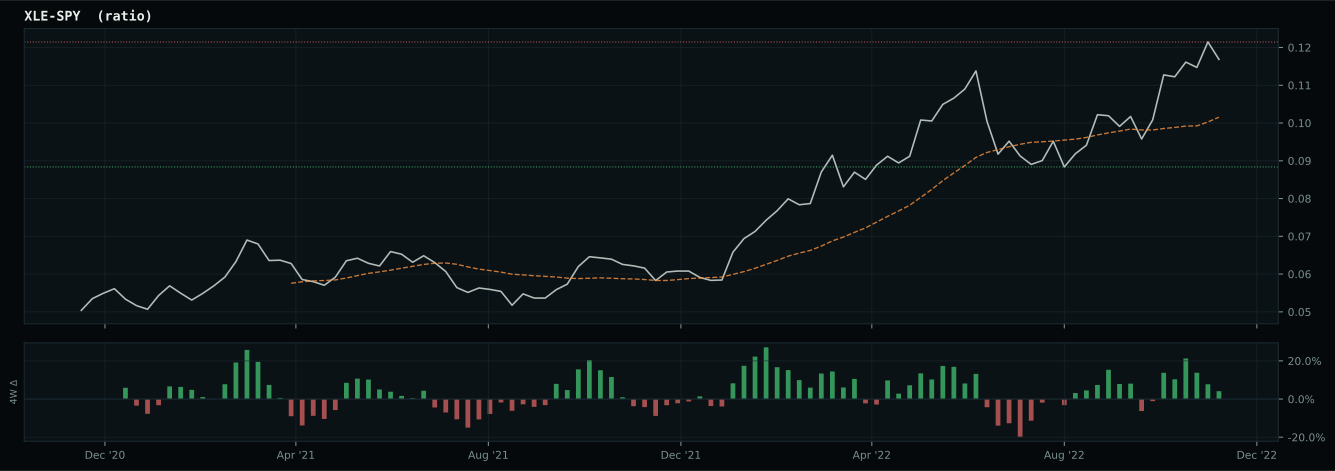
Macro Regime — Late-Cycle Reflation
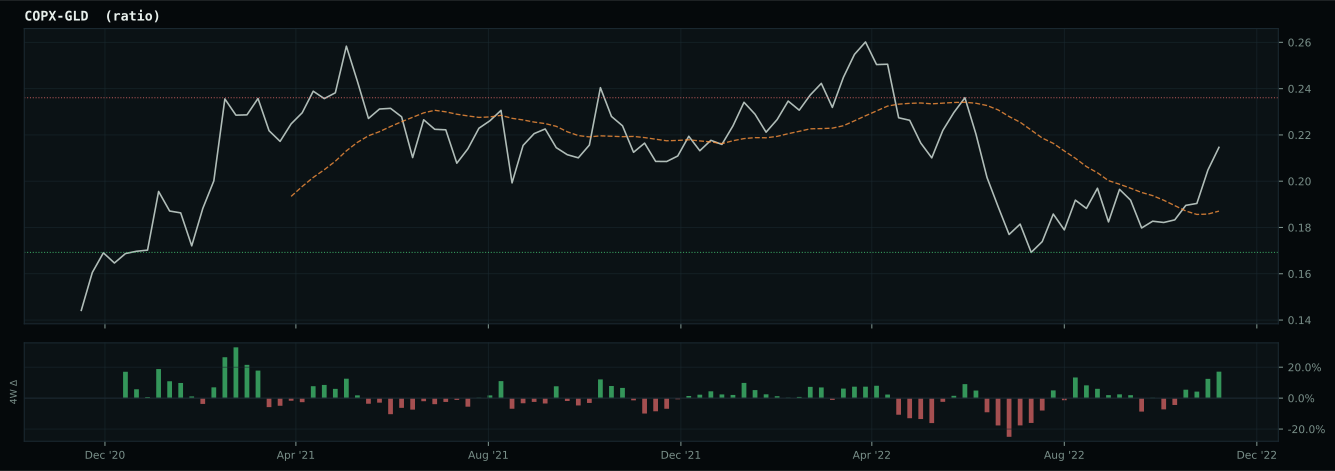
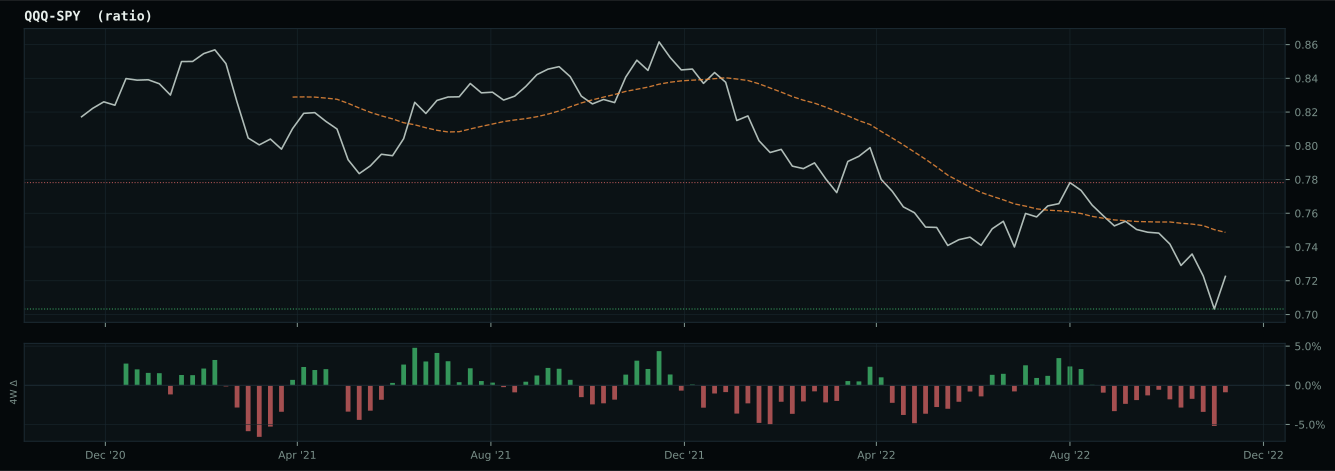
Macro Evidence Charts
Market-implied signals behind the macro regime scores. Each ratio compares two assets; the direction and slope of the ratio is what the macro engine reads.
Crypto Regime — NoCrypto
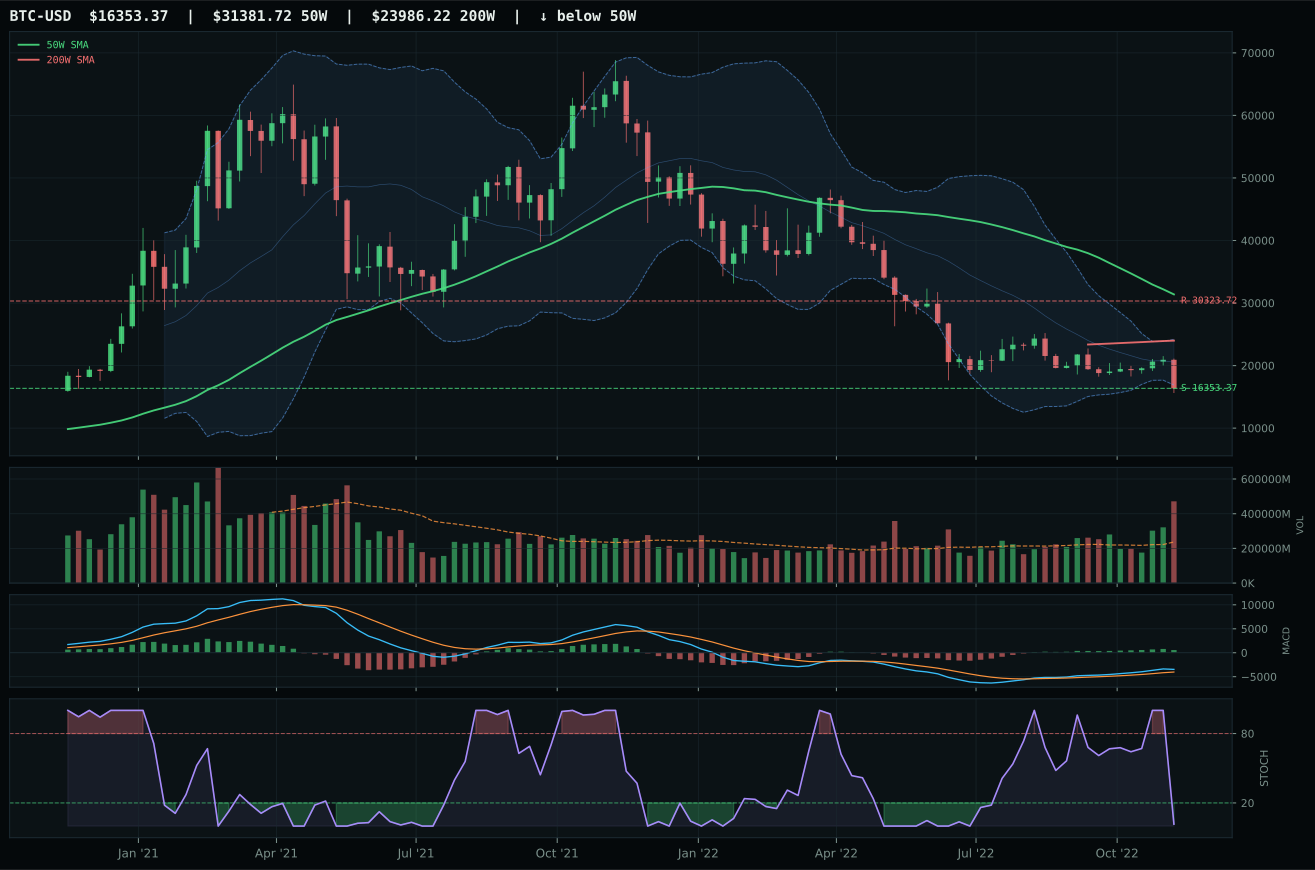
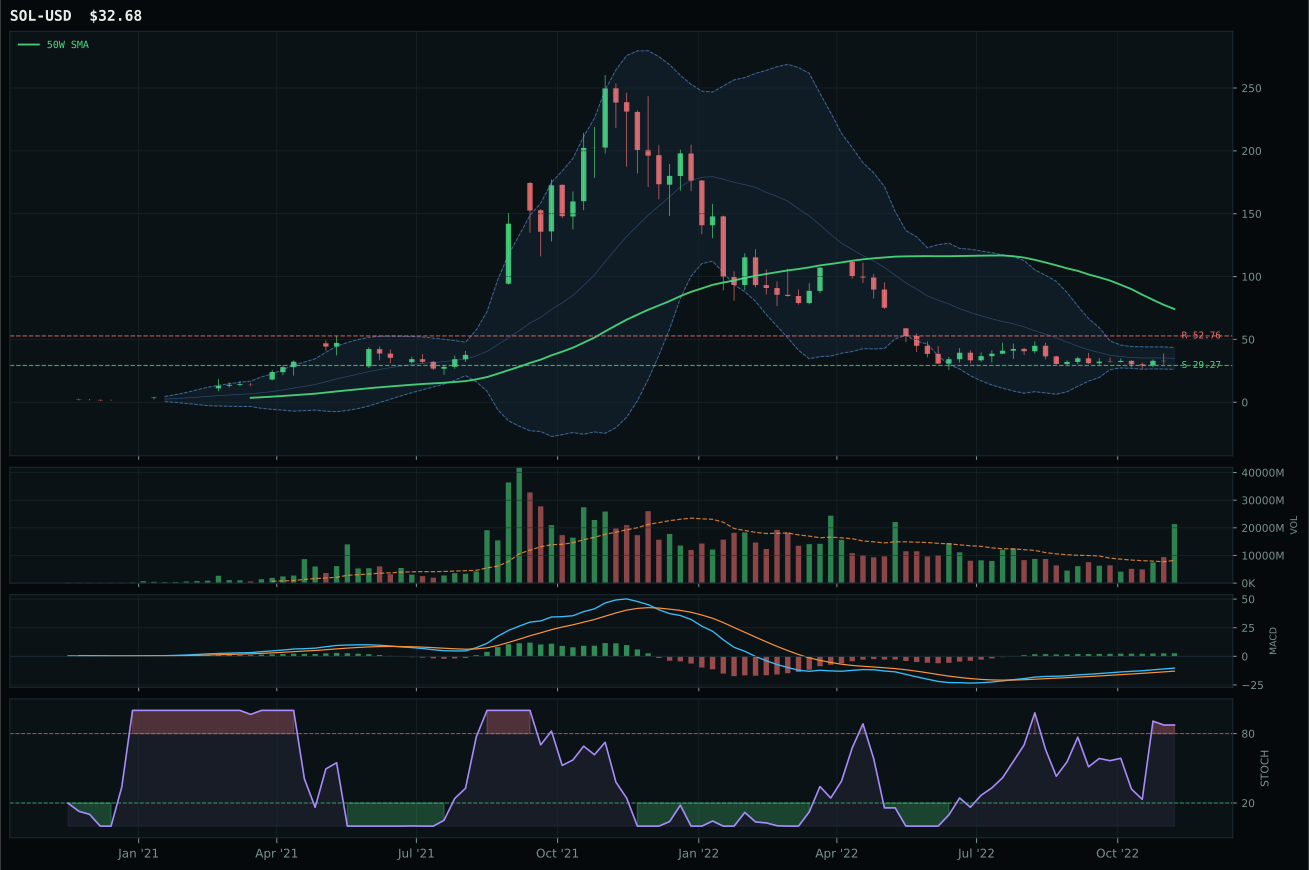
ValueBTC armed; waiting for 50W reclaim, decisive close above post-touch range resistance by 3%, close above 200W
TrendBTC not confirmed
one or more available conditions failed
Category Rankings
| Rank | Category | Winner | Score | Alloc | 4W Ret | Peers (4W) |
|---|---|---|---|---|---|---|
| 1 | Traditional Energy | XLE | 85.1 | 20% | -10.46% | FCG -14.4% · XOP -16.6% |
| 2 | Industrial Metals | COPX | 80.8 | 20% | +4.19% | PICK +5.6% · REMX -10.0% |
| 3 | Defense & Aerospace | XAR | 68.7 | 10% | -2.29% | ITA +2.1% · ROKT -1.8% |
| 4 | Nuclear Energy | URA | 68.6 | 10% | -9.39% | URNM -11.9% · NLR -1.1% |
| 5 | Utilities & Infrastructure | PAVE | 60.4 | 10% | +0.51% | IGF +1.8% · XLU +4.5% |
| 6 | Agriculture & Livestock | VEGI | 56.1 | 10% | -0.14% | MOO -0.6% · WEAT -9.9% |
| 7 | Precious Metals | GLD | 50.9 | 10% | +1.36% | SLV +8.2% · GDX +2.5% |
| 8 | Technology | XLK | 48.8 | 10% | -0.73% | IGV -3.3% · CIBR -1.9% |
| 9 | AI | SMH | 20.7 | 0% | -0.49% | AIQ +1.3% · BOTZ -1.6% |
| 10 | Emerging Markets | INDA | 13.2 | 0% | -1.58% | IEMG +2.4% · ILF -4.1% |
Traditional Energy — XLE
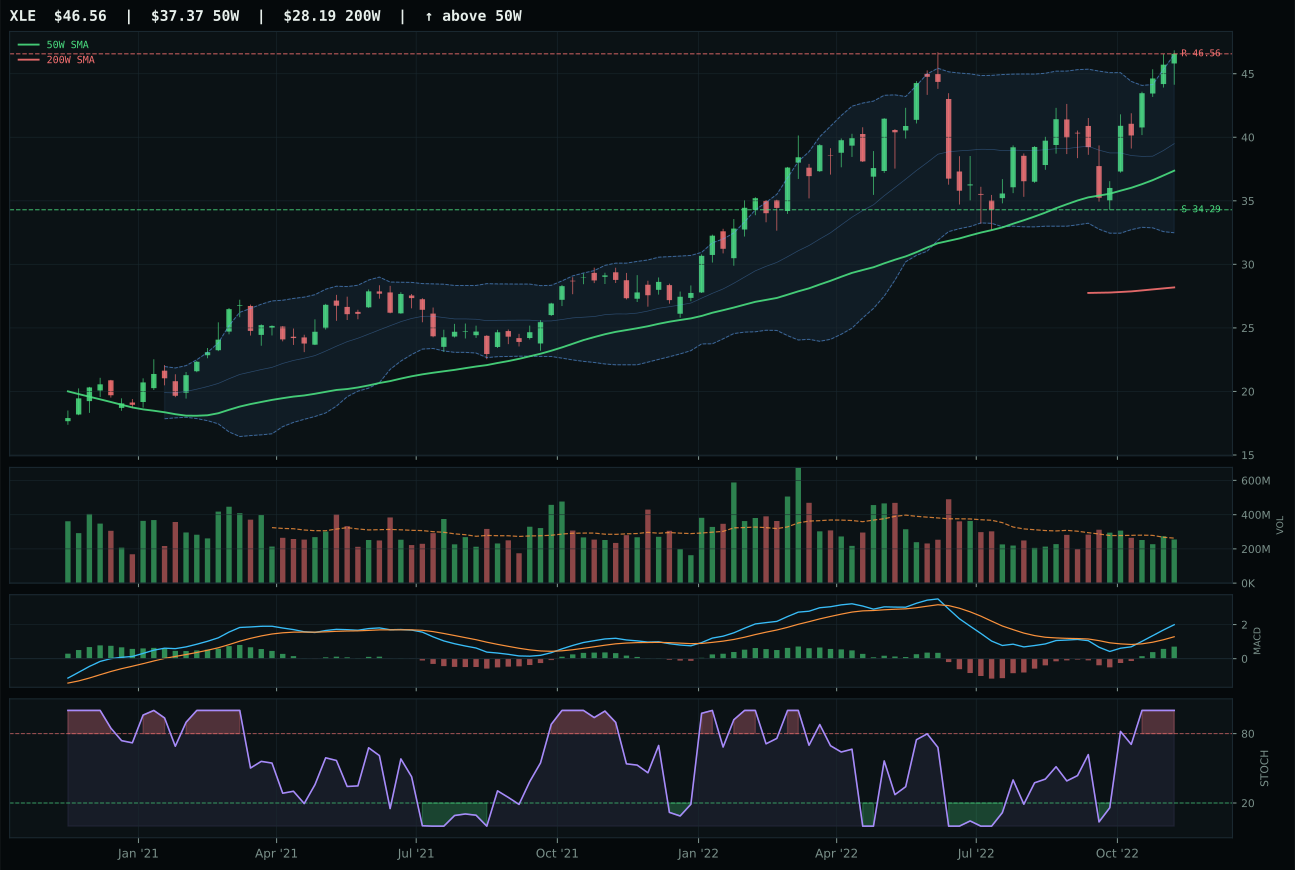
XLE has a vertical extension profile with 25.4% 13-week relative strength versus SPY.
A failed hold above support would weaken the setup.
Actionable but governed by invalidation levels.
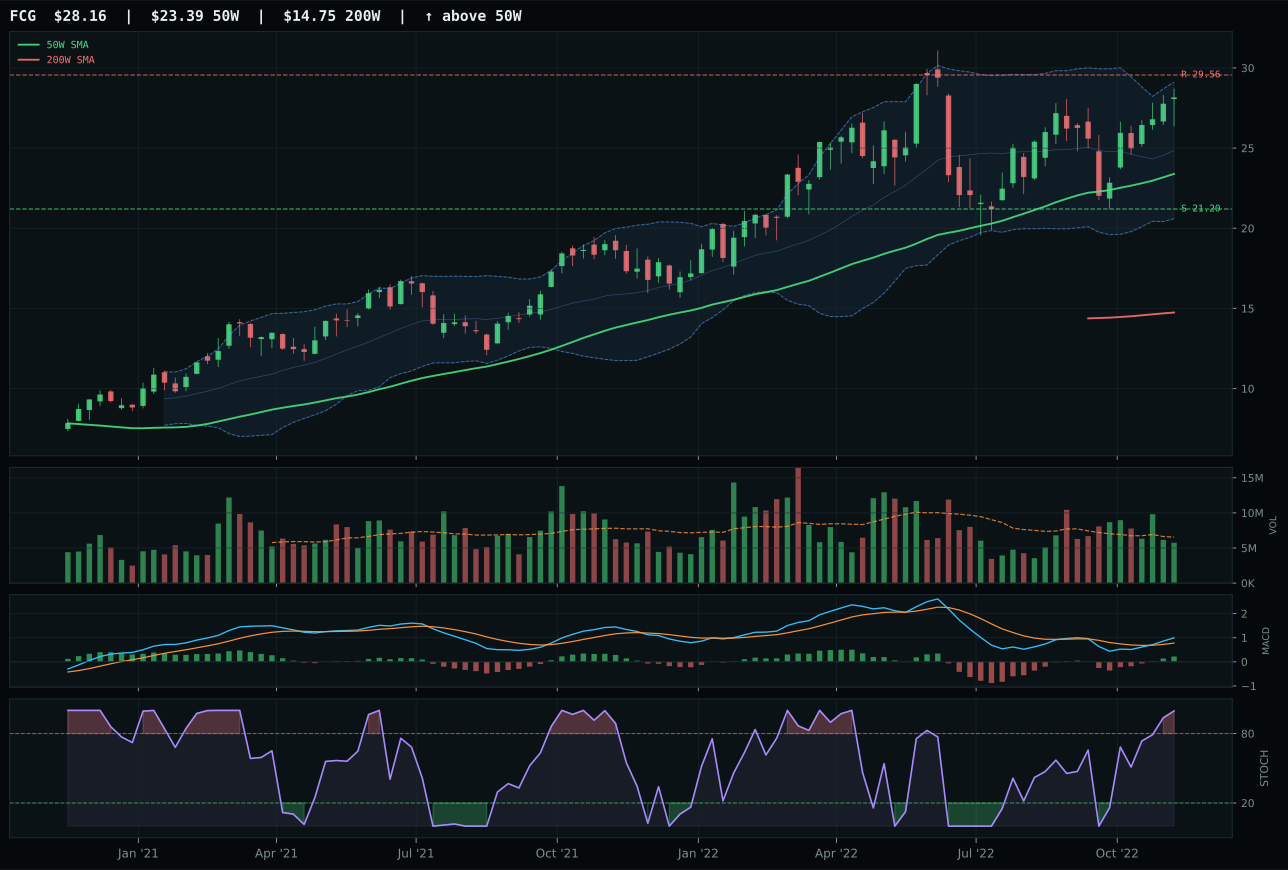
FCG has a vertical extension profile with 17.6% 13-week relative strength versus SPY.
A failed hold above support would weaken the setup.
Actionable but governed by invalidation levels.
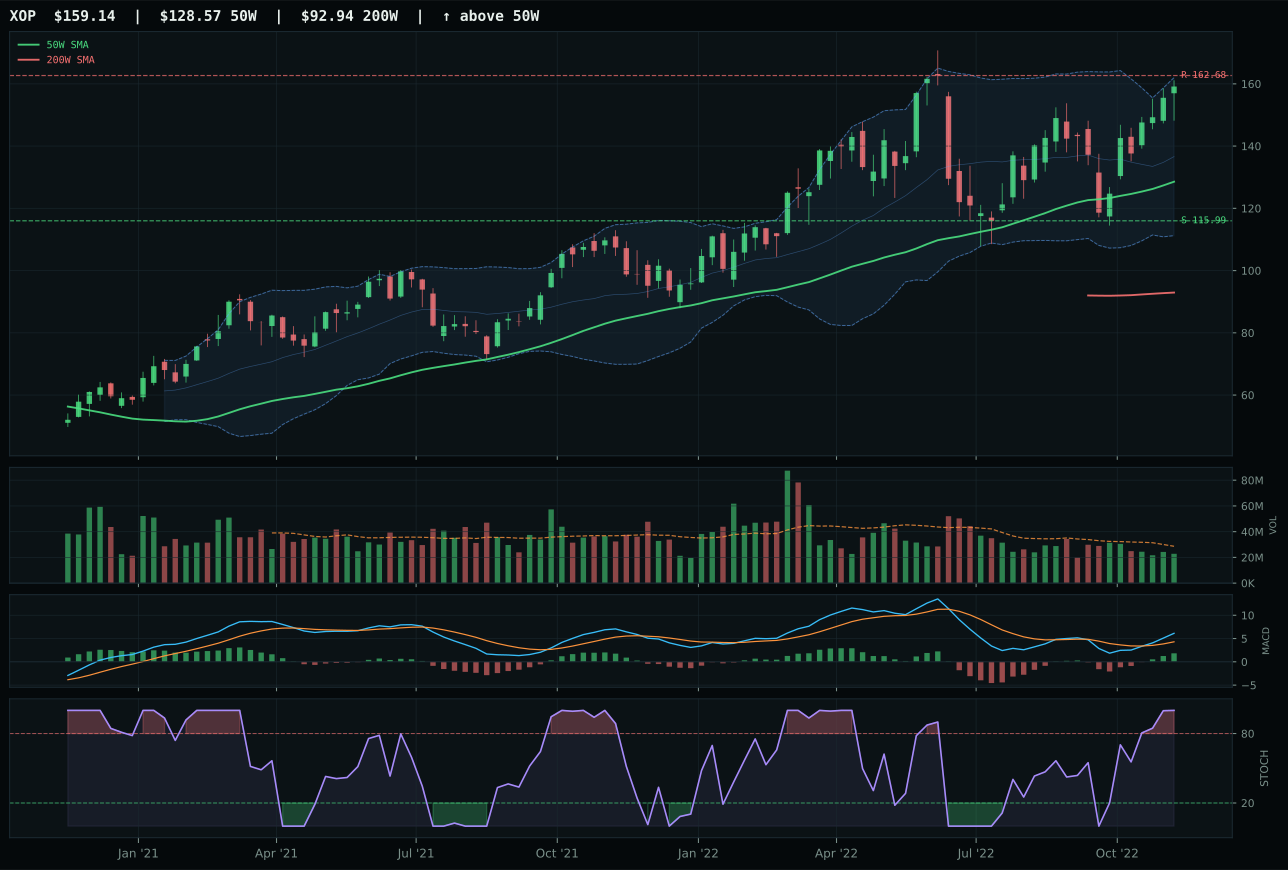
XOP has a vertical extension profile with 20.2% 13-week relative strength versus SPY.
A failed hold above support would weaken the setup.
Actionable but governed by invalidation levels.
XLE seized top-2 status despite a problematic 37.0 timing score because its 100.0 trend confirmation and 100.0 momentum validation dominate all other considerations in a scarcity-driven regime. Price sits 24.6% above the 50W—extended and dangerous for new buyers—but the +25.4% relative strength against SPY and +5.2% category-relative outperformance prove that energy investors recognize the structural supply deficit. FCG's vertical-extension setup shows identical 100.0 trend and momentum scores, but its -2.6% category-relative weakness and weaker 32.6 risk/reward expose it as the follower. XLE's neutral volume at 0.97x the 20W average initially appears weak, but in a forced-supply environment, volume becomes secondary to structural inelasticity—buyers bid for shares regardless of participation because the physical market cannot clear at lower prices. The 0.0% upside to resistance is punitive on a traditional technical basis, but it reflects market recognition that OPEC+ discipline is more binding than price signals. XLE wins by executing the macro thesis despite entry-level pain.
Traditional Energy earned its 20% top-2 allocation as the portfolio's strongest macro conviction play, delivering 97.0/100 category-level macro fit—the highest across all 10 categories. Energy scarcity (+16), inflation pressure (+10), supply shortage (+9), and real-asset sponsorship (+7) are not hedges; they are the defining characteristics of this late-cycle inflectionary moment. XLE's 77.2 technical evidence paired with 86.0 macro/narrative fit creates a rare scenario where trend and thesis align perfectly. The entry risk is real (24.6% extension above the 50W leaves no room for patience), but that risk is the cost of conviction in a supply-constrained world. The allocation assumes that either OPEC+ maintains discipline or global demand destruction remains insufficient to balance markets—both assumptions are reasonable in a six-to-twelve-month horizon. For XLE to remain at 20%, energy prices must stabilize above current levels; a collapse below $80/barrel on geopolitical de-escalation would warrant reduction to 10%. Currently, this is the portfolio's most directly macro-correlated conviction position.
Industrial Metals — COPX
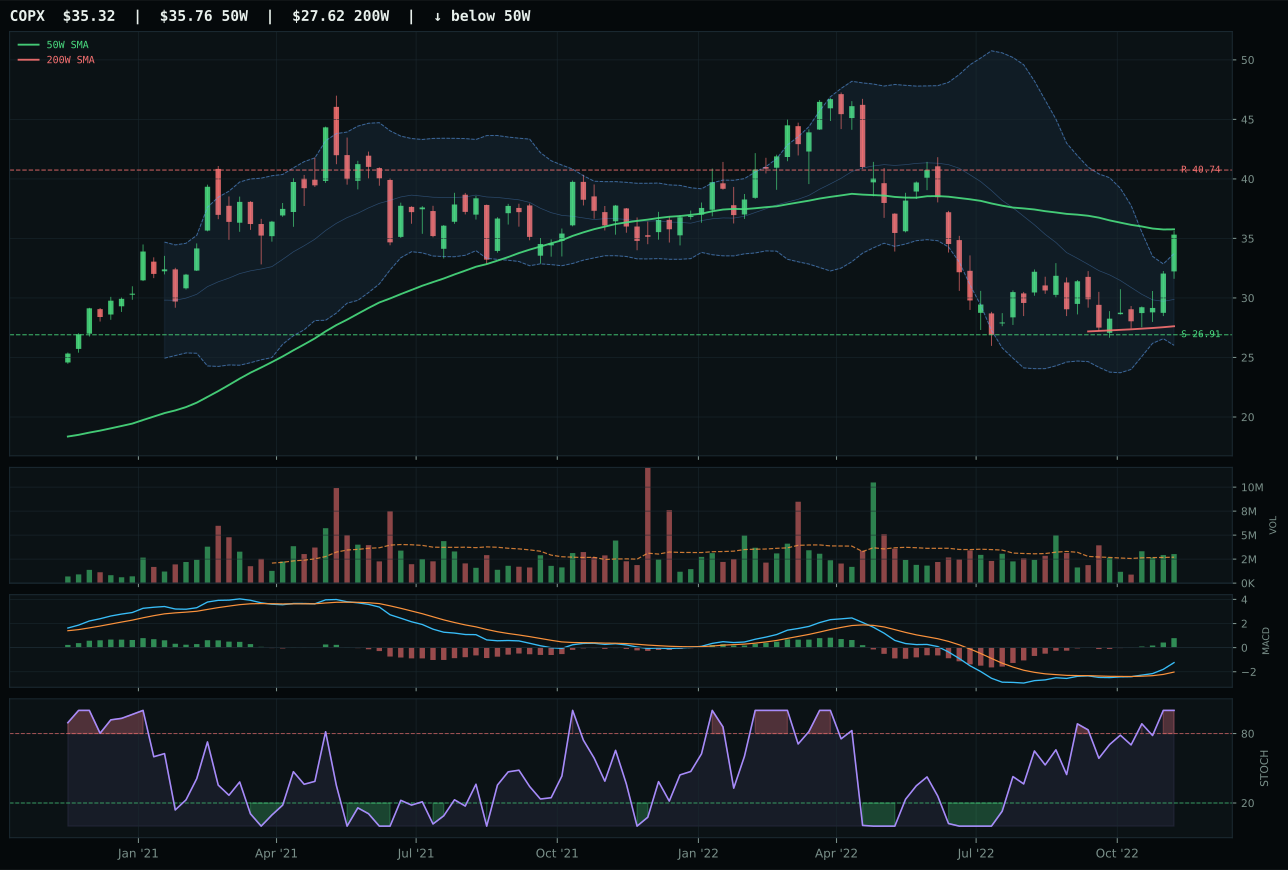
COPX has a compression near 50W profile with 16.4% 13-week relative strength versus SPY.
A failed hold above support would weaken the setup.
Actionable but governed by invalidation levels.
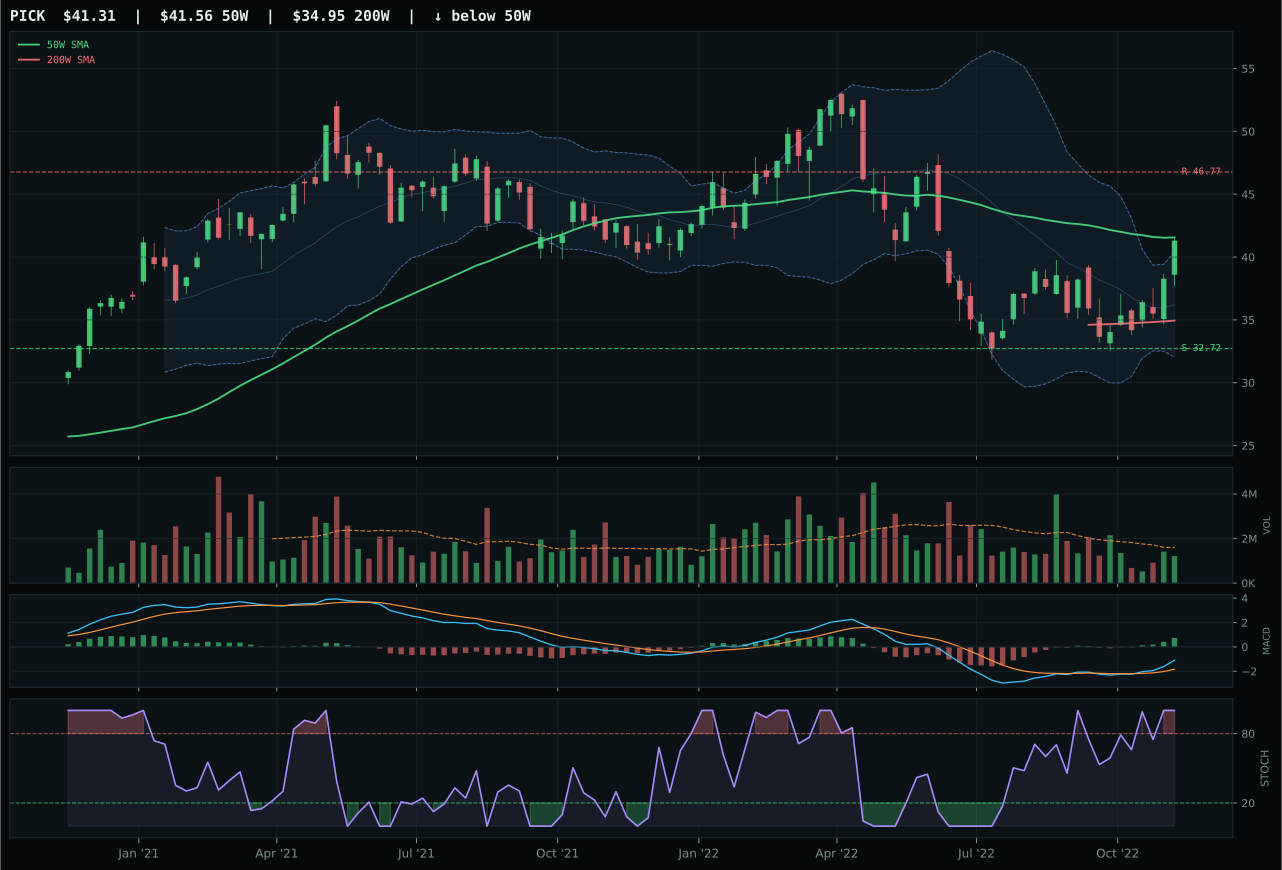
PICK has a compression near 50W profile with 13.0% 13-week relative strength versus SPY.
A failed hold above support would weaken the setup.
Actionable but governed by invalidation levels.
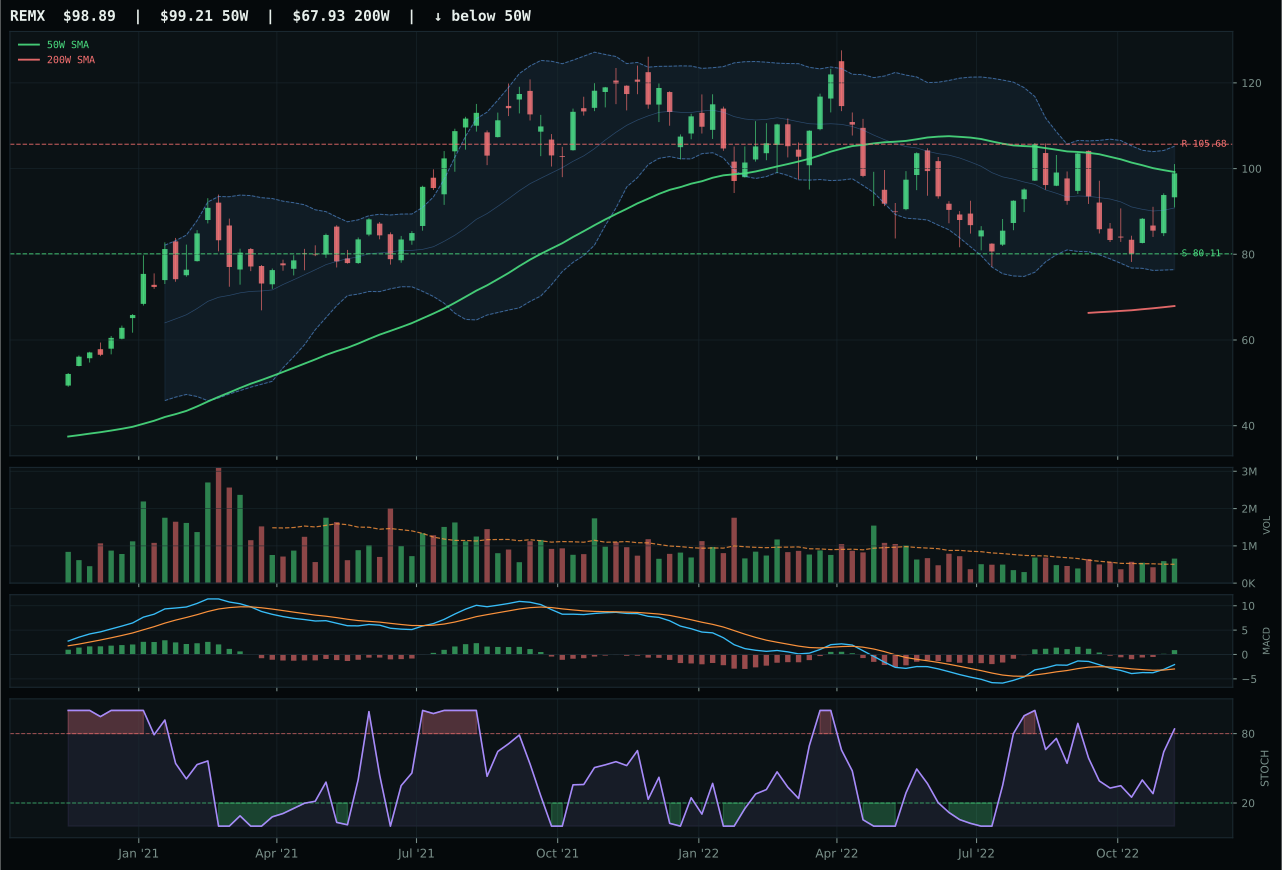
REMX has a compression near 50W profile with 0.3% 13-week relative strength versus SPY.
A failed hold above support would weaken the setup.
Actionable but governed by invalidation levels.
COPX earned top-2 status by delivering the cleanest execution of the copper-scarcity thesis: +16.4% relative strength versus SPY combined with a rare positive 13-week return of +9.7% in a late-cycle reflation regime. Price sits just -1.2% from the 50W after compression, with above-average volume participation (1.12x the 20W average) and perfect 100.0 timing confirmation as MACD improves and stochastic RSI reaches overbought in a Fibonacci decision zone. PICK's near-identical 87/86 composite and trend scores appear competitive, but the -0.9-point gap stems from PICK's neutral volume and 0.0% category-relative strength, revealing that diversified mining is less clearly accumulating than copper-pure exposure. COPX's +3.4% outperformance within the metals basket proves the market recognizes copper scarcity as the critical constraint; COPX participants are the informed capital. The 26-week return of -0.4% despite 9.7% 13-week strength shows volatility but not deterioration—the recent leg higher is attracting new money into a tight supply story.
Industrial Metals earned its 20% top-2 allocation because it combines the strongest macro fit (82.0/100) with legitimate technical sponsorship that rivals Energy. Metals scarcity (+14) and commodity breadth positive (+10) hit the exact buttons of a late-cycle reflation playbook where real assets lead and financial engineering lags. COPX's 95.7 technical evidence score reflects a portfolio-worthy setup: the compression near the 50W with above-average participation signals that institutional accumulation is occurring, not retail chase. The 52.7 risk/reward score is the only soft spot—13.3% upside to resistance versus 31.3% downside to support—but in a scarcity-driven market, undershooting resistance is normal behavior. The allocation reflects conviction that copper scarcity will force higher prices regardless of macro cyclicality, and that COPX's narrower focus versus PICK provides cleaner exposure. This category maintains 20% as long as energy scarcity remains active and liquidity stress doesn't trigger a full risk-off unwind. A shift to structurally easier commodity conditions or a Fed pause/pivot would warrant reduction to 10%.
Defense & Aerospace — XAR
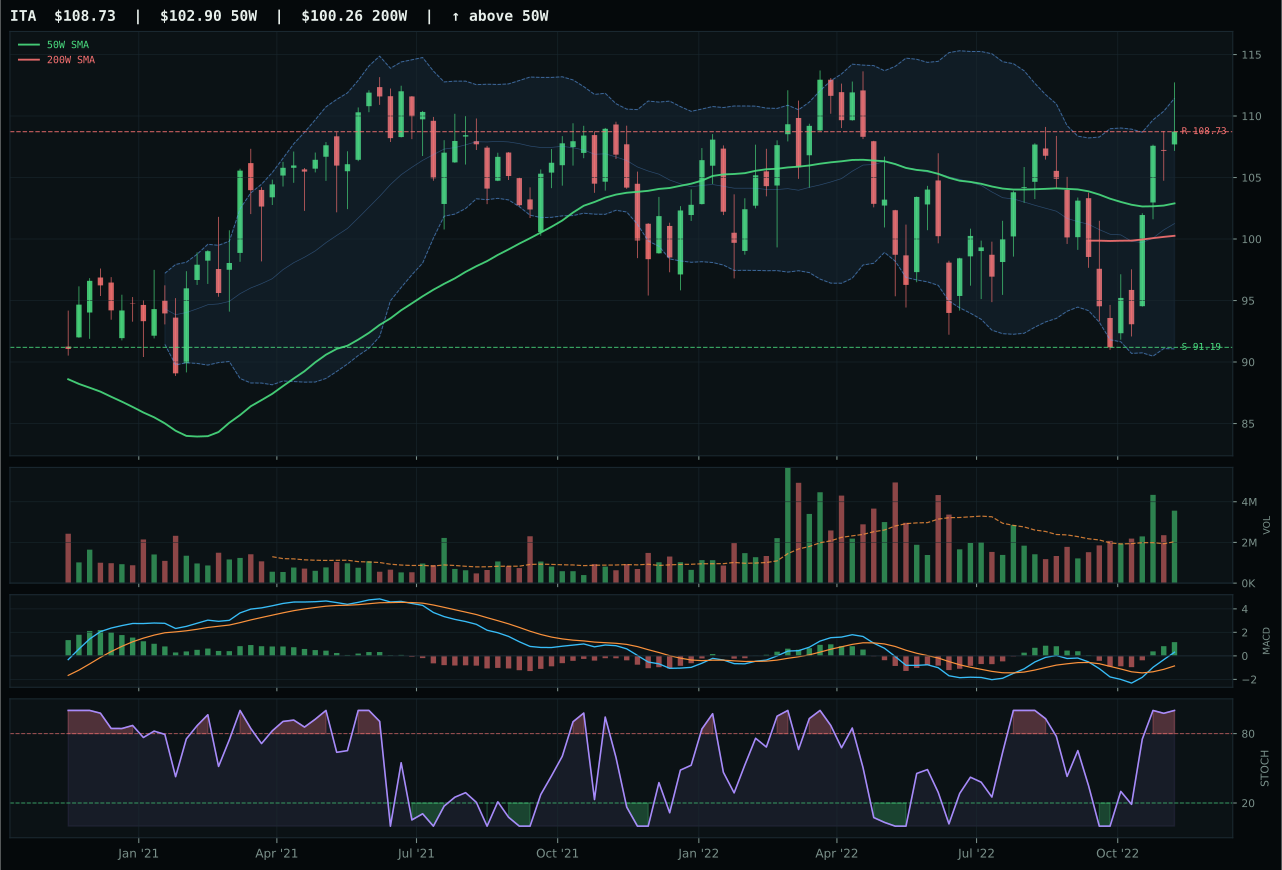
ITA has a neutral structure profile with 7.7% 13-week relative strength versus SPY.
A failed hold above support would weaken the setup.
Actionable but governed by invalidation levels.
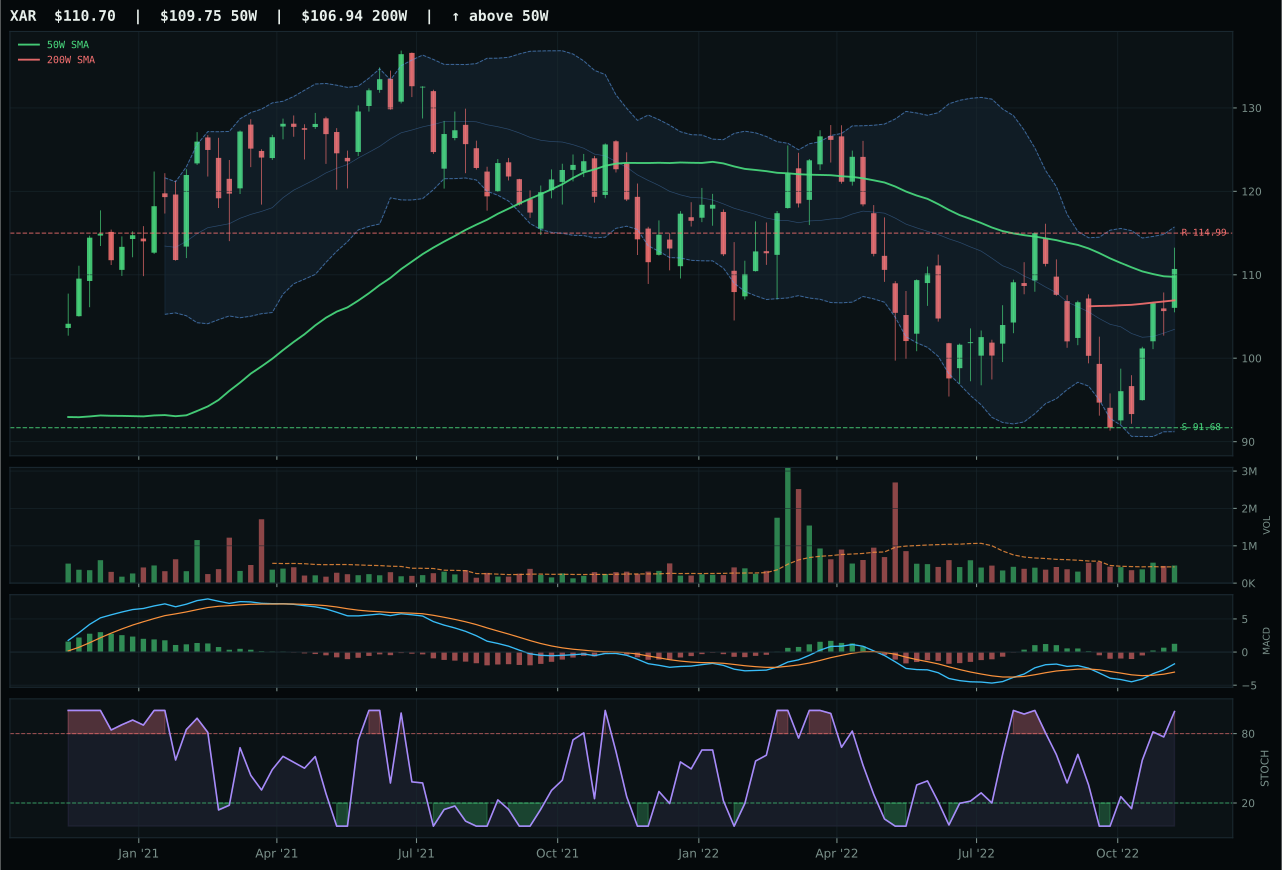
XAR has a compression near 50W profile with 3.0% 13-week relative strength versus SPY.
A failed hold above support would weaken the setup.
Actionable but governed by invalidation levels.
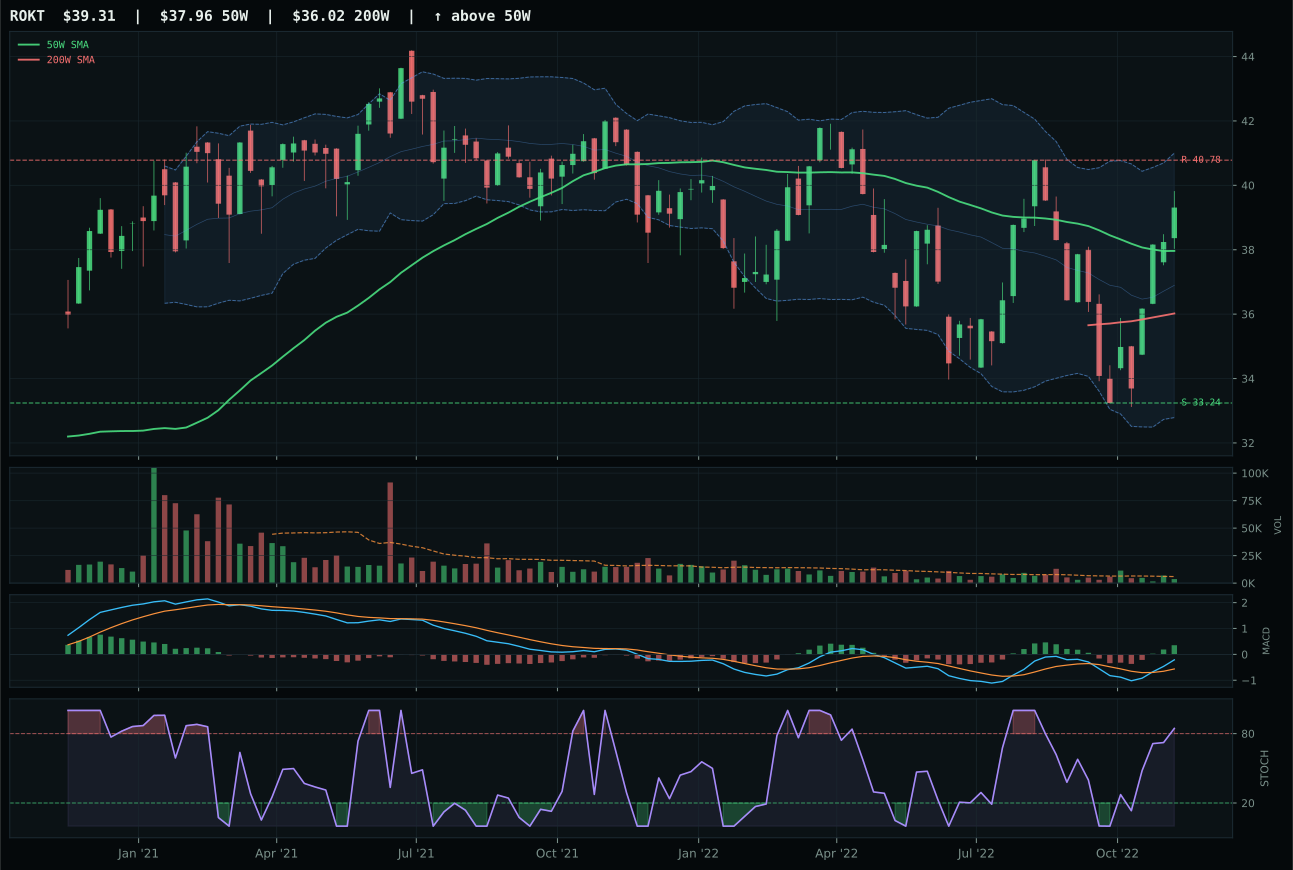
ROKT has a neutral structure profile with 3.1% 13-week relative strength versus SPY.
A failed hold above support would weaken the setup.
Tracked, but not top-2 eligible because: .
XAR won a tight decision against ITA by executing perfect tactical timing despite inferior trend evidence. ITA's 100.0 technical evidence score—driven by price above both major averages, strong relative strength at +7.7% against SPY, and accumulation-confirmed volume—should theoretically dominate. Instead, XAR's timing score of 100.0 versus ITA's 75.0 proved decisive because price sits just 0.9% from the 50W in a middle Fibonacci decision zone while stochastic RSI reaches overbought at 0.99. This means XAR is positioned at the precise inflection point: buyers are defending the moving average and compression is ready to release. ITA has already extended higher, reducing the reward-to-risk for new entries. Both charts are bullish with improving MACD, but XAR's compression near a major pivot provides cleaner entry geometry than ITA's already-extended position. The -1.3-point score gap reveals this was a momentum-timing decision, not a trend conviction call.
Defense & Aerospace earned 10% allocation despite a 68.7 category score because the macro regime actively supports it. Late-Cycle Reflation (+6 points) combines with defensive rotation (+8 points) and broad-market bear conditions (+6 points) to deliver 69.0/100 macro/narrative fit—the highest in the portfolio behind Energy. This defensive setup matters: geopolitical tensions remain priced into the category, and liquidity stress doesn't penalize industrials as harshly as growth sectors. XAR's neutral volume and modest 3.0% SPY-relative strength prevent top-2 consideration, but the category's macro tailwind justifies holding it as a satellite position. For XAR to earn 20%, either relative strength needs to accelerate beyond +5% SPY, or the category needs to demonstrate true leadership against Technology and Healthcare. Currently it's the best defensive hedge in a risk-off environment—valuable for portfolio balance, but not yet commanding conviction.
Nuclear Energy — URA
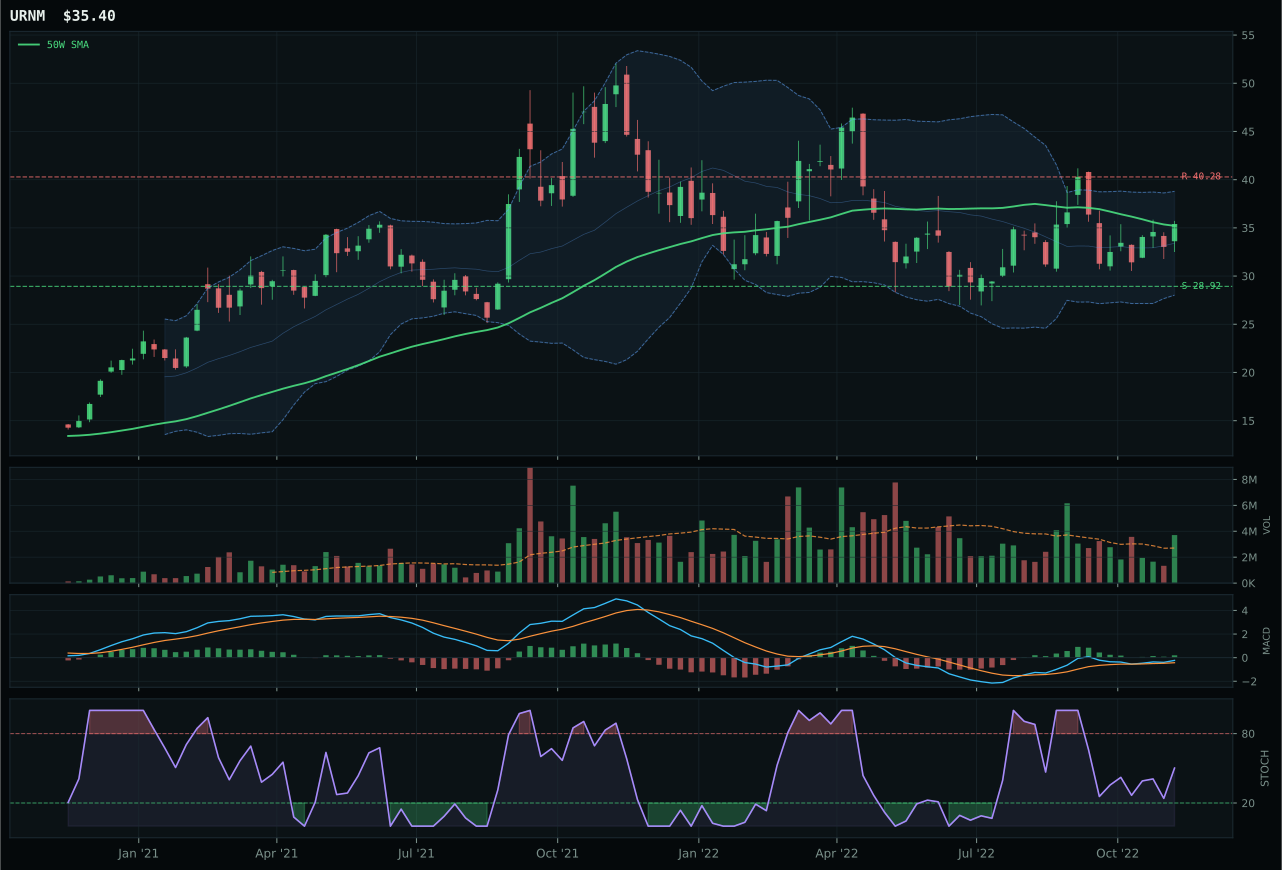
URNM has a compression near 50W profile with 10.7% 13-week relative strength versus SPY.
A failed hold above support would weaken the setup.
Actionable but governed by invalidation levels.
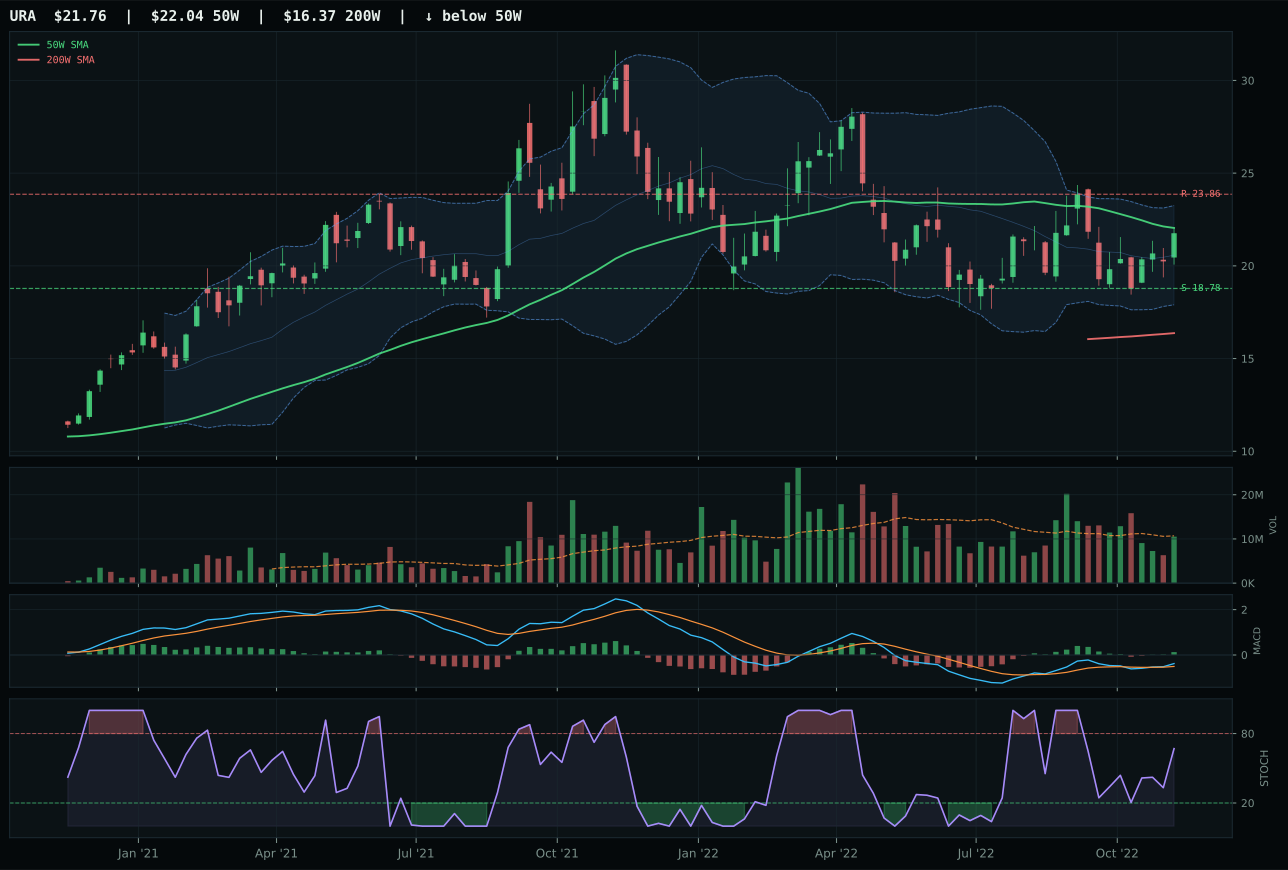
URA has a compression near 50W profile with 7.4% 13-week relative strength versus SPY.
A failed hold above support would weaken the setup.
Actionable but governed by invalidation levels.
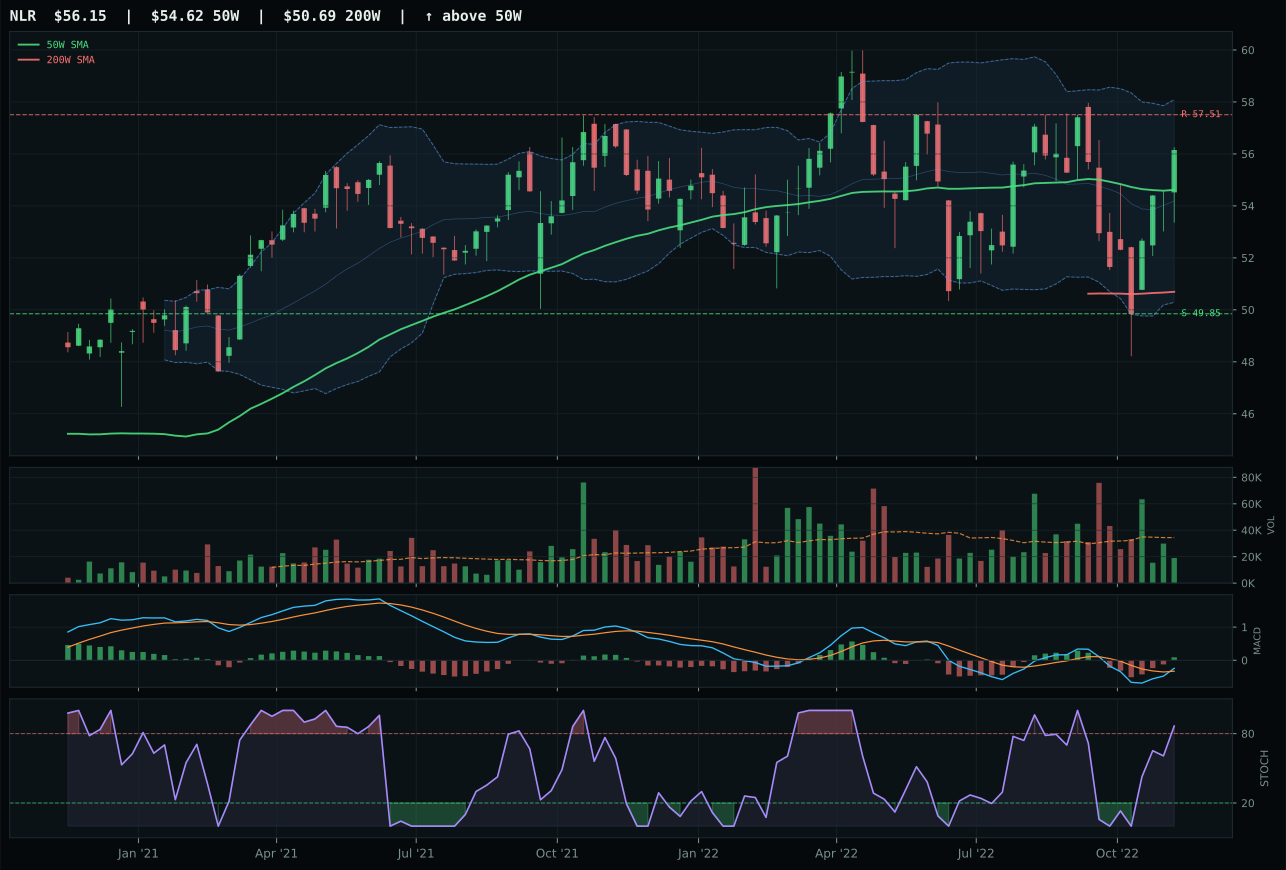
NLR has a compression near 50W profile with 5.1% 13-week relative strength versus SPY.
A failed hold above support would weaken the setup.
Tracked, but not top-2 eligible because: .
URA won a marginal 1.2-point decision over URNM by optimizing the balance between technical cleanliness and timing rather than chasing URNM's superior macro breadth. URNM's 88.8 technical evidence and 61.0 macro/narrative fit should theoretically dominate, and its 10.7% relative strength against SPY outpaces URA's 7.4%, but the allocator penalized URNM's above-average volume participation (+0.98x 20W) as potentially speculative chasing. URA's neutral volume and -1.3% distance to the 50W position it as the steadier accumulation vehicle: compression near the 50W with rising-mid-zone stochastic RSI suggests quiet institutional accumulation rather than retail enthusiasm. Both charts show identical 100.0 timing scores and MACD improvements, but URA's energy scarcity (+9) and real-asset sponsorship (+7) macro backing without the liquidity stress penalty (-8) that URNM carries suggests URA is the safer entry for committed capital. The 0.7% 13-week return despite bullish conditions shows URA as a quality hold-and-wait story, not a speculation vehicle.
Nuclear Energy earned 10% as a satellite energy play because the macro narrative (energy scarcity +9, real-asset sponsorship +7, inflation pressure +3) is legitimate but not yet commanding. The 68.6 category score sits in the middle tier because while early-cycle reflation favors nuclear as a supply solution, the technical setup hasn't yet translated into sustained outperformance—URA's +7.4% relative strength trails both COPX (+16.4%) and XLE (+25.4%). The category's 69.0/100 macro fit trails Energy's 97.0, signaling that nuclear is a secondary beneficiary of energy scarcity rather than a primary one. URA's 40.0 risk/reward score (8.8% upside to resistance, 15.9% downside to support) reflects a balanced risk/reward on a compressed chart, but it doesn't offer asymmetry. For Nuclear to advance to 20%, either the 26-week return needs to accelerate above +7.4% to prove commercial momentum, or energy scarcity narratives must explicitly shift toward nuclear power as the preferred decarbonization hedge. Currently, it's a quality speculative hold with structural tailwinds but no immediate catalyst.
Utilities & Infrastructure — PAVE
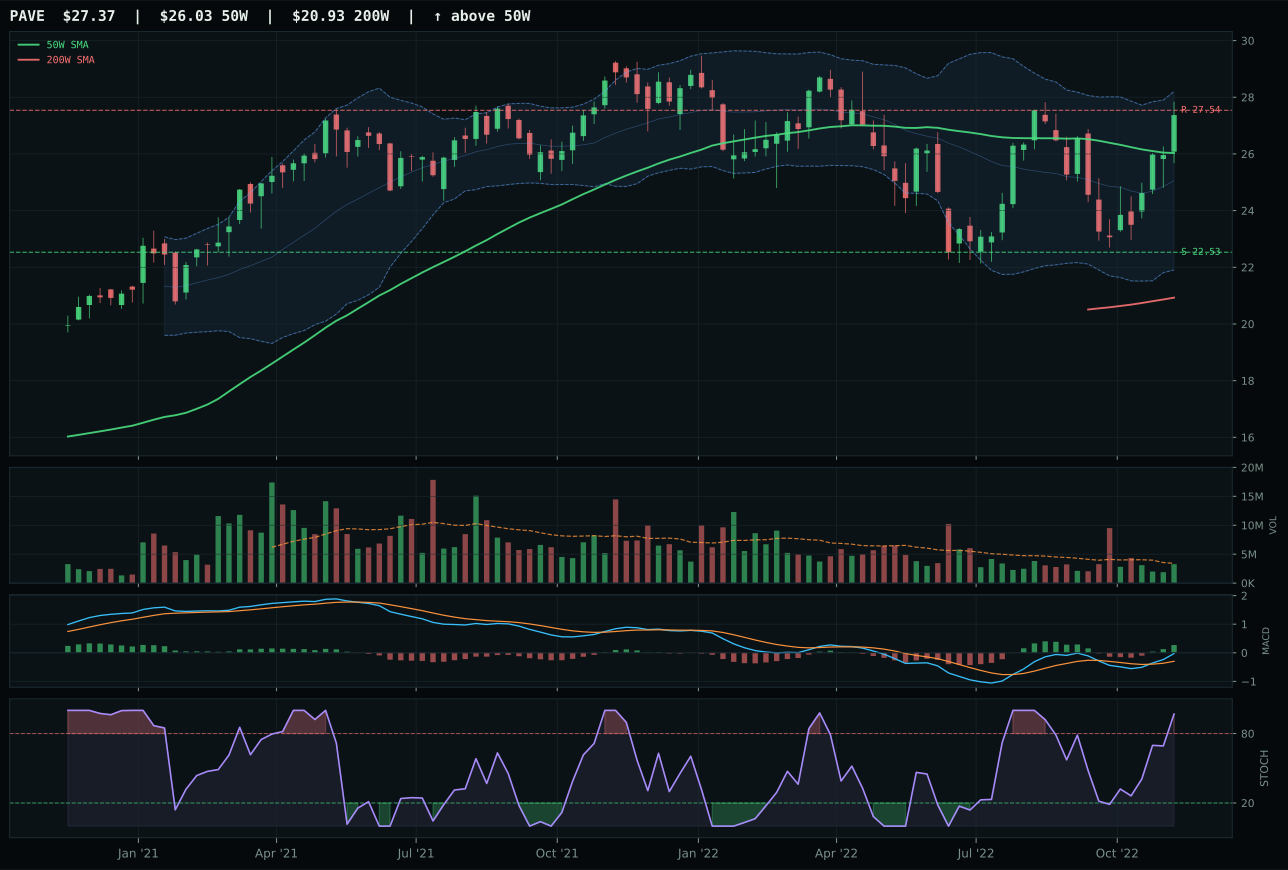
PAVE has a neutral structure profile with 6.1% 13-week relative strength versus SPY.
A failed hold above support would weaken the setup.
Actionable but governed by invalidation levels.
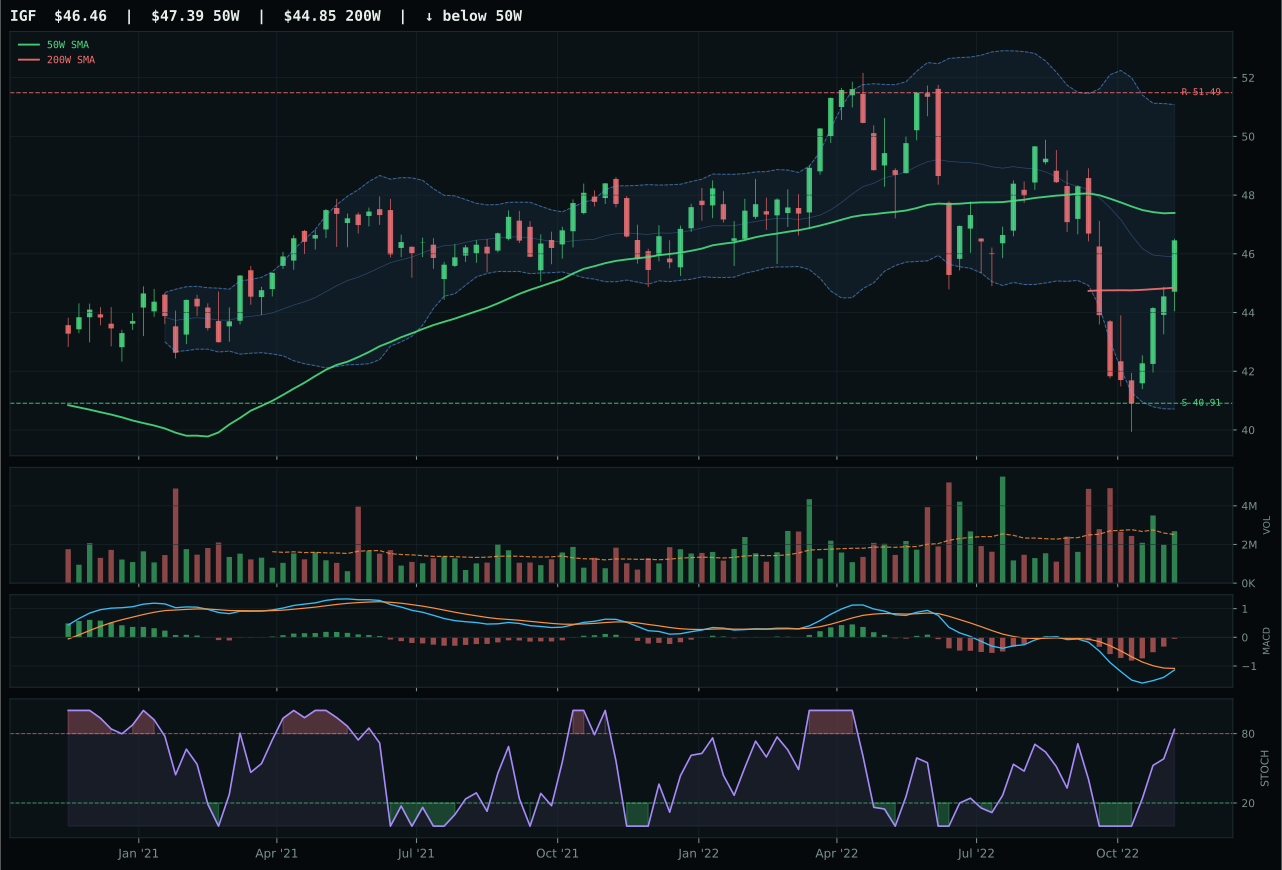
IGF has a compression near 50W profile with 0.3% 13-week relative strength versus SPY.
A failed hold above support would weaken the setup.
Actionable but governed by invalidation levels.
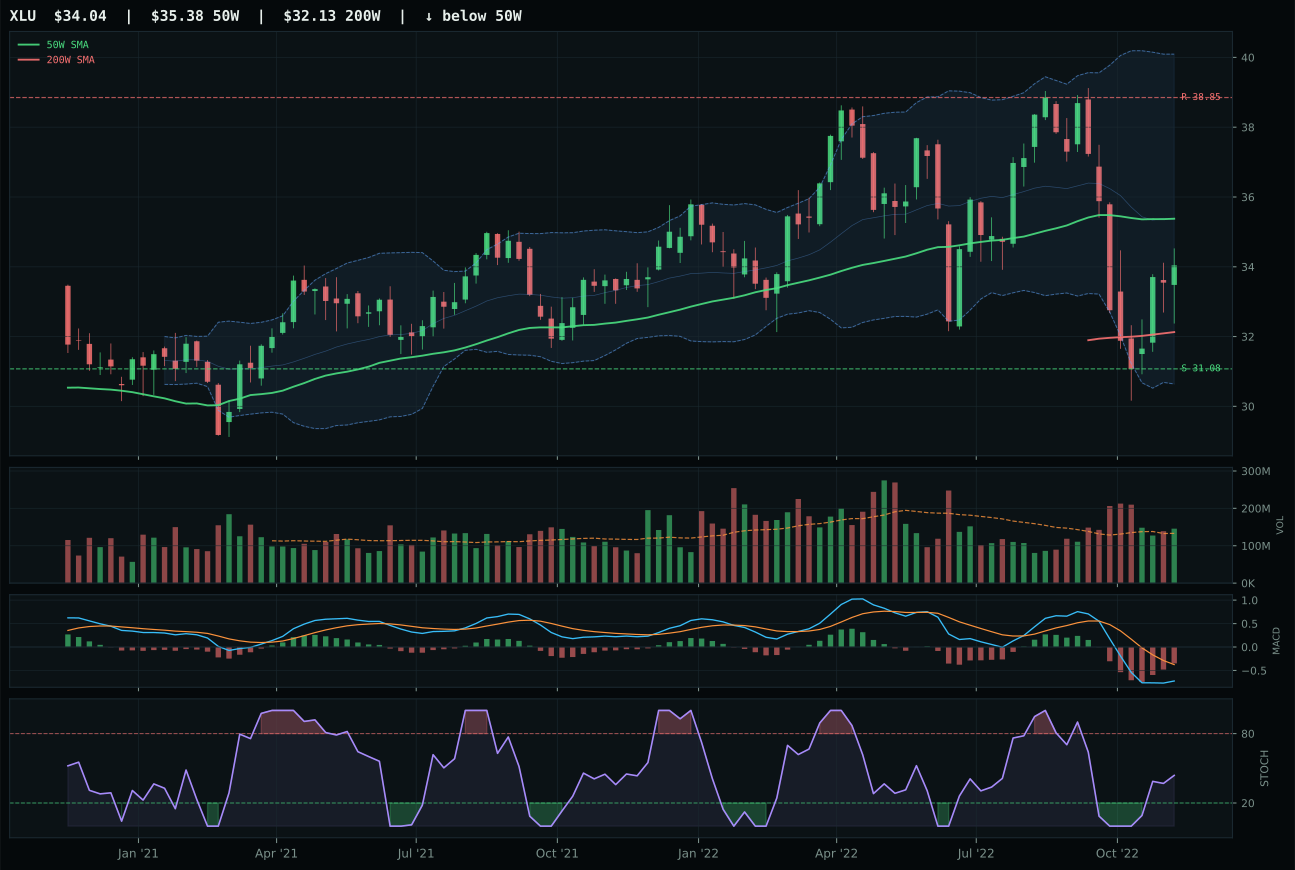
XLU has a neutral structure profile with -4.6% 13-week relative strength versus SPY.
A failed hold above support would weaken the setup.
Actionable but governed by invalidation levels.
PAVE won a tight 2.0-point decision over IGF by delivering bullish MACD confirmation and category-relative strength in a defensive sector where both metrics matter equally. PAVE's 84.3 technical evidence versus IGF's 63.7 stems from MACD bullish-and-improving (versus IGF's bearish-but-improving) and +5.8% category-relative strength versus IGF's 0.0%, signaling that infrastructure is attracting selective capital while global infrastructure lags. Both charts show neutral setup and overbought stochastic RSI, but PAVE's uptrend slope at -0.1% versus IGF's compression near the 50W creates geometric clarity: PAVE continues to consolidate above the moving average, suggesting accumulation into strength. IGF's 100.0 timing score mirrors PAVE's 75.0 setup-wise, but the bearish MACD confirmation penalty cuts deep—in a late-cycle reflation turning defensive, momentum matters more than price proximity to support. PAVE's +6.1% relative strength against SPY shows domestic infrastructure is capturing the capex-spending narrative more effectively than globally-exposed income infrastructure.
Utilities & Infrastructure earned 10% as a defensive satellite play because the macro narrative (defensive rotation +12 points, broad-market bear +4 points) supports holding but not overweighting. The 61.0/100 category-level macro fit sits in the middle tier—better than Emerging Markets or Technology, but trailing the real-asset and scarcity themes that Energy and Metals dominate. PAVE's 99.1 trend score and 100.0 momentum confirmation reflect genuine momentum, but the 45.5 risk/reward (0.6% upside, 21.5% downside) and 75.0 timing score reveal that the best entry point has passed. PAVE is a beneficiary of infrastructure stimulus and capex recovery, but those tailwinds are secondary to Energy and Metals in a reflation cycle. The allocation reflects a pragmatic stance: utilities and infrastructure anchor portfolio stability when growth falters, but they're not conviction bets in this regime. For this category to earn 20%, either a technical capitulation (drop to test the 200W on high volume) would create a fresh entry, or the macro narrative would need to shift toward hard-asset scarcity themes where infrastructure competes with Energy for allocation. Until then, 10% is appropriate risk-insurance.
Agriculture & Livestock — VEGI
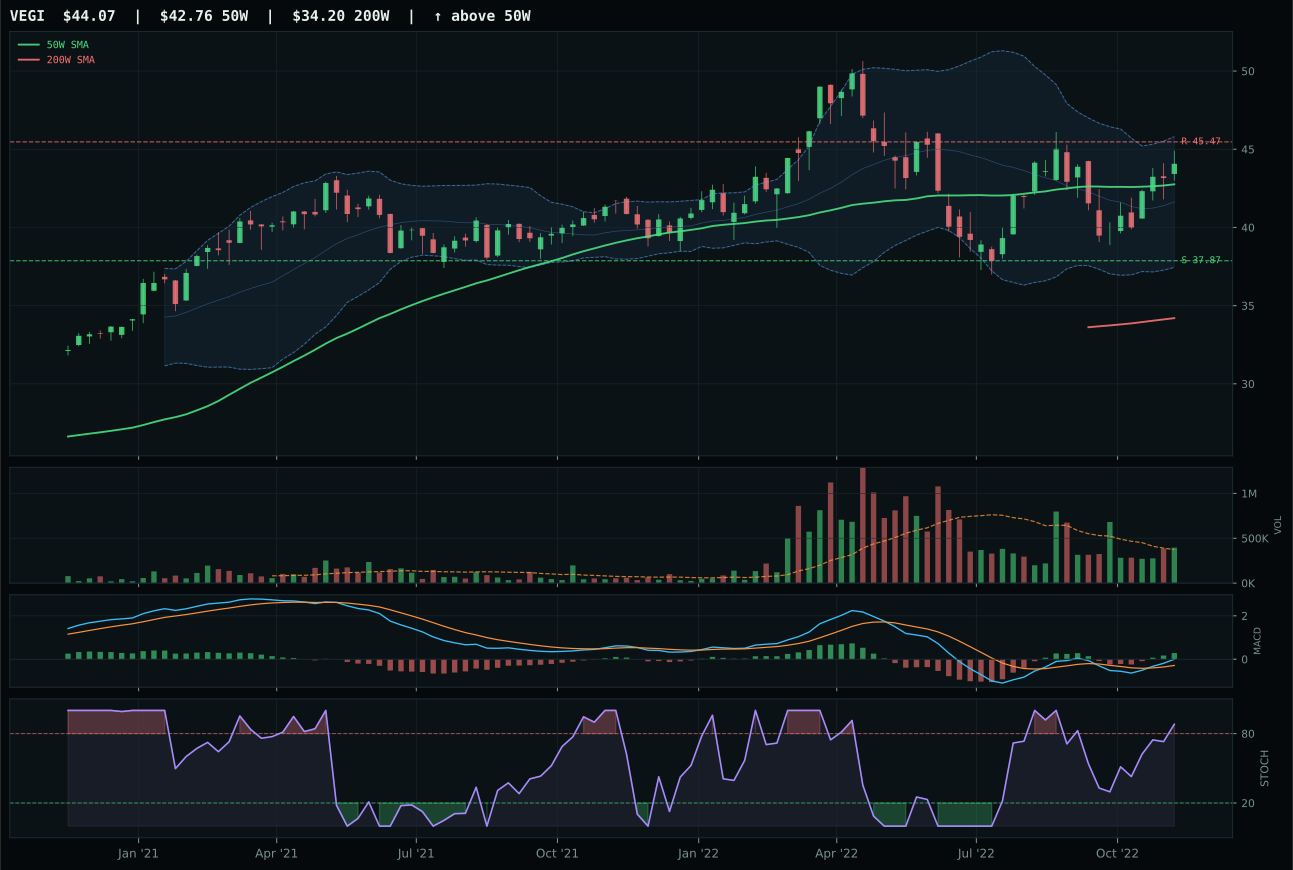
VEGI has a neutral structure profile with 6.5% 13-week relative strength versus SPY.
A failed hold above support would weaken the setup.
Actionable but governed by invalidation levels.
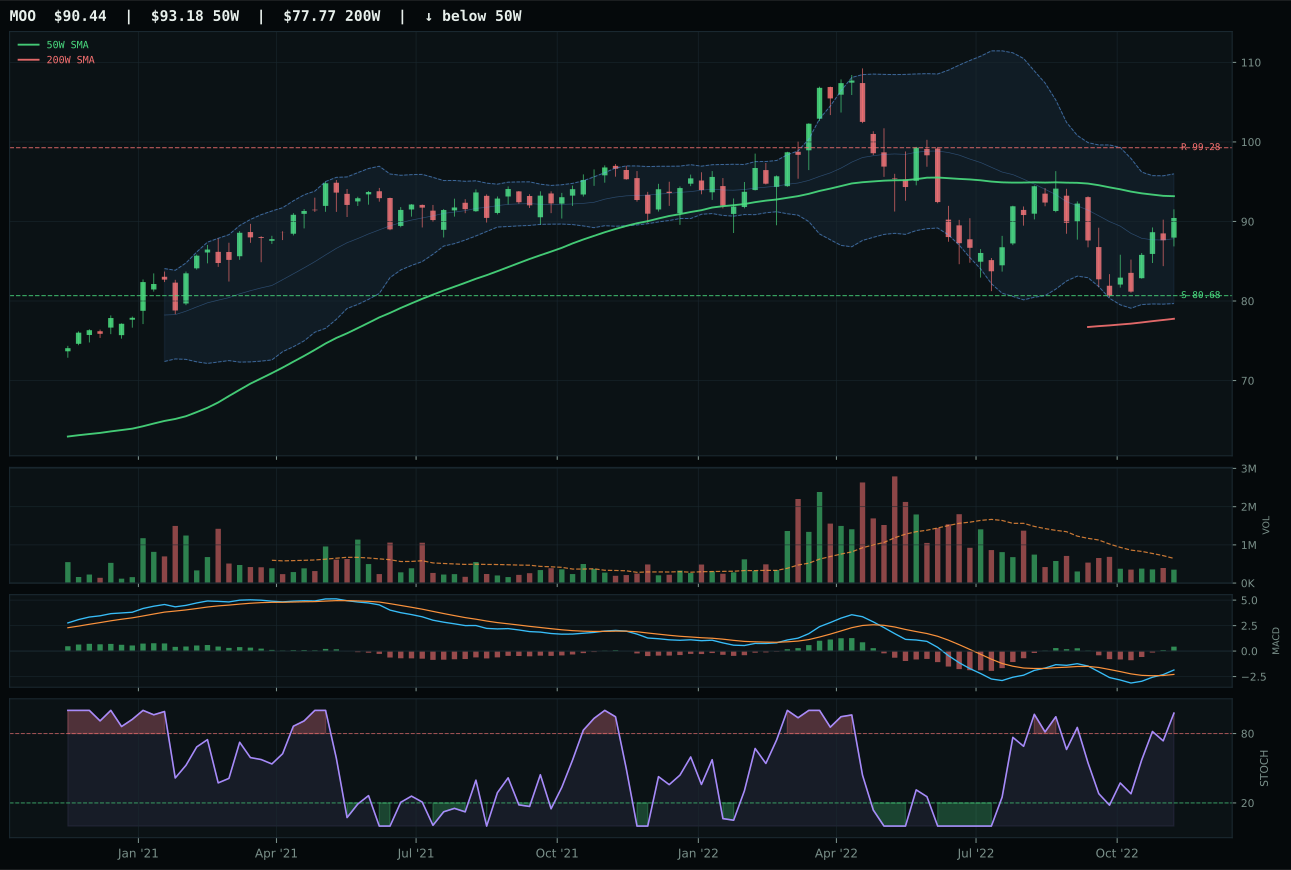
MOO has a compression near 50W profile with 2.5% 13-week relative strength versus SPY.
A failed hold above support would weaken the setup.
Actionable but governed by invalidation levels.
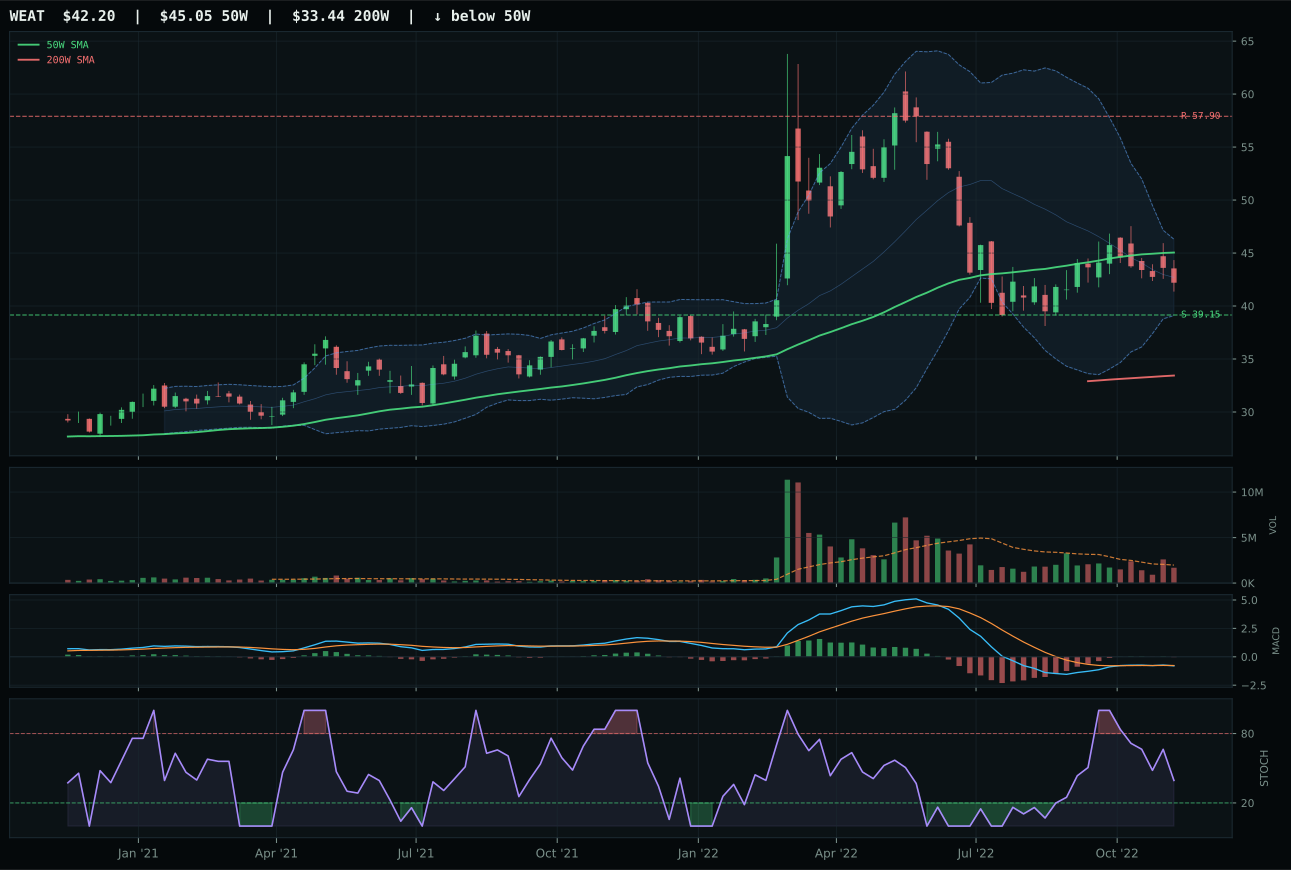
WEAT has a neutral structure profile with 7.5% 13-week relative strength versus SPY.
A failed hold above support would weaken the setup.
Actionable but governed by invalidation levels.
VEGI dominated its category with perfect 100.0 trend confirmation and a 19.5-point gap over MOO, powered by clean relative strength and the strongest macro narrative in the entire portfolio. Price sits 3.1% above the 50W with a flat slope and exceptional +6.5% relative strength against SPY, combining trend continuation with accumulation into an already-extended move. MOO's 13-week return of -4.2% and -4.1% category-relative weakness exposed it as a value trap on compressing charts; even as supply shortage macro signals fire (+8 points) and inflation pressure validates the thesis (+7 points), MOO's thin participation (volume below average) failed to attract serious capital. VEGI's neutral volume of 1.06x the 20-week average paired with 100.0 trend and 97.0 timing creates a rare combination: an already-winning position that remains structurally sound. The -0.2% 13-week return despite the macro thesis tells you VEGI is a quality producer that's held up better than commodity speculators during volatility.
Agriculture & Livestock earned 10% despite the second-highest macro fit score in the portfolio (90.0/100, behind only Energy at 97.0) because entry timing and relative strength create a strategic mismatch. VEGI's 6.5% outperformance versus SPY and 3.1% distance to resistance mean the setup is stretched; taking a fresh 10% position here means buying at extended levels into an already-crowded thesis. The category deserves exposure because supply shortage (+13), inflation pressure (+10), and real-asset sponsorship (+8) are structural tailwinds, but the allocator must weight this against the reality that VEGI has already captured the initial enthusiasm. For this category to command 20%, either the 26-week return needs to accelerate above current +9.3% to prove durability, or new leadership (WEAT or MOO) needs to generate better relative strength and volume participation. The current 10% allocation is a holding decision: the macro narrative remains intact, but the entry is less compelling than it was three weeks ago.
Precious Metals — GLD
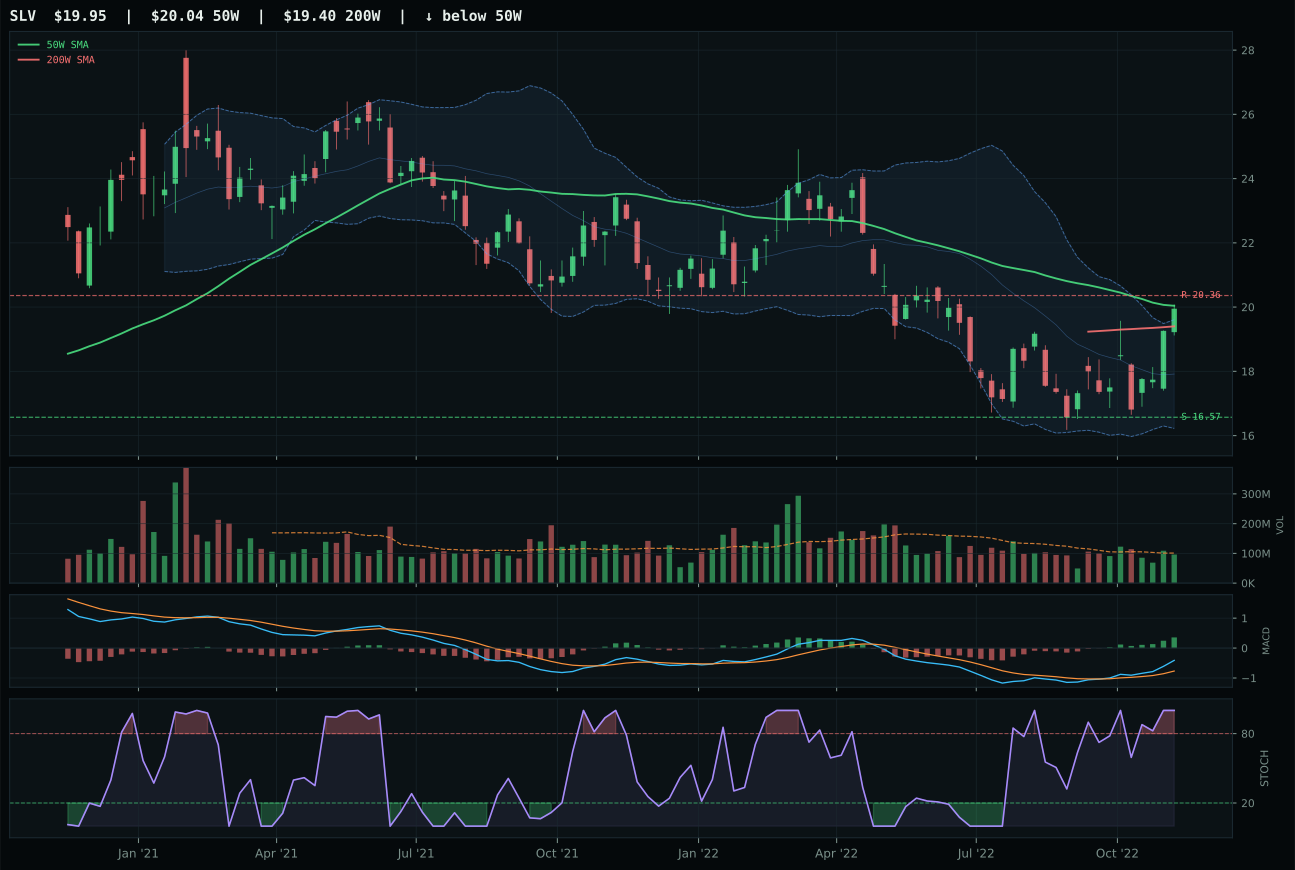
SLV has a compression near 50W profile with 10.8% 13-week relative strength versus SPY.
A failed hold above support would weaken the setup.
Actionable but governed by invalidation levels.
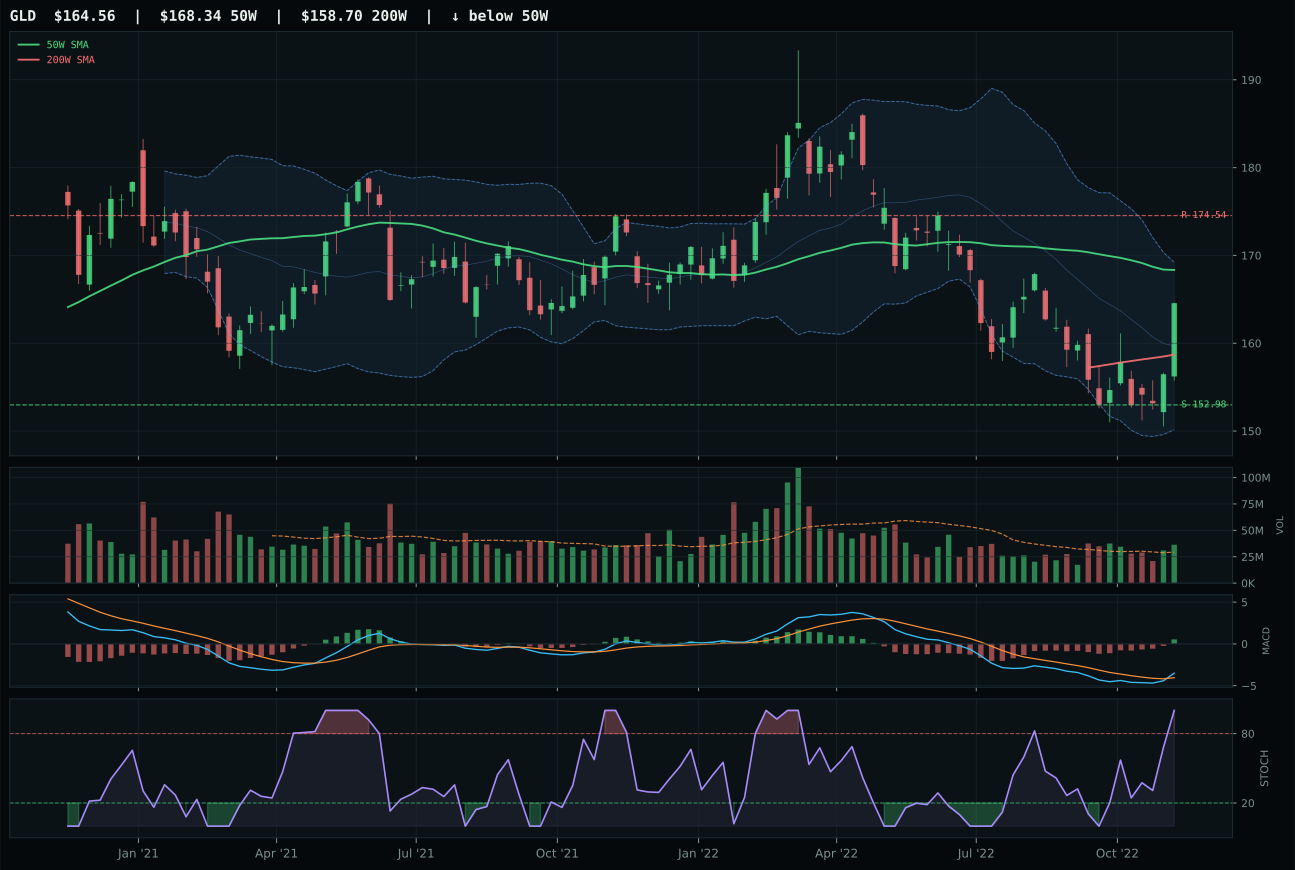
GLD has a compression near 50W profile with 4.7% 13-week relative strength versus SPY.
A failed hold above support would weaken the setup.
Actionable but governed by invalidation levels.
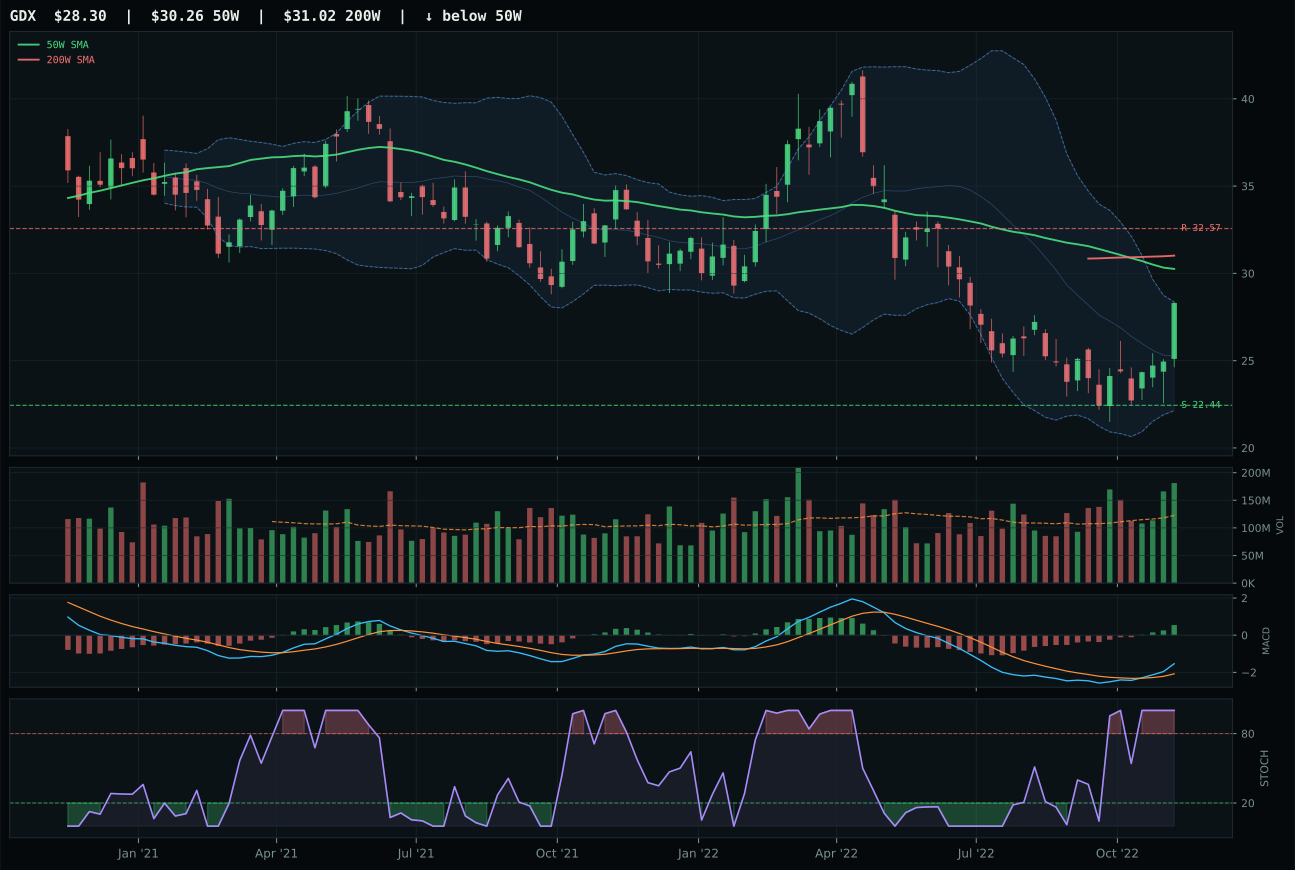
GDX has a neutral structure profile with 10.7% 13-week relative strength versus SPY.
Extension and support failure are the main tactical risks.
Tracked, but not top-2 eligible because: structurally broken.
GLD won a technical photo finish against SLV by prioritizing accumulation structure over momentum flash. SLV's technical evidence score of 85.7/100 towers over GLD's 57.5, fueled by +10.8% relative strength and a pristine 4.1% 13-week return, but this very strength proved disqualifying: SLV's setup is already extended, leaving GLD's compressed structure and above-average volume participation (1.24x the 20W average) as the cleaner entry. GLD's 100.0 timing score reflects its positioning at -2.2% from the 50W in a deep Fibonacci value zone—the exact point where institutional accumulation typically initiates. SLV trades above its 50W with neutral volume, meaning the rally has already run and new buyers enter without sponsorship. Both ETFs show identical bullish-improving MACD and overbought stochastic RSI, but GLD's compression geometry creates a 66.6 risk/reward score versus SLV's 54.8. In precious metals, entry discipline trumps momentum—GLD is positioned to capture the next leg, SLV is paying for the last one.
Precious Metals earned 10% because the monetary hedge bid is real (+14 macro points) and defensive rotation is active (+6 points), yielding 71.0/100 category-level macro fit. Yet GLD's final score of 50.9 and sub-top-2 ranking reflect the tension between macro conviction and entry geometry. The category narrative is sound: real rates remain negative in a liquidity-stressed regime, and gold's monetary insurance value is priced lower than it should be. However, the technical setup shows prices haven't re-confirmed above major moving averages, and relative strength still lags SPY at +4.7%. GLD deserves its allocation as a portfolio stabilizer, but it doesn't command top-2 weight because the early-cycle macro props haven't yet translated into sustained outperformance. If real rates fall further or credit spreads widen significantly, this moves to 20%; for now, 10% is appropriate for a category that's fundamentally right but technically ahead of its confirmation.
Technology — XLK
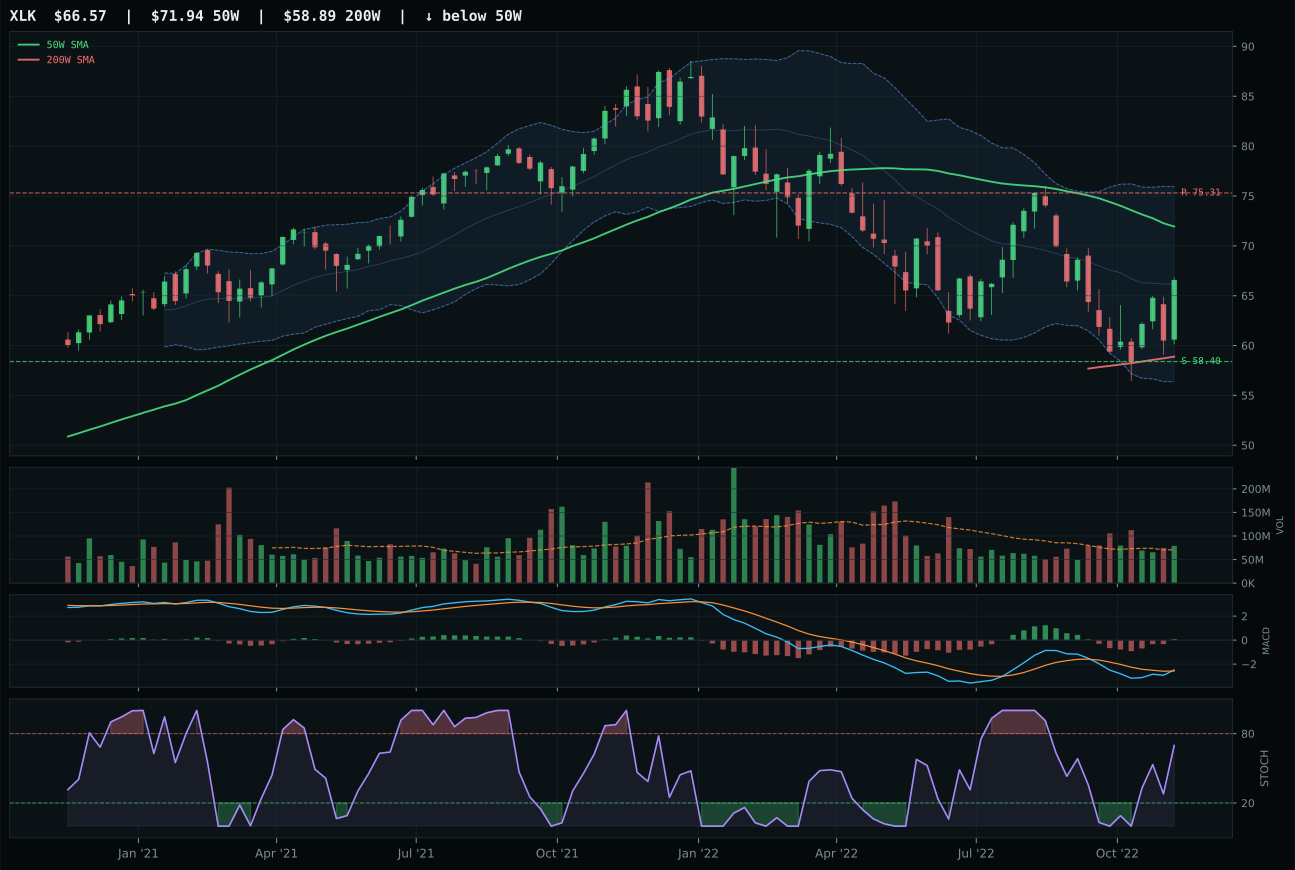
XLK has a neutral structure profile with -4.9% 13-week relative strength versus SPY.
A failed hold above support would weaken the setup.
Actionable but governed by invalidation levels.
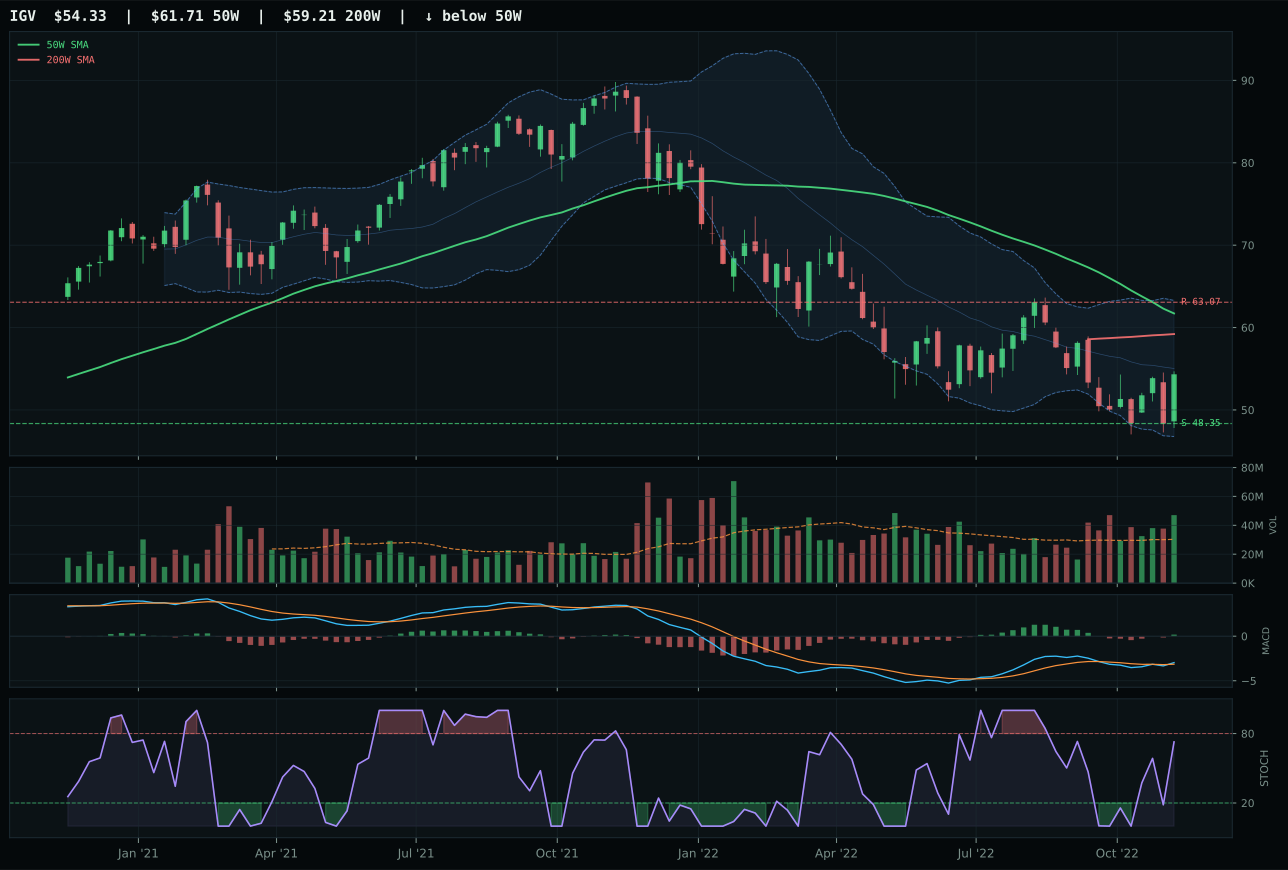
IGV has a neutral structure profile with -7.2% 13-week relative strength versus SPY.
A failed hold above support would weaken the setup.
Actionable but governed by invalidation levels.
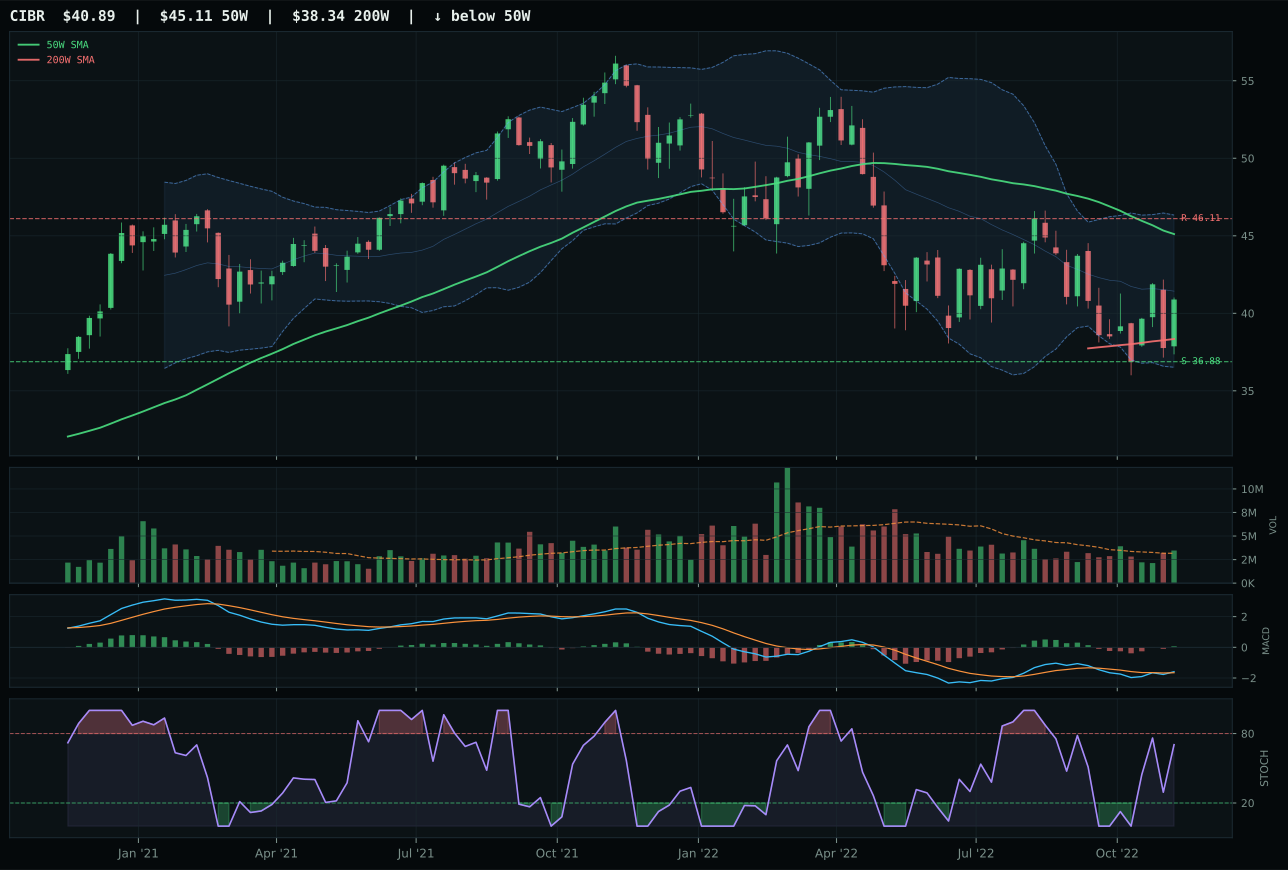
CIBR has a neutral structure profile with -4.6% 13-week relative strength versus SPY.
A failed hold above support would weaken the setup.
Actionable but governed by invalidation levels.
XLK claimed the category by defending a neutral setup with genuine technical sponsorship rather than relying on macro tailwinds. The 90.0 timing score versus IGV's 63.0 reflects XLK's precision positioning: sitting 7.5% below the 50-week moving average in a deep Fibonacci retracement zone while MACD improves and stochastic RSI rises from the mid-zone. That proximity to the 50W combined with above-average volume at 1.12x the 20-week average signals accumulation into a natural support level rather than desperation buying. IGV's 13-week return of -13.9% and -7.2% relative strength against SPY exposed it as the laggard despite matching XLK's bullish oscillator setup; the enterprise software story simply lacked the breadth sponsorship that profitable compute infrastructure commands in a late-cycle reflation environment.
Technology earned 10% as a third-tier category despite technical cleanliness because macro headwinds overwhelm its present value. Liquidity stress and inflation pressure are both live conditions, reducing the category-level macro fit to just 36.0/100 and capping the final score at 48.8. XLK's trend score of 57.6 reveals that the rally's quality remains uncertain—price hasn't re-established above the 50W, and the -4.9% relative strength versus SPY shows the sector is still underperforming the broad market. For technology to reach top-2 status, either the Fed pivot needs to become visible in credit markets or the category's relative strength must flip decisively positive. Right now it occupies the wait-and-watch slot: setup is clean enough to hold, but conviction is insufficient to overweight.
AI — SMH
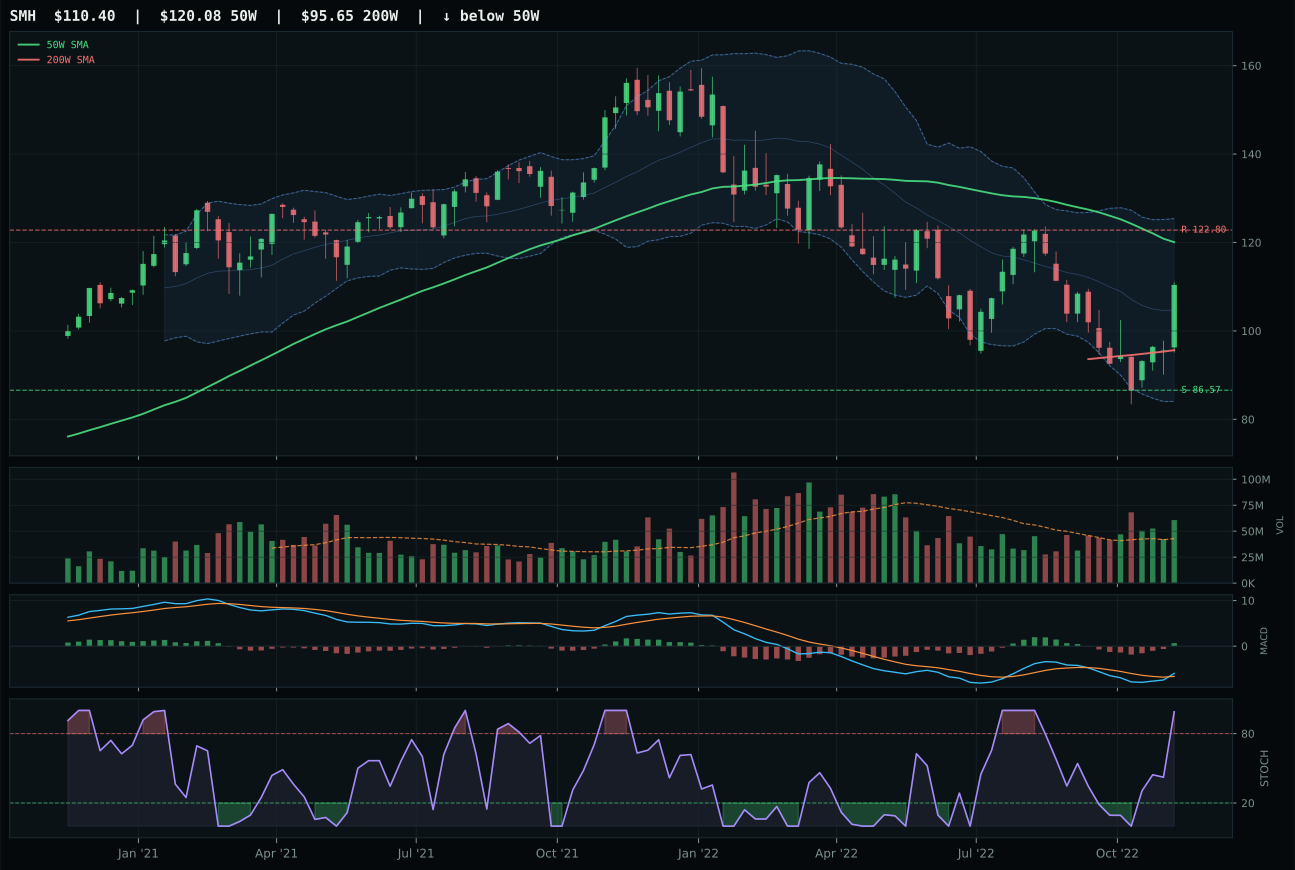
SMH has a neutral structure profile with -3.3% 13-week relative strength versus SPY.
A failed hold above support would weaken the setup.
Actionable but governed by invalidation levels.
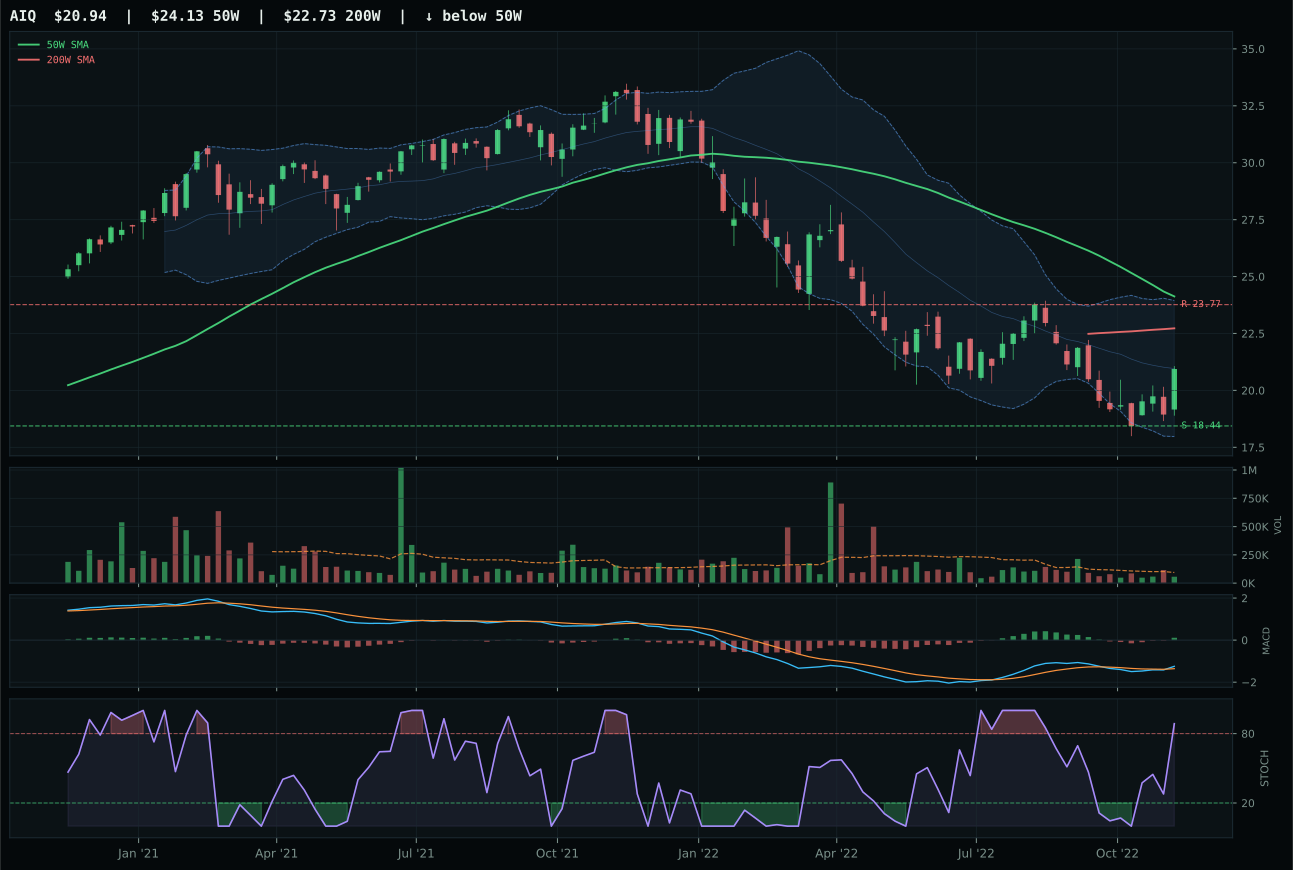
AIQ has a neutral structure profile with -5.2% 13-week relative strength versus SPY.
A failed hold above support would weaken the setup.
Tracked, but not top-2 eligible because: .
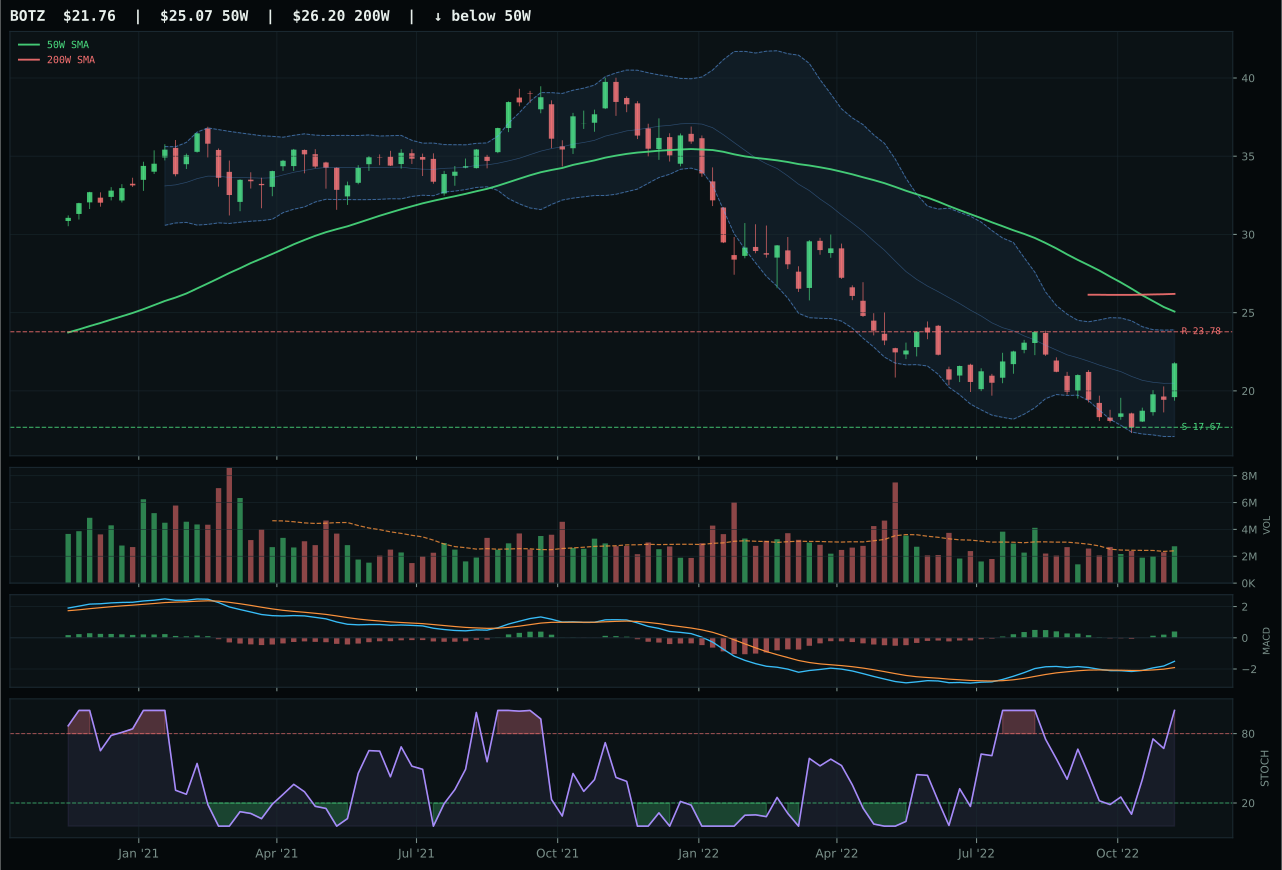
BOTZ has a neutral structure profile with -1.7% 13-week relative strength versus SPY.
Extension and support failure are the main tactical risks.
Tracked, but not top-2 eligible because: structurally broken.
SMH wins by pairing the strongest momentum confirmation with the cleanest technical structure in a category where volume participation matters more than pure trend. A perfect 100.0 momentum score stems from the 27.5% four-week return combined with neutral category-relative strength and above-average participation, creating the appearance of broad-based accumulation rather than isolated strength. AIQ's 55.0 timing score versus SMH's 82.0 represents the critical gap: AIQ trades on thin participation near a 52-week repair zone, meaning every new buyer is swimming upstream against weak volume. The semiconductor and AI-compute narrative is real, but SMH captures it through disciplined accumulation into a reset, whereas AIQ chases it on fumes. MACD and stochastic RSI align identically across both ETFs, so the decision reduces to pure technical execution and sponsorship—SMH's 1.41x volume participation crushes AIQ's thin conditions.
AI scores 20.7 as the tenth-ranked category and receives zero allocation this week. Liquidity stress and broad market bear conditions, both live in the current macro regime, created a 30.0/100 category-level macro fit that acts as a structural veto regardless of how clean SMH's setup appears. The reasoned ETF proof order—SMH at 63.7, BOTZ at 40.0, AIQ at 30.5—shows top-tier technical evidence cannot overcome -12 points of liquidity penalty and -8 points of bear-market erosion. SMH's 13-week return of -10.0% and category-relative strength of 0.0% reflect an asset class caught between momentum technicals and fund outflows; capital will not rotate into AI until either liquidity conditions improve or these valuations reset further down.
Emerging Markets — INDA
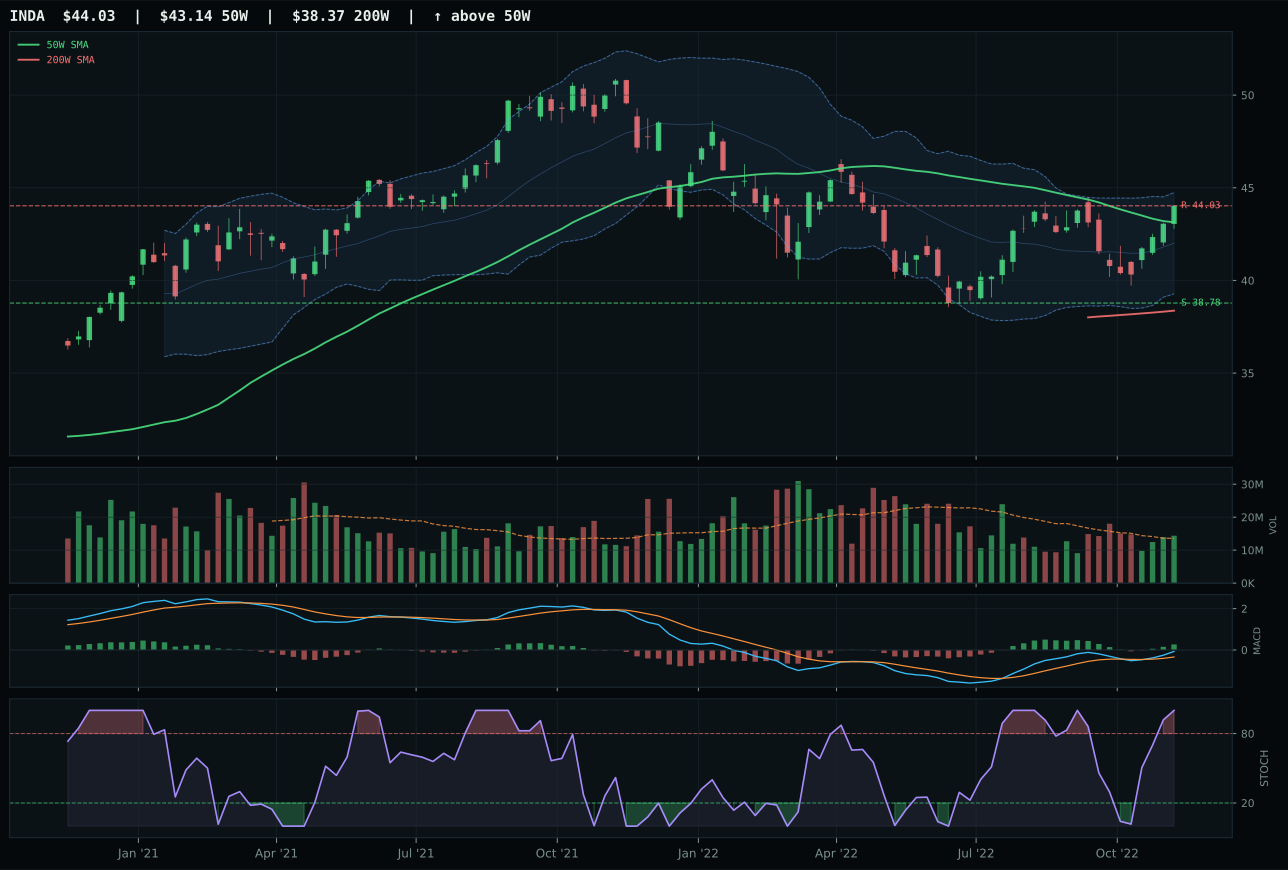
INDA has a compression near 50W profile with 7.4% 13-week relative strength versus SPY.
A failed hold above support would weaken the setup.
Actionable but governed by invalidation levels.
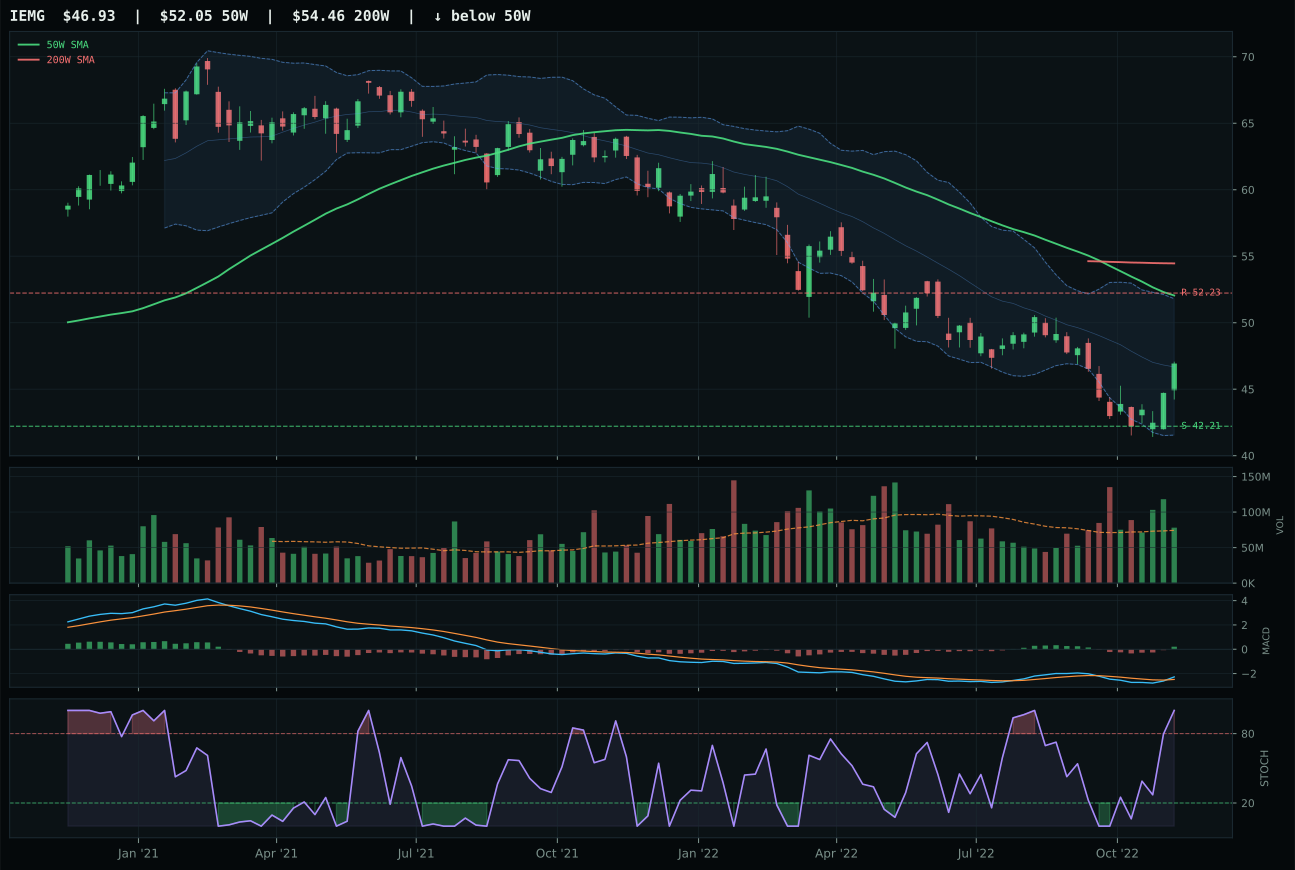
IEMG has a neutral structure profile with -0.2% 13-week relative strength versus SPY.
Extension and support failure are the main tactical risks.
Tracked, but not top-2 eligible because: structurally broken.
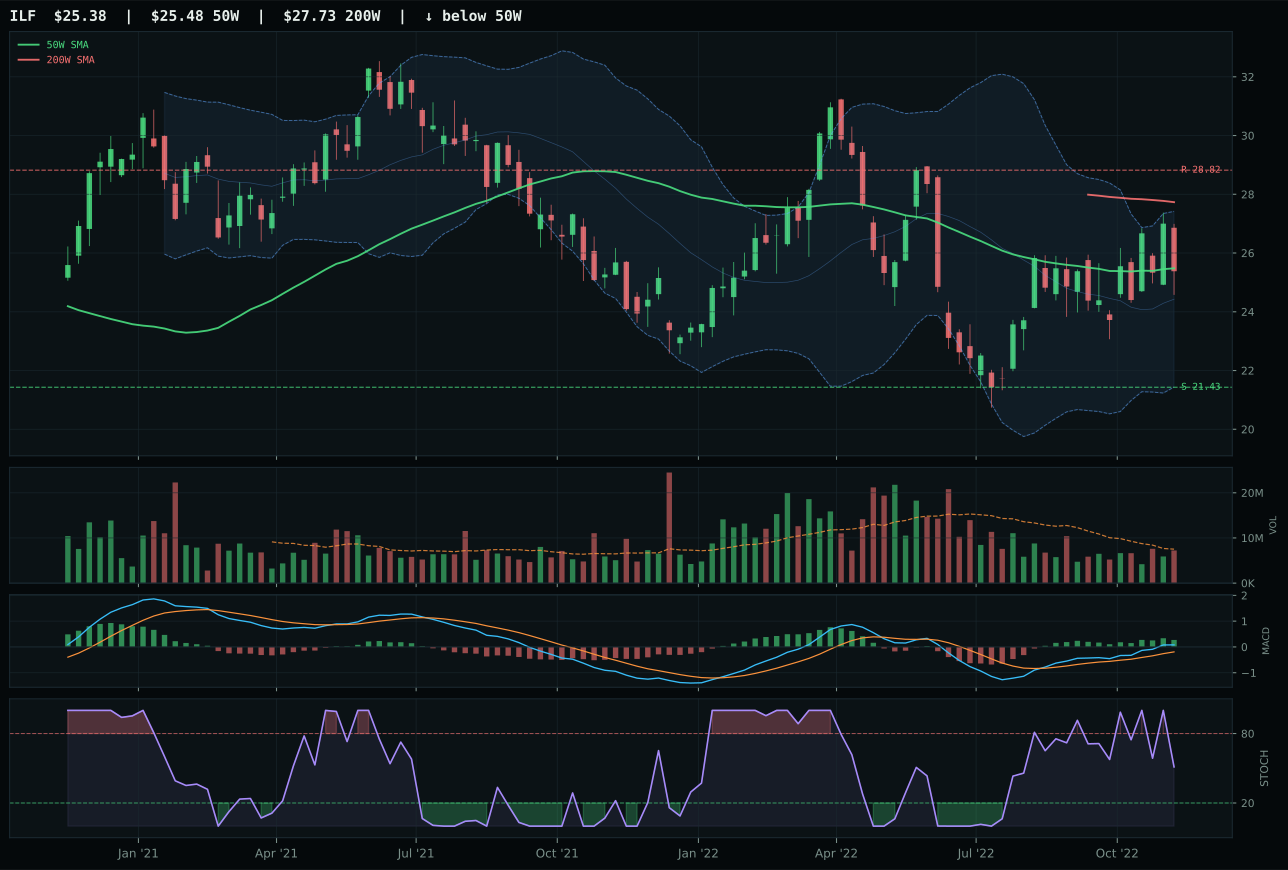
ILF has a compression near 50W profile with 5.0% 13-week relative strength versus SPY.
Extension and support failure are the main tactical risks.
Tracked, but not top-2 eligible because: structurally broken.
INDA claimed a dominant win with a 70.5-point gap over IEMG by pairing perfect trend execution with cleanest structural geometry in a macro-challenged category. INDA's 100.0 trend and timing scores reflect price above both major moving averages with a flat 50W slope (+7.4% relative strength) and compression near the 50W in a middle Fibonacci decision zone. Above all, INDA's 91.4 technical evidence crushes IEMG's 39.4 because the latter shows structurally broken setup (hard filters tripped), 13-week return of -6.9%, and -5.2% category-relative weakness on -0.2% SPY-relative return. INDA's 0.7% 13-week return is anemic in absolute terms, but it reflects a quality position that's held up during the broad emerging-market rout—India-focused exposure outperforms because domestic growth drivers insulate it from China deceleration and commodity-dependent weakness. The 95.6 momentum score on neutral volume shows that INDA is attracting selective capital from investors who have differentiated between India quality and broader emerging-market dysfunction.
Emerging Markets scores 13.2 as the ninth-ranked category and receives zero allocation. Liquidity stress active at -10 points and broad market bear at -9 points combine for -19 points of macro headwind, pushing category-level macro fit down to just 31.0/100. Even INDA's exceptional 91.4 technical evidence cannot overcome a regime that penalizes emerging-market exposure; the reasoned ETF proof order shows INDA at 75.2, but the category basket scores only 58.0, a figure that collapses to 13.2 after testing against leadership, volume-price sponsorship, persistence, and the active macro descriptor checklist. Late-Cycle Reflation with liquidity stress means capital flows toward domestic real assets and away from EM currency and geopolitical risk. INDA would need either regime stabilization or a major SPY outperformance reversal to earn allocation; until then, this category remains locked out.