
2022-11-04
Informational purposes only. The content in this report, including allocations, analysis, and commentary, is provided solely for informational and educational purposes. It does not constitute financial advice, investment advice, trading advice, or any other type of advice. Past performance does not guarantee future results. Always conduct your own research and consult a qualified financial professional before making investment decisions.
Macro risk engine requires the 50% Defensive overlay for this run; payload selected by cause: Inflation Scarcity.
Weekly Allocation
| Ticker | Category | Weight | Role |
|---|---|---|---|
| XLE | Traditional Energy | 60% | Overlay |
| REMX | Industrial Metals | 10% | Top-2 (10%) |
| MOO | Agriculture & Livestock | 5% | Tier-2 (5%) |
| ITA | Defense & Aerospace | 5% | Tier-2 (5%) |
| PAVE | Utilities & Infrastructure | 5% | Tier-2 (5%) |
| GLD | Precious Metals | 5% | Tier-2 (5%) |
| URA | Nuclear Energy | 5% | Tier-2 (5%) |
| ILF | Emerging Markets | 5% | Tier-2 (5%) |
Trade Instructions — Monday Open
Sell the tranche from 2022-10-07 (completing its 4-week hold). Buy the new tranche. Instructions show net portfolio changes — same-asset positions cancel, weight changes show the delta.
| Action | Ticker | Instruction |
|---|---|---|
| SELL | GLD | Sell 17% of GLD position (reduce 7.50% → 6.25%) |
| SELL | WEAT | Sell 50% of WEAT position (reduce 2.50% → 1.25%) |
| SELL | COPX | Sell 33% of COPX position (reduce 3.75% → 2.50%) |
| SELL | CIBR | Sell 50% of CIBR position (reduce 2.50% → 1.25%) |
| BUY | MOO | Buy MOO — 25.00% of freed cash (adds 1.25% to portfolio) |
| BUY | REMX | Buy REMX — 50.00% of freed cash (adds 2.50% to portfolio) |
| BUY | ILF | Buy ILF — 25.00% of freed cash (adds 1.25% to portfolio) |
Current Portfolio After Trade
Combined holdings across all 4 active tranches. Each tranche is 25% of the portfolio.
| Ticker | % of Portfolio | Weight Bar |
|---|---|---|
| XLE | 60.00% | |
| GLD | 6.25% | |
| ITA | 6.25% | |
| PAVE | 5.00% | |
| URNM | 3.75% | |
| MOO | 3.75% | |
| COPX | 2.50% | |
| PICK | 2.50% | |
| REMX | 2.50% | |
| WEAT | 1.25% | |
| CIBR | 1.25% | |
| INDA | 1.25% | |
| XLK | 1.25% | |
| URA | 1.25% | |
| ILF | 1.25% |
Macro Regime — Late-Cycle Reflation
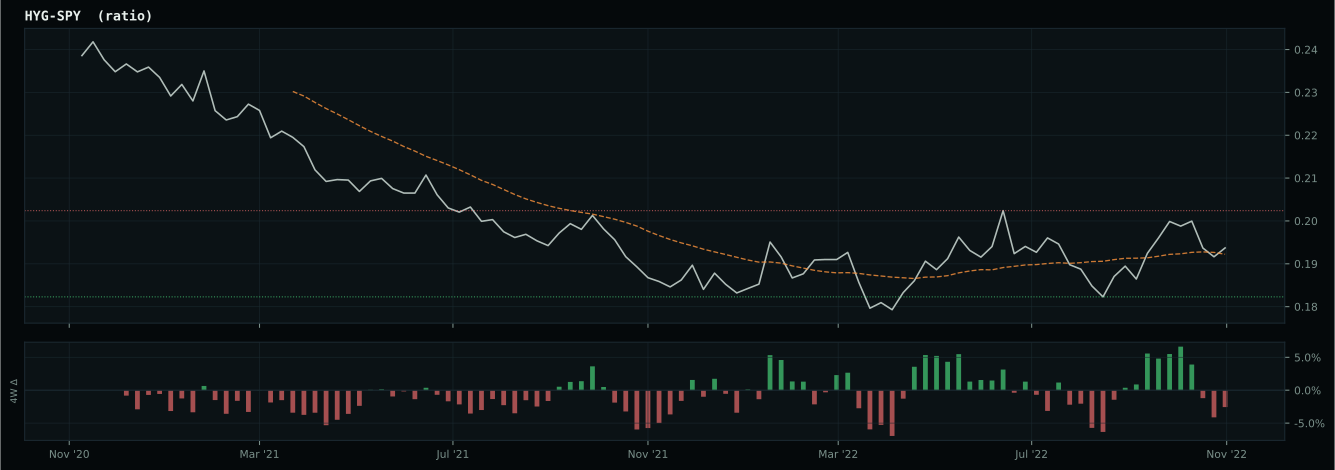
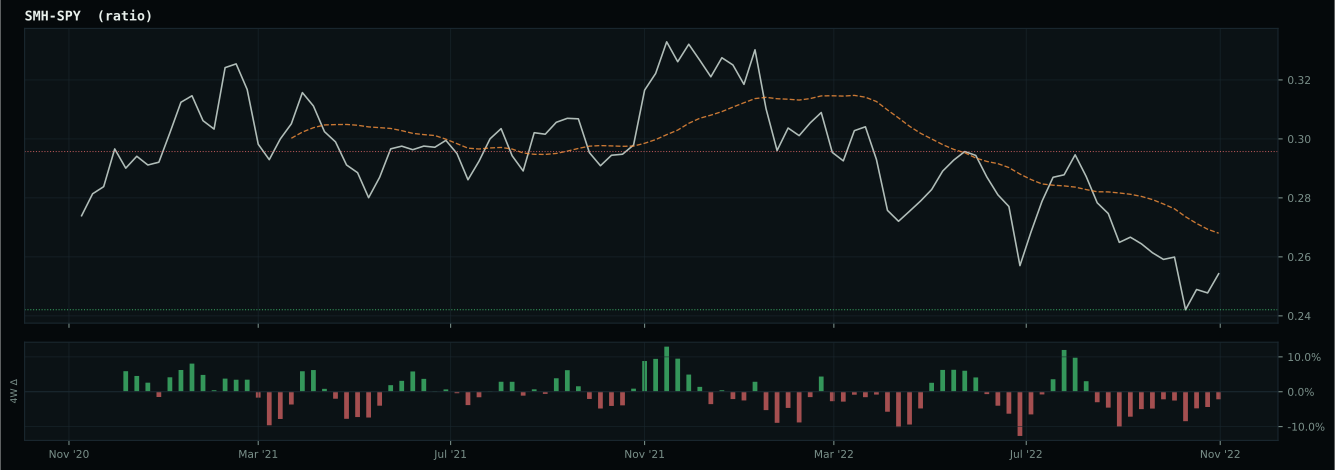
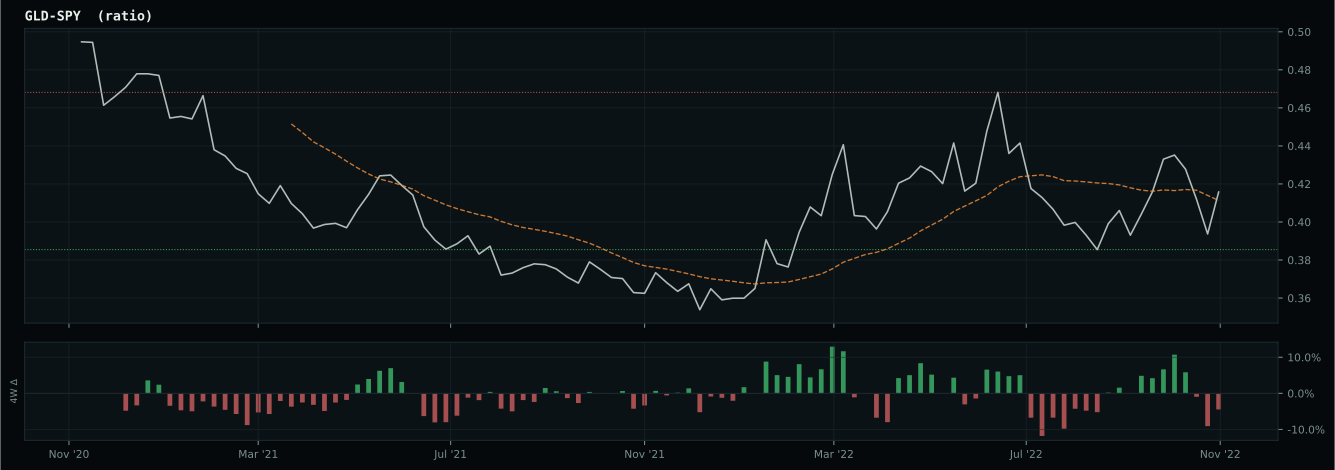
growth data is not confirming the weak market-implied risk appetite signal
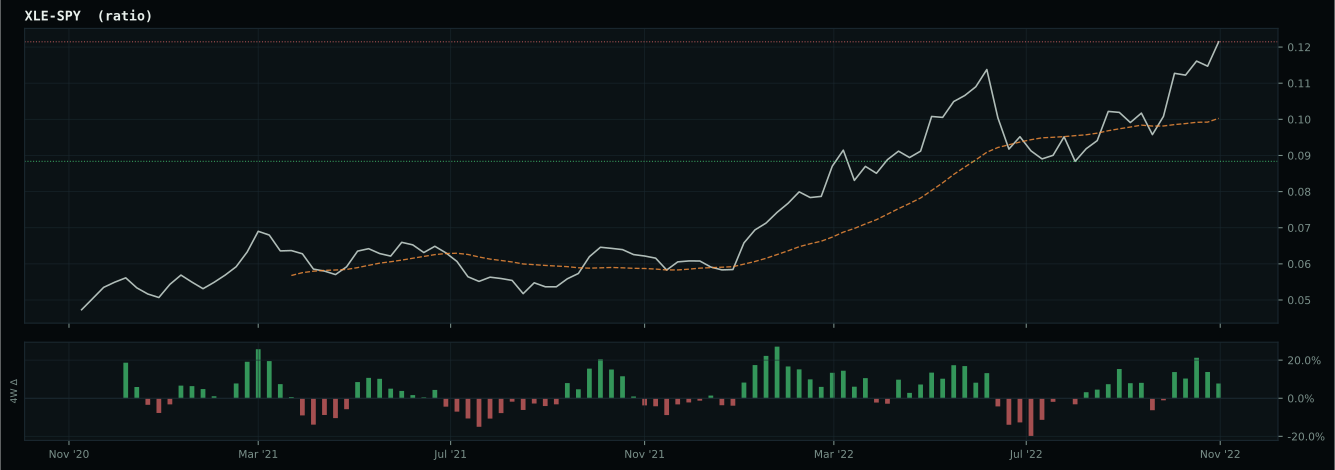
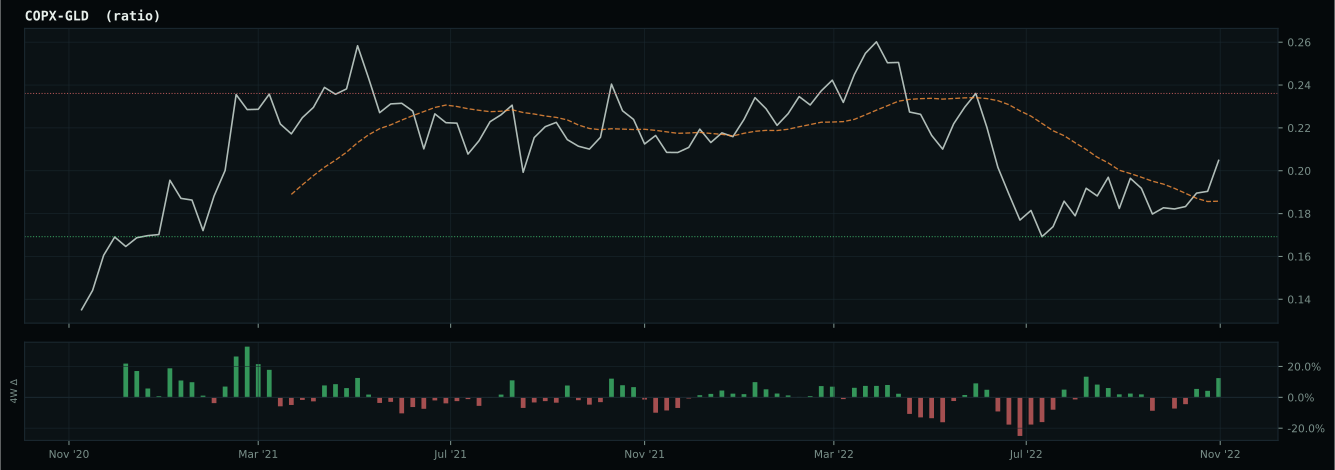
Defensive overlay cause is inflation/scarcity: energy, commodity breadth, or oil-versus-gold confirmation is stronger than the broad equity tape, so the sleeve owns the inflation pressure. XLE has been confirmed above its 8W SMA and is eligible.
Macro Evidence Charts
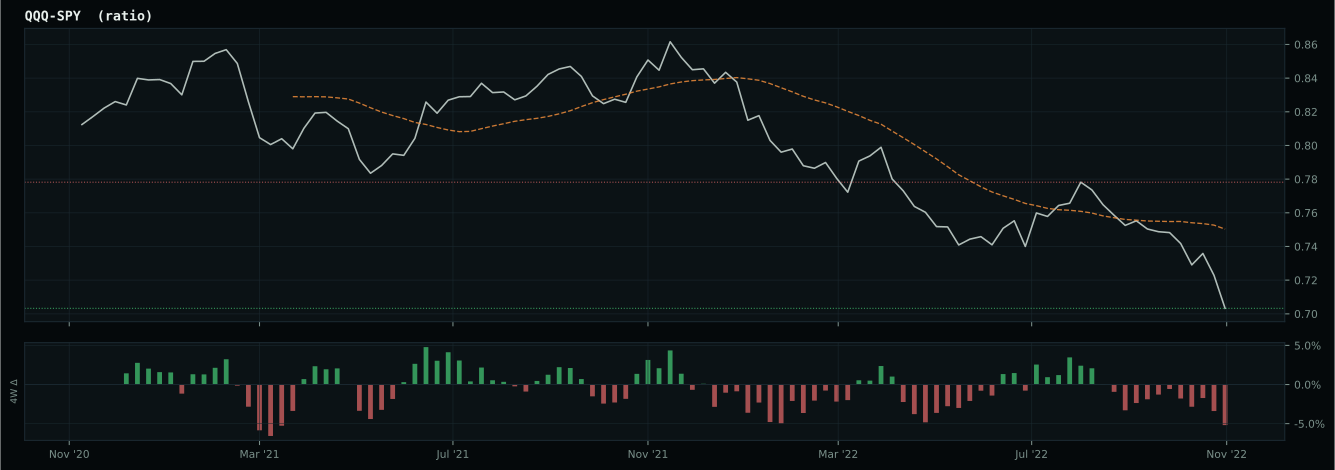
Market-implied signals behind the macro regime scores. Each ratio compares two assets; the direction and slope of the ratio is what the macro engine reads.
Crypto Regime — NoCrypto
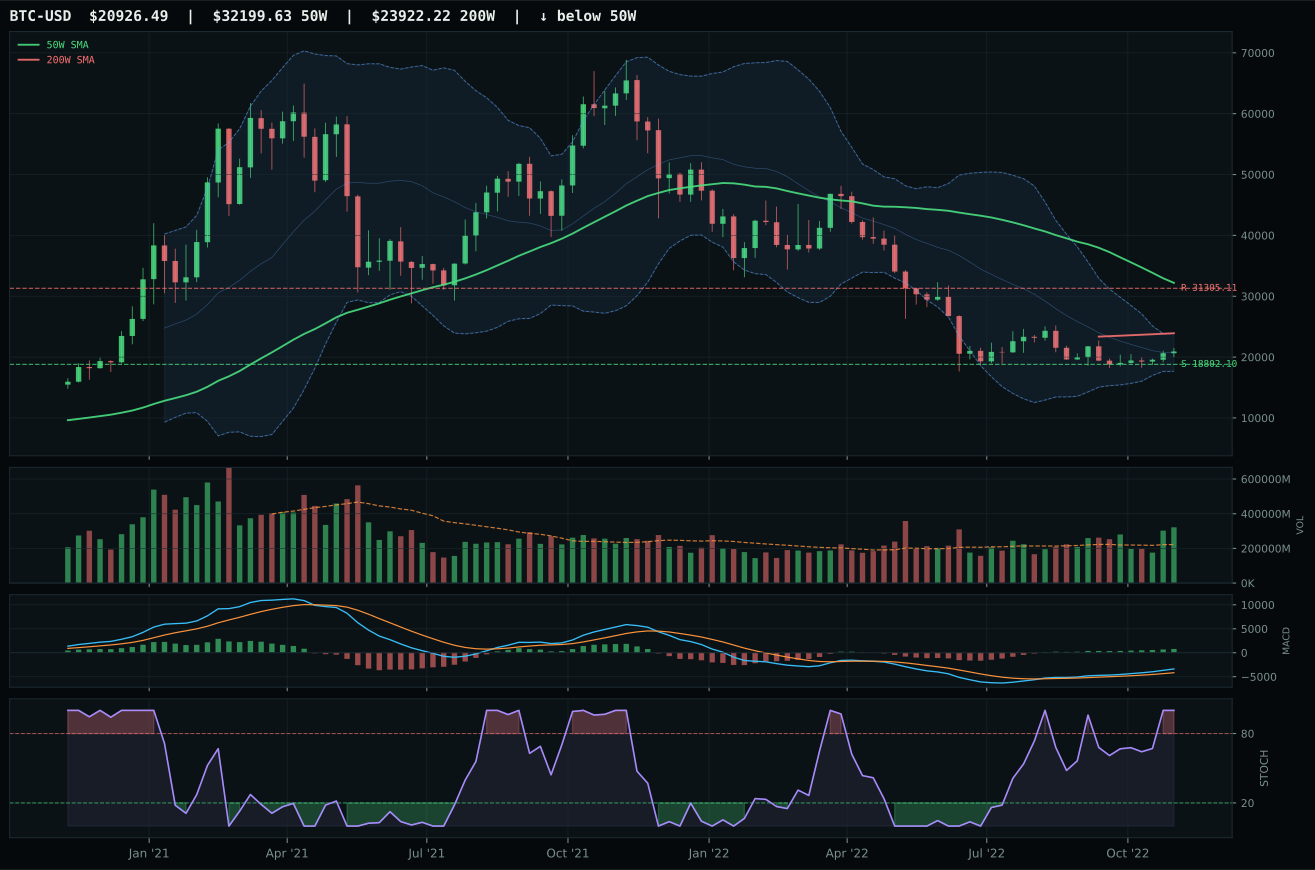
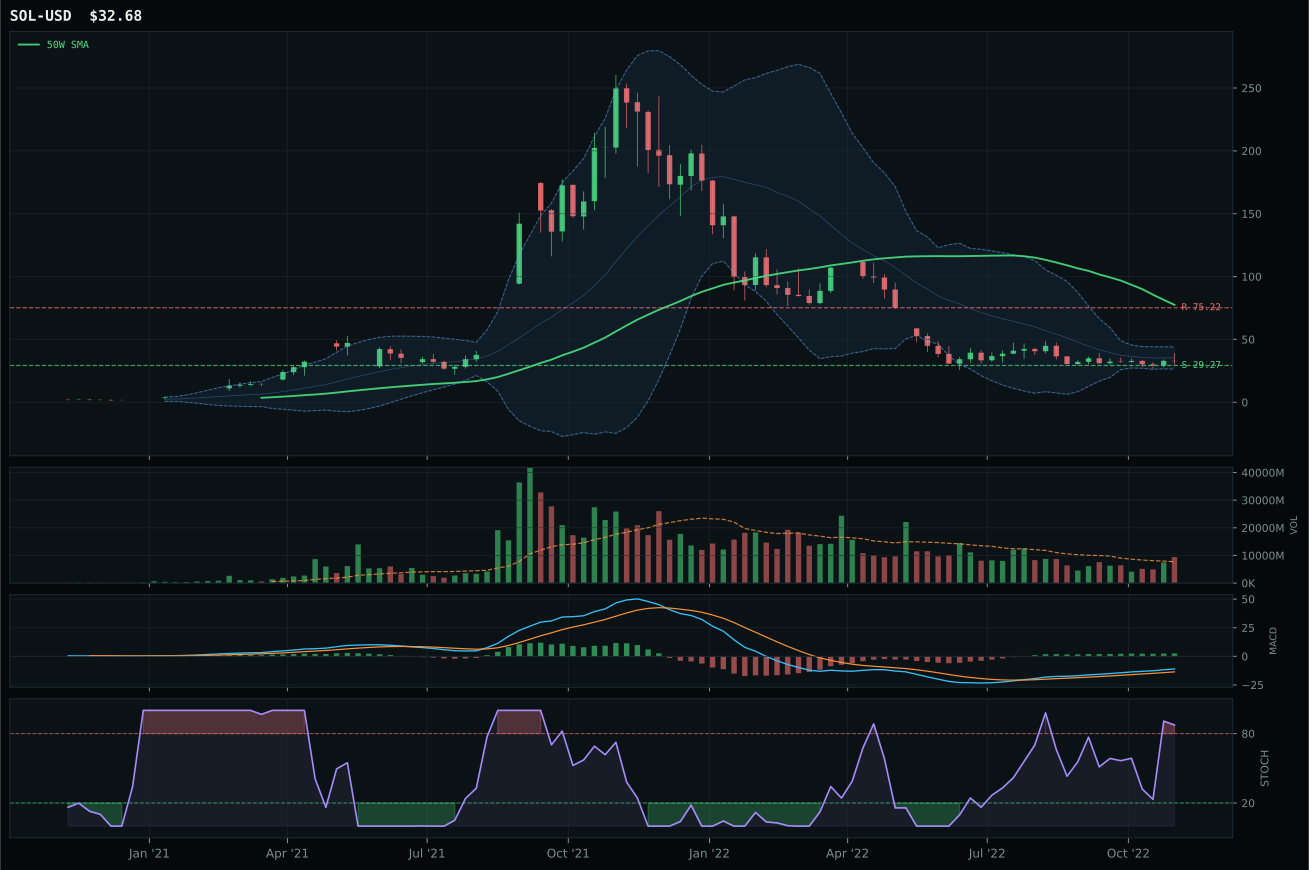
ValueBTC armed; waiting for 50W reclaim, decisive close above post-touch range resistance by 3%, close above 200W
TrendBTC not confirmed
one or more available conditions failed
Category Rankings
| Rank | Category | Winner | Score | Alloc | 4W Ret | Peers (4W) |
|---|---|---|---|---|---|---|
| 1 | Traditional Energy | XLE | 82.0 | 20% | -0.45% | FCG -4.2% · XOP -5.1% |
| 2 | Industrial Metals | REMX | 72.1 | 20% | +1.60% | COPX +15.3% · PICK +14.0% |
| 3 | Agriculture & Livestock | MOO | 64.6 | 10% | +4.80% | VEGI +3.8% · WEAT -11.0% |
| 4 | Defense & Aerospace | ITA | 48.7 | 10% | +5.46% | XAR +5.9% · ROKT +3.6% |
| 5 | Utilities & Infrastructure | PAVE | 48.1 | 10% | +7.17% | IGF +6.6% · XLU +5.3% |
| 6 | Precious Metals | GLD | 45.9 | 10% | +6.61% | SLV +8.8% · GDX +18.0% |
| 7 | Nuclear Energy | URA | 45.8 | 10% | +1.91% | URNM -1.5% · NLR +4.1% |
| 8 | Emerging Markets | ILF | 40.8 | 10% | -4.62% | INDA +1.2% · IEMG +8.3% |
| 9 | Technology | XLK | 24.6 | 0% | +10.83% | CIBR +8.2% · IGV +11.1% |
| 10 | AI | SMH | 9.3 | 0% | +15.79% | AIQ +12.9% · BOTZ +10.1% |
Traditional Energy — XLE
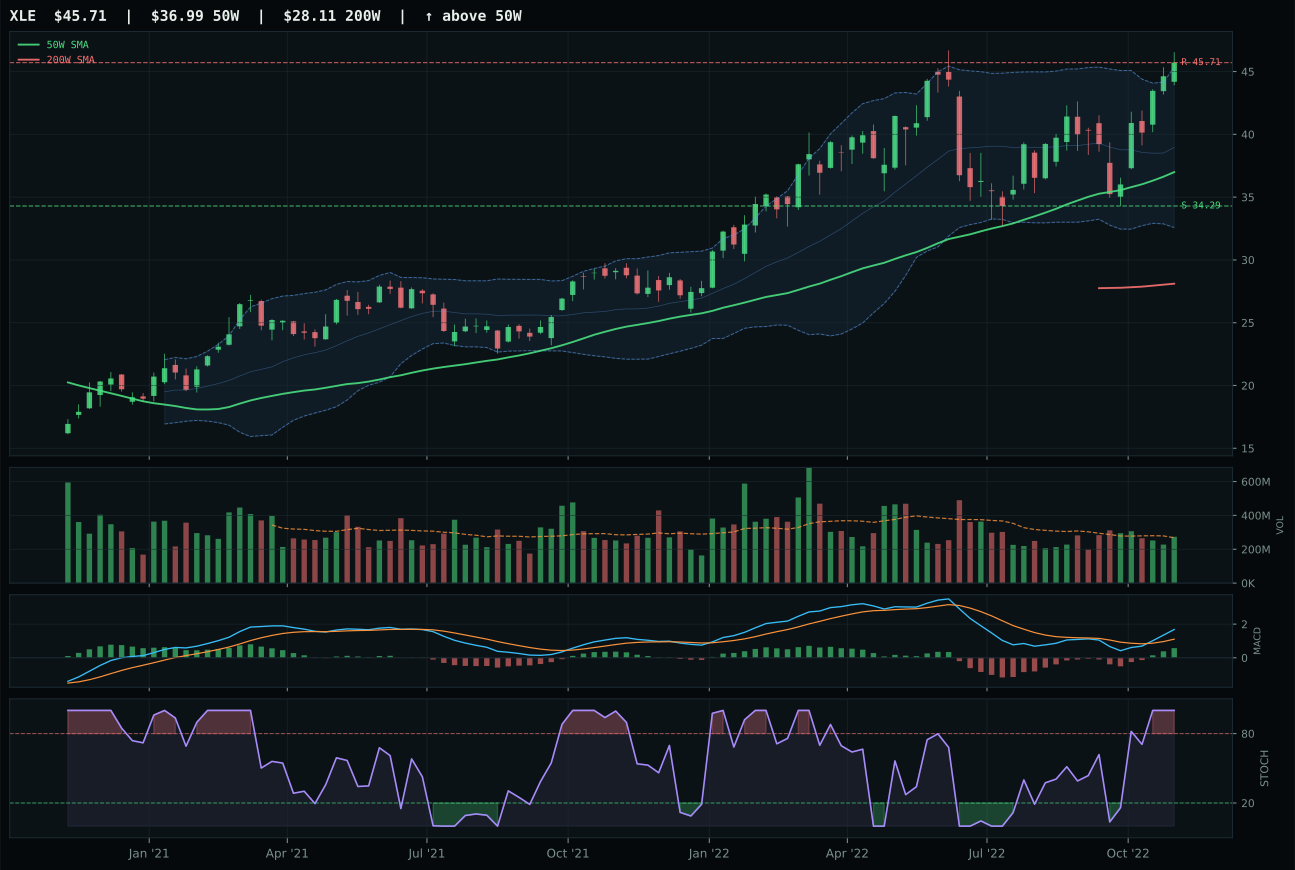
XLE has a vertical extension profile with 34.1% 13-week relative strength versus SPY.
A failed hold above support would weaken the setup.
Actionable but governed by invalidation levels.
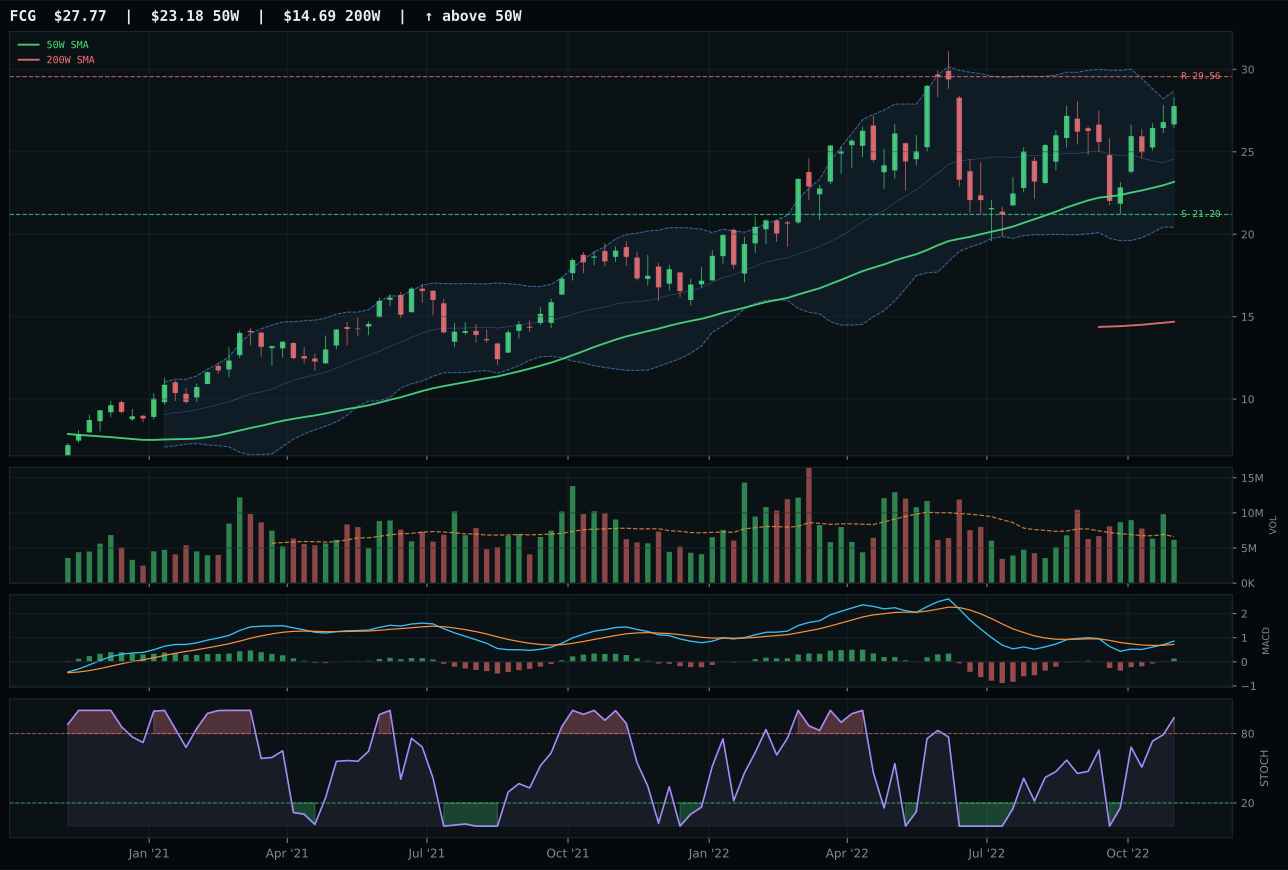
FCG has a vertical extension profile with 28.7% 13-week relative strength versus SPY.
A failed hold above support would weaken the setup.
Actionable but governed by invalidation levels.
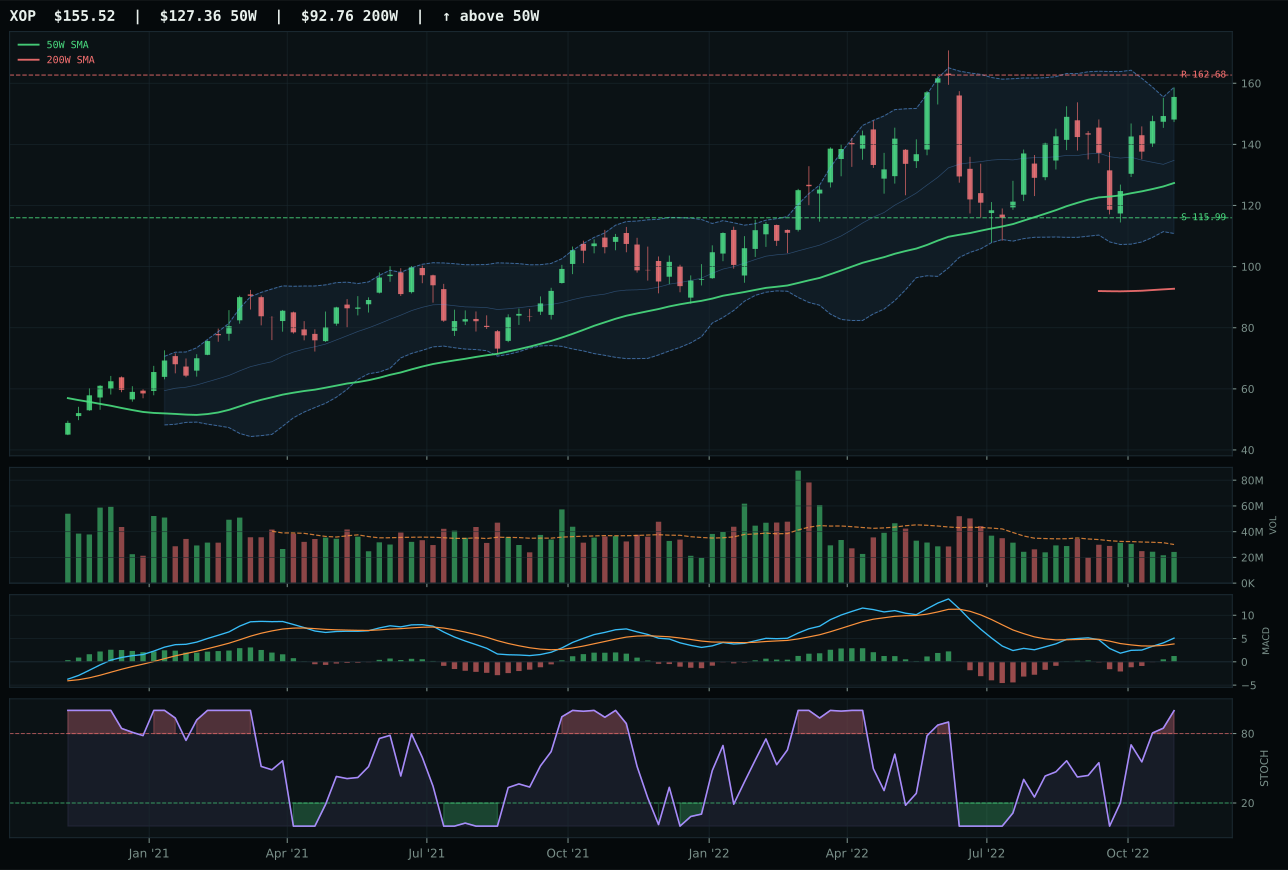
XOP has a vertical extension profile with 29.5% 13-week relative strength versus SPY.
A failed hold above support would weaken the setup.
Actionable but governed by invalidation levels.
XLE wins Traditional Energy with a razor-thin 0.3-point gap over FCG, earning top-2 status (10% allocation) as the category's clearest leadership. Price is 23.6% extended above the 50W in the near-52W high / extension zone, with MACD bullish and improving and stochastic RSI overbought at 1.00. Entry risk is maximal at this distance, yet the 13W return of 25.1% and 34.1% SPY-relative strength define the move as institutional. Risk/reward is compressed (41.3) with upside to resistance at 0%, but volume-price confirmation (75.3/100) and persistence (80.6/100) indicate accumulation is continuing even at extension. FCG's timing is weaker (45.0 vs 37.0 distance penalty), and its category-relative strength trails at -0.8% vs 4.6%; XLE's category leadership in RS is the tiebreaker.
Traditional Energy earns 10% allocation as the top-2 highest-scoring category at 82.0, alongside Industrial Metals at 72.1. Energy's macro fit is the portfolio's strongest at 88.0/100, driven by late-cycle reflation (+12), energy scarcity (+16), inflation pressure (+10), real asset sponsorship (+7), offset only by liquidity stress (-7). This is unambiguous commodity bull support. Yet the allocation is not 20% because XLE's timing score of 37.0 reflects severe entry risk—price is 23.6% above the 50W, near resistance, and every new buyer paid near peak. The risk/reward of 41.3 provides zero upside from current resistance levels and 33.3% downside to support at 34.29. Late-Cycle Reflation and energy scarcity remain intact, but the technical setup now requires vindication: if XLE holds support on pullback with volume, the thesis remains intact for 10%; if 50W breaks with accelerating volume, the category may drop to tier-2. This is a position held for macro conviction, not entry aesthetics.
Industrial Metals — REMX
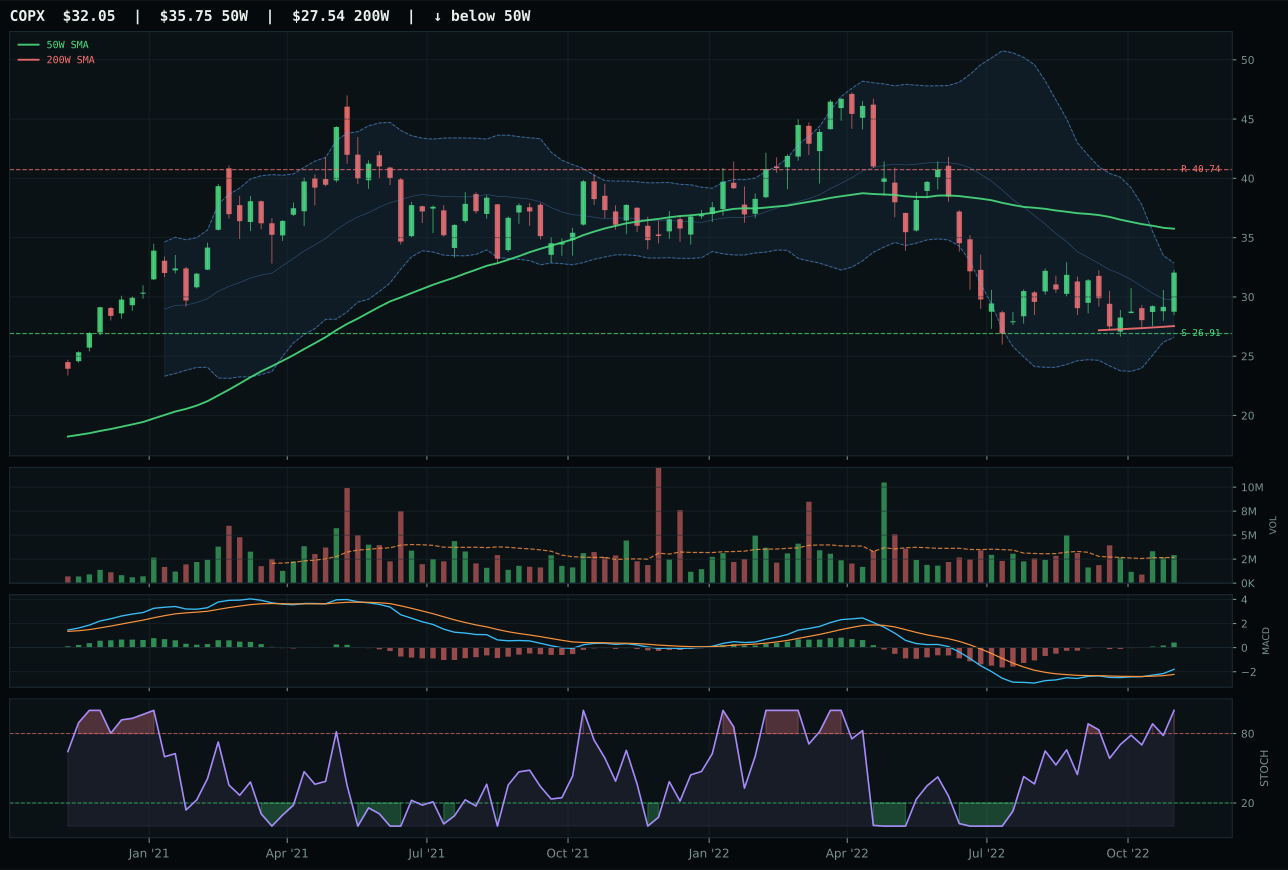
COPX has a neutral structure profile with 17.3% 13-week relative strength versus SPY.
A failed hold above support would weaken the setup.
Actionable but governed by invalidation levels.
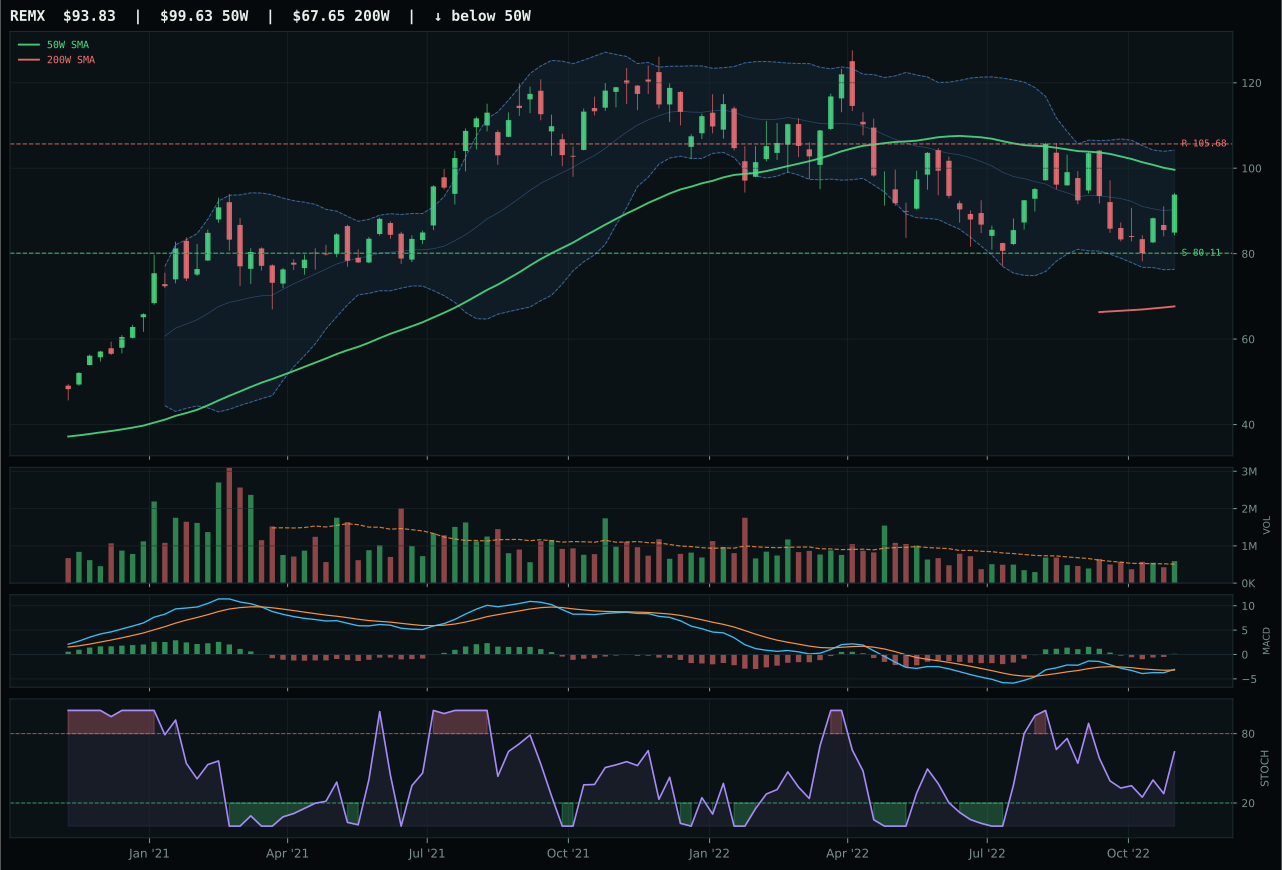
REMX has a neutral structure profile with 7.6% 13-week relative strength versus SPY.
A failed hold above support would weaken the setup.
Actionable but governed by invalidation levels.
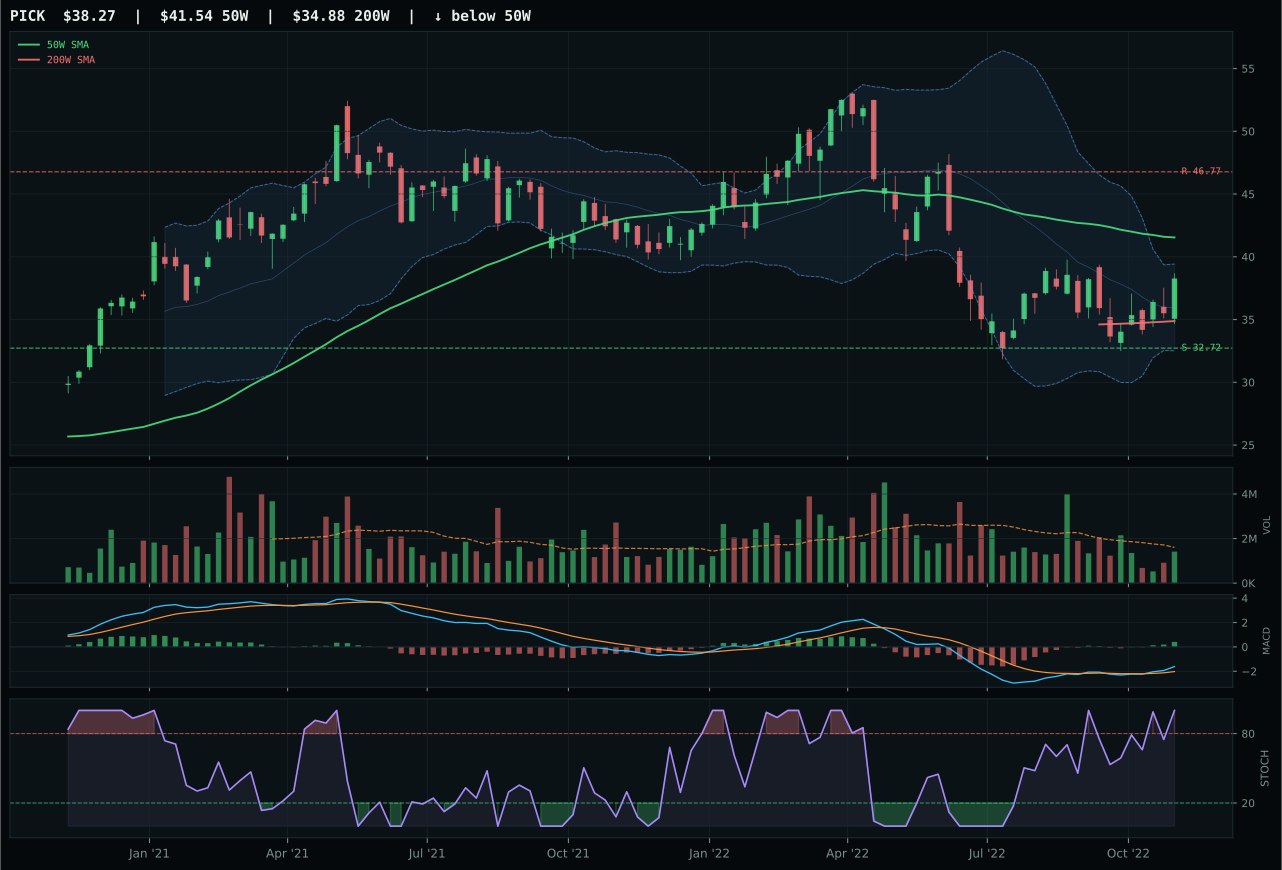
PICK has a neutral structure profile with 13.2% 13-week relative strength versus SPY.
A failed hold above support would weaken the setup.
Actionable but governed by invalidation levels.
REMX wins Industrial Metals and earns top-2 status (10% allocation) despite trailing COPX and PICK in the 3/2/1 reasoned proof order (60.5 vs 73.4 and 73.3). The category reasoner elevated REMX as the representative because its timing (90.0) and volume confirmation (57.1/100) exceed COPX's, and its risk/reward (49.8) beats PICK's deteriorated entry. Price sits -5.8% from the 50W in the Fib 0.618 deep retracement zone with MACD bullish and improving and stochastic RSI rising mid-zone at 0.64—this is early recovery energy with room to run. COPX's 17.3% SPY-relative strength and 8.4% 13W return are superior, but its overbought stochastic at 1.00 and timing of 62.0 signal stretched entry risk. Four-week momentum of 11.8% for REMX confirms fresh accumulation; above-average volume at 1.16x provides sponsorship that COPX's neutral volume lacks.
Industrial Metals earns 10% allocation as a top-2 overweight, claiming the second slot alongside Traditional Energy. The category score of 72.1 reflects the strongest category-level macro fit in the portfolio except Energy: metals scarcity is active at +14, late-cycle reflation helps at +10, real asset sponsorship at +6, offsetting liquidity stress at -8 and dollar pressure at -7, totaling 65.0/100. This dual bid from supply-side scarcity (metals) and demand-side reflation (late-cycle capex) justifies top-2 allocation. REMX's assignment despite trailing COPX and PICK in technical evidence reflects the system's weighting toward timing and volume confirmation over absolute momentum—a prudent trade-off when entry risk (stochastic overbought in COPX/PICK) threatens the persistence of the move. The 10% allocation assumes REMX holds support at 80.11; if that level breaks with volume, the category's macro support remains intact but the representative should rotate to PICK or COPX on mean-reversion.
Agriculture & Livestock — MOO
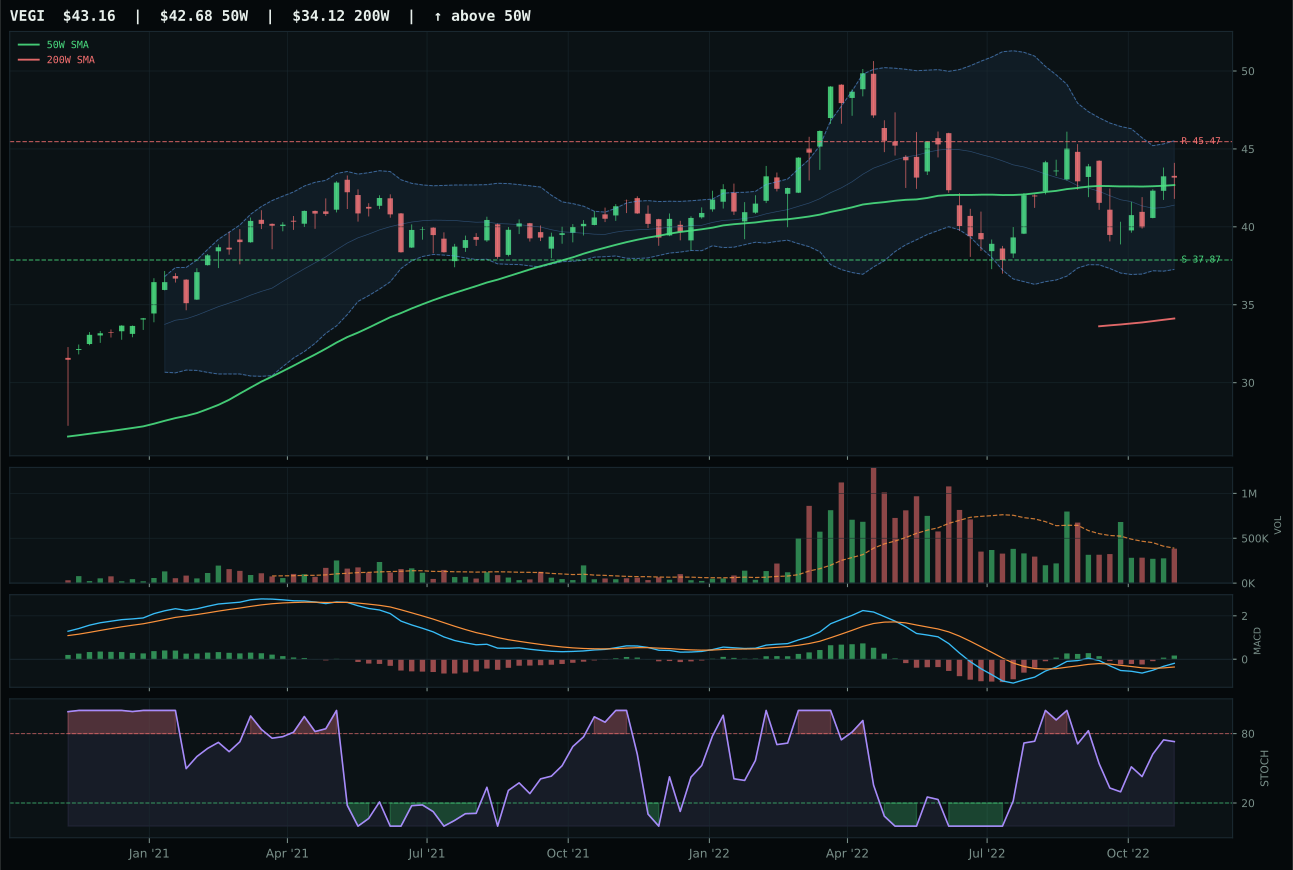
VEGI has a compression near 50W profile with 11.9% 13-week relative strength versus SPY.
A failed hold above support would weaken the setup.
Actionable but governed by invalidation levels.
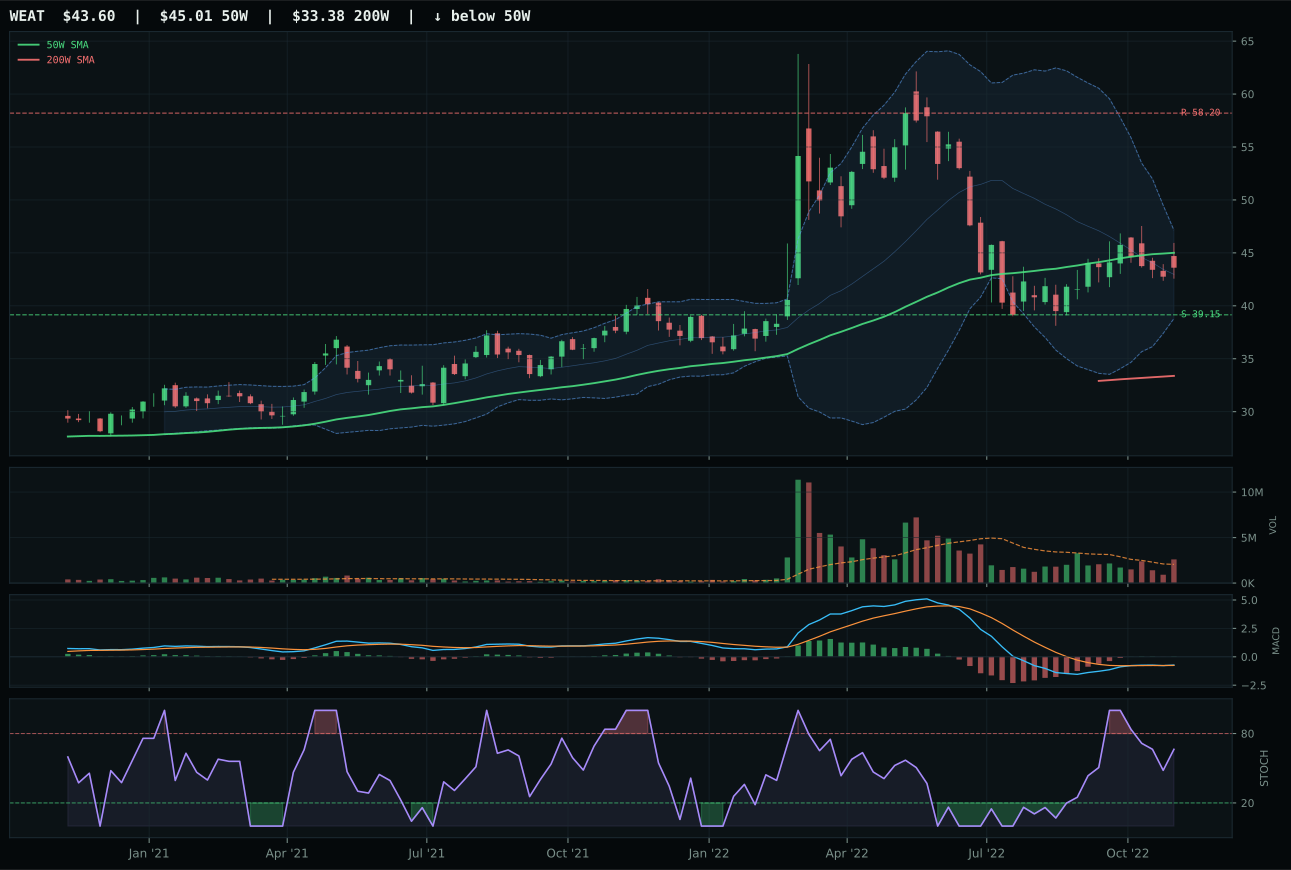
WEAT has a neutral structure profile with 15.8% 13-week relative strength versus SPY.
A failed hold above support would weaken the setup.
Actionable but governed by invalidation levels.
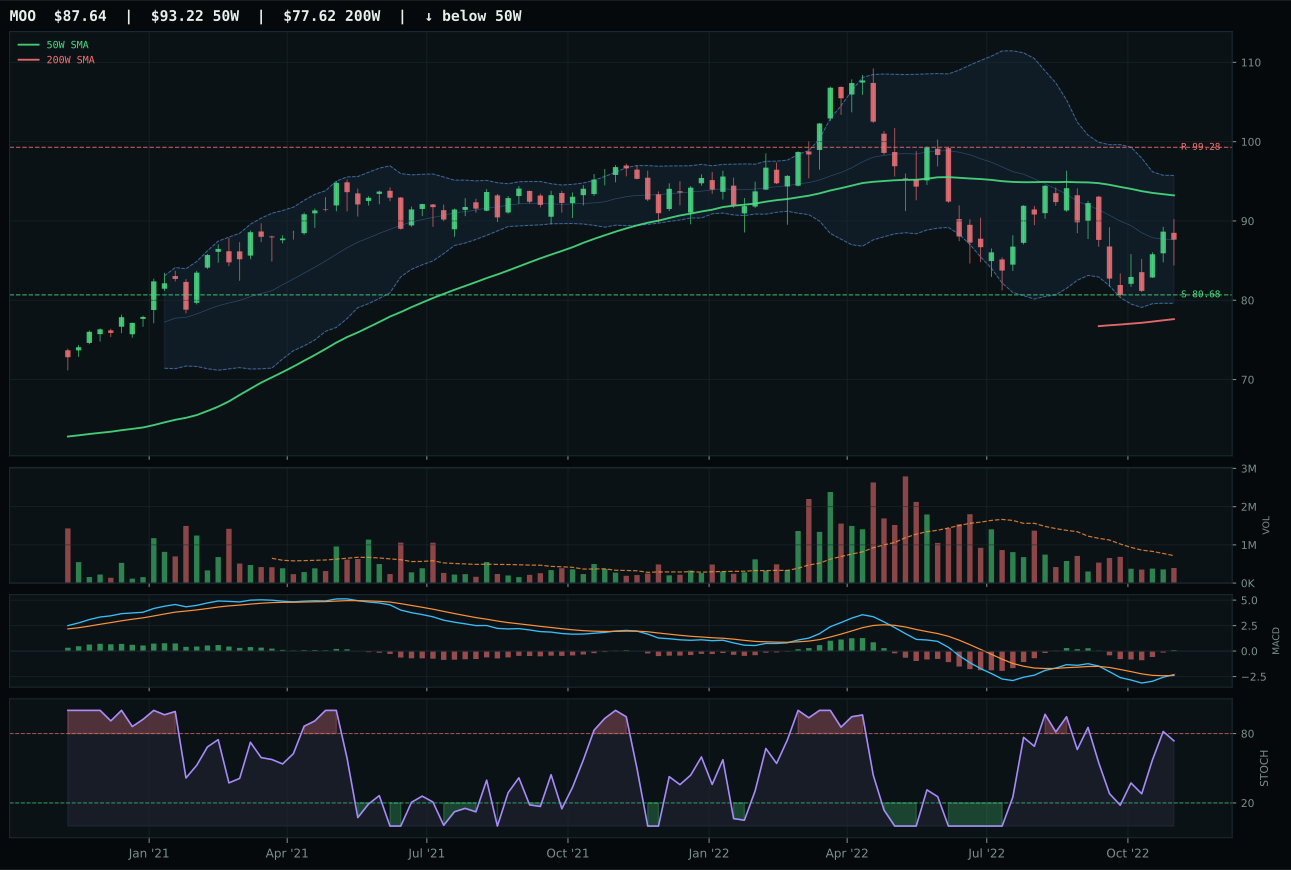
MOO has a neutral structure profile with 5.5% 13-week relative strength versus SPY.
A failed hold above support would weaken the setup.
Actionable but governed by invalidation levels.
MOO wins despite finishing 31.9 points below runner-up VEGI, claiming the category through superior risk/reward geometry (77.5 vs 59.5) and deeper retracement value (Fib 0.786 vs 0.500). Price sits -6.0% from the 50W in the value zone, with MACD bullish and improving and stochastic RSI rising mid-zone at 0.74. The critical edge: MOO is positioned at support with 8.6% downside to hold and 11.7% upside to resistance—a 2:1 asymmetry. VEGI, by contrast, compressed near the 50W (1.1% from trend) and already rallied 2.9% in 13W; it is overextended for new buyers. Volume participation is thin at 0.55x for MOO, yet that low volume signature combined with improved technicals suggests accumulation rather than distribution. VEGI's stronger absolute momentum (11.9% RS vs SPY) and cleaner trend (100/100) are offset by entry risk and deteriorating risk/reward.
Agriculture & Livestock earns 5% allocation as a tier-2 position. The category score of 64.6 reflects the strongest macro backdrop in the portfolio: late-cycle reflation helps at +8, inflation pressure active at +10, and real asset sponsorship at +8, totaling category macro fit of 72.0/100. This rivals Energy macro support. Yet Agriculture ranks below Industrial Metals (72.1) and Energy (82.0) because its representative, MOO, carries weaker technical evidence (45.1/100) than REMX (62.6/100) or XLE (79.1/100). The 3/2/1 basket started at 76.5 but tested down to 64.6 after accounting for volume-price persistence and risk/reward limitations. MOO's thin volume at 0.55x is a concern; if volume does not expand on the next test of support at 80.68, the setup risks reversal. Hold at 5% with the understanding that if VEGI breaks above the 50W with volume, a rotation from MOO to VEGI may be warranted.
Defense & Aerospace — ITA
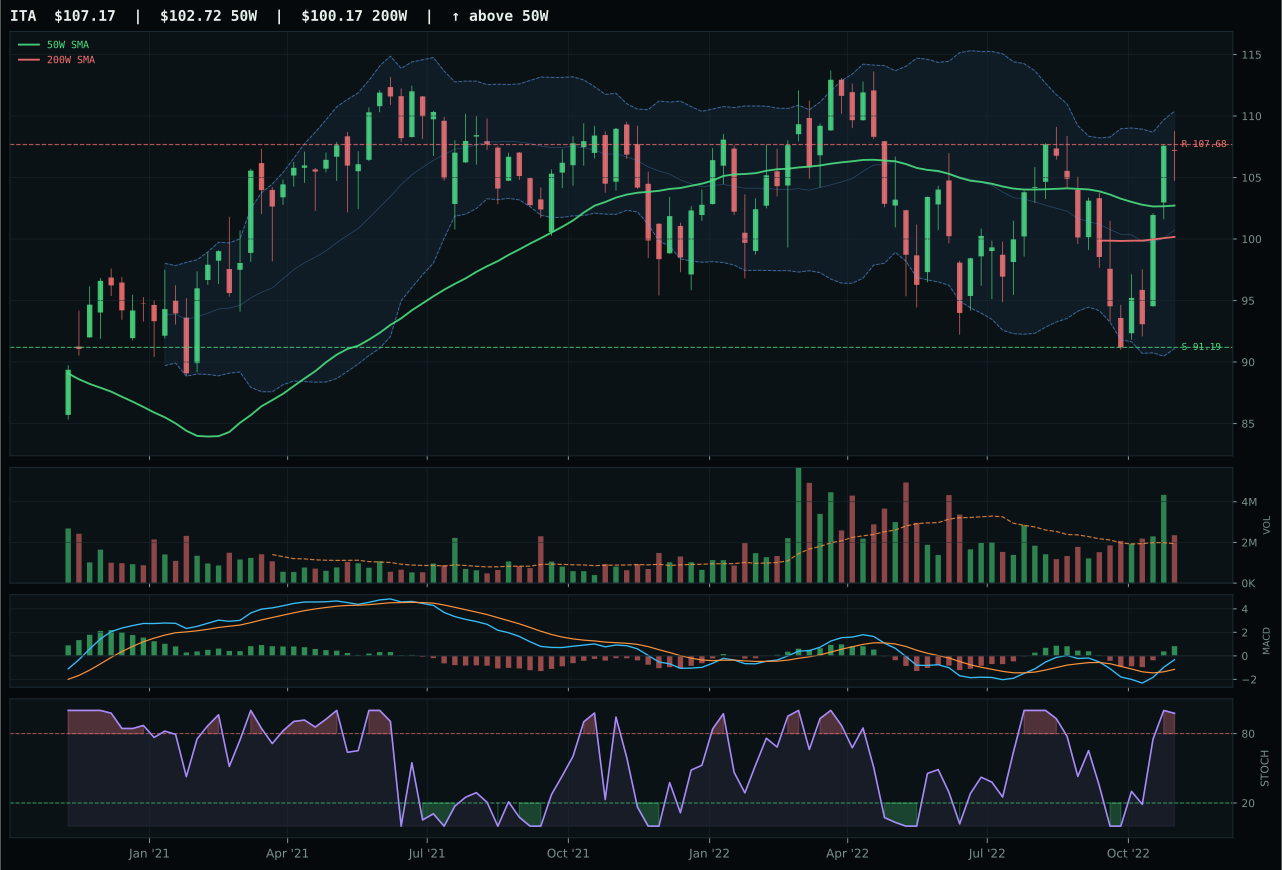
ITA has a neutral structure profile with 11.8% 13-week relative strength versus SPY.
A failed hold above support would weaken the setup.
Actionable but governed by invalidation levels.
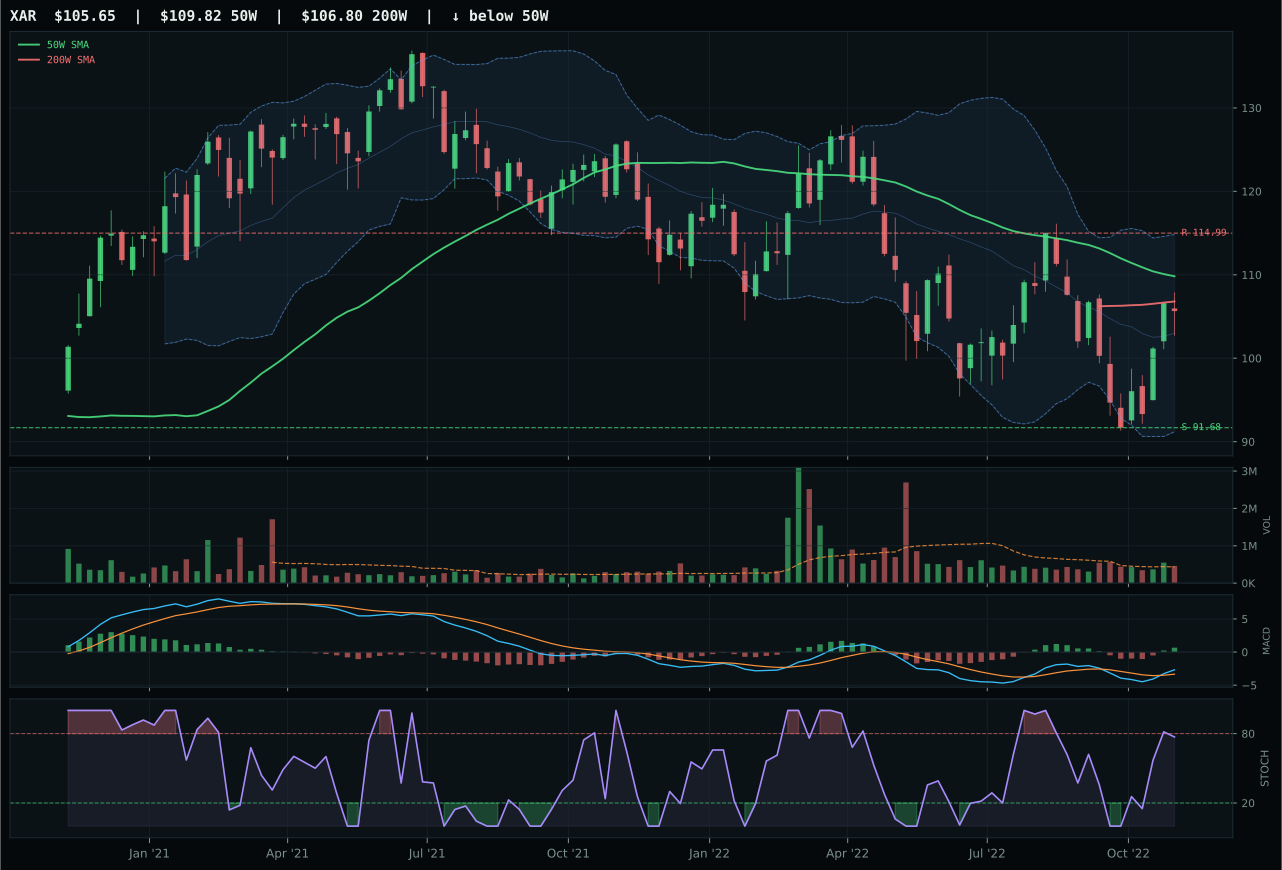
XAR has a neutral structure profile with 6.2% 13-week relative strength versus SPY.
A failed hold above support would weaken the setup.
Actionable but governed by invalidation levels.
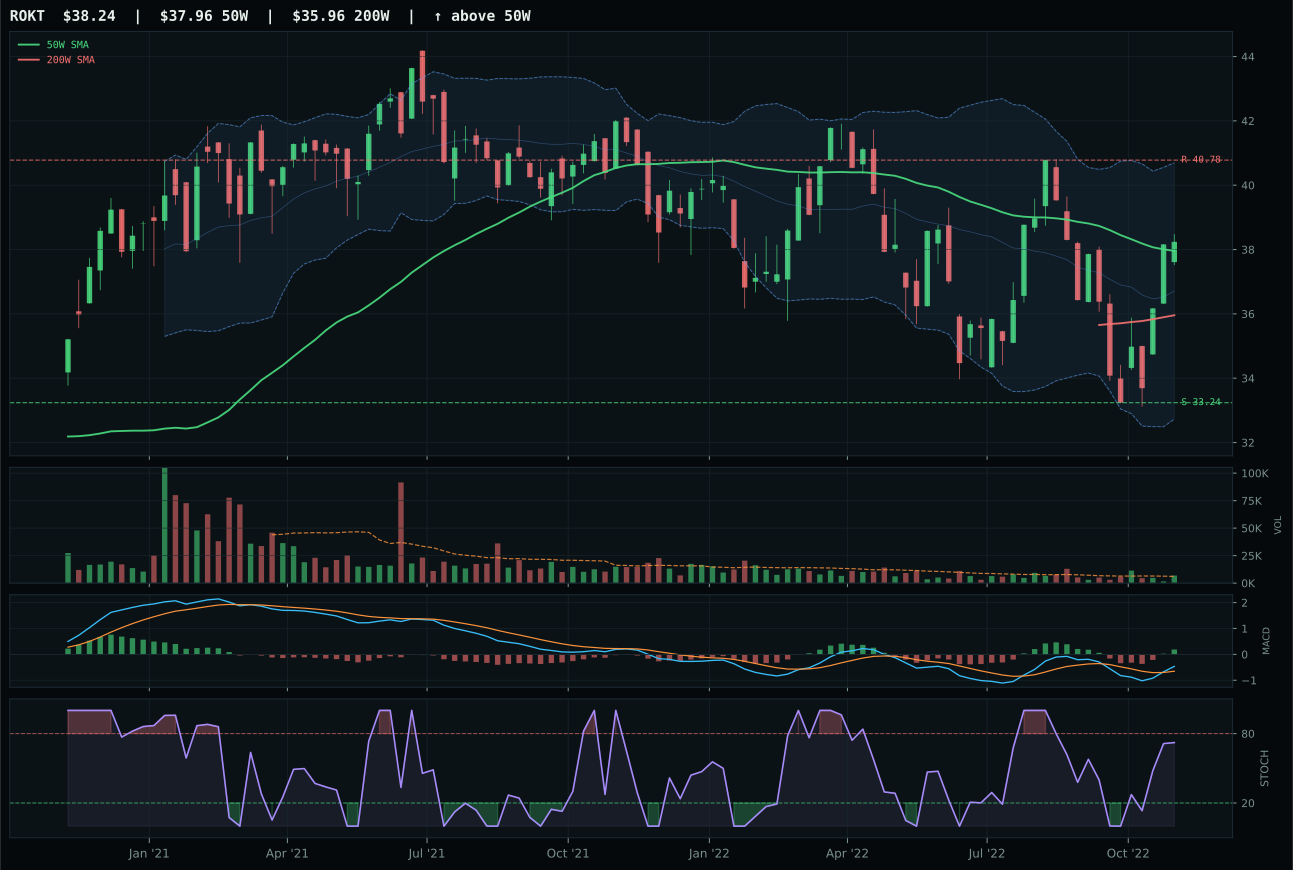
ROKT has a compression near 50W profile with 7.1% 13-week relative strength versus SPY.
A failed hold above support would weaken the setup.
Tracked, but not top-2 eligible because: .
ITA dominates Defense & Aerospace with a 23.5-point gap over runner-up XAR, claiming the category through pristine trend and momentum confirmation. Price sits 4.3% above the 50W with a flat 50W slope (0.1%), MACD bullish and improving, and stochastic RSI overbought at 0.98—this is not a recovery play but an active breakout being defended by above-average volume at 1.22x. The 13W return of 2.8% and 11.8% SPY-relative strength mark the only category leaders posting positive risk appetite. Four-week momentum of 12.6% and category-relative strength of 4.7% confirm fresh accumulation. XAR's neutral structure and weak volume (neutral vs participation) signal hesitation; ITA's compression at 76.1 and upper-retracement Fib location show the crowd is organized and willing.
Defense & Aerospace earns 5% allocation as a tier-2 holding. The category score of 48.7 reflects supportive macro conditions: late-cycle reflation helps at +6, defensive rotation active at +8, and broad market bear at +6, yielding category-level macro fit of 70.0/100. This is the second-strongest macro environment across all ten categories. Yet the allocation remains tier-2 (5%) rather than top-2 (10%) because two higher-scoring categories ranked above it—Industrial Metals at 72.1 and Traditional Energy at 82.0, both driven by commodity scarcity and real asset bid. ITA's risk/reward of 45.5 reflects that upside to resistance is nearly exhausted at only -0.5%, meaning new buyers face asymmetric downside. The category holds because defensive rotation is genuine, but its limitation is entry risk; ITA already rallied 2.8% in 13W and sits near resistance. Watch for a test of support at 91.19 to improve the risk/reward to 5% maintenance threshold.
Utilities & Infrastructure — PAVE
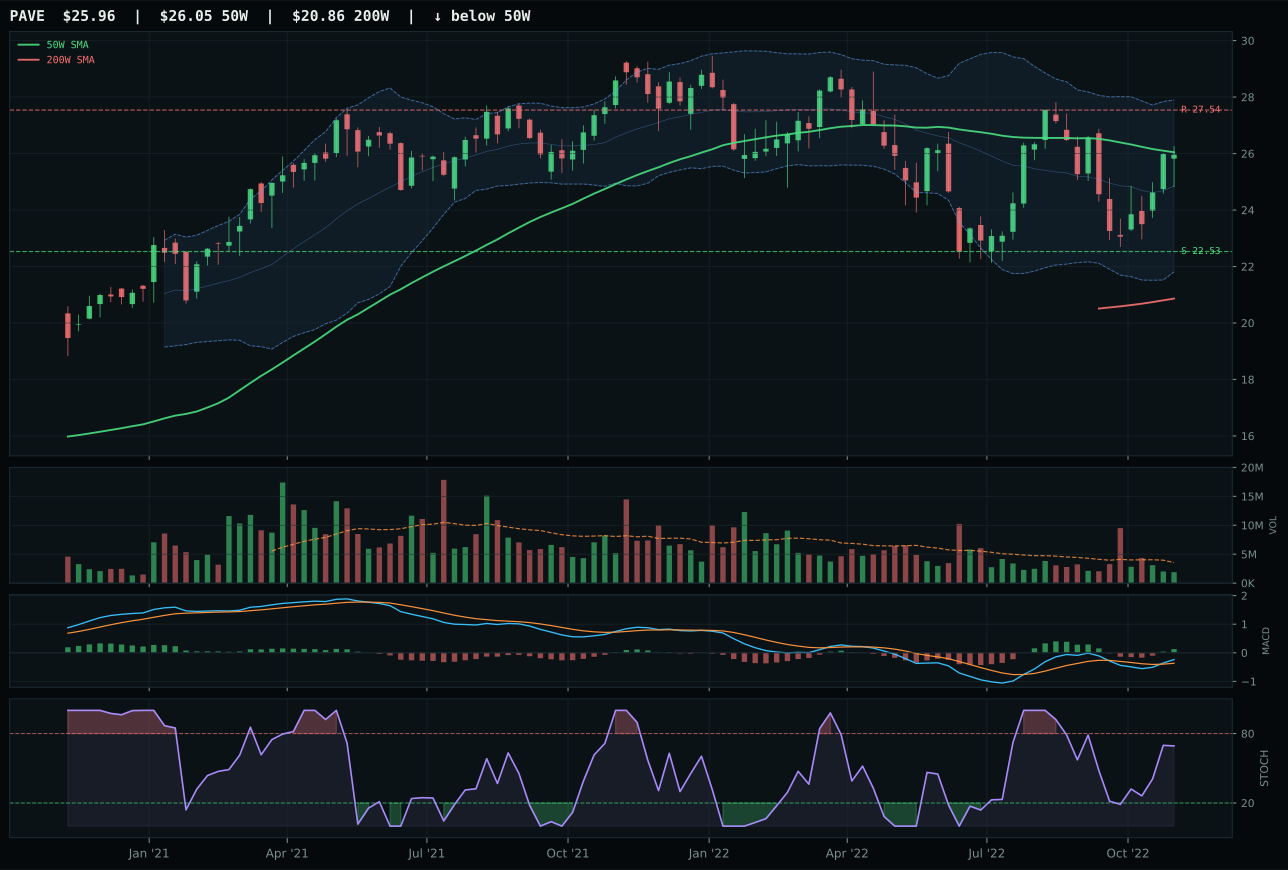
PAVE has a compression near 50W profile with 7.6% 13-week relative strength versus SPY.
A failed hold above support would weaken the setup.
Actionable but governed by invalidation levels.
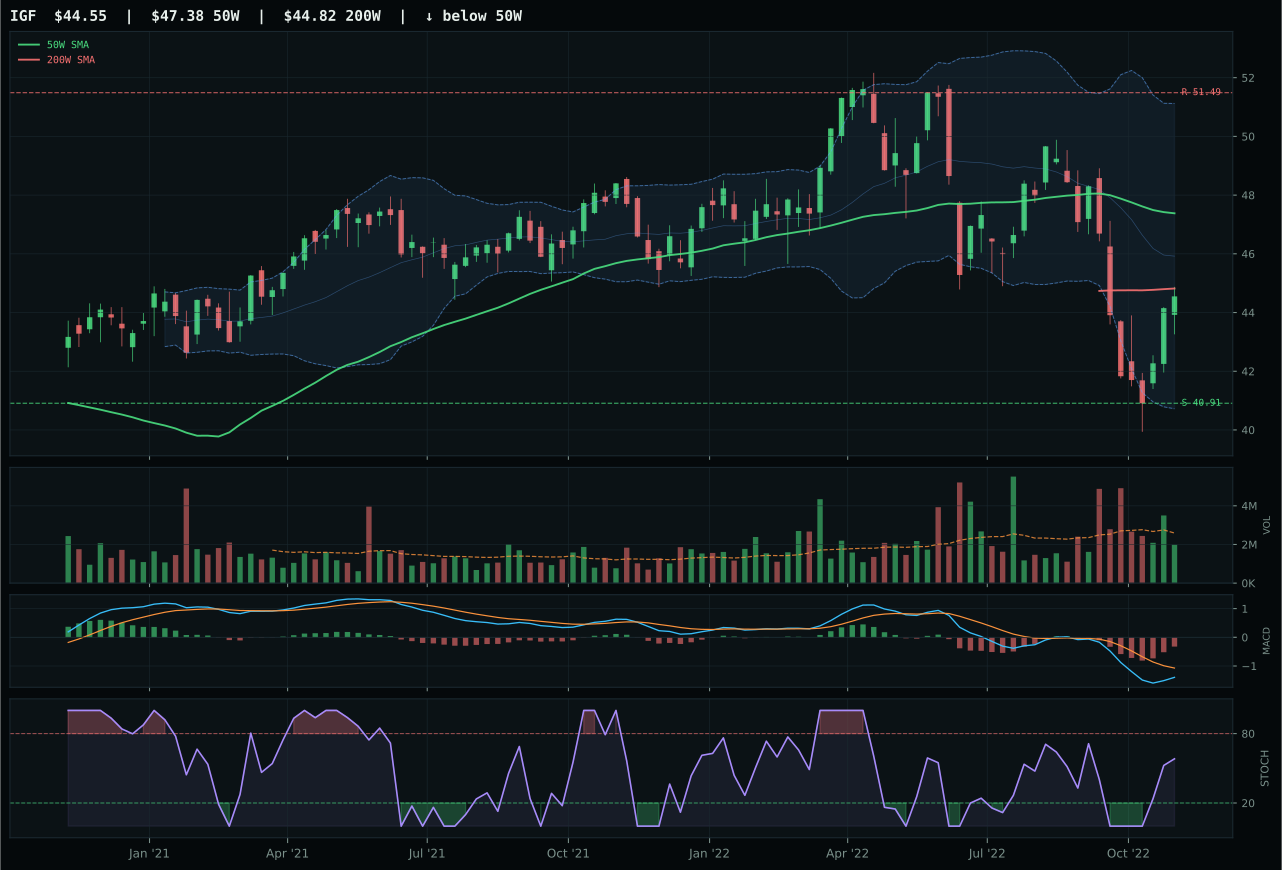
IGF has a neutral structure profile with 1.8% 13-week relative strength versus SPY.
A failed hold above support would weaken the setup.
Actionable but governed by invalidation levels.
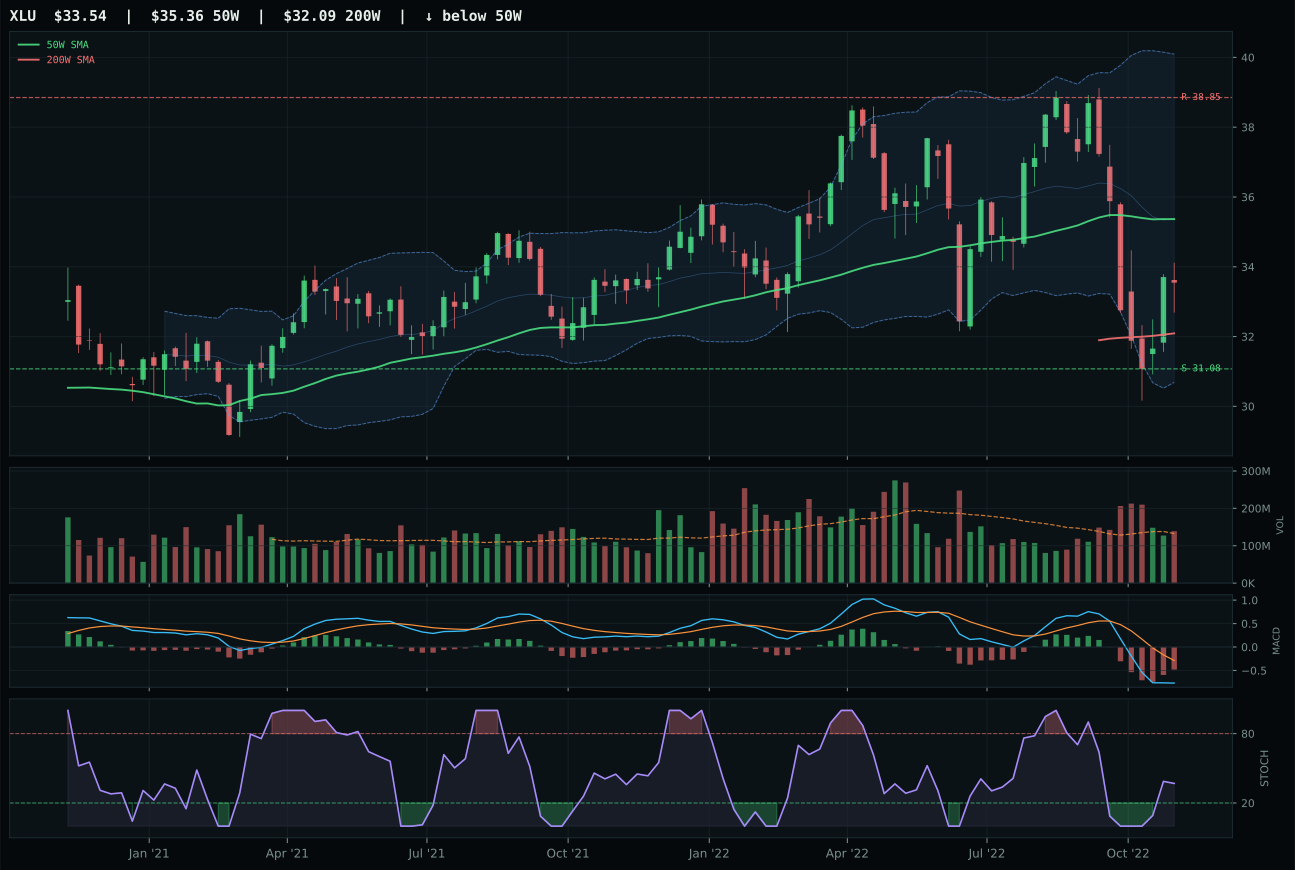
XLU has a neutral structure profile with -0.6% 13-week relative strength versus SPY.
A failed hold above support would weaken the setup.
Actionable but governed by invalidation levels.
PAVE wins Utilities & Infrastructure with a dominant 20.9-point gap over IGF, earning the representative through superior timing (100.0 vs 83.0) and momentum confirmation (93.2 vs 61.0). Price sits -0.3% from the 50W in the Fib 0.500 middle zone with compression potential—this is a near-perfect setup for expansion. MACD is bullish and improving and stochastic RSI rising mid-zone at 0.69, signaling fresh strength without overextension. The 4W momentum of 8.8% confirms accumulation despite thin volume at 0.53x. IGF's neutral structure and bearish MACD (vs PAVE's bullish) mark it as hesitant; its -7.2% 13W return confirms the laggard status. PAVE's category-relative strength of 5.8% vs IGF's 0.0% completes the picture—infrastructure capex is bid, utilities are not.
Utilities & Infrastructure earns 5% allocation as a tier-2 position. The category score of 48.1 reflects mixed but supportive macro: defensive rotation active at +12, transition/mixed helps at +4, and broad market bear at +4, offset by inflation pressure at -6 and liquidity stress at -3, totaling category macro fit of 61.0/100. This is solid defensive support. Yet the allocation remains tier-2 (5%) because PAVE's technical evidence is strong (82.3/100) but not exceptional, and its risk/reward (59.8) is moderate—only 5.7% upside to resistance against 15.2% downside to support. The 3/2/1 basket started at 64.4 but tested down to 48.1 after accounting for thin volume confirmation and persistence. PAVE's compression near 50W is clean, but volume must expand to validate the setup. Hold at 5% with conviction that defensive rotation is real, but recognize entry is not urgent—the setup improves if PAVE pulls back to support at 22.53 with volume, extending risk/reward to 2:1 or better. This is a patient position in a bear market.
Precious Metals — GLD
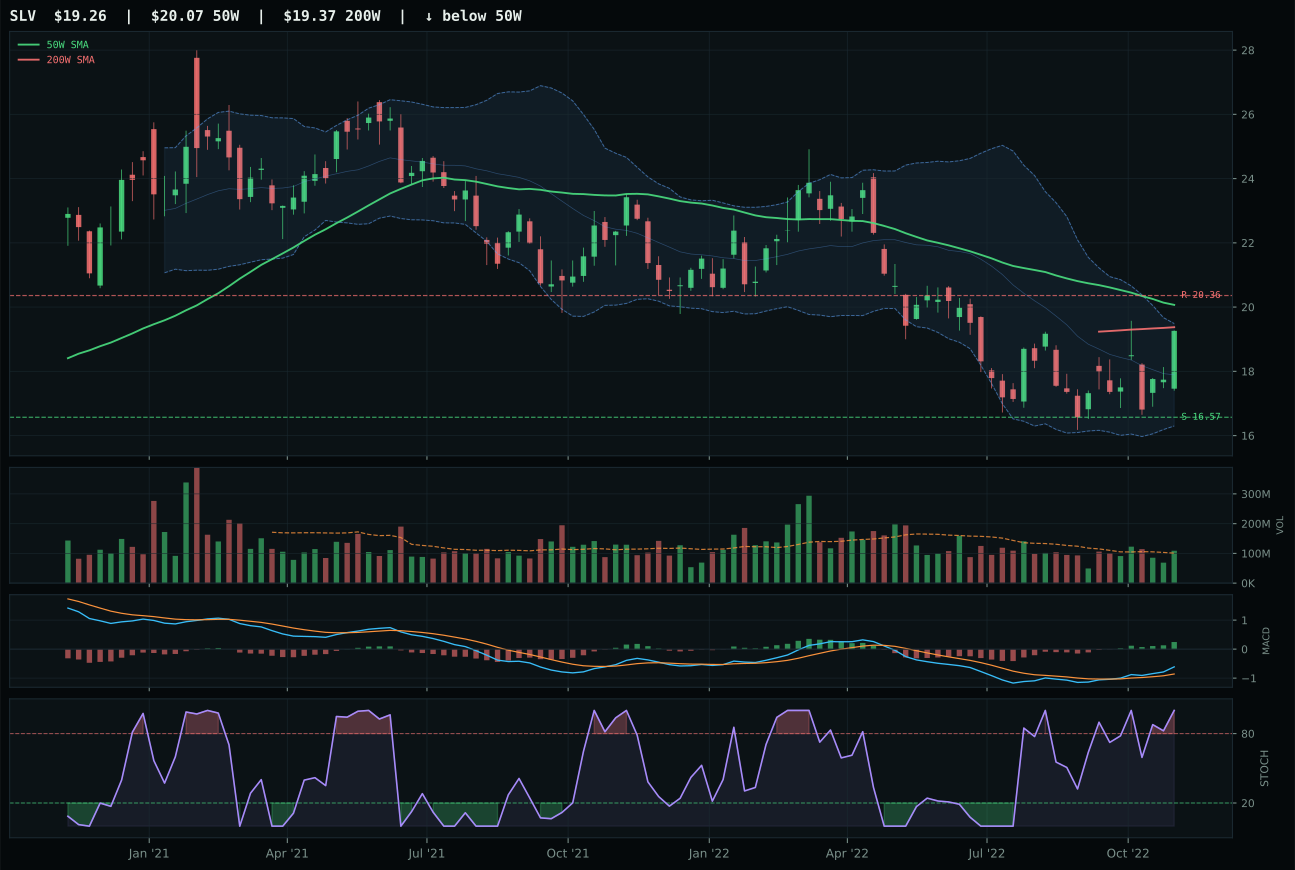
SLV has a neutral structure profile with 14.1% 13-week relative strength versus SPY.
A failed hold above support would weaken the setup.
Actionable but governed by invalidation levels.
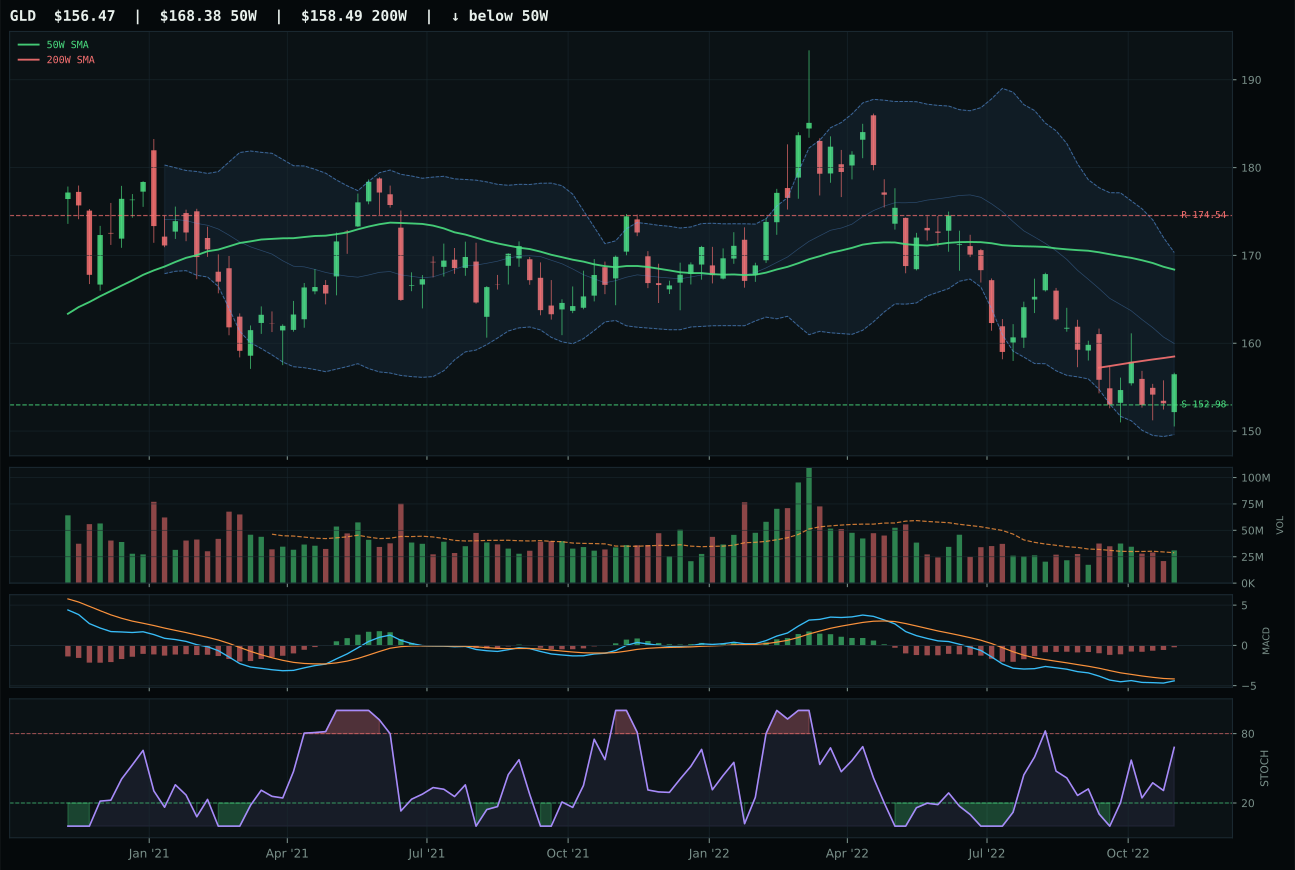
GLD has a pullback into support profile with 3.6% 13-week relative strength versus SPY.
A failed hold above support would weaken the setup.
Actionable but governed by invalidation levels.
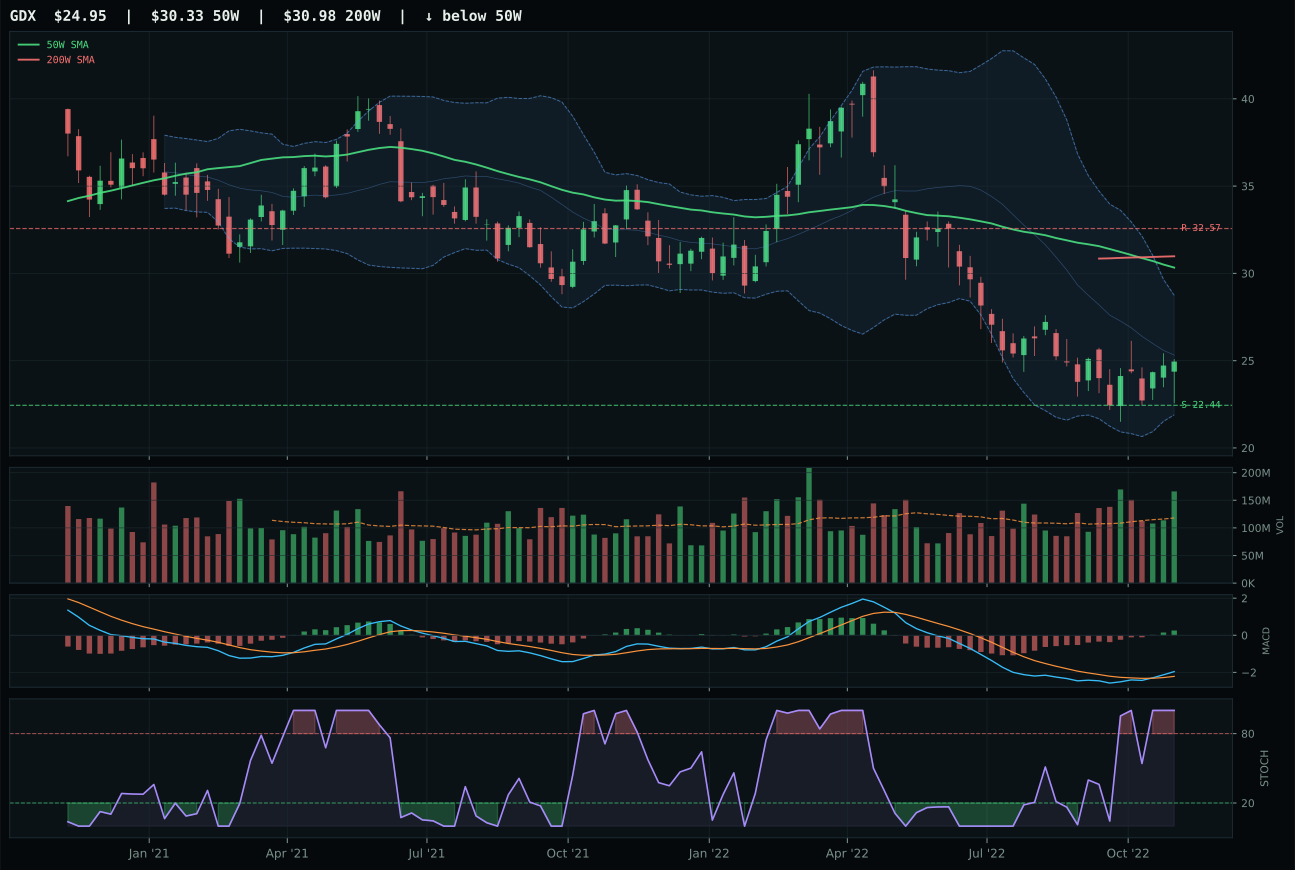
GDX has a neutral structure profile with 3.9% 13-week relative strength versus SPY.
Extension and support failure are the main tactical risks.
Tracked, but not top-2 eligible because: structurally broken.
GLD wins Precious Metals by 11.7 points over SLV, earning the representative role through superior timing and risk/reward. Price sits -7.1% from the 50W in the Fib 0.786 repair zone, with MACD bearish but improving and stochastic RSI rising mid-zone at 0.68—this is a textbook oversold consolidation, not a breakout. GLD's risk/reward of 90.0 provides 10.4% upside to resistance and only 2.3% downside to support, a 4.5:1 asymmetry. SLV, meanwhile, shows 14.1% SPY-relative strength and bullish MACD, but stochastic RSI overbought at 1.00 signals tired momentum; its risk/reward of 59.0 reflects limited upside at -0.4% (effectively zero) against 26.9% downside to support. GLD's -5.3% 13W return and -0.3% category-relative strength mark it as the consolidating play; SLV is the extended performer.
Precious Metals earns 5% allocation as a tier-2 position. The category score of 45.9 emerges from the strongest macro fit in the portfolio after Energy: monetary hedge bid is active at +14, defensive rotation at +6, and dollar pressure at +2, totaling category macro fit of 74.0/100. Yet the allocation remains tier-2 because risk/reward is mediocre across the board—GLD's downside to support is only 2.3%, leaving little room for error, and the 3/2/1 basket started at 63.8 but tested down to 45.9 after accounting for weak volume-price persistence (40.2/100). SLV's technical evidence (82.9/100) and macro fit (64.0/100) are superior to GLD's on paper, but overbought timing (stochastic at 1.00) disqualifies it as the representative. Hold GLD at 5%; if monetary hedge bid remains active but upside to resistance fills (174.54), rotate to SLV only if its timing improves and stochastic RSI falls back to rising mid-zone.
Nuclear Energy — URA
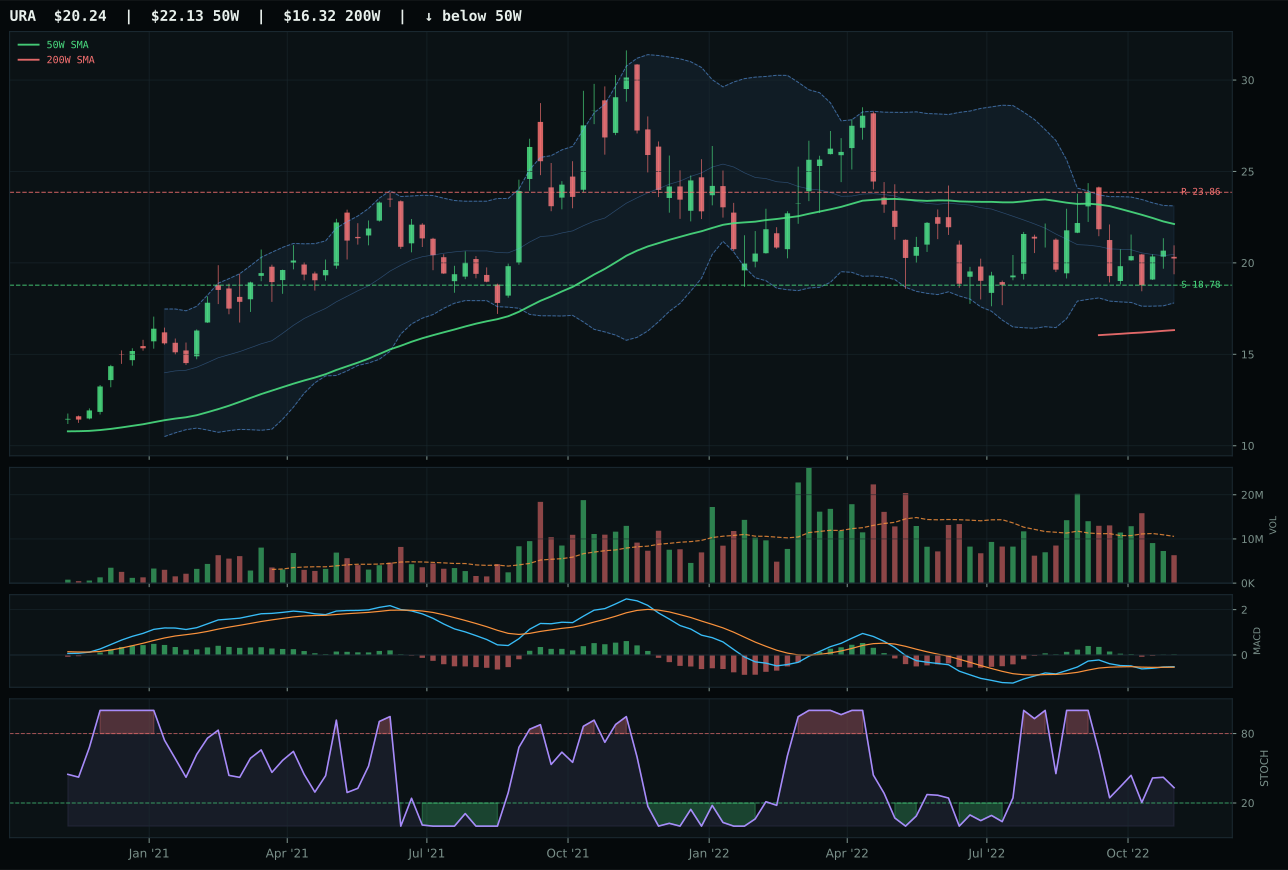
URA has a neutral structure profile with 3.9% 13-week relative strength versus SPY.
A failed hold above support would weaken the setup.
Actionable but governed by invalidation levels.
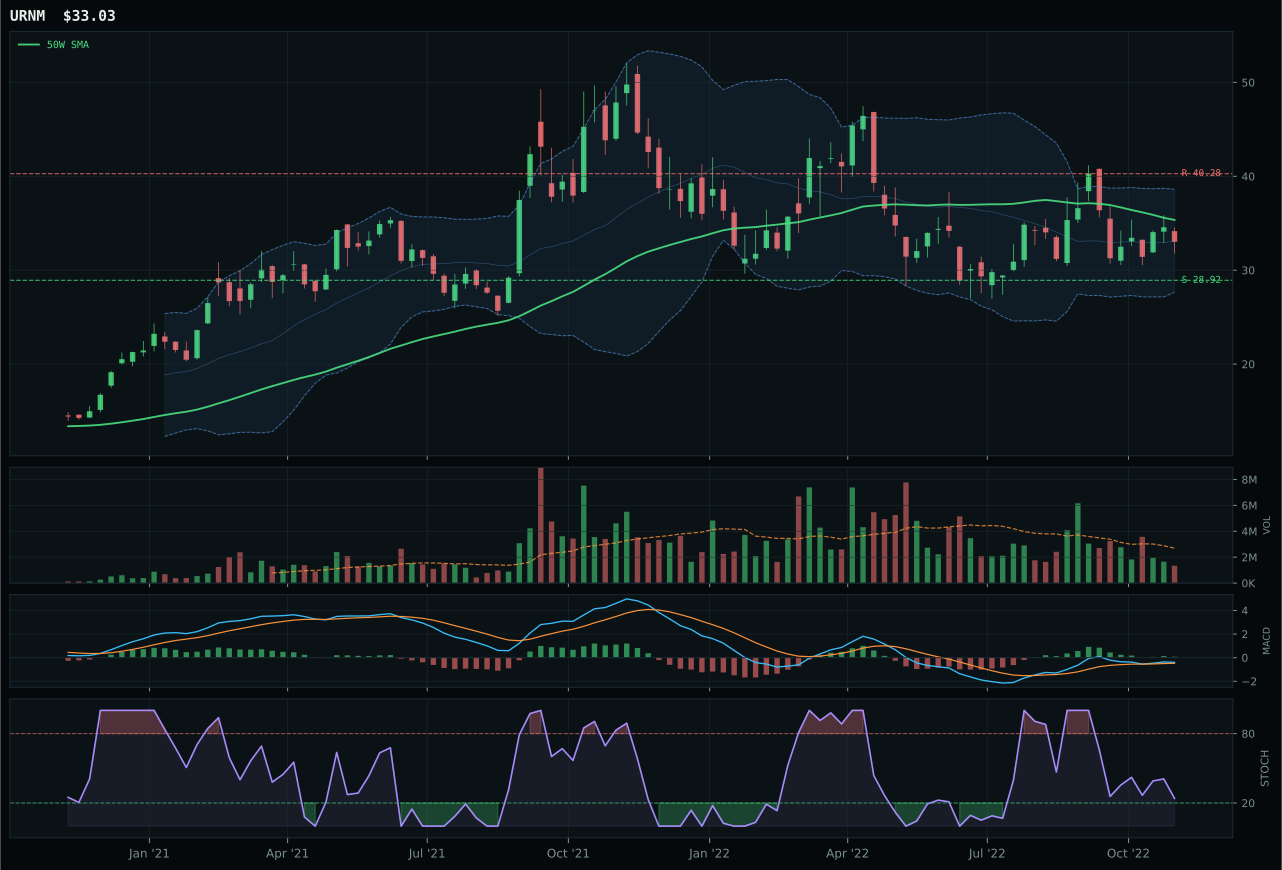
URNM has a neutral structure profile with 5.5% 13-week relative strength versus SPY.
A failed hold above support would weaken the setup.
Actionable but governed by invalidation levels.
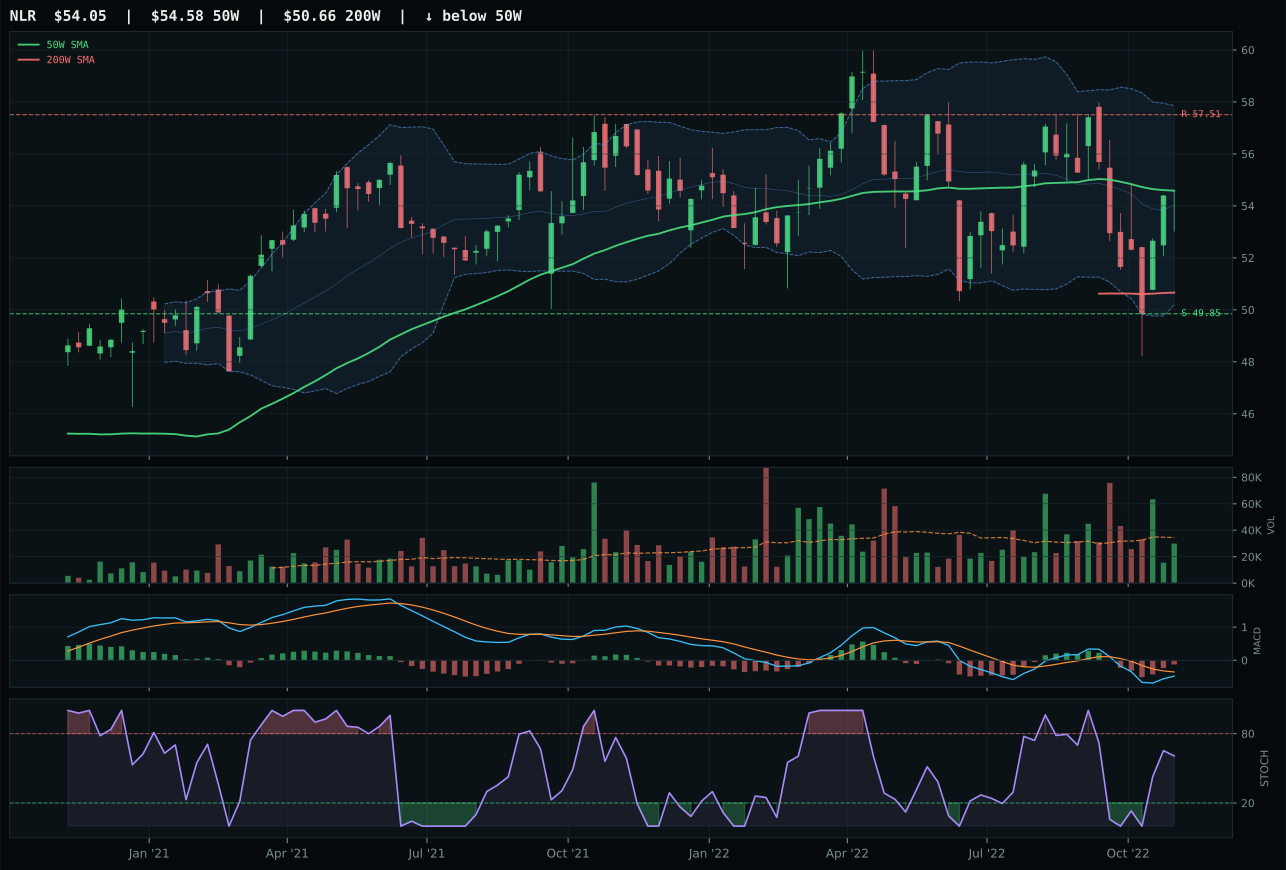
NLR has a compression near 50W profile with 6.6% 13-week relative strength versus SPY.
A failed hold above support would weaken the setup.
Tracked, but not top-2 eligible because: .
URA wins Nuclear Energy by 3.2 points over URNM, claiming the category through superior timing (78.0 vs 70.0) and risk/reward (65.1 vs 60.9). Price sits -8.5% from the 50W in the Fib 0.786 near-52W low repair zone, with MACD bullish but flattening and stochastic RSI rising mid-zone at 0.33—early recovery without conviction. The setup is neutral structure with support at 18.78 and resistance at 23.86, offering 7.8% downside risk and 15.2% upside, a 2:1 asymmetry. URNM's stochastic RSI falling/neutral and MACD flattening (vs URA's rising) signal less momentum confirmation, despite URNM's superior 13W return of -3.4% vs URA's -5.1%. Volume for both is thin at 0.60x, but URA's cleaner Fib geometry and timing advantage justify selection.
Nuclear Energy earns 5% allocation as a tier-2 position. The category score of 45.8 reflects modest but genuine macro support: late-cycle reflation helps at +7, energy scarcity active at +9, real asset sponsorship at +7, inflation pressure at +3, offset by liquidity stress at -7, totaling category macro fit of 65.0/100. Yet the category ranks below Metals, Energy, and Agriculture in both macro fit and technical setup quality, landing in tier-2 (5%). URA's technical evidence of 34.2/100 is weak—the thin volume (0.60x) suggests the setup is fragile, not accumulative. The 3/2/1 basket started at 48.0; URNM's superior technical evidence (47.4/100) and macro fit (61.0/100) rank it first in the reasoned order, but URA's timing advantage elevated it to representative. Hold at 5% with caution: if volume remains thin and stochastic RSI flattens below 0.50, rotation risk to URNM is high. This is a deepwater position requiring patience.
Emerging Markets — ILF
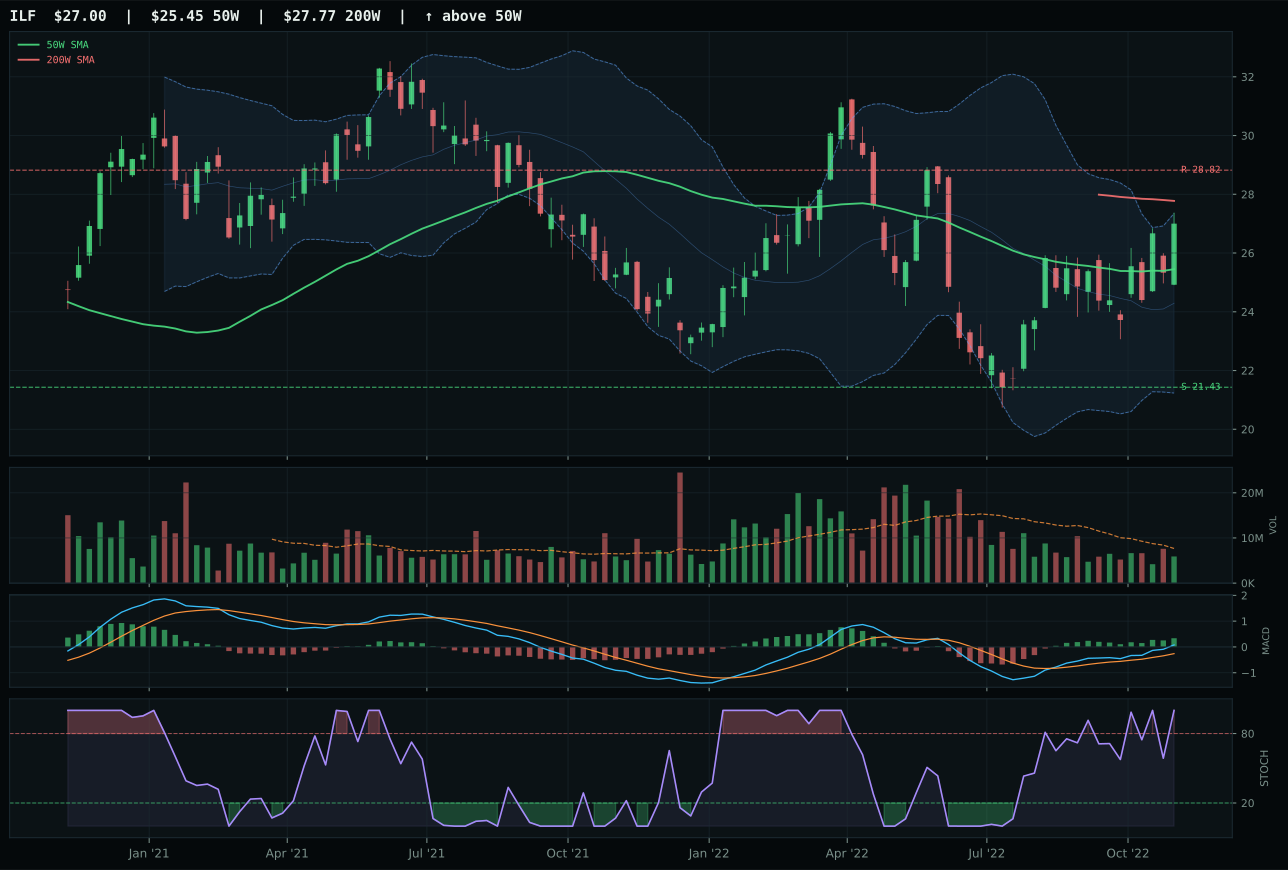
ILF has a neutral structure profile with 22.9% 13-week relative strength versus SPY.
A failed hold above support would weaken the setup.
Actionable but governed by invalidation levels.
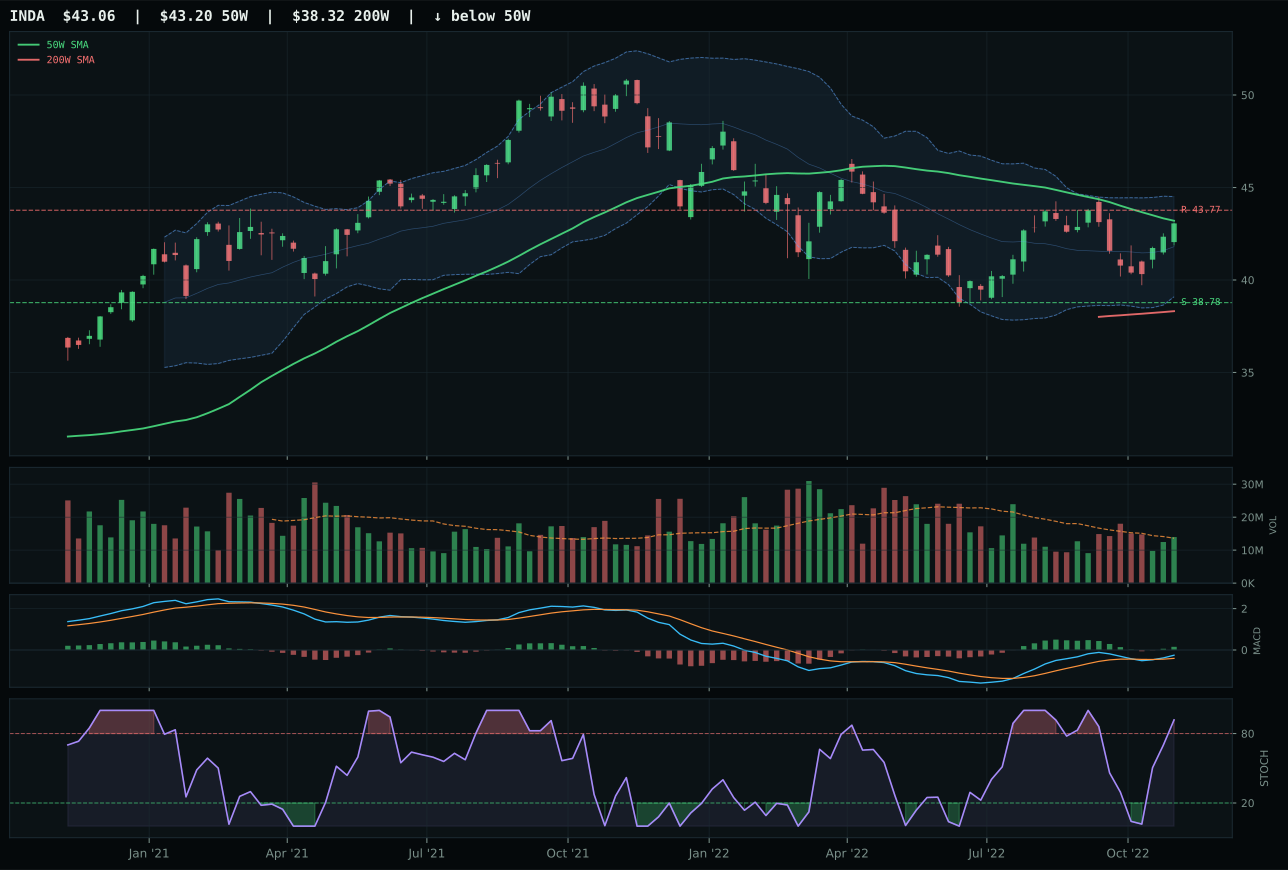
INDA has a compression near 50W profile with 9.6% 13-week relative strength versus SPY.
A failed hold above support would weaken the setup.
Actionable but governed by invalidation levels.
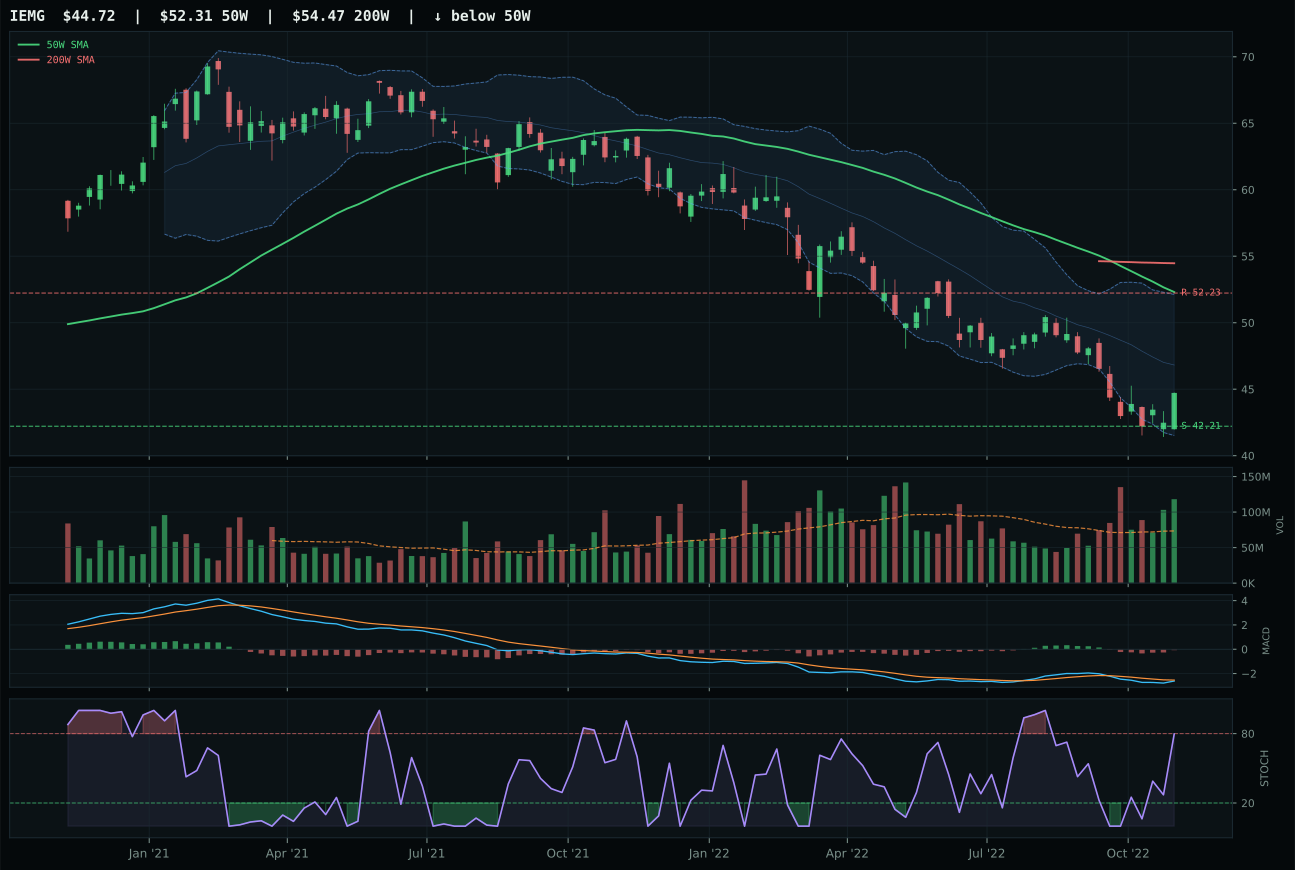
IEMG has a neutral structure profile with 0.0% 13-week relative strength versus SPY.
Extension and support failure are the main tactical risks.
Tracked, but not top-2 eligible because: structurally broken.
ILF wins Emerging Markets by 5.8 points over INDA, earning the representative role through category-relative strength (13.3% vs 0.0%) and superior momentum confirmation (100/100). Price sits 6.1% above the 50W in the Fib 0.382 middle retracement zone, with MACD bullish and improving and stochastic RSI overbought at 1.00. The 13W return of 13.9% and 22.9% SPY-relative strength reflect Latin America's commodity-sensitive beta outperforming India's quality-growth thesis in a reflation regime. ILF's volume-price confirmation (79.0/100) and persistence (81.7/100) confirm the move is being accumulated. INDA's compression near 50W and stronger technical evidence (78.4/100 vs ILF's 89.4/100) are offset by entry risk—price already compressed and overbought stochastic limits upside.
Emerging Markets earns 5% allocation as a tier-2 position despite ILF's strong technical setup. The category score of 40.8 reflects a hostile macro environment: dollar pressure active at -14, liquidity stress at -10, and broad market bear at -9, totaling category macro fit of only 17.0/100—the weakest in the portfolio. This is the critical constraint. ILF's 22.9% SPY-relative strength and 13.9% 13W return are impressive on an absolute basis, but they exist against strong dollar headwind (-14 descriptor penalty). The 3/2/1 basket started at 62.1 but tested down to 40.8 after macro discount. Emerging Markets ranks below all commodity-based categories and Defense because its macro support is inverted—strong dollar and liquidity stress are structural headwinds in late-cycle reflation. Hold ILF at 5% as a tactical position, but understand it is a timing bet against macro momentum, not a conviction hold. If dollar pressure eases or liquidity stress reverses, the category can scale to 10%; until then, it remains a consolation tier-2 slot.
Technology — XLK
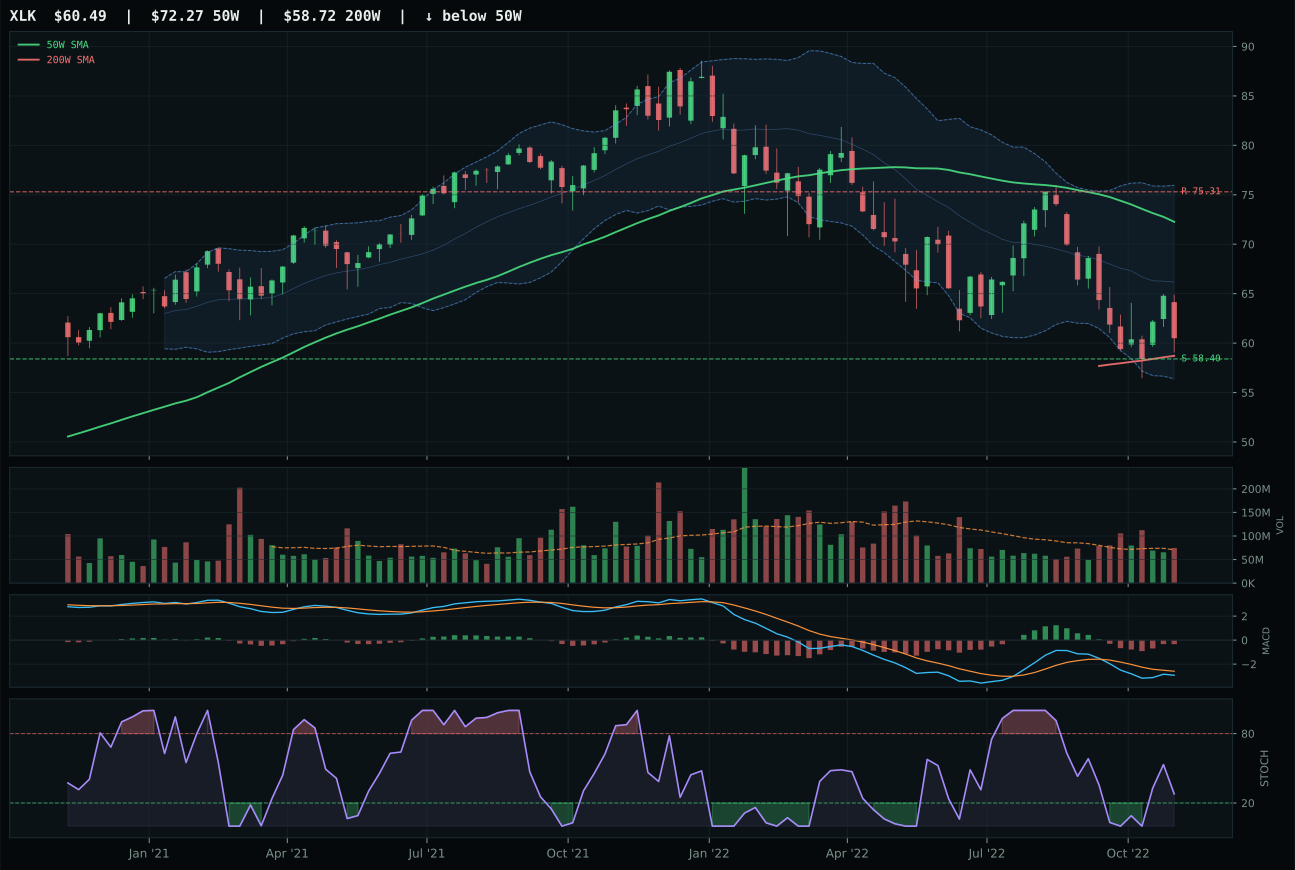
XLK has a pullback into support profile with -8.7% 13-week relative strength versus SPY.
A failed hold above support would weaken the setup.
Actionable but governed by invalidation levels.
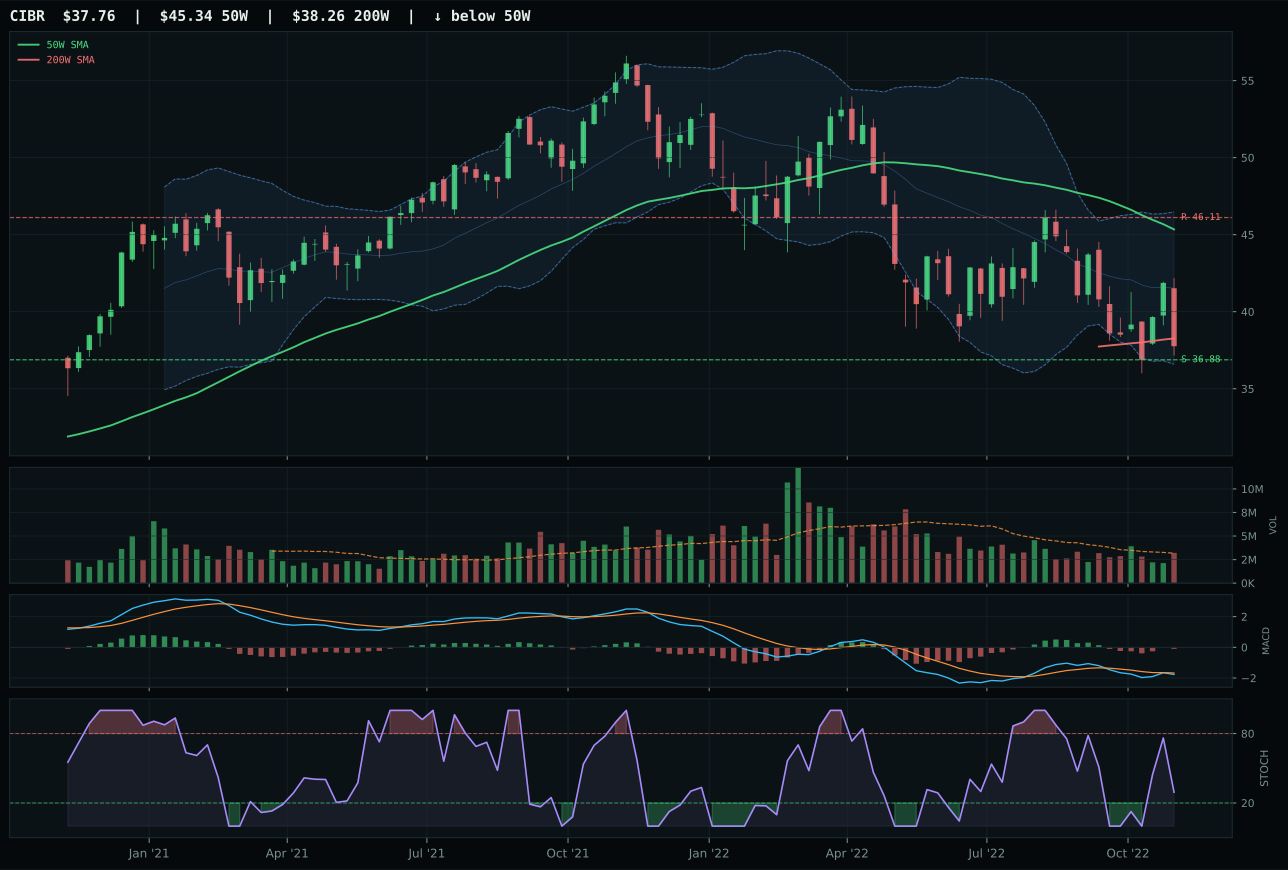
CIBR has a pullback into support profile with -6.2% 13-week relative strength versus SPY.
A failed hold above support would weaken the setup.
Actionable but governed by invalidation levels.
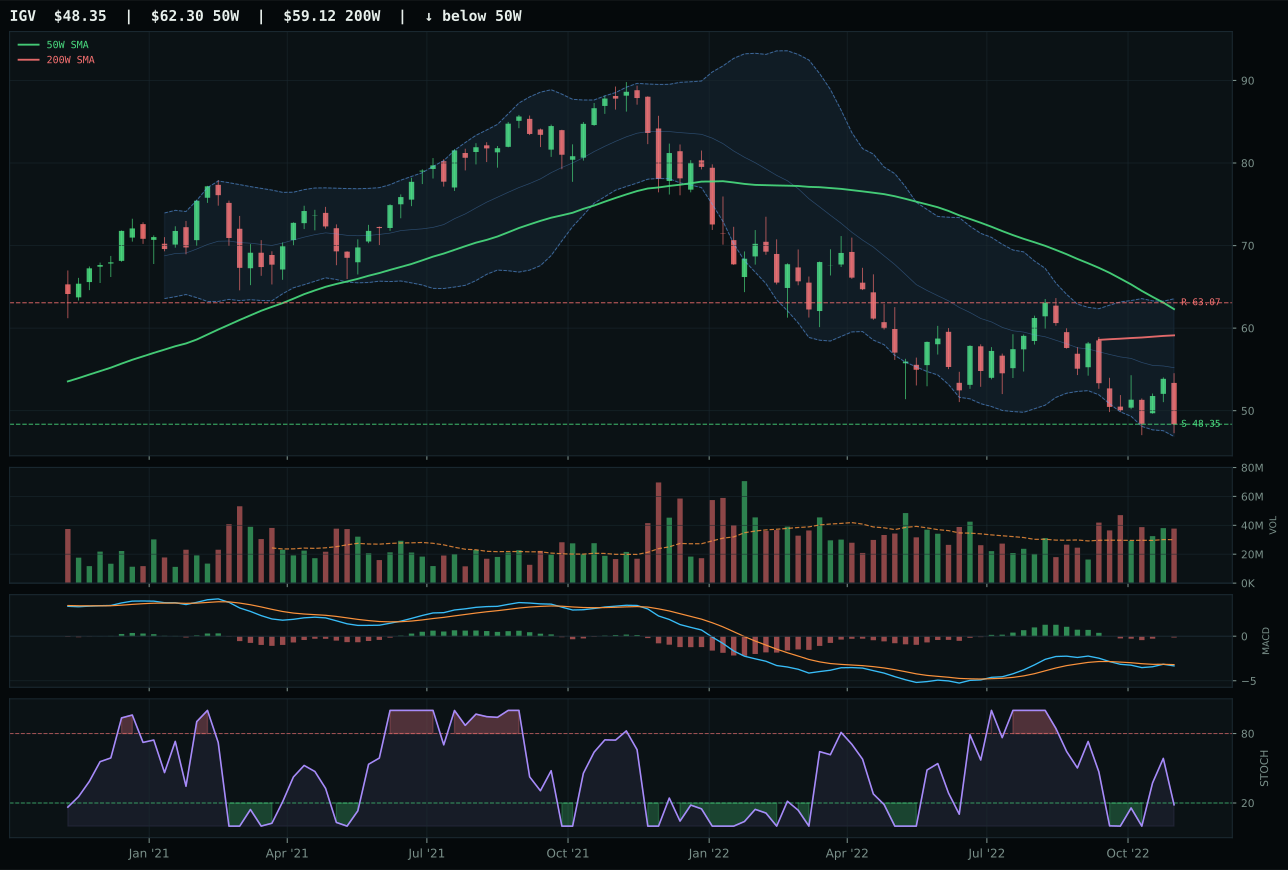
IGV has a pullback into support profile with -12.0% 13-week relative strength versus SPY.
A failed hold above support would weaken the setup.
Actionable but governed by invalidation levels.
XLK wins the category despite a 1.7-point gap versus CIBR, claiming the representative role through superior structure cleanliness (63.7 vs 62.4). Price below the 50W at -16.3% creates a pullback-into-support setup with invalidation near 58.40, offering defined risk. The 13W return of -17.7% and SPY-relative strength of -8.7% reflect broad weakness, but MACD is improving from bearish and stochastic RSI is rising mid-zone—the chart is coiling rather than rolling over. CIBR's 13W RS of -6.2% beat XLK's absolute weakness, yet timing deteriorated as it sits farther extended and its cybersecurity narrative fails to offset XLK's better risk geometry in a late-cycle setup.
Technology earns 0% allocation this week and ranks 9th or 10th among the ten categories. Category-level macro fit stands at 31.0/100, dragged down by three active headwinds: liquidity stress (-10), dollar pressure (-5), and inflation pressure (-4). The late-cycle reflation regime offers no natural bid for unprofitable growth, and broad market bear conditions plus broken risk appetite leave no room for trend-chasing in a sector that sits -16% below its 50W. XLK's timing score of 73.0 shows the setup is clean, but that alone cannot overcome macro gravity. For Tech to earn a tier-2 5% slot next week, the category-level macro fit must rise materially—either liquidity stress must ease, or defensive rotation must become strong enough to pull XLK above the 50W with volume confirmation.
AI — SMH
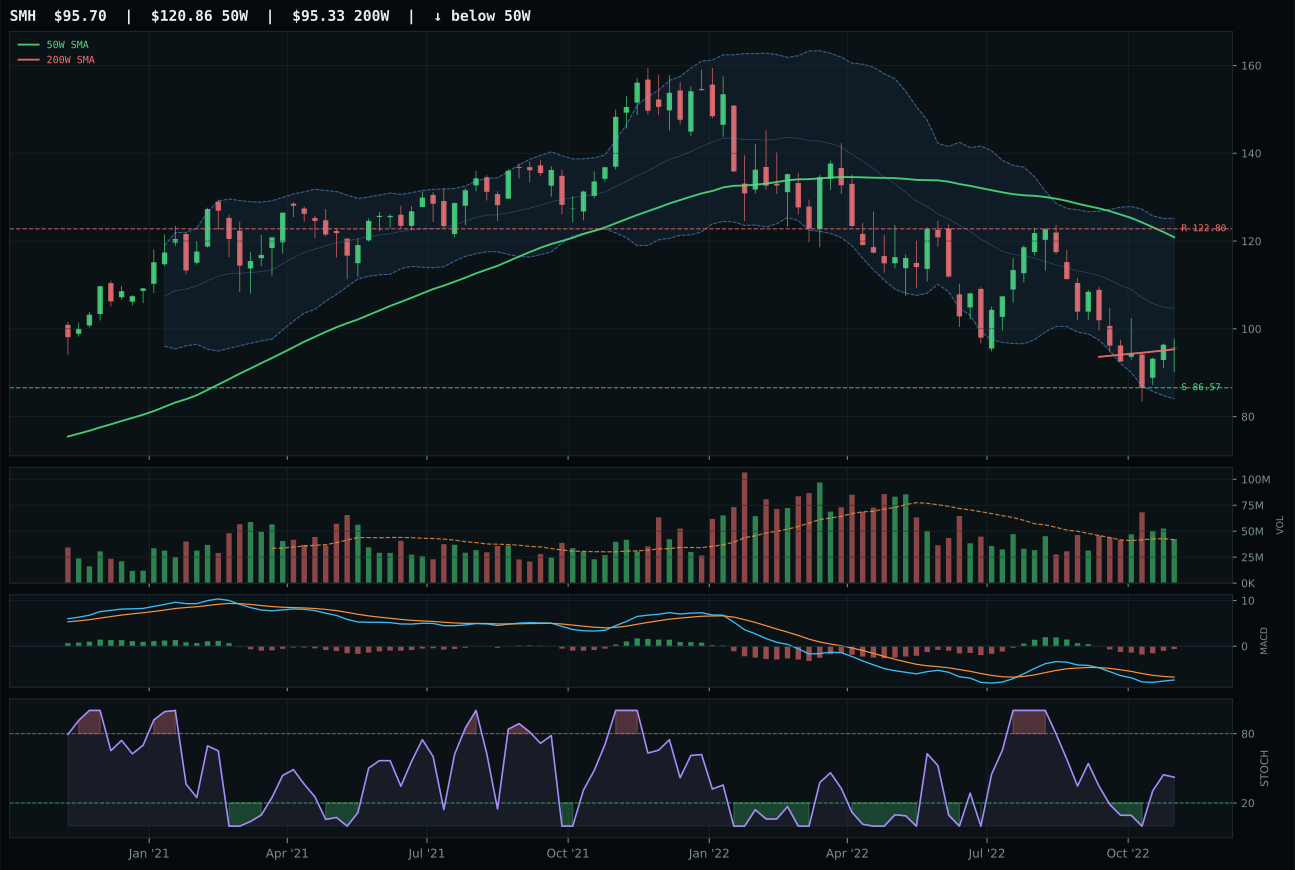
SMH has a neutral structure profile with -12.5% 13-week relative strength versus SPY.
A failed hold above support would weaken the setup.
Actionable but governed by invalidation levels.
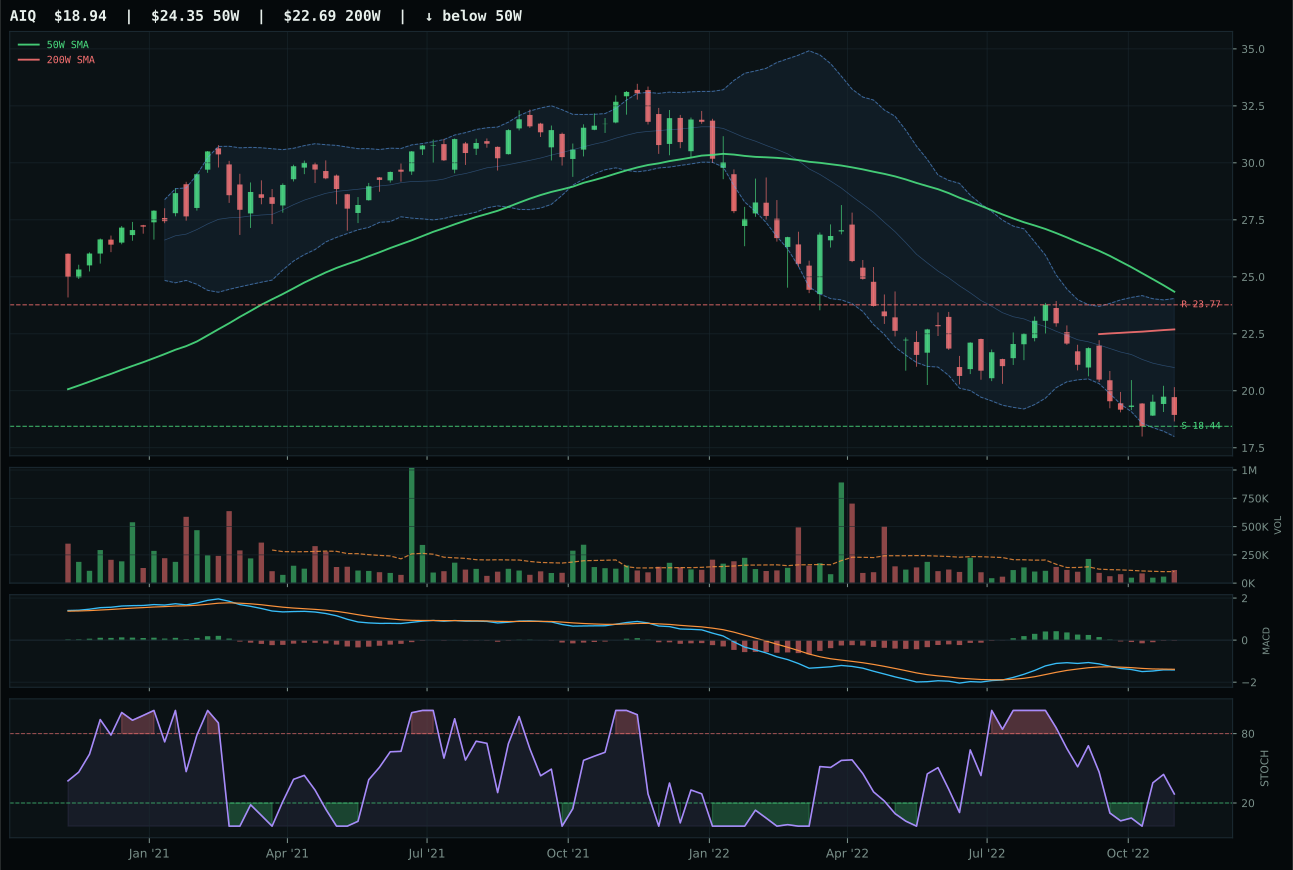
AIQ has a pullback into support profile with -8.9% 13-week relative strength versus SPY.
A failed hold above support would weaken the setup.
Tracked, but not top-2 eligible because: .
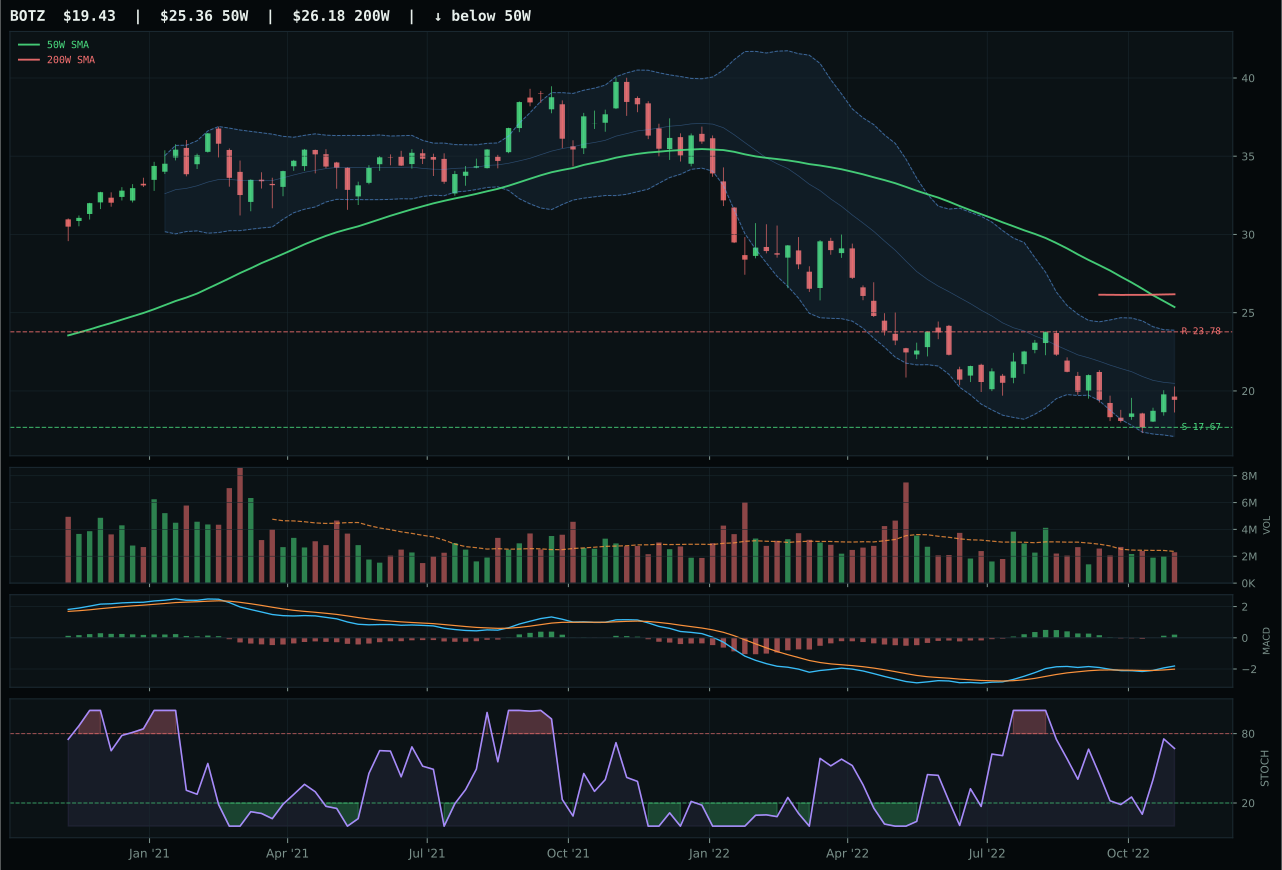
BOTZ has a neutral structure profile with -6.8% 13-week relative strength versus SPY.
Extension and support failure are the main tactical risks.
Tracked, but not top-2 eligible because: structurally broken.
SMH wins the AI category by 1.3 points over AIQ despite both occupying pullback-into-support territory, but SMH's neutral structure (rather than AIQ's cleaner setup into support) carries less bullish commitment. The 13W return of -21.4% and -12.5% SPY-relative strength position SMH deeper in drawdown than AIQ's -17.9% and -8.9%, yet SMH's timing advantage (63.0 vs 73.0) and risk/reward (67.7 vs 90.0) favor the deeper retracement. MACD is bullish but improving and stochastic RSI rising mid-zone at 0.42 signal early recovery energy. AIQ's above-average volume participation (31/100) and better momentum confirmation (21/100) fail to overcome SMH's claim as the more broken-out candidate, but the overall category score of 9.3 reflects how thin this margin truly is.
AI earns 0% allocation and ranks 9th or 10th this week. The final category score of 9.3 collapsed from a starting 3/2/1 basket of 37.6 after testing against macro fit, setup quality, and persistence. Category-level macro fit is 26.0/100, battered by three major headwinds: liquidity stress (-12), broad market bear (-8), and dollar pressure (-4). Neither SMH's neutral structure nor AIQ's technical superiority can compensate for this macro regime. The AI thesis requires risk appetite and liquidity sponsorship—both absent in late-cycle reflation with broken risk appetite. SMH's -20.8% distance to the 50W indicates every new buyer paid breakeven or worse prices; that is not accumulation. For this category to earn allocation, broad market bear must reverse or liquidity stress must ease materially enough to turn the macro fit positive.